Embed Size (px)
Citation preview

Chapter 4: Hospitalization
2014 ANNUAL DATA REPORTVOLUME 2: END-STAGE RENAL
DISEASE
2
Data Source: Reference tables: G.1 and special analyses, USRDS ESRD Database. Period prevalent ESRD patients; adjusted for age, sex, race, & primary diagnosis; ref: ESRD patients, 2010. Percent changes from 1993 for the year 2012 are shown in parentheses. Abbreviations: ESRD, end-stage renal disease.
vol 2 Figure 4.1 Trends in adjusted all-cause, cause specific hospitalization rates, all ESRD
Vol 2, ESRD, Ch 4

3
Data Source: Reference tables: G.3 and special analyses, USRDS ESRD Database. Period prevalent ESRD patients; adjusted for age, sex, race, & primary diagnosis; ref: ESRD patients, 2010. Percent changes from 1993 for the year 2012 are shown in parentheses. Abbreviations: ESRD, end-stage renal disease.
vol 2 Figure 4.1 Trends in adjusted all-cause, cause specific hospitalization rates, hemodialysis
Vol 2, ESRD, Ch 4
4
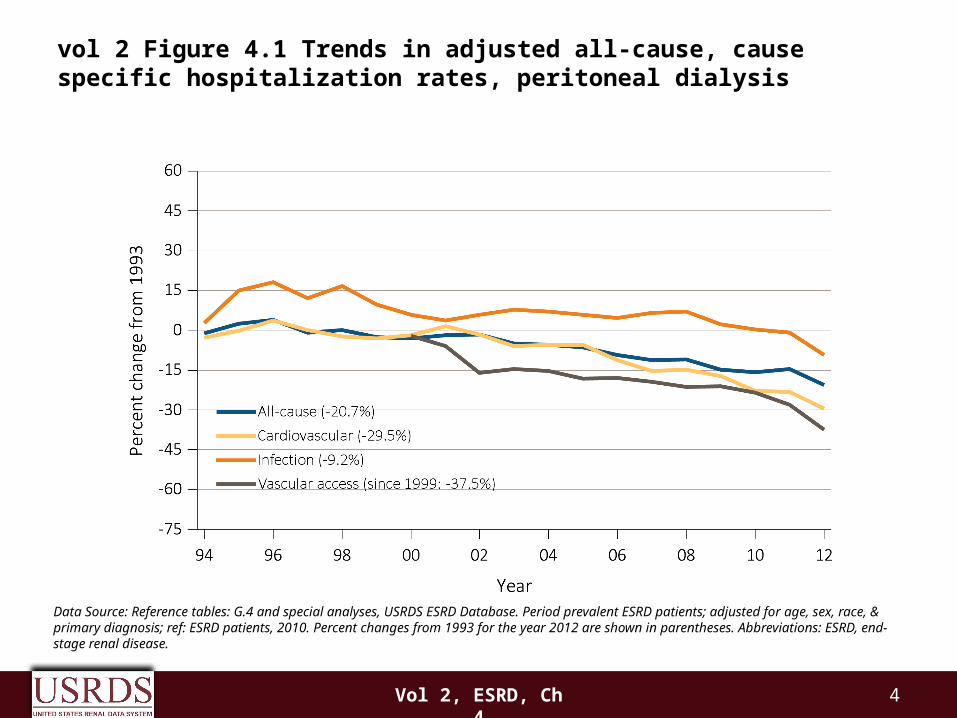
Data Source: Reference tables: G.4 and special analyses, USRDS ESRD Database. Period prevalent ESRD patients; adjusted for age, sex, race, & primary diagnosis; ref: ESRD patients, 2010. Percent changes from 1993 for the year 2012 are shown in parentheses. Abbreviations: ESRD, end-stage renal disease.
vol 2 Figure 4.1 Trends in adjusted all-cause, cause specific hospitalization rates, peritoneal dialysis
Vol 2, ESRD, Ch 4

5
Data Source: Reference tables: G.5 and special analyses, USRDS ESRD Database. Period prevalent ESRD patients; adjusted for age, sex, race, & primary diagnosis; ref: ESRD patients, 2010. Percent changes from 1993 for the year 2012 are shown in parentheses. Abbreviations: ESRD, end-stage renal disease.
vol 2 Figure 4.1 Trends in adjusted all-cause, cause specific hospitalization rates, transplant
Vol 2, ESRD, Ch 4

6Vol 2, ESRD, Ch 4
vol 2 Figure 4.2 Trends in adjusted hospitalization rates, by modality
Data Source: Reference tables: G.1, G.3, G.4, G.5, and special analyses, USRDS ESRD Database. Period prevalent ESRD patients; adjusted for age, sex, race, & primary diagnosis; ref: ESRD patients, 2010. Abbreviations: ESRD, end-stage renal disease.

7Vol 2, ESRD, Ch 4
Data Source: Reference tables: G.6, G.8, G.9, G.10, and special analyses, USRDS ESRD Database. Period prevalent ESRD patients; adjusted for age, sex, race, & primary diagnosis; ref: ESRD patients, 2010. Abbreviations: ESRD, end-stage renal disease.
vol 2 Figure 4.2 Trends in adjusted hospital days, by modality
8Vol 2, ESRD, Ch 4
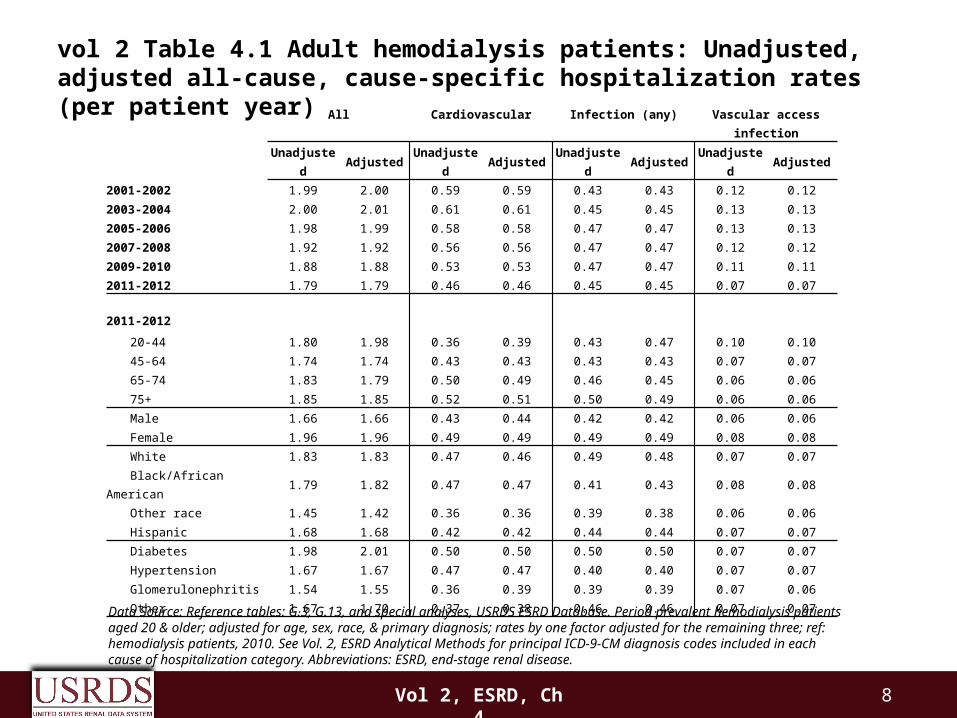
Data Source: Reference tables: G.3, G.13, and special analyses, USRDS ESRD Database. Period prevalent hemodialysis patients aged 20 & older; adjusted for age, sex, race, & primary diagnosis; rates by one factor adjusted for the remaining three; ref: hemodialysis patients, 2010. See Vol. 2, ESRD Analytical Methods for principal ICD-9-CM diagnosis codes included in each cause of hospitalization category. Abbreviations: ESRD, end-stage renal disease.
vol 2 Table 4.1 Adult hemodialysis patients: Unadjusted, adjusted all-cause, cause-specific hospitalization rates (per patient year)
All Cardiovascular Infection (any) Vascular access infection
Unadjusted Adjusted Unadjusted Adjusted Unadjusted Adjusted Unadjusted Adjusted
2001-2002 1.99 2.00 0.59 0.59 0.43 0.43 0.12 0.12
2003-2004 2.00 2.01 0.61 0.61 0.45 0.45 0.13 0.13
2005-2006 1.98 1.99 0.58 0.58 0.47 0.47 0.13 0.13
2007-2008 1.92 1.92 0.56 0.56 0.47 0.47 0.12 0.12
2009-2010 1.88 1.88 0.53 0.53 0.47 0.47 0.11 0.11
2011-2012 1.79 1.79 0.46 0.46 0.45 0.45 0.07 0.07
2011-2012
20-44 1.80 1.98 0.36 0.39 0.43 0.47 0.10 0.10
45-64 1.74 1.74 0.43 0.43 0.43 0.43 0.07 0.07
65-74 1.83 1.79 0.50 0.49 0.46 0.45 0.06 0.06
75+ 1.85 1.85 0.52 0.51 0.50 0.49 0.06 0.06
Male 1.66 1.66 0.43 0.44 0.42 0.42 0.06 0.06
Female 1.96 1.96 0.49 0.49 0.49 0.49 0.08 0.08
White 1.83 1.83 0.47 0.46 0.49 0.48 0.07 0.07
Black/African American 1.79 1.82 0.47 0.47 0.41 0.43 0.08 0.08
Other race 1.45 1.42 0.36 0.36 0.39 0.38 0.06 0.06
Hispanic 1.68 1.68 0.42 0.42 0.44 0.44 0.07 0.07
Diabetes 1.98 2.01 0.50 0.50 0.50 0.50 0.07 0.07
Hypertension 1.67 1.67 0.47 0.47 0.40 0.40 0.07 0.07
Glomerulonephritis 1.54 1.55 0.36 0.39 0.39 0.39 0.07 0.06
Other 1.67 1.70 0.37 0.38 0.46 0.46 0.07 0.07
9Vol 2, ESRD, Ch 4
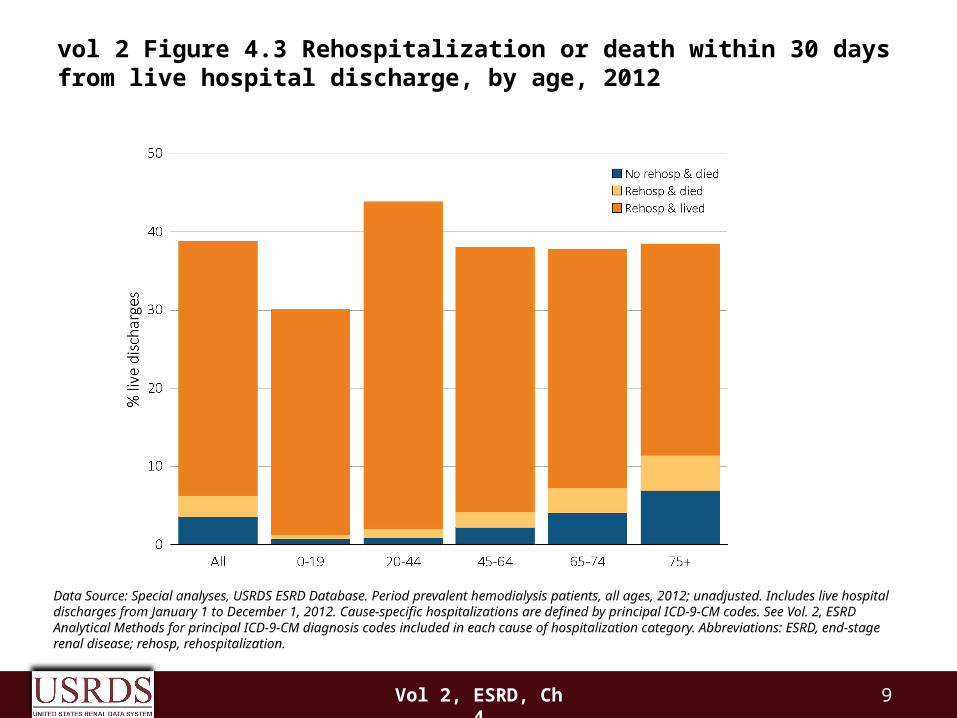
Data Source: Special analyses, USRDS ESRD Database. Period prevalent hemodialysis patients, all ages, 2012; unadjusted. Includes live hospital discharges from January 1 to December 1, 2012. Cause-specific hospitalizations are defined by principal ICD-9-CM codes. See Vol. 2, ESRD Analytical Methods for principal ICD-9-CM diagnosis codes included in each cause of hospitalization category. Abbreviations: ESRD, end-stage renal disease; rehosp, rehospitalization.
vol 2 Figure 4.3 Rehospitalization or death within 30 days from live hospital discharge, by age, 2012
10Vol 2, ESRD, Ch 4
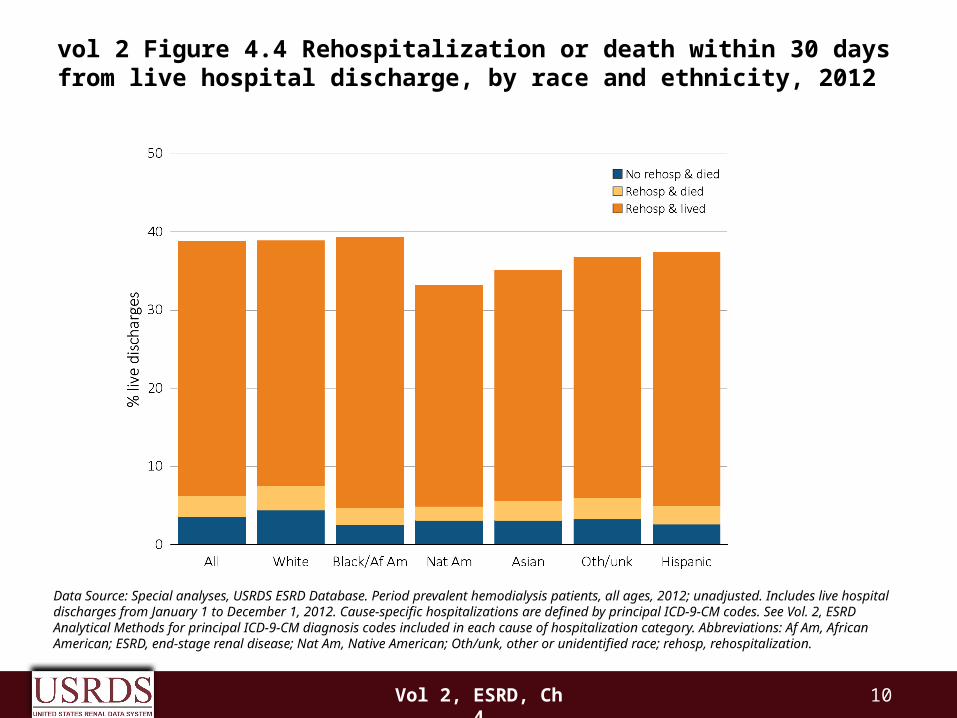
Data Source: Special analyses, USRDS ESRD Database. Period prevalent hemodialysis patients, all ages, 2012; unadjusted. Includes live hospital discharges from January 1 to December 1, 2012. Cause-specific hospitalizations are defined by principal ICD-9-CM codes. See Vol. 2, ESRD Analytical Methods for principal ICD-9-CM diagnosis codes included in each cause of hospitalization category. Abbreviations: Af Am, African American; ESRD, end-stage renal disease; Nat Am, Native American; Oth/unk, other or unidentified race; rehosp, rehospitalization.
vol 2 Figure 4.4 Rehospitalization or death within 30 days from live hospital discharge, by race and ethnicity, 2012

11Vol 2, ESRD, Ch 4
Data Source: Special analyses, USRDS ESRD Database. Period prevalent hemodialysis patients, all ages, 2012, unadjusted. Includes live hospital discharges from January 1 to December 1, 2012. Cause-specific hospitalizations are defined by principal ICD-9-CM codes. See Vol. 2, ESRD Analytical Methods for principal ICD-9-CM diagnosis codes included in each cause of hospitalization category. Abbreviations: CVD, cardiovascular disease; ESRD, end-stage renal disease; rehosp, rehospitalization; VA, vascular access.
vol 2 Figure 4.5 Rehospitalization or death within 30 days from live hospital discharge, by cause of index hospitalization, 2012
12Vol 2, ESRD, Ch 4
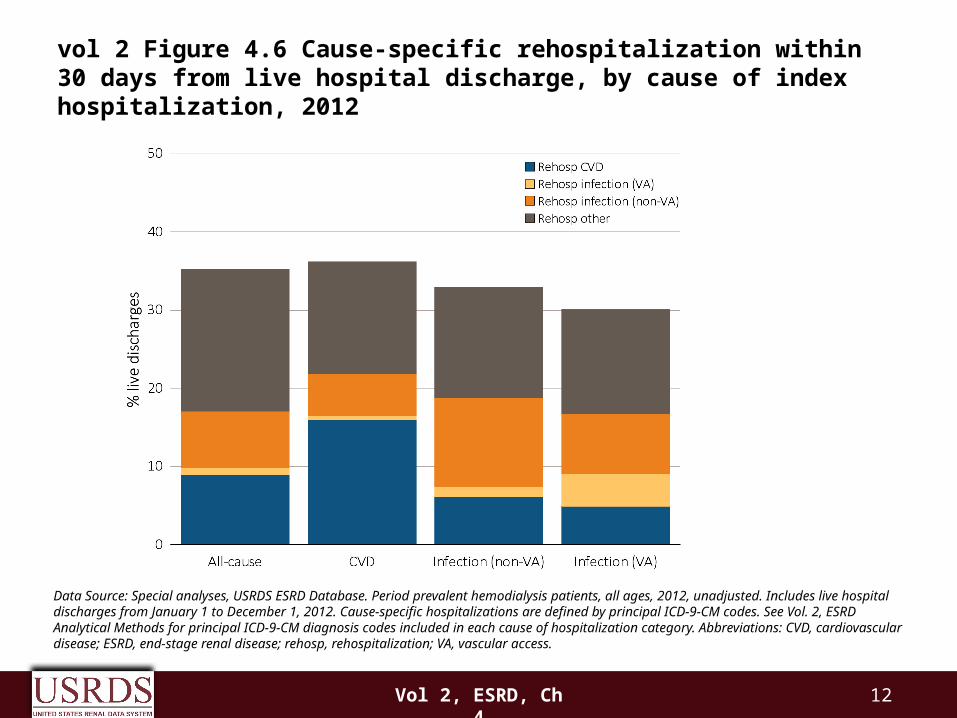
Data Source: Special analyses, USRDS ESRD Database. Period prevalent hemodialysis patients, all ages, 2012, unadjusted. Includes live hospital discharges from January 1 to December 1, 2012. Cause-specific hospitalizations are defined by principal ICD-9-CM codes. See Vol. 2, ESRD Analytical Methods for principal ICD-9-CM diagnosis codes included in each cause of hospitalization category. Abbreviations: CVD, cardiovascular disease; ESRD, end-stage renal disease; rehosp, rehospitalization; VA, vascular access.
vol 2 Figure 4.6 Cause-specific rehospitalization within 30 days from live hospital discharge, by cause of index hospitalization, 2012

13Vol 2, ESRD, Ch 4
Data Source: Special analyses, USRDS ESRD Database. Period prevalent hemodialysis patients, all ages, 2012, unadjusted. Includes live hospital discharges from January 1 to December 1, 2012. Cause-specific hospitalizations are defined by principal ICD-9-CM codes. See Vol. 2, ESRD Analytical Methods for principal ICD-9-CM diagnosis codes included in each cause of hospitalization category. Abbreviations: CVD, cardiovascular disease; ESRD, end-stage renal disease; rehosp, rehospitalization.
vol 2 Figure 4.7 Rehospitalization or death within 30 days from live hospital discharge for cardiovascular index hospitalization, by age, 2012
14Vol 2, ESRD, Ch 4
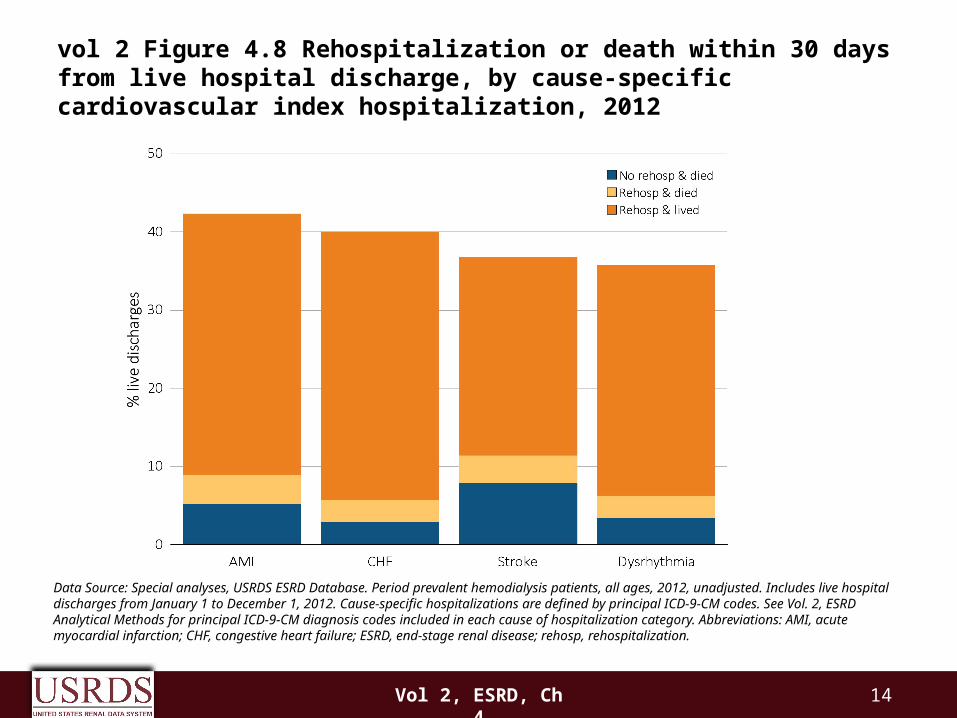
Data Source: Special analyses, USRDS ESRD Database. Period prevalent hemodialysis patients, all ages, 2012, unadjusted. Includes live hospital discharges from January 1 to December 1, 2012. Cause-specific hospitalizations are defined by principal ICD-9-CM codes. See Vol. 2, ESRD Analytical Methods for principal ICD-9-CM diagnosis codes included in each cause of hospitalization category. Abbreviations: AMI, acute myocardial infarction; CHF, congestive heart failure; ESRD, end-stage renal disease; rehosp, rehospitalization.
vol 2 Figure 4.8 Rehospitalization or death within 30 days from live hospital discharge, by cause-specific cardiovascular index hospitalization, 2012
15Vol 2, ESRD, Ch 4
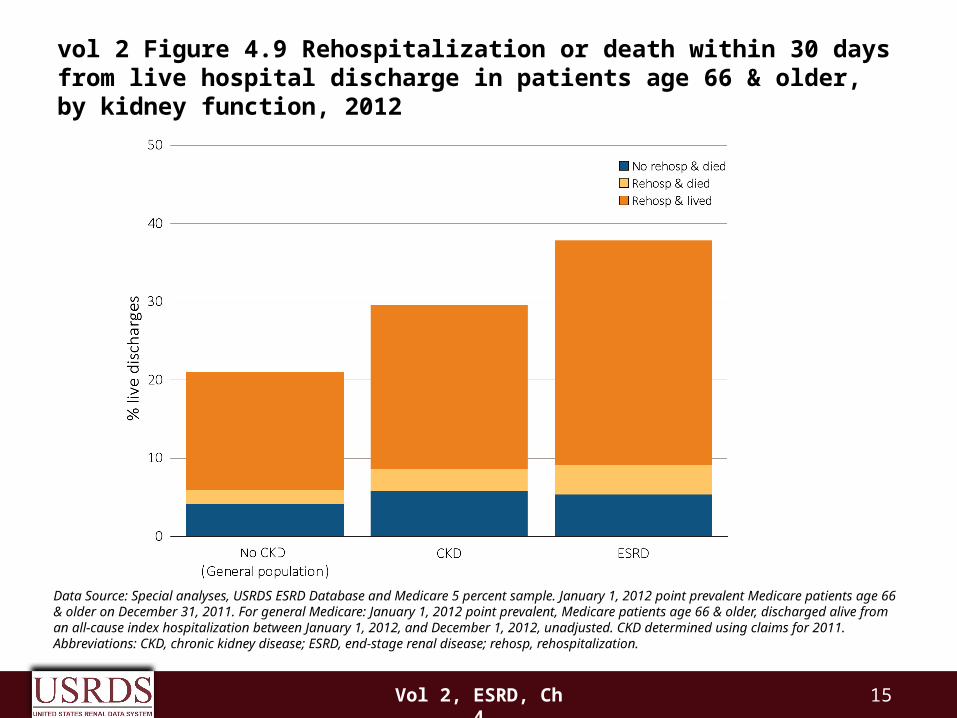
Data Source: Special analyses, USRDS ESRD Database and Medicare 5 percent sample. January 1, 2012 point prevalent Medicare patients age 66 & older on December 31, 2011. For general Medicare: January 1, 2012 point prevalent, Medicare patients age 66 & older, discharged alive from an all-cause index hospitalization between January 1, 2012, and December 1, 2012, unadjusted. CKD determined using claims for 2011. Abbreviations: CKD, chronic kidney disease; ESRD, end-stage renal disease; rehosp, rehospitalization.
vol 2 Figure 4.9 Rehospitalization or death within 30 days from live hospital discharge in patients age 66 & older, by kidney function, 2012