Embed Size (px)
Citation preview
Chapter 4
Disaster Scenario
Chapter 4 Disaster Scenario
4-1
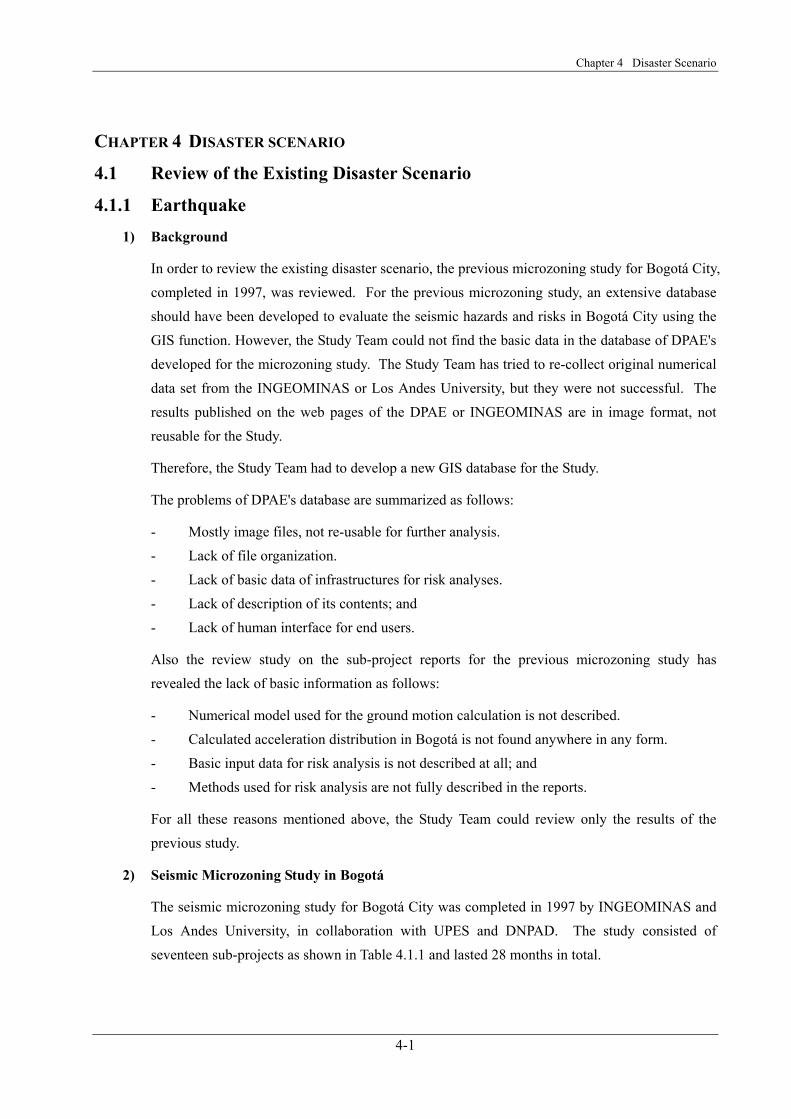
CHAPTER 4 DISASTER SCENARIO
4.1 Review of the Existing Disaster Scenario
4.1.1 Earthquake 1) Background
In order to review the existing disaster scenario, the previous microzoning study for Bogotá City, completed in 1997, was reviewed. For the previous microzoning study, an extensive database should have been developed to evaluate the seismic hazards and risks in Bogotá City using the GIS function. However, the Study Team could not find the basic data in the database of DPAE's developed for the microzoning study. The Study Team has tried to re-collect original numerical data set from the INGEOMINAS or Los Andes University, but they were not successful. The results published on the web pages of the DPAE or INGEOMINAS are in image format, not reusable for the Study.
Therefore, the Study Team had to develop a new GIS database for the Study.
The problems of DPAE's database are summarized as follows:
- Mostly image files, not re-usable for further analysis. - Lack of file organization. - Lack of basic data of infrastructures for risk analyses. - Lack of description of its contents; and - Lack of human interface for end users.
Also the review study on the sub-project reports for the previous microzoning study has revealed the lack of basic information as follows:
- Numerical model used for the ground motion calculation is not described. - Calculated acceleration distribution in Bogotá is not found anywhere in any form. - Basic input data for risk analysis is not described at all; and - Methods used for risk analysis are not fully described in the reports.
For all these reasons mentioned above, the Study Team could review only the results of the previous study.
2) Seismic Microzoning Study in Bogotá
The seismic microzoning study for Bogotá City was completed in 1997 by INGEOMINAS and Los Andes University, in collaboration with UPES and DNPAD. The study consisted of seventeen sub-projects as shown in Table 4.1.1 and lasted 28 months in total.
The Study on Disaster Prevention in the Bogotá Metropolitan Area in the Republic of Colombia
4-2
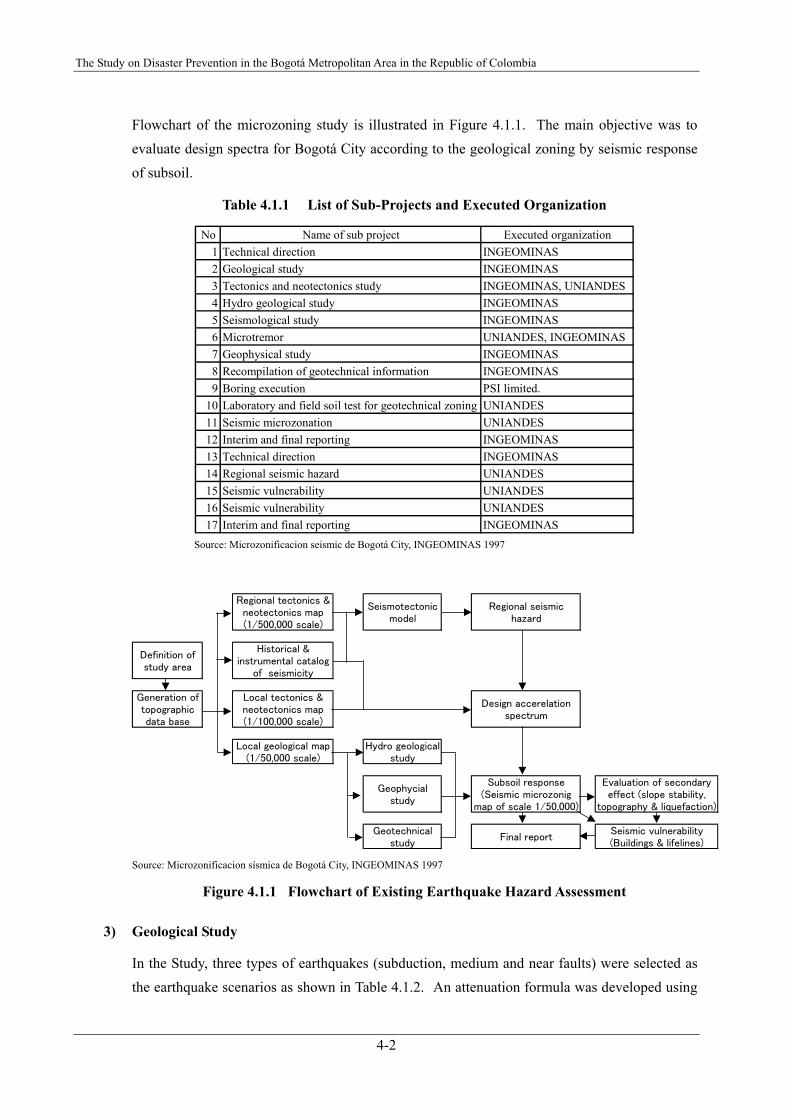
Flowchart of the microzoning study is illustrated in Figure 4.1.1. The main objective was to evaluate design spectra for Bogotá City according to the geological zoning by seismic response of subsoil.
Table 4.1.1 List of Sub-Projects and Executed Organization
No Name of sub project Executed organization1 Technical direction INGEOMINAS2 Geological study INGEOMINAS3 Tectonics and neotectonics study INGEOMINAS, UNIANDES4 Hydro geological study INGEOMINAS5 Seismological study INGEOMINAS6 Microtremor UNIANDES, INGEOMINAS7 Geophysical study INGEOMINAS8 Recompilation of geotechnical information INGEOMINAS9 Boring execution PSI limited.
10 Laboratory and field soil test for geotechnical zoning UNIANDES11 Seismic microzonation UNIANDES12 Interim and final reporting INGEOMINAS13 Technical direction INGEOMINAS14 Regional seismic hazard UNIANDES15 Seismic vulnerability UNIANDES16 Seismic vulnerability UNIANDES17 Interim and final reporting INGEOMINAS
Source: Microzonificacion seismic de Bogotá City, INGEOMINAS 1997
Regional tectonics &neotectonics map(1/500,000 scale)
Seismotectonicmodel
Regional seismichazard
Definition ofstudy area
Historical &instrumental catalog
of seismicity
Generation oftopographicdata base
Local tectonics &neotectonics map(1/100,000 scale)
Design accerelation
spectrum
Local geological map(1/50,000 scale)
Hydro geologicalstudy
Geophycialstudy
Subsoil response(Seismic microzonig
map of scale 1/50,000)
Evaluation of secondaryeffect (slope stability,
topography & liquefaction)
Geotechnicalstudy
Final reportSeismic vulnerability(Buildings & lifelines)
Source: Microzonificacion sísmica de Bogotá City, INGEOMINAS 1997
Figure 4.1.1 Flowchart of Existing Earthquake Hazard Assessment
3) Geological Study
In the Study, three types of earthquakes (subduction, medium and near faults) were selected as the earthquake scenarios as shown in Table 4.1.2. An attenuation formula was developed using
Chapter 4 Disaster Scenario
4-3
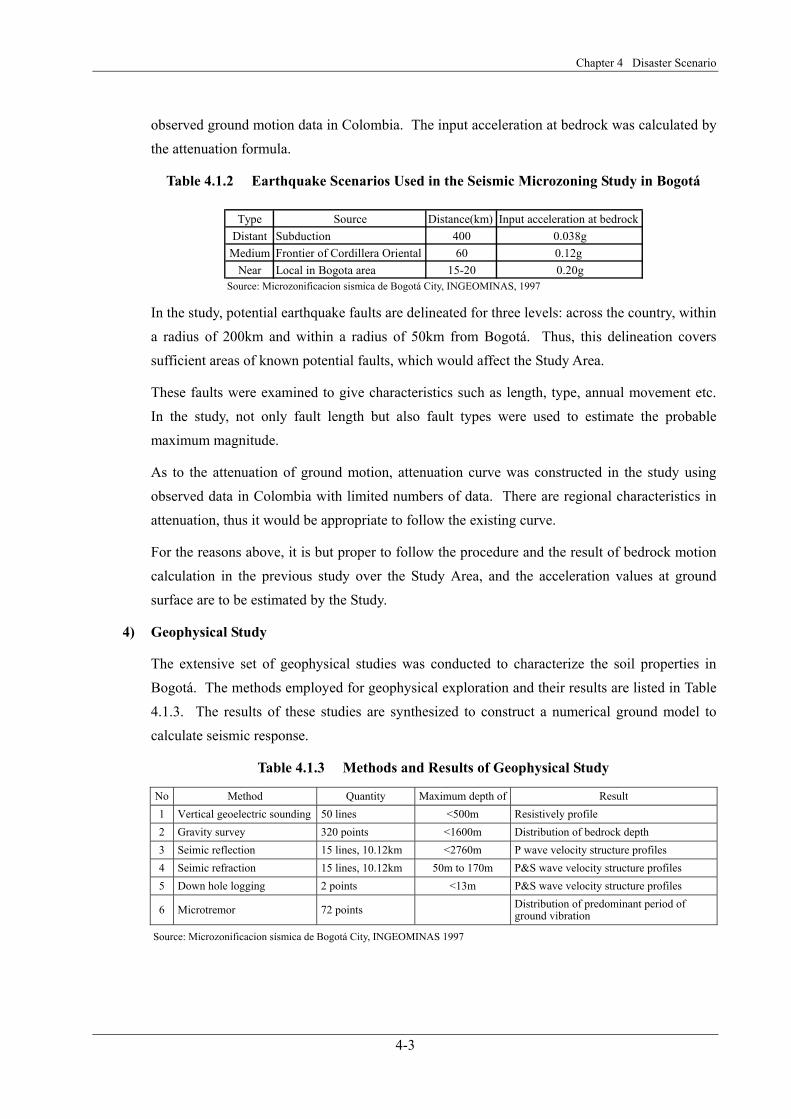
observed ground motion data in Colombia. The input acceleration at bedrock was calculated by the attenuation formula.
Table 4.1.2 Earthquake Scenarios Used in the Seismic Microzoning Study in Bogotá
Type Source Distance(km) Input acceleration at bedrockDistant Subduction 400 0.038g
Medium Frontier of Cordillera Oriental 60 0.12g Near Local in Bogota area 15-20 0.20g
Source: Microzonificacion sismica de Bogotá City, INGEOMINAS, 1997
In the study, potential earthquake faults are delineated for three levels: across the country, within a radius of 200km and within a radius of 50km from Bogotá. Thus, this delineation covers sufficient areas of known potential faults, which would affect the Study Area.
These faults were examined to give characteristics such as length, type, annual movement etc. In the study, not only fault length but also fault types were used to estimate the probable maximum magnitude.
As to the attenuation of ground motion, attenuation curve was constructed in the study using observed data in Colombia with limited numbers of data. There are regional characteristics in attenuation, thus it would be appropriate to follow the existing curve.
For the reasons above, it is but proper to follow the procedure and the result of bedrock motion calculation in the previous study over the Study Area, and the acceleration values at ground surface are to be estimated by the Study.
4) Geophysical Study
The extensive set of geophysical studies was conducted to characterize the soil properties in Bogotá. The methods employed for geophysical exploration and their results are listed in Table 4.1.3. The results of these studies are synthesized to construct a numerical ground model to calculate seismic response.
Table 4.1.3 Methods and Results of Geophysical Study
No Method Quantity Maximum depth of Result 1 Vertical geoelectric sounding 50 lines <500m Resistively profile 2 Gravity survey 320 points <1600m Distribution of bedrock depth 3 Seimic reflection 15 lines, 10.12km <2760m P wave velocity structure profiles 4 Seimic refraction 15 lines, 10.12km 50m to 170m P&S wave velocity structure profiles 5 Down hole logging 2 points <13m P&S wave velocity structure profiles
6 Microtremor 72 points Distribution of predominant period of ground vibration
Source: Microzonificacion sísmica de Bogotá City, INGEOMINAS 1997
The Study on Disaster Prevention in the Bogotá Metropolitan Area in the Republic of Colombia
4-4
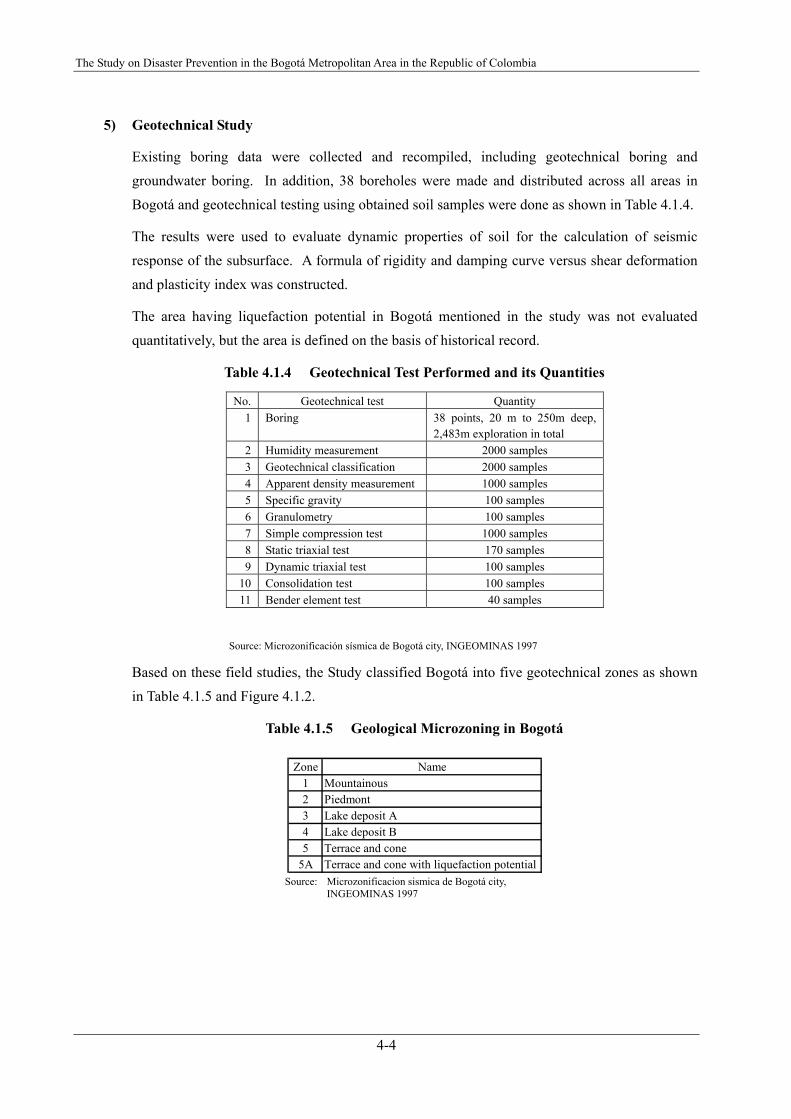
5) Geotechnical Study
Existing boring data were collected and recompiled, including geotechnical boring and groundwater boring. In addition, 38 boreholes were made and distributed across all areas in Bogotá and geotechnical testing using obtained soil samples were done as shown in Table 4.1.4.
The results were used to evaluate dynamic properties of soil for the calculation of seismic response of the subsurface. A formula of rigidity and damping curve versus shear deformation and plasticity index was constructed.
The area having liquefaction potential in Bogotá mentioned in the study was not evaluated quantitatively, but the area is defined on the basis of historical record.
Table 4.1.4 Geotechnical Test Performed and its Quantities
No. Geotechnical test Quantity 1 Boring 38 points, 20 m to 250m deep,
2,483m exploration in total 2 Humidity measurement 2000 samples 3 Geotechnical classification 2000 samples 4 Apparent density measurement 1000 samples 5 Specific gravity 100 samples 6 Granulometry 100 samples 7 Simple compression test 1000 samples 8 Static triaxial test 170 samples 9 Dynamic triaxial test 100 samples
10 Consolidation test 100 samples 11 Bender element test 40 samples
Source: Microzonificación sísmica de Bogotá city, INGEOMINAS 1997
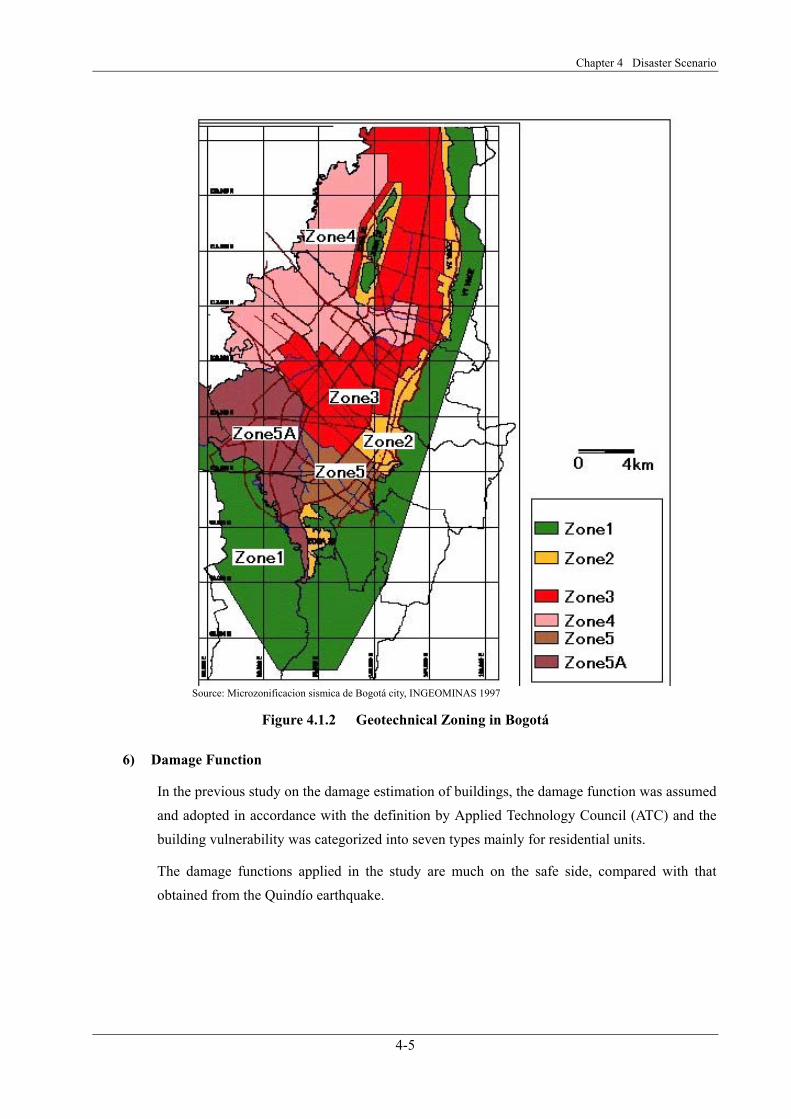
Based on these field studies, the Study classified Bogotá into five geotechnical zones as shown in Table 4.1.5 and Figure 4.1.2.
Table 4.1.5 Geological Microzoning in Bogotá
Zone Name1 Mountainous2 Piedmont3 Lake deposit A4 Lake deposit B5 Terrace and cone
5A Terrace and cone with liquefaction potential Source: Microzonificacion sismica de Bogotá city,
INGEOMINAS 1997
Chapter 4 Disaster Scenario
4-5
Source: Microzonificacion sismica de Bogotá city, INGEOMINAS 1997
Figure 4.1.2 Geotechnical Zoning in Bogotá
6) Damage Function
In the previous study on the damage estimation of buildings, the damage function was assumed and adopted in accordance with the definition by Applied Technology Council (ATC) and the building vulnerability was categorized into seven types mainly for residential units.
The damage functions applied in the study are much on the safe side, compared with that obtained from the Quindío earthquake.
The Study on Disaster Prevention in the Bogotá Metropolitan Area in the Republic of Colombia
4-6
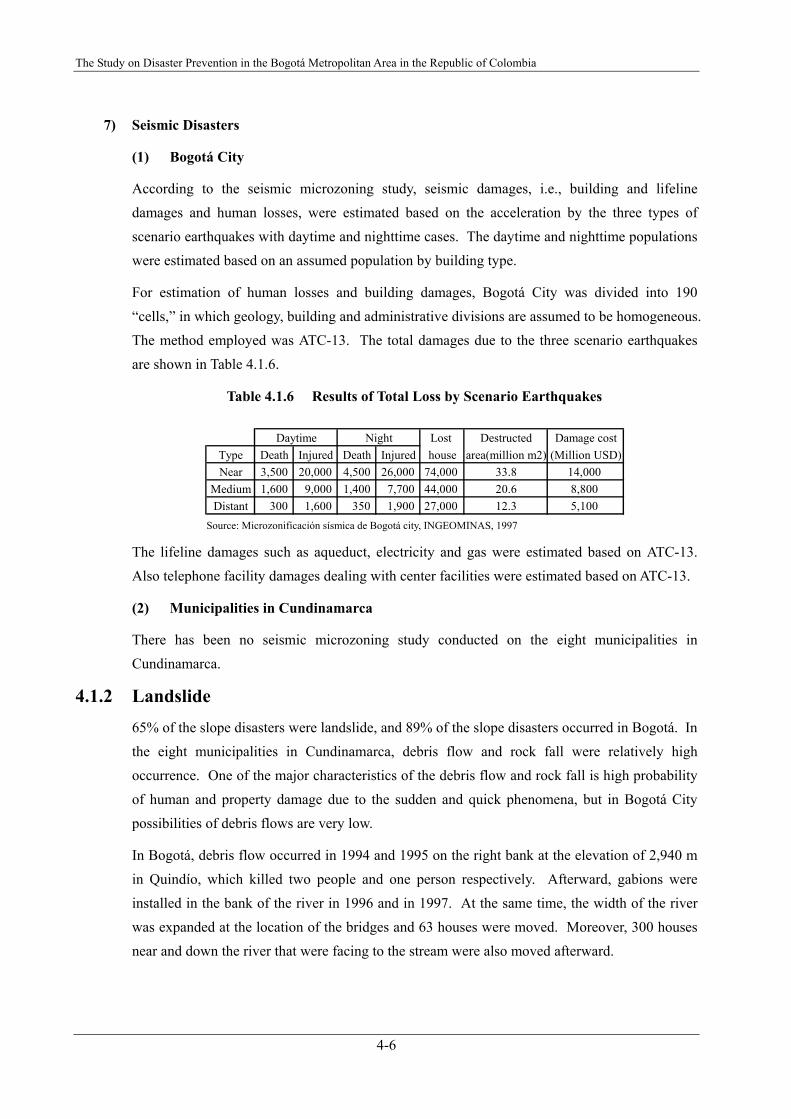
7) Seismic Disasters
(1) Bogotá City
According to the seismic microzoning study, seismic damages, i.e., building and lifeline damages and human losses, were estimated based on the acceleration by the three types of scenario earthquakes with daytime and nighttime cases. The daytime and nighttime populations were estimated based on an assumed population by building type.
For estimation of human losses and building damages, Bogotá City was divided into 190 “cells,” in which geology, building and administrative divisions are assumed to be homogeneous. The method employed was ATC-13. The total damages due to the three scenario earthquakes are shown in Table 4.1.6.
Table 4.1.6 Results of Total Loss by Scenario Earthquakes
Daytime Night Lost Destructed Damage costType Death Injured Death Injured house area(million m2) (Million USD)Near 3,500 20,000 4,500 26,000 74,000 33.8 14,000
Medium 1,600 9,000 1,400 7,700 44,000 20.6 8,800Distant 300 1,600 350 1,900 27,000 12.3 5,100
Source: Microzonificación sísmica de Bogotá city, INGEOMINAS, 1997
The lifeline damages such as aqueduct, electricity and gas were estimated based on ATC-13. Also telephone facility damages dealing with center facilities were estimated based on ATC-13.
(2) Municipalities in Cundinamarca
There has been no seismic microzoning study conducted on the eight municipalities in Cundinamarca.
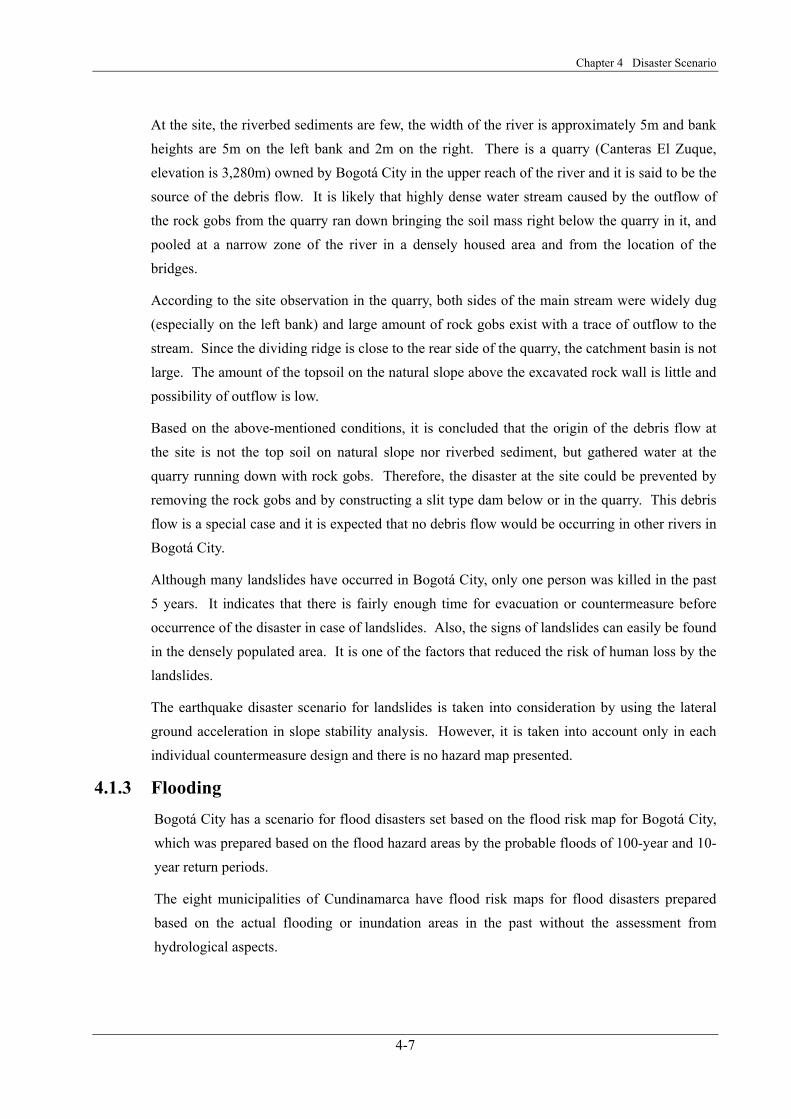
4.1.2 Landslide 65% of the slope disasters were landslide, and 89% of the slope disasters occurred in Bogotá. In the eight municipalities in Cundinamarca, debris flow and rock fall were relatively high occurrence. One of the major characteristics of the debris flow and rock fall is high probability of human and property damage due to the sudden and quick phenomena, but in Bogotá City possibilities of debris flows are very low.
In Bogotá, debris flow occurred in 1994 and 1995 on the right bank at the elevation of 2,940 m in Quindío, which killed two people and one person respectively. Afterward, gabions were installed in the bank of the river in 1996 and in 1997. At the same time, the width of the river was expanded at the location of the bridges and 63 houses were moved. Moreover, 300 houses near and down the river that were facing to the stream were also moved afterward.
Chapter 4 Disaster Scenario
4-7
At the site, the riverbed sediments are few, the width of the river is approximately 5m and bank heights are 5m on the left bank and 2m on the right. There is a quarry (Canteras El Zuque, elevation is 3,280m) owned by Bogotá City in the upper reach of the river and it is said to be the source of the debris flow. It is likely that highly dense water stream caused by the outflow of the rock gobs from the quarry ran down bringing the soil mass right below the quarry in it, and pooled at a narrow zone of the river in a densely housed area and from the location of the bridges.
According to the site observation in the quarry, both sides of the main stream were widely dug (especially on the left bank) and large amount of rock gobs exist with a trace of outflow to the stream. Since the dividing ridge is close to the rear side of the quarry, the catchment basin is not large. The amount of the topsoil on the natural slope above the excavated rock wall is little and possibility of outflow is low.
Based on the above-mentioned conditions, it is concluded that the origin of the debris flow at the site is not the top soil on natural slope nor riverbed sediment, but gathered water at the quarry running down with rock gobs. Therefore, the disaster at the site could be prevented by removing the rock gobs and by constructing a slit type dam below or in the quarry. This debris flow is a special case and it is expected that no debris flow would be occurring in other rivers in Bogotá City.
Although many landslides have occurred in Bogotá City, only one person was killed in the past 5 years. It indicates that there is fairly enough time for evacuation or countermeasure before occurrence of the disaster in case of landslides. Also, the signs of landslides can easily be found in the densely populated area. It is one of the factors that reduced the risk of human loss by the landslides.
The earthquake disaster scenario for landslides is taken into consideration by using the lateral ground acceleration in slope stability analysis. However, it is taken into account only in each individual countermeasure design and there is no hazard map presented.
4.1.3 Flooding Bogotá City has a scenario for flood disasters set based on the flood risk map for Bogotá City, which was prepared based on the flood hazard areas by the probable floods of 100-year and 10-year return periods.
The eight municipalities of Cundinamarca have flood risk maps for flood disasters prepared based on the actual flooding or inundation areas in the past without the assessment from hydrological aspects.
The Study on Disaster Prevention in the Bogotá Metropolitan Area in the Republic of Colombia
4-8
In order to develop an optimum flood risk map for the Bogotá Metropolitan Area, it is necessary to conduct a flood analysis of the Rio Bogotá and to identify flood problems in the Bogotá Metropolitan Area.
4.1.4 Industrial Facilities A study was conducted by Los Andes University about the potential effect of industrial facilities in the localities of Puente Aranda and Fontibón on the following: - The life of the district habitants. - The life of industrial employees. - The public service infrastructure. - The urban furniture. - The activity of the city’s productive area. - Institutions that support the society (schools). - Massive events installations. - Health care centers.
Risk generation process might define several failure scenarios. For instance, if an earthquake were taken as a risk generation process, there could be defined scenarios in terms of the most probable earthquake, the most frequent one, etc. However, what Los Andes University studied was fire, explosion, spill and leakage events in normal times, not in an earthquake.
The discussed model should lead to the definition of a certain level of consequences per scenario considered. The results per scenario might represent different levels of evidence that support the final decision. In general, there must be evaluated the consequences in terms of human lives, economic aspects and damages to the physical infrastructure. The consequence should be identifiable based on a parameter or index that supports the decision. Comments by the Study Team about the Los Andes University study are as follows: - The analysis method used by Los Andes University is nearly the same method (Fire,
Leakage, Spill) applied in Japan except explosion blast pressure influence (11,760Pa (=0.12kgf/cm2), which corresponds to the window glass breakage. This is important because the degree of damage to the public is determined by blast pressure at the residential area.
- For the leakage calculation, amount of chemical substance is assumed; however actual leakage amount assumption in case of real accidents is very difficult to calculate. So worst-case scenario like in the EPA or OSHA risk analysis method should be applied to judge the risk. Worst-case scenario is probable at the time of strong earthquake.
Chapter 4 New Disaster Scenario
4-9
4.2 New Disaster Scenario
4.2.1 Earthquake 1) Basic Concept of Microzoning
(1) Seismic microzoning
In order to mitigate damage due to a possible disaster in the future in a given area, it is important to have knowledge of its disaster history, to understand its current status of disaster prevention and response, and to evaluate possible disasters in the area in future.
In this study, seismic microzoning is defined as hazard and risk evaluation study for a possible future earthquake that would affect the Study Area.
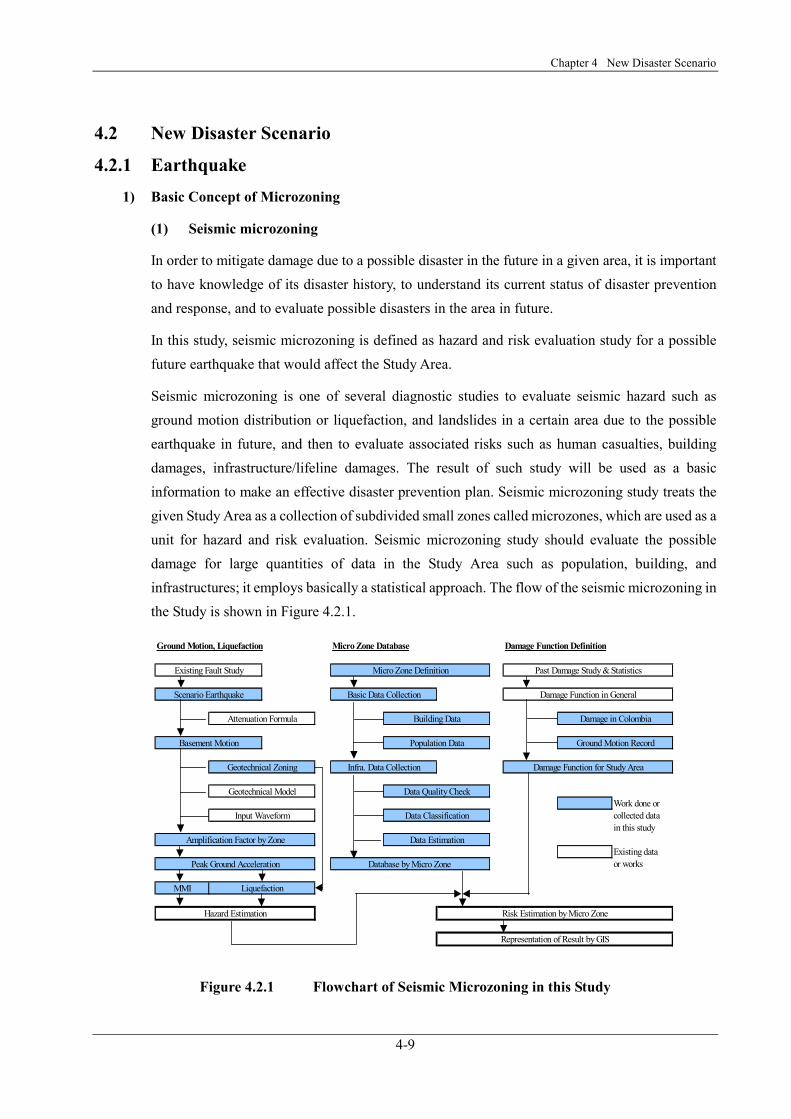
Seismic microzoning is one of several diagnostic studies to evaluate seismic hazard such as ground motion distribution or liquefaction, and landslides in a certain area due to the possible earthquake in future, and then to evaluate associated risks such as human casualties, building damages, infrastructure/lifeline damages. The result of such study will be used as a basic information to make an effective disaster prevention plan. Seismic microzoning study treats the given Study Area as a collection of subdivided small zones called microzones, which are used as a unit for hazard and risk evaluation. Seismic microzoning study should evaluate the possible damage for large quantities of data in the Study Area such as population, building, and infrastructures; it employs basically a statistical approach. The flow of the seismic microzoning in the Study is shown in Figure 4.2.1.
Ground Motion, Liquefaction Micro Zone Database Damage Function Definition
Existing Fault Study Micro Zone Definition Past Damage Study & Statistics
Scenario Earthquake Basic Data Collection Damage Function in General
Attenuation Formula Building Data Damage in Colombia
Basement Motion Population Data Ground Motion Record
Geotechnical Zoning Infra. Data Collection Damage Function for Study Area
Geotechnical Model Data Quality CheckWork done or
Input Waveform Data Classification collected data in this study
Amplification Factor by Zone Data EstimationExisting data
Peak Ground Acceleration Database by Micro Zone or works
MMI Liquefaction
Hazard Estimation Risk Estimation by Micro Zone
Representation of Result by GIS
Figure 4.2.1 Flowchart of Seismic Microzoning in this Study
The Study on Disaster Prevention in the Bogotá Metropolitan Area in the Republic of Colombia
4-10
2) Basic Conditions
(1) Scenario earthquake
A. Fault parameter
This Study considers three scenario earthquakes, the same as in the previous microzoning study. They are MZSB97: “Near earthquake,” which involves the effect of faults within a radius of 50km from Bogotá, “Regional earthquake,” which involves the effect of faults within a radius of 200km from Bogotá, and subduction event in the Pacific coast at a distance of 400km from Bogotá. In MZSB97, uniform distribution of bedrock acceleration was assumed within Bogotá. The scenario earthquakes for the Study are taken as a more specific and realistic approach for the following reasons: - Non-uniform distribution of bedrock acceleration is taken into account, due to the larger
spatial extension of the Study Area; and. - Most probable and typical earthquakes are considered to simulate realistic situations in a
possible event for disaster mitigation planning.
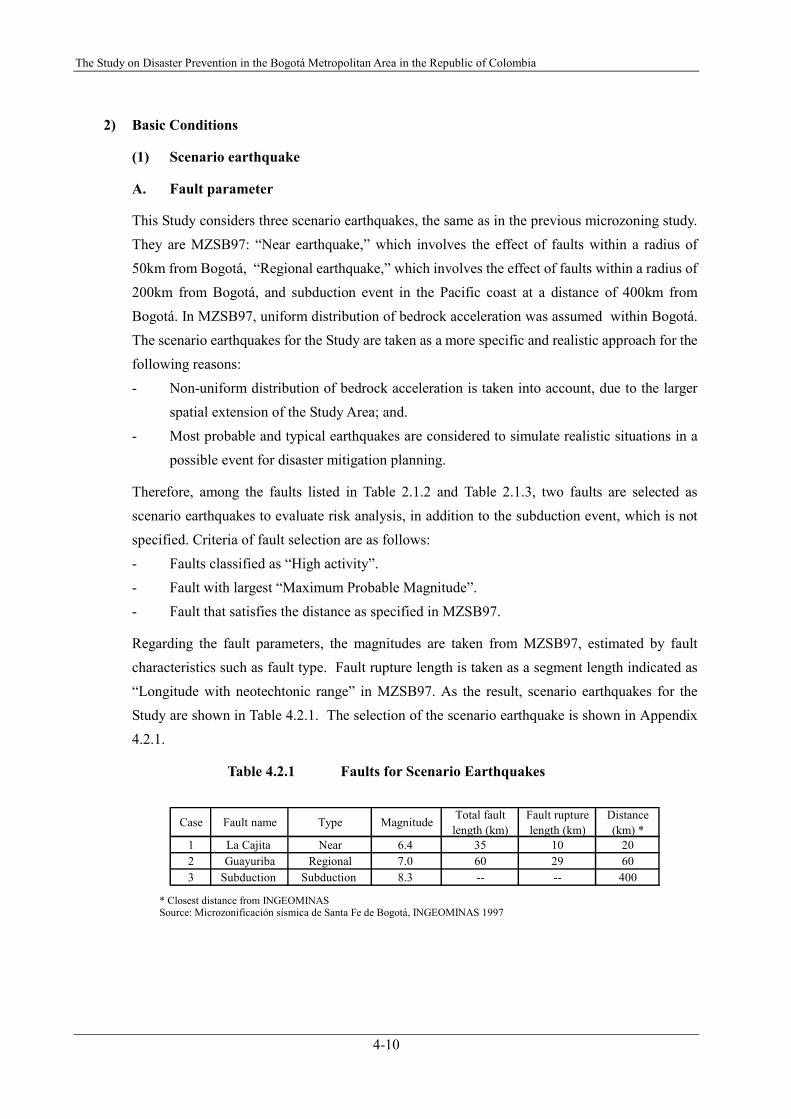
Therefore, among the faults listed in Table 2.1.2 and Table 2.1.3, two faults are selected as scenario earthquakes to evaluate risk analysis, in addition to the subduction event, which is not specified. Criteria of fault selection are as follows: - Faults classified as “High activity”. - Fault with largest “Maximum Probable Magnitude”. - Fault that satisfies the distance as specified in MZSB97.
Regarding the fault parameters, the magnitudes are taken from MZSB97, estimated by fault characteristics such as fault type. Fault rupture length is taken as a segment length indicated as “Longitude with neotechtonic range” in MZSB97. As the result, scenario earthquakes for the Study are shown in Table 4.2.1. The selection of the scenario earthquake is shown in Appendix 4.2.1.
Table 4.2.1 Faults for Scenario Earthquakes
Case Fault name Type Magnitude Total faultlength (km)
Fault rupturelength (km)
Distance(km) *
1 La Cajita Near 6.4 35 10 202 Guayuriba Regional 7.0 60 29 603 Subduction Subduction 8.3 -- -- 400
* Closest distance from INGEOMINAS Source: Microzonificación sísmica de Santa Fe de Bogotá, INGEOMINAS 1997
Chapter 4 New Disaster Scenario
4-11
B. Attenuation of ground motion at basement
Seismic basement
Seismic waves generated by fault movements spread along the basement as its amplitude decreases with distance, then finally amplified by the effect of surface geology. In order to calculate ground motion at specific site, “seismic basement” is usually defined. Seismic basement is defined as a geological stratum where incident seismic wave can be commonly treated, impedance variation beneath the stratum is negligible, and seismic wave is geologically uniform. Then the ground acceleration can be treated by the difference of surface geological effects.
Attenuation Relation
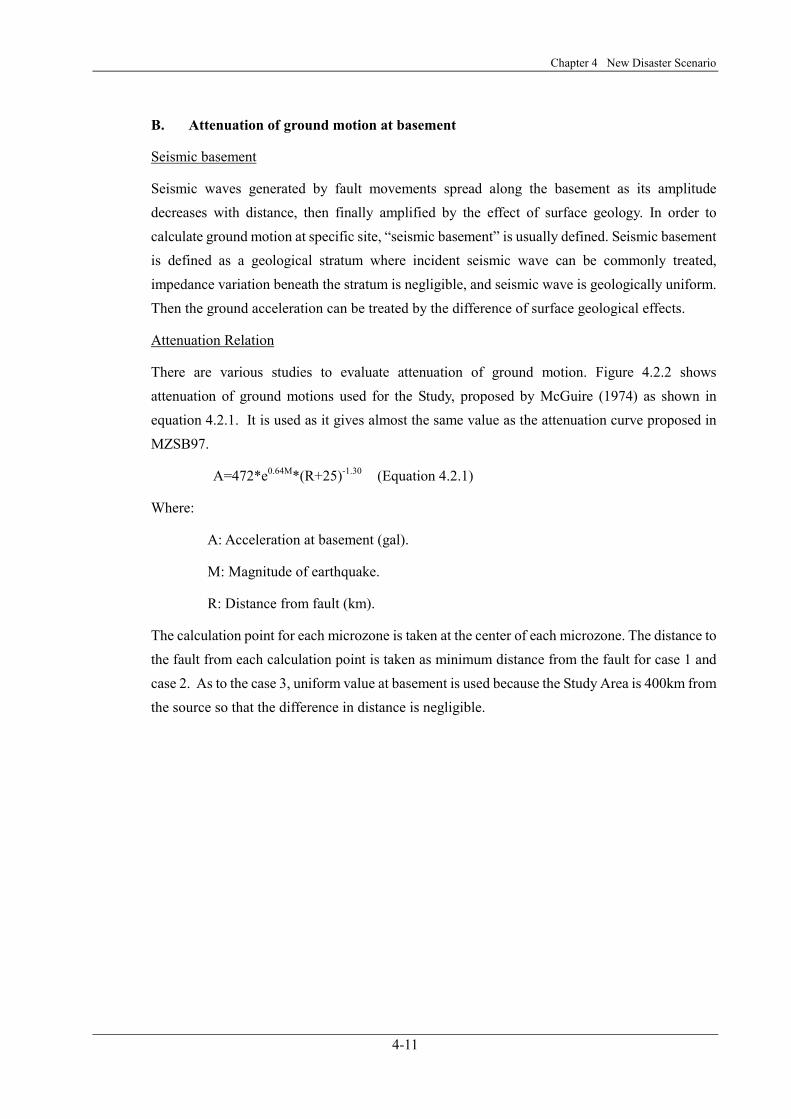
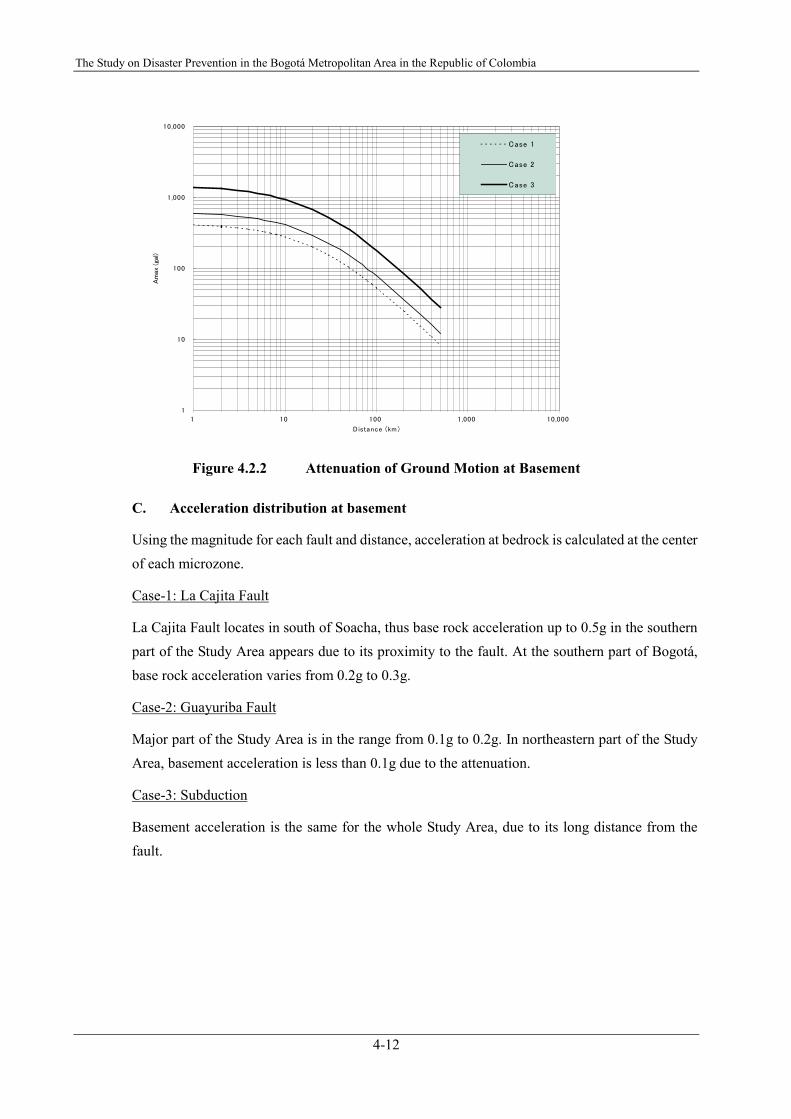
There are various studies to evaluate attenuation of ground motion. Figure 4.2.2 shows attenuation of ground motions used for the Study, proposed by McGuire (1974) as shown in equation 4.2.1. It is used as it gives almost the same value as the attenuation curve proposed in MZSB97.
A=472*e0.64M*(R+25)-1.30 (Equation 4.2.1)
Where:
A: Acceleration at basement (gal).
M: Magnitude of earthquake.
R: Distance from fault (km).
The calculation point for each microzone is taken at the center of each microzone. The distance to the fault from each calculation point is taken as minimum distance from the fault for case 1 and case 2. As to the case 3, uniform value at basement is used because the Study Area is 400km from the source so that the difference in distance is negligible.
The Study on Disaster Prevention in the Bogotá Metropolitan Area in the Republic of Colombia
4-12
1
10
100
1,000
10,000
1 10 100 1,000 10,000
Distance (km )
Am
ax (ga
l)
Case 1
Case 2
Case 3
Figure 4.2.2 Attenuation of Ground Motion at Basement
C. Acceleration distribution at basement
Using the magnitude for each fault and distance, acceleration at bedrock is calculated at the center of each microzone.
Case-1: La Cajita Fault
La Cajita Fault locates in south of Soacha, thus base rock acceleration up to 0.5g in the southern part of the Study Area appears due to its proximity to the fault. At the southern part of Bogotá, base rock acceleration varies from 0.2g to 0.3g.
Case-2: Guayuriba Fault
Major part of the Study Area is in the range from 0.1g to 0.2g. In northeastern part of the Study Area, basement acceleration is less than 0.1g due to the attenuation.
Case-3: Subduction
Basement acceleration is the same for the whole Study Area, due to its long distance from the fault.
Chapter 4 New Disaster Scenario
4-13
(2) Evaluation of surface geology
A. Geological zoning
Geological data collection
Based on aerial photo interpretation and site visits to verify an existing geological map, a geological zoning map is prepared for the Study Area. Geological zoning map of 1/50,000 scale was made and served as a basis to make a geotechnical-zoning map later on.
B. Geotechnical zoning
The Study Team collected existing boring data from related organizations such as DPAE, INGEOMINAS, EAAB, CAR, DAMA, IDEAM, INVIAS, Cundinamarca government, planning office in each municipality etc.
Geotechnical boring data collection
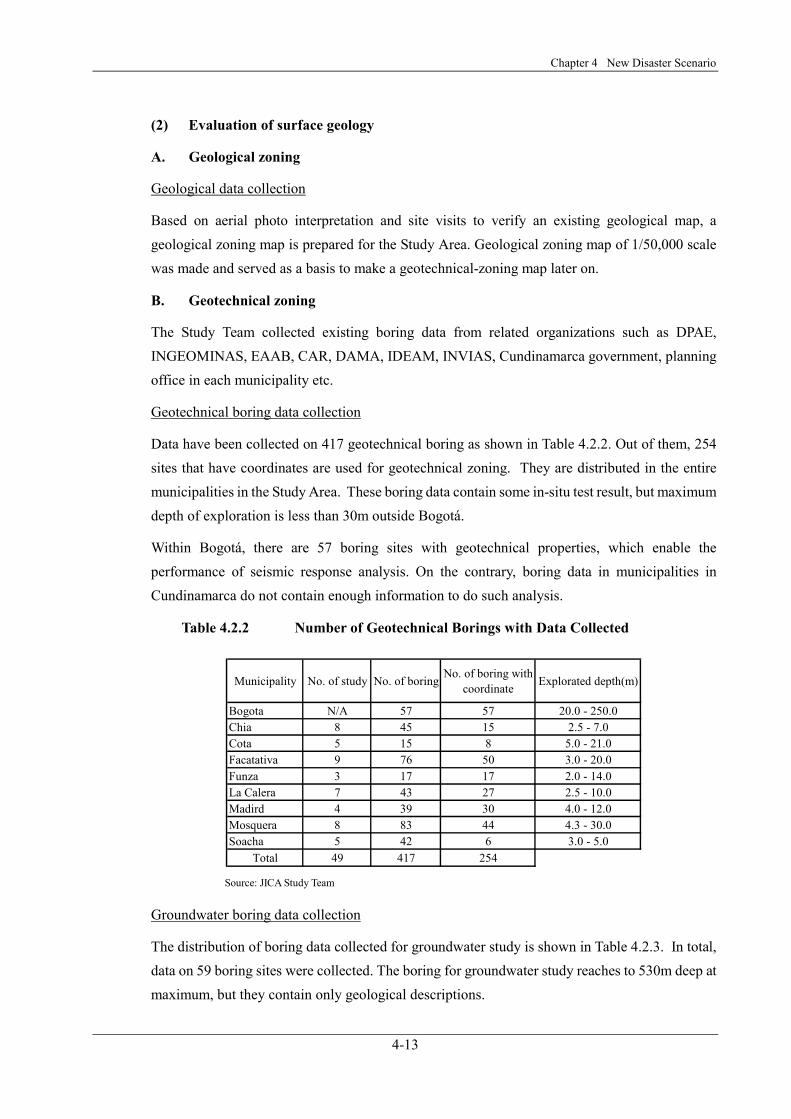
Data have been collected on 417 geotechnical boring as shown in Table 4.2.2. Out of them, 254 sites that have coordinates are used for geotechnical zoning. They are distributed in the entire municipalities in the Study Area. These boring data contain some in-situ test result, but maximum depth of exploration is less than 30m outside Bogotá.
Within Bogotá, there are 57 boring sites with geotechnical properties, which enable the performance of seismic response analysis. On the contrary, boring data in municipalities in Cundinamarca do not contain enough information to do such analysis.
Table 4.2.2 Number of Geotechnical Borings with Data Collected
Municipality No. of study No. of boring No. of boring withcoordinate Explorated depth(m)
Bogota N/A 57 57 20.0 - 250.0Chia 8 45 15 2.5 - 7.0Cota 5 15 8 5.0 - 21.0Facatativa 9 76 50 3.0 - 20.0Funza 3 17 17 2.0 - 14.0La Calera 7 43 27 2.5 - 10.0Madird 4 39 30 4.0 - 12.0Mosquera 8 83 44 4.3 - 30.0Soacha 5 42 6 3.0 - 5.0
Total 49 417 254 Source: JICA Study Team
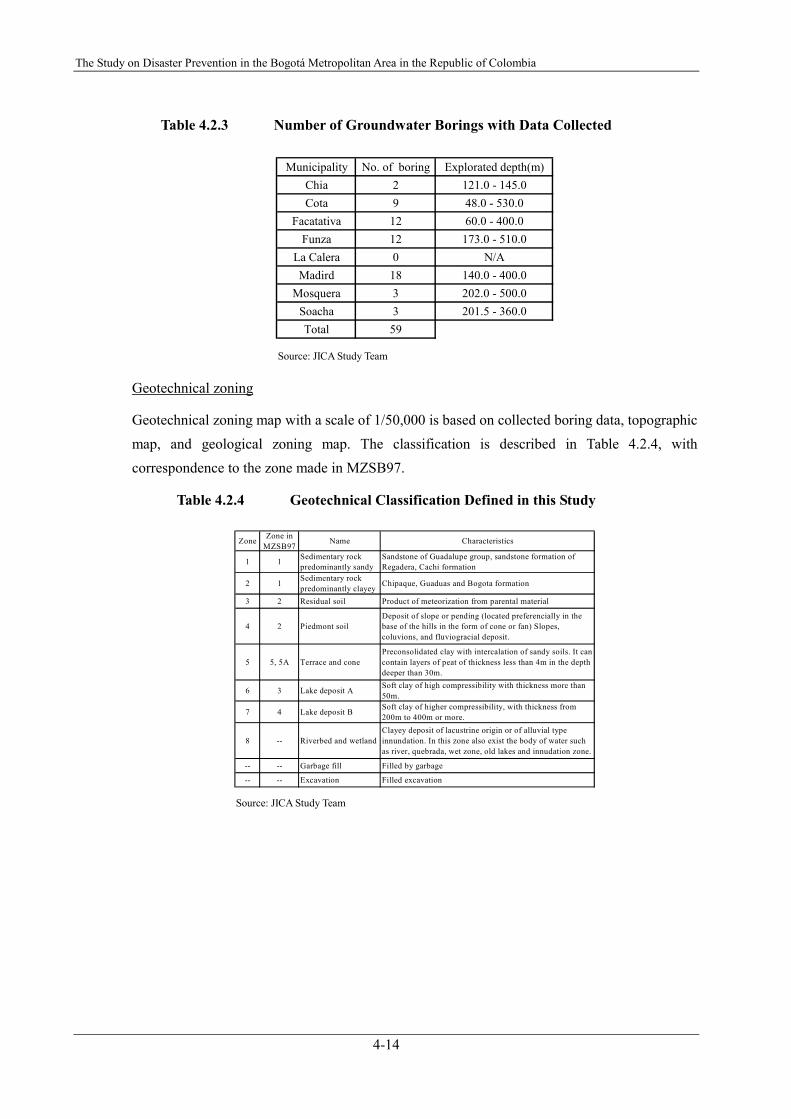
Groundwater boring data collection
The distribution of boring data collected for groundwater study is shown in Table 4.2.3. In total, data on 59 boring sites were collected. The boring for groundwater study reaches to 530m deep at maximum, but they contain only geological descriptions.
The Study on Disaster Prevention in the Bogotá Metropolitan Area in the Republic of Colombia
4-14
Table 4.2.3 Number of Groundwater Borings with Data Collected
Municipality No. of boring Explorated depth(m)Chia 2 121.0 - 145.0Cota 9 48.0 - 530.0
Facatativa 12 60.0 - 400.0Funza 12 173.0 - 510.0
La Calera 0 N/AMadird 18 140.0 - 400.0
Mosquera 3 202.0 - 500.0Soacha 3 201.5 - 360.0Total 59
Source: JICA Study Team
Geotechnical zoning
Geotechnical zoning map with a scale of 1/50,000 is based on collected boring data, topographic map, and geological zoning map. The classification is described in Table 4.2.4, with correspondence to the zone made in MZSB97.
Table 4.2.4 Geotechnical Classification Defined in this Study
Zone Zone inMZSB97
Name Characteristics
1 1 Sedimentary rockpredominantly sandy
Sandstone of Guadalupe group, sandstone formation ofRegadera, Cachi formation
2 1 Sedimentary rockpredominantly clayey Chipaque, Guaduas and Bogota formation
3 2 Residual soil Product of meteorization from parental material
4 2 Piedmont soilDeposit of slope or pending (located preferencially in thebase of the hills in the form of cone or fan) Slopes,coluvions, and fluviogracial deposit.
5 5, 5A Terrace and conePreconsolidated clay with intercalation of sandy soils. It cancontain layers of peat of thickness less than 4m in the depthdeeper than 30m.
6 3 Lake deposit A Soft clay of high compressibility with thickness more than50m.
7 4 Lake deposit B Soft clay of higher compressibility, with thickness from200m to 400m or more.
8 -- Riverbed and wetlandClayey deposit of lacustrine origin or of alluvial typeinnundation. In this zone also exist the body of water suchas river, quebrada, wet zone, old lakes and innudation zone.
-- -- Garbage fill Filled by garbage
-- -- Excavation Filled excavation Source: JICA Study Team
Chapter 4 New Disaster Scenario
4-15
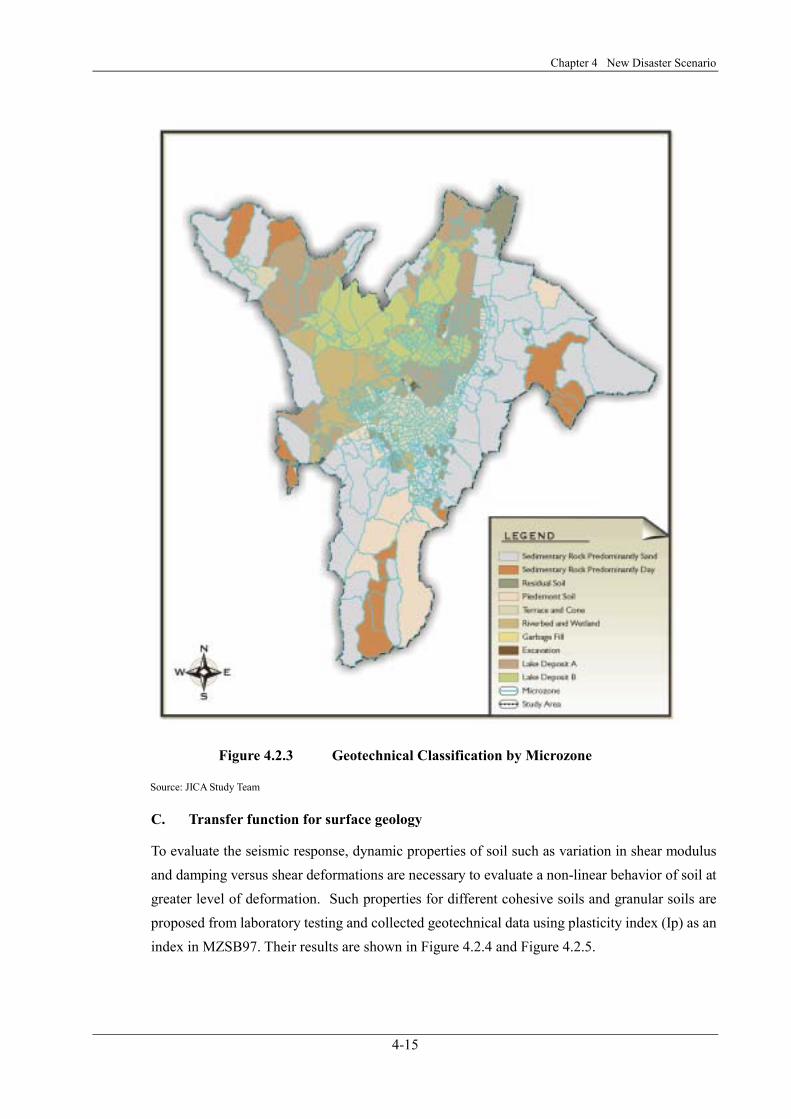
Figure 4.2.3 Geotechnical Classification by Microzone
Source: JICA Study Team
C. Transfer function for surface geology
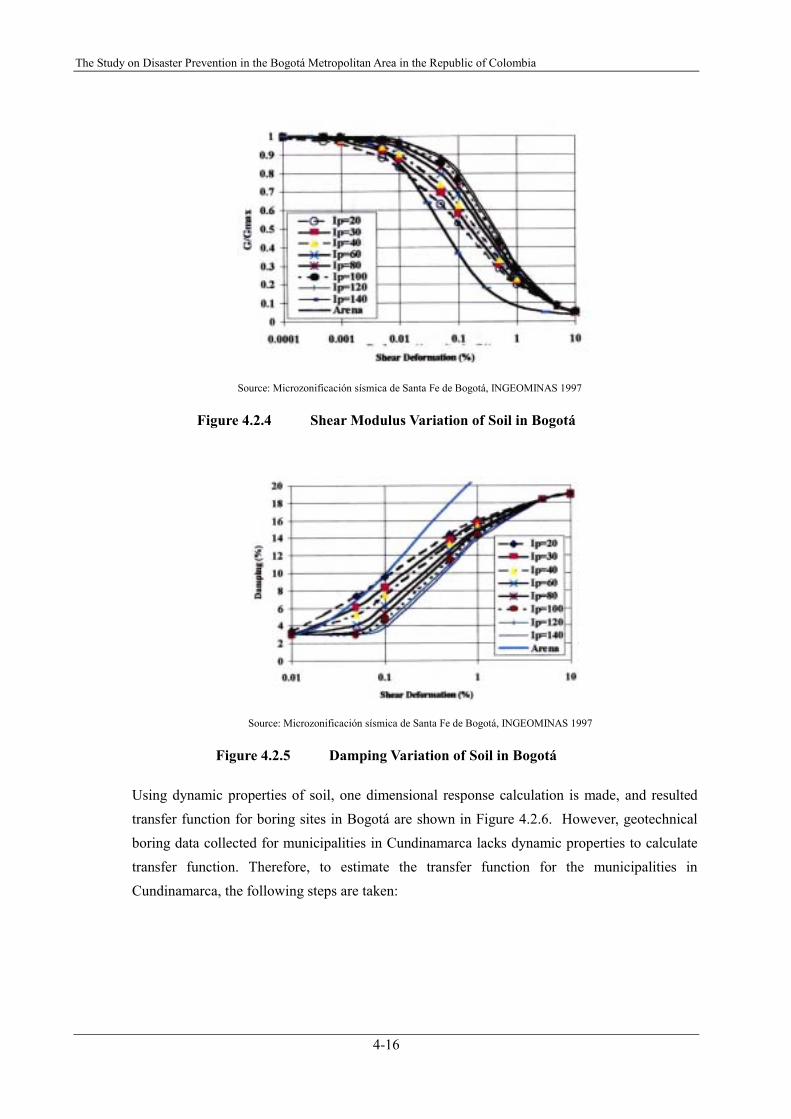
To evaluate the seismic response, dynamic properties of soil such as variation in shear modulus and damping versus shear deformations are necessary to evaluate a non-linear behavior of soil at greater level of deformation. Such properties for different cohesive soils and granular soils are proposed from laboratory testing and collected geotechnical data using plasticity index (Ip) as an index in MZSB97. Their results are shown in Figure 4.2.4 and Figure 4.2.5.
The Study on Disaster Prevention in the Bogotá Metropolitan Area in the Republic of Colombia
4-16
Source: Microzonificación sísmica de Santa Fe de Bogotá, INGEOMINAS 1997
Figure 4.2.4 Shear Modulus Variation of Soil in Bogotá
Source: Microzonificación sísmica de Santa Fe de Bogotá, INGEOMINAS 1997
Figure 4.2.5 Damping Variation of Soil in Bogotá
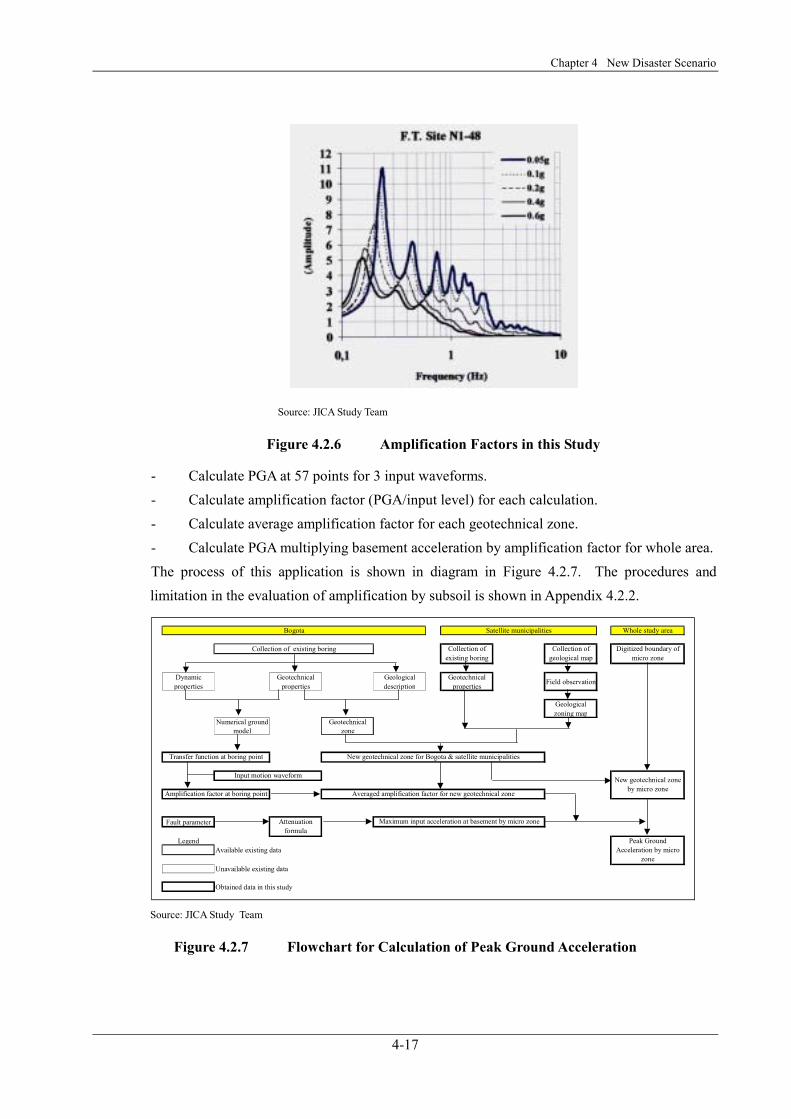
Using dynamic properties of soil, one dimensional response calculation is made, and resulted transfer function for boring sites in Bogotá are shown in Figure 4.2.6. However, geotechnical boring data collected for municipalities in Cundinamarca lacks dynamic properties to calculate transfer function. Therefore, to estimate the transfer function for the municipalities in Cundinamarca, the following steps are taken:
Chapter 4 New Disaster Scenario
4-17
Source: JICA Study Team
Figure 4.2.6 Amplification Factors in this Study
- Calculate PGA at 57 points for 3 input waveforms. - Calculate amplification factor (PGA/input level) for each calculation. - Calculate average amplification factor for each geotechnical zone. - Calculate PGA multiplying basement acceleration by amplification factor for whole area. The process of this application is shown in diagram in Figure 4.2.7. The procedures and limitation in the evaluation of amplification by subsoil is shown in Appendix 4.2.2.
Dynamicproperties
Geotechnicalproperties
Geologicaldescription
Geotechnicalproperties Field observation
Geologicalzoning map
Numerical groundmodel
Geotechnicalzone
Fault parameter
LegendAvailable existing data
Unavailable existing data
Obtained data in this study
Peak GroundAcceleration by micro
zone
New geotechnical zoneby micro zone
Attenuationformula
Maximum input acceleration at basement by micro zone
Collection ofexisting boring
Collection ofgeological map
Input motion waveform
New geotechnical zone for Bogota & satellite municipalities
Averaged amplification factor for new geotechnical zone
Transfer function at boring point
Amplification factor at boring point
Bogota Satellite municipalities Whole study area
Collection of existing boring Digitized boundary ofmicro zone
Source: JICA Study Team
Figure 4.2.7 Flowchart for Calculation of Peak Ground Acceleration
The Study on Disaster Prevention in the Bogotá Metropolitan Area in the Republic of Colombia
4-18
(3) Strong motion calculation
A. Input ground motion records
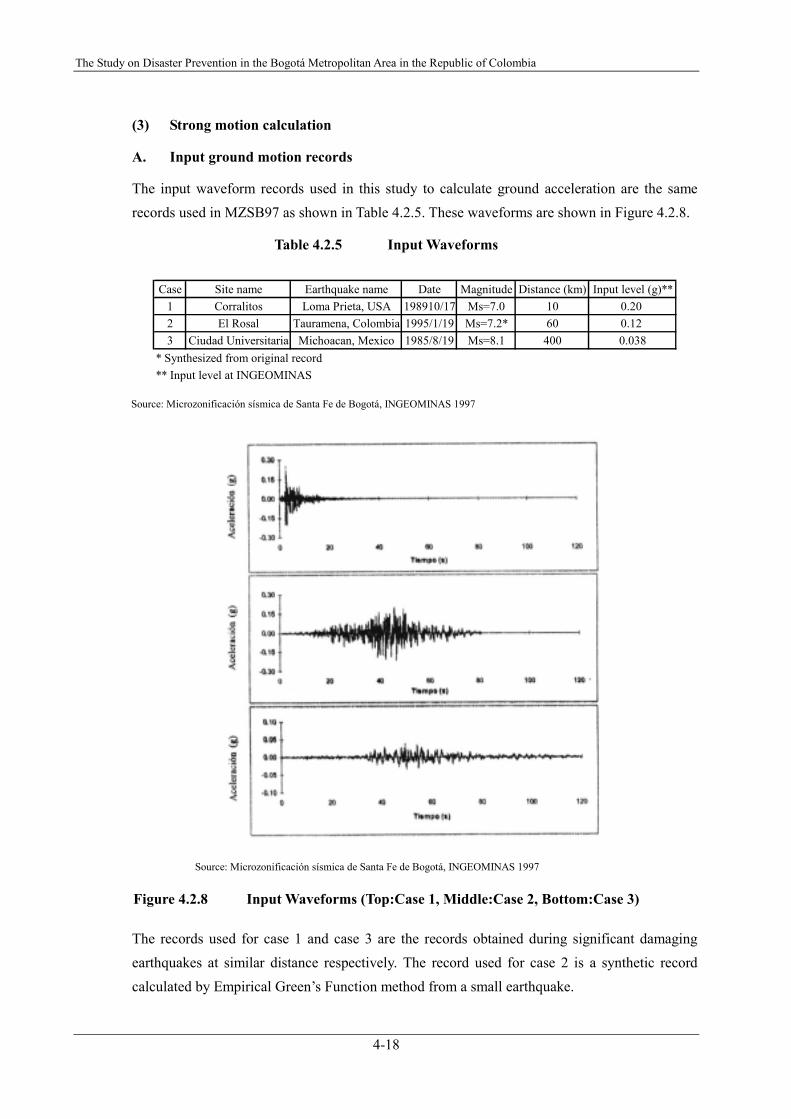
The input waveform records used in this study to calculate ground acceleration are the same records used in MZSB97 as shown in Table 4.2.5. These waveforms are shown in Figure 4.2.8.
Table 4.2.5 Input Waveforms
Case Site name Earthquake name Date Magnitude Distance (km) Input level (g)**1 Corralitos Loma Prieta, USA 198910/17 Ms=7.0 10 0.202 El Rosal Tauramena, Colombia 1995/1/19 Ms=7.2* 60 0.123 Ciudad Universitaria Michoacan, Mexico 1985/8/19 Ms=8.1 400 0.038
* Synthesized from original record** Input level at INGEOMINAS
Source: Microzonificación sísmica de Santa Fe de Bogotá, INGEOMINAS 1997
Source: Microzonificación sísmica de Santa Fe de Bogotá, INGEOMINAS 1997
Figure 4.2.8 Input Waveforms (Top:Case 1, Middle:Case 2, Bottom:Case 3)
The records used for case 1 and case 3 are the records obtained during significant damaging earthquakes at similar distance respectively. The record used for case 2 is a synthetic record calculated by Empirical Green’s Function method from a small earthquake.
Chapter 4 New Disaster Scenario
4-19
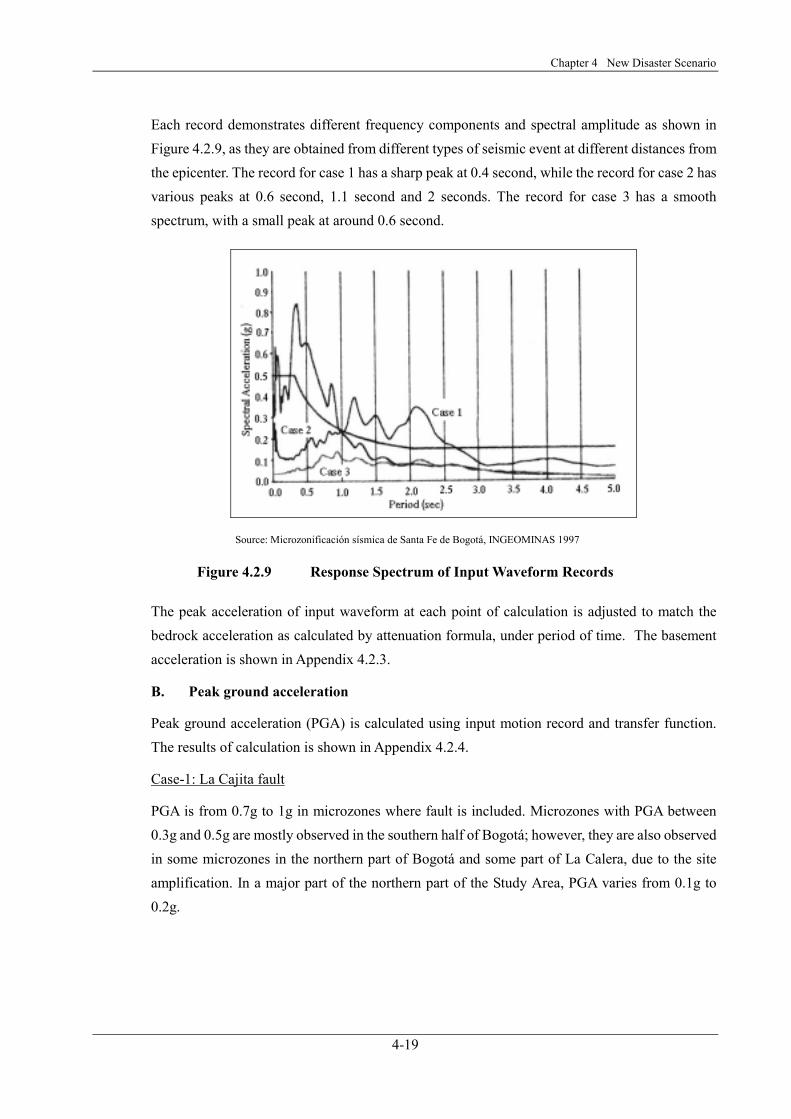
Each record demonstrates different frequency components and spectral amplitude as shown in Figure 4.2.9, as they are obtained from different types of seismic event at different distances from the epicenter. The record for case 1 has a sharp peak at 0.4 second, while the record for case 2 has various peaks at 0.6 second, 1.1 second and 2 seconds. The record for case 3 has a smooth spectrum, with a small peak at around 0.6 second.
Source: Microzonificación sísmica de Santa Fe de Bogotá, INGEOMINAS 1997
Figure 4.2.9 Response Spectrum of Input Waveform Records
The peak acceleration of input waveform at each point of calculation is adjusted to match the bedrock acceleration as calculated by attenuation formula, under period of time. The basement acceleration is shown in Appendix 4.2.3.
B. Peak ground acceleration
Peak ground acceleration (PGA) is calculated using input motion record and transfer function. The results of calculation is shown in Appendix 4.2.4.
Case-1: La Cajita fault
PGA is from 0.7g to 1g in microzones where fault is included. Microzones with PGA between 0.3g and 0.5g are mostly observed in the southern half of Bogotá; however, they are also observed in some microzones in the northern part of Bogotá and some part of La Calera, due to the site amplification. In a major part of the northern part of the Study Area, PGA varies from 0.1g to 0.2g.
The Study on Disaster Prevention in the Bogotá Metropolitan Area in the Republic of Colombia
4-20
Case-2: Guayuriba fault
PGA varies from 0.3g to 0.5g in the center of Bogotá and southern part of the Study Area, but PGA decays from 0.2g to 0.3g in the northwestern part of the Study Area due to the attenuation. PGA in most of the suburb of the Study Area falls in the range of 0.1g to 0.2g.
Case-3: Subduction
PGA is less than 0.1g in more than half of the Study Area. In the central part of Bogotá and northwestern part of the Study Area, PGA is between 0.1g and 0.2g, due to the amplification of the thick lake deposit.
C. Seismic intensity
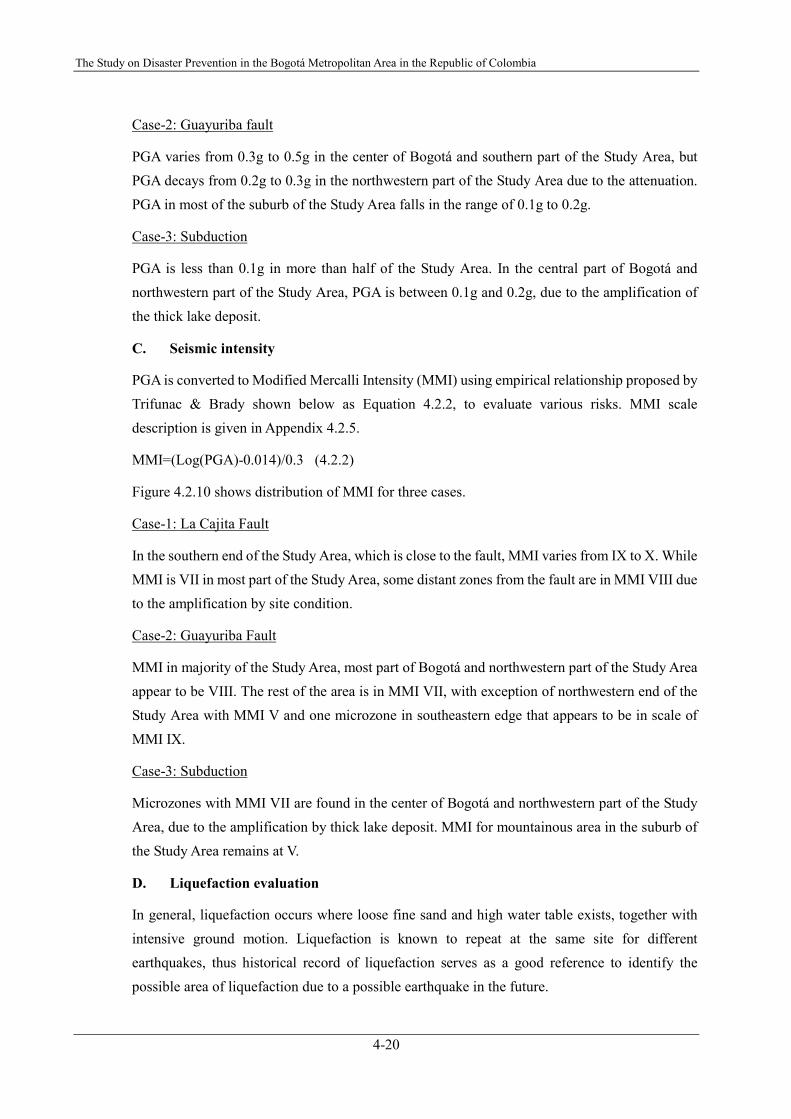
PGA is converted to Modified Mercalli Intensity (MMI) using empirical relationship proposed by Trifunac & Brady shown below as Equation 4.2.2, to evaluate various risks. MMI scale description is given in Appendix 4.2.5.
MMI=(Log(PGA)-0.014)/0.3 (4.2.2)
Figure 4.2.10 shows distribution of MMI for three cases.
Case-1: La Cajita Fault
In the southern end of the Study Area, which is close to the fault, MMI varies from IX to X. While MMI is VII in most part of the Study Area, some distant zones from the fault are in MMI VIII due to the amplification by site condition.
Case-2: Guayuriba Fault
MMI in majority of the Study Area, most part of Bogotá and northwestern part of the Study Area appear to be VIII. The rest of the area is in MMI VII, with exception of northwestern end of the Study Area with MMI V and one microzone in southeastern edge that appears to be in scale of MMI IX.
Case-3: Subduction
Microzones with MMI VII are found in the center of Bogotá and northwestern part of the Study Area, due to the amplification by thick lake deposit. MMI for mountainous area in the suburb of the Study Area remains at V.
D. Liquefaction evaluation
In general, liquefaction occurs where loose fine sand and high water table exists, together with intensive ground motion. Liquefaction is known to repeat at the same site for different earthquakes, thus historical record of liquefaction serves as a good reference to identify the possible area of liquefaction due to a possible earthquake in the future.
The Study on Disaster Prevention in the Bogotá Metropolitan Area in the Republic of Colombia
4-22
Japanese method
In Japan, liquefaction has been a subject of study in the field of earthquake engineering since the experience of the 1964 Niigata earthquake, when liquefaction caused significant damage to buildings, bridges and an oil refinery built in a newly developed area on reclaimed land which was part of a riverbed.
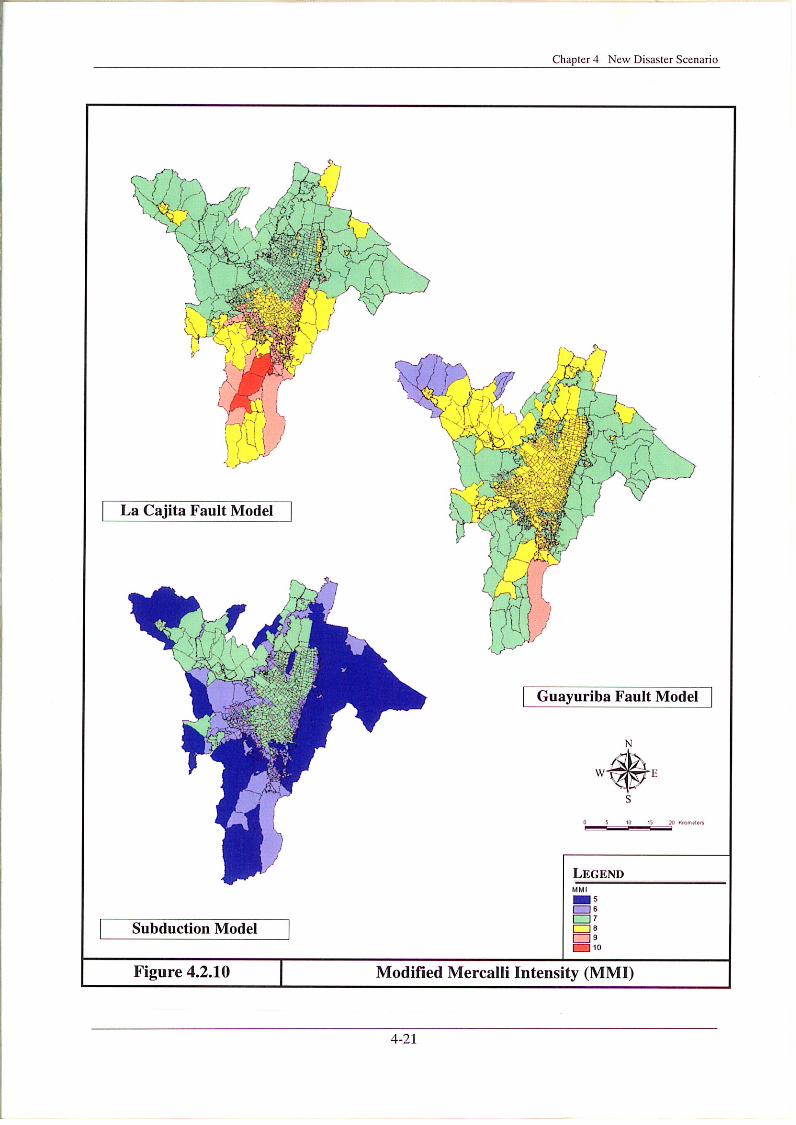
Following method is proposed as a grade-1 method by the International Society of Soil Mechanics and Geotechnical Engineering: - In terms of seismic intensity, significant liquefaction is expected to occur where ground is
Alluvium soil and MM Intensity is greater than VIII. - In terms of topography, liquefaction possibility is expected as shown in Table 4.2.6.
Table 4.2.6 Liquefaction Possibility Evaluated by Topography
Rank Topography Liquefaction possibility
A Existing river bed, Old river bed, Wet land,Reclaimed land, lowland between dune High
B Fan, Natural bank, Sand dune, Flood plain, Sea shore,other lowland Possible
C Plateau, Hill, Mountain Low Source: “Manual for zonation on seismic geotechnical hazards,” Technical Committee for Earthquake Geotechnical Engineering, TC4 ISSMGE 1998
Method Used in this Study
The area having liquefaction potential in Bogotá was mentioned in an existing study based on the description in historical documents.
In this study, new boring data in Bogotá are obtained and used to revise the liquefiable area from a geotechnical point of view. In general, the deposit in the Rio Tunjuelito contains fine sand, while the deposit along the Rio Bogotá is made up from mostly clayey material, which has less possibility of liquefaction.
However, due to the lack of sufficient quantitative data such as soil grain size destitution, standard penetration testing N-values, and water table, detailed evaluation of liquefaction in this study is not possible. Therefore, rough evaluation method is employed using existing information.
In this study, the area subjected to liquefaction evaluation is the above-mentioned revised liquefiable area and zone 5. Together with seismic intensity estimated in this study and geotechnical condition, liquefaction possibility is evaluated by the criteria as shown in Table 4.2.7.