Embed Size (px)
Citation preview

Chapter Four 1
Environmental Consequences 2

This page intentionally left blank.

Chapter 4 Environmental Consequences
Draft EIS – Colorado River Interim Guidelines for Lower Basin Shortages and Coordinated Operations for Lake Powell and Lake Mead
4-1 February 2007
4.1 Introduction 1
Chapter 4 presents the probable consequences (impacts or effects) of each of the alternatives on 2 the environmental resources described in Chapter 3. The potential effects of each action 3 alternative compared to the No Action Alternative are presented for each potentially affected 4 resource in this chapter, in the same order as described in Chapter 3. 5
The methodology and technical assumptions used to analyze the potential impacts to the 6 Colorado River system (e.g., reservoir elevations, releases, and flows) is described in Section 7 4.2. Additional methodologies and assumptions used to analyze specific resources are described 8 in the appropriate resource section. 9

Environmental Consequences Chapter 4
February 2007 4-2 Draft EIS – Colorado River Interim Guidelines for
Lower Basin Shortages and Coordinated Operations for Lake Powell and Lake Mead
This page intentionally left blank. 1

Chapter 4 Environmental Consequences
Draft EIS – Colorado River Interim Guidelines for Lower Basin Shortages and Coordinated Operations for Lake Powell and Lake Mead
4-3 February 2007
4.2 Methodology 1
Hydrologic modeling of the Colorado River system was conducted to determine the potential 2 hydrologic effects of the alternatives. The modeling provided projections of potential future 3 Colorado River system conditions (e.g., reservoir elevations, reservoir releases, river flows) for 4 comparison of those conditions under the No Action Alternative to conditions under each action 5 alternative. Due to the uncertainty with regard to future inflows into the system, multiple 6 simulations were performed in order to quantify the uncertainties of future conditions and the 7 modeling results are typically expressed in probabilistic terms. 8
The hydrologic modeling also provided the basis for the analysis of the potential effects of each 9 alternative on other environmental resources such as recreation, biology, energy, etc. The 10 potential effects to specific resource issues are identified and analyzed for each action alternative 11 and again, compared to the potential effects to that resource issue under the No Action 12 Alternative. These comparisons are typically expressed in terms of the incremental differences in 13 probabilities (or projected circumstances associated with a given probability) between the No 14 Action Alternative and the action alternatives. 15
This section provides an overview of the hydrologic modeling system. Further detail is also 16 provided in Appendix A. For some resource analyses, additional modeling using other 17 techniques was needed to analyze the potential effects to particular resource issues. In most of 18 these cases, the output from the hydrologic modeling was used as input to these other models. 19 The methodologies used for the additional modeling are described in each respective resource 20 section. 21
4.2.1 Alternatives Modeled 22 As discussed in Chapter 2, five alternatives are considered in this Draft EIS: No Action, Basin 23 States, Conservation Before Shortage, Water Supply, and Reservoir Storage. Each alternative 24 includes specific assumptions with regard to the four operational elements of the proposed 25 federal action: Shortage Guidelines, Coordinated Reservoir Operations, Storage and Delivery 26 of Conserved Water, and Interim Surplus Guidelines. Additional details with respect to the 27 modeling assumptions used to represent each alternative is presented in this section and in 28 Appendix A. 29
4.2.2 Period of Analysis 30 This Draft EIS addresses guidelines that would be in effect for the period between 2008 to 31 2026 for Lower Basin reservoir operations and the coordinated operations of Lake Powell and 32 Lake Mead. All action alternatives are assumed to revert back to the assumptions used to 33 represent the No Action Alternative beginning in 2027. Due to the potential for hydrologic 34 effects of the action alternatives beyond the 19-year interim period, the hydrologic modeling 35 for all alternatives extends through 2060. 36
4.2.3 Model Description 37 Future Colorado River system conditions under the No Action Alternative and the action 38 alternatives were simulated using the Colorado River Simulation System (CRSS). The model 39

Environmental Consequences Chapter 4
February 2007 4-4 Draft EIS – Colorado River Interim Guidelines for
Lower Basin Shortages and Coordinated Operations for Lake Powell and Lake Mead
framework used for this process is a commercial river modeling software called RiverWare™. 1 RiverWare™ is a generalized river basin modeling software package developed by the 2 University of Colorado through a cooperative process with Reclamation and the Tennessee 3 Valley Authority. CRSS was originally developed by Reclamation in the early 1970s and was 4 implemented in RiverWare™ in 1996. River operation parameters modeled and analyzed in 5 CRSS include the water entering the river system, storage in system reservoirs, releases from 6 storage, river flows, and the water demands of and deliveries to water users in the Basin States 7 and Mexico. 8
The water supply used as input to the model consisted of the historic record of natural flow in 9 the river system over the 99-year period from 1906 through 2004 from 29 individual inflow 10 points (or nodes) on the system. The future Colorado River water demands were based on 11 demand and depletion projections prepared by the Basin States. Depletions are defined as 12 diversions from the river less return flow credits, where applicable. The operation of the 13 mainstream reservoirs including Lake Powell and Lake Mead is provided as a set of operating 14 rules which describe how water is released and delivered under various hydrologic conditions. 15 Further explanation of the model and operating rules is provided in Appendix A. 16
4.2.4 Computational Procedures and Future Hydrology 17 The model was used to simulate the future operational conditions of the Colorado River 18 system on a monthly time-step for the period 2008 through 2060. Output data included 19 reservoir elevations and storages, releases from the dams, hydroelectric energy generation, 20 salinity concentration, flows at various points along the system, and diversions to and return 21 flows from various water users. The input data for the model included monthly natural 22 inflows, various physical process parameters (such as the evaporation rates for each reservoir), 23 initial reservoir conditions, and the diversion and depletion schedules for entities in the Basin 24 States and Mexico. The common and specific operating rules were also input for each 25 alternative analyzed. 26
Despite the differences in the operating rules under the No Action Alternative and each action 27 alternative, the future conditions of the Colorado River system (especially water levels at 28 Lake Mead and Lake Powell) are most sensitive to future inflows. As discussed in Section 29 3.3, observations over the period of historical record (1906 through present) show that inflow 30 into the system has been highly variable from year to year, and over decades. Although the 31 model does not project future inflows, it can be used to analyze a range of possible future 32 inflows and to quantify the probability of particular events (e.g., lake elevations levels being 33 below or above certain levels). 34
Although several methods are available for projecting the range of possible future inflows, 35 Reclamation utilized the existing historical record of natural flows to create a number of 36 different hydrologic sequences using a technique for sampling from the historical record 37 known as the Indexed Sequential Method (ISM) (USBR 1985; Ouarda et. al. 1997). These 38 sequences were used to perform a series of simulations and the output was analyzed to 39 quantify the uncertainty due to hydrologic variability for each variable of interest. 40
Chapter 4 Environmental Consequences
Draft EIS – Colorado River Interim Guidelines for Lower Basin Shortages and Coordinated Operations for Lake Powell and Lake Mead
4-5 February 2007
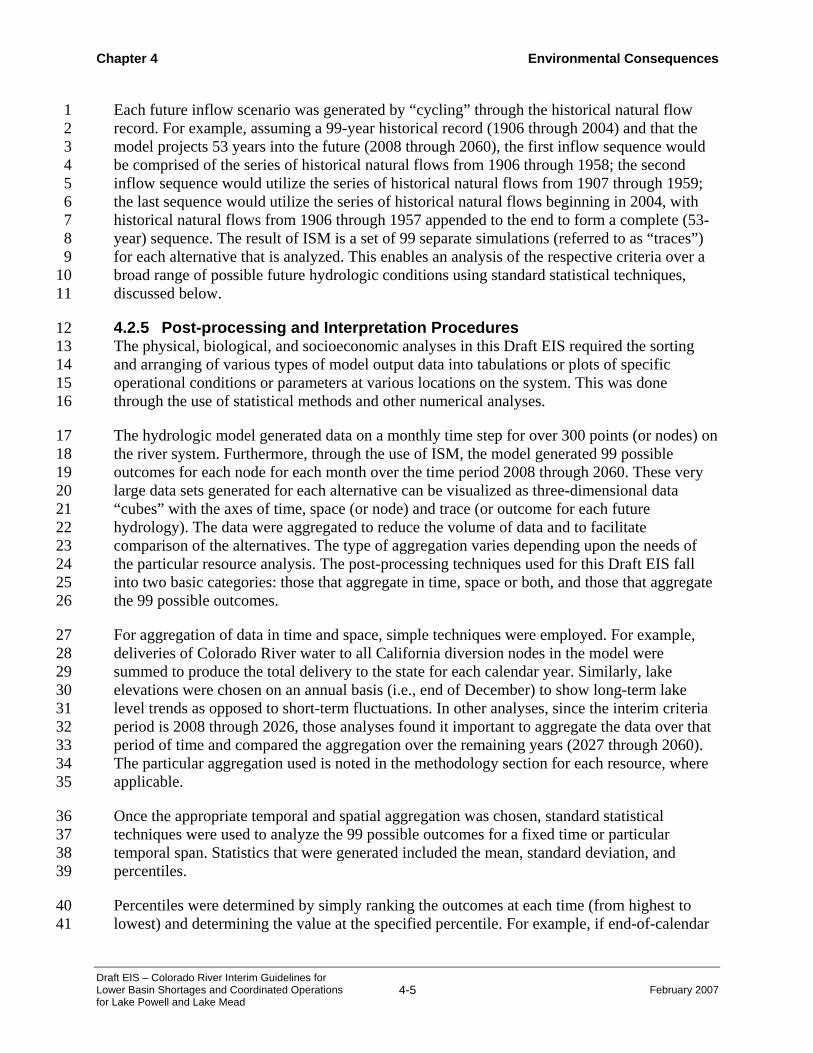
Each future inflow scenario was generated by “cycling” through the historical natural flow 1 record. For example, assuming a 99-year historical record (1906 through 2004) and that the 2 model projects 53 years into the future (2008 through 2060), the first inflow sequence would 3 be comprised of the series of historical natural flows from 1906 through 1958; the second 4 inflow sequence would utilize the series of historical natural flows from 1907 through 1959; 5 the last sequence would utilize the series of historical natural flows beginning in 2004, with 6 historical natural flows from 1906 through 1957 appended to the end to form a complete (53-7 year) sequence. The result of ISM is a set of 99 separate simulations (referred to as “traces”) 8 for each alternative that is analyzed. This enables an analysis of the respective criteria over a 9 broad range of possible future hydrologic conditions using standard statistical techniques, 10 discussed below. 11
4.2.5 Post-processing and Interpretation Procedures 12 The physical, biological, and socioeconomic analyses in this Draft EIS required the sorting 13 and arranging of various types of model output data into tabulations or plots of specific 14 operational conditions or parameters at various locations on the system. This was done 15 through the use of statistical methods and other numerical analyses. 16
The hydrologic model generated data on a monthly time step for over 300 points (or nodes) on 17 the river system. Furthermore, through the use of ISM, the model generated 99 possible 18 outcomes for each node for each month over the time period 2008 through 2060. These very 19 large data sets generated for each alternative can be visualized as three-dimensional data 20 “cubes” with the axes of time, space (or node) and trace (or outcome for each future 21 hydrology). The data were aggregated to reduce the volume of data and to facilitate 22 comparison of the alternatives. The type of aggregation varies depending upon the needs of 23 the particular resource analysis. The post-processing techniques used for this Draft EIS fall 24 into two basic categories: those that aggregate in time, space or both, and those that aggregate 25 the 99 possible outcomes. 26
For aggregation of data in time and space, simple techniques were employed. For example, 27 deliveries of Colorado River water to all California diversion nodes in the model were 28 summed to produce the total delivery to the state for each calendar year. Similarly, lake 29 elevations were chosen on an annual basis (i.e., end of December) to show long-term lake 30 level trends as opposed to short-term fluctuations. In other analyses, since the interim criteria 31 period is 2008 through 2026, those analyses found it important to aggregate the data over that 32 period of time and compared the aggregation over the remaining years (2027 through 2060). 33 The particular aggregation used is noted in the methodology section for each resource, where 34 applicable. 35
Once the appropriate temporal and spatial aggregation was chosen, standard statistical 36 techniques were used to analyze the 99 possible outcomes for a fixed time or particular 37 temporal span. Statistics that were generated included the mean, standard deviation, and 38 percentiles. 39
Percentiles were determined by simply ranking the outcomes at each time (from highest to 40 lowest) and determining the value at the specified percentile. For example, if end-of-calendar 41

Environmental Consequences Chapter 4
February 2007 4-6 Draft EIS – Colorado River Interim Guidelines for
Lower Basin Shortages and Coordinated Operations for Lake Powell and Lake Mead
year Lake Mead elevations are ranked for each year, the 50th percentile (median) outcome for 1 a given year is the elevation for which half of the values are below and half are above that 2 elevation. Similarly, the 10th percentile value is the elevation for which ten percent of the 3 values are lower and 90 percent are higher. This statistical method is used to view the results 4 of all hydrologic sequences in a compact manner yet maintains the variability at high, 5 medium, and low reservoir levels that may be lost by averaging the results of all traces. 6 Several presentations of the ranked data are then possible. For example, a graph (or table) may 7 be produced that is used to compare the 90th percentile, 50th percentile, and 10th percentile 8 outcomes from 2008 through 2060 for the No Action Alternative and the action alternatives. It 9 should be noted that a statistic such as the 10th percentile is not the result of any one 10 hydrologic trace (i.e., no historical sequence produced the 10th percentile). Such a statistic 11 provides information with regard to the probability (e.g., a 10 percent probability) of the 12 variable of interest being at or below the 10th percentile value in a specified year; however, 13 the statistic cannot be used to understand the probability of remaining at that value in 14 subsequent years. 15
4.2.6 Model Uncertainty 16 The CRSS model does not project future inflows, but rather relies on the historic record to 17 analyze a range of possible future inflows. For this reason, projections of future reservoir 18 elevations are probabilistic, based on the 99-year historic record. The historic record includes 19 periods of extreme drought and periods with above average flow, allowing analysis of the 20 proposed federal action under a wide range of future flow conditions. However, 99-year 21 record period is a relatively short time frame, and it is possible that future flows may include 22 periods of wet or dry conditions that are outside of all the possible sequences seen in the 23 historical record. Use of the historic record also cannot reflect potential future climate 24 changes. 25
Reclamation has several on-going research and development programs to investigate 26 alternative methods for generating ranges of possible future inflows on the Colorado River, 27 including stochastic hydrology methods and paleo-reconstruction methods (reconstruction of 28 historical inflows from analysis of tree-rings). A hydrologic sensitivity analysis was 29 performed using three distinct methods for generating future inflows and is presented in 30 Appendix N. 31
Model output is also sensitive to input diversion and depletion schedules. The best available 32 data for future diversions and depletions were input to CRSS. Actual future depletion 33 schedules, especially when simulating system conditions far into the future (beyond about 20 34 years from the present) may differ. 35
Finally, all models are sensitive to the quality of the data available as input information. For 36 example, water flows are based upon the data from gages which have uncertainties associated 37 with their measurements. These uncertainties limit the accuracy of any model that uses that 38 data, even though that is generally the best available information. 39

Chapter 4 Environmental Consequences
Draft EIS – Colorado River Interim Guidelines for Lower Basin Shortages and Coordinated Operations for Lake Powell and Lake Mead
4-7 February 2007
4.2.7 Modeling Assumptions Common to All Alternatives 1 In addition to the specific operating rules necessary to model each of the alternatives 2 (discussed in Chapter 2, Appendix A, and in the following section), the modeling of river 3 system operations also requires certain assumptions about various aspects of water delivery 4 and system operations that are common to all alternatives. 5
Assumptions common to all alternatives: 6
♦ All simulations were performed with a start year of 2008 and a simulation length of 7 53 years (2008 through 2060); 8
♦ Each action alternative was assumed to be in effect for the interim period which 9 extends from 2008 through 2026. After 2026, the operating rules for all action 10 alternatives revert to the rules of the No Action Alternative; 11
♦ The initial conditions for the Upper Basin and Lower Basin reservoirs reflect the 12 2007 end-of-calendar year (EOCY) elevations as projected by the August 2006 24-13 Month Study. The Lake Powell and Lake Mead starting conditions (initial elevations) 14 in the model were 3,614.80 and 1,116.53 feet msl, respectively. Initial conditions for 15 all reservoirs are detailed in Appendix A; 16
♦ Future hydrology was generated from the 99-year (1906 through 2004) historic record 17 of calculated natural flows at 29 separate inflow points in the Colorado River 18 watershed using the ISM. Ninety-nine simulations were performed for each 19 alternative; 20
♦ The current Upper Basin reservoir operating rules, with the exception of Lake Powell, 21 are identical under all alternatives. Under the action alternatives, the operation of 22 Lake Powell reflects the coordinated operations strategy of each respective alternative 23 during the Interim Period; 24
♦ Future water demands for Upper Division water users are based on depletion 25 projections prepared by the Upper Division states in coordination with the Upper 26 Colorado River Commission and Reclamation and published in the SIA Final EIS 27 (Volume II, Appendix G). These depletion schedules are provided in Appendix C to 28 this Draft EIS; 29
♦ The Lake Mead flood control procedures are always in effect; 30
♦ Except during flood control, Lake Mead is operated to meet downstream demands 31 under the water supply condition (Normal, Surplus, or Shortage condition) in effect in 32 a particular year; 33
♦ Future water demands for Lower Division water users are based on depletion 34 projections prepared by the Lower Division states and published in the SIA Final EIS 35 (Volume II, Appendix G) with some exceptions. The depletion schedules under 36

Environmental Consequences Chapter 4
February 2007 4-8 Draft EIS – Colorado River Interim Guidelines for
Lower Basin Shortages and Coordinated Operations for Lake Powell and Lake Mead
Normal conditions for IID, CVWD, and MWD are those specified in the Colorado 1 River Water Delivery Agreement and include accelerated Inadvertent Overrun 2 paybacks through 2004 and any subsequent changes in payback schedules. The 3 depletion schedules for all Arizona users were provided by the Arizona Department 4 of Water Resources for this EIS effort. These depletion schedules are provided in 5 Appendix D to this Draft EIS; 6
♦ If the Lake Mead elevation falls below 1,000 feet msl, the delivery to SNWA is 7 reduced to zero. This reflects the limitations of the SNWA intakes which are used to 8 pump water from Lake Mead; 9
♦ Lake Mohave and Lake Havasu are operated in accordance with their existing rule 10 curves; 11
♦ Water deliveries to Mexico are pursuant to the requirements of the 1944 Treaty. This 12 provides annual deliveries of 1.5 maf to Mexico and up to 1.7 maf during Lake Mead 13 flood control release conditions; 14
♦ Mexico’s principal diversion is at Morelos Diversion Dam where most of its 15 Colorado River apportionment of 1.5 maf is diverted. In practice, up to 140 kafy is 16 delivered to Mexico near the SIB. The model, however, extends to just south of the 17 NIB to include the Morelos Diversion Dam and accounts for the entire 1944 Treaty 18 delivery at that point; 19
♦ For 2008 and 2009, the model sets the delivery schedule to Mexico at the NIB to 20 1.577 mafy. The additional 77 kafy reflects the average over-deliveries to Mexico for 21 the period 1964 through 2005 (excluding years when there were flood control releases 22 on the Colorado mainstream or Gila River); 23
♦ Beginning in 2010, the proposed Drop 2 Reservoir is assumed to be in operation and 24 to conserve an average of 69 kafy, reducing the average over-delivery to Mexico from 25 77 kafy to 8 kafy; 26
♦ The bypass of return flows from the Welton-Mohawk Irrigation and Drainage District 27 to the Cienega de Santa Clara in Mexico is assumed to be 109 kafy (the historical 28 average for the period 1990 through 2005) and are not counted as part of the 1944 29 Treaty delivery; 30
♦ Except under the Conservation Before Shortage Alternative, replacement of the 31 bypassed water is not assumed to occur in the future. The United States recognizes 32 that it has an obligation to replace, as appropriate, the bypass flows and the 33 assumptions made herein, for modeling purposes; do not necessarily represent the 34 policy that Reclamation will adopt for replacement of bypass flows. The assumptions 35 made with respect to modeling the bypass flows are intended only to provide a 36 thorough and comprehensive accounting of the Lower Basin water supply. The 37
Chapter 4 Environmental Consequences
Draft EIS – Colorado River Interim Guidelines for Lower Basin Shortages and Coordinated Operations for Lake Powell and Lake Mead
4-9 February 2007
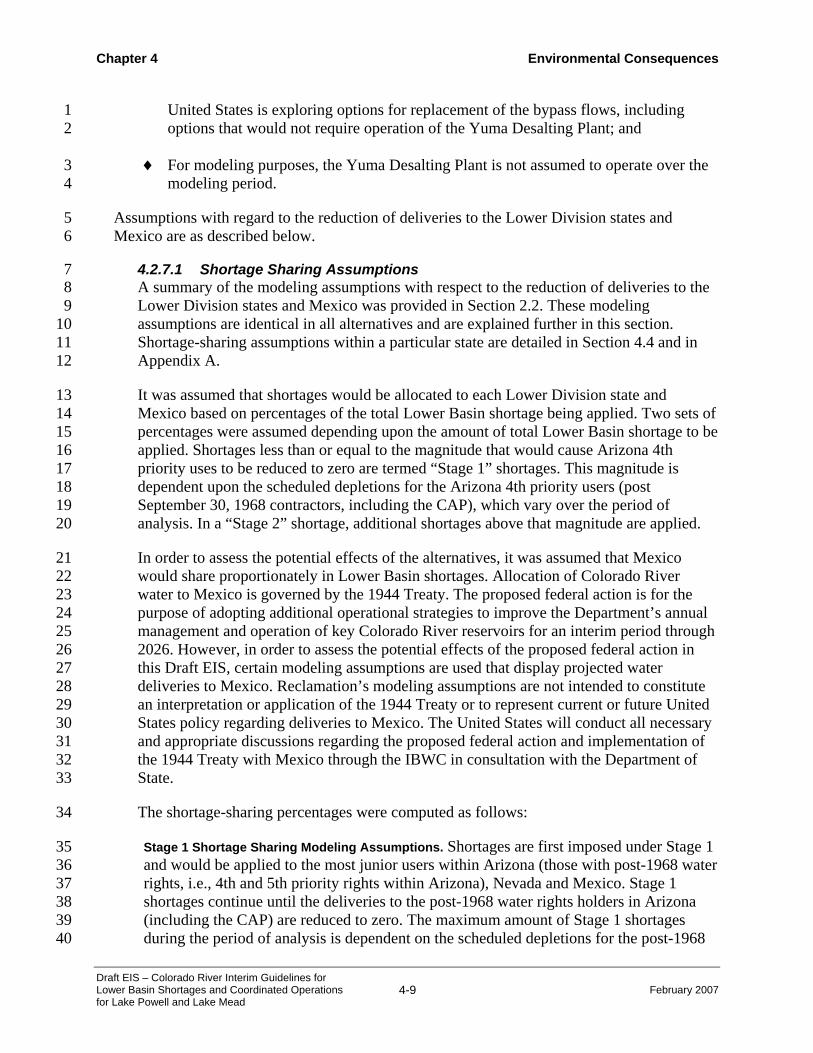
United States is exploring options for replacement of the bypass flows, including 1 options that would not require operation of the Yuma Desalting Plant; and 2
♦ For modeling purposes, the Yuma Desalting Plant is not assumed to operate over the 3 modeling period. 4
Assumptions with regard to the reduction of deliveries to the Lower Division states and 5 Mexico are as described below. 6
4.2.7.1 Shortage Sharing Assumptions 7 A summary of the modeling assumptions with respect to the reduction of deliveries to the 8 Lower Division states and Mexico was provided in Section 2.2. These modeling 9 assumptions are identical in all alternatives and are explained further in this section. 10 Shortage-sharing assumptions within a particular state are detailed in Section 4.4 and in 11 Appendix A. 12
It was assumed that shortages would be allocated to each Lower Division state and 13 Mexico based on percentages of the total Lower Basin shortage being applied. Two sets of 14 percentages were assumed depending upon the amount of total Lower Basin shortage to be 15 applied. Shortages less than or equal to the magnitude that would cause Arizona 4th 16 priority uses to be reduced to zero are termed “Stage 1” shortages. This magnitude is 17 dependent upon the scheduled depletions for the Arizona 4th priority users (post 18 September 30, 1968 contractors, including the CAP), which vary over the period of 19 analysis. In a “Stage 2” shortage, additional shortages above that magnitude are applied. 20
In order to assess the potential effects of the alternatives, it was assumed that Mexico 21 would share proportionately in Lower Basin shortages. Allocation of Colorado River 22 water to Mexico is governed by the 1944 Treaty. The proposed federal action is for the 23 purpose of adopting additional operational strategies to improve the Department’s annual 24 management and operation of key Colorado River reservoirs for an interim period through 25 2026. However, in order to assess the potential effects of the proposed federal action in 26 this Draft EIS, certain modeling assumptions are used that display projected water 27 deliveries to Mexico. Reclamation’s modeling assumptions are not intended to constitute 28 an interpretation or application of the 1944 Treaty or to represent current or future United 29 States policy regarding deliveries to Mexico. The United States will conduct all necessary 30 and appropriate discussions regarding the proposed federal action and implementation of 31 the 1944 Treaty with Mexico through the IBWC in consultation with the Department of 32 State. 33
The shortage-sharing percentages were computed as follows: 34
Stage 1 Shortage Sharing Modeling Assumptions. Shortages are first imposed under Stage 1 35 and would be applied to the most junior users within Arizona (those with post-1968 water 36 rights, i.e., 4th and 5th priority rights within Arizona), Nevada and Mexico. Stage 1 37 shortages continue until the deliveries to the post-1968 water rights holders in Arizona 38 (including the CAP) are reduced to zero. The maximum amount of Stage 1 shortages 39 during the period of analysis is dependent on the scheduled depletions for the post-1968 40
Environmental Consequences Chapter 4
February 2007 4-10 Draft EIS – Colorado River Interim Guidelines for
Lower Basin Shortages and Coordinated Operations for Lake Powell and Lake Mead
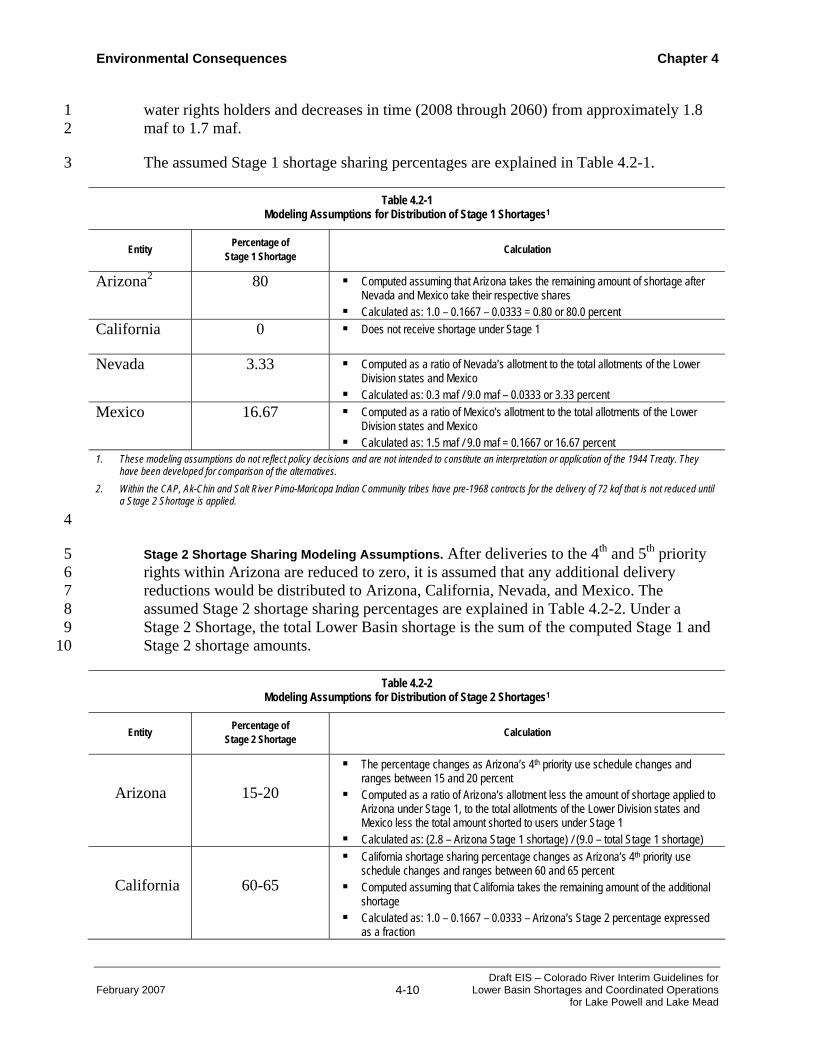
water rights holders and decreases in time (2008 through 2060) from approximately 1.8 1 maf to 1.7 maf. 2
The assumed Stage 1 shortage sharing percentages are explained in Table 4.2-1. 3
Table 4.2-1 Modeling Assumptions for Distribution of Stage 1 Shortages1
Entity Percentage of Stage 1 Shortage Calculation
Arizona2 80 Computed assuming that Arizona takes the remaining amount of shortage after Nevada and Mexico take their respective shares
Calculated as: 1.0 – 0.1667 – 0.0333 = 0.80 or 80.0 percent California 0 Does not receive shortage under Stage 1
Nevada 3.33 Computed as a ratio of Nevada’s allotment to the total allotments of the Lower Division states and Mexico
Calculated as: 0.3 maf / 9.0 maf – 0.0333 or 3.33 percent Mexico 16.67 Computed as a ratio of Mexico’s allotment to the total allotments of the Lower
Division states and Mexico Calculated as: 1.5 maf / 9.0 maf = 0.1667 or 16.67 percent
1. These modeling assumptions do not reflect policy decisions and are not intended to constitute an interpretation or application of the 1944 Treaty. They have been developed for comparison of the alternatives.
2. Within the CAP, Ak-Chin and Salt River Pima-Maricopa Indian Community tribes have pre-1968 contracts for the delivery of 72 kaf that is not reduced until a Stage 2 Shortage is applied.
4
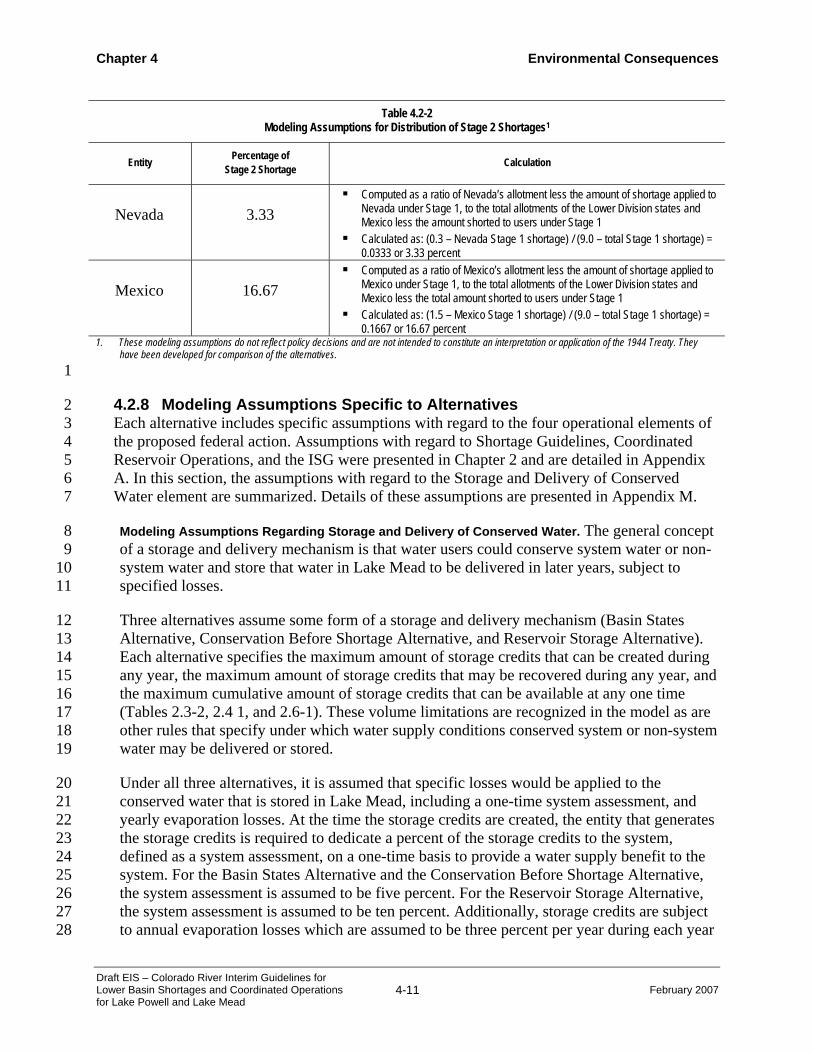
Stage 2 Shortage Sharing Modeling Assumptions. After deliveries to the 4th and 5th priority 5 rights within Arizona are reduced to zero, it is assumed that any additional delivery 6 reductions would be distributed to Arizona, California, Nevada, and Mexico. The 7 assumed Stage 2 shortage sharing percentages are explained in Table 4.2-2. Under a 8 Stage 2 Shortage, the total Lower Basin shortage is the sum of the computed Stage 1 and 9 Stage 2 shortage amounts. 10
Table 4.2-2 Modeling Assumptions for Distribution of Stage 2 Shortages1
Entity Percentage of Stage 2 Shortage Calculation
Arizona 15-20
The percentage changes as Arizona’s 4th priority use schedule changes and ranges between 15 and 20 percent
Computed as a ratio of Arizona’s allotment less the amount of shortage applied to Arizona under Stage 1, to the total allotments of the Lower Division states and Mexico less the total amount shorted to users under Stage 1
Calculated as: (2.8 – Arizona Stage 1 shortage) / (9.0 – total Stage 1 shortage)
California 60-65
California shortage sharing percentage changes as Arizona’s 4th priority use schedule changes and ranges between 60 and 65 percent
Computed assuming that California takes the remaining amount of the additional shortage
Calculated as: 1.0 – 0.1667 – 0.0333 – Arizona’s Stage 2 percentage expressed as a fraction
Chapter 4 Environmental Consequences
Draft EIS – Colorado River Interim Guidelines for Lower Basin Shortages and Coordinated Operations for Lake Powell and Lake Mead
4-11 February 2007
Table 4.2-2 Modeling Assumptions for Distribution of Stage 2 Shortages1
Entity Percentage of Stage 2 Shortage Calculation
Nevada 3.33 Computed as a ratio of Nevada’s allotment less the amount of shortage applied to
Nevada under Stage 1, to the total allotments of the Lower Division states and Mexico less the amount shorted to users under Stage 1
Calculated as: (0.3 – Nevada Stage 1 shortage) / (9.0 – total Stage 1 shortage) = 0.0333 or 3.33 percent
Mexico 16.67 Computed as a ratio of Mexico’s allotment less the amount of shortage applied to
Mexico under Stage 1, to the total allotments of the Lower Division states and Mexico less the total amount shorted to users under Stage 1
Calculated as: (1.5 – Mexico Stage 1 shortage) / (9.0 – total Stage 1 shortage) = 0.1667 or 16.67 percent
1. These modeling assumptions do not reflect policy decisions and are not intended to constitute an interpretation or application of the 1944 Treaty. They have been developed for comparison of the alternatives.
1
4.2.8 Modeling Assumptions Specific to Alternatives 2 Each alternative includes specific assumptions with regard to the four operational elements of 3 the proposed federal action. Assumptions with regard to Shortage Guidelines, Coordinated 4 Reservoir Operations, and the ISG were presented in Chapter 2 and are detailed in Appendix 5 A. In this section, the assumptions with regard to the Storage and Delivery of Conserved 6 Water element are summarized. Details of these assumptions are presented in Appendix M. 7
Modeling Assumptions Regarding Storage and Delivery of Conserved Water. The general concept 8 of a storage and delivery mechanism is that water users could conserve system water or non-9 system water and store that water in Lake Mead to be delivered in later years, subject to 10 specified losses. 11
Three alternatives assume some form of a storage and delivery mechanism (Basin States 12 Alternative, Conservation Before Shortage Alternative, and Reservoir Storage Alternative). 13 Each alternative specifies the maximum amount of storage credits that can be created during 14 any year, the maximum amount of storage credits that may be recovered during any year, and 15 the maximum cumulative amount of storage credits that can be available at any one time 16 (Tables 2.3-2, 2.4 1, and 2.6-1). These volume limitations are recognized in the model as are 17 other rules that specify under which water supply conditions conserved system or non-system 18 water may be delivered or stored. 19
Under all three alternatives, it is assumed that specific losses would be applied to the 20 conserved water that is stored in Lake Mead, including a one-time system assessment, and 21 yearly evaporation losses. At the time the storage credits are created, the entity that generates 22 the storage credits is required to dedicate a percent of the storage credits to the system, 23 defined as a system assessment, on a one-time basis to provide a water supply benefit to the 24 system. For the Basin States Alternative and the Conservation Before Shortage Alternative, 25 the system assessment is assumed to be five percent. For the Reservoir Storage Alternative, 26 the system assessment is assumed to be ten percent. Additionally, storage credits are subject 27 to annual evaporation losses which are assumed to be three percent per year during each year 28

Environmental Consequences Chapter 4
February 2007 4-12 Draft EIS – Colorado River Interim Guidelines for
Lower Basin Shortages and Coordinated Operations for Lake Powell and Lake Mead
the conserved water remains in storage in Lake Mead. The exception to this is during 1 Shortage conditions, when no evaporation loss is applied. 2
At this time, it is unknown which entities might participate in a Lake Mead mechanism that 3 allows the storage and delivery of conserved system and non-system water. Furthermore, the 4 timing and magnitude of the storage and delivery of conserved water is unknown. However, 5 modeling assumptions with respect to the entities that might participate and their respective 6 level of participation were needed to enable the evaluation of the mechanism and its potential 7 effects on environmental resources, particularly to reservoir storage and river flows below 8 Lake Mead. 9
Table 4.2-3 summarizes the modeling assumptions with regard to the entities that were 10 assumed to participate under each alternative, the activities undertaken to generate storage 11 credits, and the water supply conditions under which storage and delivery of storage credits 12 could occur. Appendix M further describes these and other key modeling assumptions. The 13 proposed federal action is for the purpose of adopting additional operational strategies to 14 improve the Department’s annual management and operation of key Colorado River 15 reservoirs. However, in order to assess the potential effects of the proposed federal action in 16 this Draft EIS, certain modeling assumptions are used that display projected water deliveries 17 to Mexico. Reclamation’s modeling assumptions are not intended to constitute an 18 interpretation or application of the 1944 Treaty or to represent current or future United States 19 policy regarding deliveries to Mexico. The United States will conduct all necessary and 20 appropriate discussions regarding the proposed federal action and implementation of the 21 1944 Treaty with Mexico through the IBWC in consultation with the Department of State 1. 22
Under the Conservation Before Shortage Alternative, extraordinary conservation is assumed 23 to occur during voluntary shortage conditions but not during involuntary shortage conditions. 24
1 Notwithstanding the lack of an existing mechanism to implement such modeling assumptions, Reclamation utilized these assumptions for a number of reasons, including the following: (1) a larger volume of potential storage in Lake Mead is identified and the associated impacts are thereby analyzed; (2) the maximum potential changes to river flows below Hoover Dam are identified and the associated impacts analyzed; (3) the assignment of water conservation amounts to entities in the Lower Basin states in excess of amounts currently requested by each state is avoided; and (4) a program of potential future cooperation between the United States and Mexico is identified.

Chapter 4 Environmental Consequences
Draft EIS – Colorado River Interim Guidelines for Lower Basin Shortages and Coordinated Operations for Lake Powell and Lake Mead
4-13 February 2007
Table 4.2-3 Modeling Assumptions for Storage and Delivery of Conserved System and Non-System Water
BS, CBS & RS 1 CBS & RS CBS RS California Arizona Nevada Mexico Federal Federal
Water Supply Condition Extraordinary Conservation
Extraordinary Conservation
Tributary Conservation Groundwater Desalinization
Drop 2 Reservoir 4
Extraordinary Conservation
Extraordinary Conservation
Extraordinary Conservation
Store No No No No No No No No No Flood Control Surplus
Deliver No No No No No No No No No Store No No Yes No Yes Yes Yes Yes Yes
Quantified (70R) Surplus Deliver No No No No Yes Yes Yes Yes Yes Store No No Yes No Yes Yes Yes Yes Yes
Full Domestic Surplus Deliver No No Yes No Yes Yes Yes Yes Yes Store Yes Yes Yes Yes Yes Yes Yes Yes Yes
Normal Deliver Yes yes Yes Yes Yes Yes Yes Yes Yes Store No No Yes Yes Yes No No No 5 Yes Shortage (involuntary and
voluntary) Deliver No No Yes Yes Yes No No No Yes System Assessment Yes Yes Yes Yes Yes No Yes Yes Yes Period of Activity 2006-2026 2017-2026 2009-2060 2009-2060 2020-2060 Temporary 2008-2026 2008-2026 2008-2026 Notes: 1. BS = Basin States Alternative, CBS = Conservation Before Shortage Alternative, RS = Reservoir Storage Alternative 2. yes = activity assumed to occur 3. no = activity assumed to not occur 4. Beginning in 2012, Nevada is assumed to receive 40 kafy of the water conserved by the Drop 2 Reservoir during Normal and Surplus years until a total of 300
kaf has been credited to Nevada. Thereafter, water conserved by the Drop 2 Reservoir is assumed to be system water. 5. Under the Conservation Before Shortage Alternative, extraordinary conservation is assumed to be undertaken by the federal government during voluntary
shortage conditions but not during involuntary shortage conditions 6. These modeling assumptions do not reflect policy decisions and are not intended to constitute an interpretation or application of the 1944 Treaty. They have
been developed for comparison of the alternatives..
1
2

Environmental Consequences Chapter 4
February 2007 4-14 Draft EIS – Colorado River Interim Guidelines for
Lower Basin Shortages and Coordinated Operations for Lake Powell and Lake Mead
This page intentionally left blank. 1 2
Chapter 4 Environmental Consequences
Draft EIS – Colorado River Interim Guidelines for Lower Basin Shortages and Coordinated Operations for Lake Powell and Lake Mead
4-15 February 2007
4.3 Hydrologic Resources 1
This section identifies the potential effects on hydrologic resources that may occur as a result of 2 implementing the No Action Alternative and the action alternatives. 3
4.3.1 Methodology 4 The methodology used to analyze the potential impacts of the alternatives to reservoir 5 storage, reservoir releases, and the corresponding changes in river flows downstream of the 6 reservoirs is described in Section 4.2. 7
As noted in Section 4.2, the CRSS model is a monthly time-step model and output for 8 simulated water system conditions, such as reservoir elevations or releases, can be provided 9 on monthly and annual bases. The data and output used in the impact analysis may vary 10 depending on the specific issue being addressed. An example of the different months 11 considered in the analyses follows: 12
Lake Powell 13
♦ March: representative of months (or period) with seasonal low Lake Powell 14 elevations; 15
♦ July: representative of months (or period) with seasonal high Lake Powell 16 concentration of visitors; and 17
♦ September: month representing End-of-Water Year, used for water accounting and 18 reporting in Upper Basin. 19
Lake Mead 20
♦ July: representative of months (or period) with seasonal low Lake Mead elevations; 21 and 22
♦ December: month representing End-of-Calendar Year, used for water accounting and 23 reporting in Lower Basin. 24
The specific data and output used in the different resource analyses are presented in this 25 chapter. 26
4.3.1.1 Methodology Used To Estimate a Range of Daily Glen Canyon Dam 27 Releases 28
The observed CRSS model output for six annual Lake Powell release volumes were used 29 to estimate the monthly volumes that would be seen under water year release volumes 30 that were less than, equal to, and greater than 8.23 maf. These annual release volumes 31 consisted of 7.00, 7.48, 7.80, 8.23, 9.00, and 9.50 mafy, corresponding to the Glen 32 Canyon Dam release volumes observed under the modeled alternatives. For each month 33 corresponding to each one of these annual flow volumes, the average, maximum, and 34
Environmental Consequences Chapter 4
February 2007 4-16 Draft EIS – Colorado River Interim Guidelines for
Lower Basin Shortages and Coordinated Operations for Lake Powell and Lake Mead
minimum daily flow volumes were then calculated using the allowable daily fluctuation 1 parameters specified in the 1996 Glen Canyon ROD. It is recognized that monthly and 2 daily flow patterns observed in the different release years could potentially deviate 3 somewhat from the flow values and patterns calculated using this approach although they 4 would most likely be very close to the calculated value. It is also noted that the release 5 patterns for the 7.0 maf release are not as consistent because the monthly volumes would 6 be affected by balancing of Lake Powell and Lake Mead storage. When balancing takes 7 place, monthly release volumes shift as forecasted inflow shifts, resulting in more than 8 one possible pattern for the 7.0 maf release years. 9
4.3.1.2 Methodology Used To Estimate the Effect on Groundwater 10 The annual median elevation of the water surface in the Colorado River has been used as 11 an indicator of groundwater elevations adjacent to the Colorado River within the 12 potentially affected river reaches. This is due to the slow movement of groundwater and 13 the time required for the decline in the groundwater table to stabilize at a decline equal to 14 that of the river (LCR MSCP BA, Appendix J and Appendix K). The methodology used 15 to analyze the potential effects to groundwater followed the methodology established in 16 the LCR MSCP analysis. 17
4.3.2 Lake Powell and Glen Canyon Dam 18 As noted in Section 3.3, future elevations of Lake Powell are expected to be within the range 19 of historic water levels. However, each action alternative may alter the probability (when 20 compared to the No Action Alternative) that the reservoir may be at a given elevation in the 21 future. 22
Under the No Action Alternative, the elevation of Lake Powell is projected to fluctuate 23 between full and lower levels during the period of analysis (2008 through 2060). Figure 4.3-1 24 illustrates the range of water levels by three lines, labeled 90th percentile, 50th percentile and 25 10th percentile. The 50th percentile line shows the modeled median elevation for each future 26 year. The median elevation gradually increases from about 3,640 feet msl to about 3,660 feet 27 msl in the year 2060. The 10th percentile line shows that the elevation would gradually 28 decline from about 3,610 feet msl to about 3,560 feet msl. 29
It should be noted that the Lake Powell elevations depicted in Figures 4.3-1 and 4.3-2 are for 30 modeled lake water levels at the end of July. The Lake Powell water level generally reaches 31 its seasonal high in July whereas the seasonal lows generally occur in March. 32
Three distinct traces were added to Figure 4.3-1 to illustrate what was actually simulated 33 under the various traces and respective hydrologic sequences and to highlight that the 90th, 34 50th, and 10th percentile lines do not represent actual traces, but rather the ranking of each 35 year’s data from the 99 traces for the conditions modeled. The traces also illustrate the 36 variability among the different traces and that the reservoir levels could temporarily decline 37 below the 10th percentile line. Trace 1 represents the hydrologic sequence that begins in year 38 1906. Trace 21 represents the hydrologic sequence that begins in year 1926. Trace 48 39 represents the hydrologic sequence that begins in year 1953. 40

Chapter 4 Environmental Consequences
Draft EIS – Colorado River Interim Guidelines for Lower Basin Shortages and Coordinated Operations for Lake Powell and Lake Mead
4-17 February 2007
1
In Figure 4.3-1, the 90th and 10th percentile lines bracket the range where 80 percent of the 2 water levels simulated for the No Action Alternative occurred. The highs and lows shown on 3 the three traces would likely be temporary conditions. The reservoir level would tend to 4 fluctuate in the range through multi-year periods of above-average and below average 5 inflows. Neither the timing of water level variations, nor the length of time the water level 6 would remain high or low can be predicted. These events would depend on the future 7 variation in basin runoff conditions. 8
Figure 4.3-2 presents a comparison of the 90th, 50th, and 10th percentile values obtained for 9 the No Action Alternative to those of the action alternatives. This figure is best used for 10 comparing the relative differences in the general lake level trends that result from the 11 simulation of the different alternatives. 12
Figure 4.3-1 Lake Powell End-of-July Elevations Under the No Action Alternative
90th, 50th and 10th Percentile Values
3,500
3,525
3,550
3,575
3,600
3,625
3,650
3,675
3,700
2005 2010 2015 2020 2025 2030 2035 2040 2045 2050 2055 2060Year
Wat
er S
urfa
ce E
leva
tion
(feet
msl
)
10th Percentile
50th Percentile
90th Percentile
Trace 1
Trace 48
Trace 21

Environmental Consequences Chapter 4
February 2007 4-18 Draft EIS – Colorado River Interim Guidelines for
Lower Basin Shortages and Coordinated Operations for Lake Powell and Lake Mead
1
As illustrated in Figure 4.3-2, the 90th percentile results were nearly identical for all of the 2 alternatives. For the 50th and the 10th percentile results, the Reservoir Storage Alternative had 3 the highest Lake Powell water levels and the Water Supply Alternative had the lowest water 4 levels. The water levels under the Basin States Alternative and the Conservation Before 5 Shortage Alternative were similar and were generally lower than those under the No Action 6 Alternative. 7
Table 4.3-1 provides a summary of the data illustrated in Figure 4.3-2, which is the 90th 8 percentile, median (50th percentile) and 10th percentile values of the alternatives compared to 9 those of the No Action Alternative. The values presented in this table include those for years 10 2026 and 2060 only. Results for the 90th percentile show that Lake Powell elevations under 11 the action alternatives were almost the same as those under the No Action Alternative. For 12 the 50th percentile, the water levels under the Water Supply, Basin States, and Conservation 13 Before Shortage Alternatives were lower than those under the No Action Alternative during 14 2026, but were almost the same by 2060. The 10th percentile trend was very similar to the 15 50th percentile trend. 16
Figure 4.3-2 Lake Powell End-of-July Elevations
Comparison of Action Alternatives to No Action Alternative 90th, 50th, and 10th Percentile Values
3,500
3,525
3,550
3,575
3,600
3,625
3,650
3,675
3,700
2005 2010 2015 2020 2025 2030 2035 2040 2045 2050 2055 2060Year
Wat
er S
urfa
ce E
leva
tion
(feet
msl
) No ActionBasin StatesConservation Before ShortageWater SupplyReservoir Storage
10th Percentile
50th Percentile
90th Percentile

Chapter 4 Environmental Consequences
Draft EIS – Colorado River Interim Guidelines for Lower Basin Shortages and Coordinated Operations for Lake Powell and Lake Mead
4-19 February 2007
Table 4.3-1 Lake Powell End-of-July Elevations (feet msl)
Comparison of Action Alternatives to No Action Alternative 90th, 50th, and 10th Percentile Values
Year 2026 Year 2060
Alternative 90th
Percentile 50th
Percentile 10th
Percentile 90th
Percentile 50th
Percentile 10th
Percentile No Action 3,697.90 3,658.75 3,579.43 3,699.27 3,656.99 3,558.63 Basin States 3,697.71 3,648.61 3,572.63 3,699.27 3,656.99 3,558.63 Conservation Before Shortage 3,697.74 3,649.20 3,573.50 3,699.27 3,656.99 3,558.63 Water Supply 3,697.64 3,631.02 3,527.55 3,699.27 3,654.00 3,558.63 Reservoir Storage 3,698.85 3,664.17 3,600.29 3,699.27 3,656.99 3,558.63
1
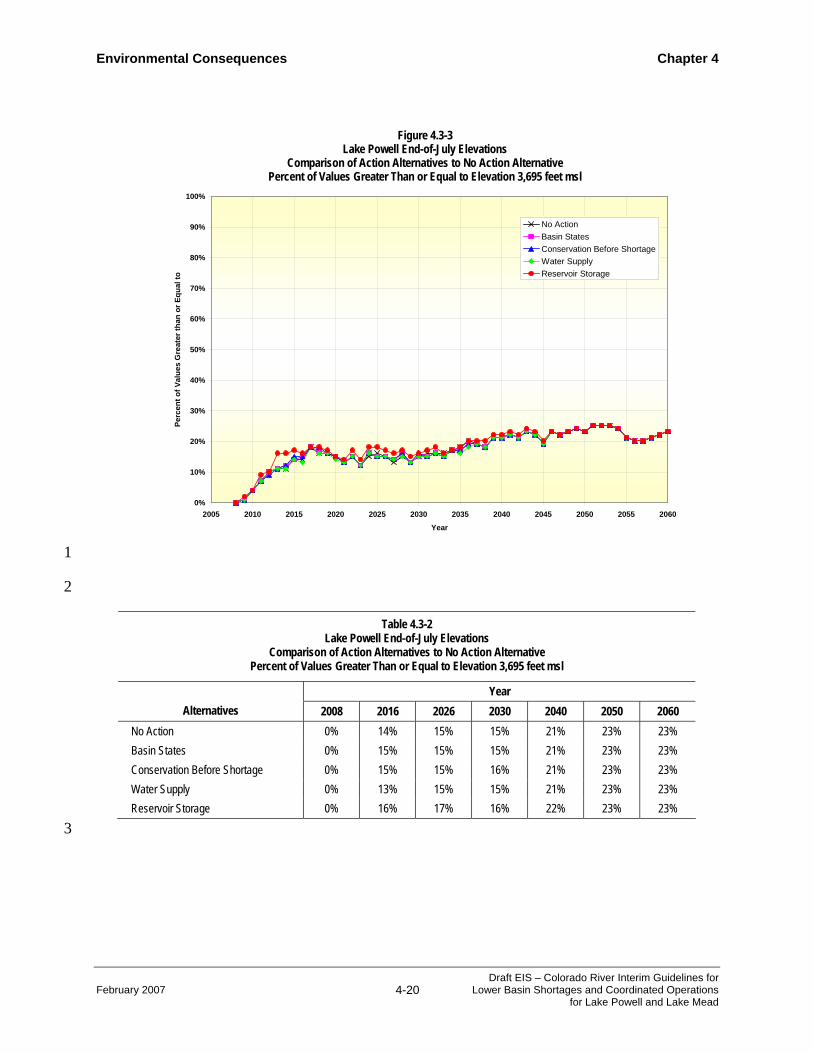
When the Lake Powell water level is at or exceeds 3,695 feet msl, the reservoir is considered 2 to be essentially full. Figure 4.3-3 shows the frequency that future Lake Powell End-of-July 3 elevations would exceed elevation 3,695 feet msl under the No Action Alternative and the 4 action alternatives. This type of figure is best used to compare the likelihood that the Lake 5 Powell elevations would be at or above the noted elevation (3,695 feet msl in this example) 6 under an action alternative as compared to the No Action Alternative. Figure 4.3-3 illustrates 7 that the percent of values that were above elevation 3,695 feet msl under the action 8 alternatives were similar to the No Action Alternative throughout the period of analysis. The 9 exception to this is the Reservoir Storage Alternative which provides slightly higher 10 exceedence values than the No Action Alternative between years 2010 through 2033. This 11 means that the Lake Powell elevations would generally tend to be higher under the Reservoir 12 Storage Alternative, as compared to the No Action Alternative. 13
As summarized in Table 4.3-2, the exceedence values under the Basin States, Conservation 14 Before Shortage, and Water Supply Alternatives were essentially the same as those observed 15 under the No Action Alternative in most years. The exceedence values under the Reservoir 16 Storage Alternative were slightly higher than those under the No Action Alternative. 17
Environmental Consequences Chapter 4
February 2007 4-20 Draft EIS – Colorado River Interim Guidelines for
Lower Basin Shortages and Coordinated Operations for Lake Powell and Lake Mead
1
2
Table 4.3-2 Lake Powell End-of-July Elevations
Comparison of Action Alternatives to No Action Alternative Percent of Values Greater Than or Equal to Elevation 3,695 feet msl
Year Alternatives 2008 2016 2026 2030 2040 2050 2060
No Action 0% 14% 15% 15% 21% 23% 23% Basin States 0% 15% 15% 15% 21% 23% 23% Conservation Before Shortage 0% 15% 15% 16% 21% 23% 23% Water Supply 0% 13% 15% 15% 21% 23% 23% Reservoir Storage 0% 16% 17% 16% 22% 23% 23%
3
Figure 4.3-3 Lake Powell End-of-July Elevations
Comparison of Action Alternatives to No Action Alternative Percent of Values Greater Than or Equal to Elevation 3,695 feet msl
0%
10%
20%
30%
40%
50%
60%
70%
80%
90%
100%
2005 2010 2015 2020 2025 2030 2035 2040 2045 2050 2055 2060
Year
Perc
ent o
f Val
ues
Gre
ater
than
or E
qual
to
No ActionBasin StatesConservation Before ShortageWater SupplyReservoir Storage
Chapter 4 Environmental Consequences
Draft EIS – Colorado River Interim Guidelines for Lower Basin Shortages and Coordinated Operations for Lake Powell and Lake Mead
4-21 February 2007
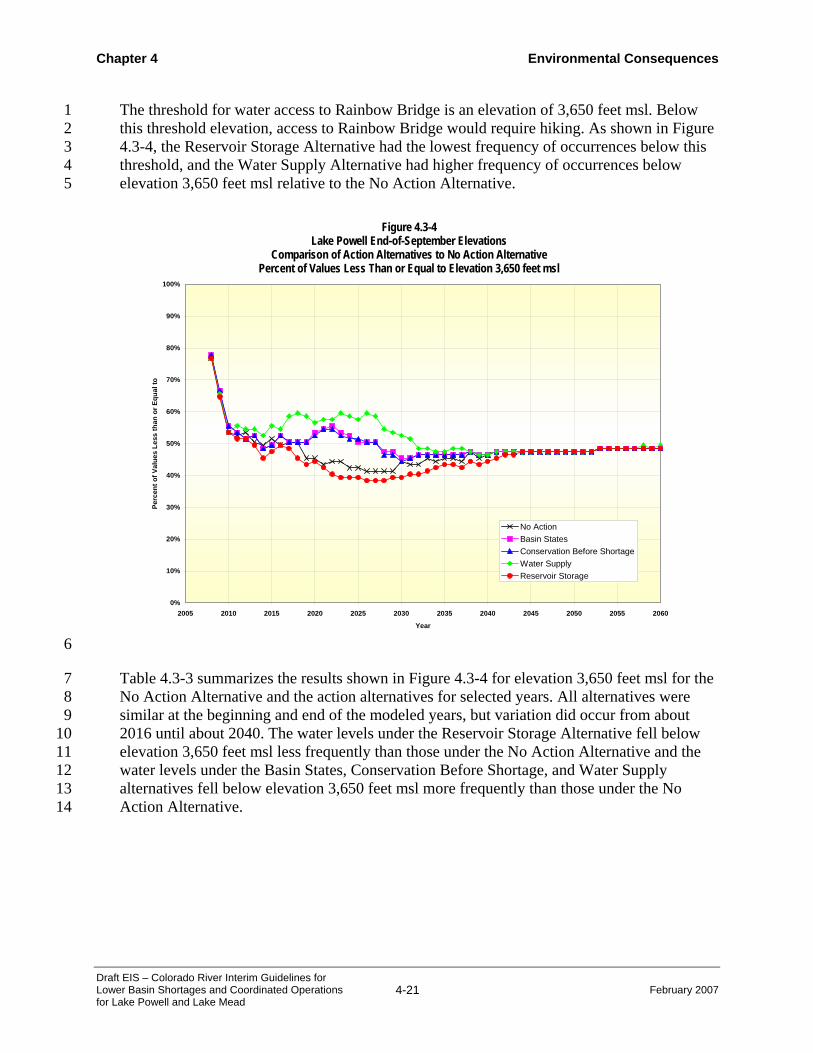
The threshold for water access to Rainbow Bridge is an elevation of 3,650 feet msl. Below 1 this threshold elevation, access to Rainbow Bridge would require hiking. As shown in Figure 2 4.3-4, the Reservoir Storage Alternative had the lowest frequency of occurrences below this 3 threshold, and the Water Supply Alternative had higher frequency of occurrences below 4 elevation 3,650 feet msl relative to the No Action Alternative. 5
6
Table 4.3-3 summarizes the results shown in Figure 4.3-4 for elevation 3,650 feet msl for the 7 No Action Alternative and the action alternatives for selected years. All alternatives were 8 similar at the beginning and end of the modeled years, but variation did occur from about 9 2016 until about 2040. The water levels under the Reservoir Storage Alternative fell below 10 elevation 3,650 feet msl less frequently than those under the No Action Alternative and the 11 water levels under the Basin States, Conservation Before Shortage, and Water Supply 12 alternatives fell below elevation 3,650 feet msl more frequently than those under the No 13 Action Alternative. 14
Figure 4.3-4 Lake Powell End-of-September Elevations
Comparison of Action Alternatives to No Action Alternative Percent of Values Less Than or Equal to Elevation 3,650 feet msl
0%
10%
20%
30%
40%
50%
60%
70%
80%
90%
100%
2005 2010 2015 2020 2025 2030 2035 2040 2045 2050 2055 2060
Year
Perc
ent o
f Val
ues
Less
than
or E
qual
to
No ActionBasin StatesConservation Before ShortageWater SupplyReservoir Storage

Environmental Consequences Chapter 4
February 2007 4-22 Draft EIS – Colorado River Interim Guidelines for
Lower Basin Shortages and Coordinated Operations for Lake Powell and Lake Mead
Table 4.3-3 Lake Powell End-of-September Elevations
Comparison of Action Alternatives to No Action Alternative Percent of Values Less Than or Equal to Elevation 3,650 feet msl
Year Alternatives 2008 2016 2026 2030 2040 2050 2060
No Action 77% 49% 41% 44% 46% 47% 48% Basin States 78% 53% 51% 45% 46% 47% 48% Conservation Before Shortage 78% 53% 51% 44% 46% 47% 48% Water Supply 77% 55% 60% 53% 46% 47% 49% Reservoir Storage 77% 49% 38% 39% 44% 47% 48%
1
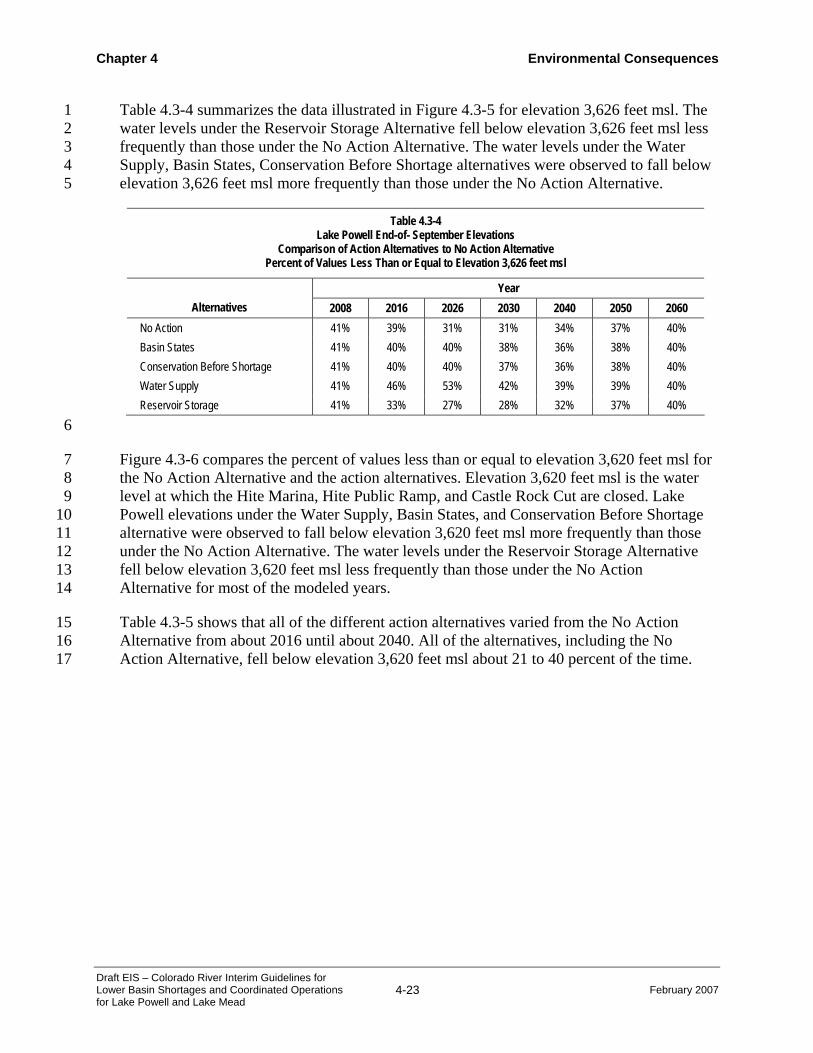
Figure 4.3-5 illustrates the results for elevations equal to or less than 3,626 feet msl. 2 An elevation of 3,626 feet msl is the level at which there is a navigational detour at the 3 Wahweap Marina and at Gregory Butte. As is shown on this figure, the Reservoir Storage 4 Alternative had less impact on this threshold than the No Action Alternative. The elevations 5 under the Water Supply, Basin States, and Conservation Before Shortage alternatives fell 6 below elevation 3,626 feet msl more frequently than those under the No Action Alternative. 7 All alternatives were similar by about 2053. 8
Figure 4.3-5 Lake Powell End-of-September Elevations
Comparison of Action Alternatives to No Action Alternative Percent of Values Less Than or Equal to Elevation 3,626 feet msl
0%
10%
20%
30%
40%
50%
60%
70%
80%
90%
100%
2005 2010 2015 2020 2025 2030 2035 2040 2045 2050 2055 2060
Year
Perc
ent o
f Val
ues
Less
than
or E
qual
to
No ActionBasin StatesConservation Before ShortageWater SupplyReservoir Storage
Chapter 4 Environmental Consequences
Draft EIS – Colorado River Interim Guidelines for Lower Basin Shortages and Coordinated Operations for Lake Powell and Lake Mead
4-23 February 2007
Table 4.3-4 summarizes the data illustrated in Figure 4.3-5 for elevation 3,626 feet msl. The 1 water levels under the Reservoir Storage Alternative fell below elevation 3,626 feet msl less 2 frequently than those under the No Action Alternative. The water levels under the Water 3 Supply, Basin States, Conservation Before Shortage alternatives were observed to fall below 4 elevation 3,626 feet msl more frequently than those under the No Action Alternative. 5
Table 4.3-4 Lake Powell End-of- September Elevations
Comparison of Action Alternatives to No Action Alternative Percent of Values Less Than or Equal to Elevation 3,626 feet msl
Year Alternatives 2008 2016 2026 2030 2040 2050 2060
No Action 41% 39% 31% 31% 34% 37% 40% Basin States 41% 40% 40% 38% 36% 38% 40% Conservation Before Shortage 41% 40% 40% 37% 36% 38% 40% Water Supply 41% 46% 53% 42% 39% 39% 40% Reservoir Storage 41% 33% 27% 28% 32% 37% 40%
6
Figure 4.3-6 compares the percent of values less than or equal to elevation 3,620 feet msl for 7 the No Action Alternative and the action alternatives. Elevation 3,620 feet msl is the water 8 level at which the Hite Marina, Hite Public Ramp, and Castle Rock Cut are closed. Lake 9 Powell elevations under the Water Supply, Basin States, and Conservation Before Shortage 10 alternative were observed to fall below elevation 3,620 feet msl more frequently than those 11 under the No Action Alternative. The water levels under the Reservoir Storage Alternative 12 fell below elevation 3,620 feet msl less frequently than those under the No Action 13 Alternative for most of the modeled years. 14
Table 4.3-5 shows that all of the different action alternatives varied from the No Action 15 Alternative from about 2016 until about 2040. All of the alternatives, including the No 16 Action Alternative, fell below elevation 3,620 feet msl about 21 to 40 percent of the time. 17

Environmental Consequences Chapter 4
February 2007 4-24 Draft EIS – Colorado River Interim Guidelines for
Lower Basin Shortages and Coordinated Operations for Lake Powell and Lake Mead
1
2
Table 4.3-5 Lake Powell End-of-September Elevations
Comparison of Action Alternatives to No Action Alternative Percent of Values Less Than or Equal to Elevation 3,620 feet msl
Year Alternatives 2008 2016 2026 2030 2040 2050 2060
No Action 34% 35% 29% 27% 32% 35% 39% Basin States 34% 36% 36% 31% 35% 35% 39% Conservation Before Shortage 34% 36% 36% 31% 35% 35% 39% Water Supply 34% 43% 47% 40% 38% 36% 39% Reservoir Storage 34% 28% 21% 25% 30% 35% 39%
3
Figure 4.3-6 Lake Powell End-of-September Elevations
Comparison of Action Alternatives to No Action Alternative Percent of Values Less Than or Equal to Elevation 3,620 feet msl
0%
10%
20%
30%
40%
50%
60%
70%
80%
90%
100%
2005 2010 2015 2020 2025 2030 2035 2040 2045 2050 2055 2060Year
Perc
ent o
f Val
ues
Less
than
or E
qual
to
No ActionBasin StatesConservation Before ShortageWater SupplyReservoir Storage
Chapter 4 Environmental Consequences
Draft EIS – Colorado River Interim Guidelines for Lower Basin Shortages and Coordinated Operations for Lake Powell and Lake Mead
4-25 February 2007
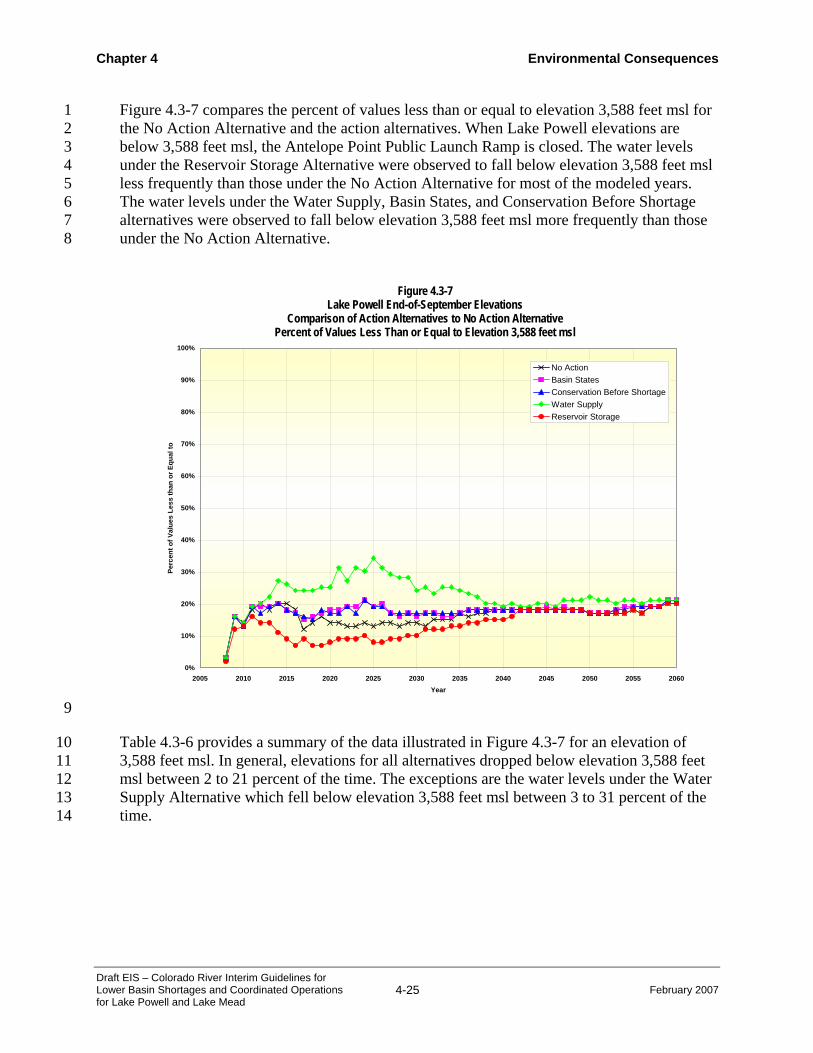
Figure 4.3-7 compares the percent of values less than or equal to elevation 3,588 feet msl for 1 the No Action Alternative and the action alternatives. When Lake Powell elevations are 2 below 3,588 feet msl, the Antelope Point Public Launch Ramp is closed. The water levels 3 under the Reservoir Storage Alternative were observed to fall below elevation 3,588 feet msl 4 less frequently than those under the No Action Alternative for most of the modeled years. 5 The water levels under the Water Supply, Basin States, and Conservation Before Shortage 6 alternatives were observed to fall below elevation 3,588 feet msl more frequently than those 7 under the No Action Alternative. 8
9
Table 4.3-6 provides a summary of the data illustrated in Figure 4.3-7 for an elevation of 10 3,588 feet msl. In general, elevations for all alternatives dropped below elevation 3,588 feet 11 msl between 2 to 21 percent of the time. The exceptions are the water levels under the Water 12 Supply Alternative which fell below elevation 3,588 feet msl between 3 to 31 percent of the 13 time. 14
Figure 4.3-7 Lake Powell End-of-September Elevations
Comparison of Action Alternatives to No Action Alternative Percent of Values Less Than or Equal to Elevation 3,588 feet msl
0%
10%
20%
30%
40%
50%
60%
70%
80%
90%
100%
2005 2010 2015 2020 2025 2030 2035 2040 2045 2050 2055 2060Year
Perc
ent o
f Val
ues
Less
than
or E
qual
to
No ActionBasin StatesConservation Before ShortageWater SupplyReservoir Storage

Environmental Consequences Chapter 4
February 2007 4-26 Draft EIS – Colorado River Interim Guidelines for
Lower Basin Shortages and Coordinated Operations for Lake Powell and Lake Mead
1 Table 4.3-6
Lake Powell End-of-September Elevations Comparison of Action Alternatives to No Action Alternative
Percent of Values Less Than or Equal to Elevation 3,588 feet msl
Year Alternatives 2008 2016 2026 2030 2040 2050 2060
No Action 3% 18% 14% 14% 18% 17% 20% Basin States 3% 17% 20% 16% 18% 17% 21% Conservation Before Shortage 3% 17% 19% 17% 18% 17% 21% Water Supply 3% 24% 31% 24% 19% 22% 21% Reservoir Storage 2% 7% 8% 10% 15% 17% 20%
2
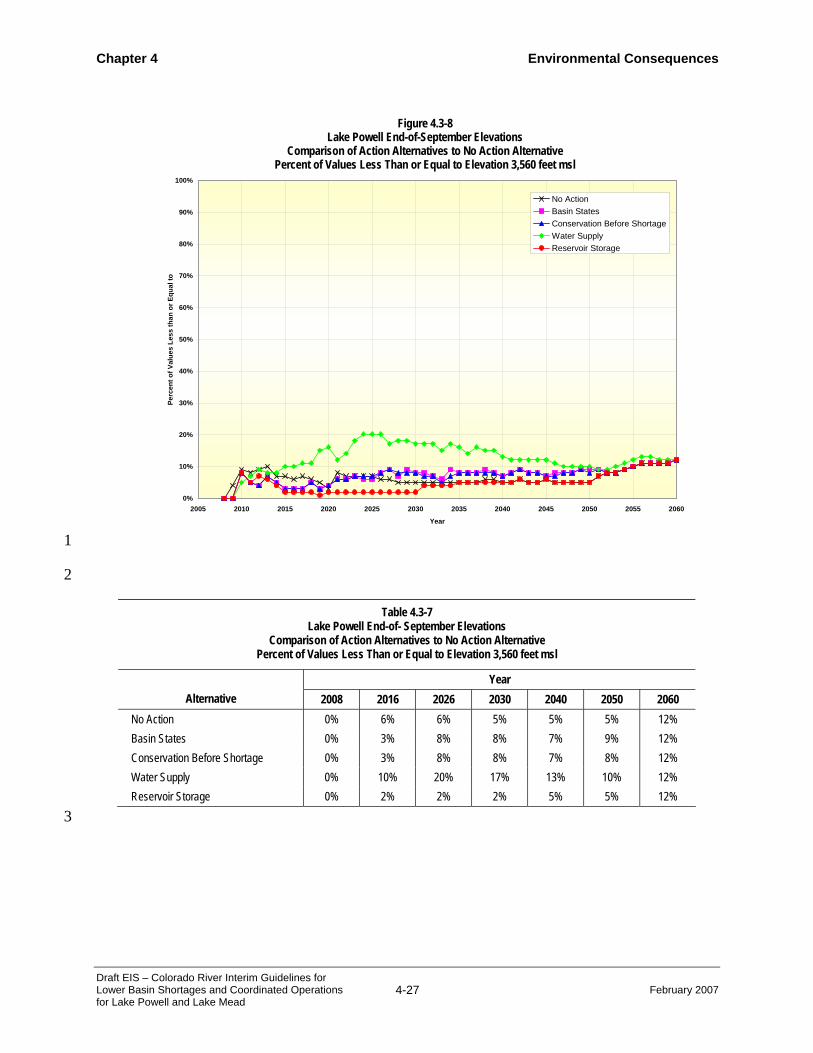
Figure 4.3-8 compares the percent of values less than or equal to elevation 3,560 feet msl for 3 the No Action Alternative and the action alternatives. Below an elevation of 3,560 feet msl, 4 the Wahweap and Stateline Public Launch Ramps, the Bullfrog Low Water Alternative 5 Launch Ramp, and the Halls Crossing Public Launch Ramps are closed. Results indicate that 6 for all alternatives, the Lake Powell end-of-September elevations were lower than 3,560 feet 7 msl between 0 to 12 percent of the time, with the exception of the Water Supply Alternative. 8 The water levels under the Water Supply Alternative fell below elevation 3,560 feet msl as 9 much as 20 percent of the time. 10
Table 4.3-7 provides a summary of the data illustrated in Figure 4.3-8 for elevation 3,560 feet 11 msl. The water levels under the Water Supply Alternative fell below elevation 3,560 feet msl 12 more frequently than those under the No Action Alternative. The water levels under the 13 Reservoir Storage Alternative fell below elevation 3,560 feet msl less frequently than those 14 under the No Action Alternative. 15
Figure 4.3-9 compares the percent of values equal to or less than elevation 3,555 feet msl for 16 the No Action Alternative and the action alternatives. Below an elevation of 3,555 feet msl, 17 the Wahweap, Antelope Point, Bullfrog, and Halls Crossing marinas are closed. Results 18 indicate that for all alternatives, the Lake Powell end-of-September elevations were lower 19 than 3,555 feet msl between 0 to 10 percent of the time. The exceptions are the water levels 20 under the Water Supply Alternative which had elevations lower than 3,555 feet msl as much 21 as 19 percent of the time. 22
Chapter 4 Environmental Consequences
Draft EIS – Colorado River Interim Guidelines for Lower Basin Shortages and Coordinated Operations for Lake Powell and Lake Mead
4-27 February 2007
1
2
Table 4.3-7 Lake Powell End-of- September Elevations
Comparison of Action Alternatives to No Action Alternative Percent of Values Less Than or Equal to Elevation 3,560 feet msl
Year Alternative 2008 2016 2026 2030 2040 2050 2060
No Action 0% 6% 6% 5% 5% 5% 12% Basin States 0% 3% 8% 8% 7% 9% 12% Conservation Before Shortage 0% 3% 8% 8% 7% 8% 12% Water Supply 0% 10% 20% 17% 13% 10% 12% Reservoir Storage 0% 2% 2% 2% 5% 5% 12%
3
Figure 4.3-8 Lake Powell End-of-September Elevations
Comparison of Action Alternatives to No Action Alternative Percent of Values Less Than or Equal to Elevation 3,560 feet msl
0%
10%
20%
30%
40%
50%
60%
70%
80%
90%
100%
2005 2010 2015 2020 2025 2030 2035 2040 2045 2050 2055 2060
Year
Perc
ent o
f Val
ues
Less
than
or E
qual
to
No ActionBasin StatesConservation Before ShortageWater SupplyReservoir Storage
Environmental Consequences Chapter 4
February 2007 4-28 Draft EIS – Colorado River Interim Guidelines for
Lower Basin Shortages and Coordinated Operations for Lake Powell and Lake Mead
1
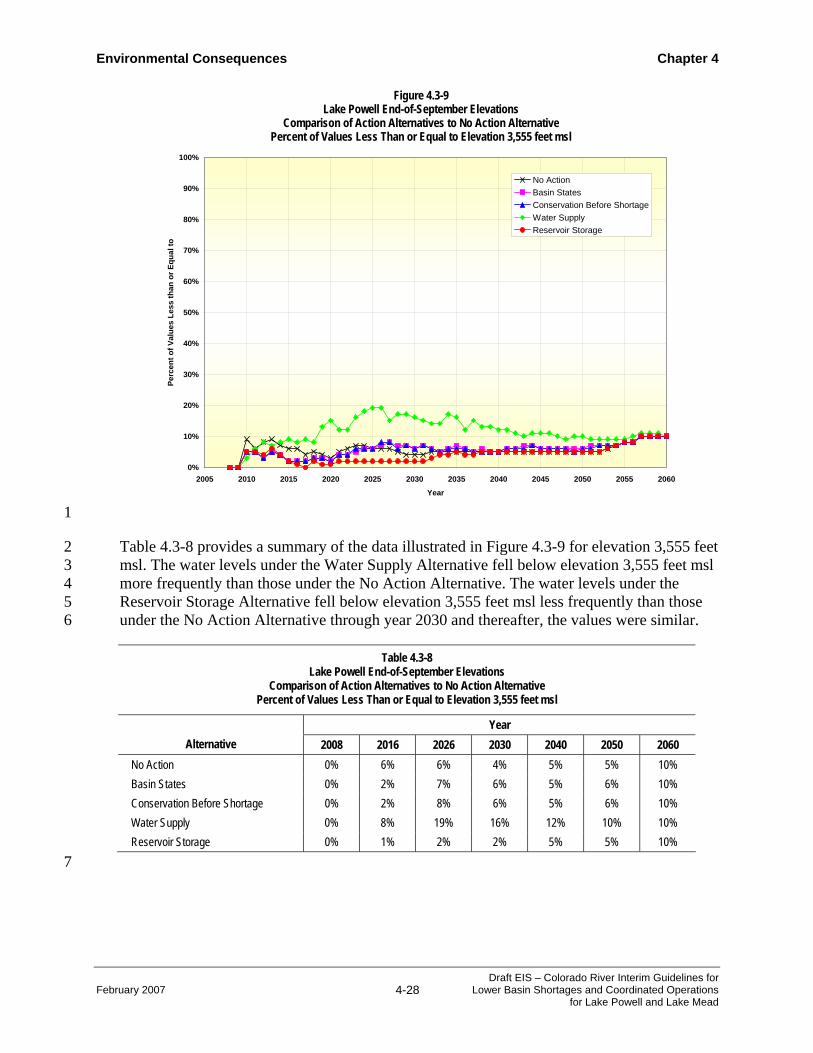
Table 4.3-8 provides a summary of the data illustrated in Figure 4.3-9 for elevation 3,555 feet 2 msl. The water levels under the Water Supply Alternative fell below elevation 3,555 feet msl 3 more frequently than those under the No Action Alternative. The water levels under the 4 Reservoir Storage Alternative fell below elevation 3,555 feet msl less frequently than those 5 under the No Action Alternative through year 2030 and thereafter, the values were similar. 6
Table 4.3-8 Lake Powell End-of-September Elevations
Comparison of Action Alternatives to No Action Alternative Percent of Values Less Than or Equal to Elevation 3,555 feet msl
Year Alternative 2008 2016 2026 2030 2040 2050 2060
No Action 0% 6% 6% 4% 5% 5% 10% Basin States 0% 2% 7% 6% 5% 6% 10% Conservation Before Shortage 0% 2% 8% 6% 5% 6% 10% Water Supply 0% 8% 19% 16% 12% 10% 10% Reservoir Storage 0% 1% 2% 2% 5% 5% 10%
7
Figure 4.3-9 Lake Powell End-of-September Elevations
Comparison of Action Alternatives to No Action Alternative Percent of Values Less Than or Equal to Elevation 3,555 feet msl
0%
10%
20%
30%
40%
50%
60%
70%
80%
90%
100%
2005 2010 2015 2020 2025 2030 2035 2040 2045 2050 2055 2060
Year
Perc
ent o
f Val
ues
Less
than
or E
qual
toNo ActionBasin StatesConservation Before ShortageWater SupplyReservoir Storage

Chapter 4 Environmental Consequences
Draft EIS – Colorado River Interim Guidelines for Lower Basin Shortages and Coordinated Operations for Lake Powell and Lake Mead
4-29 February 2007
Figure 4.3-10 compares the percent of values equal to or less than 3,550 feet msl for the No 1 Action Alternative and the action alternatives. Below this elevation, the operation of the John 2 Atlantic Burr Ferry may be affected. The Lake Powell end-of-September elevations under all 3 of the alternatives were lower than 3,550 feet msl infrequently, ranging between zero to 10 4 percent. The exception to this was the Water Supply Alternative, which had water levels that 5 fell below elevation 3,550 feet msl as much as 18 percent of the time. The water levels under 6 the Reservoir Storage, Basin States, and Conservation Before Shortage Alternatives were all 7 very similar to those under the No Action Alternative throughout the period of analysis. 8
9
Table 4.3-9 provides a summary of the data illustrated in Figure 4.3-10 and shows that the 10 water levels under the Basin States, Conservation Before Shortage, and Reservoir Storage 11 alternatives were generally within the same range as those under the No Action Alternative. 12 The water levels under the Water Supply Alternative fell below elevation 3,550 feet msl most 13 frequently compared to the other alternatives, as much as 17 percent of the time. 14
Figure 4.3-10 Lake Powell End-of-September Elevations
Comparison of Action Alternatives to No Action Alternative Percent of Values Less Than or Equal to Elevation 3,550 feet msl
0%
10%
20%
30%
40%
50%
60%
70%
80%
90%
100%
2005 2010 2015 2020 2025 2030 2035 2040 2045 2050 2055 2060
Year
Perc
ent o
f Val
ues
Less
than
or E
qual
to
No ActionBasin StatesConservation Before ShortageWater SupplyReservoir Storage

Environmental Consequences Chapter 4
February 2007 4-30 Draft EIS – Colorado River Interim Guidelines for
Lower Basin Shortages and Coordinated Operations for Lake Powell and Lake Mead
Table 4.3-9 Lake Powell End-of-September Elevations
Comparison of Action Alternatives to No Action Alternative Percent of Values Less Than or Equal to Elevation 3,550 feet msl
Year Alternatives 2008 2016 2026 2030 2040 2050 2060
No Action 0% 5% 4% 4% 5% 5% 10% Basin States 0% 1% 6% 6% 5% 5% 10% Conservation Before Shortage 0% 1% 6% 6% 5% 5% 10% Water Supply 0% 5% 17% 16% 10% 9% 10% Reservoir Storage 0% 1% 1% 1% 5% 5% 10%
1
Figure 4.3-11 compares the percent of values for Lake Powell end-of-March elevations that 2 were less than or equal to an elevation of 3,490 feet msl, the minimum power pool for Lake 3 Powell and the Glen Canyon Powerplant, between the No Action Alternative and the action 4 alternatives. The figure shows that the Lake Powell end-of-March elevation fell below 3,490 5 feet msl under the No Action, Basin States, Conservation Before Shortage, and Reservoir 6 Storage alternatives very infrequently. The Lake Powell end-of-March elevations under the 7 Water Supply Alternative were observed to fall below 3,490 feet msl more frequently than 8 those under the No Action Alternative, with the differences being as high as seven percent. 9
Figure 4.3-11 Lake Powell End-of-March Elevations
Comparison of Action Alternatives to No Action Alternative Percent of Values Less Than or Equal to Elevation 3,490 feet msl
0%
10%
20%
30%
40%
50%
60%
70%
80%
90%
100%
2005 2010 2015 2020 2025 2030 2035 2040 2045 2050 2055 2060
Year
Perc
ent o
f Val
ues
Less
than
or E
qual
to
No ActionBasin StatesConservation Before ShortageWater SupplyReservoir Storage

Chapter 4 Environmental Consequences
Draft EIS – Colorado River Interim Guidelines for Lower Basin Shortages and Coordinated Operations for Lake Powell and Lake Mead
4-31 February 2007
Table 4.3-10 provides a summary of the data illustrated in Figure 4.3-11 for elevation 3,490 1 feet msl. As show on this table, the water levels under all of the alternatives, with the 2 exception of the Water Supply Alternative, fell below elevation 3,490 feet msl less than three 3 percent of the time. 4
Table 4.3-10 Lake Powell End-of-March Elevations
Comparison of Action Alternatives to No Action Alternative Percent of Values Less Than or Equal to Elevation 3,490 feet msl
Year Alternatives 2008 2016 2026 2030 2040 2050 2060
No Action 0% 1% 1% 0% 0% 0% 3% Basin States 0% 0% 0% 1% 1% 0% 3% Conservation Before Shortage 0% 0% 0% 1% 1% 0% 3% Water Supply 0% 0% 8% 6% 3% 0% 3% Reservoir Storage 0% 0% 0% 0% 0% 0% 3%
5
4.3.3 Glen Canyon Dam to Lake Mead 6 The river flows that occur between Glen Canyon Dam and Lake Mead result mostly from 7 controlled releases from Glen Canyon Dam (Lake Powell). The gains from tributaries in this 8 reach on average are less than three percent of the total inflow, are concentrated over very 9 short periods of time, and will not be affected by the proposed federal action. As noted in 10 Section 3.3, future annual and monthly releases may be affected by the proposed federal 11 action. However, each alternative may alter the probability (when compared to the No Action 12 Alternative) of the magnitude and timing of particular releases. 13
Table 4.3-11 provides a comparison of the relative frequency of occurrence of annual 14 releases from Lake Powell under the No Action Alternative and the action alternatives, 15 during the period between 2009 through 2060. The reported values are water year values. 16 Releases greater than 9.0 maf generally correspond to years where either equalization or spill 17 avoidance releases are made from Lake Powell. As is shown, the most frequently occurring 18 releases for all alternatives are 8.23 maf. Releases less than the annual minimum objective 19 release of 8.23 maf occurred less than one percent of the time under the No Action 20 Alternative, approximately 3.7 percent under the Basin States, Conservation Before Shortage, 21 and Water Supply alternatives, and approximately six percent under the Reservoir Storage 22 Alternative. Releases greater than the annual minimum objective release of 8.23 maf 23 occurred approximately 35.5 percent under the No Action Alternative, approximately 42.4 24 percent under the Basin States, Conservation Before Shortage, and Water Supply 25 alternatives, and approximately 36.67 percent under the Reservoir Storage Alternative. 26

Environmental Consequences Chapter 4
February 2007 4-32 Draft EIS – Colorado River Interim Guidelines for
Lower Basin Shortages and Coordinated Operations for Lake Powell and Lake Mead
1 Table 4.3-11
Glen Canyon Dam Water Year Releases Probability of Occurrence of Different Size Annual Releases Comparison of Action Alternatives to No Action Alternative
Water Years 2009 through 2060 Alternative
Glen Canyon Dam Release Volumes No Action Basin States
Conservation Before
Shortage Water Supply
Reservoir Storage
Greater than 9.00 mafy 29.80% 35.53% 35.53% 36.67% 30.94% Between 8.51 to 9.00 mafy 3.44% 4.58% 4.58% 3.44% 3.44% Between 8.24 to 8.50 mafy 2.29% 2.29% 2.29% 2.29% 2.29% Minimum Objective Release of 8.23 mafy 64.18% 53.87% 53.87% 53.87% 57.30% Between 7.51 to 8.22 mafy 0.27% 0.00% 0.00% 1.15% 6.00% Between 7.0 to 7.50 mafy 0.00% 3.71% 3.71% 2.56% 0.00% Less than 7.0 mafy 0.00% 0.00% 0.00% 0.00% 0.00%
Total 100.0% 100.0% 100.0% 100.0% 100.0% 2
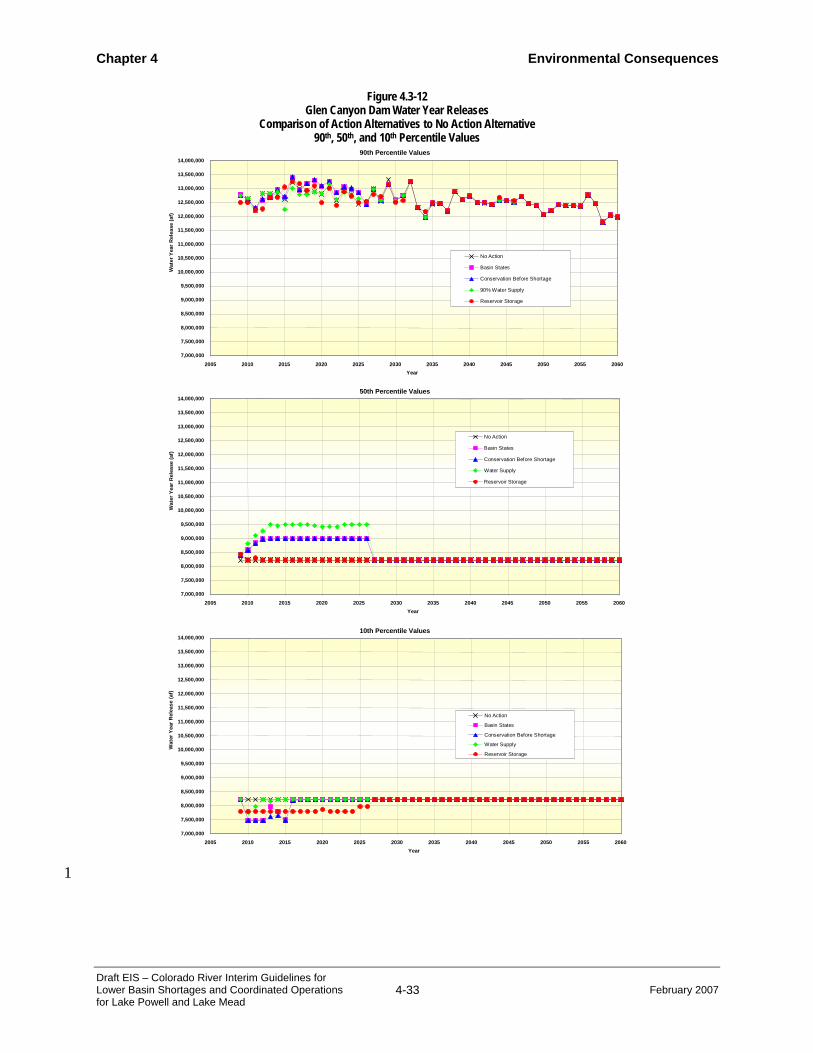
Figure 4.3-12 presents a comparison of the 90th, 50th, and 10th percentile values observed 3 under the action alternatives to those under the No Action Alternative. As illustrated in 4 Figure 4.3-12, the 90th percentile values under all of the alternatives fluctuate and range 5 between 12.0 mafy to about 13.4 mafy, primarily due to spill avoidance releases. For the 50th 6 percentile values, the Reservoir Storage Alternative and the No Action Alternatives are 7 nearly identical, with consistent releases of 8.23 maf. The Basin States, Conservation Before 8 Shortage, and Water Supply alternatives show releases greater than the minimum objective 9 release of 8.23 maf, up to 9.5 maf, a result of balancing or equalization releases. The 10th 10 percentile values showed that the Water Supply Alternative varied only in the initial three 11 years, providing slightly lower releases than the No Action Alternative. The Basin States and 12 Conservation Before Shortage alternatives also provided slightly lower annual release 13 volumes than the No Action Alternative through the year 2016. The 10th percentile values for 14 releases under the Reservoir Storage Alternative are not as low as those of the other action 15 alternatives but are slightly lower than those of the No Action Alternative and extend through 16 2026. 17
Chapter 4 Environmental Consequences
Draft EIS – Colorado River Interim Guidelines for Lower Basin Shortages and Coordinated Operations for Lake Powell and Lake Mead
4-33 February 2007
1
Figure 4.3-12 Glen Canyon Dam Water Year Releases
Comparison of Action Alternatives to No Action Alternative 90th, 50th, and 10th Percentile Values
90th Percentile Values
7,000,000 7,500,000 8,000,000 8,500,000 9,000,000 9,500,000
10,000,000 10,500,000 11,000,000 11,500,000 12,000,000 12,500,000 13,000,000 13,500,000 14,000,000
2005 2010 2015 2020 2025 2030 2035 2040 2045 2050 2055 2060 Year
Wat
er Y
ear
Rel
ease
(af)
No Action
Basin States
Conservation Before Shortage
90% Water Supply
Reservoir Storage
50th Percentile Values
7,000,000 7,500,000 8,000,000 8,500,000 9,000,000 9,500,000
10,000,000 10,500,000 11,000,000 11,500,000 12,000,000 12,500,000 13,000,000 13,500,000 14,000,000
2005 2010 2015 2020 2025 2030 2035 2040 2045 2050 2055 2060 Year
Wat
er Y
ear
Rel
ease
(af)
No Action
Basin States
Conservation Before Shortage
Water Supply
Reservoir Storage
10th Percentile Values
7,000,000 7,500,000 8,000,000 8,500,000 9,000,000 9,500,000
10,000,000 10,500,000 11,000,000 11,500,000 12,000,000 12,500,000 13,000,000 13,500,000 14,000,000
2005 2010 2015 2020 2025 2030 2035 2040 2045 2050 2055 2060 Year
Wat
er Y
ear
Rel
ease
(af)
No Action
Basin States
Conservation Before Shortage
Water Supply
Reservoir Storage
Environmental Consequences Chapter 4
February 2007 4-34 Draft EIS – Colorado River Interim Guidelines for
Lower Basin Shortages and Coordinated Operations for Lake Powell and Lake Mead
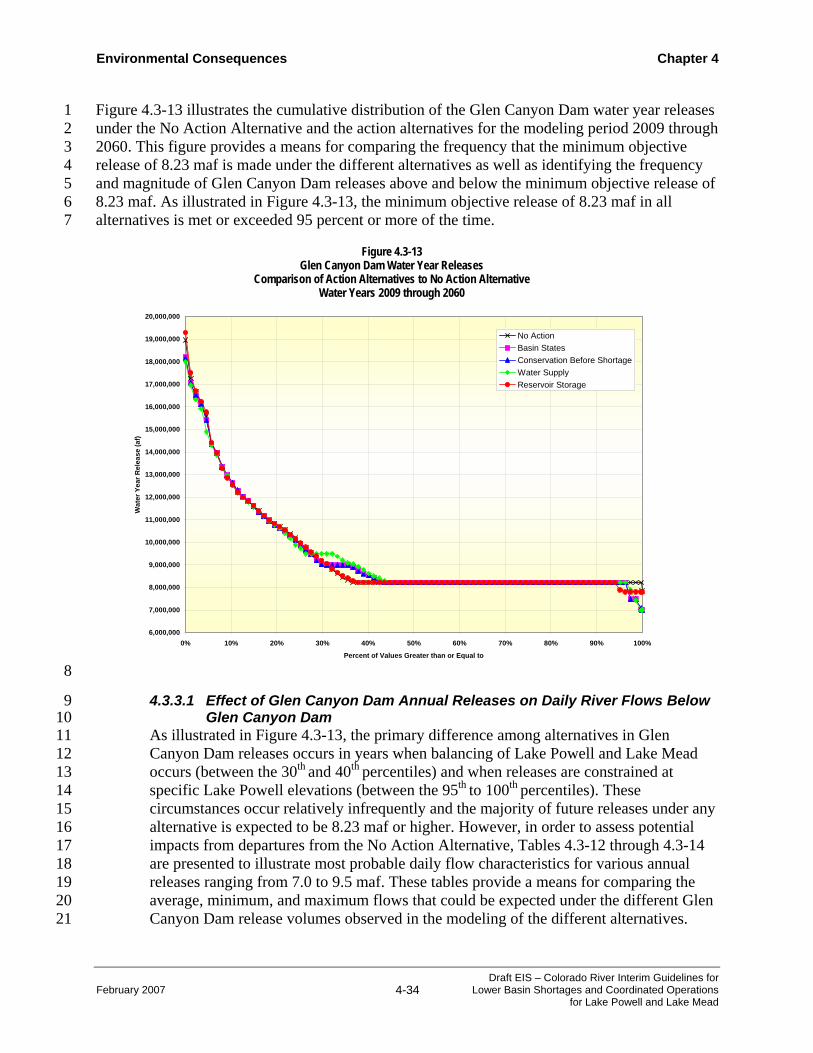
Figure 4.3-13 illustrates the cumulative distribution of the Glen Canyon Dam water year releases 1 under the No Action Alternative and the action alternatives for the modeling period 2009 through 2 2060. This figure provides a means for comparing the frequency that the minimum objective 3 release of 8.23 maf is made under the different alternatives as well as identifying the frequency 4 and magnitude of Glen Canyon Dam releases above and below the minimum objective release of 5 8.23 maf. As illustrated in Figure 4.3-13, the minimum objective release of 8.23 maf in all 6 alternatives is met or exceeded 95 percent or more of the time. 7
8
4.3.3.1 Effect of Glen Canyon Dam Annual Releases on Daily River Flows Below 9 Glen Canyon Dam 10
As illustrated in Figure 4.3-13, the primary difference among alternatives in Glen 11 Canyon Dam releases occurs in years when balancing of Lake Powell and Lake Mead 12 occurs (between the 30th and 40th percentiles) and when releases are constrained at 13 specific Lake Powell elevations (between the 95th to 100th percentiles). These 14 circumstances occur relatively infrequently and the majority of future releases under any 15 alternative is expected to be 8.23 maf or higher. However, in order to assess potential 16 impacts from departures from the No Action Alternative, Tables 4.3-12 through 4.3-14 17 are presented to illustrate most probable daily flow characteristics for various annual 18 releases ranging from 7.0 to 9.5 maf. These tables provide a means for comparing the 19 average, minimum, and maximum flows that could be expected under the different Glen 20 Canyon Dam release volumes observed in the modeling of the different alternatives. 21
Figure 4.3-13 Glen Canyon Dam Water Year Releases
Comparison of Action Alternatives to No Action Alternative Water Years 2009 through 2060
6,000,000
7,000,000
8,000,000
9,000,000
10,000,000
11,000,000
12,000,000
13,000,000
14,000,000
15,000,000
16,000,000
17,000,000
18,000,000
19,000,000
20,000,000
0% 10% 20% 30% 40% 50% 60% 70% 80% 90% 100%
Percent of Values Greater than or Equal to
Wat
er Y
ear R
elea
se (a
f)
No ActionBasin StatesConservation Before ShortageWater SupplyReservoir Storage

Chapter 4 Environmental Consequences
Draft EIS – Colorado River Interim Guidelines for Lower Basin Shortages and Coordinated Operations for Lake Powell and Lake Mead
4-35 February 2007
Table 4.3-12 Average Daily Glen Canyon Dam Releases (cfs)
Corresponding to Various Annual Release Volumes
7.0 maf 7.48 maf 7.8 maf 8.23 maf 9.0 maf 9.5 maf Oct 9,758 7,806 9,758 9,758 9,758 9,758 Nov 10,083 8,403 10,083 10,083 10,083 10,083 Dec 13,011 9,758 9,758 13,011 13,011 13,011 Jan 10,717 13,011 13,011 13,011 13,011 13,824 Feb 9,771 10,804 10,804 10,804 11,704 11,704 Mar 7,354 9,758 9,758 9,758 10,571 10,571 Apr 7,599 8,403 10,083 10,083 10,083 10,924 May 7,354 9,758 9,758 9,758 10,571 13,011 Jun 9,119 10,083 10,083 10,924 13,444 15,125 Jul 11,767 13,011 13,011 13,824 16,263 17,077 Aug 11,767 13,011 13,011 14,637 17,077 17,890 Sep 7,599 10,083 10,083 10,588 13,444 14,285
1
Table 4.3-13 Minimum Hourly Glen Canyon Dam Release (cfs)
Corresponding to Various Annual Release Volumes
7.0 maf 7.48 maf 7.8 maf 8.23 maf 9.0 maf 9.5 maf Oct 6,458 5,006 6,458 6,458 6,458 6,458 Nov 6,783 5,603 6,783 6,783 6,783 6,783 Dec 8,711 6,458 6,458 8,711 8,711 8,711 Jan 7,417 8,711 9,711 8,711 8,711 9,524 Feb 6,971 7,504 7,504 7,504 8,404 8,404 Mar 5,000 6,458 6,458 6,458 7,271 7,271 Apr 5,000 5,603 6,783 6,783 6,783 7,624 May 5,000 6,458 6,458 6,458 7,271 8,711 Jun 6,319 6,783 6,783 7,624 9,144 10,825 Jul 8,467 8,711 8,711 9,524 11,963 12,777 Aug 8,467 8,711 8,711 10,337 12,777 13,590 Sep 5,000 6,783 6,783 7,288 9,144 9,985
2

Environmental Consequences Chapter 4
February 2007 4-36 Draft EIS – Colorado River Interim Guidelines for
Lower Basin Shortages and Coordinated Operations for Lake Powell and Lake Mead
1 Table 4.3-14
Maximum Hourly Glen Canyon Dam Release (cfs) Corresponding to Various Annual Release Volumes
7.0 maf 7.48 maf 7.8 maf 8.23 maf 9.0 maf 9.5 maf Oct 12,458 10,006 12,458 12,458 12,458 12,458 Nov 12,783 10,603 12,783 12,783 12,783 12,783 Dec 16,711 12,458 12,458 16,711 16,711 16,711 Jan 13,417 16,711 15,711 16,711 16,711 17,524 Feb 11,971 13,504 13,504 13,504 14,404 14,404 Mar 10,000 12,458 12,458 12,458 13,271 13,271 Apr 10,000 10,603 12,783 12,783 12,783 13,624 May 10,000 12,458 12,458 12,458 13,271 16,711 Jun 11,319 12,783 12,783 13,624 17,144 18,825 Jul 14,467 16,711 16,711 17,524 19,963 20,777 Aug 14,467 16,711 16,711 18,337 20,777 21,590 Sep 10,000 12,783 12,783 13,288 17,144 17,985
2
Table 4.3-12 provides a listing of the average flow for the month that would occur under 3 the various annual releases. Tables 4.3-13 and 4.3-14 provide listings of the minimum 4 and maximum hourly flow from Glen Canyon Dam under the various annual releases 5 when the parameters of the 1996 Glen Canyon Dam ROD (Section 3.3) are applied to 6 the monthly volumes. 7
The monthly release values listed in Table 4.3-12 for the months of October, November 8 and December in the 7.0 maf column are identical to monthly releases in 8.23 maf years. 9 This occurs because the operation is governed by balancing releases between Lake 10 Powell and Lake Mead in 7.0 maf years and the first inflow forecast for the upcoming 11 year is not available until January. Beginning in January and continuing through the 12 remainder of the water year, monthly releases from Lake Powell in 7.0 maf years are 13 adjusted to balance volumes between Lake Powell and Lake Mead. It should also be 14 noted that the variability in forecasts and different levels of Lake Powell and Lake Mead 15 in 7.0 maf years result in there not being a consistent monthly pattern for these years, as 16 opposed to the other years in the table where the monthly pattern is more predictable. 17 The 7.0 maf pattern shown in Table 4.3-13 represents Trace 91 for water year 2014 from 18 the Water Supply Alternative. 19
These hourly releases are needed in order to analyze potential downstream impacts to 20 water quality and other resources. 21

Chapter 4 Environmental Consequences
Draft EIS – Colorado River Interim Guidelines for Lower Basin Shortages and Coordinated Operations for Lake Powell and Lake Mead
4-37 February 2007
4.3.3.2 10-year Running Total of Glen Canyon Dam Releases 1 Figure 4.3-14 compares the 10-year running totals of the Glen Canyon Dam water year 2 releases (10-year running total) under the action alternatives to the No Action 3 Alternative. The values used to compute the 10-year running total for the years between 4 2008 through 2017 included a combination of historical values (for years prior to 2006), 5 projections from the 24-month study (for years 2006 and 2007), and output from the 6 CRSS model (for years 2008 and later). As noted in Section 4.2, the 24-month study was 7 used to project the starting conditions for the reservoir levels for January 1, 2008. 8
The upper limit of the 10-year running total was similar under the No Action Alternative 9 and the action alternatives and equaled approximately 131 maf. The 10-year running 10 total under all of the alternatives, including the No Action Alternative, was always 11 above 75 maf. 12
The 10-year running total under the No Action Alternative was less than 8.23 maf less 13 than one percent of the years with a minimum value of 81.9 maf. The 10-year running 14 total under the Basin States and Conservation Before Shortage alternatives was less than 15 82.3 maf in approximately two percent of the years and the minimum value was 79.6 16 maf. The 10-year running total under the Water Supply Alternative was less than 82.3 17 maf in only one percent of the years and the minimum value was 79.8 maf. The 10 year 18 running total under the Reservoir Storage Alternative was less than 82.3 maf in 19 approximately 6.7 percent of the years and the minimum value was 78.5 maf. 20
Figure 4.3-14 Glen Canyon Dam 10-Year Running Total of Annual Releases Comparison of Action Alternatives to No Action Alternative
Years 2008 through 2060
75 80 85 90 95
100 105 110 115 120 125 130 135
0% 10% 20% 30% 40% 50% 60% 70% 80% 90% 100%Percent of Values Greater than or Equal to
10-Y
ear R
unni
ng T
otal
(maf
)
No ActionBasin States Conservation Before Storage Water Supply Reservoir Storage

Environmental Consequences Chapter 4
February 2007 4-38 Draft EIS – Colorado River Interim Guidelines for
Lower Basin Shortages and Coordinated Operations for Lake Powell and Lake Mead
4.3.4 Lake Mead and Hoover Dam 1 As noted in Section 3.3, future elevations of Lake Mead are expected to be within the range 2 of historic water levels. However, each alternative may alter the probability (when compared 3 to the No Action Alternative) that the reservoir may be at a given elevation in the future. 4
Figure 4.3-15 presents a comparison of the 90th, 50th, and 10th percentile values observed for 5 the action alternatives to those under the No Action Alternative. Under the No Action 6 Alternative, the elevation of Lake Mead was projected to fluctuate between full (1,219.6 feet 7 msl) and lower water during the period of analysis (2008 through 2060). The 90th percentile 8 line increases from starting conditions to nearly full pool, about elevation 1,212 feet msl. The 9 median water level values (50th percentile) under the No Action Alternative fluctuated 10 between approximately 1,100 feet msl to approximately 1,120 feet msl between 2008 and 11 2035. The 10th percentile values show a declining trend between 2008 and 2025, from about 12 1,101 feet msl to about 1,018 feet msl. 13
14
Figure 4.3-15 Lake Mead End-of-December Elevations
Comparison of Action Alternatives to No Action Alternative 90th, 50th, and 10th Percentile Values
1,000
1,025
1,050
1,075
1,100
1,125
1,150
1,175
1,200
1,225
2005 2010 2015 2020 2025 2030 2035 2040 2045 2050 2055 2060Year
Wat
er S
urfa
ce E
leva
tion
(feet
msl
)
No Action Basin StatesConservation Before ShortageWater SupplyReservoir Storage
10th Percentile
50th Percentile
90th Percentile

Chapter 4 Environmental Consequences
Draft EIS – Colorado River Interim Guidelines for Lower Basin Shortages and Coordinated Operations for Lake Powell and Lake Mead
4-39 February 2007
All action alternatives showed similar 90th percentile values compared to the No Action 1 Alternative. It should be noted that the Lake Mead elevations depicted in Figure 4.3-15 2 represent water levels at the end of December which is when lake levels are typically at 3 a seasonal high. Conversely, the Lake Mead water level generally reaches its annual low 4 in July. 5
The Basin States and Conservation Before Shortage alternatives had slightly higher 50th 6 percentile values than the No Action Alternative between 2008 through 2024, then dropped 7 below those of the No Action Alternative between 2025 and about 2041, and thereafter were 8 similar. The Water Supply Alternative had lower 50th percentile values than the No Action 9 Alternative between 2012 through 2041, and thereafter were similar. Conversely, the 10 Reservoir Storage Alternative had higher 50th percentile values than the No Action. During 11 the interim period, the 10th percentile values for the Basin States, Conservation Before 12 Shortage, and Water Supply alternatives are higher than the No Action Alternative, and the 13 values for the Reservoir Storage Alternative are significantly higher than the No Action. 14
Table 4.3-15 provides a summary of the data illustrated in Figure 4.3-15 which reflects the 15 90th, 50th, and 10th percentile values observed under the No Action Alternative and the action 16 alternatives. The values presented in this table include those for years 2026 and 2060 only. 17 The 90th, 50th, and 10th percentile values under the action alternatives differ from 18 the No Action Alternative to some extent in year 2026 and at very insignificant levels in 19 year 2060. 20
Table 4.3-15 Lake Mead End-of-December Elevations (feet msl)
Comparison of Action Alternatives to No Action Alternative 90th , 50th , and 10th Percentile Values
Year 2026 Year 2060 Alternative 90th
Percentile 50th
Percentile 10th
Percentile 90th
Percentile 50th
Percentile 10th
Percentile No Action 1,206.87 1,106.50 1,015.31 1,202.39 1,099.41 1,012.44 Basin States 1,207.05 1,095.39 1,030.07 1,205.79 1,100.55 1,012.95 Conservation Before Shortage 1,207.05 1,097.22 1,027.39 1,205.79 1,100.55 1,012.70 Water Supply 1,204.72 1,090.78 1,016.47 1,205.59 1,099.41 1,012.42 Reservoir Storage 1,214.05 1,132.64 1,062.16 1,205.80 1,101.47 1,012.75
21
The 90th percentile values in year 2026 vary little between the action alternatives and the No 22 Action Alternative. The exception to this is the Reservoir Storage Alternative which is 23 approximately seven feet higher than that of the No Action Alternative. 24
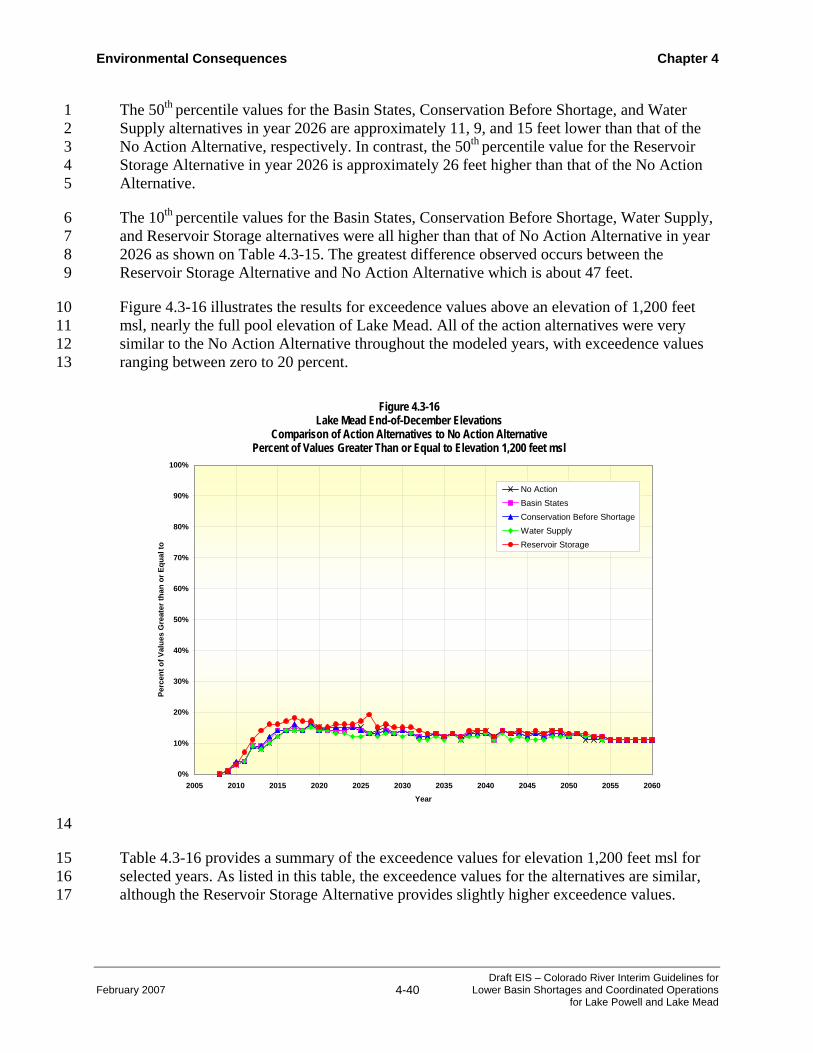
Environmental Consequences Chapter 4
February 2007 4-40 Draft EIS – Colorado River Interim Guidelines for
Lower Basin Shortages and Coordinated Operations for Lake Powell and Lake Mead
The 50th percentile values for the Basin States, Conservation Before Shortage, and Water 1 Supply alternatives in year 2026 are approximately 11, 9, and 15 feet lower than that of the 2 No Action Alternative, respectively. In contrast, the 50th percentile value for the Reservoir 3 Storage Alternative in year 2026 is approximately 26 feet higher than that of the No Action 4 Alternative. 5
The 10th percentile values for the Basin States, Conservation Before Shortage, Water Supply, 6 and Reservoir Storage alternatives were all higher than that of No Action Alternative in year 7 2026 as shown on Table 4.3-15. The greatest difference observed occurs between the 8 Reservoir Storage Alternative and No Action Alternative which is about 47 feet. 9
Figure 4.3-16 illustrates the results for exceedence values above an elevation of 1,200 feet 10 msl, nearly the full pool elevation of Lake Mead. All of the action alternatives were very 11 similar to the No Action Alternative throughout the modeled years, with exceedence values 12 ranging between zero to 20 percent. 13
14
Table 4.3-16 provides a summary of the exceedence values for elevation 1,200 feet msl for 15 selected years. As listed in this table, the exceedence values for the alternatives are similar, 16 although the Reservoir Storage Alternative provides slightly higher exceedence values.17
Figure 4.3-16 Lake Mead End-of-December Elevations
Comparison of Action Alternatives to No Action Alternative Percent of Values Greater Than or Equal to Elevation 1,200 feet msl
0%
10%
20%
30%
40%
50%
60%
70%
80%
90%
100%
2005 2010 2015 2020 2025 2030 2035 2040 2045 2050 2055 2060
Year
Perc
ent o
f Val
ues
Gre
ater
than
or E
qual
to
No ActionBasin StatesConservation Before ShortageWater SupplyReservoir Storage

Chapter 4 Environmental Consequences
Draft EIS – Colorado River Interim Guidelines for Lower Basin Shortages and Coordinated Operations for Lake Powell and Lake Mead
4-41 February 2007
1
Table 4.3-16 Lake Mead End-of- December Elevations
Comparison of Action Alternatives to No Action Alternative Percent of Values Greater Than or Equal to Elevation 1,200 feet msl
Year Alternatives 2008 2016 2026 2030 2040 2050 2060
No Action 0% 14% 13% 14% 14% 12% 11% Basin States 0% 14% 13% 14% 13% 12% 11% Conservation Before Shortage 0% 14% 13% 14% 13% 12% 11% Water Supply 0% 14% 13% 12% 13% 12% 11% Reservoir Storage 0% 17% 19% 15% 14% 13% 11%
2
Figure 4.3-17 illustrates the frequency that future Lake Mead end-of-December elevations 3 would drop below elevation 1,178 feet msl. Lake Mead elevations of 1,178 feet msl and 4 1,000 feet msl were used by the Clean Water Coalition as reference elevations for its Lake 5 Mead water quality analysis (Systems Conveyance and Operations Program Final 6 Environmental Impact Statement [SCOP FEIS] October 2006). The SCOP FEIS analyzed 7 water quality changes corresponding to Lake Mead elevation drawdown from 1,178 feet msl 8 to 1,000 feet msl. These potential Lake Mead water quality changes are discussed in Section 9 4.5. As shown in Figure 4.3-17, the results for the Basin States and Conservation Before 10 Shortage alternatives are similar to those of the No Action Alternative. The water levels 11 under the Reservoir Storage Alternative were observed to fall below elevation 1,178 feet msl 12 less frequently than those under the No Action Alternative. The water levels under the Water 13 Supply Alternative were observed to fall below elevation 1,178 feet msl more frequently than 14 those under the No Action Alternative. 15
Table 4.3-17 provides a summary of the results illustrated in Figure 4.3-17 for elevation 16 1,178 feet msl in tabular form for selected years. As shown in Table 4.3-17, the water levels 17 under the Basin States and Conservation Before Shortage alternatives are similar to those 18 under the No Action Alternative. The water levels under the Reservoir Storage Alternative 19 fell below elevation 1,178 feet msl less frequently than those under the No Action 20 Alternative. The water levels under the Water Supply Alternative fell below elevation 1,178 21 feet msl more frequently than those under the No Action Alternative. 22
23
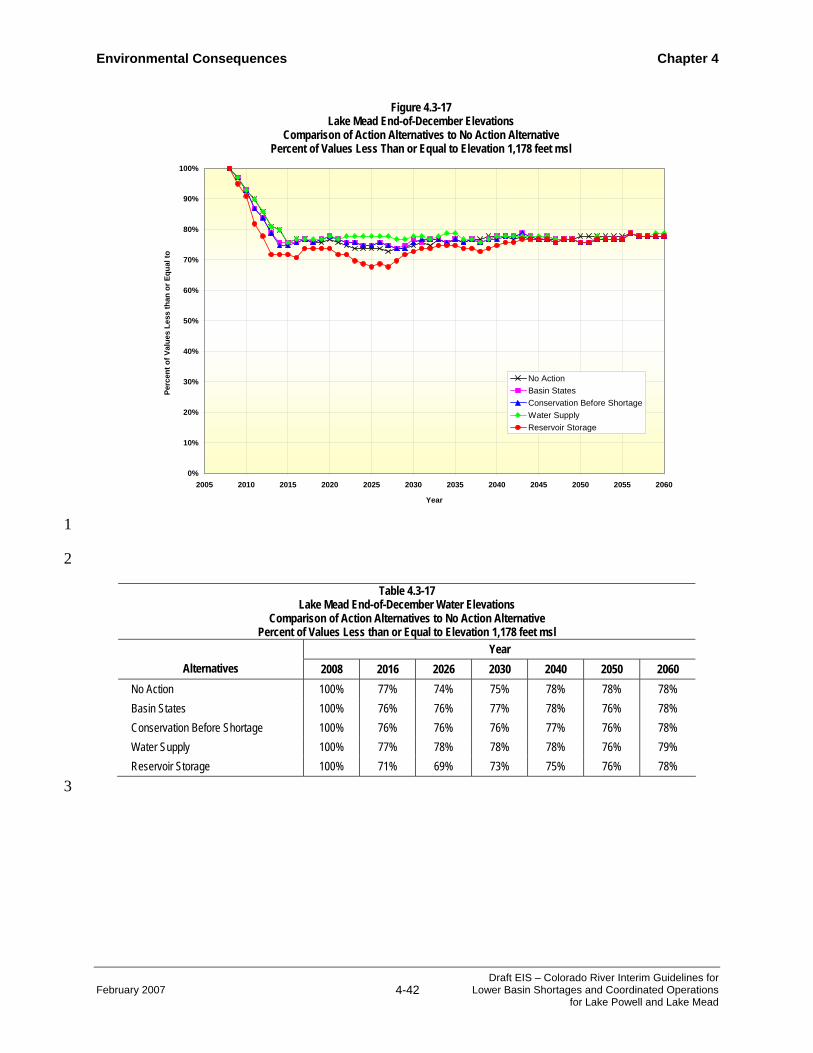
Environmental Consequences Chapter 4
February 2007 4-42 Draft EIS – Colorado River Interim Guidelines for
Lower Basin Shortages and Coordinated Operations for Lake Powell and Lake Mead
1
2
Table 4.3-17 Lake Mead End-of-December Water Elevations
Comparison of Action Alternatives to No Action Alternative Percent of Values Less than or Equal to Elevation 1,178 feet msl
Year Alternatives 2008 2016 2026 2030 2040 2050 2060
No Action 100% 77% 74% 75% 78% 78% 78% Basin States 100% 76% 76% 77% 78% 76% 78% Conservation Before Shortage 100% 76% 76% 76% 77% 76% 78% Water Supply 100% 77% 78% 78% 78% 76% 79% Reservoir Storage 100% 71% 69% 73% 75% 76% 78%
3
Figure 4.3-17 Lake Mead End-of-December Elevations
Comparison of Action Alternatives to No Action Alternative Percent of Values Less Than or Equal to Elevation 1,178 feet msl
0%
10%
20%
30%
40%
50%
60%
70%
80%
90%
100%
2005 2010 2015 2020 2025 2030 2035 2040 2045 2050 2055 2060
Year
Perc
ent o
f Val
ues
Less
than
or E
qual
to
No ActionBasin StatesConservation Before ShortageWater SupplyReservoir Storage

Chapter 4 Environmental Consequences
Draft EIS – Colorado River Interim Guidelines for Lower Basin Shortages and Coordinated Operations for Lake Powell and Lake Mead
4-43 February 2007
Figure 4.3-18 illustrates the frequency that future Lake Mead end-of-July elevations would 1 drop below elevation 1,175 feet msl. Below this elevation, the Pearce Bay Launch Ramp is 2 closed and whitewater boaters must paddle an additional 16 miles to South Cove. As 3 illustrated in Figure 4.3-18, the results for the Basin States, Conservation Before Shortage, 4 and Water Supply alternatives are similar to those of the No Action Alternative. The water 5 levels under the Reservoir Storage Alternative were observed to fall below elevation 1,175 6 feet msl less frequently than those under the No Action Alternative. 7
8
Table 4.3-18 provides a summary of the results illustrated in Figure 4.3-18 for elevation 9 1,175 feet msl for selected years. As shown in Table 4.3-18, the water levels under the Basin 10 States, Conservation Before Shortage, and Water Supply alternatives are similar to those 11 under the No Action Alternative. The water levels under the Reservoir Storage Alternative 12 fell below elevation 1,175 feet msl less frequently than those under the No Action 13 Alternative through about 2040. 14
Figure 4.3-18 Lake Mead End-of-July Elevations
Comparison of Action Alternatives to No Action Alternative Percent of Values Less Than or Equal to Elevation 1,175 feet msl
0%
10%
20%
30%
40%
50%
60%
70%
80%
90%
100%
2005 2010 2015 2020 2025 2030 2035 2040 2045 2050 2055 2060Year
Perc
ent o
f Val
ues
Less
than
or E
qual
to
No ActionBasin StatesConservation Before ShortageWater SupplyReservoir Storage

Environmental Consequences Chapter 4
February 2007 4-44 Draft EIS – Colorado River Interim Guidelines for
Lower Basin Shortages and Coordinated Operations for Lake Powell and Lake Mead
1 Table 4.3-18
Lake Mead End-of-July Elevations Comparison of Action Alternatives to No Action Alternative
Percent of Values Less Than or Equal to Elevation 1,175 feet msl
Year Alternatives 2008 2016 2026 2030 2040 2050 2060
No Action 100% 77% 76% 76% 78% 78% 80% Basin States 100% 76% 76% 77% 78% 78% 80% Conservation Before Shortage 100% 76% 77% 77% 78% 78% 80% Water Supply 100% 77% 78% 77% 80% 78% 80% Reservoir Storage 100% 71% 68% 72% 76% 77% 80%
2
Figure 4.3-19 illustrates the frequency that Lake Mead end-of-July elevations would fall 3 below elevation 1,170 feet msl. This Lake Mead elevation is the minimum water level 4 needed to maintain navigation between Grand Wash and Pearce Ferry. At water levels below 5 1,170 feet msl, potential sediment aggradation could potentially impair navigation between 6 these two locations. As illustrated in Figure 4.3-19, the results for the Basin States and 7 Conservation Before Shortage alternatives are similar to those observed under the No Action 8 Alternative. The water levels under the Water Supply alternative were observed to fall below 9 elevation 1,170 feet msl more frequently than those under the No Action Alternative between 10 2019 and 2033. The water levels under the Reservoir Storage Alternative were observed to 11 fall below elevation 1,170 feet msl less frequently than those under the No Action 12 Alternative. 13
Table 4.3-19 provides a summary of the results illustrated in Figure 4.3-19 for the Lake 14 Mead end-of-July elevation of 1,170 feet msl for selected years. 15

Chapter 4 Environmental Consequences
Draft EIS – Colorado River Interim Guidelines for Lower Basin Shortages and Coordinated Operations for Lake Powell and Lake Mead
4-45 February 2007
1
2
Table 4.3-19 Lake Mead End-of- July Elevations
Comparison of Action Alternatives to No Action Alternative Percent of Values Less Than or Equal to Elevation 1,170 feet msl
Year Alternatives 2008 2016 2026 2030 2040 2050 2060
No Action 100% 76% 74% 73% 76% 77% 78% Basin States 100% 75% 73% 75% 77% 75% 78% Conservation Before Shortage 100% 75% 73% 75% 77% 75% 78% Water Supply 100% 76% 77% 77% 77% 76% 78% Reservoir Storage 100% 69% 65% 71% 76% 74% 78%
3
Figure 4.3-19 Lake Mead End-of-July Elevations
Comparison of Action Alternatives to No Action Alternative Percent of Values Less Than or Equal to Elevation 1,170 feet msl
0%
10%
20%
30%
40%
50%
60%
70%
80%
90%
100%
2005 2010 2015 2020 2025 2030 2035 2040 2045 2050 2055 2060
Year
Perc
ent o
f Val
ues
Less
than
or E
qual
to
No ActionBasin StatesConservation Before ShortageWater SupplyReservoir Storage
\

Environmental Consequences Chapter 4
February 2007 4-46 Draft EIS – Colorado River Interim Guidelines for
Lower Basin Shortages and Coordinated Operations for Lake Powell and Lake Mead
Figure 4.3-20 illustrates the frequency that Lake Mead end-of-July elevations fall below 1 elevation 1,125 feet msl. At lake elevations lower than 1,125 feet msl, the Overton Beach 2 Marina, Callville Ramp, and South Cove Ramp are closed. As illustrated in Figure 4.3-20, 3 the frequency that elevations fall below elevation 1,125 feet msl for the Basin States and 4 Conservation Before Shortage alternatives are similar to those observed under the No Action 5 Alternative. The water levels under the Water Supply Alternative were observed to fall below 6 elevation 1,125 feet msl more frequently than those under the No Action alternative between 7 2008 and 2035. The water levels under the Reservoir Storage Alternative were observed to 8 fall below elevation 1,125 feet msl less frequently than those under the No Action 9 Alternative between 2010 and 2037. 10
11
Table 4.3-20 provides a summary of the results for the Lake Mead end-of-July elevation of 12 1,125 feet msl for selected years. 13
Figure 4.3-20 Lake Mead End-of-July Elevations
Comparison of Action Alternatives to No Action Alternative Percent of Values Less Than or Equal to Elevation 1,125 feet msl
0%
10%
20%
30%
40%
50%
60%
70%
80%
90%
100%
2005 2010 2015 2020 2025 2030 2035 2040 2045 2050 2055 2060Year
Perc
ent o
f Val
ues
Less
than
or E
qual
to
No ActionBasin StatesConservation Before ShortageWater SupplyReservoir Storage
\

Chapter 4 Environmental Consequences
Draft EIS – Colorado River Interim Guidelines for Lower Basin Shortages and Coordinated Operations for Lake Powell and Lake Mead
4-47 February 2007
1 Table 4.3-20
Lake Mead End-of-July Elevations Comparison of Action Alternatives to No Action Alternative
Percent of Values Less Than or Equal to Elevation 1,125 feet msl
Year Alternatives 2008 2016 2026 2030 2040 2050 2060
No Action 80% 63% 55% 56% 56% 60% 60% Basin States 76% 61% 57% 57% 55% 59% 60% Conservation Before Shortage 75% 61% 57% 57% 55% 59% 60% Water Supply 80% 63% 63% 58% 58% 59% 60% Reservoir Storage 75% 51% 52% 52% 54% 59% 60%
2
Figure 4.3-21 illustrates the frequency that Lake Mead end-of-July elevations would fall 3 below elevation 1,080 feet msl. At lake elevations below 1,080 feet msl, the operations at the 4 Lake Mead Marina Public Launch Ramp, Hemenway Public Launch Ramp, and Temple Bar 5 Public Launch Ramp could potentially be affected. As illustrated in Figure 4.3-21, the 6 Reservoir Storage Alternative was observed to fall below elevation 1,080 feet msl less 7 frequently than under the No Action Alternative between 2010 and 2045. The water levels 8 under the Basin States and Conservation Before Shortage alternatives were observed to fall 9 below elevation 1,080 feet msl slightly less frequently than those under the No Action 10 Alternative between 2013 and 2023 and then slightly more frequently between 2023 and 11 2038. The water levels under the Water Supply Alternative were observed to fall below 12 elevation 1,080 feet msl more frequently than those under the No Action Alternative between 13 2012 and 2040. 14
Table 4.3-21 provides a summary of the results for the Lake Mead-end-of-July elevation of 15 1,080 feet msl for selected years. As shown in Table 4.3-21, the action alternatives vary from 16 the No Action Alternative mostly between years 2016 and 2030 and are similar in subsequent 17 years. 18

Environmental Consequences Chapter 4
February 2007 4-48 Draft EIS – Colorado River Interim Guidelines for
Lower Basin Shortages and Coordinated Operations for Lake Powell and Lake Mead
1
2
Table 4.3-21 Lake Mead End-of-July Elevations
Comparison of Action Alternatives to No Action Alternative Percent of Values Less Than or Equal to Elevation 1,080 feet msl
Year Alternatives 2008 2016 2026 2030 2040 2050 2060
No Action 0% 40% 43% 42% 39% 41% 41% Basin States 0% 34% 44% 46% 40% 41% 43% Conservation Before Shortage 0% 34% 44% 46% 40% 41% 43% Water Supply 0% 40% 48% 47% 40% 41% 42% Reservoir Storage 0% 19% 22% 28% 38% 41% 42%
3
Figure 4.3-21 Lake Mead End-of-July Elevations
Comparison of Action Alternatives to No Action Alternative Percent of Values Less Than or Equal to Elevation 1,080 feet msl
0%
10%
20%
30%
40%
50%
60%
70%
80%
90%
100%
2005 2010 2015 2020 2025 2030 2035 2040 2045 2050 2055 2060Year
Perc
ent o
f Val
ues
Less
than
or E
qual
to
No ActionBasin StatesConservation Before ShortageWater SupplyReservoir Storage

Chapter 4 Environmental Consequences
Draft EIS – Colorado River Interim Guidelines for Lower Basin Shortages and Coordinated Operations for Lake Powell and Lake Mead
4-49 February 2007
Figure 4.3-22 illustrates the frequency that Lake Mead end-of-July elevations would fall 1 below elevation 1,050 feet msl. The Lake Mead elevation of 1,050 feet msl is the minimum 2 elevation needed for efficient power generation at the Hoover Powerplant, the minimum 3 elevation for operation of the upper intake of the SNWA and the minimum elevation for the 4 Echo Bay Boat Launch. As illustrated in Figure 4.3-22, the water levels under the Basin 5 States, Conservation Before Shortage, and Water Supply alternatives were observed to fall 6 below elevation 1,050 feet msl less frequently than those under the No Action Alternative 7 from 2016 through 2027. The water levels under the Reservoir Storage Alternative were 8 observed to fall below elevation 1,050 feet msl less frequently than those under the No 9 Action Alternative (lower by as much as 10 to 20 percent), reflecting higher reservoir 10 elevations. 11
12
Figure 4.3-22 Lake Mead End-of-July Elevations
Comparison of Action Alternatives to No Action Alternative Percent of Values Less Than or Equal to Elevation 1,050 feet msl
0%
10%
20%
30%
40%
50%
60%
70%
80%
90%
100%
2005 2010 2015 2020 2025 2030 2035 2040 2045 2050 2055 2060Year
Perc
ent o
f Val
ues
Less
Tha
n or
Equ
al T
o
No ActionBasin StatesConservation Before Shortage Water SupplyReservoir Storage

Environmental Consequences Chapter 4
February 2007 4-50 Draft EIS – Colorado River Interim Guidelines for
Lower Basin Shortages and Coordinated Operations for Lake Powell and Lake Mead
Table 4.3-22 provides a summary of the results illustrated in Figure 4.3-22 for the Lake 1 Mead end-of-July elevation of 1,050 feet msl for selected years. 2
Table 4.3-22 Lake Mead End-of-July Elevations
Comparison of Action Alternatives to No Action Alternative Percent of Values Less Than or Equal to Elevation 1,050 feet msl
Year Alternatives 2008 2016 2026 2030 2040 2050 2060
No Action 0% 10% 26% 26% 27% 28% 36% Basin States 0% 9% 20% 26% 28% 30% 36% Conservation Before Shortage 0% 10% 20% 27% 28% 29% 36% Water Supply 0% 9% 21% 37% 30% 30% 36% Reservoir Storage 0% 2% 4% 11% 21% 27% 36%
3
Figure 4.3-23 illustrates the frequency that Lake Mead end-of-July elevations would fall 4 below elevation 1,000 feet msl. The Lake Mead elevation of 1,000 feet msl is the minimum 5 elevation needed by the SNWA to pump water from Lake Mead through its lower intake. As 6 illustrated in Figure 4.3-23, the Lake Mead end-of-July water levels under the No Action, 7 Conservation Before Shortage, and Reservoir Storage alternatives do not fall below elevation 8 1,000 feet msl. The water levels under the Water Supply and Basin States alternatives do 9 show some instances where the water levels fall below 1,000 feet msl, although the 10 frequency and probability are low. The maximum observed probability for elevations falling 11 below 1,000 feet msl under the Water Supply Alternative is six percent and occurs towards 12 the end of the interim period. Under the Basin States Alternative, the maximum observed 13 probability for elevations falling below 1,000 feet msl is two percent and also occurs toward 14 the end of the interim period. 15
Table 4.3-23 provides a summary of the results illustrated in Figure 4.3-23 for the Lake 16 Mead end-of-July elevation of 1,000 feet msl for selected years. The Water Supply and Basin 17 States alternatives are the only alternatives that show instances where the water levels fall 18 below elevation 1,000 feet msl, and they occur in year 2026. 19

Chapter 4 Environmental Consequences
Draft EIS – Colorado River Interim Guidelines for Lower Basin Shortages and Coordinated Operations for Lake Powell and Lake Mead
4-51 February 2007
1
Table 4.3-23 Lake Mead End-of-July Elevations
Comparison of Action Alternatives to No Action Alternative Percent of Values Less Than or Equal to Elevation 1,000 feet msl
Year Alternatives 2008 2016 2026 2030 2040 2050 2060
No Action 0% 0% 0% 0% 0% 0% 0% Basin States 0% 0% 2% 0% 0% 0% 0% Conservation Before Shortage 0% 0% 0% 0% 0% 0% 0% Water Supply 0% 0% 6% 0% 0% 0% 0% Reservoir Storage 0% 0% 0% 0% 0% 0% 0%
2
Figure 4.3-24 illustrates the minimum Lake Mead end-of-July elevations that were observed 3 in the modeling of the action alternatives and No Action Alternative during the period of 4 analysis (2008 through 2060). The minimum lake elevations under the No Action Alternative 5 never fall below Lake Mead elevation 1,000 feet msl throughout the period of analysis. 6 Similarly, the minimum lake elevations under the Basin States, Conservation Before 7 Shortage, and Reservoir Storage alternatives never fall below Lake Mead elevation 1,000 feet 8
Figure 4.3-23 Lake Mead End-of-July Elevations
Comparison of Action Alternatives to No Action Alternative Percent of Values Less Than or Equal to Elevation 1,000 feet msl
0%
10%
20%
30%
40%
50%
60%
70%
80%
90%
100%
2005 2010 2015 2020 2025 2030 2035 2040 2045 2050 2055 2060
Year
Perc
ent o
f Val
ues
Less
than
or E
qual
to
No ActionBasin StatesConservation Before ShortageWater SupplyReservoir Storage

Environmental Consequences Chapter 4
February 2007 4-52 Draft EIS – Colorado River Interim Guidelines for
Lower Basin Shortages and Coordinated Operations for Lake Powell and Lake Mead
msl throughout the period of analysis. The minimum lake elevations under the Reservoir 1 Storage Alternative are generally higher than those observed under the No Action 2 Alternative. The minimum lake elevations under the Water Supply Alternative are generally 3 lower than those observed under the No Action Alternative and fall below Lake Mead 4 elevation 1,000 feet msl during the interim period. The minimum Lake Mead end-of-July 5 elevation values under the action alternatives and the No Action Alternative all converge 6 between 2027 through 2030 and generally remain at about 1,000 feet msl after 2030. 7
8
Table 4.3-24 provides a summary of the results illustrated in Figure 4.3-24 for the Lake 9 Mead end-of-July minimum elevations. As shown on this table, the greatest variability 10 between the action alternatives and the No Action Alternative occurs during the interim 11 period. The Lake Mead elevations fall below elevation 1,000 feet msl under the Water 12 Supply Alternative only. 13
Figure 4.3-24 Lake Mead End-of-July Elevations
Comparison of Action Alternatives to No Action Alternative Minimum Water Elevation Values (feet msl)
900
925
950
975
1,000
1,025
1,050
1,075
1,100
1,125
1,150
1,175
1,200
1,225
2005 2010 2015 2020 2025 2030 2035 2040 2045 2050 2055 2060Year
Wat
er S
urfa
ce E
leva
tion
(feet
msl
)
No Action
Basin States
Conservation Before Shortage
Water Supply
Reservoir Storage

Chapter 4 Environmental Consequences
Draft EIS – Colorado River Interim Guidelines for Lower Basin Shortages and Coordinated Operations for Lake Powell and Lake Mead
4-53 February 2007
1 Table 4.3-24
Lake Mead End-of-December Elevations Comparison of Action Alternatives to No Action Alternative
Minimum Elevation Values (feet msl)
Year Alternatives 2008 2016 2026 2030 2040 2050 2060
No Action 1,097.1 1,004.7 1,000.9 1,000.9 1,000.9 1,000.9 1,000.9 Basin States 1,095.7 1,011.3 995.0 1,000.9 1,000.9 1,000.9 1,000.9 Conservation Before Shortage 1,096.3 1,008.2 1,003.5 1,000.9 1,000.9 1,001.1 1,000.9 Water Supply 1,092.9 1,023.4 982.5 1,000.9 1,000.9 1,000.9 1,000.9 Reservoir Storage 1,098.8 1,028.0 1,033.2 1,004.2 1,000.9 1,000.9 1,000.9
2
4.3.4.1 Storage of Conserved Water in Lake Mead 3 One of the elements of the proposed federal action is a mechanism for the storage and 4 delivery of conserved water and non-system waters in Lake Mead. The general concept 5 of this proposed program is that water users would conserve water or secure non-system 6 water which could then be stored in Lake Mead. One of the potential effects of this 7 alternative is an increase in the amount of water that would remain in storage in Lake 8 Mead. The three alternatives that include some form of the storage and delivery 9 mechanism are the Basin States, Conservation Before Shortage, and Reservoir Storage 10 alternatives. The modeling results discussed previously for the Basin States, Conservation 11 Before Shortage, and Reservoir Storage alternatives all include the storage and delivery 12 mechanism. The specific assumptions with respect to the storage and delivery mechanism 13 considered and modeled under each of these alternatives are discussed in Section 4.2 and 14 Appendix M. 15
A simulation was performed for each of these alternatives to isolate the effects of the 16 storage and delivery mechanism on the behavior of the system. This was accomplished 17 by holding all other assumptions constant and removing the storage and delivery 18 mechanism. Figure 4.3-25 presents a comparison of the 90th, 50th, and 10th percentile 19 values observed for the action alternatives to those under the No Action Alternative. This 20 figure illustrates the Lake Mead elevations for the Basin States, Conservation Before 21 Shortage, and Reservoir Storage alternatives if the storage and delivery mechanism is not 22 in place. The Lake Mead elevations illustrated in Figure 4.3-25 for these alternatives can 23 be contrasted to those shown in Figure 4.3-15 which shows the Lake Mead elevations for 24 these alternatives if the storage and delivery mechanism is in place. As illustrated by this 25 comparison, the inclusion of mechanism in these alternatives would have a tendency to 26 provide higher Lake Mead elevations and also changes the relative difference of these 27 alternatives to the No Action Alternative. 28
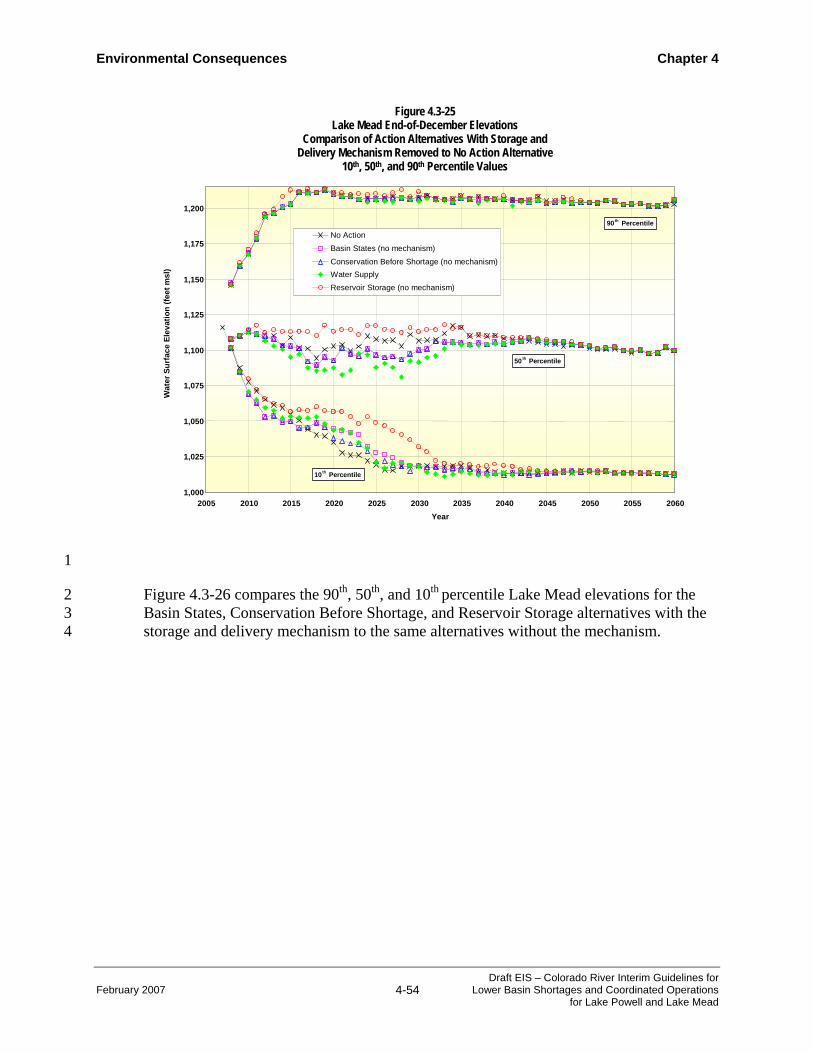
Environmental Consequences Chapter 4
February 2007 4-54 Draft EIS – Colorado River Interim Guidelines for
Lower Basin Shortages and Coordinated Operations for Lake Powell and Lake Mead
1
Figure 4.3-26 compares the 90th, 50th, and 10th percentile Lake Mead elevations for the 2 Basin States, Conservation Before Shortage, and Reservoir Storage alternatives with the 3 storage and delivery mechanism to the same alternatives without the mechanism. 4
Figure 4.3-25 Lake Mead End-of-December Elevations
Comparison of Action Alternatives With Storage and Delivery Mechanism Removed to No Action Alternative
10th, 50th, and 90th Percentile Values
1,000
1,025
1,050
1,075
1,100
1,125
1,150
1,175
1,200
2005 2010 2015 2020 2025 2030 2035 2040 2045 2050 2055 2060Year
Wat
er S
urfa
ce E
leva
tion
(feet
msl
)
No ActionBasin States (no mechanism)
Conservation Before Shortage (no mechanism)Water SupplyReservoir Storage (no mechanism)
10 th Percentile
50th Percentile
90 th Percentile

Chapter 4 Environmental Consequences
Draft EIS – Colorado River Interim Guidelines for Lower Basin Shortages and Coordinated Operations for Lake Powell and Lake Mead
4-55 February 2007
Table 4.3 25 provides a summary of the increases in Lake Mead elevations for selected 1 years that can be attributed to the inclusion of the storage and delivery mechanism in the 2 Basin States, Conservation Before Shortage, and Reservoir Storage alternatives. As 3 shown on this figure and table, for the 50th and 10th percentile values, the storage and 4 delivery mechanism could potentially provide higher Lake Mead elevations, by as much 5 as 17.8 feet under the Reservoir Storage Alternative, 11.6 feet under the Conservation 6 Before Shortage Alternative, and nearly ten feet under the Basin States Alternative. 7
Table 4.3-25 Increase / Decrease ( ) in Lake Mead Elevations (feet msl) Resulting From a Storage and Delivery Mechanism
Comparison of Action Alternatives With and Without a Storage and Delivery Mechanism 90th, 50th, and 10th Percentile Values
Basin States Conservation Before Shortage Reservoir Storage
Year 90th
Percentile 50th
Percentile 10th
Percentile 90th
Percentile 50th
Percentile 10th
Percentile 90th
Percentile 50th
Percentile 10th
Percentile
2008 2.4 2.7 1.3 3.0 3.7 2.4 4.0 5.5 4.2 2016 (0.6) 9.9 5.7 0.1 11.6 5.1 1.9 16.5 14.8 2026 0.2 0.5 3.8 0.2 2.3 5.4 5.5 17.8 15.9 2030 0.2 1.3 0.1 0.2 3.3 1.8 1.9 9.8 17.6 2040 0.7 1.3 1.3 0.1 1.6 0.7 0.8 4.5 0.7 2050 0.4 (0.5) 0.1 0.4 (0.5) (1.8) 0.4 0.8 3.8 2060 0.2 1.1 0.5 0.2 1.1 0.4 0.2 2.1 0.3
8
Figure 4.3-26 Lake Mead End-of-December Elevations
Comparison of Action Alternatives With and Without a Storage and Delivery Mechanism 10th, 50th, and 90th Percentile Values
1,000
1,025
1,050
1,075
1,100
1,125
1,150
1,175
1,200
1,225
2005 2010 2015 2020 2025 2030 2035 2040 2045 2050 2055 2060Year
Wat
er S
urfa
ce E
leva
tion
(feet
msl
)
Basin StatesConservation Before ShortageReservoir StorageBasin States (no mechanism) Conservation Before Shortage (no mechanism)Reservoir Storage (no mechanism)
10th Percentile
50th Percentile
90 th Percentile

Environmental Consequences Chapter 4
February 2007 4-56 Draft EIS – Colorado River Interim Guidelines for
Lower Basin Shortages and Coordinated Operations for Lake Powell and Lake Mead
4.3.5 Hoover Dam to Davis Dam 1 The river flows between Hoover Dam and Lake Mohave are comprised mainly of releases 2 from Hoover Dam (Lake Mead) and tributary inflows. These inflows, mostly from side 3 washes, comprise less than one percent of the total annual flow in this reach. During the 10-4 year period between 1996 and 2005, the annual Hoover Dam releases have ranged between 5 8.274 maf and 12.774 maf and averaged 10.415 maf. 6
As noted in Section 3.3, future annual and monthly releases may be affected by the proposed 7 federal action. Each alternative may alter the probability (when compared to the No Action 8 Alternative) of the magnitude and timing of particular releases. However, as expressed in 9 Section 3.3, due to the presence of Lake Mohave immediately downstream, these potential 10 changes in releases will have an effect only on hydropower generation. 11
Figure 4.3-27 presents a comparison of the 90th, 50th, and 10th percentile values observed 12 under the No Action and action alternatives for Hoover Dam annual (calendar year) releases. 13 The greatest variability between the action alternatives and No Action Alternative generally 14 occurs during the period between 2008 and 2026. Also, the greatest variability occurs 15 between the Reservoir Storage Alternative and No Action Alternative and is consistent with 16 the underlying strategy of the Reservoir Storage Alternative which is to maintain more water 17 in storage. This is facilitated through more frequent voluntary and involuntary delivery 18 reductions and is reflected in the 50th and 10th percentile values which are lower for this 19 alternative between 2008 and 2026. Since more water is held in storage, as compared to the 20 No Action Alternative, the Reservoir Storage Alternative provides more opportunities for 21 more frequent and higher flood/surplus releases, which is reflected in the 90th percentile 22 values for this alternative. In contrast, the strategy of the Water Supply Alternative is to meet 23 the water users’ delivery requirements with less regard to preserving water in storage. As 24 such, the 50th and 10th percentile values under the Water Supply Alternative show that more 25 water is delivered under this alternative between 2008 and 2026, as compared to the No 26 Action Alternative. The range of water releases that occur under the Basin States and 27 Conservation Before Shortage alternatives generally coincides with the range of releases 28 under the No Action Alternative. 29
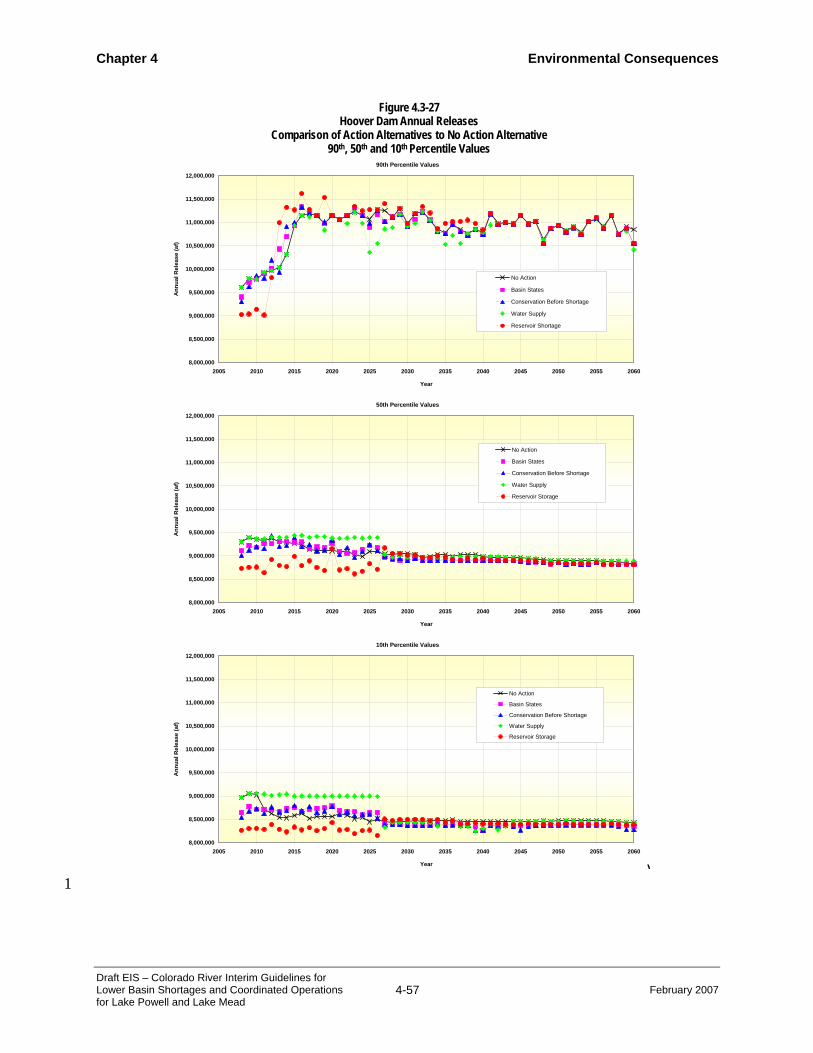
Chapter 4 Environmental Consequences
Draft EIS – Colorado River Interim Guidelines for Lower Basin Shortages and Coordinated Operations for Lake Powell and Lake Mead
4-57 February 2007
1
Figure 4.3-27 Hoover Dam Annual Releases
Comparison of Action Alternatives to No Action Alternative 90th, 50th and 10th Percentile Values
90th Percentile Values
8,000,000
8,500,000
9,000,000
9,500,000
10,000,000
10,500,000
11,000,000
11,500,000
12,000,000
2005 2010 2015 2020 2025 2030 2035 2040 2045 2050 2055 2060
Year
Ann
ual R
elea
se (a
f)
No Action
Basin States
Conservation Before Shortage
Water Supply
Reservoir Shortage
50th Percentile Values
8,000,000
8,500,000
9,000,000
9,500,000
10,000,000
10,500,000
11,000,000
11,500,000
12,000,000
2005 2010 2015 2020 2025 2030 2035 2040 2045 2050 2055 2060
Year
Ann
ual R
elea
se (a
f)
No Action
Basin States
Conservation Before Shortage
Water Supply
Reservoir Storage
10th Percentile Values
8,000,000
8,500,000
9,000,000
9,500,000
10,000,000
10,500,000
11,000,000
11,500,000
12,000,000
2005 2010 2015 2020 2025 2030 2035 2040 2045 2050 2055 2060
Year
Ann
ual R
elea
se (a
f)
No Action
Basin States
Conservation Before Shortage
Water Supply
Reservoir Storage
\

Environmental Consequences Chapter 4
February 2007 4-58 Draft EIS – Colorado River Interim Guidelines for
Lower Basin Shortages and Coordinated Operations for Lake Powell and Lake Mead
Another observation relates to the 50th and 10th percentile annual Hoover Dam release 1 volumes that are consistently lower under the Basin States, Conservation Before Shortage, 2 and Reservoir Storage alternatives as compared to the No Action Alternative after 2026. This 3 difference can be attributed to the assumption that SNWA would develop additional 4 permanent non-system water supplies. 5
Figure 4.3-28 illustrates the cumulative distribution of Hoover Dam annual releases under the 6 No Action and action alternatives for years 2008 through 2060. The observed annual releases 7 under all the alternatives (including the No Action Alternative) fluctuate between 7.45 maf to 8 about 17.3 maf. The lowest minimum annual release is 6.73 maf and occurs under the Water 9 Supply Alternative, although it only occurs about one percent of the time. 10
11
Table 4.3-26 provides a summary of the distribution of the Hoover Dam releases within 12 different flow ranges of interest. As shown on this table, the Hoover Dam releases in the 13 range identified as typical under Normal conditions (i.e. 8.5 mafy to 9.5 mafy) are similar 14 under all the alternatives. The greatest variability between the action alternatives and the No 15 Action Alternative occurs in the frequency of releases that are greater than 9.5 mafy and 16 those between 7.50 and 8.49 mafy. 17
Figure 4.3-28 Hoover Dam Annual Releases
Comparison of Action Alternatives to No Action Alternative Years 2008 through 2060
6,000,000
7,000,000
8,000,000
9,000,000
10,000,000
11,000,000
12,000,000
13,000,000
14,000,000
15,000,000
16,000,000
17,000,000
18,000,000
19,000,000
20,000,000
0% 10% 20% 30% 40% 50% 60% 70% 80% 90% 100%
Percent of Values Greater than or Equal to
Ann
ual R
elea
se (a
f)
No ActionBasin StatesConservation Before ShortageWater SupplyReservoir Storage

Chapter 4 Environmental Consequences
Draft EIS – Colorado River Interim Guidelines for Lower Basin Shortages and Coordinated Operations for Lake Powell and Lake Mead
4-59 February 2007
1 Table 4.3-26
Hoover Dam Annual Releases Probability of Occurrence of Different Annual Release Volumes
Comparison of Action Alternatives to No Action Alternative Calendar Years 2008 through 2060
Alternative
Hoover Dam Release Volumes No Action Basin States
Conservation Before Shortage
Water Supply
Reservoir Storage
Greater than 9.50 mafy 20.2% 18.0% 18.0% 22.5% 14.6% Between 8.50 to 9.50 mafy 68.6% 68.6% 66.3% 67.5% 65.2% Between 7.50 to 8.49 mafy 10.1% 12.4% 14.6% 9.0% 19.1% Less than 7.5 mafy 1.0% 1.0% 1.0% 1.0% 1.0%
Total 100.0% 100.0% 100.0% 100.0% 100.0% 2
4.3.5.1 Lake Mohave Water Levels 3 Lake Mohave is operated under a rule curve that provides specific “target elevations” at 4 the end of each month (Section 3.3). The same rule curve would be used and applied in 5 the future operations under the No Action Alternative and the action alternatives. 6 Therefore, end-of-month elevations in Lake Mohave are not affected by the proposed 7 federal action. 8
4.3.6 Davis Dam to Parker Dam 9 10
4.3.6.1 River Flows 11 The flows between Davis Dam and Parker Dam are comprised mainly of releases from 12 Davis Dam (Lake Mohave) and tributary inflows from the Bill Williams River. During 13 the 10-year period between 1996 and 2005, the annual Davis Dam releases have ranged 14 between 8.1 maf and 12.6 maf and averaged 10.2 maf. Releases greater than 9.5 maf 15 generally correspond to years when surplus or flood flow releases are made at Hoover 16 Dam and are passed through Lake Mohave. Flows less than 8.5 maf are associated with 17 voluntary or involuntary delivery reductions to water users in the Lower Basin. 18
Figure 4.3-29 presents a comparison of the 90th, 50th, and 10th percentile values observed 19 for the action alternatives to those under the No Action Alternative. The values and 20 variability of the 90th, 50th, and 10th percentile values under the No Action Alternative and 21 action alternatives are similar to those in Figure 4.3-27 (Hoover Dam releases) because 22 the releases from Hoover Dam are passed through Lake Mohave. The differences are 23 losses that are attributed to evaporation at Lake Mohave, which would be the same in all 24 of the alternatives due to rule curve operations. 25

Environmental Consequences Chapter 4
February 2007 4-60 Draft EIS – Colorado River Interim Guidelines for
Lower Basin Shortages and Coordinated Operations for Lake Powell and Lake Mead
1
Figure 4.3-29 Davis Dam Annual Releases
Comparison of Action Alternatives to No Action Alternative 90th, 50th, and 10th Percentile Values
90th Percentile Values
8,000,000
8,500,000
9,000,000
9,500,000
10,000,000
10,500,000
11,000,000
11,500,000
12,000,000
2005 2010 2015 2020 2025 2030 2035 2040 2045 2050 2055 2060
Year
Ann
ual R
elea
se (a
f)
No Action
Basin States
Conservation Before Shortage
Water Supply
Reservoir Storage
50th Percentile Values
8,000,000
8,500,000
9,000,000
9,500,000
10,000,000
10,500,000
11,000,000
11,500,000
12,000,000
2005 2010 2015 2020 2025 2030 2035 2040 2045 2050 2055 2060
Year
Ann
ual R
elea
se (a
f)
No Action
Basin States
Conservation Before Shortage
Water Supply
Reservoir Storage
10th Percentile Values
8,000,000
8,500,000
9,000,000
9,500,000
10,000,000
10,500,000
11,000,000
11,500,000
12,000,000
2005 2010 2015 2020 2025 2030 2035 2040 2045 2050 2055 2060
Year
Ann
ual R
elea
se (a
f)
No Action
Basin States
Conservation Before Shortage
Water Supply
Reservoir Storage
\

Chapter 4 Environmental Consequences
Draft EIS – Colorado River Interim Guidelines for Lower Basin Shortages and Coordinated Operations for Lake Powell and Lake Mead
4-61 February 2007
Figure 4.3-30 illustrates the cumulative distribution of the Davis Dam releases for the No 1 Action Alternative and the action alternatives for the period 2008 through 2060. The 2 range and frequency of the releases under the different alternatives are similar to those 3 shown in Figure 4.3-28. Again, the reason for this is that releases from Hoover Dam are 4 passed through Lake Mohave. 5
6
4.3.6.2 Colorado River Annual Flow Near Havasu NWR 7 A point located immediately downstream of the Havasu NWR was used to further 8 analyze the river flows for this reach. 9
The 90th, 50th, and 10th percentile annual flow volumes at this point are shown in Figure 10 4.3-31. The 90th percentile for the Basin States, Conservation Before Shortage, and Water 11 Supply alternatives were similar to those of the No Action Alternative. However, the 12 values for the Water Supply Alternative periodically fell below those of the No Action 13 Alternative during the period between 2025 through 2039. The 90th percentile values for 14 the Reservoir Storage Alternative fluctuated above and below those of the No Action 15 Alternative from about 2008 to 2019. 16
Figure 4.3-30 Davis Dam Annual Releases
Comparison of Action Alternatives to No Action Alternative Years 2008 through 2060
6,000,000
7,000,000
8,000,000
9,000,000
10,000,000
11,000,000
12,000,000
13,000,000
14,000,000
15,000,000
16,000,000
17,000,000
18,000,000
0% 10% 20% 30% 40% 50% 60% 70% 80% 90% 100%
Percent of Values Greater than or Equal to
Ann
ual R
elea
se (a
f)
No ActionBasin StatesConservation Before ShortageWater SupplyReservoir Storage

Environmental Consequences Chapter 4
February 2007 4-62 Draft EIS – Colorado River Interim Guidelines for
Lower Basin Shortages and Coordinated Operations for Lake Powell and Lake Mead
1
Figure 4.3-31 Colorado River Annual Flow Near Havasu NWR - RM 242.3 (af)
Comparison of Action Alternatives to No Action Alternative 90th, 50th, and 10th Percentile Values
90th Percentile
7,500,000
8,000,000
8,500,000
9,000,000
9,500,000
10,000,000
10,500,000
11,000,000
11,500,000
12,000,000
2005 2010 2015 2020 2025 2030 2035 2040 2045 2050 2055 2060Year
Ann
ual F
low
Vol
ume
(af)
No ActionBasin StatesConservation Before ShortageWater SupplyReservoir Storage
50th Percentile
7,500,000
8,000,000
8,500,000
9,000,000
9,500,000
10,000,000
10,500,000
11,000,000
11,500,000
12,000,000
2005 2010 2015 2020 2025 2030 2035 2040 2045 2050 2055 2060Year
Ann
ual F
low
Vol
ume
(af)
No ActionBasin StatesConservation Before ShortageWater SupplyReservoir Storage
10th Percentile
7,500,000
8,000,000
8,500,000
9,000,000
9,500,000
10,000,000
10,500,000
11,000,000
11,500,000
12,000,000
2005 2010 2015 2020 2025 2030 2035 2040 2045 2050 2055 2060Year
Ann
ual F
low
Vol
ume
(af)
No ActionBasin StatesConservation Before ShortageWater SupplyReservoir Storage

Chapter 4 Environmental Consequences
Draft EIS – Colorado River Interim Guidelines for Lower Basin Shortages and Coordinated Operations for Lake Powell and Lake Mead
4-63 February 2007
The 50th percentile values of the Water Supply Alternative were similar to those under the 1 No Action Alternative for the initial 5 years and then were higher by an average of about 2 250 kafy for the period between 2013 through 2026. This is a direct result of there being 3 essentially no shortages under the Water Supply Alternative during the interim period. 4 The 50th percentile flows of the Basin States and Conservation Before Shortage 5 alternatives were similar to those of the No Action Alternative. The 50th percentile values 6 of the Reservoir Storage Alternative were on average about 450 kaf lower than the No 7 Action Alternative during the interim period (through 2026) and thereafter were similar 8 to those of the No Action Alternative. During the interim period, the Reservoir Storage 9 Alternative maintains more water in storage through more frequent shortages. At the 10th 10 percentile level, although the magnitudes of the annual flows of all the alternatives are 11 generally lower by about 500 kaf, the relative changes in flow volumes of the action 12 alternatives compared to the No Action Alternative are similar to those at the 50th 13 percentile level. 14
Table 4.3-27 provides a comparison of the 90th, 50th, and 10th percentile annual flow 15 volumes between the action alternatives and the No Action Alternative for selected years. 16
Table 4.3-27 Colorado River Annual Flow Near Havasu NWR - RM 242.3 (maf)
Comparison of Action Alternatives to No Action Alternative 90th, 50th, and 10th Percentile Values
Year 2016 Year 2026 Year 2040 Year 2060 Alternative 90th 50th 10th 90th 50th 10th 90th 50th 10th 90th 50th 10th
No Action 11.021 8.992 8.409 11.202 8.822 8.276 10.636 8.770 8.267 10.673 8.716 8.212
Basin States 11.200 9.070 8.467 11.030 8.979 8.404 10.633 8.739 8.129 10.348 8.652 8.167
Conservation Before Shortage 11.212 8.970 8.448 11.144 8.896 8.341 10.633 8.682 8.192 10.348 8.652 8.167
Water Supply 11.021 9.265 8.758 10.166 9.205 8.759 10.636 8.770 8.194 10.278 8.724 8.212
Reservoir Storage 11.443 8.597 8.053 11.228 8.492 8.018 10.677 8.746 8.217 10.348 8.652 8.198
17
4.3.6.3 Groundwater 18 As discussed in Section 3.3, the flows in the Davis Dam to Parker Dam reach are 19 primarily composed of water released from Davis Dam. Therefore, the annual median 20 releases are representative of the annual median flows in the reach. When converted to 21 stage, a comparison of the annual median releases for each alternative may be used as the 22 indicator to analyze potential effects to groundwater adjacent to the river in this reach. 23

Environmental Consequences Chapter 4
February 2007 4-64 Draft EIS – Colorado River Interim Guidelines for
Lower Basin Shortages and Coordinated Operations for Lake Powell and Lake Mead
Figure 4.3-32 illustrates the annual median releases from Davis Dam for each alternative 1 for the years 2008 through 2060. These are the same data shown in Figure 4.3-29 2 converted from acre-feet per year to cubic feet per second. In general, the median releases 3 for the Water Supply and Reservoir Storage alternatives bracket the median releases for 4 the other three alternatives due primarily to the different shortage assumptions for each of 5 the alternatives. Table 4.3-28 compares the annual median values relative to the No 6 Action Alternative for specific years (each action alternative value less the No Action 7 Alternative value). Using appropriate relationships to convert flow-to-stage (LCR MSCP 8 BA, Appendix J, Attachment D), these relative flow differences would result in minor 9 reductions in river stage (on the order of 0.5 feet). Based on the relationships used in the 10 LCR MSCP BA, Appendix K, such river stage reductions would result in corresponding 11 reductions in groundwater elevations adjacent to the river (approximately 0.25 feet to 0.5 12 feet for gaining and losing reaches respectively). 13
14
Figure 4.3-32 Davis Dam Annual Releases
Comparison of Action Alternatives to No Action Alternative Annual Median (50th Percentile) Values (cfs)
11,600
11,800
12,000
12,200
12,400
12,600
12,800
13,000
13,200
2005 2010 2015 2020 2025 2030 2035 2040 2045 2050 2055 2060
Year
Ann
ual R
elea
se (c
fs)
No ActionBasin StatesConservation Before ShortageWater SupplyReservoir Storage
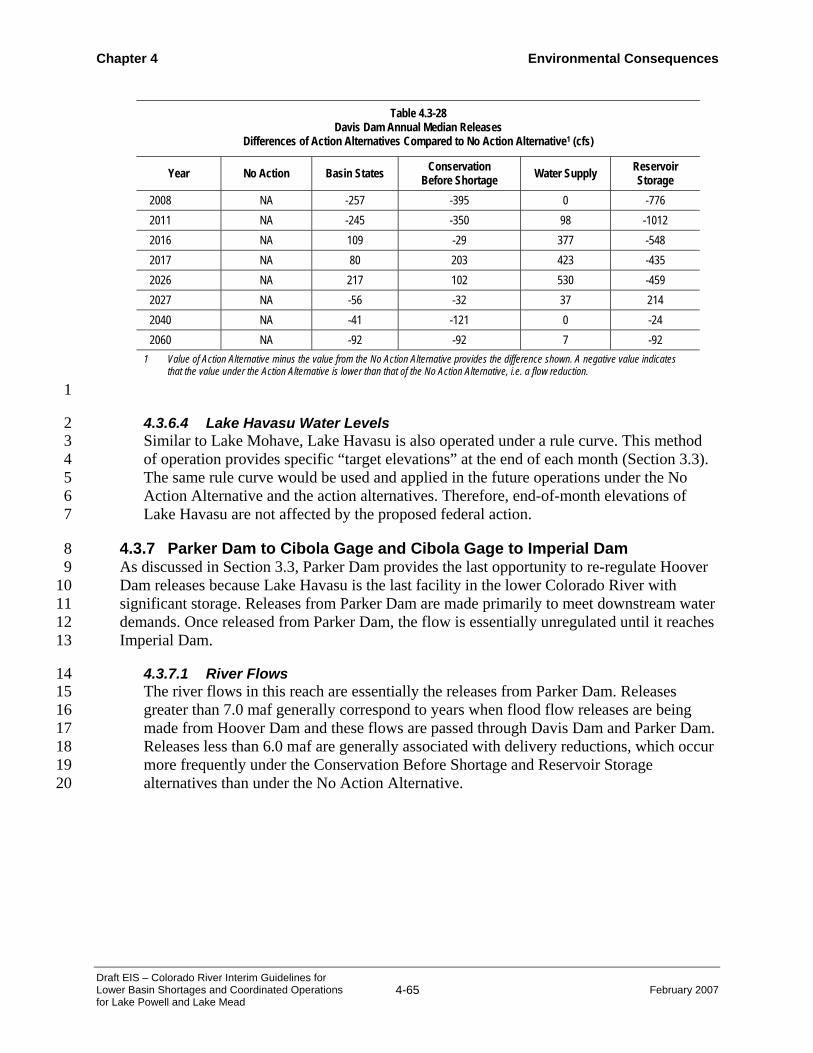
Chapter 4 Environmental Consequences
Draft EIS – Colorado River Interim Guidelines for Lower Basin Shortages and Coordinated Operations for Lake Powell and Lake Mead
4-65 February 2007
Table 4.3-28 Davis Dam Annual Median Releases
Differences of Action Alternatives Compared to No Action Alternative1 (cfs)
Year No Action Basin States Conservation Before Shortage Water Supply Reservoir
Storage 2008 NA -257 -395 0 -776 2011 NA -245 -350 98 -1012 2016 NA 109 -29 377 -548 2017 NA 80 203 423 -435 2026 NA 217 102 530 -459 2027 NA -56 -32 37 214 2040 NA -41 -121 0 -24 2060 NA -92 -92 7 -92
1 Value of Action Alternative minus the value from the No Action Alternative provides the difference shown. A negative value indicates that the value under the Action Alternative is lower than that of the No Action Alternative, i.e. a flow reduction.
1
4.3.6.4 Lake Havasu Water Levels 2 Similar to Lake Mohave, Lake Havasu is also operated under a rule curve. This method 3 of operation provides specific “target elevations” at the end of each month (Section 3.3). 4 The same rule curve would be used and applied in the future operations under the No 5 Action Alternative and the action alternatives. Therefore, end-of-month elevations of 6 Lake Havasu are not affected by the proposed federal action. 7
4.3.7 Parker Dam to Cibola Gage and Cibola Gage to Imperial Dam 8 As discussed in Section 3.3, Parker Dam provides the last opportunity to re-regulate Hoover 9 Dam releases because Lake Havasu is the last facility in the lower Colorado River with 10 significant storage. Releases from Parker Dam are made primarily to meet downstream water 11 demands. Once released from Parker Dam, the flow is essentially unregulated until it reaches 12 Imperial Dam. 13
4.3.7.1 River Flows 14 The river flows in this reach are essentially the releases from Parker Dam. Releases 15 greater than 7.0 maf generally correspond to years when flood flow releases are being 16 made from Hoover Dam and these flows are passed through Davis Dam and Parker Dam. 17 Releases less than 6.0 maf are generally associated with delivery reductions, which occur 18 more frequently under the Conservation Before Shortage and Reservoir Storage 19 alternatives than under the No Action Alternative. 20

Environmental Consequences Chapter 4
February 2007 4-66 Draft EIS – Colorado River Interim Guidelines for
Lower Basin Shortages and Coordinated Operations for Lake Powell and Lake Mead
Figure 4.3-33 presents a comparison of the 90th, 50th, and 10th percentile lines for Parker 1 Dam annual releases under the alternatives. The 90th percentile values represent releases 2 due to flood control operations. The Reservoir Storage Alternative tends to release 3 greater volumes during flood control when compared to the other alternatives since it 4 keeps Lake Mead water levels higher. Beyond year 2045 all flow volumes converged to a 5 release of about 7.40 maf. At the 50th percentile, the Basin States, Conservation Before 6 Shortage and Reservoir Storage alternatives had less release volume than the No Action 7 Alternative until the year 2026. The Water Supply Alternative generally released more 8 volume over that same period. At year 2027, all alternatives converged to about 6.50 maf, 9 with differences due to the assumption that SNWA would develop additional non-system 10 water supplies that are permanent. The comparison of the 10th percentile showed similar 11 results that mirror the 50th percentile values, except the release volumes were about 6.25 12 maf. 13
Figure 4.3-34 illustrates the cumulative distribution for the Parker Dam annual releases 14 for the period of 2008 through 2060. The releases under the No Action Alternative range 15 between 14.0 maf to 5.96 maf. The releases under the Basin States and Water Supply 16 alternatives were similar to those observed under the No Action Alternative. The releases 17 under the Conservation Before Shortage and Reservoir Storage alternatives had the 18 lowest releases, 5.60 and 5.35 maf, respectively. 19

Chapter 4 Environmental Consequences
Draft EIS – Colorado River Interim Guidelines for Lower Basin Shortages and Coordinated Operations for Lake Powell and Lake Mead
4-67 February 2007
1
Figure 4.3-33 Parker Dam Annual Releases
Comparison of Action Alternatives to No Action Alternative 90th, 50th, and 10th Percentile Values
90th Percentile Values
5,500,000
6,000,000
6,500,000
7,000,000
7,500,000
8,000,000
8,500,000
2005 2010 2015 2020 2025 2030 2035 2040 2045 2050 2055 2060
Year
Ann
ual R
elea
se (a
f)
No Action
Basin States
Conservation Before Shortage
Water Supply
Reservoir Storage
50th Percentile Values
5,500,000
6,000,000
6,500,000
7,000,000
7,500,000
8,000,000
8,500,000
2005 2010 2015 2020 2025 2030 2035 2040 2045 2050 2055 2060
Year
Ann
ual R
elea
se (a
f)
No Action
Basin States
Conservation Before Shortage
Water Supply
Reservoir Storage
10th Percentile Values
5,500,000
6,000,000
6,500,000
7,000,000
7,500,000
8,000,000
8,500,000
2005 2010 2015 2020 2025 2030 2035 2040 2045 2050 2055 2060
Year
Ann
ual R
elea
se (a
f)
No Action
Basin States
Conservation Before Shortage
Water Supply
Reservoir Storage
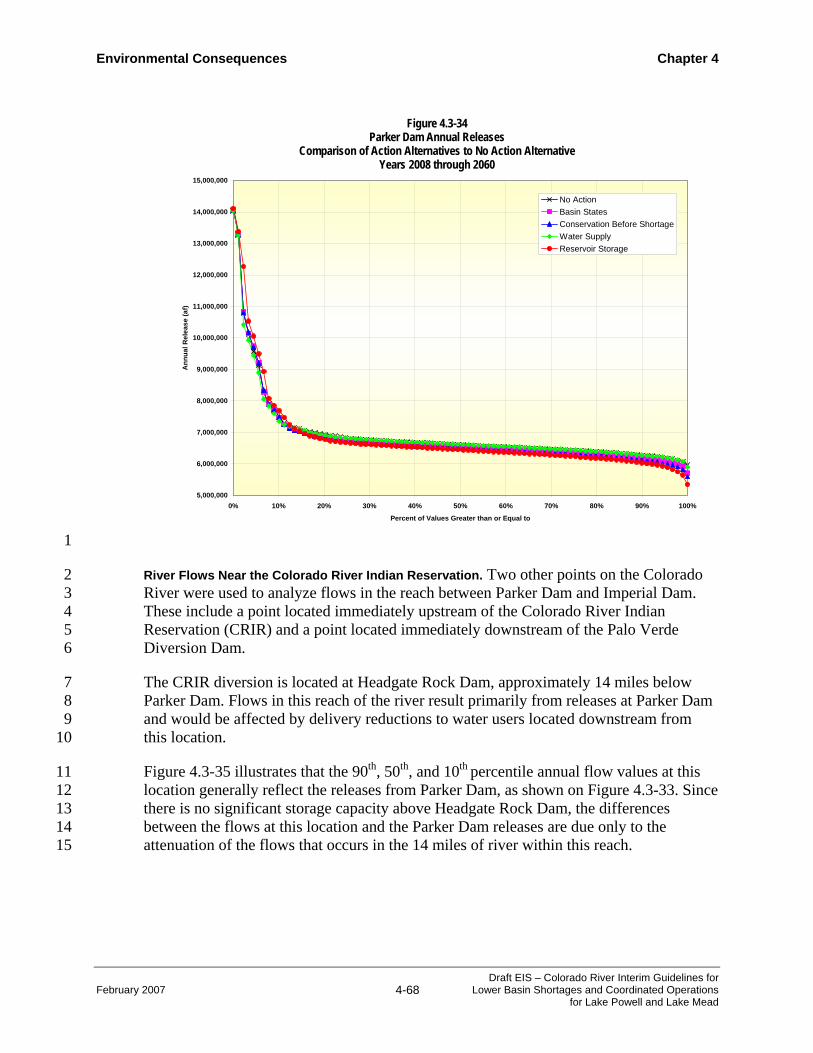
Environmental Consequences Chapter 4
February 2007 4-68 Draft EIS – Colorado River Interim Guidelines for
Lower Basin Shortages and Coordinated Operations for Lake Powell and Lake Mead
1
River Flows Near the Colorado River Indian Reservation. Two other points on the Colorado 2 River were used to analyze flows in the reach between Parker Dam and Imperial Dam. 3 These include a point located immediately upstream of the Colorado River Indian 4 Reservation (CRIR) and a point located immediately downstream of the Palo Verde 5 Diversion Dam. 6
The CRIR diversion is located at Headgate Rock Dam, approximately 14 miles below 7 Parker Dam. Flows in this reach of the river result primarily from releases at Parker Dam 8 and would be affected by delivery reductions to water users located downstream from 9 this location. 10
Figure 4.3-35 illustrates that the 90th, 50th, and 10th percentile annual flow values at this 11 location generally reflect the releases from Parker Dam, as shown on Figure 4.3-33. Since 12 there is no significant storage capacity above Headgate Rock Dam, the differences 13 between the flows at this location and the Parker Dam releases are due only to the 14 attenuation of the flows that occurs in the 14 miles of river within this reach. 15
Figure 4.3-34 Parker Dam Annual Releases
Comparison of Action Alternatives to No Action Alternative Years 2008 through 2060
5,000,000
6,000,000
7,000,000
8,000,000
9,000,000
10,000,000
11,000,000
12,000,000
13,000,000
14,000,000
15,000,000
0% 10% 20% 30% 40% 50% 60% 70% 80% 90% 100%
Percent of Values Greater than or Equal to
Ann
ual R
elea
se (a
f)
No ActionBasin StatesConservation Before ShortageWater SupplyReservoir Storage

Chapter 4 Environmental Consequences
Draft EIS – Colorado River Interim Guidelines for Lower Basin Shortages and Coordinated Operations for Lake Powell and Lake Mead
4-69 February 2007
1
Figure 4.3-35 Colorado River Annual Flow Upstream of CRIR Diversion - RM 180.8 (af)
Comparison of Action Alternatives to No Action Alternative 90th, 50th, and 10th Percentile Values
90th Percentile
5,000,000
5,500,000
6,000,000
6,500,000
7,000,000
7,500,000
8,000,000
8,500,000
9,000,000
2005 2010 2015 2020 2025 2030 2035 2040 2045 2050 2055 2060Year
Ann
ual F
low
Vol
ume
(af)
No ActionBasin StatesConservation Before Shortage
Water SupplyReservoir Storage
50th Percentile
5,000,000
5,500,000
6,000,000
6,500,000
7,000,000
7,500,000
8,000,000
8,500,000
9,000,000
2005 2010 2015 2020 2025 2030 2035 2040 2045 2050 2055 2060
Year
Ann
ual F
low
Vol
ume
(af)
No Action
Basin States
Conservation Before Shortage
Water Supply
Reservoir Storage
10th Percentile
5,000,000
5,500,000
6,000,000
6,500,000
7,000,000
7,500,000
8,000,000
8,500,000
9,000,000
2005 2010 2015 2020 2025 2030 2035 2040 2045 2050 2055 2060
Year
Ann
ual F
low
Vol
ume
(af)
No Action
Basin States
Conservation Before Shortage
Water Supply
Reservoir Storage
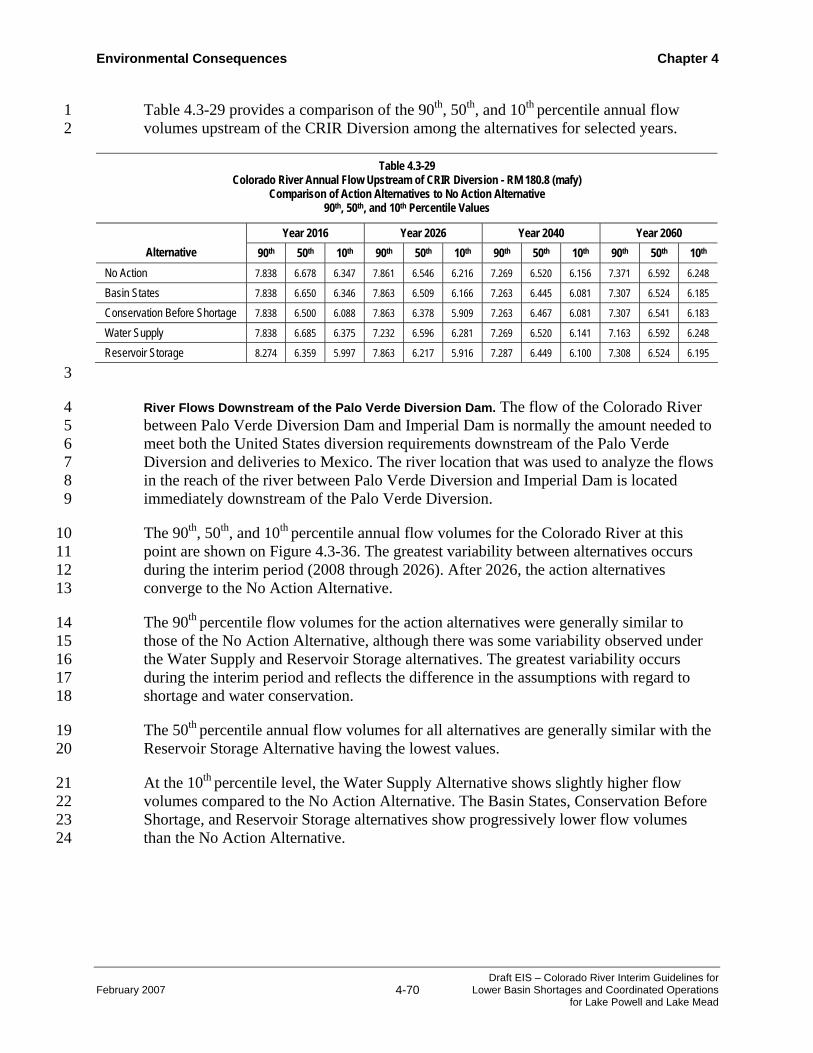
Environmental Consequences Chapter 4
February 2007 4-70 Draft EIS – Colorado River Interim Guidelines for
Lower Basin Shortages and Coordinated Operations for Lake Powell and Lake Mead
Table 4.3-29 provides a comparison of the 90th, 50th, and 10th percentile annual flow 1 volumes upstream of the CRIR Diversion among the alternatives for selected years. 2
Table 4.3-29 Colorado River Annual Flow Upstream of CRIR Diversion - RM 180.8 (mafy)
Comparison of Action Alternatives to No Action Alternative 90th, 50th, and 10th Percentile Values
Year 2016 Year 2026 Year 2040 Year 2060 Alternative 90th 50th 10th 90th 50th 10th 90th 50th 10th 90th 50th 10th
No Action 7.838 6.678 6.347 7.861 6.546 6.216 7.269 6.520 6.156 7.371 6.592 6.248
Basin States 7.838 6.650 6.346 7.863 6.509 6.166 7.263 6.445 6.081 7.307 6.524 6.185
Conservation Before Shortage 7.838 6.500 6.088 7.863 6.378 5.909 7.263 6.467 6.081 7.307 6.541 6.183
Water Supply 7.838 6.685 6.375 7.232 6.596 6.281 7.269 6.520 6.141 7.163 6.592 6.248
Reservoir Storage 8.274 6.359 5.997 7.863 6.217 5.916 7.287 6.449 6.100 7.308 6.524 6.195
3
River Flows Downstream of the Palo Verde Diversion Dam. The flow of the Colorado River 4 between Palo Verde Diversion Dam and Imperial Dam is normally the amount needed to 5 meet both the United States diversion requirements downstream of the Palo Verde 6 Diversion and deliveries to Mexico. The river location that was used to analyze the flows 7 in the reach of the river between Palo Verde Diversion and Imperial Dam is located 8 immediately downstream of the Palo Verde Diversion. 9
The 90th, 50th, and 10th percentile annual flow volumes for the Colorado River at this 10 point are shown on Figure 4.3-36. The greatest variability between alternatives occurs 11 during the interim period (2008 through 2026). After 2026, the action alternatives 12 converge to the No Action Alternative. 13
The 90th percentile flow volumes for the action alternatives were generally similar to 14 those of the No Action Alternative, although there was some variability observed under 15 the Water Supply and Reservoir Storage alternatives. The greatest variability occurs 16 during the interim period and reflects the difference in the assumptions with regard to 17 shortage and water conservation. 18
The 50th percentile annual flow volumes for all alternatives are generally similar with the 19 Reservoir Storage Alternative having the lowest values. 20
At the 10th percentile level, the Water Supply Alternative shows slightly higher flow 21 volumes compared to the No Action Alternative. The Basin States, Conservation Before 22 Shortage, and Reservoir Storage alternatives show progressively lower flow volumes 23 than the No Action Alternative. 24
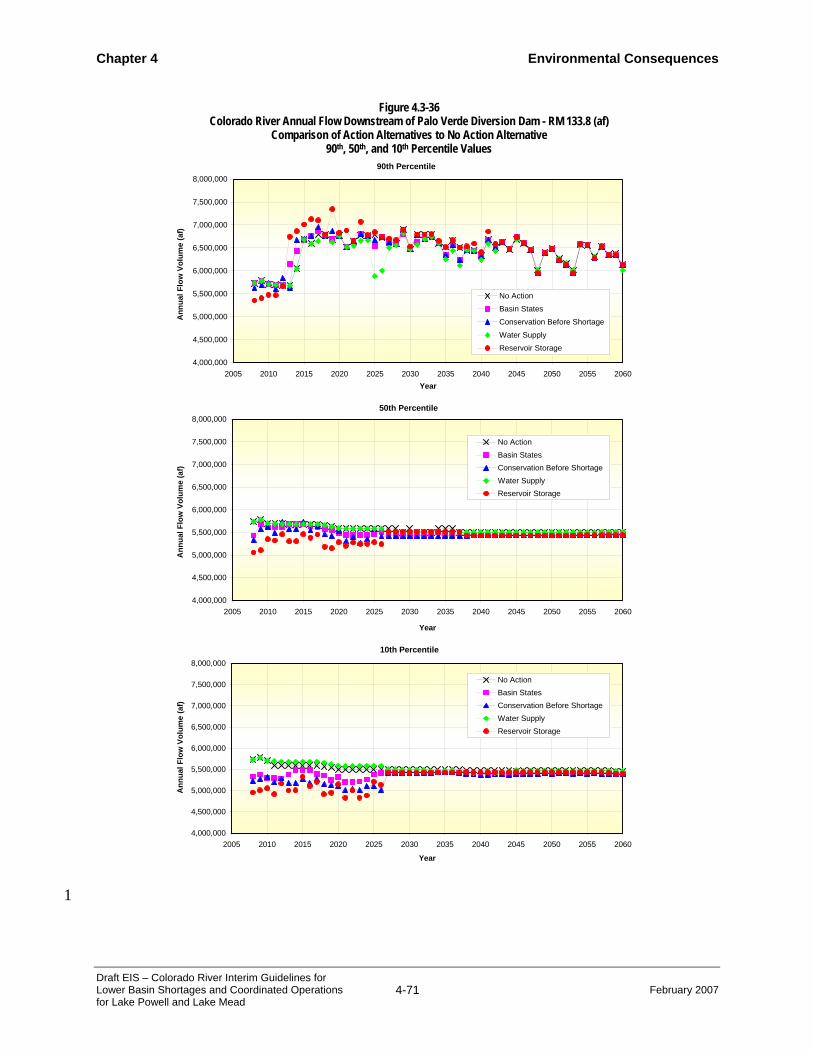
Chapter 4 Environmental Consequences
Draft EIS – Colorado River Interim Guidelines for Lower Basin Shortages and Coordinated Operations for Lake Powell and Lake Mead
4-71 February 2007
1
Figure 4.3-36 Colorado River Annual Flow Downstream of Palo Verde Diversion Dam - RM 133.8 (af)
Comparison of Action Alternatives to No Action Alternative 90th, 50th, and 10th Percentile Values
90th Percentile
4,000,000
4,500,000
5,000,000
5,500,000
6,000,000
6,500,000
7,000,000
7,500,000
8,000,000
2005 2010 2015 2020 2025 2030 2035 2040 2045 2050 2055 2060Year
Ann
ual F
low
Vol
ume
(af)
No ActionBasin States
Conservation Before Shortage
Water SupplyReservoir Storage
50th Percentile
4,000,000
4,500,000
5,000,000
5,500,000
6,000,000
6,500,000
7,000,000
7,500,000
8,000,000
2005 2010 2015 2020 2025 2030 2035 2040 2045 2050 2055 2060
Year
Ann
ual F
low
Vol
ume
(af)
No ActionBasin StatesConservation Before ShortageWater SupplyReservoir Storage
10th Percentile
4,000,000
4,500,000
5,000,000
5,500,000
6,000,000
6,500,000
7,000,000
7,500,000
8,000,000
2005 2010 2015 2020 2025 2030 2035 2040 2045 2050 2055 2060
Year
Ann
ual F
low
Vol
ume
(af)
No ActionBasin StatesConservation Before ShortageWater SupplyReservoir Storage

Environmental Consequences Chapter 4
February 2007 4-72 Draft EIS – Colorado River Interim Guidelines for
Lower Basin Shortages and Coordinated Operations for Lake Powell and Lake Mead
Table 4.3-30 provides a comparison of the 90th, 50th, and 10th percentile annual flow 1 volumes downstream of the Palo Verde Diversion Dam. 2
Table 4.3-30 Colorado River Annual Flow Downstream of Palo Verde Diversion Dam - RM 133.8 (maf)
Comparison of Action Alternatives to No Action Alternative 90th, 50th, and 10th Percentile Values
Year 2016 Year 2026 Year 2040 Year 2060 Alternative 90th 50th 10th 90th 50th 10th 90th 50th 10th 90th 50th 10th
No Action 6.592 5.685 5.598 6.730 5.586 5.500 6.334 5.508 5.478 6.147 5.509 5.453
Basin States 6.758 5.641 5.485 6.731 5.511 5.423 6.326 5.433 5.402 6.126 5.434 5.389
Conservation Before Shortage 6.762 5.547 5.185 6.741 5.411 5.011 6.326 5.433 5.370 6.126 5.434 5.392
Water Supply 6.592 5.685 5.685 6.003 5.586 5.586 6.245 5.508 5.440 6.019 5.509 5.453
Reservoir Storage 7.128 5.384 5.109 6.731 5.244 5.134 6.407 5.433 5.433 6.127 5.434 5.402
3
4.3.7.2 Groundwater 4 As discussed in Section 3.3, the flows in the Parker Dam to Imperial Dam reach are 5 primarily composed of water released from Parker Dam and therefore, the annual median 6 releases are representative of the annual median flows in each reach. When converted to 7 stage, a comparison of the annual median releases for each alternative may be used as the 8 indicator to analyze potential effects to groundwater adjacent to the river in this reach. 9
Figure 4.3-37 illustrates the annual median releases from Parker Dam for each alternative 10 for the years 2008 through 2060. As was the case for Davis Dam, the median releases for 11 the Water Supply and Reservoir Storage alternatives bracket the median releases for the 12 other three alternatives due primarily to the different shortage assumptions for each of the 13 alternatives. Table 4.3-31 compares the annual median values relative to the No Action 14 Alternative for specific years (each action alternative value less the No Action 15 Alternative value). Using appropriate relationships to convert flow-to-stage ( LCR MSCP 16 BA, Appendix J, Attachment D), these relative flow differences would result in minor 17 reductions in river stage (on the order of 0.25 feet). Based on the relationships used in the 18 LCR MSCP BA ,Appendix K, such river stage reductions would result in corresponding 19 reductions in groundwater elevations adjacent to the river (approximately 0.15 feet to 20 0.30 feet reduction for gaining and losing reaches respectively). 21

Chapter 4 Environmental Consequences
Draft EIS – Colorado River Interim Guidelines for Lower Basin Shortages and Coordinated Operations for Lake Powell and Lake Mead
4-73 February 2007
1
2
Table 4.3-31 Parker Dam Annual Median Releases
Differences of Action Alternatives Compared to No Action Alternative1, (cfs)
Year No Action Basin States Conservation
Before Shortage
Water Supply
Reservoir Storage
2008 NA -331 -469 0 -850 2011 NA -200 -383 13 -684 2016 NA -44 -248 10 -439 2017 NA -115 -74 24 -413 2026 NA -51 -232 69 -454 2027 NA -45 -37 16 20 2040 NA -103 -82 0 -96 2060 NA -95 -75 0 -95
1 Value of Action Alternative minus the value from the No Action Alternative provides the difference shown. A negative value indicates that the value under the Action Alternative is lower than that of the No Action Alternative, i.e. a flow reduction.
3
Figure 4.3-37 Parker Dam Annual Releases
Comparison of Action Alternatives to No Action Alternative Annual Median (50th Percentile) Values
7,500
7,750
8,000
8,250
8,500
8,750
9,000
9,250
9,500
9,750
10,000
2005 2010 2015 2020 2025 2030 2035 2040 2045 2050 2055 2060Year
Ann
ual R
elea
se (c
fs)
No ActionBasin StatesConservation Before ShortageWater SupplyReservoir Storage
Environmental Consequences Chapter 4
February 2007 4-74 Draft EIS – Colorado River Interim Guidelines for
Lower Basin Shortages and Coordinated Operations for Lake Powell and Lake Mead
4.3.8 Imperial Dam to NIB 1 As noted in Section 3.3, most of the water delivered to Mexico is diverted at Imperial Dam, 2 conveyed via the AAC, and then returned to the Colorado River through the Pilot Knob and 3 Siphon Drop Powerplants and their respective wasteway channels, 2.1 miles and 7.6 miles 4 upstream of the NIB, respectively. The proposed federal action will not alter the operation of 5 these diversions and wasteways and therefore, will not have an effect on this river reach. 6
4.3.9 NIB to SIB 7 As noted in Section 3.3, Mexico diverts most of its Colorado River water supply at the 8 Morelos Diversion Dam, and except during flood control operations, only limited flows 9 actually pass Morelos Diversion Dam. During flood control operations, releases are made 10 from Hoover Dam as dictated by the flood control criteria established with the USACE 11 (Section 3.3). These releases are dependent upon the amount of available storage in the 12 system (including Lake Powell and Lake Mead) and the hydrologic inflow forecast. The 13 proposed federal action could potentially change the amount of water in storage in Lake 14 Powell and Lake Mead, thereby affecting the frequency and/or volume of flood control 15 releases. 16
In addition, the modeling assumptions used to model the storage and delivery mechanism for 17 the Conservation Before Shortage and Reservoir Storage alternatives could potentially alter 18 the flows in this reach.1 It was assumed that water conservation activities in Mexico would 19 result in conserved water that would be stored in Lake Mead and delivered on a periodic 20 basis to Mexico through the NIB to the SIB reach. These modeling assumptions were used in 21 this Draft EIS in order to analyze the potential impacts to resources of the storage and 22 delivery mechanism, particularly with regard to reservoir elevations and river flow impacts. 23 The use of these modeling assumptions does not represent any determination by Reclamation 24 as to whether, or how, any storage/delivery arrangements would actually be implemented 25 in the future. These modeling assumptions are not intended to constitute an interpretation 26 or application of the 1944 Treaty or to represent current or future United States policy 27 regarding deliveries to Mexico. Details of these assumptions are discussed in Section 4.2 and 28 Appendix M. 29
The 90th, 50th, and 10th percentile annual flow volumes for this reach are shown in Figure 4.3-30 38. 31
1 These flows were modeled as part of the storage and delivery mechanism under the Conservation Before Shortage and Reservoir Storage alternatives. These modeling assumptions were utilized in this Draft EIS in order to analyze the potential impacts to environmental resources of the storage and delivery mechanism, particularly with regard to reservoir elevations and river flow impacts. The use of these modeling assumptions does not represent any determination by Reclamation as to whether, or how, these releases could be made under current administration of the Colorado River.

Chapter 4 Environmental Consequences
Draft EIS – Colorado River Interim Guidelines for Lower Basin Shortages and Coordinated Operations for Lake Powell and Lake Mead
4-75 February 2007
1
Figure 4.3-38 Colorado River Annual Flow Below Mexico Diversion at Morelos Diversion Dam - RM 21.1 (af)
Comparison of Action Alternatives to No Action Alternative 90th, 50th, and 10th Percentile Values
90th Percentile
0
200,000
400,000
600,000
800,000
1,000,000
1,200,000
1,400,000
1,600,000
2005 2010 2015 2020 2025 2030 2035 2040 2045 2050 2055 2060Year
Ann
ual F
low
Vol
ume
(af)
No Action
Basin States
Conservation Before Shortage
Water Supply
Reservoir Storage
50th Percentile
0
200,000
400,000
600,000
800,000
1,000,000
1,200,000
1,400,000
1,600,000
2005 2010 2015 2020 2025 2030 2035 2040 2045 2050 2055 2060Year
Ann
ual F
low
Vol
ume
(af)
No Action
Basin States
Conservation Before Shortage
Water Supply
Reservoir Storage
10th Percentile
0
200,000
400,000
600,000
800,000
1,000,000
1,200,000
1,400,000
1,600,000
2005 2010 2015 2020 2025 2030 2035 2040 2045 2050 2055 2060
Year
Ann
ual F
low
Vol
ume
(af)
No Action
Basin States
Conservation Before Shortage
Water Supply
Reservoir Storage
Environmental Consequences Chapter 4
February 2007 4-76 Draft EIS – Colorado River Interim Guidelines for
Lower Basin Shortages and Coordinated Operations for Lake Powell and Lake Mead
Flows at the 90th percentile are produced by flood control operations. The values for the 1 Reservoir Storage Alternative were generally greater than for the other alternatives due to 2 higher reservoir levels. After 2045, the 90th percentile annual flow volumes are all similar. 3 The 90th percentile annual flow volumes for the Water Supply Alternative were generally 4 lower than the other alternatives through about 2030. 5
Flows at the 50th percentile are comprised solely of non-flood control flows. The No Action, 6 Basin States, and Water Supply alternatives assume no activity with regard to delivery of 7 conserved water to Mexico. The 50th percentile flows for the Conservation Before Shortage 8 and Reservoir Storage alternatives show intermittent annual flow volumes of from about 40 9 kaf to 200 kaf during the interim period. 10
At the 10th percentile, the Conservation Before Shortage is the only alternative that shows an 11 annual flow value that is greater than zero, in the year 2010 at a volume of 80 kaf. 12
Table 4.3-17 provides a summary of the results illustrated in Figure 4.3-17 for elevation 13 1,178 feet msl in tabular form for selected years. As shown in Table 4.3-17, the water levels 14 under the Basin States and Conservation Before Shortage alternatives are similar to those 15 under the No Action Alternative. The water levels under the Reservoir Storage Alternative 16 fell below elevation 1,178 feet msl less frequently than those under the No Action 17 Alternative. The water levels under the Water Supply Alternative fell below elevation 1,178 18 feet msl more frequently than those under the No Action Alternative. 19
Figure 4.3-39 shows the cumulative distribution for annual volumes of excess flows below 20 the Mexico diversion at Morelos Diversion Dam for the period between 2008 through 2060. 21 At flows less than about 250 kaf, the differences are due to the assumed delivery of 22 conserved water to Mexico under the Conservation Before Shortage and Reservoir Storage 23 alternatives. Flows greater than about 250 kaf are the result of flood control operations. 24
Table 4.3-32 provides a comparison of the 90th, 50th, and 10th percentile annual flow volumes 25 below the Mexico diversion at Morelos Diversion Dam between the action alternatives and 26 No Action Alternative for selected years. 27

Chapter 4 Environmental Consequences
Draft EIS – Colorado River Interim Guidelines for Lower Basin Shortages and Coordinated Operations for Lake Powell and Lake Mead
4-77 February 2007
1
2
Table 4.3-32 Colorado River Annual Flow Below Mexico Diversion at Morelos Diversion Dam - RM 21.1 (maf)
Comparison of Action Alternatives to No Action Alternative 90th, 50th, and 10th Percentile Values
Year 2016 Year 2026 Year 2040 Year 2060 Alternative 90th 50th 10th 90th 50th 10th 90th 50th 10th 90th 50th 10th
No Action 0.414 0.000 0.000 0.579 0.000 0.000 0.206 0.000 0.000 0.032 0.000 0.000
Basin States 0.542 0.000 0.000 0.567 0.000 0.000 0.235 0.000 0.000 0.045 0.000 0.000
Conservation Before Shortage 0.605 0.000 0.000 0.591 0.000 0.000 0.235 0.000 0.000 0.045 0.000 0.000
Water Supply 0.414 0.000 0.000 0.083 0.000 0.000 0.192 0.000 0.000 0.000 0.000 0.000
Reservoir Storage 0.974 0.000 0.000 0.680 0.000 0.000 0.284 0.000 0.000 0.045 0.000 0.000
3
Figure 4.3-39 Excess Flows Below Mexico Diversion at Morelos Diversion Dam
Comparison of Action Alternatives to No Action Alternative Cumulative Distribution - Years 2008 through 2060
0
500,000
1,000,000
1,500,000
2,000,000
2,500,000
3,000,000
3,500,000
4,000,000
4,500,000
5,000,000
5,500,000
6,000,000
6,500,000
7,000,000
0% 10% 20% 30% 40% 50% 60% 70% 80% 90% 100%
Percent of Values Greater than or Equal to
Ann
ual R
iver
Flo
w (a
f)
No ActionBasin StatesConservation Before ShortageWater SupplyReservoir Storage
Environmental Consequences Chapter 4
February 2007 4-78 Draft EIS – Colorado River Interim Guidelines for
Lower Basin Shortages and Coordinated Operations for Lake Powell and Lake Mead
4.3.10 Summary 1 The following conclusions were drawn from the analyses of hydrologic resources. 2
4.3.10.1 Reservoir Storage 3 The Water Supply Alternative generally provides lower Lake Powell water levels than 4 the No Action Alternative. Conversely, the Reservoir Storage Alternative provides higher 5 Lake Powell levels than the No Action Alternative. The observed Lake Powell water 6 levels under the Basin States and Conservation Before Shortage alternatives are similar to 7 each other. The 50th and 10th percentile values of these two alternatives vary less than 8 those of the Water Supply and Reservoir Storage alternatives. The greatest difference in 9 Lake Powell elevation between the Basin States and Conservation Before Shortage 10 alternatives and the No Action Alternative in any one year is about 10 feet. 11
The Lake Mead 50th percentile elevations under the Water Supply Alternative are 12 generally lower than those under the No Action Alternative. However, the Lake Mead 13 10th percentile elevations under the Water Supply Alternative vary and are sometimes 14 higher and sometimes lower than those under the No Action Alternative. The Reservoir 15 Storage Alternative generally provides higher Lake Powell levels than the No Action 16 Alternative. The observed Lake Mead water levels under the Basin States and 17 Conservation Before Shortage alternatives are similar to each other. The 50th and 10th 18 percentile values of these two alternatives vary less than those of the Water Supply and 19 Reservoir Storage alternatives. Both the 50th and 10th percentile values of the Basin States 20 and Conservation Before Shortage alternatives vary from being higher and sometimes 21 lower than those of the No Action Alternative. 22
Lake Mohave and Lake Havasu are operated on a rule curve and have target end-of-23 month elevations. This manner of operation will continue in the future and would apply 24 to operations under any of the action alternatives. Therefore, future Lake Mohave and 25 Lake Havasu water levels would be expected to be similar between the action alternatives 26 and the No Action Alternative. 27
4.3.10.2 Reservoir Releases 28 Glen Canyon Dam releases less than the annual minimum objective release of 8.23 maf 29 occurred less than one percent of the time under the No Action Alternative, 30 approximately 3.7 percent under the Basin States, Conservation Before Shortage, and 31 Water Supply alternatives, and approximately six percent under the Reservoir Storage 32 Alternative. Releases greater than the annual minimum objective release of 8.23 maf 33 occurred approximately 35.5 percent under the No Action Alternative, approximately 34 42.4 percent under the Basin States, Conservation Before Shortage, and Water Supply 35 alternatives, and approximately 36.67 percent under the Reservoir Storage Alternative. 36 Releases greater than 9.0 maf generally correspond to years where either equalization or 37 spill avoidance releases are made from Lake Powell. Glen Canyon Dam releases greater 38 than 9.0 maf occurred 29.80 percent of the time under the No Action Alternative, 35.53 39 percent under the Basin States and Conservation Before Shortage alternatives, 36.67 40 percent under the Water Supply Alternative, and 30.94 percent under the Reservoir 41 Storage Alternative. 42

Chapter 4 Environmental Consequences
Draft EIS – Colorado River Interim Guidelines for Lower Basin Shortages and Coordinated Operations for Lake Powell and Lake Mead
4-79 February 2007
More water is held in storage in Lake Mead under the Reservoir Storage Alternative and 1 therefore the releases from Hoover Dam are lower under this alternative during the 2 interim period (2008 through 2026), as compared to the No Action Alternative. 3 Conversely, the Hoover Dam releases under the Water Supply Alternative are greater 4 than those under No Action Alternative because less water is held in storage under the 5 Water Supply Alternative. The Hoover Dam releases under the Basin States and 6 Conservation Before Shortage alternatives are slightly less than those under the No 7 Action Alternative and the differences can be attributed to the assumption that SNWA 8 would develop additional non-system water supplies that are permanent, such as 9 desalination. The assumption is that these supplies would be exchanged with other 10 downstream Colorado River water users and the point of delivery of the exchanged water 11 would move from below Hoover Dam to Lake Mead, resulting in reduced releases from 12 Hoover Dam. Other reductions in releases under the action alternatives can be attributed 13 to both voluntary and involuntary delivery reductions, i.e. water conservation and 14 shortages. The alternative with the greatest effect on Hoover Dam releases due to 15 shortage related delivery reductions is the Reservoir Storage Alternative. 16
The releases from Davis Dam and Parker Dam generally reflect the same pattern of 17 releases under the different action alternatives as those from Hoover Dam. The 18 differences in the release volumes are mostly attributed to the depletions that occur 19 upstream of each respective dam. 20
4.3.10.3 River Flows 21 The river flows in the Glen Canyon Dam to Lake Mead river reach could potentially be 22 reduced below 8.23 maf under the different action alternatives, albeit the frequency of 23 occurrence of these reductions is expected to low. River flow reductions below 8.23 mafy 24 are expected to occur about 3.7 percent of the time under the Basin States, Conservation 25 Before Shortage, and Water Supply alternatives about 3.7 percent of the time and about 6 26 percent of the time under the Reservoir Storage Alternative. The corresponding seasonal, 27 daily and hourly flows will also be affected although these will continue to be managed 28 consistent with the AMP. 29
The river flow reductions that were observed for the river reaches downstream of Hoover 30 Dam under the action alternatives were similar to those previously analyzed in the LCR 31 MSCP Final EIS and LCR MSCP BA/BO. 32
4.3.10.4 Groundwater 33 The river flow reductions were determined to have no effect on the groundwater 34 resources within the river reach that extends from Glen Canyon Dam to Lake Mead. The 35 river flow reductions that occur below Hoover Dam could potentially affect groundwater 36 resources within the different river reaches where they occur. However, the potential 37 river stage reductions and corresponding potential effects on groundwater resources 38 within these river reaches were determined to be similar to those considered in the LCR 39 MSCP Final EIS and LCR MSCP BA/BO. 40

Environmental Consequences Chapter 4
February 2007 4-80 Draft EIS – Colorado River Interim Guidelines for
Lower Basin Shortages and Coordinated Operations for Lake Powell and Lake Mead
This page intentionally left blank. 1 2
Chapter 4 Environmental Consequences
Draft EIS – Colorado River Interim Guidelines for Lower Basin Shortages and Coordinated Operations for Lake Powell and Lake Mead
4-81 February 2007
4.4 Water Deliveries 1
This section compares water deliveries from the Colorado River mainstream to the Lower 2 Division states and Mexico under the No Action and action alternatives. In addition, potential 3 impacts of shortages to water user categories (agricultural, M&I, and Tribal) within Arizona are 4 compared. Details with regard to potential impacts to specific water users, particularly within the 5 state of Arizona, are presented in Appendix G. 6
4.4.1 Methodology 7 The methodology used to analyze total water deliveries to each Lower Division state and 8 Mexico for each alternative is based on the hydrologic model (CRSS) described in Section 9 4.2 and in Appendix A. The modeling assumptions with respect to the distribution of 10 shortages to the Lower Division states and Mexico are summarized in Section 4.2. 11
4.4.1.1 Shortage Allocation Model 12 To analyze the potential impacts of shortages to water users within each Lower Division 13 state, a more detailed model referred to as the Shortage Allocation Model was developed. 14 The Shortage Allocation Model was used to estimate delivery of water to Colorado River 15 water entitlement holders within the Lower Division states and Mexico under varying 16 levels of shortages. The entitlements, along with consumptive use schedules and 17 established priorities within each respective Lower Division state, were included as 18 parameters in the Shortage Allocation Model. In addition, the shortage distribution within 19 the CAP is consistent with the Arizona Water Settlement Act (AWSA). 20
The Shortage Allocation Model allocates shortages to the Lower Division states 21 consistent with the shortage sharing assumptions used in the CRSS model. The Shortage 22 Allocation Model then distributes Colorado River water to entitlement holders within 23 each state based on the priority of water rights within each respective state using the 24 assumption that shortages will be shared on a pro rata basis by users of the same priority. 25 A detailed description of the Shortage Allocation Model and the methodologies used to 26 distribute the shortages is provided in Appendix G. A list of each state’s Colorado River 27 water entitlement holders, listed by priority, is included in Appendix E. 28
Total Lower Basin shortages of 100 kaf to 2.5 maf (in increments of 100 kaf) were 29 analyzed in the Shortage Allocation Model, fully covering the range of total Lower Basin 30 shortages projected to occur under the No Action and action alternatives. The output for 31 each model run shows how shortages were distributed to each entitlement holder within 32 each state. The Shortage Allocation Model also summarized shortages into three water 33 user categories in Arizona (agricultural, M&I, and Tribal), which are presented in Section 34 4.4.5. Detailed output from the Shortage Allocation Model is provided in Appendix G. 35
4.4.2 Apportionments to the Upper Division States 36 The proposed federal action will not affect the apportionments to the Upper Division states 37 nor their ability to use their Compact apportionments and therefore no resource impact 38 analysis was necessary. 39

Chapter 4 Environmental Consequences
February 2007 4-82 Draft EIS – Colorado River Interim Guidelines for
Lower Basin Shortages and Coordinated Operations for Lake Powell and Lake Mead
4.4.3 Apportionments to the Lower Division States and Water Entitlements 1 within Each State 2
The proposed federal action will not affect the apportionments to the Lower Division states 3 or the water entitlements to water users within those states and therefore no resource impact 4 analysis was necessary. However, water deliveries to each state and to users within each state 5 may potentially be affected and are analyzed in the following sections. 6
4.4.4 Lower Division States Water Supply Determination 7 The proposed federal action would provide guidance to the Secretary’s annual determination 8 of the water supply condition (Surplus, Normal, or Shortage) for the Lower Division states. 9 This section compares the probabilities of the determinations that would be made under each 10 alternative. 11
4.4.4.1 Shortage Conditions 12 A Shortage condition exists in a particular year when the Secretary determines that there 13 is insufficient mainstream water available to satisfy 7.5 maf of consumptive use in the 14 Lower Division states. The elements of the proposed federal action include shortage 15 guidelines and each alternative assumes a specific formulation for determining Shortage 16 conditions (Chapter 2). 17
Probability of Involuntary and Voluntary Shortage. The Conservation Before Shortage 18 proposal suggested an approach to the management of shortages in the Lower Basin 19 whereby voluntary water reductions would occur at specific Lake Mead elevations in 20 order to delay the onset of larger, involuntary water reductions. The voluntary water 21 reductions would occur through a compensation program whereby willing Lower Basin 22 Colorado River water users, including Mexico, would be paid to voluntarily and 23 temporarily reduce their water use (Section 2.4). In Section 4.4 (this section), these water 24 delivery reductions are termed voluntary shortages. Conversely, involuntary shortages 25 would be water delivery reductions imposed by the determination of a Shortage condition 26 by the Secretary. 27
The probability of a determination of Shortage conditions (and associated involuntary 28 delivery reductions) for all alternatives is illustrated in Figure 4.4-1. Under the No Action 29 Alternative, the probability of shortage increases throughout the interim period from 30 about 20 percent in 2011 to about 50 percent in 2026. All action alternatives have lower 31 probabilities of involuntary shortage when compared to the No Action Alternative from 32 2013 through 2026. Table 4.4-1 shows a comparison of the alternatives with respect to 33 the first year of involuntary shortage. Table 4.4-2 shows the probability of any amount of 34 involuntary Lower Basin shortage for specific years. 35
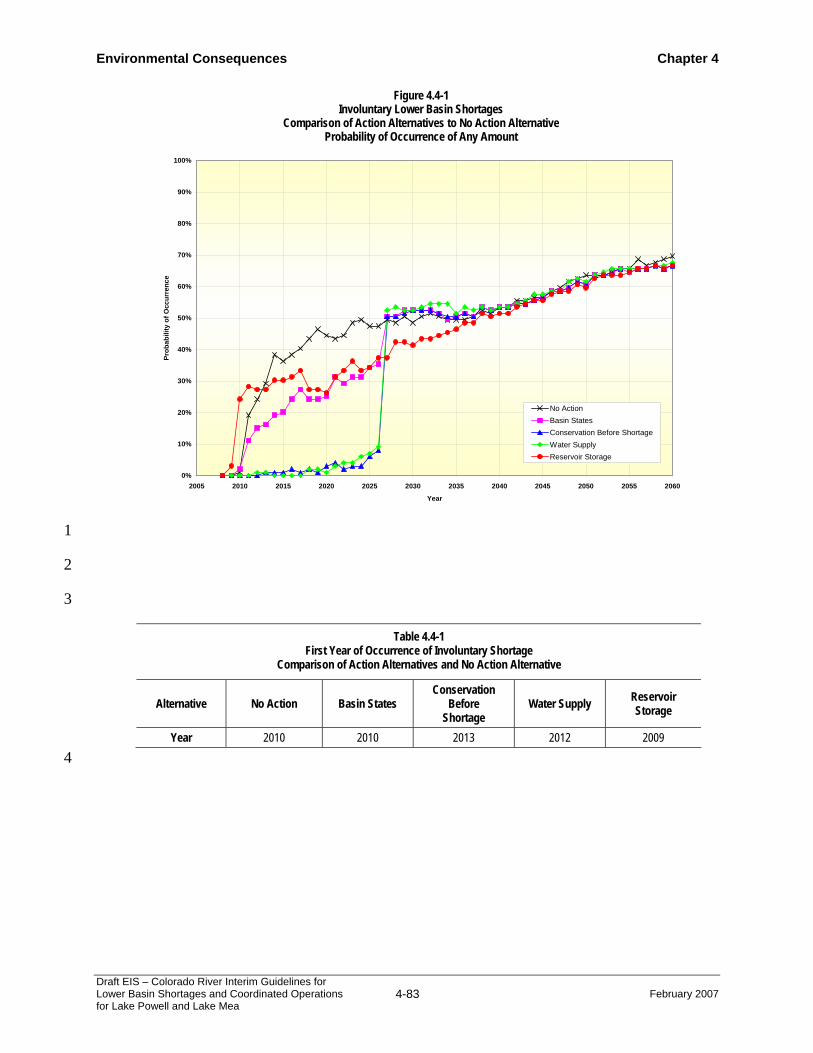
Environmental Consequences Chapter 4
Draft EIS – Colorado River Interim Guidelines for Lower Basin Shortages and Coordinated Operations for Lake Powell and Lake Mea
4-83 February 2007
1
2
3
Table 4.4-1 First Year of Occurrence of Involuntary Shortage
Comparison of Action Alternatives and No Action Alternative
Alternative No Action Basin States Conservation
Before Shortage
Water Supply Reservoir Storage
Year 2010 2010 2013 2012 2009
4
Figure 4.4-1 Involuntary Lower Basin Shortages
Comparison of Action Alternatives to No Action Alternative Probability of Occurrence of Any Amount
0%
10%
20%
30%
40%
50%
60%
70%
80%
90%
100%
2005 2010 2015 2020 2025 2030 2035 2040 2045 2050 2055 2060
Year
Prob
abili
ty o
f Occ
urre
nce
No ActionBasin StatesConservation Before ShortageWater SupplyReservoir Storage

Chapter 4 Environmental Consequences
February 2007 4-84 Draft EIS – Colorado River Interim Guidelines for
Lower Basin Shortages and Coordinated Operations for Lake Powell and Lake Mead
1 Table 4.4-2
Probability of Occurrence of Any Amount of Involuntary Shortage Comparison of Action Alternatives to No Action Alternative
Year No Action Basin States Conservation
Before Shortage
Water Supply Reservoir Storage
2008 0% 0% 0% 0% 0% 2017 40% 27% 1% 0% 33% 2026 47% 35% 8% 9% 37% 2027 49% 51% 51% 53% 37% 2040 54% 54% 54% 54% 52% 2060 70% 67% 67% 68% 67%
2
The Conservation Before Shortage and Water Supply alternatives result in infrequent, 3 involuntary shortages during the interim period due to quite different reasons. The 4 Conservation Before Shortage Alternative assumes that voluntary shortages would occur 5 prior to the determination of an involuntary Shortage condition, whereas the Water 6 Supply Alternative imposes involuntary shortages only if Lake Mead storage approaches 7 the dead pool. Under the Water Supply Alternative, a shortage will also occur to SNWA 8 when Lake Mead’s elevation falls below 1,000 feet msl (Section 4.2). Figure 4.4-1 shows 9 that this occurs approximately one to nine percent for years in the interim period in the 10 Water Supply Alternative. Figure 4.4-1 also shows that the probability of involuntary 11 shortages under the Conservation Before Shortage Alternative is similar (approximately 12 one to eight percent over the interim period) since involuntary shortages are imposed 13 under that alternative to protect Lake Mead from falling below elevation 1,000 feet msl. 14
Figure 4.4-2, Table 4.4-3, and Table 4.4-4 show the comparisons for all alternatives when 15 both involuntary and voluntary shortages are considered. When both involuntary and 16 voluntary shortages are considered, the occurrence of the first shortage (in year 2010) is 17 identical for the Basin States and Conservation Before Shortage alternatives. The 18 probability of shortages is also very similar because the Conservation Before Shortage 19 Alternative assumes an identical strategy to determine the occurrence and magnitude of 20 voluntary shortages as is used by the Basin States Alternative to determine the occurrence 21 and magnitude of involuntary shortages. The Conservation Before Shortage Alternative 22 shows somewhat lower probabilities of both voluntary and involuntary shortage over the 23 interim period when compared to the Basin States Alternative primarily because more 24 water is retained in Lake Mead to greater participation in the storage and delivery 25 mechanism assumed under the Conservation Before Shortage Alternative. Also, the 26

Environmental Consequences Chapter 4
Draft EIS – Colorado River Interim Guidelines for Lower Basin Shortages and Coordinated Operations for Lake Powell and Lake Mea
4-85 February 2007
increased amount of involuntary shortage required in certain years to keep Lake Mead 1 above 1,000 feet msl under the Conservation Before Shortage Alternative tends to retain 2 additional water in Lake Mead, as compared to the Basin States Alternative, which 3 decreases the probability of future shortages. 4
5
6
Table 4.4-3 First Year of Occurrence of Involuntary or Voluntary Shortage
Comparison of Action Alternatives to No Action Alternative
Alternative No Action Basin States Conservation
Before Shortage
Water Supply Reservoir Storage
Year 2010 2010 2010 2012 2009
7
Figure 4.4-2 Involuntary and Voluntary Lower Basin Shortages
Comparison of Action Alternatives to No Action Alternative Probability of Occurrence of Any Amount
0%
10%
20%
30%
40%
50%
60%
70%
80%
90%
100%
2005 2010 2015 2020 2025 2030 2035 2040 2045 2050 2055 2060
Year
Prob
abili
ty o
f Occ
urre
nce
No ActionBasin StatesConservation Before ShortageWater SupplyReservoir Storage
\
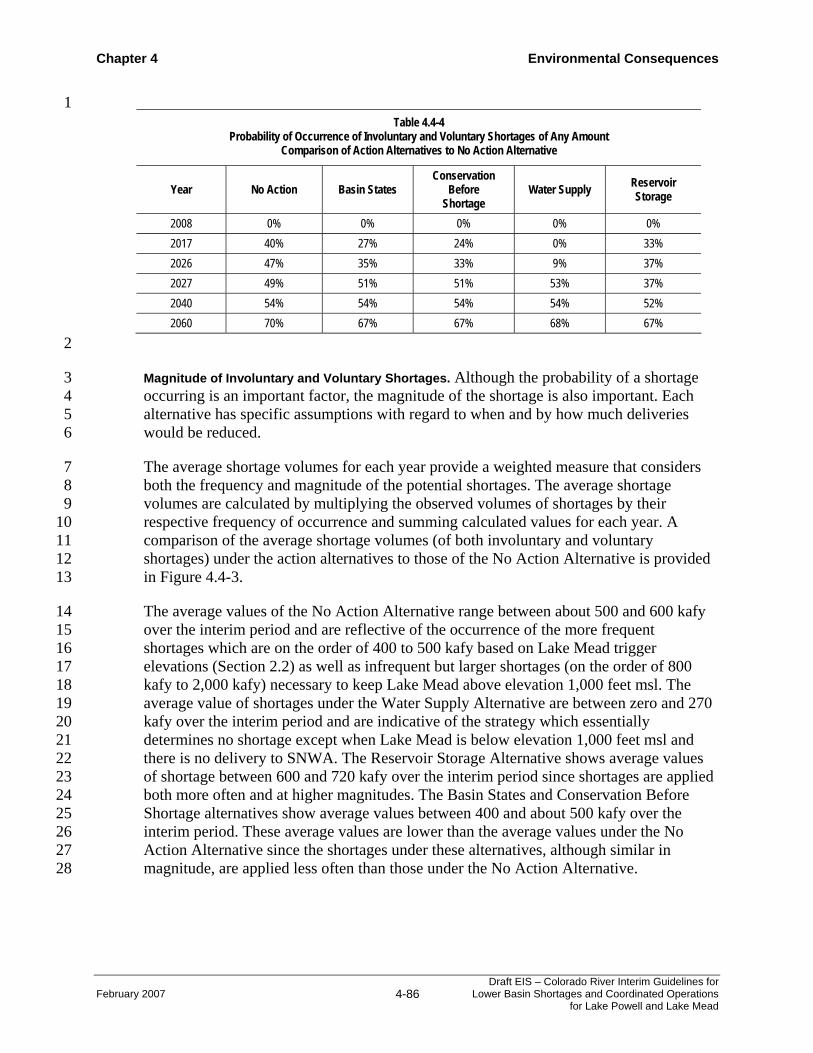
Chapter 4 Environmental Consequences
February 2007 4-86 Draft EIS – Colorado River Interim Guidelines for
Lower Basin Shortages and Coordinated Operations for Lake Powell and Lake Mead
1 Table 4.4-4
Probability of Occurrence of Involuntary and Voluntary Shortages of Any Amount Comparison of Action Alternatives to No Action Alternative
Year No Action Basin States Conservation
Before Shortage
Water Supply Reservoir Storage
2008 0% 0% 0% 0% 0% 2017 40% 27% 24% 0% 33% 2026 47% 35% 33% 9% 37% 2027 49% 51% 51% 53% 37% 2040 54% 54% 54% 54% 52% 2060 70% 67% 67% 68% 67%
2
Magnitude of Involuntary and Voluntary Shortages. Although the probability of a shortage 3 occurring is an important factor, the magnitude of the shortage is also important. Each 4 alternative has specific assumptions with regard to when and by how much deliveries 5 would be reduced. 6
The average shortage volumes for each year provide a weighted measure that considers 7 both the frequency and magnitude of the potential shortages. The average shortage 8 volumes are calculated by multiplying the observed volumes of shortages by their 9 respective frequency of occurrence and summing calculated values for each year. A 10 comparison of the average shortage volumes (of both involuntary and voluntary 11 shortages) under the action alternatives to those of the No Action Alternative is provided 12 in Figure 4.4-3. 13
The average values of the No Action Alternative range between about 500 and 600 kafy 14 over the interim period and are reflective of the occurrence of the more frequent 15 shortages which are on the order of 400 to 500 kafy based on Lake Mead trigger 16 elevations (Section 2.2) as well as infrequent but larger shortages (on the order of 800 17 kafy to 2,000 kafy) necessary to keep Lake Mead above elevation 1,000 feet msl. The 18 average value of shortages under the Water Supply Alternative are between zero and 270 19 kafy over the interim period and are indicative of the strategy which essentially 20 determines no shortage except when Lake Mead is below elevation 1,000 feet msl and 21 there is no delivery to SNWA. The Reservoir Storage Alternative shows average values 22 of shortage between 600 and 720 kafy over the interim period since shortages are applied 23 both more often and at higher magnitudes. The Basin States and Conservation Before 24 Shortage alternatives show average values between 400 and about 500 kafy over the 25 interim period. These average values are lower than the average values under the No 26 Action Alternative since the shortages under these alternatives, although similar in 27 magnitude, are applied less often than those under the No Action Alternative. 28
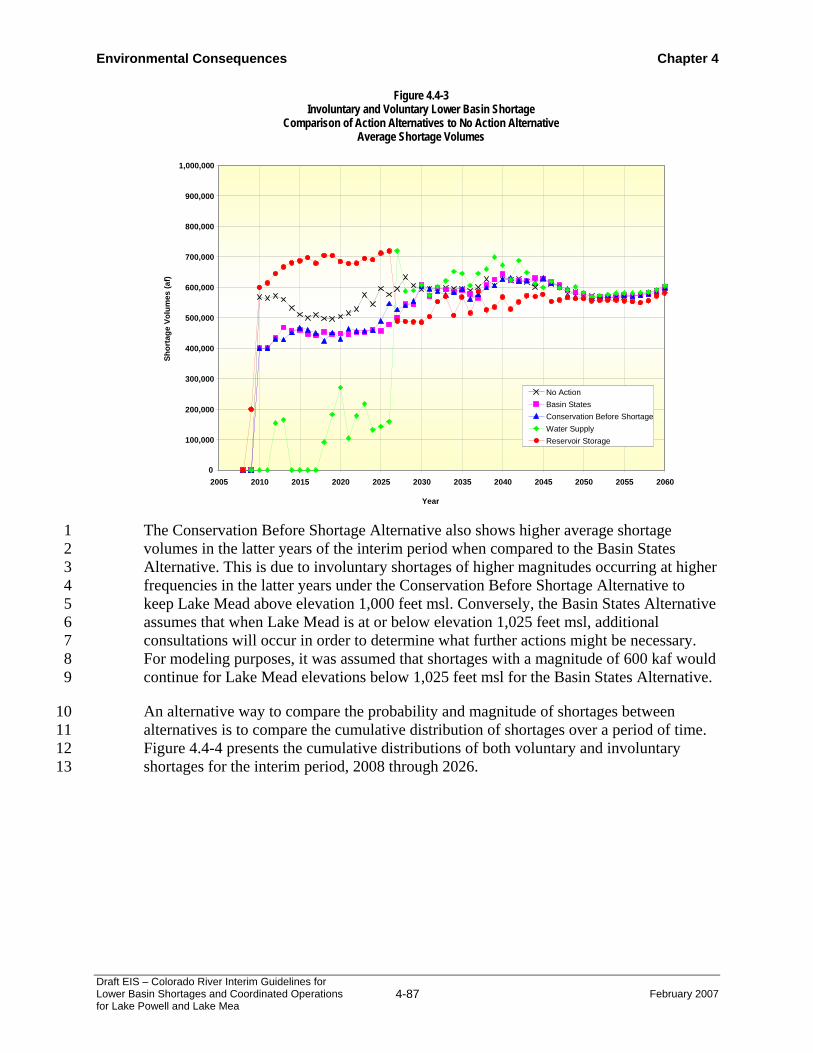
Environmental Consequences Chapter 4
Draft EIS – Colorado River Interim Guidelines for Lower Basin Shortages and Coordinated Operations for Lake Powell and Lake Mea
4-87 February 2007
The Conservation Before Shortage Alternative also shows higher average shortage 1 volumes in the latter years of the interim period when compared to the Basin States 2 Alternative. This is due to involuntary shortages of higher magnitudes occurring at higher 3 frequencies in the latter years under the Conservation Before Shortage Alternative to 4 keep Lake Mead above elevation 1,000 feet msl. Conversely, the Basin States Alternative 5 assumes that when Lake Mead is at or below elevation 1,025 feet msl, additional 6 consultations will occur in order to determine what further actions might be necessary. 7 For modeling purposes, it was assumed that shortages with a magnitude of 600 kaf would 8 continue for Lake Mead elevations below 1,025 feet msl for the Basin States Alternative. 9
An alternative way to compare the probability and magnitude of shortages between 10 alternatives is to compare the cumulative distribution of shortages over a period of time. 11 Figure 4.4-4 presents the cumulative distributions of both voluntary and involuntary 12 shortages for the interim period, 2008 through 2026. 13
Figure 4.4-3 Involuntary and Voluntary Lower Basin Shortage
Comparison of Action Alternatives to No Action Alternative Average Shortage Volumes
0
100,000
200,000
300,000
400,000
500,000
600,000
700,000
800,000
900,000
1,000,000
2005 2010 2015 2020 2025 2030 2035 2040 2045 2050 2055 2060
Year
Shor
tage
Vol
umes
(af)
No ActionBasin StatesConservation Before ShortageWater SupplyReservoir Storage

Chapter 4 Environmental Consequences
February 2007 4-88 Draft EIS – Colorado River Interim Guidelines for
Lower Basin Shortages and Coordinated Operations for Lake Powell and Lake Mead
1
Under the No Action Alternative, shortages between 400 and 500 kafy would be applied 2 in about 30 percent of the time, with shortages of greater magnitudes occurring about five 3 percent of the time over the interim period. Under the Basin States and Conservation 4 Before Shortage alternatives, shortages occur less often than under the No Action 5 Alternative (about 21 to 18 percent of the time respectively), with the slight lower 6 probability of the Conservation Before Shortage Alternative due to the assumption of 7 larger amounts of conserved water being stored in Lake Mead under that alternative. The 8 Reservoir Storage Alternative shows that shortages of magnitudes greater than 600 kafy 9 would occur about 10 percent of the time. 10
Figure 4.4-5 provides the cumulative distribution of shortages for the period between 11 2027 through 2060. Although all alternatives were assumed to revert back to the No 12 Action assumptions in 2027, the differences in cumulative distributions are attributed to 13 differences in Lake Powell and Lake Mead elevations between the alternatives at the end 14 of the interim period (2026). For example, the occurrence of large shortages (on the order 15 of 2,500 kaf) at low probabilities under the Water Supply Alternative is due to large 16 shortages that must be applied in order to return Lake Mead above elevation 1,000 feet 17 msl for some traces in 2027 and 2028. 18
Figure 4.4-4 Involuntary and Voluntary Lower Basin Shortages
Comparison of Action Alternatives to No Action Alternative Years 2006 through 2026
0
200,000
400,000
600,000
800,000
1,000,000
1,200,000
1,400,000
1,600,000
1,800,000
2,000,000
2,200,000
2,400,000
2,600,000
0% 10% 20% 30% 40% 50% 60% 70% 80% 90% 100%
Percent of Values Greater than or Equal to
Low
er B
asin
Sho
rtage
(af)
No ActionBasin StatesConservation Before ShortageWater SupplyReservoir Storage

Environmental Consequences Chapter 4
Draft EIS – Colorado River Interim Guidelines for Lower Basin Shortages and Coordinated Operations for Lake Powell and Lake Mea
4-89 February 2007
1 Tables 4.4-5 through 4.4-9 present the probability of occurrence of shortages of various 2 magnitudes for years 2017, 2026, 2027, 2040, and 2060 under all alternatives. Also 3 shown are the probabilities for the Conservation Before Shortage Alternative for just 4 involuntary shortages and both involuntary and voluntary shortages. 5
6
Figure 4.4-5 Involuntary and Voluntary Lower Basin Shortages
Comparison of Action Alternatives to No Action Alternative Years 2027 through 2060
0
200,000
400,000
600,000
800,000
1,000,000
1,200,000
1,400,000
1,600,000
1,800,000
2,000,000
2,200,000
2,400,000
2,600,000
0% 10% 20% 30% 40% 50% 60% 70% 80% 90% 100%
Percent of Values Greater than or Equal to
Low
er B
asin
Sho
rtag
e (a
f)
No ActionBasin StatesConservation Before ShortageWater SupplyReservoir Storage

Chapter 4 Environmental Consequences
February 2007 4-90 Draft EIS – Colorado River Interim Guidelines for
Lower Basin Shortages and Coordinated Operations for Lake Powell and Lake Mead
1 Table 4.4-5
Distribution of Shortages, Year 2017
Conservation Before Shortage
Shortage (kaf) No Action Basin States Involuntary
Involuntary & Voluntary
Water Supply
Reservoir Storage
< 400 0% 0% 0% 0% 0% 0% 400 - 499 39% 18% 0% 16% 0% 0% 500 - 599 0% 7% 0% 7% 0% 0% 600 - 799 0% 2% 0% 0% 0% 22% 800 - 999 1% 0% 1% 1% 0% 9%
1,000 – 1,199 0% 0% 0% 0% 0% 2% 1,200 – 1,399 0% 0% 0% 0% 0% 0% 1,400 – 1,599 0% 0% 0% 0% 0% 0% 1,600 – 1,799 0% 0% 0% 0% 0% 0% 1,800 – 1,999 0% 0% 0% 0% 0% 0% 2,000 – 2,499 0% 0% 0% 0% 0% 0%
> 2,500 0% 0% 0% 0% 0% 0% 2
Table 4.4-6 Distribution of Shortages, Year 2026
Conservation Before Shortage
Shortage (kaf) No
Action Basin States Involuntary
Involuntary & Voluntary
Water Supply
Reservoir Storage
< 400 0% 0% 2% 2% 9% 0% 400 - 499 39% 16% 0% 16% 0% 0% 500 - 599 1% 12% 0% 11% 0% 0% 600 - 799 3% 7% 4% 4% 0% 19% 800 - 999 2% 0% 1% 1% 0% 14%
1,000 – 1,199 0% 0% 0% 0% 0% 4% 1,200 – 1,399 0% 0% 0% 0% 0% 0% 1,400 – 1,599 0% 0% 0% 0% 0% 0% 1,600 – 1,799 1% 0% 0% 0% 0% 0% 1,800 – 1,999 1% 0% 1% 1% 0% 0% 2,000 – 2,499 0% 0% 0% 0% 0% 0%
> 2,500 0% 0% 0% 0% 0% 0% 3

Environmental Consequences Chapter 4
Draft EIS – Colorado River Interim Guidelines for Lower Basin Shortages and Coordinated Operations for Lake Powell and Lake Mea
4-91 February 2007
1 Table 4.4-7
Distribution of Shortages, Year 2027
Conservation Before Shortage Shortage
(kaf) No Action Basin States Involuntary Involuntary & Voluntary
Water Supply
Reservoir Storage
< 400 0% 0% 0% 0% 0% 0% 400 - 499 39% 48% 45% 45% 43% 37% 500 - 599 1% 1% 1% 1% 0% 0% 600 - 799 3% 0% 0% 0% 1% 0% 800 - 999 3% 0% 3% 3% 0% 0%
1,000 – 1,199 1% 1% 1% 1% 1% 0% 1,200 – 1,399 0% 0% 0% 0% 1% 0% 1,400 – 1,599 0% 0% 0% 0% 0% 0% 1,600 – 1,799 1% 0% 0% 0% 0% 0% 1,800 – 1,999 1% 0% 0% 0% 2% 0% 2,000 – 2,499 0% 0% 0% 0% 3% 0%
> 2,500 0% 0% 0% 0% 1% 0% 2
Table 4.4-8 Distribution of Shortages, Year 2040
Conservation Before Shortage Shortage
(kaf) No Action Basin States Involuntary Involuntary & Voluntary
Water Supply
Reservoir Storage
< 400 0% 0% 0% 0% 0% 0% 400 - 499 42% 41% 40% 40% 37% 46% 500 - 599 1% 1% 1% 1% 1% 0% 600 - 799 2% 2% 2% 2% 4% 0% 800 - 999 1% 1% 1% 1% 2% 2%
1,000 – 1,199 3% 3% 7% 7% 4% 0% 1,200 – 1,399 0% 0% 0% 0% 0% 0% 1,400 – 1,599 0% 0% 0% 0% 0% 0% 1,600 – 1,799 3% 4% 1% 1% 4% 2% 1,800 – 1,999 1% 1% 1% 1% 1% 1% 2,000 – 2,499 0% 0% 0% 0% 0% 0%
> 2,500 0% 0% 0% 0% 0% 0%
3

Chapter 4 Environmental Consequences
February 2007 4-92 Draft EIS – Colorado River Interim Guidelines for
Lower Basin Shortages and Coordinated Operations for Lake Powell and Lake Mead
1 Table 4.4-9
Distribution of Shortages, Year 2060
Conservation Before Shortage Shortage
(kaf) No Action Basin States Involuntary Involuntary & Voluntary
Water Supply
Reservoir Storage
< 400 0% 0% 0% 0% 0% 0% 400 - 499 55% 53% 49% 49% 53% 54% 500 - 599 1% 0% 3% 3% 1% 0% 600 - 799 4% 5% 5% 5% 4% 5% 800 - 999 3% 2% 2% 2% 3% 1%
1,000 – 1,199 3% 3% 4% 4% 3% 4% 1,200 – 1,399 0% 0% 0% 0% 0% 0% 1,400 – 1,599 0% 0% 0% 0% 0% 0% 1,600 – 1,799 3% 3% 3% 3% 3% 3% 1,800 – 1,999 1% 1% 0% 0% 1% 0% 2,000 – 2,499 0% 0% 0% 0% 0% 0%
> 2,500 0% 0% 0% 0% 0% 0% 2
The maximum amounts of shortages for each alternative for each year is presented in 3 Figure 4.4-6. Table 4.4-10 lists the maximum values for particular years. The large 4 shortages in 2027 and 2028 are clearly shown for the Water Supply Alternative. By 5 contrast, the Reservoir Storage Alternative has the lowest maximum shortage of any of 6 the alternatives in 2027 because the reservoir would be maintained at relatively higher 7 levels. By 2040, all alternatives have converged essentially to the No Action Alternative 8 values. 9
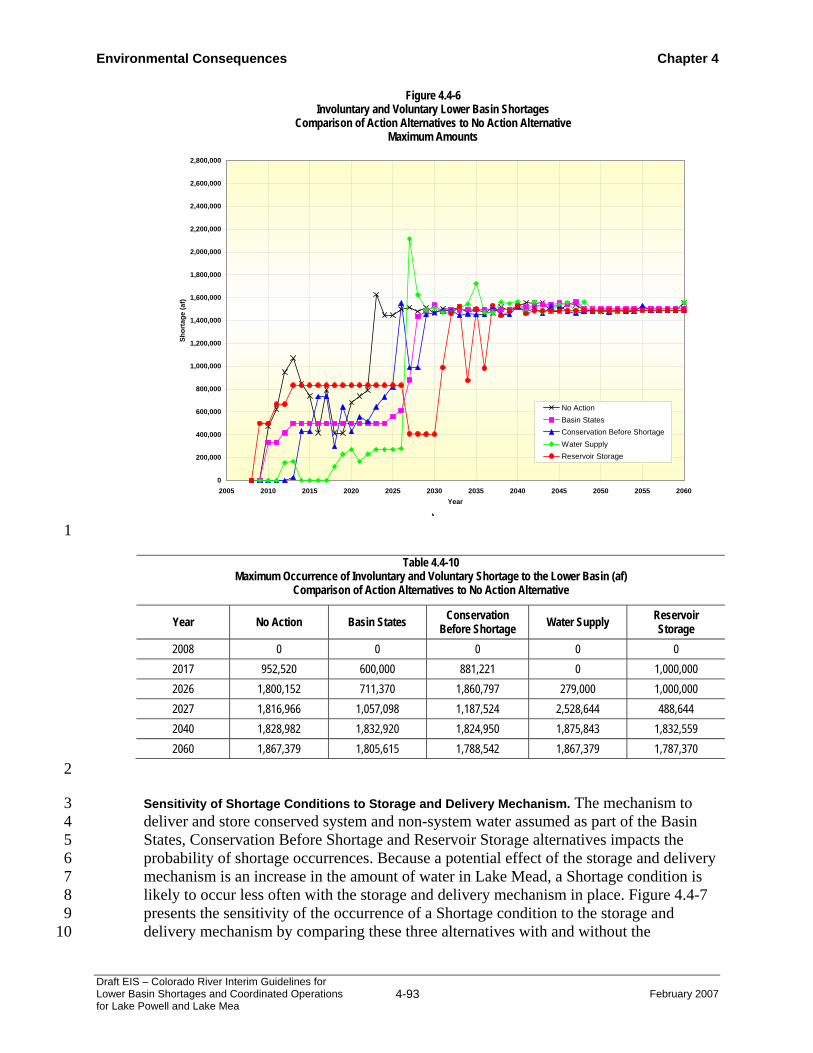
Environmental Consequences Chapter 4
Draft EIS – Colorado River Interim Guidelines for Lower Basin Shortages and Coordinated Operations for Lake Powell and Lake Mea
4-93 February 2007
1
Table 4.4-10 Maximum Occurrence of Involuntary and Voluntary Shortage to the Lower Basin (af)
Comparison of Action Alternatives to No Action Alternative
Year No Action Basin States Conservation Before Shortage Water Supply Reservoir
Storage 2008 0 0 0 0 0 2017 952,520 600,000 881,221 0 1,000,000 2026 1,800,152 711,370 1,860,797 279,000 1,000,000 2027 1,816,966 1,057,098 1,187,524 2,528,644 488,644 2040 1,828,982 1,832,920 1,824,950 1,875,843 1,832,559 2060 1,867,379 1,805,615 1,788,542 1,867,379 1,787,370
2
Sensitivity of Shortage Conditions to Storage and Delivery Mechanism. The mechanism to 3 deliver and store conserved system and non-system water assumed as part of the Basin 4 States, Conservation Before Shortage and Reservoir Storage alternatives impacts the 5 probability of shortage occurrences. Because a potential effect of the storage and delivery 6 mechanism is an increase in the amount of water in Lake Mead, a Shortage condition is 7 likely to occur less often with the storage and delivery mechanism in place. Figure 4.4-7 8 presents the sensitivity of the occurrence of a Shortage condition to the storage and 9 delivery mechanism by comparing these three alternatives with and without the 10
Figure 4.4-6 Involuntary and Voluntary Lower Basin Shortages
Comparison of Action Alternatives to No Action Alternative Maximum Amounts
0
200,000
400,000
600,000
800,000
1,000,000
1,200,000
1,400,000
1,600,000
1,800,000
2,000,000
2,200,000
2,400,000
2,600,000
2,800,000
2005 2010 2015 2020 2025 2030 2035 2040 2045 2050 2055 2060Year
Shor
tage
(af)
No ActionBasin StatesConservation Before ShortageWater SupplyReservoir Storage
\

Chapter 4 Environmental Consequences
February 2007 4-94 Draft EIS – Colorado River Interim Guidelines for
Lower Basin Shortages and Coordinated Operations for Lake Powell and Lake Mead
mechanism in place. For each alternative, the inclusion of the mechanism has the effect 1 of decreasing the probability of shortages. Under the Basin States and Conservation 2 Before Shortage alternatives the probability of shortage is reduced an average of about 3 five percent from 2010 through 2026. Under the Reservoir Storage Alternative the 4 reduction is greater, an average of 12 percent from 2010 through 2026, due to the greater 5 amount of storage credits that are assumed to be generated under this alternative. 6
7
4.4.4.2 Surplus Conditions 8 A Surplus condition exists in a particular year when the Secretary determines that there is 9 sufficient mainstream water available to satisfy in excess of 7.5 maf of consumptive use 10 in the Lower Division states. The elements of the proposed federal action include a 11 modification and/or extension of the ISG and each alternative expresses a particular 12 assumption for determining Surplus conditions (Chapter 2). 13
Figure 4.4-7 Involuntary and Voluntary Lower Basin Shortages
Comparison of Action Alternatives With and Without a Storage and Delivery Mechanism Probability of Occurrence of Any Amount
0%
10%
20%
30%
40%
50%
60%
70%
80%
90%
100%
2005 2010 2015 2020 2025 2030 2035 2040 2045 2050 2055 2060
Year
Prob
abili
ty o
f Occ
urre
nce
Basin StatesConservation Before ShortageReservoir StorageBasin States (no mechansim)Conservation Before Shortage (no mechanism)Reservoir Storage (no mechanism)
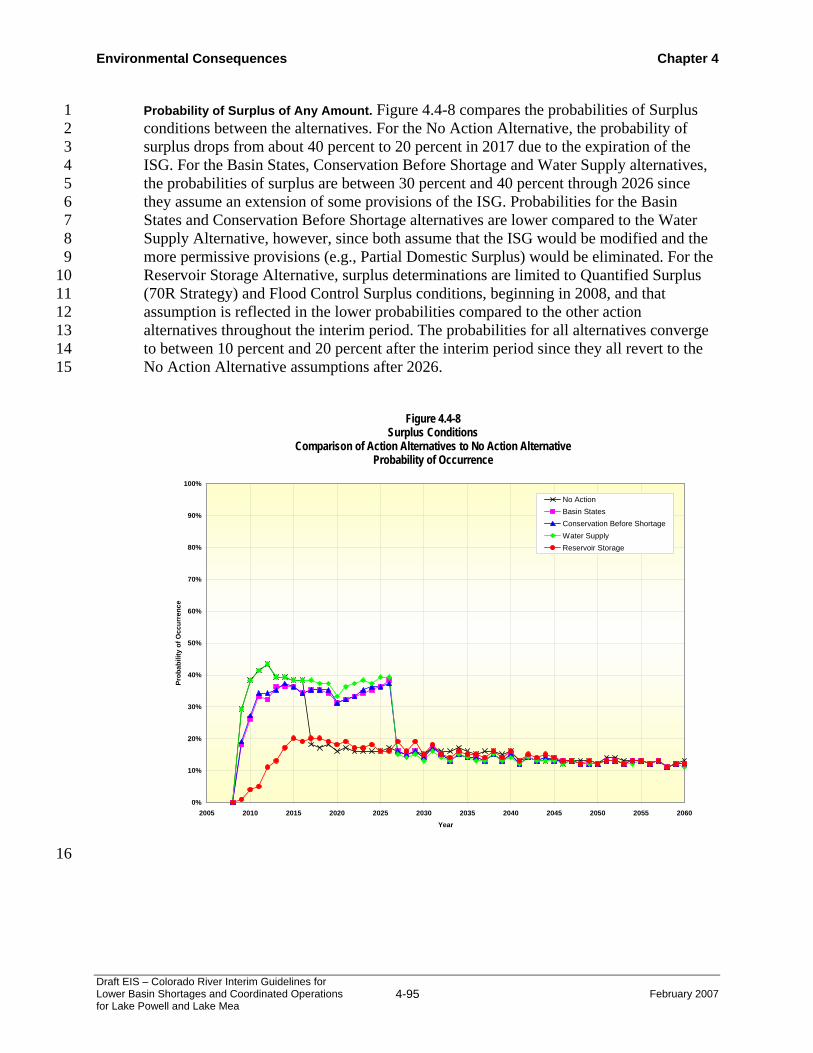
Environmental Consequences Chapter 4
Draft EIS – Colorado River Interim Guidelines for Lower Basin Shortages and Coordinated Operations for Lake Powell and Lake Mea
4-95 February 2007
Probability of Surplus of Any Amount. Figure 4.4-8 compares the probabilities of Surplus 1 conditions between the alternatives. For the No Action Alternative, the probability of 2 surplus drops from about 40 percent to 20 percent in 2017 due to the expiration of the 3 ISG. For the Basin States, Conservation Before Shortage and Water Supply alternatives, 4 the probabilities of surplus are between 30 percent and 40 percent through 2026 since 5 they assume an extension of some provisions of the ISG. Probabilities for the Basin 6 States and Conservation Before Shortage alternatives are lower compared to the Water 7 Supply Alternative, however, since both assume that the ISG would be modified and the 8 more permissive provisions (e.g., Partial Domestic Surplus) would be eliminated. For the 9 Reservoir Storage Alternative, surplus determinations are limited to Quantified Surplus 10 (70R Strategy) and Flood Control Surplus conditions, beginning in 2008, and that 11 assumption is reflected in the lower probabilities compared to the other action 12 alternatives throughout the interim period. The probabilities for all alternatives converge 13 to between 10 percent and 20 percent after the interim period since they all revert to the 14 No Action Alternative assumptions after 2026. 15
16
Figure 4.4-8 Surplus Conditions
Comparison of Action Alternatives to No Action Alternative Probability of Occurrence
0%
10%
20%
30%
40%
50%
60%
70%
80%
90%
100%
2005 2010 2015 2020 2025 2030 2035 2040 2045 2050 2055 2060Year
Prob
abili
ty o
f Occ
urre
nce
No ActionBasin StatesConservation Before ShortageWater SupplyReservoir Storage

Chapter 4 Environmental Consequences
February 2007 4-96 Draft EIS – Colorado River Interim Guidelines for
Lower Basin Shortages and Coordinated Operations for Lake Powell and Lake Mead
Probability of Various Types of Surplus. Figure 4.4-9 presents a comparison of the 1 probability of occurrence of the Partial Domestic Surplus condition for each alternative. 2 The probability is zero for the Basin States, Conservation Before Shortage and Reservoir 3 Storage alternatives since no provisions for Partial Domestic Surplus are contained in 4 those alternatives. The probability of Partial Domestic Surplus for the No Action and the 5 Water Supply alternatives are identical through 2016. After 2016, the probability of 6 Partial Domestic Surplus under the No Action Alternative drops to zero since the ISG 7 expire, while the Water Supply Alternative assumes an extension of the existing ISG 8 through 2026. 9
Figure 4.4-10 presents a comparison of the probability of occurrence of the Full Domestic 10 Surplus condition for each alternative. The probability is zero for the Reservoir Storage 11 Alternative since it does not include a provision for this condition. The probability of 12 Full Domestic Surplus for the No Action and Water Supply alternatives are nearly 13 identical through 2016 since they have the same assumptions during that period, with the 14 Water Supply Alternative continuing the Full Domestic Surplus provision through 2026. 15 The Basin States and Conservation Before Shortage alternatives also have nearly 16 identical probabilities through 2026 since they have the same assumptions during 17
Figure 4.4-9 Partial Domestic Surplus Deliveries to Lower Basin States
Comparison of Action Alternatives to No Action Alternative Probability of Occurrence
0%
10%
20%
30%
40%
50%
60%
70%
80%
90%
100%
2005 2010 2015 2020 2025 2030 2035 2040 2045 2050 2055 2060
Year
Perc
ent o
f Val
ues
Gre
ater
than
or E
qual
to
No ActionBasin StatesConservation Before ShortageWater SupplyReservoir Storage
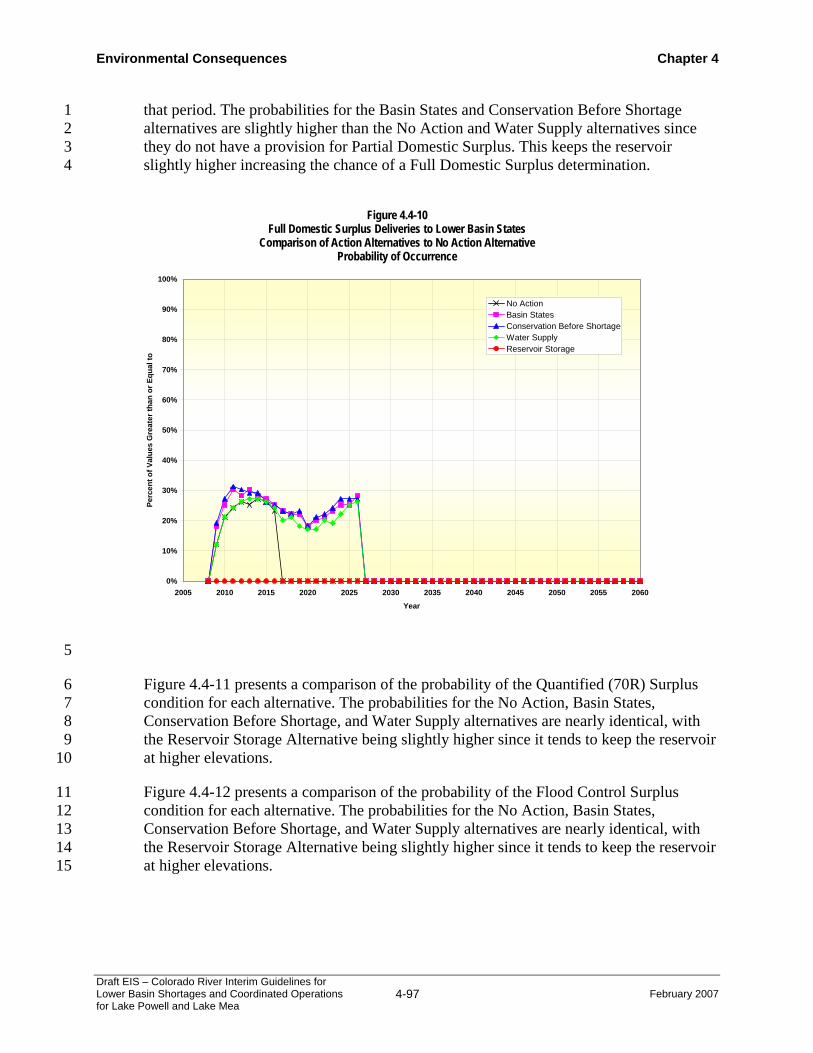
Environmental Consequences Chapter 4
Draft EIS – Colorado River Interim Guidelines for Lower Basin Shortages and Coordinated Operations for Lake Powell and Lake Mea
4-97 February 2007
that period. The probabilities for the Basin States and Conservation Before Shortage 1 alternatives are slightly higher than the No Action and Water Supply alternatives since 2 they do not have a provision for Partial Domestic Surplus. This keeps the reservoir 3 slightly higher increasing the chance of a Full Domestic Surplus determination. 4
5
Figure 4.4-11 presents a comparison of the probability of the Quantified (70R) Surplus 6 condition for each alternative. The probabilities for the No Action, Basin States, 7 Conservation Before Shortage, and Water Supply alternatives are nearly identical, with 8 the Reservoir Storage Alternative being slightly higher since it tends to keep the reservoir 9 at higher elevations. 10
Figure 4.4-12 presents a comparison of the probability of the Flood Control Surplus 11 condition for each alternative. The probabilities for the No Action, Basin States, 12 Conservation Before Shortage, and Water Supply alternatives are nearly identical, with 13 the Reservoir Storage Alternative being slightly higher since it tends to keep the reservoir 14 at higher elevations. 15
Figure 4.4-10 Full Domestic Surplus Deliveries to Lower Basin States
Comparison of Action Alternatives to No Action Alternative Probability of Occurrence
0%
10%
20%
30%
40%
50%
60%
70%
80%
90%
100%
2005 2010 2015 2020 2025 2030 2035 2040 2045 2050 2055 2060
Year
Perc
ent o
f Val
ues
Gre
ater
than
or E
qual
to
No ActionBasin StatesConservation Before ShortageWater SupplyReservoir Storage

Chapter 4 Environmental Consequences
February 2007 4-98 Draft EIS – Colorado River Interim Guidelines for
Lower Basin Shortages and Coordinated Operations for Lake Powell and Lake Mead
1
2
Figure 4.4-11 Quantified Surplus (70R Strategy) Deliveries to Lower Basin States
Comparison of Action Alternatives to No Action Alternative Probability of Occurrence
0%
10%
20%
30%
40%
50%
60%
70%
80%
90%
100%
2005 2010 2015 2020 2025 2030 2035 2040 2045 2050 2055 2060
Year
Perc
ent o
f Val
ues
Gre
ater
than
or E
qual
toNo ActionBasin StatesConservation Before ShortageWater SupplyReservoir Storage
Figure 4.4-12 Flood Control Surplus Deliveries to Lower Basin States
Comparison of Action Alternatives to No Action Alternative Probability of Occurrence
0%
10%
20%
30%
40%
50%
60%
70%
80%
90%
100%
2005 2010 2015 2020 2025 2030 2035 2040 2045 2050 2055 2060
Year
Perc
ent o
f Val
ues
Gre
ater
than
or E
qual
to
No ActionBasin StatesConservation Before ShortageWater SupplyReservoir Storage

Environmental Consequences Chapter 4
Draft EIS – Colorado River Interim Guidelines for Lower Basin Shortages and Coordinated Operations for Lake Powell and Lake Mea
4-99 February 2007
Sensitivity of Surplus Conditions to Storage and Delivery Mechanism. The mechanism to 1 deliver and store conserved and non-system water assumed as part of the Basin States, 2 Conservation Before Shortage and Reservoir Storage alternatives impacts the probability 3 of Surplus occurrences. Because a potential effect of the storage and delivery mechanism 4 is an increase in the amount of water in Lake Mead, a Surplus condition is likely to occur 5 more often with the storage and delivery mechanism in place. 6
Figure 4.4-13 presents the sensitivity of the occurrence of a Surplus condition to the 7 storage and delivery mechanism by comparing these three alternatives with and without 8 the mechanism in place. For each alternative, the inclusion of the mechanism has the 9 effect of slightly increasing the probability of a surplus. The maximum increase is about 10 five percent under the Basin States and Conservation Before Shortage alternatives and 11 occurs in 2011. The maximum increase is about four percent under the Reservoir Storage 12 Alternative, occurring in 2014 and 2015. 13
14
Figure 4.4-13 Surplus Deliveries to Lower Basin States
Comparison of Action Alternatives With and Without a Storage and Delivery Mechanism Probability of Occurrence
0%
10%
20%
30%
40%
50%
60%
70%
80%
90%
100%
2005 2010 2015 2020 2025 2030 2035 2040 2045 2050 2055 2060
Year
Prob
abili
ty o
f Occ
urre
nce
Basin States
Conservation Before ShortageReservoir Storage
Basin States (no mechansim)
Conservation Before Shortage (no mechanism)Reservoir Storage (no mechanism)

Chapter 4 Environmental Consequences
February 2007 4-100 Draft EIS – Colorado River Interim Guidelines for
Lower Basin Shortages and Coordinated Operations for Lake Powell and Lake Mead
4.4.4.3 Normal Conditions 1 The probability of a Normal condition is shown in Figure 4.4-14. Under the assumption 2 of an initial Lake Mead elevation of 1,116.53 feet msl on January 1, 2008, the Normal 3 condition would occur for all alternatives with a 100 percent probability in 2008. 4
5
6 4.4.4.4 Summary of Water Supply Conditions 7 Figure 4.4-15 illustrates the probabilities of occurrence for the three water supply 8 conditions (Surplus, Normal, and Shortage) under all alternatives. 9
Figure 4.4-14 Probability of Normal Conditions
Comparison of Action Alternatives to No Action Alternative Years 2008 through 2060
0%
10%
20%
30%
40%
50%
60%
70%
80%
90%
100%
2005 2010 2015 2020 2025 2030 2035 2040 2045 2050 2055 2060
Year
Prob
abili
ty o
f Occ
uren
ce
No ActionBasin StatesConservation Before ShortageWater SupplyReservoir Storage
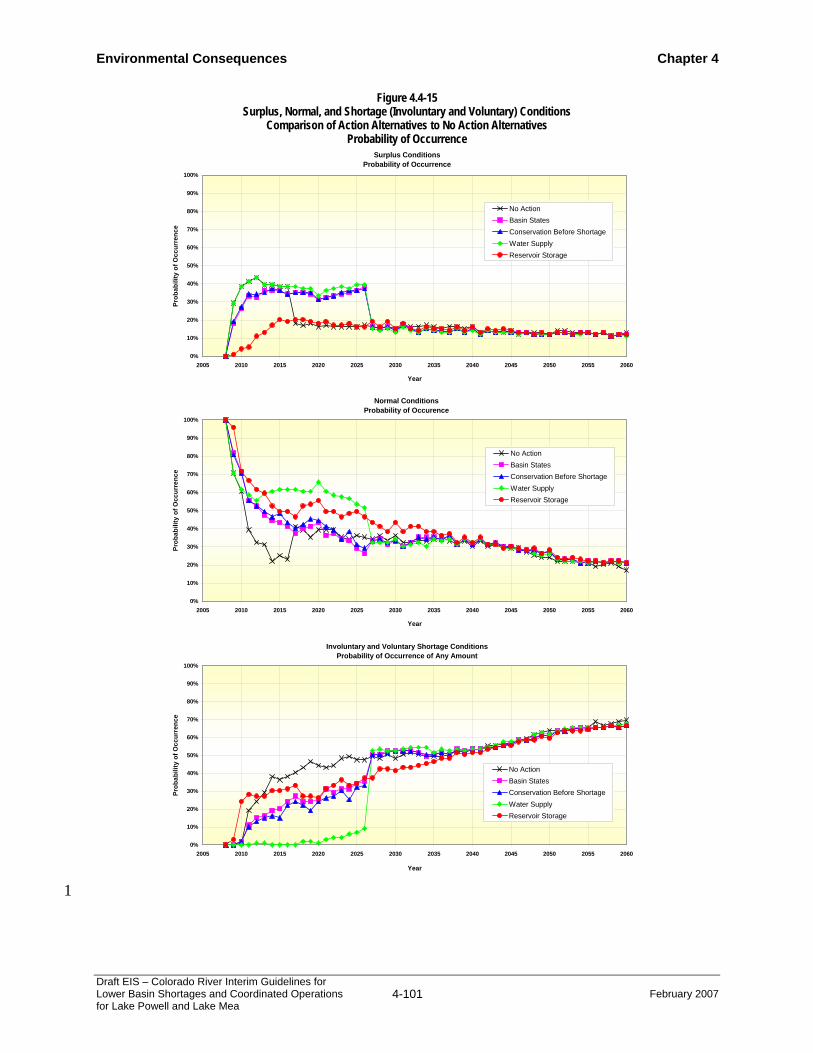
Environmental Consequences Chapter 4
Draft EIS – Colorado River Interim Guidelines for Lower Basin Shortages and Coordinated Operations for Lake Powell and Lake Mea
4-101 February 2007
1
Figure 4.4-15 Surplus, Normal, and Shortage (Involuntary and Voluntary) Conditions
Comparison of Action Alternatives to No Action Alternatives Probability of Occurrence
Surplus ConditionsProbability of Occurrence
0%
10%
20%
30%
40%
50%
60%
70%
80%
90%
100%
2005 2010 2015 2020 2025 2030 2035 2040 2045 2050 2055 2060
Year
Prob
abili
ty o
f Occ
urre
nce
No ActionBasin StatesConservation Before ShortageWater SupplyReservoir Storage
Normal Conditions Probability of Occurence
0%
10%
20%
30%
40%
50%
60%
70%
80%
90%
100%
2005 2010 2015 2020 2025 2030 2035 2040 2045 2050 2055 2060
Year
Prob
abili
ty o
f Occ
urre
nce
No ActionBasin StatesConservation Before ShortageWater SupplyReservoir Storage
Involuntary and Voluntary Shortage ConditionsProbability of Occurrence of Any Amount
0%
10%
20%
30%
40%
50%
60%
70%
80%
90%
100%
2005 2010 2015 2020 2025 2030 2035 2040 2045 2050 2055 2060
Year
Prob
abili
ty o
f Occ
urre
nce
No ActionBasin StatesConservation Before ShortageWater SupplyReservoir Storage

Chapter 4 Environmental Consequences
February 2007 4-102 Draft EIS – Colorado River Interim Guidelines for
Lower Basin Shortages and Coordinated Operations for Lake Powell and Lake Mead
4.4.5 Total Water Deliveries to the Lower Division States 1 This section presents the simulated water deliveries to the three Lower Division states. 2 Deliveries to each state may deviate from a state’s apportionment due to Surplus or Shortage 3 conditions as well as the storage and delivery of conserved water to and from Lake Mead. 4 For the alternatives that do not include some form of a storage and delivery mechanism (the 5 No Action Alternative and the Water Supply Alternative), water deliveries above or below a 6 state’s apportionment occur only during Surplus conditions or Shortage conditions 7 respectively. Water deliveries under the Basin States, Conservation Before Shortage and 8 Reservoir Storage alternatives in excess of a state’s apportionment can occur due to a Surplus 9 conditions as well as when conserved water previously stored in Lake Mead is delivered. 10 Also under these alternatives, water deliveries less than a state’s apportionment can occur 11 due to a Shortage condition as well as when water is being conserved within that state and 12 stored in Lake Mead. In the following sections, the modeled water deliveries are presented 13 with and without the storage and delivery mechanism to facilitate understanding of the 14 differences. 15
4.4.5.1 Total Water Deliveries to Arizona 16 This section presents the simulated water deliveries to Arizona under the No Action 17 Alternative and the action alternatives. 18
No Action Alternative. Water deliveries to Arizona are projected to fluctuate throughout the 19 53-year period of analysis reflecting variations in hydrologic conditions. The 90th, 50th, 20 and 10th percentile ranking of modeled water deliveries to Arizona under the No Action 21 Alternative are presented in Figure 4.4-16. Since the No Action Alternative does not 22 include a storage and delivery mechanism, deviations from annual deliveries of 2.8 mafy 23 are due to Shortage and Surplus conditions. 24
The 90th percentile line generally coincides with Arizona’s depletion schedule during full 25 surplus water supply conditions. The exceptions to this are the periods from 2008 through 26 2014 and 2055 through 2060. As indicated by this 90th percentile line, the probability that 27 the No Action Alternative would provide Arizona’s full surplus depletion schedule is at 28 least 10 percent for the period 2015 through 2055. 29
The 50th percentile line represents the median annual depletion values. This 50th 30 percentile line generally coincides with Arizona’s projected depletion schedule under 31 Normal conditions through year 2028. After 2028, the median annual Arizona modeled 32 depletion values fluctuate between 2.41 maf and 2.80 maf. 33
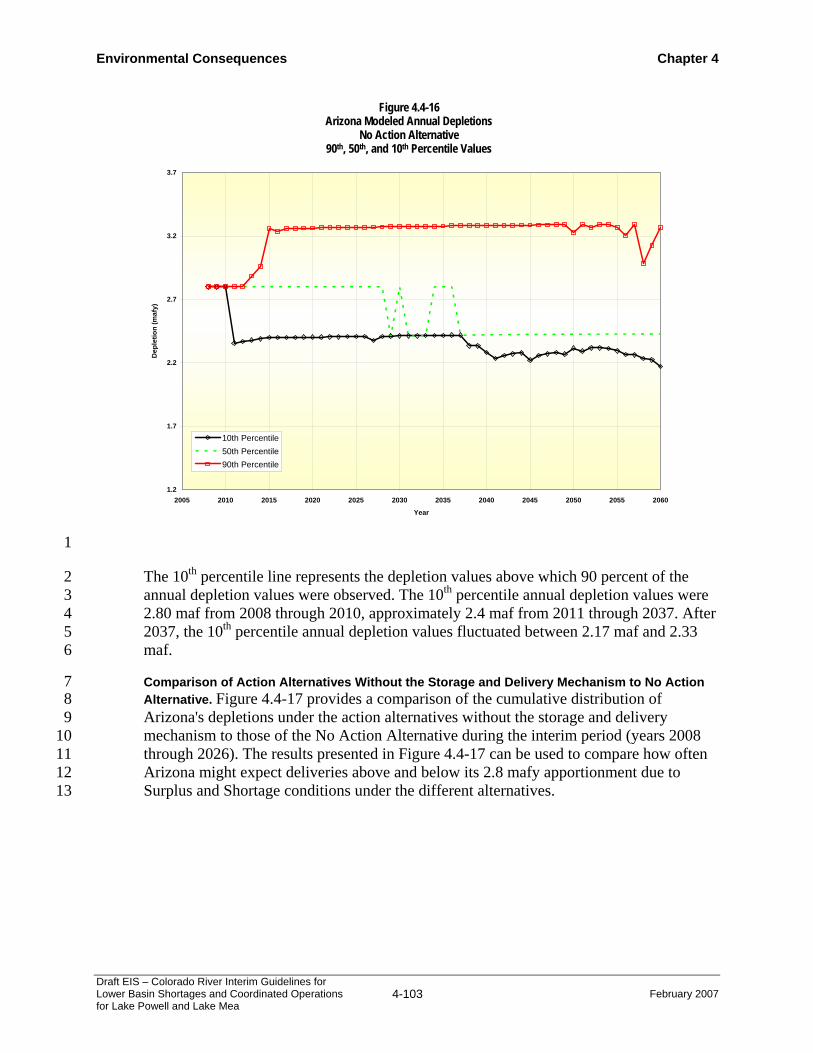
Environmental Consequences Chapter 4
Draft EIS – Colorado River Interim Guidelines for Lower Basin Shortages and Coordinated Operations for Lake Powell and Lake Mea
4-103 February 2007
1
The 10th percentile line represents the depletion values above which 90 percent of the 2 annual depletion values were observed. The 10th percentile annual depletion values were 3 2.80 maf from 2008 through 2010, approximately 2.4 maf from 2011 through 2037. After 4 2037, the 10th percentile annual depletion values fluctuated between 2.17 maf and 2.33 5 maf. 6
Comparison of Action Alternatives Without the Storage and Delivery Mechanism to No Action 7 Alternative. Figure 4.4-17 provides a comparison of the cumulative distribution of 8 Arizona's depletions under the action alternatives without the storage and delivery 9 mechanism to those of the No Action Alternative during the interim period (years 2008 10 through 2026). The results presented in Figure 4.4-17 can be used to compare how often 11 Arizona might expect deliveries above and below its 2.8 mafy apportionment due to 12 Surplus and Shortage conditions under the different alternatives. 13
Figure 4.4-16 Arizona Modeled Annual Depletions
No Action Alternative 90th, 50th, and 10th Percentile Values
1.2
1.7
2.2
2.7
3.2
3.7
2005 2010 2015 2020 2025 2030 2035 2040 2045 2050 2055 2060
Year
Dep
letio
n (m
afy)
10th Percentile50th Percentile90th Percentile

Chapter 4 Environmental Consequences
February 2007 4-104 Draft EIS – Colorado River Interim Guidelines for
Lower Basin Shortages and Coordinated Operations for Lake Powell and Lake Mead
1
Figure 4.4-18 provides a similar comparison of the cumulative distribution of water 2 deliveries to Arizona under the action alternatives without the storage and delivery 3 mechanism to those of the No Action Alternative for the 34-year period (years 2027 4 through 2060) that would follow the interim period. 5
Sensitivity of Total Water Deliveries to Arizona to Storage and Delivery Mechanism. Arizona 6 water deliveries under the Basin States, Conservation Before Shortage, and Reservoir 7 Storage alternatives are impacted by the modeling assumptions made to postulate 8 potential future participation in a storage and delivery mechanism (Appendix M). This 9 section isolates the impacts of those assumptions on Arizona’s modeled depletions. 10
Figure 4.4-17 Arizona Modeled Annual Depletions
Comparison of Action Alternatives (Without Storage and Delivery Mechanism) to No Action Alternative Years 2008 through 2026
1.2
1.4
1.6
1.8
2.0
2.2
2.4
2.6
2.8
3.0
3.2
3.4
0% 10% 20% 30% 40% 50% 60% 70% 80% 90% 100%
Percent of Values Greater than or Equal to
Ann
ual D
eple
tions
(maf
y)
No ActionBasin StatesConservation Before ShortageWater SupplyReservoir Storage

Environmental Consequences Chapter 4
Draft EIS – Colorado River Interim Guidelines for Lower Basin Shortages and Coordinated Operations for Lake Powell and Lake Mea
4-105 February 2007
1 Figure 4-4.19 provides a comparison of the cumulative distribution of Arizona’s 2 depletions under the Basin States, Conservation Before Shortage, and Reservoir Storage 3 alternatives, with and without the mechanism in place during the interim period. With the 4 mechanism in place, deliveries of approximately 2.7 mafy are due to the storage of 5 conserved water. With the mechanism removed, occurrences of deliveries less than 2.8 6 mafy or greater than 2.8 mafy reflect only Shortage or Surplus conditions respectively. 7 These observations mirror the effects of the mechanism on the probability of voluntary 8 and involuntary total Lower Basin Shortage and Surplus Conditions presented in the 9 previous subsection. 10
11
12
13
Figure 4.4-18 Arizona Modeled Annual Depletions
Comparison of Action Alternatives (Without Storage and Delivery Mechanism) to No Action Alternative Years 2027 through 2060
1.2
1.4
1.6
1.8
2.0
2.2
2.4
2.6
2.8
3.0
3.2
3.4
0% 10% 20% 30% 40% 50% 60% 70% 80% 90% 100%
Percent of Values Greater than or Equal to
Ann
ual D
eple
tions
(maf
y)
No ActionBasin StatesConservation Before ShortageWater SupplyReservoir Storage

Chapter 4 Environmental Consequences
February 2007 4-106 Draft EIS – Colorado River Interim Guidelines for
Lower Basin Shortages and Coordinated Operations for Lake Powell and Lake Mead
1
Figure 4-4.20 provides a comparison of the cumulative distribution of Arizona’s 2 depletions under the action alternatives that include a storage and delivery mechanism, 3 with and without the mechanism in place for the 34-year period that would follow the 4 interim period. There is almost no effect of the mechanism during these years as it is 5 assumed only conserved water previously stored in Lake Mead may be delivered during 6 this period. 7
Figure 4.4-19 Arizona Modeled Depletions
Comparison of Action Alternatives With and Without Storage and Delivery Mechanism Years 2008 through 2026
1.2
1.4
1.6
1.8
2.0
2.2
2.4
2.6
2.8
3.0
3.2
3.4
0% 10% 20% 30% 40% 50% 60% 70% 80% 90% 100%
Percent of Values Greater than or Equal to
Ann
ual D
eple
tions
(maf
y)
Basin StatesBasin States (no mechanism)Conservation Before ShortageConservation Before Shortage (no mechanism)Reservoir StorageReservoir Storage (no mechanism)

Environmental Consequences Chapter 4
Draft EIS – Colorado River Interim Guidelines for Lower Basin Shortages and Coordinated Operations for Lake Powell and Lake Mea
4-107 February 2007
1
4.4.5.2 Total Water Deliveries to California 2 This section presents the simulated water deliveries to California under the No Action 3 Alternative and the action alternatives. 4
No Action Alternative. Water deliveries to California are projected to fluctuate throughout 5 the 53-year period of analysis reflecting variations in hydrologic conditions. The 90th, 6 50th, and 10th percentile ranking of modeled water deliveries to California under the No 7 Action Alternative are presented in Figure 4.4-21. Since the No Action Alternative does 8 not include a storage and delivery mechanism, deviations from annual deliveries of 4.4 9 mafy are due to Shortage and Surplus conditions. 10
Figure 4.4-20 Arizona Modeled Depletions
Comparison of Action Alternatives With and Without Storage and Delivery Mechanism Years 2027 through 2060
1.2
1.4
1.6
1.8
2.0
2.2
2.4
2.6
2.8
3.0
3.2
3.4
0% 10% 20% 30% 40% 50% 60% 70% 80% 90% 100%
Percent of Values Greater than or Equal to
Ann
ual D
eple
tions
(maf
y
Basin StatesBasin States (no mechanism)Conservation Before ShortageConservation Before Shortage (no mechanism)Reservoir StorageReservoir Storage (no mechanism)

Chapter 4 Environmental Consequences
February 2007 4-108 Draft EIS – Colorado River Interim Guidelines for
Lower Basin Shortages and Coordinated Operations for Lake Powell and Lake Mead
1
The 90th percentile line generally coincides with California’s depletion schedule during 2 full surplus water supply conditions. The exceptions to this are the periods from 2008 3 through 2014 and from 2055 through 2060. As indicated by this 90th percentile line, the 4 probability that the No Action Alternative would provide California’s full surplus 5 depletion schedule is at least 10 percent for the period from 2015 through 2055. 6
The 50th percentile line represents the median annual depletion values. This 50th 7 percentile line generally coincides with California’s projected depletion schedule under 8 Normal conditions throughout the 53-year period of analysis. 9
The 10th percentile line represents the depletion values above which 90 percent of the 10 annual depletion values were observed. The 10th percentile annual depletion values also 11 generally coincide with California’s projected depletion schedule under Normal 12 conditions throughout the 53-year period of analysis. This means that there is at least a 90 13 percent probability that California will receive its Normal conditions scheduled deliveries 14 from 2008 through 2060. 15
Figure 4.4-21 California Modeled Annual Depletions
No Action Alternative 90th, 50th, and 10th Percentile Values
3.2
3.4
3.6
3.8
4.0
4.2
4.4
4.6
4.8
5.0
5.2
5.4
2005 2010 2015 2020 2025 2030 2035 2040 2045 2050 2055 2060
Year
Dep
letio
n (m
afy)
10th Percentile50th Percentile90th Percentile

Environmental Consequences Chapter 4
Draft EIS – Colorado River Interim Guidelines for Lower Basin Shortages and Coordinated Operations for Lake Powell and Lake Mea
4-109 February 2007
Comparison of Action Alternatives Without the Storage and Delivery Mechanism to No Action 1 Alternative. Figure 4.4-22 provides a comparison of the cumulative distribution of 2 California's depletions under the action alternatives without the storage and delivery 3 mechanism to those of the No Action Alternative during the interim period (years 2008 4 through 2026). The results presented in Figure 4.4-22 can be used to compare how often 5 California might expect deliveries above and below its 4.4 mafy apportionment due to 6 Surplus and Shortage conditions under the different alternatives. 7
8
Figure 4.4-23 provides a similar comparison of the cumulative distribution of water 9 deliveries to California under the action alternatives without the storage and delivery 10 mechanism to those of the No Action Alternative for the 34-year period (years 2027 11 through 2060) that would follow the interim period. 12
Figure 4.4-22 California Modeled Annual Depletions
Comparison of Action Alternatives (Without Storage and Delivery Mechanism) to No Action Alternative Years 2008 through 2026
3.2
3.4
3.6
3.8
4.0
4.2
4.4
4.6
4.8
5.0
5.2
5.4
0% 10% 20% 30% 40% 50% 60% 70% 80% 90% 100%
Percent of Values Greater than or Equal to
Ann
ual D
eple
tions
(maf
y)
No Action
Basin StatesConservation Before ShortageWater SupplyReservoir Storage

Chapter 4 Environmental Consequences
February 2007 4-110 Draft EIS – Colorado River Interim Guidelines for
Lower Basin Shortages and Coordinated Operations for Lake Powell and Lake Mead
1
Sensitivity of Total Water Deliveries to California to Storage and Delivery Mechanism. 2 California water deliveries under the Basin States, Conservation Before Shortage and 3 Reservoir Storage alternatives are impacted by modeling assumptions made to postulate 4 potential future participation in a storage and delivery mechanism (Appendix M). This 5 section isolates the impacts of those assumptions on California’s depletions. 6
Figure 4-4.24 provides a comparison of the cumulative distribution of California’s 7 depletions under the action alternatives that include a storage and delivery mechanism, 8 with and without the mechanism in place during the interim period. For alternatives with 9 the mechanism removed, occurrences of deliveries less than 4.4 mafy reflect only 10 Shortage conditions. Removing the mechanism shows that there is almost no occurrence 11 of deliveries less than 4.4 mafy due to Shortage conditions. The five percent occurrence 12 of deliveries less than 4.4 mafy when the mechanism is not in place reflects California’s 13 scheduled delivery of less than 4.4 maf in 2008 which coincides with scheduled 14 repayment of inadvertent overruns by IID and CVWD. 15
Figure 4.4-23 California Modeled Annual Depletions
Comparison of Action Alternatives (Without Storage and Delivery Mechanism) to No Action Alternative Years 2027 through 2060
3.2
3.4
3.6
3.8
4.0
4.2
4.4
4.6
4.8
5.0
5.2
5.4
0% 10% 20% 30% 40% 50% 60% 70% 80% 90% 100%
Percent of Values Greater than or Equal to
Ann
ual D
eple
tions
(maf
y)
No Action
Basin States
Conservation Before Shortage
Water Supply
Reservoir Storage
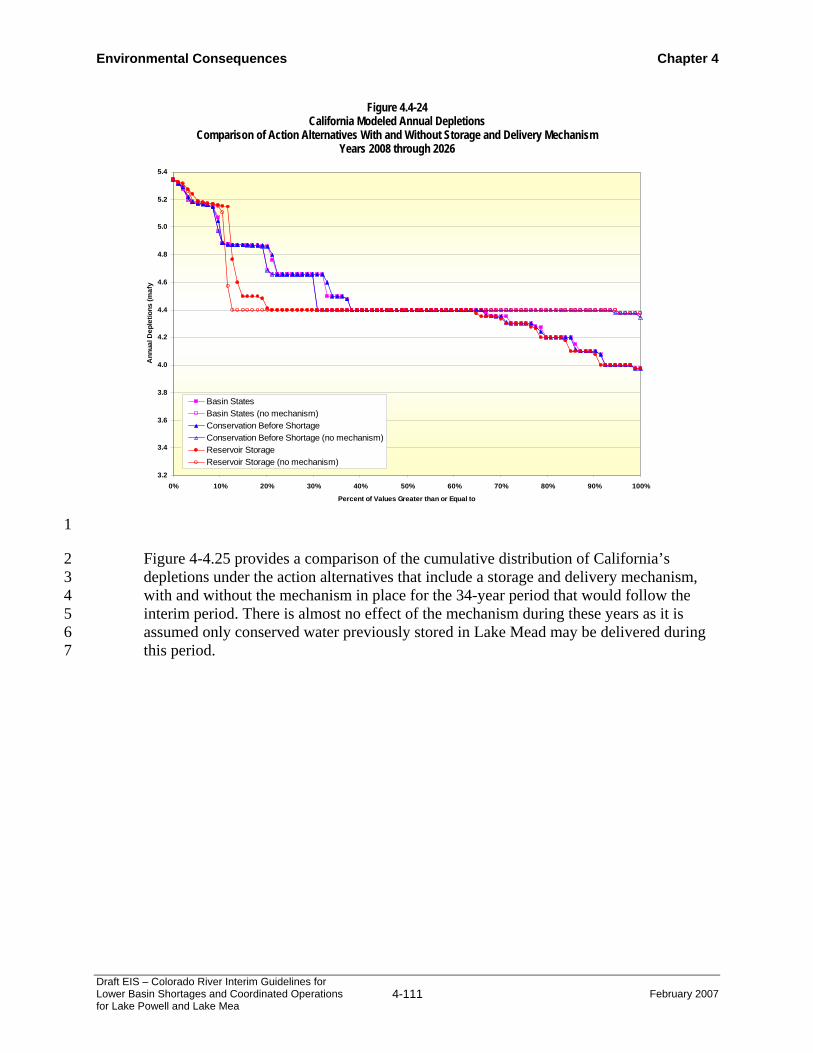
Environmental Consequences Chapter 4
Draft EIS – Colorado River Interim Guidelines for Lower Basin Shortages and Coordinated Operations for Lake Powell and Lake Mea
4-111 February 2007
1
Figure 4-4.25 provides a comparison of the cumulative distribution of California’s 2 depletions under the action alternatives that include a storage and delivery mechanism, 3 with and without the mechanism in place for the 34-year period that would follow the 4 interim period. There is almost no effect of the mechanism during these years as it is 5 assumed only conserved water previously stored in Lake Mead may be delivered during 6 this period. 7
Figure 4.4-24 California Modeled Annual Depletions
Comparison of Action Alternatives With and Without Storage and Delivery Mechanism Years 2008 through 2026
3.2
3.4
3.6
3.8
4.0
4.2
4.4
4.6
4.8
5.0
5.2
5.4
0% 10% 20% 30% 40% 50% 60% 70% 80% 90% 100%
Percent of Values Greater than or Equal to
Ann
ual D
eple
tions
(maf
y
Basin StatesBasin States (no mechanism)Conservation Before ShortageConservation Before Shortage (no mechanism)Reservoir StorageReservoir Storage (no mechanism)

Chapter 4 Environmental Consequences
February 2007 4-112 Draft EIS – Colorado River Interim Guidelines for
Lower Basin Shortages and Coordinated Operations for Lake Powell and Lake Mead
1
4.4.5.3 Total Water Deliveries to Nevada 2 This section presents the simulated water deliveries to Nevada under the No Action 3 Alternative and the action alternatives. 4
No Action Alternative. Water deliveries to Nevada are projected to fluctuate throughout the 5 53-year period of analysis reflecting variations in hydrologic conditions. The 90th, 50th, 6 and 10th percentile ranking of modeled water deliveries to Nevada under the No Action 7 Alternative are presented in Figure 4.4-26. Since the No Action Alternative does not 8 include a storage and delivery mechanism, deviations from annual deliveries of 300 kafy 9 are due to Shortage and Surplus conditions. 10
Figure 4.4-25 California Modeled Annual Depletions
Comparison of Action Alternatives With and Without Storage and Delivery Mechanism Years 2027 through 2060
3.2
3.4
3.6
3.8
4.0
4.2
4.4
4.6
4.8
5.0
5.2
5.4
0% 10% 20% 30% 40% 50% 60% 70% 80% 90% 100%
Percent of Values Greater than or Equal to
Ann
ual D
eple
tions
(maf
y
Basin StatesBasin States (no mechanism)Conservation Before ShortageConservation Before Shortage (no mechanism)Reservoir Storage (no mechanism)Reservoir Storage (no mechanism)
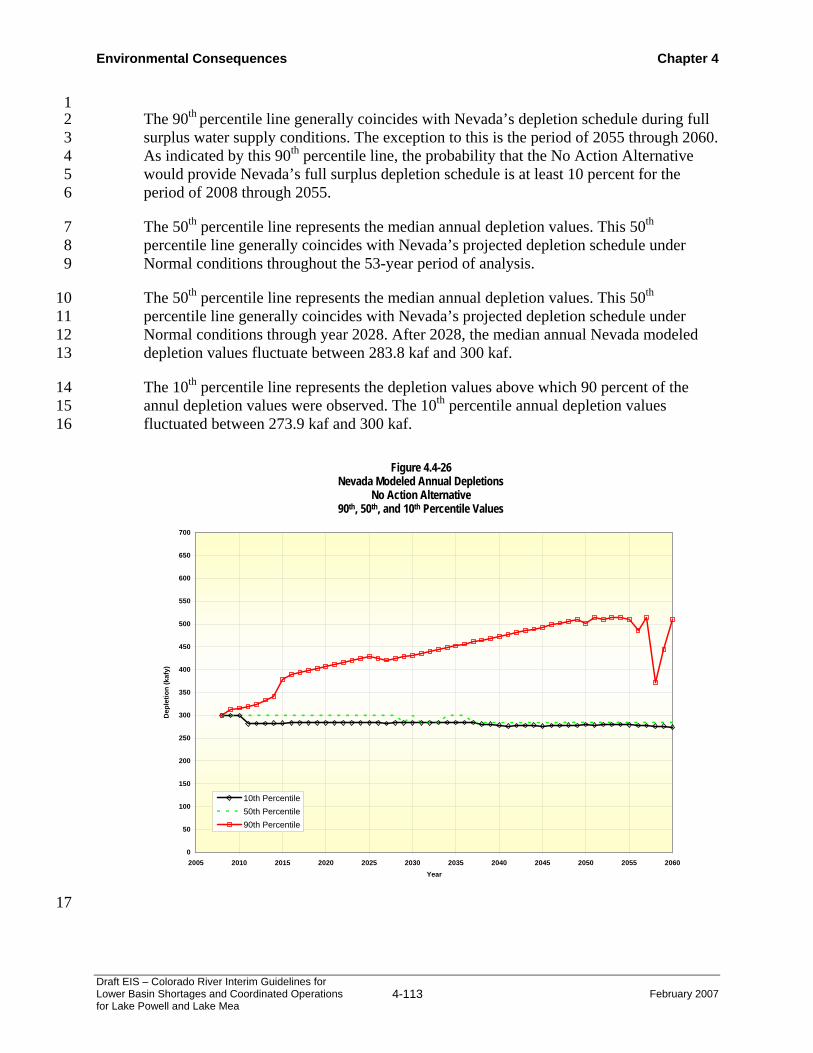
Environmental Consequences Chapter 4
Draft EIS – Colorado River Interim Guidelines for Lower Basin Shortages and Coordinated Operations for Lake Powell and Lake Mea
4-113 February 2007
1 The 90th percentile line generally coincides with Nevada’s depletion schedule during full 2 surplus water supply conditions. The exception to this is the period of 2055 through 2060. 3 As indicated by this 90th percentile line, the probability that the No Action Alternative 4 would provide Nevada’s full surplus depletion schedule is at least 10 percent for the 5 period of 2008 through 2055. 6
The 50th percentile line represents the median annual depletion values. This 50th 7 percentile line generally coincides with Nevada’s projected depletion schedule under 8 Normal conditions throughout the 53-year period of analysis. 9
The 50th percentile line represents the median annual depletion values. This 50th 10 percentile line generally coincides with Nevada’s projected depletion schedule under 11 Normal conditions through year 2028. After 2028, the median annual Nevada modeled 12 depletion values fluctuate between 283.8 kaf and 300 kaf. 13
The 10th percentile line represents the depletion values above which 90 percent of the 14 annul depletion values were observed. The 10th percentile annual depletion values 15 fluctuated between 273.9 kaf and 300 kaf. 16
17
Figure 4.4-26 Nevada Modeled Annual Depletions
No Action Alternative 90th, 50th, and 10th Percentile Values
0
50
100
150
200
250
300
350
400
450
500
550
600
650
700
2005 2010 2015 2020 2025 2030 2035 2040 2045 2050 2055 2060Year
Dep
letio
n (k
afy)
10th Percentile50th Percentile90th Percentile

Chapter 4 Environmental Consequences
February 2007 4-114 Draft EIS – Colorado River Interim Guidelines for
Lower Basin Shortages and Coordinated Operations for Lake Powell and Lake Mead
Comparison of Action Alternatives Without the Storage and Delivery Mechanism to No Action 1 Alternative. Figure 4.4-27 provides a comparison of the cumulative distribution of 2 Nevada's depletions under the action alternatives without the storage and delivery 3 mechanism to those of the No Action Alternative during the interim period (years 2008 4 through 2026). The results presented in Figure 4.4-27 can be used to compare how often 5 Nevada might expect deliveries above and below its 300 kafy apportionment due to 6 Surplus and Shortage conditions under the different alternatives. 7
8
Figure 4.4-28 provides a similar comparison of the cumulative distribution of water 9 deliveries to Nevada under the action alternatives without the storage and delivery 10 mechanism to those of the No Action Alternative for the 34-year period (years 2027 11 through 2060) that would follow the interim period. 12
Figure 4.4-27 Nevada Modeled Annual Depletions
Comparison of Action Alternatives (Without Storage and Delivery Mechanism) to No Action Alternative Years 2008 through 2026
0
50
100
150
200
250
300
350
400
450
500
550
600
0% 10% 20% 30% 40% 50% 60% 70% 80% 90% 100%
Percent of Values Greater than or Equal to
Ann
ual D
eple
tions
(kaf
y)
No ActionBasin StatesConservation Before ShortageWater SupplyReservoir Storage

Environmental Consequences Chapter 4
Draft EIS – Colorado River Interim Guidelines for Lower Basin Shortages and Coordinated Operations for Lake Powell and Lake Mea
4-115 February 2007
1
Sensitivity of Total Water Deliveries to Nevada to Storage and Delivery Mechanism. Nevada 2 water deliveries under the Basin States, Conservation Before Shortage and Reservoir 3 Storage alternatives are impacted by the modeling assumptions made to postulate 4 potential future participation in a storage and delivery mechanism (Appendix M). This 5 section isolates the impacts of those assumptions on Nevada’s modeled depletions. 6
Figure 4-4.29 provides a comparison of the cumulative distribution of Nevada’s 7 depletions under the action alternatives that include a storage and delivery mechanism, 8 with and without the mechanism in place during the interim period. With the mechanism 9 removed the occurrence of deliveries greater than 300 kafy is about 55 percent less under 10 the Basin States and Conservation Before Shortage alternatives. Under the Reservoir 11 Storage Alternative the occurrence of deliveries above 300 kafy is about 70 percent less 12 with the mechanism removed. This indicates that the majority of the occurrences of 13 deliveries above 300 kafy in the Basin States, Conservation Before Shortage and 14 Reservoir Storage alternatives can be attributed to the delivery of conserved and non-15 system water to Nevada. Also, the magnitude of the deliveries above 300 kafy is less with 16 the storage and delivery mechanism not in place. Under the Basin States and 17
Figure 4.4-28 Nevada Modeled Annual Depletions
Comparison of Action Alternatives (Without Storage and Delivery Mechanism) to No Action Alternative Years 2027 through 2060
0
50
100
150
200
250
300
350
400
450
500
550
600
0% 10% 20% 30% 40% 50% 60% 70% 80% 90% 100%
Percent of Values Greater than or Equal to
Ann
ual D
eple
tions
(kaf
y)
No ActionBasin StatesConservation Before ShortageWater SupplyReservoir Storage
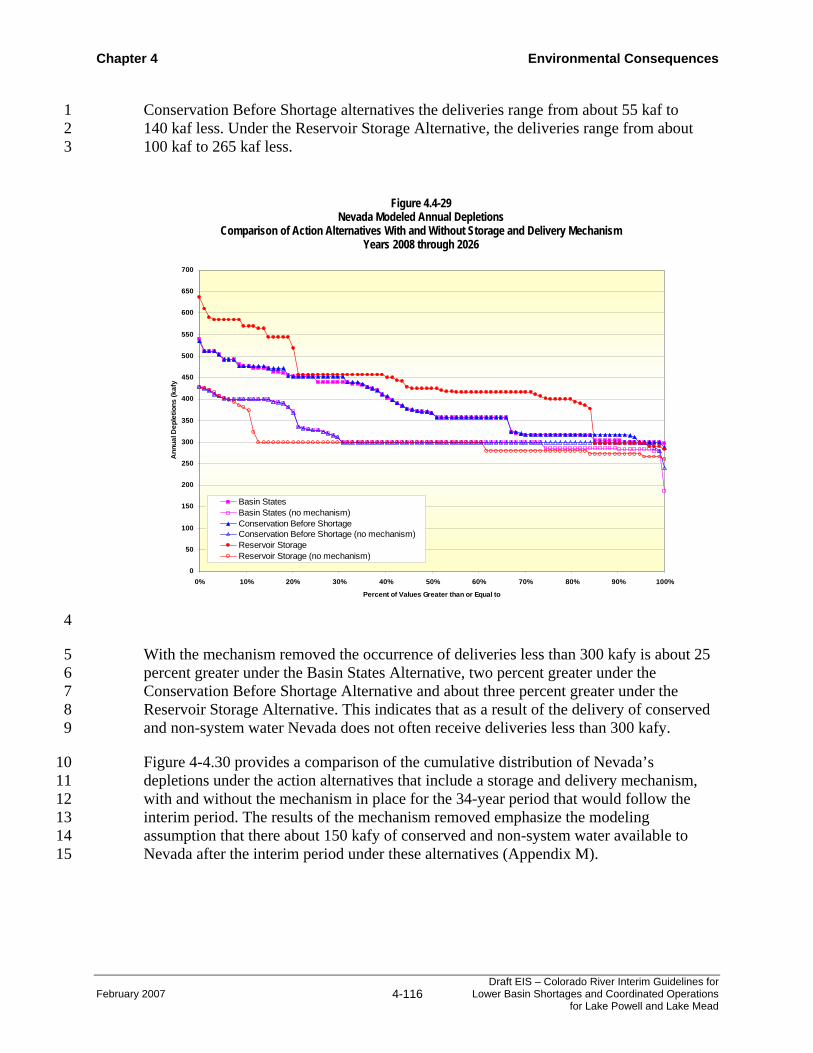
Chapter 4 Environmental Consequences
February 2007 4-116 Draft EIS – Colorado River Interim Guidelines for
Lower Basin Shortages and Coordinated Operations for Lake Powell and Lake Mead
Conservation Before Shortage alternatives the deliveries range from about 55 kaf to 1 140 kaf less. Under the Reservoir Storage Alternative, the deliveries range from about 2 100 kaf to 265 kaf less. 3
4
With the mechanism removed the occurrence of deliveries less than 300 kafy is about 25 5 percent greater under the Basin States Alternative, two percent greater under the 6 Conservation Before Shortage Alternative and about three percent greater under the 7 Reservoir Storage Alternative. This indicates that as a result of the delivery of conserved 8 and non-system water Nevada does not often receive deliveries less than 300 kafy. 9
Figure 4-4.30 provides a comparison of the cumulative distribution of Nevada’s 10 depletions under the action alternatives that include a storage and delivery mechanism, 11 with and without the mechanism in place for the 34-year period that would follow the 12 interim period. The results of the mechanism removed emphasize the modeling 13 assumption that there about 150 kafy of conserved and non-system water available to 14 Nevada after the interim period under these alternatives (Appendix M). 15
Figure 4.4-29 Nevada Modeled Annual Depletions
Comparison of Action Alternatives With and Without Storage and Delivery Mechanism Years 2008 through 2026
0
50
100
150
200
250
300
350
400
450
500
550
600
650
700
0% 10% 20% 30% 40% 50% 60% 70% 80% 90% 100%
Percent of Values Greater than or Equal to
Ann
ual D
eple
tions
(kaf
y
Basin StatesBasin States (no mechanism)Conservation Before ShortageConservation Before Shortage (no mechanism)Reservoir StorageReservoir Storage (no mechanism)
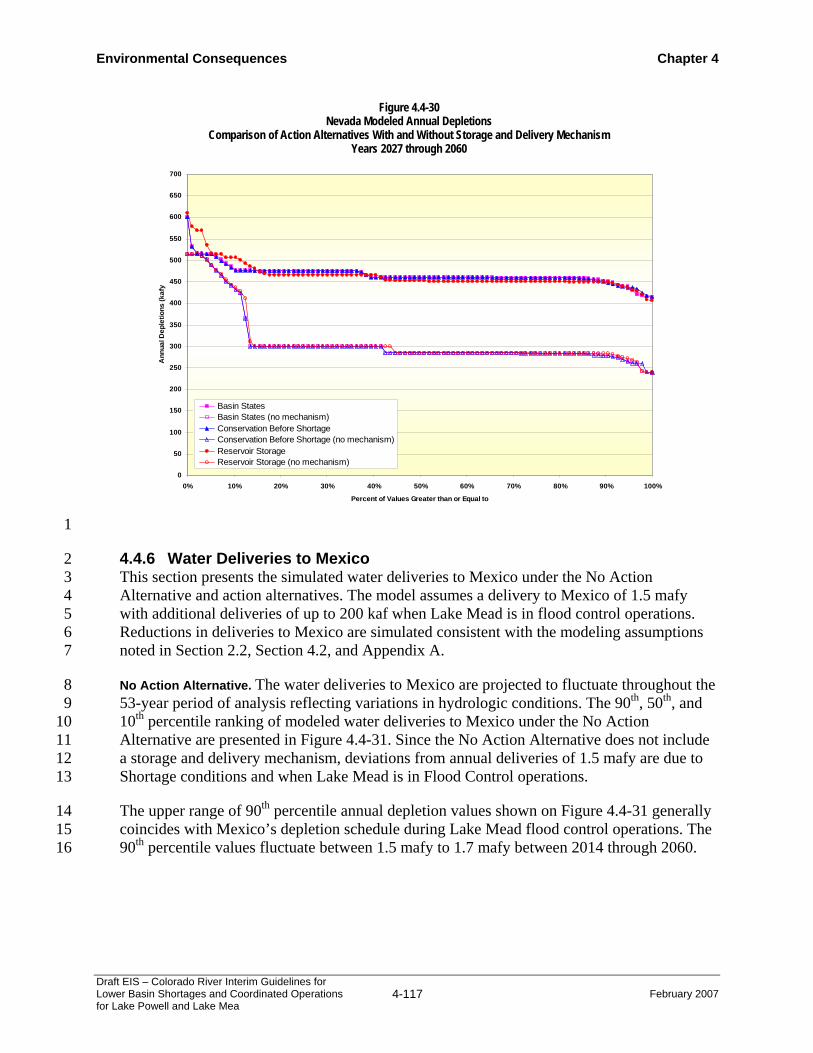
Environmental Consequences Chapter 4
Draft EIS – Colorado River Interim Guidelines for Lower Basin Shortages and Coordinated Operations for Lake Powell and Lake Mea
4-117 February 2007
1
4.4.6 Water Deliveries to Mexico 2 This section presents the simulated water deliveries to Mexico under the No Action 3 Alternative and action alternatives. The model assumes a delivery to Mexico of 1.5 mafy 4 with additional deliveries of up to 200 kaf when Lake Mead is in flood control operations. 5 Reductions in deliveries to Mexico are simulated consistent with the modeling assumptions 6 noted in Section 2.2, Section 4.2, and Appendix A. 7
No Action Alternative. The water deliveries to Mexico are projected to fluctuate throughout the 8 53-year period of analysis reflecting variations in hydrologic conditions. The 90th, 50th, and 9 10th percentile ranking of modeled water deliveries to Mexico under the No Action 10 Alternative are presented in Figure 4.4-31. Since the No Action Alternative does not include 11 a storage and delivery mechanism, deviations from annual deliveries of 1.5 mafy are due to 12 Shortage conditions and when Lake Mead is in Flood Control operations. 13
The upper range of 90th percentile annual depletion values shown on Figure 4.4-31 generally 14 coincides with Mexico’s depletion schedule during Lake Mead flood control operations. The 15 90th percentile values fluctuate between 1.5 mafy to 1.7 mafy between 2014 through 2060. 16
Figure 4.4-30 Nevada Modeled Annual Depletions
Comparison of Action Alternatives With and Without Storage and Delivery Mechanism Years 2027 through 2060
0
50
100
150
200
250
300
350
400
450
500
550
600
650
700
0% 10% 20% 30% 40% 50% 60% 70% 80% 90% 100%
Percent of Values Greater than or Equal to
Ann
ual D
eple
tions
(kaf
y
Basin StatesBasin States (no mechanism)Conservation Before ShortageConservation Before Shortage (no mechanism)Reservoir StorageReservoir Storage (no mechanism)

Chapter 4 Environmental Consequences
February 2007 4-118 Draft EIS – Colorado River Interim Guidelines for
Lower Basin Shortages and Coordinated Operations for Lake Powell and Lake Mead
1
The 50th percentile line represents the median annual depletion values in years 2008 and 2 2028. After 2028, the 50th percentile annual depletion values fluctuate between 1.419 maf 3 and 1.5 maf. The drop in the modeled water deliveries to Mexico below Mexico’s 1.5 maf 4 allotment reflects the modeling assumptions with respect to shortages. 5
The 10th percentile line represents the median annual depletion values in years 2008 and 6 2010 and fall to 1.408 in 2011. After 2011, the annual depletion values fluctuate between 7 1.369 mafy and 1.421 mafy. The drop in the modeled water deliveries to Mexico below 8 Mexico’s 1.5 maf allotment reflects the modeling assumptions with respect to shortages. 9
Comparison of Action Alternatives Without the Storage and Delivery Mechanism to No Action 10 Alternative. Figure 4.4-32 provides a comparison of the cumulative distribution of Mexico's 11 depletions under the action alternatives without the storage and delivery mechanism to those 12 of the No Action Alternative during the interim period (years 2008 through 2026). The 13 results presented in Figure 4.4-32 can be used to compare how often Mexico might expect 14 deliveries above and below its 1944 Treaty allocation of 1.5 maf due to Surplus and Shortage 15
Figure 4.4-31 Mexico Modeled Annual Depletions
No Action Alternative 90th, 50th, and 10th Percentile Values
0.8
0.9
1.0
1.1
1.2
1.3
1.4
1.5
1.6
1.7
1.8
1.9
2.0
2005 2010 2015 2020 2025 2030 2035 2040 2045 2050 2055 2060Year
Dep
letio
n (m
afy)
10th Percentile50th Percentile90th Percentile

Environmental Consequences Chapter 4
Draft EIS – Colorado River Interim Guidelines for Lower Basin Shortages and Coordinated Operations for Lake Powell and Lake Mea
4-119 February 2007
conditions under the different alternatives. The occurrences of deliveries greater than 1.5 afy 1 reflect both times when additional water up to 200 kafy is made available during Flood 2 Control conditions. The occurrences of deliveries less than 1.5 mafy reflect deliveries to 3 Mexico during Shortage conditions and reflect the modeling assumptions with regard to the 4 sharing of shortages between the Lower Division states and Mexico. 5
6
7
Figure 4.4-33 provides a similar comparison of the cumulative distribution of the water 8 deliveries to Mexico under the action alternatives without the storage and delivery 9 mechanism to those of the No Action Alternative for the 34-year period (years 2027 through 10 2060) that would follow the interim period. 11
Figure 4.4-32 Mexico Modeled Annual Depletions
Comparison of Action Alternatives (Without Storage and Delivery Mechanism) to No Action Alternative Years 2008 through 2026
0.8
0.9
1.0
1.1
1.2
1.3
1.4
1.5
1.6
1.7
1.8
0% 10% 20% 30% 40% 50% 60% 70% 80% 90% 100%
Percent of Values Greater than or Equal to
Ann
ual D
eple
tions
(maf
y)
No Action
Basin States
Conservation Before Shortage
Water Supply
Reservoir Storage

Chapter 4 Environmental Consequences
February 2007 4-120 Draft EIS – Colorado River Interim Guidelines for
Lower Basin Shortages and Coordinated Operations for Lake Powell and Lake Mead
1
Sensitivity of Total Water Deliveries to Mexico to Storage and Delivery Mechanism. As noted 2 before, modeling was performed to support the analysis of the storage and delivery 3 mechanism (Appendix M). At this time, it is unknown which entities might participate in this 4 proposed mechanism that allows the storage and delivery of conserved system and non-5 system water. Furthermore, the timing and magnitude of the storage and delivery of 6 conserved water is unknown. However, modeling assumptions with respect to the entities 7 that might participate and their respective level of participation were needed to enable the 8 analysis of the mechanism and its potential effects on environmental resources, particularly 9 to reservoir storage and river flows below Lake Mead. 10
The results of the analysis that compares the cumulative distribution of Mexico's depletions 11 under the action alternatives with and without the storage and delivery mechanism to those of 12 the No Action Alternative are provided in Appendix P. The modeling assumptions are not 13 intended to constitute an interpretation or application of the 1944 Treaty or to represent 14 current or future United States policy regarding deliveries to Mexico. 15
Figure 4.4-33 Mexico Modeled Annual Depletions
Comparison of Action Alternatives (Without Storage and Delivery Mechanism) to No Action Alternative Years 2027 through 2060
0.8
0.9
1.0
1.1
1.2
1.3
1.4
1.5
1.6
1.7
1.8
0% 10% 20% 30% 40% 50% 60% 70% 80% 90% 100%
Percent of Values Greater than or Equal to
Ann
ual D
eple
tions
(maf
y)
No ActionBasin StatesConservation Before ShortageWater SupplyReservoir Storage

Environmental Consequences Chapter 4
Draft EIS – Colorado River Interim Guidelines for Lower Basin Shortages and Coordinated Operations for Lake Powell and Lake Mea
4-121 February 2007
4.4.7 Distribution of Shortages to and within the Lower Division States 1 Although the Consolidated Decree and the CRBPA provide some direction to the Secretary 2 with regard to the distribution of shortages to the Lower Division states, no specific 3 guidelines exist with regard to exactly how those shortages would be distributed. 4 Furthermore, although priority systems exist within each state, exactly how shortages would 5 be distributed to water users of equal priority within a state is unknown. Therefore, specific 6 modeling assumptions were made in order to facilitate the comparison of each alternative. 7 These assumptions are discussed in Section 4.2, Appendix A, and Appendix G and are 8 consistent between all alternatives. 9
4.4.7.1 Distribution of Shortages within Arizona 10 Table 4.4-11 shows different Lower Basin shortage volumes and the portion of the 11 shortage that was assumed to be distributed to Arizona. This table shows the shortage 12 distribution in different years because the distribution changes at the higher magnitudes 13 of shortage due to the changes in the scheduled use of the Arizona 4th Priority water users 14 (Section 4.2). 15
16 Table 4.4-11
Shortage Allocation to Arizona (af)
Total Lower Basin Shortage Year 200,000 400,000 500,000 600,000 800,000 1,200,000 1,800,000 2,500,000 2008 160,000 320,000 400,000 480,000 640,000 960,000 1,440,000 1,587,484 2017 160,000 320,000 400,000 480,000 640,000 960,000 1,397,578 1,533,925 2026 160,000 320,000 400,000 480,000 640,000 960,000 1,394,205 1,530,879 2027 160,000 320,000 400,000 480,000 640,000 960,000 1,393,837 1,530,547 2040 160,000 320,000 400,000 480,000 640,000 960,000 1,388,281 1,525,531 2060 160,00 320,000 400,000 480,000 640,000 960,000 1,388,281 1,525,531
17
As noted in Table 4.4-11, total Lower Basin shortages up to 2.5 maf were analyzed to 18 fully analyze the range of total Lower Basin shortages that could occur. 19
Table 4.4-12 and Table 4.4-13 provide the probability of occurrence of the total Lower 20 Basin Shortage volumes that are shown in Table 4.4-11 for two periods, 2008 through 21 2026 and 2027 through 2060, respectively. The probability of shortages with a magnitude 22 of zero includes periods when Surplus or Normal conditions are in effect. 23
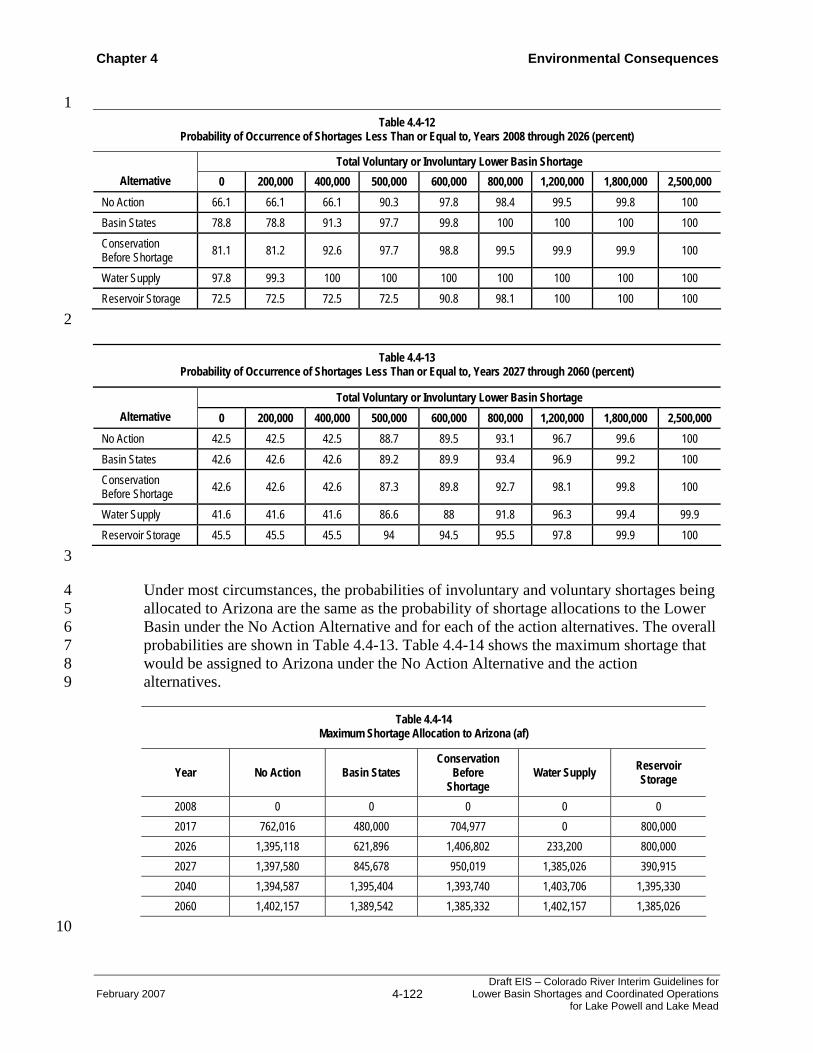
Chapter 4 Environmental Consequences
February 2007 4-122 Draft EIS – Colorado River Interim Guidelines for
Lower Basin Shortages and Coordinated Operations for Lake Powell and Lake Mead
1 Table 4.4-12
Probability of Occurrence of Shortages Less Than or Equal to, Years 2008 through 2026 (percent)
Total Voluntary or Involuntary Lower Basin Shortage Alternative 0 200,000 400,000 500,000 600,000 800,000 1,200,000 1,800,000 2,500,000
No Action 66.1 66.1 66.1 90.3 97.8 98.4 99.5 99.8 100 Basin States 78.8 78.8 91.3 97.7 99.8 100 100 100 100 Conservation Before Shortage 81.1 81.2 92.6 97.7 98.8 99.5 99.9 99.9 100
Water Supply 97.8 99.3 100 100 100 100 100 100 100 Reservoir Storage 72.5 72.5 72.5 72.5 90.8 98.1 100 100 100
2
Table 4.4-13 Probability of Occurrence of Shortages Less Than or Equal to, Years 2027 through 2060 (percent)
Total Voluntary or Involuntary Lower Basin Shortage Alternative 0 200,000 400,000 500,000 600,000 800,000 1,200,000 1,800,000 2,500,000
No Action 42.5 42.5 42.5 88.7 89.5 93.1 96.7 99.6 100 Basin States 42.6 42.6 42.6 89.2 89.9 93.4 96.9 99.2 100 Conservation Before Shortage 42.6 42.6 42.6 87.3 89.8 92.7 98.1 99.8 100
Water Supply 41.6 41.6 41.6 86.6 88 91.8 96.3 99.4 99.9 Reservoir Storage 45.5 45.5 45.5 94 94.5 95.5 97.8 99.9 100
3
Under most circumstances, the probabilities of involuntary and voluntary shortages being 4 allocated to Arizona are the same as the probability of shortage allocations to the Lower 5 Basin under the No Action Alternative and for each of the action alternatives. The overall 6 probabilities are shown in Table 4.4-13. Table 4.4-14 shows the maximum shortage that 7 would be assigned to Arizona under the No Action Alternative and the action 8 alternatives. 9
Table 4.4-14 Maximum Shortage Allocation to Arizona (af)
Year No Action Basin States Conservation
Before Shortage
Water Supply Reservoir Storage
2008 0 0 0 0 0 2017 762,016 480,000 704,977 0 800,000 2026 1,395,118 621,896 1,406,802 233,200 800,000 2027 1,397,580 845,678 950,019 1,385,026 390,915 2040 1,394,587 1,395,404 1,393,740 1,403,706 1,395,330 2060 1,402,157 1,389,542 1,385,332 1,402,157 1,385,026
10

Environmental Consequences Chapter 4
Draft EIS – Colorado River Interim Guidelines for Lower Basin Shortages and Coordinated Operations for Lake Powell and Lake Mea
4-123 February 2007
While shortage allocations to California and Nevada would affect single entities within 1 each state (MWD in California and SWNA in Nevada) allocations within Arizona are 2 distributed among a number of water users based upon Arizona’s system of water rights 3 priorities (Section 3.4 and Appendix G). This shortage distribution is based solely on 4 current priorities and does not reflect management decisions that may be taken by 5 Arizona entities to obtain additional water supplies to offset shortages. Table 4.4-15 6 summarizes how shortages of different volumes in Arizona would be distributed among 7 Arizona’s priorities and how this distribution changes over time. The table also does not 8 show 5th priority users and the CAP Bank who now rely on unused and surplus water 9 because by 2017 no unused water will be available to the 5th priority users and surplus 10 water will not be available in shortage years. 11
Table 4.4-15 Distribution of Shortages Among Arizona Entities1 (af)
Lower Basin Shortage Allocations 200,000 400,000 500,000 600,000 800,000 1,200,000 1,800,000 2,500,000
Year 2017 CAP Non-Indian Agricultural Priority
142,684 272,691 272,691 272,691 272,691 272,691 272,691 272,691
CAP Tribes 0 2,553 16,920 62,958 114,969 218,772 357,350 367,977 CAP M&I 0 10,124 67,099 92,402 183,074 364,639 605,637 610,313 4th Priority Users on Mainstream 9,807 19,614 24,517 29,421 39,227 58,841 84,825 84,825 2nd and 3rd Priority (Includes Some CAP Users) 0 0 0 0 0 0 13,653 149,999
Year 2026 CAP Non-Indian Agricultural Priority
65,979 65,979 65,979 65,979 65,979 65,979 65,979 65,979
CAP Tribes 38,941 111,547 151,901 175,815 227,576 331,099 467,921 478,430 CAP M&I 37,378 107,070 137,866 185,101 275,637 456,711 694,543 699,167 4th Priority Users on Mainstream 10,212 20,425 25,531 30,637 40,850 61,275 88,046 88,046 2nd and 3rd Priority (Includes Some CAP Users) 0 0 0 0 0 0 14,785 151,460
Year 2027 CAP Non-Indian Agricultural Priority
31,869 31,867 31,867 31,867 31,867 31,867 31,867 31,867
CAP Tribes 61,303 140,306 178,018 202,008 253,748 357,229 493,846 504,338 CAP M&I 49,070 112,307 145,717 192,848 283,349 464,351 701,812 706,429 4th Priority Users on Mainstream 10,272 20,544 25,680 30,817 41,089 61,633 88,529 88,529 2nd and 3rd Priority (Includes Some CAP Users) 0 0 0 0 0 0 14,909 151,620
12

Chapter 4 Environmental Consequences
February 2007 4-124 Draft EIS – Colorado River Interim Guidelines for
Lower Basin Shortages and Coordinated Operations for Lake Powell and Lake Mead
1 Table 4.4-15 (continued)
Distribution of Shortages Among Arizona Entities (af)
Lower Basin Shortage Allocations 200,000 400,000 500,000 600,000 800,000 1,200,000 1,800,000 2,500,000
Year 2040 CAP Non-Indian Agricultural Priority
0 0 0 0 0 0 0 0
CAP Tribes 74,171 138,517 156,515 181,583 233,056 336,001 469,648 480,025 CAP M&I 55,727 132,886 185,640 231,324 321,356 501,419 733,523 738,089 4th Priority Users on Mainstream 11,048 22,096 27,620 33,144 44,192 66,288 94,702 94,702 2nd and 3rd Priority (Includes Some CAP Users) 0 0 0 0 0 0 16,791 154,042
Year 2060 CAP Non-Indian Agricultural Priority
0 0 0 0 0 0 0 0
CAP Tribes 132,218 172,941 186,015 211,449 262,604 339,336 497,743 508,120 CAP M&I 90,217 190,126 247,367 292,248 381,725 560,677 791,351 795,917 4th Priority Users on Mainstream 11,968 23,935 29,919 35,903 47,870 71,806 102,584 102,584 2nd and 3rd Priority (Includes Some CAP Users) 0 0 0 0 0 0 16,791 154,042
1 CAP users incur five percent conveyance loss through the CAP system due to seepage and therefore the sum of the Arizona shortages in any one column do not add up to the total shortage volume allocated to Arizona at each Lower Basin Shortage increment noted at the top of the table.
2
A major change in the allocation of Arizona shortages occurs during 2017 and 2040 3 within the CAP and can be seen in Table 4.4-15. The allocation of shortages to individual 4 users within the CAP is affected by the water priority scheme within the CAP, the 5 AWSA, and the water use buildup schedules for the CAP users. Over time, the impact of 6 a given shortage to the CAP increasingly impacts the higher priority Indian and M&I 7 users as their use builds up and the shortage cannot be absorbed by the lower priorities. 8
Prior to the enactment of the AWSA, there were differing views as to how mild shortages 9 would be distributed between the CAP Indian and M&I priority users. As part of the 10 AWSA, a compromise was reached. Also, under the AWSA, the CAP irrigation districts 11 agreed to relinquish their long-term water service subcontracts for Non-Indian 12 Agricultural priority water. Approximately 300 kaf was relinquished, with approximately 13 200 kaf being made available for Indian water rights settlements and approximately 100 14 kaf was made available for future M&I use. In return, the irrigation districts obtained 15 CAP distribution system debt relief, relief from the acreage limitation provisions of 16 Federal Reclamation law, and a commitment from the CAP to receive an interim water 17 supply at an affordable rate. 18
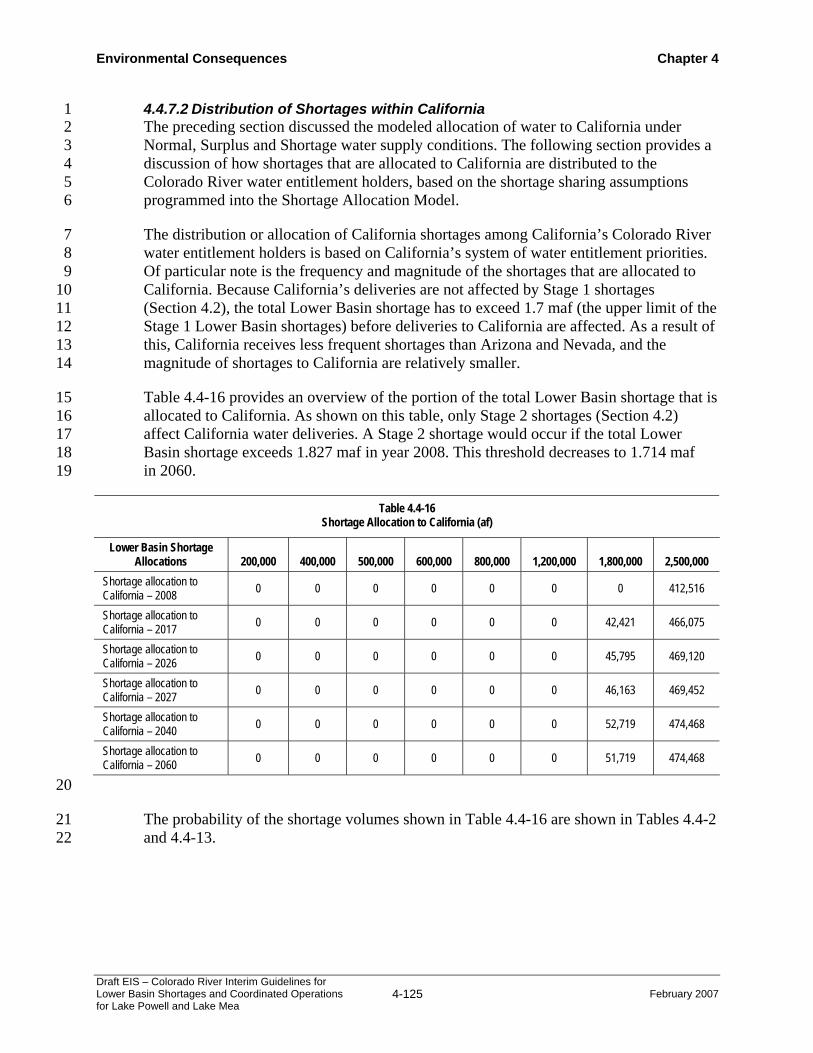
Environmental Consequences Chapter 4
Draft EIS – Colorado River Interim Guidelines for Lower Basin Shortages and Coordinated Operations for Lake Powell and Lake Mea
4-125 February 2007
4.4.7.2 Distribution of Shortages within California 1 The preceding section discussed the modeled allocation of water to California under 2 Normal, Surplus and Shortage water supply conditions. The following section provides a 3 discussion of how shortages that are allocated to California are distributed to the 4 Colorado River water entitlement holders, based on the shortage sharing assumptions 5 programmed into the Shortage Allocation Model. 6
The distribution or allocation of California shortages among California’s Colorado River 7 water entitlement holders is based on California’s system of water entitlement priorities. 8 Of particular note is the frequency and magnitude of the shortages that are allocated to 9 California. Because California’s deliveries are not affected by Stage 1 shortages 10 (Section 4.2), the total Lower Basin shortage has to exceed 1.7 maf (the upper limit of the 11 Stage 1 Lower Basin shortages) before deliveries to California are affected. As a result of 12 this, California receives less frequent shortages than Arizona and Nevada, and the 13 magnitude of shortages to California are relatively smaller. 14
Table 4.4-16 provides an overview of the portion of the total Lower Basin shortage that is 15 allocated to California. As shown on this table, only Stage 2 shortages (Section 4.2) 16 affect California water deliveries. A Stage 2 shortage would occur if the total Lower 17 Basin shortage exceeds 1.827 maf in year 2008. This threshold decreases to 1.714 maf 18 in 2060. 19
Table 4.4-16 Shortage Allocation to California (af)
Lower Basin Shortage Allocations 200,000 400,000 500,000 600,000 800,000 1,200,000 1,800,000 2,500,000
Shortage allocation to California – 2008 0 0 0 0 0 0 0 412,516
Shortage allocation to California – 2017 0 0 0 0 0 0 42,421 466,075
Shortage allocation to California – 2026 0 0 0 0 0 0 45,795 469,120
Shortage allocation to California – 2027 0 0 0 0 0 0 46,163 469,452
Shortage allocation to California – 2040 0 0 0 0 0 0 52,719 474,468
Shortage allocation to California – 2060 0 0 0 0 0 0 51,719 474,468
20
The probability of the shortage volumes shown in Table 4.4-16 are shown in Tables 4.4-2 21 and 4.4-13. 22

Chapter 4 Environmental Consequences
February 2007 4-126 Draft EIS – Colorado River Interim Guidelines for
Lower Basin Shortages and Coordinated Operations for Lake Powell and Lake Mead
Table 4.4-17 shows the maximum shortage volumes that would be assigned to California 1 under the No Action Alternative and the four action alternatives. Because of the large 2 magnitude Lower Basin shortages assumed to be required to trigger shortages in 3 California, many shortages declared in the Lower Basin would not trigger shortages in 4 California. 5
Table 4.4-17 Maximum Shortage Allocation to California (af)
Year No Action Basin States
Conservation Before
Shortage Water Supply Reservoir Storage
2008 0 0 0 0 0 2017 0 0 0 0 0 2026 45,798 0 81,835 0 0 2027 55,625 0 0 511,784 0 2040 68,599 70,931 66,220 96,968 70,717 2060 91,745 52,187 51,389 91,745 51,356
6
Maximum shortage values presented in Table 4.4-17 for California vary with both the 7 maximum level of declared shortage in the Lower Basin and with the timing of the 8 shortage. Under almost all conditions, the California shortage is allocated to the MWD. 9 However, under the maximum shortage amount that occurs under the Water Supply 10 Alternative, which occurs less than one percent of the time, the shortage allocated to 11 California would include a very small portion of shortage (4,203 af) that would be 12 allocated to other California users. 13
4.4.7.3 Distribution of Shortages to Nevada 14 Table 4.4-18 shows different Lower Basin shortage volumes and the portion of the 15 shortage that is allocated to Nevada. The shortage allocation to Nevada represents 16 approximately 3.33 percent of the total Lower Basin shortage amount. This percentage 17 does not vary with time and is distributed among users served by the SNWA. 18
Table 4.4-18 Shortage Allocation to Nevada (af)
Lower Basin Shortage
Allocations 200,000 400,000 500,000 600,000 800,000 1,200,000 1,800,000 2,500,000
Shortage allocation to Nevada 6,667 13,333 16,667 20,000 26,667 40,000 60,000 83,333
19
The probability of occurrence of the shortage volumes shown in Table 4.4-18 are shown 20 in Tables 4.4-12 and 4.4-13. 21

Environmental Consequences Chapter 4
Draft EIS – Colorado River Interim Guidelines for Lower Basin Shortages and Coordinated Operations for Lake Powell and Lake Mea
4-127 February 2007
Table 4.4-19 shows the maximum shortage volumes that would be assigned to Nevada 1 under the No Action Alternative and action alternatives for selected years. 2
Table 4.4-19 Maximum Shortage Allocation to Nevada (af)
Year No Action Basin States
Conservation Before
Shortage Water Supply Reservoir Storage
2008 0 0 0 0 0 2017 31,750 20,000 29,375 0 33,333 2026 60,000 23,710 62,025 9,300 33,333 2027 60,565 35,235 39,585 84,290 16,290 2040 60,965 61,100 60,630 65,530 61,085 2060 62,245 60,185 59,620 62,245 59,580
3
4.4.7.4 Distribution of Shortages to Mexico 4 As discussed in Section 4.2, for modeling purposes an assumption was made that 5 Mexico’s delivery would be reduced below 1.5 mafy when Lower Basin shortages occur. 6 The amount of the reduction is 16.67 percent of the total Lower Basin shortage volume. 7 The shortage distribution to Mexico is summarized in Table 4.4-20. 8
Table 4.4-20 Shortage Distribution to Mexico (af)1
Lower Basin Shortage Allocations 200,000 400,000 500,000 600,000 800,000 1,200,000 1,800,000 2,500,000
Shortage allocation to Mexico 33,333 66,667 83,333 100,000 133,333 200,000 300,000 416,667
1. These modeling assumptions do not reflect policy decisions and are not intended to constitute an interpretation or application of the 1944 Treaty.
9
The probability of involuntary shortages being allocated to Mexico are the same as the 10 probability of Lower Basin shortage. The probability of the shortage volumes shown in 11 Table 4.4-20 under the No Action Alternative and for each of the action alternatives are 12 shown in Tables 4.4-12 and 4.4-13. 13
This table indicates that, while the proportion of the Lower Basin shortage distributed to 14 Mexico is constant, the probability of the occurrence of shortage increases over time. 15 Table 4.4-21 below, shows the maximum shortage that would be distributed to Mexico 16 under the No Action Alternative and the action alternatives. 17

Chapter 4 Environmental Consequences
February 2007 4-128 Draft EIS – Colorado River Interim Guidelines for
Lower Basin Shortages and Coordinated Operations for Lake Powell and Lake Mead
Table 4.4-21 Maximum Shortage Allocation to Mexico1 (af)
Year No Action Alternative Basin States
Conservation Before
Shortage Water Supply Reservoir Storage
2008 0 0 0 0 0 2017 158,750 100,000 146,870 0 166,667 2026 300,025 118,560 310,135 46,500 166,667 2027 302,830 176,185 197,920 421,440 81,440 2040 304,830 305,485 304,160 312,640 305,425 2060 311,230 300,935 298,090 311,230 297,895
1. These modeling assumptions do not reflect policy decisions and are not intended to constitute an interpretation or application of the 1944 Treaty.
1 4.4.8 Summary 2 The following conclusions were drawn from the analyses of water deliveries. 3
4.4.8.1 Normal Conditions 4 All of the action alternatives improve water supply conditions during the interim period 5 relative to the No Action Alternative, improve the probability that normal deliveries will 6 be met, and reduce the probability that Shortage condition deliveries will occur. The 7 differences between the action alternatives and the No Action Alternative, in terms of the 8 probability of occurrence for Normal conditions water supply deliveries, diminish after 9 2027 and converge by about 2038. 10
4.4.8.2 Surplus Conditions 11 The Water Supply Alternative exhibits the same probability of Surplus condition 12 deliveries as the No Action Alternative (between about 30 to 40 percent) between 2008 13 and 2016 due to the provisions for the Partial Domestic Surplus as provided in the ISG. 14 The ISG provisions terminate under the No Action Alternative in 2016. These conditions 15 are retained in the Water Supply Alternative through 2026 and therefore this alternative 16 consistently provides the highest probability of Surplus condition deliveries during the 17 interim period. The Reservoir Storage Alternative exhibits the lowest probabilities 18 (between about 10 to 20 percent) during the interim period because surplus 19 determinations are limited to Quantified and Flood Control Surplus conditions beginning 20 in 2008. The surplus provisions under the Basin States and Conservation Before Shortage 21 alternatives are similar and the probability of Surplus conditions between 2010 and the 22 probability of occurrence through 2016 is slightly less than under the No Action 23 Alternative due to the absence of the Partial Domestic Surplus provision in these two 24 alternative. After the end of the interim period in 2026 the probability for all alternatives 25 converges to between 10 and 20 percent. 26
The mechanism to deliver and store conserved and system and non-system water 27 assumed as part of the Basin States, Conservation Before Shortage and Reservoir Storage 28 alternatives has the effect of increasing the occurrence of a Surplus Condition. The 29 maximum increase observed is about four to five percent occurring in one to two years. 30
Environmental Consequences Chapter 4
Draft EIS – Colorado River Interim Guidelines for Lower Basin Shortages and Coordinated Operations for Lake Powell and Lake Mea
4-129 February 2007
4.4.8.3 Shortage Conditions 1 During most of the interim period, the probability of involuntary and voluntary shortage 2 is less under all of the action alternatives compared to the No Action Alternative. The 3 probability of occurrence of shortages under the Water Supply Alternative is generally 4 less than under the No Action Alternative and the action alternatives during the interim 5 period because shortages under the Water Supply Alternative only occur if the Lake 6 Mead water level is drawn down close to the top of the dead pool elevation or if Lake 7 Mead’s elevation falls below 1,000 feet msl. However, after 2026, the Water Supply 8 Alternative has the highest probability of occurrence due to the depleted storage 9 conditions and because the shortage determination method reverts back to the No Action 10 Alternative provisions. In terms of magnitude, the average shortages that occur under the 11 Water Supply Alternative (zero and 270 kafy) are significantly less than those observed 12 under the No Action Alternative (500 and 600 kafy) during the interim period. After 13 2026, higher average and maximum shortage volumes are observed under the Water 14 Supply Alternative relative to the No Action Alternative and the remaining action 15 alternatives. 16
The probability of occurrence of shortages under the Reservoir Storage Alternative is 17 slightly higher than under the No Action Alternative between 2008 and 2013. However, 18 after 2013 and through about 2037, shortages under the Reservoir Storage Alternative 19 occur less frequently as compared to the No Action Alternative. In terms of magnitude, 20 the average shortage volumes that are observed during the interim period are highest 21 under the Reservoir Storage Alternative (between 600 and 720 kafy). This occurs because 22 the Reservoir Storage Alternative contains the most aggressive shortage strategy that 23 applies shortages both more often and at higher magnitudes. 24
Shortages also occur less frequent under the Basin States and Conservation Before 25 Shortage alternatives during the interim period as compared to the No Action Alternative 26 and are similar after 2026. The probability values of the Basin States Alternative and 27 Conservation Before Shortage Alternative differ a maximum of about five percent with 28 those of the Conservation Before Shortage Alternative being generally slightly lower than 29 those under the Basin States Alternative. In terms of magnitude, the average Involuntary 30 and Voluntary Shortages that are observed under the Basin States and Conservation 31 Before Shortage alternatives are similar to each other (between 400 and 500 kafy ) and 32 both are less than those observed under the No Action Alternative during the interim 33 period. After 2026, the average shortage volumes are similar. The maximum observed 34 Involuntary and Voluntary water delivery reduction in any one year to Arizona, 35 California, and Nevada are 1.4 maf, 456 kaf, and 65 kaf, respectively. 36
The mechanism to deliver and store conserved system and non-system water assumed as 37 part of the Basin States, Conservation Before Shortage and Reservoir Storage alternatives 38 has the effect of decreasing the occurrence of shortages. The greatest reduction during the 39 interim period occurs in the Reservoir Storage Alternative (about 12 percent) as it is 40 assumed that a larger amount of storage credits are generated under this alternative. The 41 Conservation Before Shortage Alternative is assumed to have a larger storage and 42 delivery mechanism than the Basin States Alternative, resulting in a shortage probability 43 of about two to three percent less during the interim period. 44

Chapter 4 Environmental Consequences
February 2007 4-130 Draft EIS – Colorado River Interim Guidelines for
Lower Basin Shortages and Coordinated Operations for Lake Powell and Lake Mead
This page intentionally left blank. 1 2
3

Chapter 4 Environmental Consequences
Draft EIS – Colorado River Interim Guidelines for Lower Basin Shortages and Coordinated Operations for Lake Powell and Lake Mead
4-131 February 2007
4.5 Water Quality 1
4.5.1 Introduction 2 This section describes the methods used to determine the potential effects to water quality 3 associated with each alternative considered in the proposed federal action, and discusses the 4 results of these analyses. 5
4.5.2 Methodology 6 The salinity module of the CRSS RiverwareTM model was used to analyze changes in 7 salinity concentration for all the alternatives from Lake Powell to Imperial Dam. 8
Using the hydrologic output from CRSS, the CE-QUAL-W2 model was used to simulate 9 temperatures of Lake Powell releases and the Generalized Environmental Modeling System 10 for Surface Waters (GEMSS) was used to simulate river temperatures between Glen Canyon 11 Dam and Lake Mead for each of the alternatives. Detailed descriptions of these models are 12 provided in Appendix F. Qualitative assessments of other water quality parameters in Lake 13 Powell were based on historical data. 14
For all parameters other than salinity, the analysis of potential impacts to Lake Mead water 15 quality were based on a combination of detailed water quality modeling and analysis 16 conducted for the Systems Conveyance and Operations Program Final EIS (SCOP FEIS, 17 Clean Water Coalition October 2006), historical data, and other information. The modeling 18 for the SCOP FEIS analyzed the potential effects on water quality of rerouting effluent from 19 the Las Vegas Wash to Lake Mead’s Boulder Basin via a pipeline. The detailed modeling 20 considered lake levels down to 1,000 feet msl and two levels of total annual average effluent 21 flows (462 cfs expected by 2030 and 616 cfs expected by 2050). Under the SCOP FEIS 22 preferred alternative (referred to as the Boulder Islands North Alternative), impacts to water 23 quality are considered to be insignificant and negligible with no violation of drinking water 24 standards for Lake Mead water levels drawn down to elevation 1,000 feet msl with projected 25 2050 effluent inflow levels. This information was combined with the probabilities of Lake 26 Mead water levels reaching elevation 1,000 feet msl under No Action Alternative and action 27 alternatives considered in this Draft EIS to assess potential impacts. 28
Furthermore, an adaptive management plan for Boulder Basin would be implemented as part 29 of the SCOP preferred alternative. The Boulder Basin Adaptive Management Plan (BBAMP) 30 would establish objectives regarding drinking water quality, downstream water quality, 31 nutrient management, and recreational use including sport fisheries. As part of the BBAMP, 32 water quality parameters would be monitored to establish baseline conditions and analyze the 33 need for potential mitigation measures in the future. (Clean Water Coalition 2006). The 34 qualitative assessments also used this information. 35
4.5.2.1 Salinity 36 Reclamation developed a computational model for salinity to aid in the development of 37 salinity reduction targets for the Colorado River Basin Salinity Control Program (SCP) 38 (Prairie and Callejo 2005). The salinity model simulates the effects of water development 39 projects on future salinity concentration levels in the Colorado River. The model includes 40

Environmental Consequences Chapter 4
February 2007 4-132 Draft EIS – Colorado River Interim Guidelines for
Lower Basin Shortages and Coordinated Operations for Lake Powell and Lake Mead
future salinity control units that have been authorized for construction but may not have 1 yet been completed. The salinity control criteria are purposely designed to be long-term 2 and non-degradational goals, rather than exceedence standards such as are used for 3 industry or drinking water. Efforts of the SCP are designed to meet the standards by 4 implementing, as needed, the most cost effective salinity control projects. This ensures 5 that the salinity control criteria will continue to be met in the future, even with the 6 salinity impacts produced by increasing Upper Basin depletions. 7
The salinity data used in the CRSS salinity model are based on a monthly regression of 8 natural flow and salinity data from 1971 through 1995 in the Upper Basin (Prairie et al 9 2005). The Lower Basin monthly regressions are based on the 1971 through 2004 natural 10 flow and salinity data. The monthly regression models allow extension of the CRSS 11 salinity model data over the period 1906 through 2004, the period for which natural flow 12 data is available. The CRSS salinity model data includes salinity control levels and salt 13 loading due to agriculture return flows as used in the 2005 Triennial Review (Colorado 14 River Salinity Control Forum 2005). The model simulates annual average salinity 15 concentrations for locations below Hoover Dam, below Parker Dam, and at Imperial 16 Dam. 17
The CRSS salinity model is intended for long-term (15 to 20 years) simulation and it is 18 highly sensitive to initial conditions during the first 10 to 12 years. The model assumes 19 salinity is a conservative water quality parameter, and reservoirs are modeled as fully 20 mixed systems. 21
4.5.2.2 Temperature 22 Lake Powell undergoes seasonal transformations that can dramatically affect the 23 temperatures of both the reservoirs and the dam releases. During the spring, solar 24 radiation and warmer air temperatures begin to warm the upper surface layers of the 25 reservoirs. This warming is also affected by spring inflow volumes and temperatures. 26 Larger inflows bring greater volumes of warmer water that can cause higher release 27 temperatures. Reservoir draw downs can bring the warmer surface water closer to the 28 power plant intake penstocks, also producing warmer releases. As summer progresses, 29 surface warming of reservoirs increases, as does the warming of releases as the water 30 moves downstream. During the winter months, reservoir temperature stratification is 31 usually eliminated by reservoir mixing, and both reservoir and downstream water cooling 32 occurs. The CE-QUAL-W2 model simulates this annual process and can analyze 33 reservoir and dam release temperatures for various reservoir starting elevations and 34 inflows. The CRSS output of dam release and reservoir elevations was used in the CE-35 QUAL-W2 model to establish a relationship between reservoir elevations and dam 36 release temperatures and project the impact of reservoir draw down on dam release 37 temperatures. Calibration of the CE-QUAL-W2 model for Lake Powell used historic 38 temperature profiles from 1990 to 2005 at 13 reservoir stations. 39
This 15-year data set provided a limited range of historic reservoir elevations, inflows 40 and releases. By using a combination of historic and modeled data for various reservoir 41

Chapter 4 Environmental Consequences
Draft EIS – Colorado River Interim Guidelines for Lower Basin Shortages and Coordinated Operations for Lake Powell and Lake Mead
4-133 February 2007
elevations, and by analyzing the impact of a repetition of the recent drought years, dam 1 release temperatures for a larger range of reservoir elevations could be analyzed. 2
The GEMSS was used to route Glen Canyon Dam release temperatures through the 3 Grand Canyon downstream to Lake Mead. The GEMSS model was calibrated for water 4 temperature at three locations in this river reach: Lees Ferry, 15.9 miles downstream of 5 Glen Canyon Dam; a point one mile downstream of the Little Colorado River confluence; 6 and the Diamond Creek gaging station 240 miles downstream of Glen Canyon Dam. 7 Below Diamond Creek, water temperatures approached equilibrium with the ambient air 8 temperature, and the rate of temperature change decreased. Since Lees Ferry 9 temperatures are nearly identical to dam release temperatures, only the results for the 10 Little Colorado River confluence and Diamond Creek sites are included in this document. 11
For any specific reservoir starting elevation, there is a range of potential dam release 12 temperatures because the reservoir is affected by the magnitude of spring inflow and 13 summer meteorological conditions. Downstream water temperatures produced by a 14 routing of these releases are also affected by meteorological conditions and the 15 magnitude of dam releases. Thus, for a single reservoir elevation the CE-QUAL-W2 and 16 GEMSS modeling resulted in a range of water temperatures. 17
The assessment of potential effects of the alternatives on temperature in Lake Mead was 18 based on the Lake Mead water quality information provided in the SCOP FEIS. 19
4.5.2.3 Other Water Quality Parameters 20 Historic water quality data from Lake Powell and Lake Mead and water quality 21 information from the SCOP FEIS for Lake Mead were used to develop qualitative 22 assessments of potential effects of the alternatives on sediment, nutrients and algae, 23 dissolved oxygen, metals, and perchlorate. 24
4.5.3 Salinity 25 Table 4.5-1, Table 4.5-2, and Table 4.5-3 present the SCP salinity control criteria and the 26 CRSS salinity model simulations of salinity concentrations for the years 2008, 2026 and 27 2060, respectively. The projected salinity concentrations presented are the flow-weighted 28 annual averages for the selected year under the No Action Alternative and the action 29 alternatives. The results assume continuation of existing salinity control programs and 30 projects. Therefore, the flow-weighted annual average salinity concentrations should not 31 increase over time under the No Action Alternative for the current plan of implementation, 32 which extends through 2025 (Colorado River Salinity Control Forum 2005). 33
The flow-weighted average annual salinity criteria for locations on the lower Colorado River 34 listed in Table 4.5-1, Table 4.5-2, and Table 4.5-3 are not exceeded at any time under any of 35 the alternatives. This is due in part to the presumed continuation of existing levels of salinity 36 controls under the SCP in the CRSS salinity model. The Water Supply Alternative generally 37 provides salinity concentrations equal to or lower than the No Action Alternative. During 38 some years the Reservoir Storage Alternative produces higher salinity concentrations than 39 the No Action Alternative. At all times the differences in salinity concentrations among the 40 different alternatives is less than three percent. 41

Environmental Consequences Chapter 4
February 2007 4-134 Draft EIS – Colorado River Interim Guidelines for
Lower Basin Shortages and Coordinated Operations for Lake Powell and Lake Mead
Table 4.5-1 Projected Colorado River Salinity in 2008
Below Hoover Dam SCP Criteria 723 mg/L
Below Parker Dam SCP Criteria 747 mg/L
At Imperial Dam SCP Criteria 879 mg/L
Alternative Projected Value
(mg/L) Projected Value
(mg/L) Projected Value
(mg/L) No Action 635 654 767 Basin States 635 655 772 Conservation Before Shortage 635 655 774 Reservoir Storage 637 657 782 Water Supply 635 654 767
1
Table 4.5-2 Projected Colorado River Salinity in 2026
Below Hoover Dam SCP Criteria 723 mg/L
Below Parker Dam SCP Criteria 747 mg/L
At Imperial Dam SCP Criteria 879 mg/L
Alternative Projected Value
(mg/L) Projected Value
(mg/L) Projected Value
(mg/L) No Action 603 624 744 Basin States 607 628 751 Conservation Before Shortage 607 629 756 Reservoir Storage 615 637 764 Water Supply 598 619 740
2
Table 4.5-3 Projected Colorado River Salinity in 2060
Alternative Below Hoover Dam
SCP Criteria 723 mg/L Below Parker Dam
SCP Criteria 747 mg/L At Imperial Dam
SCP Criteria 879 mg/L Projected Value
(mg/L) Projected Value
(mg/L) Projected Value
(mg/L) No Action 626 648 779 Basin States 630 653 786 Conservation Before Shortage 630 653 786 Reservoir Storage 630 653 786 Water Supply 626 648 780
3
4.5.4 Temperature 4 5
4.5.4.1 Lake Powell and Glen Canyon Dam 6 The release temperature ranges presented in Figure 4.5-1 are comprised of historic and 7 modeled data and represent a yearly range including seasonal fluctuations. This graph 8 shows that as Lake Powell’s elevation decreases, the range of annual release temperature 9

Chapter 4 Environmental Consequences
Draft EIS – Colorado River Interim Guidelines for Lower Basin Shortages and Coordinated Operations for Lake Powell and Lake Mead
4-135 February 2007
fluctuations increases. The minimum release temperature occurs in the winter and it is 1 fairly consistent at about 7 °C to 10 °C (44.6ºF to 50 ºF). The peak summer release 2 temperature varies significantly with elevation, peaking at about 25 °C (77 º F) as the 3 reservoir elevation drops to near the minimum power pool elevation of 3,490 feet msl. 4 The nearer the reservoir elevation is to the power plant penstock intakes, the higher the 5 summer and fall release temperatures. Reservoir elevations near the full pool elevation of 6 3,700 feet msl show much less variation among seasons, with releases consistently cold 7 from 8 °C to 12 °C (46.4 ºF to 53.6 ºF). During extreme drought events, the elevation of 8 Lake Powell may drop below the minimum power pool elevation of 3,490 feet msl. If this 9 occurs, releases would be discontinued from the powerplant penstocks and releases 10 would be made through the river outlet tubes, which are located at elevation 3,374 feet 11 msl. Under these conditions, the temperature of the water released from Glen Canyon 12 Dam could potentially change from about 25 °C to less than 10 °C (77 ºF to less than 50 13 ºF). If the reservoir elevation were to drop further, closer to the elevation of the river 14 outlet tubes, the releases would again gradually warm. 15
16
In addition to the seasonal ranges described above, Table 4.5-4 and Table 4.5-5 present 17 projected release temperature ranges associated with the CRSS projected 90th, 50th, and 18 10th percentile elevations of Lake Powell in 2016, 2026, and 2060 for the months of July 19 and October, respectively. This represents the period of time when maximum warming 20
Figure 4.5 -1 Historic Data and CE-QUAL-W2 Model Results for Lake Powell Release Temperatures by Elevation
0
5
10
15
20
25
30
3,490 3,520 3,550 3,580 3,610 3,640 3,670 3,700Elevation (feet msl)
Wat
er T
empe
ratu
re (°
C)

Environmental Consequences Chapter 4
February 2007 4-136 Draft EIS – Colorado River Interim Guidelines for
Lower Basin Shortages and Coordinated Operations for Lake Powell and Lake Mead
occurs in Lake Powell and the downstream releases. The release temperature ranges in 1 Table 4.5-4 and Table 4.5-5 reflect the variability of hydrologic, meteorological, and 2 hydraulic conditions. The sensitivity of release temperatures to these conditions increases 3 with decreasing reservoir elevations. This sensitivity causes a wide range of possible 4 release temperatures at similar reservoir elevations. In general, for a given month and 5 reservoir elevation a higher release temperature is associated with an above average 6 inflow volume and a lower release temperature is associated with a below average inflow 7 volume. Therefore, the ranges shown in these tables reflect different release temperatures 8 for these specific months and reservoir elevations, ranges which are due primarily to 9 large differences in reservoir inflows. 10
For reservoir elevations at or above the 90th percentile elevation for all years there are no 11 differences among the alternatives. Overall, the temperature ranges for July and October 12 for the No Action Alternative, Basin States Alternative, and Conservation Before 13 Shortage Alternative are similar for 2016, 2026, and 2060 for the 50th and 10th percentile 14 reservoir elevations, respectively. The temperature range for the Water Supply 15 Alternative is warmer due to the corresponding lower Lake Powell reservoir elevations 16 for the 10th and 50th percentiles. The Reservoir Storage Alternative results in cooler water 17 temperatures for the 10th and 50th percentile reservoir elevations for some years, due to 18 higher reservoir elevations. 19
Table 4.5-4 Lake Powell July Elevations and Release Temperatures
90th, 50th, and 10th Percentile Values
90th Percentile 50th Percentile 10th Percentile
Year Elevation (feet msl)
Temperature (°C)
Elevation (feet msl)
Temperature (°C)
Elevation (feet msl)
Temperature (°C)
2016 No Action 3,698.7 9 to 11 2,650.3 8.5 to 11.5 3,583.5 9 to 17 Basin States 3,698.5 9 to 11 3,646.4 8.5 to 11.5 3,587.2 9 to 17 Conservation Before Shortage 3,698.1 9 to 11 3,646.4 8.5 to 11.5 3,587.7 9 to 17 Water Supply 3,698.5 9 to 11 3,642.0 8.5 to 11.5 3,572.0 10 to 19 Reservoir Storage 3,698.8 9 to 11 3,650.3 8.5 to 11.5 3,599.5 8.5 to 15 2026 No Action 3,697.9 9 to 11 3,658.8 8.5 to 11 3,579.4 9.5 to 18 Basin States 3,697.7 9 to 11 3,648.6 8.5 to 11.5 3,572.6 10 to 19 Conservation Before Shortage 3,697.7 9 to 11 3,649.2 8.5 to 11.5 3,573.5 10 to 19 Water Supply 3,697.6 9 to 11 3,631.0 8.5 to 12 3,527.5 17 to 22 Reservoir Storage 3,698.8 9 to 11 3,664.2 8.5 to 11 3,600.3 8.5 to 15 2060 No Action 3,699.3 9 to 11 3,657.0 8.5 to 11 3,558.6 10 to 20 Basin States 3,699.3 9 to 11 3,657.0 8.5 to 11 3,558.6 10 to 20 Conservation Before Shortage 3,699.3 9 to 11 3,657.0 8.5 to 11 3,558.6 10 to 20 Water Supply 3,699.3 9 to 11 3,657.0 8.5 to 11 3,55i8.6 10 to 20 Reservoir Shortage 3,699.3 9 to 11 3,657.0 8.5 to 11 3,558.6 10 to 20

Chapter 4 Environmental Consequences
Draft EIS – Colorado River Interim Guidelines for Lower Basin Shortages and Coordinated Operations for Lake Powell and Lake Mead
4-137 February 2007
1 Table 4.5-5
Lake Powell October Elevations and Release Temperatures 90th, 50th, and 10th Percentile Values
90th Percentile 50th Percentile 10th Percentile
Year Elevation (feet msl)
Temperature (°C)
Elevation (feet msl)
Temperature (°C)
Elevation (feet msl)
Temperature (°C)
2016 No Action 3,689.6 9 to 11.5 3,644.1 9 to 15 3,574.6 11 to 21 Basin States 3,689.6 9 to 11.5 3,640.5 9 to 15 3,574.2 11 to 21 Conservation Before Shortage 3,689.6 9 to 11.5 3,640.5 9 to 15 3,574.5 11 to 21 Water Supply 3,689.4 9 to 11.5 3,634.7 9 to 16 3,560.7 12 to 22 Reservoir Storage 3,690.0 9 to 11.5 3,647.0 9 to 15 3,588.0 10 to 20 2026 No Action 3,689.2 9 to 11.5 3,656.6 8.5 to 14 3,569.8 11 to 21 Basin States 3,689.2 9 to 11.5 3,637.1 9 to 15.5 3,569.4 11 to 21 Conservation Before Shortage 3,689.2 9 to 11.5 3,640.6 9 to 15 3,570.1 11 to 21 Water Supply 3,689.2 9 to 11.5 3,622.4 9 to 18 3,512.9 16 to 24 Reservoir Storage 3,689.7 9 to 11.5 3,659.1 8.5 to 14 3,591.5 10 to 20 2060 No Action 3,689.9 9 to 11.5 3,647.1 9 to 15 3,552.2 13 to 22 Basin States 3,689.9 9 to 11.5 3,647.1 9 to 15 3,552.2 13 to 22 Conservation Before Shortage 3,689.9 9 to 11.5 3,647.1 9 to 15 3,552.2 13 to 22 Water Supply 3,689.9 9 to 11.5 3,647.1 9 to 15 3,552.2 13 to 22 Reservoir Shortage 3,689.9 9 to 11.5 3,647.1 9 to 15 3,552.2 13 to 22
2
4.5.4.2 Glen Canyon Dam to Lake Mead 3 Using historic data and output from the CE-QUAL-W2 model as input, the GEMSS 4 model analyzed monthly temperatures for July and October for the CRSS 90th, 50th, and 5 10th percentile projected reservoir releases. These monthly temperatures are presented for 6 each alternative in Table 4.5-6 and Table 4.5-7 for the confluence with the Little 7 Colorado River, and in Table 4.5-8 and Table 4.5-9 for the gage below Diamond Creek, 8 and are consistently higher than the dam release temperatures shown in Table 4.5-4 and 9 Table 4.5-5. The data listed in these tables are ranges, and refer to the variability of 10 temperatures due to three factors: variable release volume; release temperature ranges; 11 and downstream meteorology. 12
The ranges presented in Table 4.5-4 and Table 4.5-5 cascade in the downstream 13 temperature modeling. The rate at which water that is released from a reservoir 14 approaches ambient air temperature as it travels downstream depends on these factors. In 15 general, warmer downstream water temperatures result from smaller release volumes, 16 higher release temperatures, and warmer ambient air temperatures. However, the 17 relationship between release temperature and downstream temperature was nonlinear 18 (e.g., a 1 °C (33.8 º F) increase in release temperature does not necessarily result in a 1 °C 19

Environmental Consequences Chapter 4
February 2007 4-138 Draft EIS – Colorado River Interim Guidelines for
Lower Basin Shortages and Coordinated Operations for Lake Powell and Lake Mead
(33.8 ºF) increase downstream). In general, the temperature ranges for July and October 1 for the No Action Alternative, Basin States Alternative, Conservation Before Shortage 2 Alternative, and Water Supply Alternative are similar. The range of temperatures varies 3 by less than about 2 ºC (35.6 º F) for each of these alternatives. The range of temperatures 4 for the Reservoir Storage Alternative tended to be cooler for both the 50th and 10th 5 percentile river flows. This is due to higher Lake Powell elevations in this alternative. 6
Table 4.5-6 Colorado River at Little Colorado River Confluence July Water Temperatures
90th, 50th, and 10th Percentile Values
90th Percentile 50th Percentile 10th Percentile
Year Temperature
(°C) Temperature
(°C) Temperature
(°C) 2016 No Action 10 to 14 10 to 14 12 to 22 Basin States 10 to 14 10 to 15 13 to 22 Conservation Before Shortage 10 to 14 10 to 15 13 to 22 Water Supply 10 to 14 10 to 15 13 to 23 Reservoir Storage 10 to 14 10 to 13 12 to 21 2026 No Action 10 to 14 10 to 14 12 to 22 Basin States 10 to 14 10 to 15 13 to 22 Conservation Before Shortage 10 to 14 10 to 15 13 to 22 Water Supply 10 to 14 10 to 15 13 to 23 Reservoir Storage 10 to 14 10 to 13 12 to 21 2060 No Action 10 to 14 10 to 14 12 to 22 Basin States 10 to 14 10 to 15 13 to 22 Conservation Before Shortage 10 to 14 10 to 15 13 to 22 Water Supply 10 to 14 10 to 15 13 to 23 Reservoir Storage 10 to 14 10 to 13 12 to 21
7

Chapter 4 Environmental Consequences
Draft EIS – Colorado River Interim Guidelines for Lower Basin Shortages and Coordinated Operations for Lake Powell and Lake Mead
4-139 February 2007
Table 4.5-7 Colorado River at Little Colorado River Confluence October Water Temperatures
90th, 50th, and 10th Percentile Values
90th Percentile 50th Percentile 10th Percentile
Year Temperature
(°C) Temperature
(°C) Temperature
(°C) 2016 No Action 10 to 11 12 to 16 11 to 21 Basin States 10 to 11 9 to 17 11 to 22 Conservation Before Shortage 10 to 11 9 to 17 11 to 22 Water Supply 10 to 11 9 to 16 14 to 22 Reservoir Storage 10 to 11 8 to 14 12 to 21 2026 No Action 10 to 11 12 to 16 11 to 21 Basin States 10 to 11 9 to 17 11 to 22 Conservation Before Shortage 10 to 11 9 to 17 11 to 22 Water Supply 10 to 11 9 to 16 14 to 22 Reservoir Storage 10 to 11 8 to 14 12 to 21 2060 No Action 10 to 11 12 to 16 11 to 21 Basin States 10 to 11 9 to 17 11 to 22 Conservation Before Shortage 10 to 11 9 to 17 11 to 22 Water Supply 10 to 11 9 to 16 14 to 22 Reservoir Storage 10 to 11 8 to 14 12 to 21
1
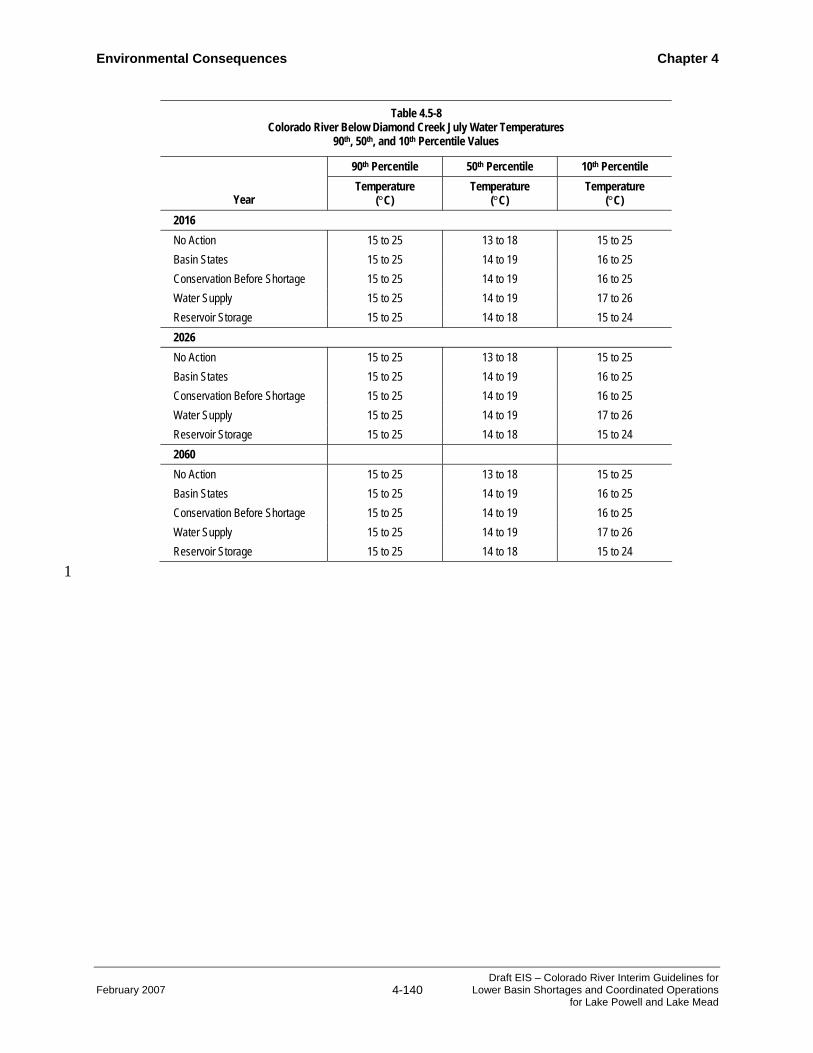
Environmental Consequences Chapter 4
February 2007 4-140 Draft EIS – Colorado River Interim Guidelines for
Lower Basin Shortages and Coordinated Operations for Lake Powell and Lake Mead
Table 4.5-8 Colorado River Below Diamond Creek July Water Temperatures
90th, 50th, and 10th Percentile Values
90th Percentile 50th Percentile 10th Percentile
Year Temperature
(°C) Temperature
(°C) Temperature
(°C) 2016 No Action 15 to 25 13 to 18 15 to 25 Basin States 15 to 25 14 to 19 16 to 25 Conservation Before Shortage 15 to 25 14 to 19 16 to 25 Water Supply 15 to 25 14 to 19 17 to 26 Reservoir Storage 15 to 25 14 to 18 15 to 24 2026 No Action 15 to 25 13 to 18 15 to 25 Basin States 15 to 25 14 to 19 16 to 25 Conservation Before Shortage 15 to 25 14 to 19 16 to 25 Water Supply 15 to 25 14 to 19 17 to 26 Reservoir Storage 15 to 25 14 to 18 15 to 24 2060 No Action 15 to 25 13 to 18 15 to 25 Basin States 15 to 25 14 to 19 16 to 25 Conservation Before Shortage 15 to 25 14 to 19 16 to 25 Water Supply 15 to 25 14 to 19 17 to 26 Reservoir Storage 15 to 25 14 to 18 15 to 24
1

Chapter 4 Environmental Consequences
Draft EIS – Colorado River Interim Guidelines for Lower Basin Shortages and Coordinated Operations for Lake Powell and Lake Mead
4-141 February 2007
Table 4.5-9 Colorado River Below Diamond Creek October Water Temperatures
90th, 50th, and 10th Percentile Values
90th Percentile 50th Percentile 10th Percentile
Year Temperature
(°C) Temperature
(°C) Temperature
(°C) 2016 No Action 11 to 16 13 to 18 13 to 22 Basin States 11 to 16 10 to 19 12 to 23 Conservation Before Shortage 11 to 16 10 to 19 12 to 23 Water Supply 11 to 16 10 to 18 14 to 23 Reservoir Storage 11 to 16 9 to 17 12 to 22 2026 No Action 11 to 16 13 to 18 13 to 22 Basin States 11 to 16 10 to 19 12 to 23 Conservation Before Shortage 11 to 16 10 to 19 12 to 23 Water Supply 11 to 16 10 to 18 14 to 23 Reservoir Storage 11 to 16 9 to 17 12 to 22 2060 No Action 11 to 16 13 to 18 13 to 22 Basin States 11 to 16 10 to 19 12 to 23 Conservation Before Shortage 11 to 16 10 to 19 12 to 23 Water Supply 11 to 16 10 to 18 14 to 23 Reservoir Storage 11 to 16 9 to 17 12 to 22
1
4.5.4.3 Lake Mead and Hoover Dam 2 Water quality modeling provided in the SCOP FEIS showed that lake temperatures would 3 change by no more than 1 ºC (33.8 º F) when the Lake Mead elevations are drawn down 4 from 1,178 feet to 1,000 feet msl (Clean Water Coalition 2006). For the No Action, 5 Conservation Before Shortage, and Reservoir Storage alternatives, the hydrologic 6 modeling shows the probability of Lake Mead being below elevation 1,000 feet msl is 7 zero (Section 4.3). For the Basin States Alternative, the hydrologic modeling showed 8 zero probability through 2024 with a small probability (of one and two percent in 2025 9 and 2026). For the Water Supply Alternative, the hydrologic modeling shows the 10 probabilty is small through 2020, increasing to a six percent chance by 2026. Based on 11 these results, potential effects of the alternatives on temperature in Lake Mead are 12 considered negligible. 13
4.5.5 Sediment and Dissolved Oxygen 14 The maximum headcutting of reservoir deltas occurs when a deeply drawn down reservoir is 15 followed by very high inflows, similar to that observed in Lake Powell in 2005. This 16 condition is very dependent on the reservoir elevation and spring inflow volume. Compared 17 to the No Action Alternative, the projected additional reservoir draw down for the Water 18 Supply Alternative could result in additional headcutting in the sediment deltas and 19

Environmental Consequences Chapter 4
February 2007 4-142 Draft EIS – Colorado River Interim Guidelines for
Lower Basin Shortages and Coordinated Operations for Lake Powell and Lake Mead
accompanying water quality impacts. The Reservoir Storage Alternative could result in a 1 decrease in headcutting if the projected reservoir elevations remain higher than for the No 2 Action Alternative. Since the projected reservoir draw down for the Conservation Before 3 Shortage Alternative and the Basin States Alternative are similar, headcutting to the sediment 4 deltas would likely be similar. 5
Quantified water quality impacts from reservoir sediment delta headcutting are not currently 6 available, nor is it possible to quantitatively distinguish the impact of sediment headcutting 7 among the alternatives. However, recent history shows that high inflows causing headcutting 8 likely increases phosphorus release and biological oxygen demand. Large spring inflows then 9 can bring this plume of low dissolved oxygen water near the powerplant intakes and result in 10 low dissolved oxygen releases. There may be short term impacts to food base and trout 11 resources between Glen Canyon Dam and Lees Ferry from these occurrences. Recurrences of 12 low dissolved oxygen such as occurred in 2005 below Glen Canyon Dam may result from 13 reservoir draw down cycles under any of the alternatives, but as described in Section 3.5.5 14 the river reaerates after passing through rapids downstream of Lees Ferry. Additionally, 15 average or lower inflows do not seem to have the power to create adverse conditions such as 16 in 2005. 17
With respect to riverine sediment transport in the Glen Canyon Dam to Lake Mead reach, 18 annual releases lower than 8.23 maf associated with the action alternatives would transport 19 less sediment through the Grand Canyon into Lake Mead than the No Action Alternative, but 20 would be offset by equalization or balancing releases in these alternatives (Figure 4.3-13). 21
To estimate the sediment transport impacts of potentially modifying the annual release 22 volumes from Glen Canyon Dam, the USGS prepared an analysis relating normalized 23 sediment transport from the Grand Canyon to annual release volumes. Table 4.5-10 shows 24 this relationship, with 8.23 maf release volumes as the basis for normalization. 25
Table 4.5-10 Relationship of Glen Canyon Dam Annual Release Volumes to Sediment Transport
Release (maf) Normalized Sand Export 6.00 0.26 7.00 0.51 8.00 0.89 8.23 1.00 9.00 1.43 10.00 2.15 11.00 3.03 12.00 4.11 13.00 5.43 14.00 7.01 15.00 8.88 16.00 11.02 17.00 13.53

Chapter 4 Environmental Consequences
Draft EIS – Colorado River Interim Guidelines for Lower Basin Shortages and Coordinated Operations for Lake Powell and Lake Mead
4-143 February 2007
Table 4.5-10 Relationship of Glen Canyon Dam Annual Release Volumes to Sediment Transport
Release (maf) Normalized Sand Export 18.00 16.67 19.00 19.72 20.00 23.40
1
Annual release volumes from all the traces of the RiverWareTM analysis for all the 2 alternatives were applied to this sand export relationship for the years 2008, 2016, and 2026. 3 Relative differences among the alternatives were calculated by comparing the action 4 alternatives to the No Action Alternative at the 10th, 50th, and 90th percentiles of sand export. 5 These normalized comparisons are shown in Tables 4.5-11 through 4.5-13 for the years 2008, 6 2016, and 2026, respectively. 7
Table 4.5-11 Comparison of Sediment Export among Alternatives (Normalized to 8.23 maf annual releases)
2008
Alternative 90th Percentile 50th Percentile 10th Percentile
No Action 4.4 1 1
Basin States 4.8 1 1
Conservation Before Shortage 4.8 1 1
Reservoir Storage 4.4 1 1
Water Supply 4.4 1 1
8
Table 4.5-12 Comparison of Sediment Export among Alternatives (Normalized to 8.23 maf annual releases)
2016
Alternative 90th Percentile 50th Percentile 10th Percentile
No Action 5.68 1 1
Basin States 5.7 1.4 1
Conservation Before Shortage 5.71 1.4 0.99
Reservoir Storage 5.68 1 0.81
Water Supply 5.33 1.8 1
9
10

Environmental Consequences Chapter 4
February 2007 4-144 Draft EIS – Colorado River Interim Guidelines for
Lower Basin Shortages and Coordinated Operations for Lake Powell and Lake Mead
Table 4.5-13 Comparison of Sediment Export among Alternatives (Normalized to 8.23 maf annual releases)
2026
Alternative 90th Percentile 50th Percentile 10th Percentile
No Action 4.76 1 1
Basin States 4.57 1.4 1
Conservation Before Shortage 4.54 1.4 1
Reservoir Storage 4.81 1 0.96
Water Supply 4.81 1.8 1
1
The data provided in the table above show that in the near term, the alternatives transport 2 nearly the same amount of sediment, but that in 2016 and 2026, the Basin States and 3 Conservation Before Shortage alternatives generally transport more sediment as water is 4 moved from Lake Powell to Lake Mead to meet water supply demands, while the Water 5 Supply Alternative transports even more sediment as greater volumes of water are moved to 6 Lake Mead. The Reservoir Storage Alternative reduces the amount of transport as releases 7 and water deliveries are reduced to keep Lake Mead, and subsequently Lake Powell, fuller. 8
Modeling completed for the SCOP FEIS determined that there would be no adverse effect on 9 dissolved oxygen as a result from the SCOP project or from the drawdown of Lake Mead 10 from elevation 1,178 feet to 1,000 feet msl. For the No Action, Conservation Before 11 Shortage, and Reservoir Storage alternative, the hydrologic modeling shows the probability 12 of Lake Mead being below elevation 1,000 feet msl is zero (Section 4.3). For the Basin States 13 Alternative, the hydrologic modeling showed zero probability through 2024 with a small 14 probability (of one and two percent in 2025 and 2026). For the Water Supply Alternative, 15 the hydrologic modeling shows the probabilty is small through 2020, increasing to a six 16 percent chance by 2026. Based on these results, potential effects of the alternatives on 17 dissolved oxygen in Lake Mead are considered negligible. Futhermore, monitoring of 18 dissolved oxygen levels in Lake Mead will be conducted as part of the SCOP BBAMP 19 (Clean Water Coalition 2006). 20
4.5.6 Nutrients and Algae 21 Most of the 1.0 mg/L of total phosphorus concentration entering Lake Powell from the major 22 tributaries is bound to the sediment and primarily settles out with the sediment (Section 3.5). 23 Bioavailable phosphorus from the major inflows is generally only 0.007 to 0.009 mg/L and 24 phosphorus concentrations released from Glen Canyon Dam and Hoover Dam generally 25 range from only 0.004 to 0.008 mg/L with occasional spikes to near 0.012 mg/L. Sediment 26 delta headcutting, as discussed above, releases phosphorus. This release can significantly 27 boost primary productivity in reservoir inflow areas. A decrease in reservoir elevation could 28 result in additional headcutting in the sediment deltas; however, data is not available to 29 project the amount of headcutting and phosphorous release for different reservoir elevations. 30
When Lake Powell is full, Glen Canyon Dam release temperatures and inflow temperatures 31 into Lake Mead are cool, and the plume of water entering Lake Mead drops to depths below 32

Chapter 4 Environmental Consequences
Draft EIS – Colorado River Interim Guidelines for Lower Basin Shortages and Coordinated Operations for Lake Powell and Lake Mead
4-145 February 2007
which algae can grow. Therefore, much of the inflowing phosphorus that is not settled out 1 with the sediment in Lake Mead travels to Hoover Dam. However, when Lake Powell 2 elevations are low enough to produce warm Glen Canyon Dam releases and inflow 3 temperatures into Lake Mead, the inflow plume into Lake Mead will remain nearer the 4 surface where light would increase productivity. The algae thus produced would settle out, 5 trap more phosphorus in the sediment in Lake Mead, and reduce the phosphorus transport 6 down reservoir into Boulder Basin. Due to the complexity of the system, the direct impact 7 due to the different alternatives can not be projected. 8
Modeling results provided in the SCOP FEIS showed that there would be no adverse effects 9 on phosphorous concentrations, other nutrients or algae as a result of the SCOP or from Lake 10 Mead being drawn down from elevation 1,178 feet to 1,000 feet msl (Clean Water Coalition 11 2006). For the No Action, Conservation Before Shortage, and Reservoir Storage alternatives, 12 the hydrologic modeling shows the probability of Lake Mead being below elevation 1,000 13 feet msl is zero (Section 4.3). For the Basin States Alternative, the hydrologic modeling 14 showed zero probability through 2024 with a small probability (of one and two percent in 15 2025 and 2026). For the Water Supply Alternative, the hydrologic modeling shows the 16 probabilty is small through 2020, increasing to a six percent chance by 2026. Based on these 17 results, the concentrations of phosphorus in Boulder Basin and Las Vegas Bay should remain 18 within the Nevada TMDL under all alternatives. Furthermore, the SCOP BBAMP will 19 monitor nutrients and chlorophyll levels in Lake Mead and manage nutrient loadings if water 20 quality objectives are not met (Clean Water Coalition 2006). 21
4.5.7 Metals 22 The modeling results provided in the SCOP FEIS for Lake Mead show that the lake’s ability 23 to dilute contaminant and nutrient loadings from Las Vegas Valley wastewater treatment 24 plants is not significantly diminished when Lake Mead elevation is 1,000 feet msl in 25 comparison to 1,178 feet msl (Clean Water Coalition 2006). For the No Action, Conservation 26 Before Shortage, and Reservoir Storage alternatives, the hydrologic modeling shows the 27 probability of Lake Mead being below elevation 1,000 feet msl is zero (Section 4.3). For the 28 Basin States Alternative, the hydrologic modeling showed zero probability through 2024 29 with a small probability (of one and two percent in 2025 and 2026). For the Water Supply 30 Alternative, the hydrologic modeling shows the probabilty is small through 2020, increasing 31 to a six percent chance by 2026. Therefore, it is anticipated that drawdown of Lake Mead 32 under any of the alternatives will not increase metals concentrations as a result of reduced 33 dilution. 34
4.5.8 Perchlorate 35 Since 1999, perchlorate containment and reduction strategies have resulted in the decline of 36 detectable concentrations in Lake Mead, Willow Beach, and Lake Havasu and other 37 sampling locations in the lower Colorado River, as well as in areas using Colorado River 38 water in Arizona. Perchlorate concentrations are ranging from non-detectable levels to six 39 ppb, indicating a slow and steady decline (Personal Communication, Blasius). The modeling 40 provided for the SCOP FEIS included a perchlorate analysis and showed that the dilution 41 capacity of Lake Mead did not significantly change when the Lake Mead water levels are 42 drawn down from 1,178 feet msl to 1,000 feet msl. For the No Action, Conservation Before 43

Environmental Consequences Chapter 4
February 2007 4-146 Draft EIS – Colorado River Interim Guidelines for
Lower Basin Shortages and Coordinated Operations for Lake Powell and Lake Mead
Shortage, and Reservoir Storage alternatives, the hydrologic modeling shows the probability 1 of Lake Mead being below elevation 1,000 feet msl is zero (Section 4.3). For the Basin States 2 Alternative, the hydrologic modeling showed zero probability through 2024 with a small 3 probability (of one tand two percent in 2025 and 2026). For the Water Supply Alternative, 4 the hydrologic modeling shows the probabilty is small through 2020, increasing to a six 5 percent chance by 2026. Therefore, Lake Mead draw down under any of the action 6 alternatives is not expected to affect perchlorate concentrations. 7
4.5.9 Summary 8 The following conclusions were drawn from the analyses of potential effects on water quality 9 constituents of concern. 10
4.5.9.1 Salinity 11 The future average annual salinity levels under the action alternatives are not expected to 12 exceed the salinity numeric criteria established by the Colorado River Salinity Control 13 Forum for different locations on lower Colorado River. 14
4.5.9.2 Temperature 15 The temperature range for Glen Canyon Dam releases under the Water Supply 16 Alternative is warmer due to the corresponding lower Lake Powell reservoir elevations 17 for the 10th and 50th percentiles. The Reservoir Storage Alternative results in cooler 18 temperatures for Glen Canyon Dam release under the 10th and 50th percentile reservoir 19 elevations for some years. The temperature of Glen Canyon Dam releases under the 20 Basin States Alternative and Conservation Before Shortage Alternative are similar to 21 those under the No Action Alternative. 22
For Lake Mead, modeling performed for the SCOP EIS showed that lake temperatures 23 would change by no more than 1 ºC (33.8 º F) when the Lake Mead elevations are drawn 24 down from 1,178 feet msl to 1,000 feet msl (Clean Water Coalition 2006). The 25 probability of Lake Mead being drawn down below elevation 1,000 feet msl is small for 26 all alternatives. Therefore, potential effects of the alternatives on temperature in Lake 27 Mead are considered negligible. 28
4.5.9.3 Other Water Quality Parameters 29 The following findings relate to other water quality parameters analyzed for Lake Powell: 30
♦ Quantified water quality impacts from reservoir sediment delta headcutting are 31 not currently available; 32
♦ The projected elevations and corresponding changes in dilution capacity are not 33 expected to result in metals concentrations of concern; and 34
♦ It is not anticipated that any of the action alternatives would result in a 35 significantly increased concentration of perchlorate. 36
For Lake Mead, hydrologic and water quality modeling provided in the SCOP FEIS 37 determined that drawing the Lake Mead water level down to an elevation of 1,000 feet 38

Chapter 4 Environmental Consequences
Draft EIS – Colorado River Interim Guidelines for Lower Basin Shortages and Coordinated Operations for Lake Powell and Lake Mead
4-147 February 2007
msl would not have a significant effect on water quality in Lake Mead, Hoover Dam 1 releases, and the SNWA water pumped from Lake Mead. The probability of Lake Mead 2 being drawn down below elevation 1,000 feet msl is small for all alternatives. Therefore, 3 potential effects of the alternatives on water quality parameters in Lake Mead are 4 considered negligible. 5
6
7

Environmental Consequences Chapter 4
February 2007 4-148 Draft EIS – Colorado River Interim Guidelines for
Lower Basin Shortages and Coordinated Operations for Lake Powell and Lake Mead
This page intentionally left blank. 1 2

Chapter 4 Environmental Consequences
Draft EIS – Colorado River Interim Guidelines for Lower Basin Shortages and Coordinated Operations for Lake Powell and Lake Mead
4-149 February 2007
4.6 Air Quality 1
This section describes the methods of analysis and potential effects on air quality at Lake Powell 2 and Lake Mead, focusing on particulate matter. Potential effects on the Glen Canyon to Lake 3 Mead reach from particulate emissions at the Lake Mead delta are also considered. 4
4.6.1 Methodology 5 Fugitive emissions can result from exposed sediment on the shorelines of Lake Powell and 6 Lake Mead as a result of fluctuations in their elevations. The mass of particulates generated 7 per acre of exposed shoreline will vary depending upon sediment characteristics and other 8 factors such as saturation, sediment disturbance, wind speeds, and topography. The method 9 for assessing potential fugitive emissions from exposed shoreline sediment at Lake Powell 10 and Lake Mead includes the following assumptions. 11
♦ The area of exposed shoreline for Lake Powell was developed using an average 12 shoreline slope of 45 degrees. The area of exposed shoreline for Lake Mead was 13 developed from bathymetry data. 14
♦ Incremental changes to Lake Powell and Lake Mead elevations were developed 15 corresponding to the years 2008 through 2060 from the CRSS modeling output. The 16 10th percentile elevations at the end of March for Lake Powell and the end of 17 December at Lake Mead were selected as worst case assumptions that still have a 18 reasonable probability of occurring. These are then correlated to the reservoir surface 19 areas (acres) and compared to the maximum elevations for Lake Powell (3,700 feet 20 msl) and Lake Mead (1,229 feet msl) to determine acres of exposed shoreline. 21
4.6.2 Lake Powell and Glen Canyon Dam 22 23
4.6.2.1 No Action Alternative 24 The lowest Lake Powell elevation occurs in March (Figure 4.6-1). For a comparative 25 evaluation, the years 2008, 2016, 2025, 2040, 2050, and 2060 were examined under the 26 No Action Alternative. The low Lake Powell elevation at the 10th percentile was 27 projected for the year 2025 with a maximum 16,656 acres of exposed shoreline. 28

Environmental Consequences Chapter 4
February 2007 4-150 Draft EIS – Colorado River Interim Guidelines for
Lower Basin Shortages and Coordinated Operations for Lake Powell and Lake Mead
1
The potential for fugitive emissions is limited by the extent of the area containing fine 2 sediment and that has the potential to generate dust. Areas of fine sediment at Lake 3 Powell comprise about three percent of the 1,960 miles of shoreline (National Park 4 Service 2002). The remainder of the Lake Powell shoreline consists of Navajo Sandstone 5 and other Glen Canyon Group rock formations. These rock formations are not conducive 6 to creating significant amounts of dust. 7
4.6.2.2 Basin States Alternative 8 At the 10th percentile, Lake Powell elevation is projected to be 3,553 feet msl in the year 9 2025, resulting in 16,582 acres of exposed shoreline. This would result in a decrease of 10 less than one percent in exposed shoreline compared to the No Action Alternative (Table 11 4.6-1). With this decrease in acreage, the potential to exceed the federal PSD Class II 12 threshold or state and national AAQS when compared to the No Action Alternative is 13 slightly decreased. 14
Figure 4.6-1 Lake Powell End-of-March Elevations
Comparison of Action Alternatives to No Action Alternative 90th, 50th, and 10th Percentile Values
3,500
3,525
3,550
3,575
3,600
3,625
3,650
3,675
3,700
2005 2010 2015 2020 2025 2030 2035 2040 2045 2050 2055 2060Year
Wat
er S
urfa
ce E
leva
tion
(feet
msl
)
No ActionBasin StatesConservation Before ShortageWater SupplyReservoir Storage
10th Percentile
50th Percentile
90th Percentile

Chapter 4 Environmental Consequences
Draft EIS – Colorado River Interim Guidelines for Lower Basin Shortages and Coordinated Operations for Lake Powell and Lake Mead
4-151 February 2007
Table 4.6-1 Lake Powell End-of-March 10th Percentile Elevation and Exposed Shoreline (Rounded to Nearest Whole Number)
Year No Action Alternative
Basin States Alternative
Conservation Before Shortage
Alternative
Water Supply
Alternative
Reservoir Storage
Alternative 2008 Surface Elevation (feet msl) 3,609 3,608 3,608 3,609 3,609
Exposed Shoreline Area (acres x 1,000) 10 10 10 10 10
Percent Difference Compared to No Action Alternative 0 1 1 0 0
2016 Surface Elevation (feet msl) 3,555 3,561 3,560 3,546 3,570
Exposed Shoreline Area (acres x 1,000) 16 16 16 17 15
Percent Difference Compared to No Action Alternative1 0 (4) (4) 7 (10)
2025 Surface Elevation (feet msl) 3,552 3,553 3,551 3,518 3,574
Exposed Shoreline Area (acres x 1,000) 17 17 17 21 14
Percent Difference Compared to No Action Alternative 0 0 1 23 (15)
2040 Surface Elevation (feet msl) 3,562 3,554 3,554 3,534 3,565
Exposed Shoreline Area (acres x 1,000) 16 16 16 19 15
Percent Difference Compared to No Action Alternative 0 6 6 20 (2)
2050 Surface Elevation (feet msl) 3,559 3,552 3,553 3,537 3,559
Exposed Shoreline Area (acres x 1,000) 16 17 16 18 16
Percent Difference Compared to No Action Alternative 0 5 4 16 0
2060 Surface Elevation (feet msl) 3,543 3,543 3,543 3,534 3,543
Exposed Shoreline Area (acres x 1,000) 18 18 18 19 18
Percent Difference Compared to No Action Alternative 0 0 0 6 0
1 Parenthesis indicates a reduction in exposed shoreline compared to the No Action Alternative
1

Environmental Consequences Chapter 4
February 2007 4-152 Draft EIS – Colorado River Interim Guidelines for
Lower Basin Shortages and Coordinated Operations for Lake Powell and Lake Mead
4.6.2.3 Conservation Before Shortage Alternative 1 At the 10th percentile, Lake Powell elevation is projected to be 3,551 feet msl in the year 2 2025. Draw downs to this level could result in 16,806 acres of exposed shoreline. This 3 would result in an increase of about one percent in exposed shoreline compared to the No 4 Action Alternative (Table 4.6-1). 5
This slight increase in acreage would not increase the potential to exceed the PSD Class 6 II threshold or the state or national AAQS when compared to the No Action Alternative. 7 Because of the sandstone formations of Lake Powell, dust would not be of concern. 8
4.6.2.4 Water Supply Alternative 9 At the 10th percentile, Lake Powell elevation is projected to be 3,518 feet msl in the year 10 2025, resulting in 20,516 acres of exposed shoreline. This would cause an increase of 23 11 percent in exposed shoreline compared to the No Action Alternative (Table 4.6-1). 12
This increase would potentially have a negative impact on air quality compared to the No 13 Action Alternative. As sediment comprises about three percent of the 1,960 miles of 14 shoreline, this increase in acreage would not result in exceedance of the PSD Class II 15 threshold or the state or national AAQS. Neither the small source area susceptible to 16 wind erosion nor the geologic formations would be conducive to creating dust. 17
4.6.2.5 Reservoir Storage Alternative 18 At the 10th percentile, Lake Powell elevation is projected to be 3,574 feet msl in the year 19 2025. Draw down of the Lake Powell water level to this elevation would result in a 20 decrease of 14,162 acres of exposed shoreline. The Reservoir Storage Alternative would 21 result in a decrease of about 15 percent in exposed shoreline compared to the No Action 22 Alternative (Table 4.6-1). 23
Compared to the No Action Alternative, the Reservoir Storage Alternative would result 24 in the highest reduction in dust emissions and increased beneficial impact to air quality. 25 Due to a decrease in exposed shoreline acreage, the potential to exceed the PSD Class II 26 threshold or the state or national AAQS is also decreased. 27
4.6.3 Glen Canyon Dam to Lake Mead, Lake Mead and Hoover Dam 28 29
4.6.3.1 No Action Alternative 30 The lowest Lake Mead elevation occurs in December (Figure 4.6-2). Under the No 31 Action Alternative, Lake Mead elevation would be drawndown to elevation 1,019 feet 32 msl for the year 2025, resulting in 86,770 acres of exposed shoreline (Table 4.6-2). 33

Chapter 4 Environmental Consequences
Draft EIS – Colorado River Interim Guidelines for Lower Basin Shortages and Coordinated Operations for Lake Powell and Lake Mead
4-153 February 2007
1
4.6.3.2 Basin States Alternative 2 At the 10th percentile, Lake Mead elevation is projected to be 1,030 feet msl in the year 3 2025, resulting in 83,920 acres of exposed shoreline. The Basin States Alternative would 4 result in a decrease of about three percent in exposed shoreline when compared to the No 5 Action Alternative (Table 4.6-2). This decrease in acreage would be directly proportional 6 to the area susceptible to wind erosion and fugitive dust emission. With a decrease in 7 exposed shoreline acreage, the potential to exceed the PSD Class I or II thresholds or the 8 state or national AAQS would also decrease. The three percent decrease would result in a 9 beneficial effect compared to the No Action Alternative. 10
Figure 4.6-2 Lake Mead End-of-December Elevations
Comparison of Action Alternatives to No Action Alternative 90th, 50th, and 10th Percentile Values
1,000
1,025
1,050
1,075
1,100
1,125
1,150
1,175
1,200
1,225
2005 2010 2015 2020 2025 2030 2035 2040 2045 2050 2055 2060
Year
Wat
er S
urfa
ce E
leva
tion
(feet
msl
)
No ActionBasin StatesConservation Before ShortageWater SupplyReservoir Storage
10th Percentile
50th Percentile
90th Percentile

Environmental Consequences Chapter 4
February 2007 4-154 Draft EIS – Colorado River Interim Guidelines for
Lower Basin Shortages and Coordinated Operations for Lake Powell and Lake Mead
Table 4.6-2 Lake Mead End-of-December 10th Percentile Elevation and Exposed Shoreline (Rounded to Nearest Whole Number)
Year No Action Alternative
Basin States
Alternative
Conservation Before
Shortage Alternative
Water Supply
Alternative
Reservoir Storage
Alternative 2008 Surface Elevation (feet msl) 1,102 1,103 1,104 1,102 1,106
Exposed Shoreline Area (acres x 1,000) 90 90 87 90 88
Percent Difference Compared to No Action Alternative1 0 (1) (3) 0 (2)
2016 Surface Elevation (feet msl) 1,051 1,051 1,050 1,052 1,072
Exposed Shoreline Area (acres x 1,000) 76 76 76 76 73
Percent Difference Compared to No Action Alternative 0 0 0 (1) (4)
2025 Surface Elevation (feet msl) 1,019 1,030 1,027 1,021 1,069
Exposed Shoreline Area (acres x 1,000) 87 84 85 86 72
Percent Difference Compared to No Action Alternative 0 (3) (2) (1) (17)
2040 Surface Elevation (feet msl) 1,014 1,014 1,013 1,013 1,019
Exposed Shoreline Area (acres x 1,000) 89 89 90 89 87
Percent Difference Compared to No Action Alternative 0 0 0 0 (3)
2050 Surface Elevation (feet msl) 1,014 1,015 1,013 1,015 1,019
Exposed Shoreline Area (acres x 1,000) 89 89 89.67 89 87
Percent Difference Compared to No Action Alternative 0 0 0.81 0 (2)
2060 Surface Elevation (feet msl) 1,012 1,013 1,013 1,012 1,013
Exposed Shoreline Area (acres x 1,000) 90 90 90 90 90
Percent Difference Compared to No Action Alternative 0 0 0 0 0
1 Parenthesis indicates a reduction in exposed shoreline compared to the No Action Alternative
1

Chapter 4 Environmental Consequences
Draft EIS – Colorado River Interim Guidelines for Lower Basin Shortages and Coordinated Operations for Lake Powell and Lake Mead
4-155 February 2007
4.6.3.3 Conservation Before Shortage Alternative 1 At the 10th percentile, Lake Mead elevation is projected to be 1,027 feet msl in the year 2 2025, resulting in more than 84,670 acres of exposed shoreline. The Conservation Before 3 Shortage Alternative would result in a decrease of more than two percent in exposed 4 shoreline when compared to the No Action Alternative (Table 4.6-2). 5
The decrease in acreage would be directly proportional to the area susceptible to wind 6 erosion and fugitive dust emissions. With a decrease in exposed shoreline acreage, the 7 potential to exceed the PSD Class I or II thresholds or the state or national AAQS would 8 also decrease. The decrease would result in a beneficial impact to the environment 9 compared to the No Action Alternative. 10
4.6.3.4 Water Supply Alternative 11 At the 10th percentile, Lake Mead elevation is projected to be 1,021 feet msl in the year 12 2025, resulting in more than 86,100 acres of exposed shoreline. The Water Supply 13 Alternative would result in a decrease of about one percent in exposed shoreline when 14 compared to the No Action Alternative (Table 4.6-2). The Water Supply Alternative 15 would have no impact or a slight benefit compared to the No Action Alternative. 16
The decrease in acreage would be directly proportional to the area susceptible to wind 17 erosion and fugitive dust emissions. With a small decrease in exposed shoreline acreage, 18 the potential to exceed the PSD Class I or II thresholds or the state or national AAQS 19 would also decrease. The decrease would have no impact or a slight benefit compared to 20 the No Action Alternative. 21
4.6.3.5 Reservoir Storage Alternative 22 At the 10th percentile, Lake Mead elevation is projected to be 1,069 feet msl in the year 23 2025, resulting in more than 71,730 acres of exposed shoreline. The Reservoir Storage 24 Alternative would result in a decrease of about 17 percent in exposed shoreline when 25 compared to the No Action Alternative (Table 4.6-2). Compared to the No Action 26 Alternative, the Reservoir Storage Alternative would have the most potential to reduce 27 fugitive emissions and result in beneficial impact to air quality. 28
The decrease in acreage would be directly proportional to the area susceptible to wind 29 erosion and fugitive dust emissions. With a decrease in exposed shoreline acreage, the 30 potential to exceed the PSD Class I or II thresholds or the state or national AAQS would 31 also be decreased. The decrease would result in a beneficial impact to the environment 32 compared to the No Action Alternative. 33
4.6.4 Summary 34 As reservoir elevations decrease and more shoreline is exposed, the potential for increased 35 fugitive dust emission increases. The exposed shoreline acreage under the Basin States 36 Alternative and under the Conservation Before Shortage Alternative are similar to that under 37 the No Action Alternative at both Lake Powell and Lake Mead and in the Glen Canyon Dam 38 to Lake Mead reach. The Water Supply Alternative would have the greatest increase in 39 exposed shoreline acreage compared to the No Action Alternative at Lake Powell, but would 40 be similar to the No Action Alternative at Lake Mead and the Glen Canyon Dam to Lake 41

Environmental Consequences Chapter 4
February 2007 4-156 Draft EIS – Colorado River Interim Guidelines for
Lower Basin Shortages and Coordinated Operations for Lake Powell and Lake Mead
Mead reach. The Reservoir Storage Alternative would have the greatest reduction in exposed 1 shoreline acreage compared to the No Action Alternative for both Lake Powell (15 percent in 2 2025) and Lake Mead (17 percent in 2025) and the Glen Canyon Dam to Lake Mead reach. 3
An increase in fugitive emissions as a result of increased exposed shoreline would be limited 4 in Lake Powell because the increased exposure of acreage would be comprised largely of 5 sandstone, which is not conducive to generating fugitive emissions of PM-10s. All of the 6 action alternatives have the potential to decrease acreage of exposed shoreline at Lake Mead 7 compared to the No Action Alternative and thus decrease particulate emissions at Lake Mead 8 and in the Glen Canyon Dam to Lake Mead reach. 9
10

Chapter 4 Environmental Consequences
Draft EIS – Colorado River Interim Guidelines for Lower Basin Shortages and Coordinated Operations for Lake Powell and Lake Mead
4-157 February 2007
4.7 Visual Resources 1
This section describes the methods and potential effects on visual resources at Lake Powell 2 and Lake Mead, focusing on selected attraction features, calcium carbonate rings, and 3 sediment deltas. 4
4.7.1 Methodology 5 To determine how changes in reservoir elevation might affect visual resources, data provided 6 in Table 4.3-3 were used to compare effects of the alternatives for Lake Powell attraction 7 features. Table 4.3-3 provides percentage of values less than or equal to a given elevation for 8 multiple years. The narrative describes effects for year 2026 because the greatest differences 9 among alternatives are projected then. 10
For calcium carbonate rings, the lowest water surface elevation reached under the 10th 11 percentile projections was used to provide a worst case or maximum extent of the calcium 12 carbonate ring. The height of the calcium carbonate ring was calculated as the distance in feet 13 from full pool elevations for Lake Powell and Lake Mead, to the lowest projected elevation 14 during the modeling time period (3,700 feet msl for Lake Powell and 1,221 feet msl for 15 Lake Mead). 16
4.7.2 Lake Powell and Glen Canyon Dam 17 18
4.7.2.1 Attraction Features 19 Views of attraction features may be altered due to changes in reservoir elevations, with 20 the key elevations ranging from 3,650 feet to 3,550 feet msl. 21
No Action Alternative. In 2026, there is a 59 percent probability of water being visible 22 under or near Rainbow Bridge. There is a four percent probability of exposing Cathedral 23 in the Desert. The upstream face of Glen Canyon Dam will be slightly more exposed, but 24 this is not considered a measurable visual impact. 25
Basin States Alternative and Conservation Before Shortage Alternative. In 2026, there is a 49 26 percent chance of water being visible under or near Rainbow Bridge. Under these two 27 action alternatives, there is a six percent chance of exposing Cathedral in the Desert. 28
Water Supply Alternative. In 2026, there is a 40 percent probability of viewing water under 29 or near Rainbow Bridge and a 17 percent chance of exposing Cathedral in the Desert. 30
Reservoir Storage Alternative. In 2026, there is a 62 percent chance of viewing water under 31 or near Rainbow Bridge and a one percent chance of exposing Cathedral in the Desert. 32
4.7.2.2 Calcium Carbonate Ring 33 34
No Action Alternative. The 10th percentile projections result in a maximum decrease to 35 elevation 3,540 feet msl, thus creating a potential calcium carbonate ring of 160 feet 36 in height. 37

Environmental Consequences Chapter 4
February 2007 4-158 Draft EIS – Colorado River Interim Guidelines for
Lower Basin Shortages and Coordinated Operations for Lake Powell and Lake Mead
Basin States Alternative and Conservation Before Shortage Alternative. Under these two 1 action alternatives, the 10th percentile projections result in a maximum decrease to 2 elevation 3,550 feet msl, thus creating a potential calcium carbonate ring of 150 feet 3 in height. 4
Water Supply Alternative. Under the Water Supply Alternative, the 10th percentile 5 projections result in a maximum decrease to elevation 3,505 feet msl, thus creating a 6 potential calcium carbonate ring of 195 feet in height. 7
Reservoir Storage Alternative. Under this alternative, the 10th percentile projections result 8 in a maximum decrease to elevation 3,540 feet msl, thus creating a potential calcium 9 carbonate ring of 160 feet in height. 10
4.7.2.3 Sediment Deltas 11 12
No Action Alternative. Sediment deltas will continue to build up over time and be visible 13 under the No Action Alternative. Ferrari’s (2006) longitudinal profile indicates that the 14 sediment delta is visible for at least 15 miles upstream of Hite. At 10th percentile 15 projections, the delta may be visible from as far away as 25 miles, essentially from Hite 16 to Gypsum Canyon. The primary effect is to Cataract Canyon boaters. 17
Basin States Alternative and Conservation Before Shortage Alternative. Under these two 18 action alternatives, the visual effects of the sediment delta would be similar to the No 19 Action Alternative. For most of the modeled timeframe, the sediment delta would be 20 slightly more visible to boaters than under the No Action Alternative due to the slightly 21 reduced Lake Powell elevation. The difference with the No Action Alternative is so slight 22 and incremental over time, that there would be no visual impact. 23
Water Supply Alternative. The Water Supply Alternative results in the lowest Lake Powell 24 elevations for most of the modeled timeframe; consequently, the sediment delta would be 25 most visible under this alternative. As with the calcium carbonate ring, while there is a 26 difference between the Water Supply Alternative and the No Action Alternative, for most 27 visitors, there would probably not be a measurable visual impact. Thus, there would be 28 low visual impact when compared to the No Action Alternative. 29
Reservoir Storage Alternative. Under this action alternative, Lake Powell elevations for 30 most of the modeled timeframe are higher than the No Action Alternative; consequently, 31 the sediment delta and visual impact on Cataract Canyon boaters will be reduced. Thus, 32 there is no visual impact when compared to the No Action Alternative. 33
4.7.3 Glen Canyon Dam to Lake Mead 34 The proposed federal action would have no effects on the visual resources in this reach. 35

Chapter 4 Environmental Consequences
Draft EIS – Colorado River Interim Guidelines for Lower Basin Shortages and Coordinated Operations for Lake Powell and Lake Mead
4-159 February 2007
4.7.4 Lake Mead and Hoover Dam 1 2
4.7.4.1 Attraction Features 3 Hoover Dam is a major destination and a national landmark. The proposed federal action 4 would not have any visual effects on this resource. 5
4.7.4.2 Calcium Carbonate Ring 6 7
No Action Alternative. The 10th percentile projections for Lake Mead result in a maximum 8 decrease to elevation 1,012 feet msl, thus creating a potential calcium carbonate ring of 9 209 feet in height. 10
Basin States Alternative and Conservation Before Shortage Alternative. The 10th percentile 11 projections for Lake Mead result in a maximum decrease to elevation 1,012 feet msl, thus 12 creating a potential calcium carbonate ring of 209 feet in height. 13
Water Supply Alternative. The 10th percentile projections for Lake Mead result in a 14 maximum decrease to elevation 1,011 feet msl, thus creating a potential calcium 15 carbonate ring of 210 feet in height. 16
Reservoir Storage Alternative. The 10th percentile projections for Lake Mead result in a 17 maximum decrease to elevation 1,013 feet msl, thus creating a potential calcium 18 carbonate ring of 208 feet in height. 19
4.7.4.3 Sediment Deltas 20 21
No Action Alternative. Studies at Lake Mead (Ferrari 2006) show that sediment deltas 47 22 miles long will continue to be present through the Lower Granite Gorge to about Iceberg 23 Canyon. This sediment delta will continue to build up over time and be visible under the 24 No Action Alternative. The primary visual effect is to visitors using upper Lake Mead, 25 Pearce’s Ferry, the Overton Arm, and Overton Beach. 26
Basin States Alternative and Conservation Before Shortage Alternative. Under these two 27 action alternatives, the visual effects of the deltas will be virtually indistinguishable from 28 those of the No Action Alternative. 29
Water Supply Alternative. The Water Supply Alternative only deviates from the No Action 30 Alternative around the year 2025, when it results in slightly lower Lake Mead elevations. 31 Consequently, the visual effect of the deltas is slightly worse than under the No Action 32 Alternative. Thus, the visual effect would be minimal when compared to the No Action 33 Alternative. 34
Reservoir Storage Alternative. Under the Reservoir Storage Alternative, Lake Mead 35 elevations for the modeled timeframe through 2030 are higher than under the No Action 36 Alternative; consequently, the visual impact of the deltas will be less than that under the 37 No Action Alternative or not visible at all. 38
Environmental Consequences Chapter 4
February 2007 4-160 Draft EIS – Colorado River Interim Guidelines for
Lower Basin Shortages and Coordinated Operations for Lake Powell and Lake Mead
4.7.5 Summary 1 For attraction features, the percent probability of water being visible under or near Rainbow 2 Bridge ranged from a low of 40 percent in Water Supply Alternative to 62 percent under the 3 Reservoir Storage Alternative. There was a range from 17 percent probability of exposing 4 Cathedral in the Desert to one percent under the Water Supply Alternative and under the 5 Reservoir Storage Alternative, respectively. Some visitors consider water under or near 6 Rainbow Bridge a negative impact, because it is a change from pre-dam conditions. 7 However, for other visitors, the view is improved with water under the bridge. Most would 8 agree that Cathedral in the Desert was one of the most spectacular geological features in Glen 9 Canyon before inundation; seeing this feature would be considered a positive visual impact. 10 There would be no visual effect on attraction features at Lake Mead. 11
For calcium carbonate rings at Lake Powell, the maximum height ranged from 195 feet under 12 the Water Supply Alternative to 150 feet under the Basin States and Conservation Before 13 Shortage alternatives. At Lake Mead, the maximum height was essentially unchanged under 14 any of the alternatives with the range from 208 to 210 feet. For both reservoirs, the presence 15 of the calcium carbonate ring is more of an effect that the height at any given reservoir 16 elevation. Therefore, while there are numeric differences in the projected height of the rings, 17 the overall difference in visual impact among the alternatives is not significant. 18
At both Lake Powell and Lake Mead sediment deltas will continue to build up over time and 19 be visible under all alternatives. The differences among all alternatives are negligible for both 20 Lakes Powell and Mead. 21
22

Chapter 4 Environmental Consequences
Draft EIS – Colorado River Interim Guidelines for Lower Basin Shortages and Coordinated Operations for Lake Powell and Lake Mead
4-161 February 2007
4.8 Biological Resources 1
This section describes the environmental consequences related to biological resources and 2 describes the methods used to determine the effects associated with implementation of the 3 proposed federal action. This section also provides a description of two ongoing environmental 4 protection programs within the study area. 5
4.8.1 Related Environmental Programs 6 Reclamation is committed to compliance with environmental statutes such as the Endangered 7 Species Act and the Grand Canyon Protection Act. The following are ongoing collaborative 8 programs intended to meet environmental compliance requirements. 9
4.8.1.1 Glen Canyon Dam Adaptive Management Program 10 Impacts to biological resources below Glen Canyon Dam are considered in the AMP, 11 which was established to monitor the effects of Glen Canyon Dam operations and other 12 management actions on the downstream environment. This program makes 13 recommendations to the Secretary regarding ways to fulfill the resource protection 14 requirements of the Grand Canyon Protection Act while complying with all applicable 15 federal law. This program will continue to analyze the effects of varied conditions on 16 biological resources below Lake Powell under the No Action Alternative and the action 17 alternatives. 18
4.8.1.2 Lower Colorado Multi-Species Conservation Program 19 For a portion of the study area, Reclamation is the implementing agency for the LCR 20 MSCP. This program mitigates potential flow-related and non-flow related impacts to 21 biological resources along the lower Colorado River. These impacts result from various 22 federal and non-federal actions over the next 50 years along the lower Colorado River 23 from Lake Mead to the SIB. This habitat-based program is being implemented to mitigate 24 impacts to special status species, although benefits of the LCR MSCP will accrue to all 25 species that utilize those habitats. This program covers potential impacts to the same 26 types of habitats that may be impacted by flow-related impacts of the action alternatives. 27 For NEPA purposes, the No Action Alternative is used as baseline. If needed, LCR 28 MSCP mitigation would be the primary source of mitigation to offset the impacts of the 29 final selected action alternative within the LCR MSCP study area. For example, the LCR 30 MSCP identified and it is mitigating impacts on LCR MSCP covered species and their 31 habitats. These impacts included the potential loss of up to: 32
♦ 2,008 acres of cottonwood-willow habitats; 33
♦ 133 acres of marsh habitat; and 34
♦ 399 acres of backwater habitat. 35
To address these impacts, the LCR MSCP would: 36
♦ restore 5,940 acres of cottonwood-willow habitat; 37

Environmental Consequences Chapter 4
February 2007 4-162 Draft EIS – Colorado River Interim Guidelines for
Lower Basin Shortages and Coordinated Operations for Lake Powell and Lake Mead
♦ restore 512 acres of marsh habitat; 1
♦ restore 360 acres of backwater habitat; 2
♦ stock 660,000 razorback sucker over the term of the LCR MSCP; and 3
♦ stock 620,000 bonytail over the term of the LCR MSCP. 4
In addition, these habitats would be actively managed to provide habitat values greater 5 than those of the impacted habitats. The quality and in most cases the quantity of restored 6 habitat will be greater than the impacted habitats. Restoration and management of these 7 habitats for LCR MSCP covered species would provide benefit to all flora and fauna that 8 utilize cottonwood-willow, marsh and backwater habitats along the Lower 9 Colorado River. 10
LCR MSCP flow-related covered activities include flow reductions due to 11 implementation of future shortages in the Lower Basin. Reclamation is committed to 12 enacting the conservation measures of the LCR MSCP and these measures will 13 effectively offset any potential minor impacts identified in this Draft EIS to cottonwood 14 willow, marsh, and backwaters from Lake Mead to the SIB. 15
4.8.2 Methodology 16 Two types of modeling results were used to perform the biological analysis, as follows: 17
♦ hydrologic modeling (CRSS) – reservoir elevations, dam releases, river flows; and 18
♦ water quality modeling (CE-QUAL-W2 and GEMMS) – temperatures. 19
This analysis evaluates the relative difference between the action alternatives and the No 20 Action Alternative. The level of available information varies with the study reaches; 21 therefore, the methodology is adjusted according to the availability of information for a 22 particular reach or group of reaches. 23
4.8.2.1 Assumptions 24 Desert scrub plant communities would not be affected by lowered reservoir elevations, 25 river stage, or groundwater. Cottonwood/willow/marsh vegetation types could be 26 adversely affected by lowered reservoir elevations, river stage, or groundwater and may 27 be lost. Tamarisk and mesquite communities would not be adversely affected by lowered 28 groundwater. For example, it has been reported that groundwater declines of 29 approximately 3.6 feet caused 92 to 100 percent of cottonwoods and willows to die, while 30 only zero to 13 percent of tamarisk died at their sample sites along the Bill Williams 31 River (Shafroth et. al. 2000). 32
Davis Dam and Parker Dam will continue to be operated to meet target reservoir 33 elevations and these operations will not vary between alternatives, thus the proposed 34 federal action will not impact riparian and marsh vegetation or wildlife habitats supported 35 by these reservoirs. 36

Environmental Consequences Chapter 4
Draft EIS – Colorado River Interim Guidelines for Lower Basin Shortages and Coordinated Operations for Lake Powell and Lake Mead
4-163 February 2007
The biological analyses are dependent upon the data inputs, modeling assumptions and 1 validity of the CE-QUAL-W2 and GEMMS models for water quality. The historic data 2 and water temperature models represent limited combinations of weather patterns, 3 hydrology, discharge patterns, and reservoir elevations. The upper and lower temperature 4 bounds from this analysis are the best estimates of probable discharge temperature ranges 5 at the indicated elevations. Additional discussion and data on temperature is provided in 6 Chapter 4.5 and in Appendix P. 7
Inflow temperatures to Lake Mead often do not warm to equilibrium temperatures during 8 much of the year. This is due to upstream cold releases from Lake Powell. The cool 9 inflows restrict the depth of surface water warming and contribute to cooler discharge 10 temperatures from Hoover Dam. If Lake Powell releases were significantly warmer, then 11 inflow temperatures to Lake Mead could reach equilibrium and discharge temperatures 12 would be warmer. 13
4.8.2.2 Vegetation Assessment Methodology 14 15
Lake Powell and Lake Mead. Reservoir elevations for the action alternatives were compared 16 to the No Action Alternative to determine whether shoreline vegetation is more or less 17 likely to establish and/or be inundated. 18
Glen Canyon Dam to NIB. Vegetation impacts were assumed to be limited to those plant 19 communities that consist of obligate phreatophytes (reliant on alluvial groundwater). The 20 LCR MSCP vegetation analysis anticipated that flow-related effects would have limited 21 impact on saltcedar and mesquite land cover types because these species are facultative 22 phreatophytes (not solely reliant on alluvial groundwater) and are more tolerant to 23 reductions in surface and groundwater water levels than cottonwood/willow or marsh 24 land cover types. The same assumption was used for this analysis. 25
Projections of monthly releases from Glen Canyon Dam, Hoover Dam, Davis Dam, and 26 Parker Dam for each action alternative were compared to the No Action Alternative. The 27 differences between the alternatives primarily at the 10th percentile were used as an 28 indicator of potential low-flow conditions, which has the most potential to adversely 29 affect vegetation. To estimate the significance of potential impacts, the potential flow 30 differences were analyzed to determine if they would fall inside or outside the annual 31 range of flows that have historically occurred in the Colorado River. Both Scott et. al. 32 (1999) and Shafroth et. al. (2000) indicated that phreatophytes may develop root systems 33 according to the hydrologic regime under which they developed. Flow variations of 34 several thousand cfs within one month and between months are considered within the 35 range of normal conditions. 36
Since the groundwater elevation along the Colorado River responds slowly to the releases 37 from the dams and the corresponding changes in river stage, it was assumed that annual 38 median changes in releases indicate potential changes in the alluvial water table elevation 39 near the river. These potential water table changes could impact riparian phreatophytes 40 and other riparian vegetation. A comparison of the median annual releases under each 41 alternative to the median annual releases under the No Action Alternative showed minor 42
Environmental Consequences Chapter 4
February 2007 4-164 Draft EIS – Colorado River Interim Guidelines for
Lower Basin Shortages and Coordinated Operations for Lake Powell and Lake Mead
reductions in river stage and corresponding water table elevations (Section 4.3.6.3 and 1 4.3.7.2). 2
NIB to SIB. Potential flow changes below the NIB as a result of implementation of the 3 proposed federal action would primarily be the result of potential changes in excess flows 4 (flood flows) arriving at the NIB. The differences in probability of these excess flows 5 under each of the alternatives could potentially affect vegetation between the NIB and the 6 SIB. Probabilities of these excess flows passing below the Morelos Diversion Dam under 7 the action alternatives were compared against the No Action Alternative to analyze 8 potential vegetation impacts. 9
4.8.2.3 Wildlife Assessment Methodology 10 Terrestrial wildlife was assumed to be affected only where the vegetation shows 11 substantial changes from the No Action Alternative. 12
An analysis of river sport fishery and aquatic food base impacts was based on release 13 temperature modeling, surface temperature data for Lake Powell and review of the 14 temperature conclusions in the SCOP FEIS (Clean Water Coalition 2006) for Lake Mead. 15 Since the sport fishery is primarily of interest to anglers, effects on this resource are 16 discussed in the Recreation Section 4.12. 17
4.8.2.4 Special Status Species Assessment Methodology 18 19
Lake Powell and Lake Mead. Impacts to terrestrial special status species at these reservoirs 20 were based primarily on the vegetation impact assessment. Potential impacts to special 21 status fish were assessed by comparing reservoir elevations under each action alternative 22 to the No Action Alternative. The potential range of release temperatures from Lake 23 Powell was also used to analyze potential impacts to special status fish between Glen 24 Canyon Dam and Lake Mead. Previous impact analysis for Lake Mead used elevation 25 1,160 feet msl as a threshold for potential impact to razorback sucker spawning areas in 26 the lake. However, recent monitoring has shown the two subpopulations of razorback 27 sucker in Lake Mead would change their spawning locations in response to lower 28 reservoir elevations (Albrecht and Holden 2006). Lake Mead is currently below elevation 29 1,160 feet msl. The elevation range of 1,120 feet msl to 1,150 feet msl was used for 30 comparison purposes in this analysis. 31
Environmental Consequences Chapter 4
Draft EIS – Colorado River Interim Guidelines for Lower Basin Shortages and Coordinated Operations for Lake Powell and Lake Mead
4-165 February 2007
Glen Canyon Dam to NIB. Impacts to terrestrial special status species along the river were 1 based primarily on the vegetation impact assessment. Impacts to special status fish were 2 based on comparing the range of potential dam release temperatures (available for Glen 3 Canyon Dam) to the life history temperature tolerances. Fishery impacts were also based 4 on comparing the monthly Lake Mead elevations and monthly releases from Davis Dam 5 and Parker Dam, where temperature data were not available. Changes in dam releases 6 that would fall outside the range of flows that typically occur were deemed to cause 7 impacts. Changes in release temperatures from Glen Canyon Dam under the No Action 8 Alternative were used to determine whether impacts to the aquatic food base could in turn 9 impact the special status fishery in the Grand Canyon. This analysis used larval 10 chironomids, larval simuliids, Gammarus lacustris, and Cladophora glomerata as 11 indicator organisms. If a particular alternative would substantially affect non-native sport 12 fish (Section 4.12), this was included in the special status fishery assessment. 13
NIB to SIB. Special status fish species do not exist in this reach so the analysis was limited 14 to terrestrial special status species. Flows in this reach of the river are sporadic, with the 15 river channel in the lower portion of the reach being frequently dry. 16
4.8.3 Effects on Vegetation and Wildlife 17 This section discusses the potential impacts to vegetation and wildlife that may result from 18 implementation of the proposed federal action. 19
4.8.3.1 Lake Powell and Lake Mead 20 21
No Action Alternative. Under the No Action Alternative, fluctuation of these reservoirs will 22 continue to inhibit plant growth around the reservoirs over the long term. Lake Powell 23 elevations trend upward under the 50th and 90th percentiles and somewhat downward 24 under the 10th percentile. Figures P-7, P-8 and P-9 provide Lake Powell end-of-March, 25 July, and September elevations. Lake Mead exhibits a slight downward trend under the 26 50th percentile and a more pronounced downward trend under the 10th percentile. Figures 27 P-10, P-11, and P-12 provide Lake Mead end-of-month elevations for March, July, and 28 September. To the extent that lake elevations may be reduced, these lower lake elevations 29 may have effects on biological resources, as described in the following paragraphs. 30
The sediment deltas in both reservoirs are expected to continue to be colonized by weeds 31 and tamarisk. The Lake Mead delta and the lower portion of the Grand Canyon especially 32 have had riparian vegetation become established and persist over long periods of time, 33 until inundated by rising reservoir elevations. The type of vegetation that becomes 34 established in these delta areas is dependent on two factors. The first factor is timing. If 35 the sediment becomes exposed during seed fall for cottonwood or willow, then those 36 species are likely to become established. If the sediment becomes exposed during the fall 37 months, then saltcedar is likely to be established and become the dominant vegetation. 38
A second factor that may influence the type of plant community that would become 39 established in the delta areas is the depth to groundwater or river elevation from these 40 exposed sediments. As the reservoir elevation declines and the sediment becomes 41 exposed, the river elevation as it downcuts through the newly exposed delta would help 42
Environmental Consequences Chapter 4
February 2007 4-166 Draft EIS – Colorado River Interim Guidelines for
Lower Basin Shortages and Coordinated Operations for Lake Powell and Lake Mead
determine whether cottonwoods or willows can survive, even if they become established. 1 If the river elevation drops too far below the root zone of cottonwoods and willows, plant 2 mortality would begin to occur, thus, opening gaps for saltcedar and other species to 3 become established. 4
Wildlife that utilizes these reservoirs and their shorelines are affected by the fluctuating 5 nature of these habitats to some extent. Reservoir fluctuation would continue into the 6 future, which would continue to alter habitat along the shoreline and below full-pool 7 elevation as has occurred in the past. 8
Action Alternatives. While the action alternatives differ from the No Action Alternative to 9 some degree, all the action alternatives exhibit similar fluctuations compared to the No 10 Action Alternative. Temporary establishment and loss of vegetation and wildlife habitat 11 below the full-pool elevation would occur similarly under all alternatives. In general, the 12 Reservoir Storage Alternative tends to result in higher reservoir elevations and the Water 13 Supply Alternative tends to result in lower reservoir elevations than the No Action 14 Alternative. The Conservation Before Shortage and Basin States alternatives tend to have 15 similar reservoir elevations as the No Action Alternative, though somewhat lower in 16 some years. Lower elevations would provide increased exposed shoreline where desirable 17 and undesirable plants could temporarily colonize. Higher elevations would provide 18 decreased exposed shoreline for plant colonization and would thus provide less 19 opportunity for temporary desirable and undesirable plant communities to develop. The 20 higher elevations under the Reservoir Storage Alternative may occur during the interim 21 period and modeling period. Tenth percentile Reservoir Storage Alternative lake 22 elevations return to the No Action Alternative conditions in approximately 2034 for Lake 23 Powell and in 2036 for Lake Mead. Lower elevations would increase the distance 24 between permanent shoreline vegetation and aquatic habitats, which would increase the 25 distance wildlife would need to travel between cover habitat and the lake edge. Higher 26 elevations would decrease the distance between permanent shoreline vegetation and the 27 lake edge. 28
The lower reservoir elevations that may occur with the Water Supply Alternative would 29 fall outside the potential range of the No Action Alternative. At these low reservoir 30 elevations, there would be a greater potential for sediment headcutting at the inflow areas 31 causing movement of sediment further into the reservoirs. The Water Supply Alternative 32 would have the greatest potential effect on these deltas due to increased reservoir 33 drawdown, which would impact vegetation and wildlife habitats. These impacts may 34 occur in the interim period and the modeling period. The lower lake elevations under the 35 Water Supply Alternative may remain lower than under the No Action Alternative until 36 approximately 2036 for Lake Powell and until 2040 for Lake Mead at the 50th percentile, 37 and until 2055 for Lake Powell at the 10th percentile. 38
4.8.3.2 Glen Canyon Dam to Lake Mead 39 40
No Action Alternative. The No Action Alternative at the 10th and 50th percentile average 41 monthly releases range from approximately 9,000 cfs to 14,000 cfs (Table 4.3-12). 42 Additional data on Glen Canyon Dam releases is provided in Figures P-13 through P-24 43

Environmental Consequences Chapter 4
Draft EIS – Colorado River Interim Guidelines for Lower Basin Shortages and Coordinated Operations for Lake Powell and Lake Mead
4-167 February 2007
in Appendix P. This range is similar to the range observed from 2000 to the present, 1 though lower than the high water years between 1995 and 2000. Therefore, the release 2 conditions which the vegetation and wildlife below Glen Canyon Dam have experienced 3 since 2000 would continue into the future at these percentile levels. The vegetation and 4 wildlife are likely adjusting or have adjusted to these lower flows. Stabilized flows have 5 been observed to favor riparian vegetation development at numerous locations in the 6 Western United States (Reclamation 1995 and USGS 2004). This trend benefits species 7 that utilize shrubby riparian vegetation. The overall release trend indicates that the 8 magnitude of monthly releases would generally be lower in the future in many months. 9
Action Alternatives. The action alternatives at the 10th percentile release all tend to be 10 lower than the No Action Alternative, with the Reservoir Storage Alternative being the 11 closest to the No Action Alternative. Tenth percentile release reductions are typically 12 between 700 and 2,000 cfs, though the Water Supply Alternative may be lower than the 13 No Action Alternative by up to 3,800 cfs in July and September. Low flows have the 14 greatest likelihood of negatively impacting riparian and marsh vegetation and wildlife 15 that utilize such habitats. The impacts would be minor because for the most part, these 16 reduced releases remain within the range of annual fluctuation and would be temporary. 17 The impacts may cause stress to phreatophytes, but would not be expected to cause 18 significant plant die-off. These impacts would affect obligate phreatophytes such as 19 willow more than facultative phreatophytes such as tamarisk. Thus these minor impacts 20 may favor continued tamarisk expansion, though tamarisk is expanding along the 21 Colorado River under existing conditions. Because Glen Canyon Dam releases under all 22 the alternatives generally return to the No Action Alternative conditions near the end of 23 the interim period, conditions causing these impacts would end after the interim period. 24 However, the effects on phreatophytes and continued tamarisk expansion may be 25 observable even after conditions return to the No Action Alternative conditions. 26
The magnitude of flows exceeding the No Action Alternative that may occur under the 27 action alternatives (90th percentile releases) is relatively small, with the exception of the 28 Reservoir Storage Alternative. Releases under the Reservoir Storage Alternative in June 29 may be up to 6,800 cfs above the No Action Alternative and approach 30,000 cfs. These 30 high flows may cause scouring of vegetation that may have developed lower on the banks 31 under previously lower flow conditions. These flows are below the levels of the 32 experimental high flows that have occurred in the past, which have exceeded 40,000 cfs. 33 Despite scouring losses from these higher flows, they would provide an overall benefit to 34 vegetation and wildlife in the long term. 35
Minor negative impacts to riparian vegetation from lower 10th percentile releases with all 36 alternatives would impact the habitats for herptofauna, small mammals, waterfowl, and 37 songbirds that utilize those habitats. Snakes found below Glen Canyon Dam are typically 38 found in drier portions of the reach and should not be impacted by these alternatives. 39 Fiftieth percentile elevation releases from Lake Powell will have similar temperatures as 40 the No Action Alternative for all the action alternatives and would thus cause no 41 temperature related impacts to amphibians along the river. Only the Water Supply 42 Alternative may result in higher temperatures in some years and may provide some 43 thermal benefit to amphibian reproduction along the river. It would be difficult to 44

Environmental Consequences Chapter 4
February 2007 4-168 Draft EIS – Colorado River Interim Guidelines for
Lower Basin Shortages and Coordinated Operations for Lake Powell and Lake Mead
measure these potential impacts as the impacts to vegetation should be minor and thus 1 indirect impacts to species using those habitats would be small. These potential small 2 habitat impacts are unlikely to impact large mammals in the canyon. Due to the potential 3 minor impacts to riparian vegetation, all the alternatives would have a similar minor 4 impact to wildlife between Glen Canyon Dam and Lake Mead. 5
4.8.3.3 Hoover Dam to Davis Dam 6 7
No Action Alternative. The Hoover Dam to Davis Dam reach consists primarily of the 8 reservoir pool of Lake Mohave, the elevation of which is controlled by operation of 9 Davis Dam. Lake Mohave and Lake Havasu are operated on a monthly rule curve and 10 end-of-month target elevations and therefore significant fluctuations do not occur. No 11 change in vegetation or wildlife is expected over the interim period or the modeling 12 period. Figures P-25 through P-36 of Appendix P provide information on monthly 13 Hoover Dam releases. 14
Action Alternatives. Elevations in these reservoirs under the action alternatives would not 15 deviate from the No Action Alternative elevations. Accordingly, there would be no 16 impacts to vegetation or wildlife at the reservoirs. Because vegetation is limited between 17 Hoover Dam and Lake Mohave, potential flow differences among alternatives in this 18 reach of the Colorado River would not substantially impact vegetation or wildlife. 19
4.8.3.4 Davis Dam to Parker Dam 20 21
No Action Alternative. Fluctuations below Davis Dam of several thousand cfs have 22 occurred in the recent past and would continue into the future. Vegetation and wildlife 23 habitat along the Colorado River are constantly making minor adjustments as these flows 24 fluctuate, which would continue into the future. 25
Action Alternatives. Release rates for Davis Dam fall within a relatively narrow band for 26 all months at the 50th and 90th percentiles. Figures P-37 through P-48 in Appendix P 27 provide monthly Davis Dam releases. The Reservoir Storage Alternative results in lower 28 releases during the interim period, while the Water Supply Alternative results in higher 29 releases. The higher releases would benefit vegetation and wildlife, but these benefits 30 would be minor. Lower releases under the Reservoir Storage Alternative would 31 negatively impact vegetation and wildlife compared to the releases under the No Action 32 Alternative. The Conservation Before Shortage and Basin States alternatives essentially 33 follow the No Action Alternative, and where there are differences they are isolated small 34 differences. Therefore, the Conservation Before Shortage and Basin States alternatives 35 should have no measurable impacts on vegetation between Davis Dam and Parker Dam. 36 The Reservoir Storage Alternative may cause some higher releases due to increased flood 37 control releases not seen in the other alternatives. These typically occur in winter months, 38 outside the growing season. These flows may be up to 6,000 cfs over the No Action 39 Alternative at the 90th percentile although would still not be large enough to cause 40 significant scouring or over bank flooding. Thus no substantial riparian benefits are 41 expected. The No Action Alternative and the action alternatives converge relatively 42 quickly after the end of the interim period. Conditions under the action alternatives 43

Environmental Consequences Chapter 4
Draft EIS – Colorado River Interim Guidelines for Lower Basin Shortages and Coordinated Operations for Lake Powell and Lake Mead
4-169 February 2007
generally return to the conditions under the No Action Alternative relatively soon after 1 the interim period, though effects on the vegetation of interim period conditions may be 2 observed beyond the interim period. 3
Impacts of the lower releases under the Reservoir Storage Alternative would have 4 similar impacts to wildlife as discussed for lower releases between Glen Canyon Dam 5 and Lake Mead. 6
4.8.3.5 Parker Dam to Imperial Dam 7 8
No Action Alternative. Figures P-49 through P-60 in Appendix P provide data on monthly 9 Parker Dam releases. At the 90th percentile level, monthly releases from Parker Dam 10 exhibit a downward trend through a reduction in high winter flows. Flows above Imperial 11 Dam exhibit a small downward trend at the 10th and 50th percentiles, but generally level-12 off after the interim period. At the 90th percentile, high flows above Imperial Dam in 13 winter become less common into the future as well. Vegetation and wildlife below Parker 14 and above Imperial Dam would experience a fluctuating release pattern over time. 15 Vegetation and wildlife would need to adjust to these reduced high flows but the gradual 16 nature of the declines should not substantially affect vegetation or wildlife. Fluctuations 17 below Parker Dam and above Imperial Dam of several thousand cfs have occurred in the 18 recent past and are expected to continue into the future. The plant communities along the 19 Colorado River are constantly making minor adjustments as these flows fluctuate. 20
Action Alternatives. Parker Dam releases under the Water Supply and Basin States 21 alternatives follow the No Action Alternative closely and would therefore not impact 22 vegetation or wildlife. Releases under the Conservation Before Shortage and Reservoir 23 Storage alternatives trend somewhat lower than the No Action Alternative, though still 24 within the range of flow variation that occurs. These lower releases would have minor 25 negative impacts to cottonwood/willow, marsh, and the wildlife that depend on these 26 habitats. The Reservoir Storage Alternative shows some higher releases during the 27 winter, but given the capacity of the channel in this reach, it is not likely that these 28 flows would substantially benefit riparian vegetation or wildlife habitat from over 29 bank flooding. These differences from the No Action Alternative releases tend to return 30 to the No Action Alternative conditions relatively soon after the interim period. 31
Flows above Imperial Dam under the Water Supply Alternative are similar to the No 32 Action Alternative and would therefore not impact vegetation or wildlife. Flows above 33 Imperial Dam during the growing season tend to be less than under the No Action 34 Alternative for the Reservoir Storage, Basin States, and Conservation Before Shortage 35 alternatives. Of these three alternatives, the Basin States Alternative exhibits the least 36 reduction from the No Action Alternative, while the Reservoir Storage Alternative 37 exhibits the most reduction. At the 10th percentile, these three alternatives would have 38 minor negative impacts on cottonwood-willow and marsh habitats and the wildlife that 39 rely on these habitats. These impacts would only occur during the interim period. The 40 impacts are expected to be minor because the flow reductions are typically 1,000 cfs and 41 less for the Reservoir Storage Alternative and 500 cfs and less for the Basin States 42 Alternative, which are within the range of variation that regularly occurs. 43

Environmental Consequences Chapter 4
February 2007 4-170 Draft EIS – Colorado River Interim Guidelines for
Lower Basin Shortages and Coordinated Operations for Lake Powell and Lake Mead
4.8.3.6 Imperial Dam to NIB 1 As noted in Section 3.3, most of the water delivered to Mexico is diverted at Imperial 2 Dam, conveyed via the AAC, and then returned to the Colorado River through the Pilot 3 Knob and Siphon Drop Powerplants and their respective wasteway channels, 2.1 and 7.6 4 miles upstream of the NIB, respectively (Section 3.3). The proposed federal action will 5 not alter the operation of these diversions and wasteways and therefore will not have an 6 effect on the river reach between Imperial Dam and the NIB. 7
4.8.3.7 NIB to SIB 8 9
No Action Alternative. The frequency and magnitude of flows are important factors in 10 maintaining riparian habitat and wildlife between Morelos Diversion Dam and the SIB; 11 however, the potential biological effects downstream of the NIB cannot be specifically 12 determined because of the uncertainty of water use once it flows to the NIB and becomes 13 available to Mexico. 14
The volume of water passing by Morelos Diversion Dam (Section 3.3) as a result of 15 cancelled water orders by contract users is rare enough to not have much effect on 16 vegetation or wildlife below the NIB. The hydrologic models assume that any water in 17 excess of Mexico’s scheduled normal or surplus deliveries would not be diverted by 18 Mexico and would continue down the Colorado River channel between Morelos 19 Diversion Dam to the SIB. This assumption results in the probability of flows passing 20 Morelos Diversion Dam that might be somewhat higher than may actually occur, and the 21 potential impacts discussed in the following section are based on this assumption. 22
Under the No Action Alternative conditions, flows below the Morelos Diversion Dam 23 will continue to be primarily the result of dam leakage and agricultural return flows. 24 Flows past the Morelos Diversion Dam will continue to be relatively rare events. It is 25 expected that the riparian and marsh vegetation and wildlife will continue to experience 26 some year-round flow in the upper part of the reach and sporadic flow in the lower part of 27 this reach under the No Action Alternative. Thus, historical conditions will generally 28 continue under the No Action Alternative. 29
Action Alternatives. During the interim period and beyond, the Basin States and Water 30 Supply alternatives are just as likely to cause excess flows below Morelos Diversion Dam 31 as the No Action Alternative, and would therefore cause no impact over the No Action 32 Alternative. Further, the probabilities of occurrence are low and are mostly between 10 33 percent and 15 percent. In representative years (2016, 2026, and 2060), the magnitude of 34 excess flows past Morelos Diversion Dam is zero for 80 percent to 90 percent of the 35 model traces for those years. The Reservoir Storage Alternative may increase the 36 magnitude of these flood control excess flows by as much as one mafy over the No 37 Action Alternative. The Conservation Before Shortage Alternative may increase the 38 magnitude of these flood control excess flows by as much as 0.4 mafy over the No 39 Action Alternative. Figure P-61 in Appendix P provides data on excess flows below the 40 Morelos Diversion Dam. 41

Environmental Consequences Chapter 4
Draft EIS – Colorado River Interim Guidelines for Lower Basin Shortages and Coordinated Operations for Lake Powell and Lake Mead
4-171 February 2007
Due to modeling assumptions under the Conservation Before Shortage and Reservoir 1 Storage alternatives, water is also delivered to Mexico through this reach via periodic 2 flows of about 40 kafy to 200 kafy (Appendix M). These pulse flows1 would occur 3 approximately every other year during the interim period only. The probability of flows 4 past Morelos Diversion Dam under these two alternatives returns to No Action 5 Alternative conditions after the interim period. These flows would benefit vegetation and 6 wildlife below Morelos Diversion Dam because they would increase river flow, scour 7 and redistribute sediment and provide opportunities for establishment of cottonwood-8 willow and marsh vegetation. These fluvial processes are valuable to aquatic and riparian 9 systems in the long-term, though temporary losses of riparian or marsh vegetation may 10 occur from scouring, which could temporarily disrupt wildlife. 11
Table 4.8-1 summarizes impacts to vegetation and wildlife for the alternatives. 12
4.8.4 Special Status Species 13 14
4.8.4.1 Lake Powell 15 16
No Action Alternative. Fluctuations of the Lake Powell elevations would continue into the 17 future, precluding the development of stable vegetated terrestrial habitats below elevation 18 3,700 feet msl because vegetation that develops is periodically dewatered and inundated. 19
Fish. The Colorado pikeminnow, bonytail chub, razorback sucker and flannelmouth 20 sucker are all occurring in Lake Powell, primarily at the inflow areas of the Colorado 21 River and the San Juan River. Flannelmouth sucker population has been decreasing 22 since the reservoir was formed (Reclamation 2000). Lower elevations would increase 23 the amount of riverine habitat for these species in the river inflow areas, which may 24 be a temporary benefit to these fish. 25
Birds. Special status birds that currently may be affected by elevation fluctuations at 26 Lake Powell include California condor, Bald eagle, osprey, belted kingfisher, Clark’s 27 grebe, and American peregrine falcon. California condors are scavengers, primarily 28 on large mammals and sometimes on fish. The lower reservoir elevations projected 29 for the future may expose additional shoreline for scavenging. 30
31
1 These flows were modeled as part of the storage and delivery mechanism under the Conservation Before Shortage and Reservoir Storage alternatives. The modeling assumptions were utilized in this Draft EIS in order to analyze the potential impacts to environmental resources of the storage and delivery mechanism, particularly with regard to reservoir elevations and river flow impacts. The use of these modeling assumptions does not represent any determination by Reclamation as to whether, or how, these releases could be made under current administration of the Colorado River.

Environmental Consequences Chapter 4
February 2007 4-172 Draft EIS – Colorado River Interim Guidelines for
Lower Basin Shortages and Coordinated Operations for Lake Powell and Lake Mead
1 Table 4.8-1
Vegetation and Wildlife Impact Summary Comparison of Action Alternatives to No Action Alternative
Location Alternative Impact Rationale Conservation Before Shortage and Basin States
No impact
Elevations and fluctuation similar to the No Action Alternative.
Water Supply Minor –negative
Reservoir elevations tend to be lower than under the No Action Alternative, with increased opportunities for undesirable plants to colonize shoreline and delta headcutting. Level fluctuations inundate all vegetation below full pool elevation. Lower elevations would increase distance between shoreline vegetation and the Lakes.
Lake Powell and Lake Mead
Reservoir Storage Minor-positive
Elevations tend to be higher than under the No Action Alternative, with decreased opportunities for undesirable plant to colonize shoreline and delta headcutting. Level fluctuations inundate all vegetation below full pool elevation. Higher elevations would decrease distance between shoreline vegetation and Lakes.
Glen Canyon Dam to Lake Mead
All Action Alternatives
Minor – negative
Decreased releases at 10th percentile (for all alternatives there are similar reductions overall). Release differences are within the range of recent history and annual fluctuation.
Hoover Dam to Davis Dam and Lake Havasu to Parker Dam
All Action Alternatives
No impact
Relatively small Hoover Dam release differences and very limited vegetation above Lake Mohave. Monthly rule curves at Lakes Mohave and Havasu prevent water level deviations from the No Action Alternative.
Conservation Before Shortage, Basin States
No impact
Monthly releases closely follow the No Action Alternative.
Water Supply Minor-positive
Monthly releases higher than under the No Action Alternative at 10th and 50th percentiles.
Davis Dam to Lake Havasu
Reservoir Storage Minor – Negative
Monthly releases lower than under the No Action Alternative at 10th and 50th percentiles.
Water Supply No impact
Monthly releases closely follow the No Action Alternative.
Parker Dam to Imperial Dam
Basin States, Conservation Before Shortage and Reservoir Storage
Minor – Negative
Monthly releases lower than under the No Action Alternative at 10th and 50th percentiles (the Reservoir Storage Alternative has the greatest reduction; the Basin States Alternative has the least reduction). The Reservoir Storage Alternative higher flows in the winter are unlikely to have substantial benefits due to channel capacity.
Imperial Dam to NIB
All Action Alternatives
No impact
Flow changes are routed through AAC and Pilot Knob/Siphon Drop power plants rather than river below Imperial Dam.
Basin States and Water Supply
No impact
Probability of excess flows past Morelos Diversion Dam is very close to the No Action Alternative.
NIB to SIB Reservoir Storage and Conservation Before Shortage
Moderate – positive
Relatively likely high flows expected past Morelos Diversion Dam, which would benefit the riparian corridor.
2
Environmental Consequences Chapter 4
Draft EIS – Colorado River Interim Guidelines for Lower Basin Shortages and Coordinated Operations for Lake Powell and Lake Mead
4-173 February 2007
Bald eagles in this area are primarily winter residents that feed on fish, waterfowl and 1 carrion. Though there may be effects on fisheries as reservoir elevations decline, no 2 effects on the population of fish are anticipated. Therefore, this food source is 3 expected to remain available for bald eagles under the No Action Alternative. 4
Ospreys are a rare transient in summer along the Colorado River. However, they 5 could potentially utilize Lake Powell during migration. Fluctuating reservoir 6 elevations would have no direct impacts to ospreys, and no substantial indirect effects 7 on food sources (fish) are expected. 8
Peregrine falcons may utilize Lake Powell for hunting songbirds, bats and small 9 mammals. Reservoir elevation fluctuations would not directly impact peregrine 10 falcons. Nearby populations in Grand Canyon are considered stable and the species 11 was delisted from federal listing in 1999 (Gloss et. al. 2005). 12
Belted kingfishers inhabit riparian areas in Arizona and mainly consume fish. 13 Kingfishers could be affected as fish availability fluctuates over time. Given the 14 gradual downward trend for Lake Powell elevations in the future, it is anticipated that 15 fish populations would be able to adjust to the changing conditions. Increased inflow 16 areas as the elevations recede may provide improved shallow water hunting area. 17
Clark’s grebe inhabit marshes and may be found in marsh habitat at the Lake Powell 18 inflow areas. They are common breeders in Utah and utilize lakes and shoreline 19 vegetation for breeding habitat. Future conditions under the No Action Alternative 20 project a decline in reservoir elevations. These declines may dewater marshes at the 21 inflow areas, causing temporary loss of marsh habitat until the marsh re-establishes at 22 a lower elevation, or the lake levels recover. 23
Mammals. Special status mammals that may utilize Lake Powell include spotted bat, 24 Townsend’s big-eared bat, pale Townsend’s big eared bat, fringed myotis, and occult 25 little brown bat. All of these species may utilize riparian habitats around the shoreline 26 of Lake Powell. As elevations fluctuate, these habitats may be dewatered or inundated 27 and localized effects on food source populations may occur. Given the wide-ranging 28 nature of these species, the No Action Alternative or any of the action alternatives 29 would not be expected to substantially impact these species. Accordingly, these 30 species would not be discussed further for this reach. 31
Amphibians. Northern leopard frog populations are found in side canyons of Lake 32 Powell above the fluctuating reservoir elevations (Gloss et. al. 2005). These 33 populations are above elevation 3,700 feet msl and would not be impacted by reduced 34 elevations of Lake Powell. However, continued fluctuations of Lake Powell 35 elevations would likely limit marsh and riparian vegetation at the shoreline, or only 36 allow it to establish temporarily, thus continuing to limit the potential for leopard 37 frogs and other amphibians to utilize areas below the full-pool elevation of Lake 38 Powell. 39

Environmental Consequences Chapter 4
February 2007 4-174 Draft EIS – Colorado River Interim Guidelines for
Lower Basin Shortages and Coordinated Operations for Lake Powell and Lake Mead
Action Alternatives. 1
Fish. Flannelmouth suckers, razorback sucker, Colorado pikeminnow and bonytail 2 chub occur in the inflow areas of the Colorado River and the San Juan River but do 3 not spawn in Lake Powell, and changing elevations would be unlikely to affect 4 habitat within the reservoir for any individuals remaining in the reservoir. 5
The lower elevations under the Water Supply, Conservation Before Shortage and 6 Basin States alternatives would increase the amount of riverine habitat for these 7 species in the river inflow areas, which may be a temporary benefit. The amount of 8 lowering would generally be less than 20 feet for the 50th percentile elevation in 9 March, 12 feet in July, and 17 feet in September (Figures P-7, P-8, P-9 in Appendix 10 P). For the 10th percentile reservoir elevations, the elevation changes could range from 11 16 feet higher to 13 feet lower, with most of the elevations being lower, than under 12 the No Action Alternative in all three months (March, July, and September). The 13 lower elevations would provide a small benefit to razorback sucker, bonytail, 14 Colorado pikeminnow and flannelmouth sucker in the river inflow areas by 15 increasing the amount of flowing water habitat, though this is expected to be a minor 16 benefit. These impacts may occur during the interim period and the modeling period. 17
The Reservoir Storage Alternative tends to result in higher lake elevations of less than 18 approximately 8 feet relative to the No Action Alternative for the 50th percentile 19 elevation in March, July, and September. For the 10th percentile reservoir elevations, 20 the elevation may be up to 26 feet higher in all three months. This would reduce the 21 amount of riverine habitat for razorback sucker, bonytail, Colorado pikeminnow and 22 flannelmouth sucker in the river inflow areas compared to the No Action Alternative 23 and create a minor negative impact. These impacts may occur during the interim 24 period and the modeling period. 25
Birds. Since bald eagles, peregrine falcons, California condor and osprey are all wide 26 ranging species that utilize many different habitat types in the area, none of the action 27 alternatives differ substantially enough to impact these species at Lake Powell. 28
Clark’s grebe would be impacted predominantly by impacts to marsh habitats. As 29 indicated in the Vegetation and Wildlife section, the Water Supply Alternative would 30 have a minor negative impact on vegetation, including marshes (at the inflow areas), 31 and the Reservoir Storage Alternative would have a minor-positive impact on 32 vegetation. Conservation Before Shortage and Basin States alternatives would not 33 impact Clark’s grebe. These impacts may occur during the interim period and the 34 modeling period. 35
Belted kingfishers would be most impacted by potential changes in fish food supplies. 36 Substantial impacts to fish food supplies at Lake Powell are not anticipated with any 37 action alternative, thus no impacts to belted kingfishers are anticipated. 38

Environmental Consequences Chapter 4
Draft EIS – Colorado River Interim Guidelines for Lower Basin Shortages and Coordinated Operations for Lake Powell and Lake Mead
4-175 February 2007
Amphibians. Northern leopard frog populations are found in side canyons above 1 elevation 3,700 feet msl, so none of the action alternatives would impact special 2 status amphibians at Lake Powell. 3
Table 4.8-2 summarizes the impacts to special status species by alternative. 4
Table 4.8-2 Lake Powell Special Status Species Impact Summary
Comparison of Action Alternatives to No Action Alternative Species Alternative Impact Rationale
Water Supply, Conservation Before Shortage, Basin States
Minor - positive
Reservoir elevations tend to be lower than under the No Action Alternative, increasing riverine conditions at the inflows. Razorback sucker,
bonytail, Colorado Pikeminnow, flannelmouth sucker Reservoir Storage Minor-
negative Reservoir elevations tend to be higher than under the No Action Alternative, decreasing riverine conditions at the inflows.
Bald eagle, peregrine falcon, osprey, California Condor, belted kingfisher
All Action Alternatives
No impact Wide ranging species and action alternatives do not differ substantially enough to cause indirect impacts.
Conservation Before Shortage and Basin States
No impact Reservoir elevations trend close to the No Action Alternative. Impacts to marsh not anticipated.
Water Supply Minor - negative
Lower reservoir elevations would have minor negative impact on marshes at inflows, by increased likelihood of headcutting sediment deltas.
Clark’s grebe
Reservoir Storage Minor – positive
Higher reservoir elevations would have minor positive impact on marshes at inflows, by decreased likelihood of headcutting sediment deltas.
Mammals All Action Alternatives
No impact Wide ranging species and action alternatives do not differ substantially enough to cause indirect impacts.
Northern leopard frog All Action Alternatives
No Impact Known populations above level of lake fluctuation.
5
4.8.4.2 Glen Canyon Dam to Lake Mead 6 7
No Action Alternative. Releases from Glen Canyon Dam would remain relatively stable 8 during the interim period, but would be reduced over the later years of the modeling 9 period. Reduced river flows have the potential to affect phreatophytes, marshes, and 10 associated special status species. 11
Plants. Grand Canyon evening primrose grows on beaches along or near the 12 mainstream Colorado River in the vicinity of Separation Canyon and downstream of 13 Diamond Creek (Reclamation 2000). Lower releases could allow this species to 14 colonize lower beaches exposed during reduced releases. Reduced high flows would 15 favor encroachment of riparian vegetation towards the Colorado River, which would 16 compete with the species. High flows and sediment, which are needed to maintain 17 beach habitats and discourage riparian vegetation encroachment, would continue to 18

Environmental Consequences Chapter 4
February 2007 4-176 Draft EIS – Colorado River Interim Guidelines for
Lower Basin Shortages and Coordinated Operations for Lake Powell and Lake Mead
be limited in the future. Beach habitat occupied by this species is also utilized by 1 recreationists, which limits Grand Canyon evening primrose establishment. 2
Invertebrates. The Kanab ambersnail occurs in semi-aquatic habitat associated with 3 springs and seeps. In the Grand Canyon, Kanab ambersnail were originally known to 4 occur only at Vasey’s Paradise, a large perennial spring. As part of an effort to 5 recover the species, Kanab amber snails were translocated from Vasey’s Paradise to 6 three other locations. One of the criteria used to select these sites was that it be above 7 the elevation of any potential future flood flows past Glen Canyon Dam. These 8 translocated populations would not be affected by the proposed federal action. The 9 Vasey’s Paradise population and vegetation are not flooded until flows exceed 17,000 10 cfs (Reclamation 2002, EA, FONSI Proposed Experimental Releases from Glen 11 Canyon Dam). Future conditions under the No Action Alternative may exceed 17,000 12 cfs for more than a single year in January, February, May, June, July, August, 13 September, and December at the 90th percentile release (Figures P-13 to P-24 in 14 Appendix P). 15
Niobrarra ambersnail occur in wetland habitats at several locations below Glen 16 Canyon Dam. The population near Lees Ferry is subject to inundation from even 17 moderate flows of the Colorado River (>25,000 cfs), and more than 90 percent of the 18 entire habitat is inundated at 45,000 cfs or more. The Indian Gardens population 19 persisted through the 1996 experimental flow. The population has not been monitored 20 since May 1998 and March 1999 at which time it was abundant. However, flows 21 exceeded 22,000 cfs for extended periods in the summer of 1998 and in May 1999, 22 and no snails were found during habitat searches in those periods. Flows over 20,000 23 cfs inundate the Indian Gardens habitat (Arizona Game and Fish 2004). Future 24 conditions under the No Action Alternative release may exceed 20,000 cfs at the 90th 25 percentile releases in June, July, August, September, and December, which could 26 cause a loss of wetland vegetation and individual snails. 27
MacNeill’s sootywing skipper is a butterfly found along the Colorado River from 28 southern Utah and Nevada to Arizona and southeastern California (Reclamation 29 1996a). Confirmed records of this species are reported for the Arizona counties of 30 Mohave, La Paz, Yuma, Yavapai, Maricopa and Pinal. The MacNeill’s sootywing 31 skipper is also present in San Bernardino, Riverside and Imperial counties in 32 California. This species also occurs along the Muddy River above Lake Mead (Austin 33 & Austin 1980). 34
The larval host plant for MacNeill’s sootywing skipper is quailbrush (Atriplex 35 lentiformis). Quailbrush is the largest salt bush found in Arizona and forms dense 36 thickets along the drainage system of the Colorado River (Emmel and Emmel 1973). 37 Quailbrush is associated with floodplains located in alkaline soil areas with adequate 38 water resources (Kearney and Peebles 1951). Specific surveys for this species and 39 larval host plants have not been conducted in the lower Grand Canyon; however, the 40 documented occurrence of MacNeill’s sootywing skipper along the Muddy River 41 above Lake Mead indicates there is a likelihood of occurrence in the lower Grand 42 Canyon. Suitable habitat for this species likely requires stands of more than one host 43
Environmental Consequences Chapter 4
Draft EIS – Colorado River Interim Guidelines for Lower Basin Shortages and Coordinated Operations for Lake Powell and Lake Mead
4-177 February 2007
plant (W. Wiesenborn 1999). Future conditions under the No Action Alternative are 1 not expected to affect floodplains where quailbrush is typically found. 2
Fish. Water releases from Glen Canyon Dam would continue to follow the guidelines 3 provided in the 1996 Glen Canyon Dam ROD under the No Action Alternative, 4 although the annual water releases may decrease in the future. Thus, the amount and 5 physical characteristics of habitat available to native special status fish species 6 (humpback chub, bluehead sucker, flannelmouth sucker) may vary over time under 7 the No Action Alternative. Little information is available to quantitatively assess the 8 potential effects of monthly release trends on the habitat of these fish. In general, the 9 daily operations and Glen Canyon Dam releases will continue to be consistent with 10 the 1996 Glen Canyon Dam ROD, therefore, the proposed federal action is not 11 expected to substantially affect daily fluctuation overall. For example, a study of 12 backwaters in the Grand Canyon (Goeking et al. 2003) found that the number and 13 area of backwaters present varied with river discharge between years at any given site 14 and varied among sites within one year. Given that there is little information to 15 correlate differences in monthly releases to impacts on the physical characteristics of 16 special status fish habitat availability, water temperature was selected as a better 17 metric to analyze the impacts to special status fish species. Cold river temperatures 18 and the presence of non-native fish species appear to be the key reasons for adverse 19 native fish conditions in this reach. 20
Temperature of water released from Glen Canyon Dam would vary depending on the 21 reservoir elevation, and these changes have been modeled (Section 4.5 and Appendix 22 P). Native fish, such as the humpback chub, flannelmouth sucker and bluehead sucker 23 could benefit from warmer water temperatures during their spawning season, because 24 releases of cold water from Lake Powell generally keep water temperature 25 downstream to Lake Mead below that needed for spawning to occur. Thus, spawning 26 could only occur in warmer tributaries or backwaters. When reservoir elevations in 27 Lake Powell fall below about 3,600 feet msl (approximately 10th percentile level), 28 water above 15 ºC (59 ºF) could be released. This water may warm approximately 29 2 ºC (35.6 ºF) by the time it reaches the Little Colorado River confluence and by up 30 to 5 ºC (41 ºF) near the Diamond Creek confluence. For the 10th percentile, water 31 temperatures could be warm enough for humpback chub spawning and egg 32 incubation from approximately May through July near Diamond Creek and from June 33 through July below the Little Colorado River confluence. Figures P-62 through P-79 34 in Appendix P provide information on modeled water temperatures at selected 35 locations for the No Action Alternative and the action alternatives. 36
Flannelmouth and bluehead suckers are also present in this reach of the Colorado 37 River although they use the warmer tributaries for spawning (Table 4.8-3). Only 38 under low Lake Powell elevations (10th percentile), could suitable temperatures for 39 spawning occur in the river for the bluehead sucker over a portion (about June to 40 October) of their spawning season above the Little Colorado River confluence, and 41 from about May to October near Diamond Creek. Egg incubation requires 42 temperatures about 2 ºC (35.6 ºF) warmer than for spawning and thus would not 43 occur for up to a month later in the spring, and then primarily near Diamond Creek. 44

Environmental Consequences Chapter 4
February 2007 4-178 Draft EIS – Colorado River Interim Guidelines for
Lower Basin Shortages and Coordinated Operations for Lake Powell and Lake Mead
For the 50th percentile elevations, water temperatures near Diamond Creek could be 1 warm enough for their spawning from about June to October, while the 90th percentile 2 elevation could result in suitable temperatures from about June through August. 3 However, temperatures may only be suitable for egg incubation in August to early 4 September for the 50th percentile and periodically in July and August for the 90th 5 percentile. For flannelmouth suckers, water temperatures could be warm enough for 6 spawning below the Little Colorado River in May and June, and in June at Lees Ferry 7 under 10th percentile reservoir elevations, while egg incubation could occur only in 8 June. Near Diamond Creek, temperatures could be warm enough for flannelmouth 9 spawning from about late April through June during their spawning season at the 10th, 10 50th, and 90th percentiles and egg incubation could occur in May and June. Water 11 temperatures may be adequate to support growth of these three fish species as 12 summarized in Table 4.8-3. 13
Table 4.8-3 Months When Water Temperatures may be Adequate to Support Growth of Fish Under the No Action Alternative
Species
Location Humpback Chub Flannelmouth Sucker Bluehead Sucker
Lees Ferry June through October at 10th percentile
June through October at 10th percentile
June through mid November at 10th percentile
Below Little Colorado River
June through October at 10th percentile
June through October at 10th percentile
June through October at 10th percentile September and October at 50th percentile
May through October at 10th percentile
May through October at 10th percentile May through October at 10th percentile
Diamond Creek June through October at 50th percentile
June through October at 50th percentile June through October at 50th percentile
June through August at 90th percentile
June through August at 90th percentile May through August at 90th percentile
14
At lower Lake Powell elevations, which may occur in the future under the No Action 15 Alternative, there is a higher potential for non-native fish to be released from Lake 16 Powell into the Glen Canyon Dam to Lake Mead reach. Warmer temperatures in the 17 future under No Action Alternative conditions at the Diamond Creek confluence 18 could create conditions that would favor the upstream migration of non-native fish 19 into the Grand Canyon. Warmer river temperatures may also promote the migration 20 of non-native warmwater fish from tributaries that provide inflow to this river reach. 21 These conditions would be a temporary occurrence. Since many non-native fish prey 22 on native fish, the potentially increased number of non-native warmwater fish may 23 adversely affect native species in this reach. However, there are many species of non-24 native fish species already present in this reach (Table 3.8-4). 25
Glen Canyon Dam releases made when Lake Powell water levels are drawdown to 26 levels coinciding with the 10th Percentile Lake Powell water elevation values (under 27 the No Action Alternative), could potentially result in warmer river flow 28

Environmental Consequences Chapter 4
Draft EIS – Colorado River Interim Guidelines for Lower Basin Shortages and Coordinated Operations for Lake Powell and Lake Mead
4-179 February 2007
temperatures. Under the No Action Alternative, these warmer river flow temperatures 1 may exceed 20 °C (68 °F) and may reach 25 °C (77 °F). These warmer river flow 2 temperatures could increase the potential for expansion of the Asian tapeworm 3 (Bothriocephalus acheilognathi) and anchorworm (Lernaea cyprinacea) in the 4 mainstream Colorado River in some years. Currently, these non-native fish parasites 5 are found primarily in fish in the Little Colorado River and other side tributaries and 6 mostly affect native fish. Under current conditions, these parasites are less likely to 7 infect fish in the Colorado River because water temperatures are less than optimal for 8 these parasites. The increased potential for these parasites to infect fish when Glen 9 Canyon Dam releases occur at low Lake Powell elevations could adversely affect 10 native fish including the humpback chub. Glen Canyon Dam releases made when 11 Lake Powell water levels are at the higher 50th and 90th percentile Lake Powell 12 elevation values result in cooler downstream temperatures and are mostly below 20 13 °C. 14
Historically, the release temperatures from Glen Canyon Dam have exhibited a 15 relatively narrow seasonal variability and typically ranged from approximately 7 °C 16 to 12 °C (44.6 ºF to 53.6 ºF) between 1990 and 2002 (Appendix F, Figure F-5). After 17 2002, the temperatures began to increase and the seasonal variability widened and 18 ranged from approximately 8 °C to 16 °C (46.4 ºF to 60.8 ºF). Modeled future release 19 temperatures for the No Action Alternative at the 50th percentile Lake Powell 20 elevations indicate similar potential conditions to those that began in 2002. Modeled 21 release temperatures at the 10th percentile Lake Powell elevation indicate the 22 possibility of warmer release temperatures and a wider seasonal variability (a range of 23 11 °C to 22 °C) (Table 4.5-5). These warmer release temperatures under the No 24 Action Alternative could affect the aquatic foodbase below Glen Canyon Dam. 25 However, larval chironomids, larval simuliids, Cladophora and Gammarus are key 26 components of the aquatic foodbase below Glen Canyon Dam and they are tolerant of 27 a wide range in temperature. No potential effects on the aquatic foodbase due to 28 changes in the water clarity, particularly algae, are expected as a result of the 29 implementation of the proposed federal action. 30
The favorable temperature ranges are 8 °C to 25 °C (46.4 °F to 77 °F) for larval 31 chironomids (LeSage and Harrison 1980; Laville and Vincon 1991; Sublette et. al. 32 1998; Stevens et. al. 1998; Danks 1978; Maier et. al. 1990), 10 °C to 26 °C (50 °F to 33 78.8 °F) for larval simuliids (Becker 1973; Ross and Merritt 1978; Colbo and Porter 34 1981; Hauer and Benke 1987), 13 °C to 17 °C (55.4 °F to 62.6 °F) for Cladophora 35 (Graham et. al. 1982; Wong et. al. 1978), and 7 °C to 29 °C (44.6 °F to 84.2 °F) for 36 Gammarus (Smith 1973; Pennak and Rosine 1976; Macneil et. al. 1997). The 37 potential future release temperatures for the No Action Alternative should be similar 38 to or higher than historic release temperatures. The warmer releases that may occur at 39 the 10th percentile Lake Powell elevations may be warmer than the preference of 40 Cladophora in some years, but in general, these potential warmer releases may 41 provide some overall benefit to the aquatic foodbase. This potential benefit is 42 anticipated to benefit special status fish that rely on these organisms as their food 43 source. Effects of the No Action Alternative on the aquatic foodbase and special 44

Environmental Consequences Chapter 4
February 2007 4-180 Draft EIS – Colorado River Interim Guidelines for
Lower Basin Shortages and Coordinated Operations for Lake Powell and Lake Mead
status fish would be similar to historic effects. Substantial temperature-related effects 1 to the aquatic foodbase are not anticipated with the No Action Alternative. 2
Mammals. Western small-footed myotis, pale Townsend’s big eared bat, spotted bat, 3 Allen’s big-eared bat, western red bat, Yuma myotis, occult little brown bat, and 4 Fringed myotis all may utilize this reach. Colorado River flows do not directly impact 5 these species as they generally roost in caves and trees well above potential flow-6 related impacts. They are not obligate riparian species but may utilize such habitats 7 for hunting. Impacts to these bat species from changes in vegetation, insect 8 populations, from flow and water temperature changes are not likely under the No 9 Action Alternative or the action alternatives. Accordingly, these species are not 10 discussed further for this reach. 11
Amphibians. For the leopard frog population above Lees Ferry, reduced flows would 12 not affect the spring-fed site. Inundation at this site occurs at approximately 21,000 13 cfs (Figures P-18 through P-21 in Appendix P). Inundation of this site would 14 potentially occur under the No Action Alternative from June through September, as 15 the 90th percentile releases in these months could exceed 21,000 cfs. Leopard frog 16 reproduction has only been observed in warm (ca. 20 °C or 68 °F) pool and marsh 17 areas, away from the direct influence of the river (Drost 2005). Colder pools (10 °C to 18 15 °C [50 °F to 59 °F]) that receive water from the Colorado River appear to be 19 avoided. Water temperature at the spring site remains above 15 °C throughout the 20 year and above 20 °C for several months (Spence 1996). Most of the warmer pools 21 are located above the 21,000 cfs level; larvae and any remaining eggs still present 22 during spring release peak flows would only infrequently be exposed to Colorado 23 River flows. Lake Powell release temperatures under the No Action Alternative may 24 exceed 15 °C (59 °F) when the reservoir is at the 10th percentile elevation. At the 50th 25 and 90th percentiles, the Lake Powell release temperatures are expected to remain 26 predominantly below 15 °C (59 °F) under the No Action Alternative (Figures P-68, 27 P-69, P-70 in Appendix P). Thus, release temperatures would continue to remain 28 below ideal temperatures for leopard frog under the No Action Alternative for most 29 of the time. 30
Birds. Special status birds in this reach include bald eagle, California condor, 31 southwestern willow flycatcher, Clark’s grebe, osprey, belted kingfisher, snowy egret, 32 and American Peregrine falcon. For the same reasons that California condor, osprey, 33 belted kingfisher, and American peregrine falcon would be unaffected in Lake 34 Powell, the proposed federal action would not impact these species between Glen 35 Canyon Dam and Lake Mead. Between Glen Canyon Dam and Lake Mead, steep 36 shorelines limit the establishment of significant marshes. It is unlikely that Clark’s 37 grebe or snowy egret would be impacted in this reach. Accordingly, only the bald 38 eagle and southwestern willow flycatcher are discussed further in this reach. 39
Bald eagles in this area are primarily winter residents and they feed largely on fish, 40 waterfowl and carrion. Bald eagles feed on trout in the Lees Ferry area, and often 41 congregate at Nankoweap Creek. Less than ideal river temperatures for trout may 42 occur in the future in some years; however, despite such potential adverse effects on 43

Environmental Consequences Chapter 4
Draft EIS – Colorado River Interim Guidelines for Lower Basin Shortages and Coordinated Operations for Lake Powell and Lake Mead
4-181 February 2007
trout in some years, it is anticipated that trout will remain a food source for eagles 1 under the No Action Alternative. Potential increases in river flow temperatures under 2 the No Action Alternative or action alternatives may result in an increase in the 3 warmwater fish population which could serve as a supplemental food source for 4 eagles. Future conditions under the No Action Alternative are not anticipated to affect 5 roost or nest sites. 6
Southwestern willow flycatchers nest in riparian shrub habitats of tamarisk and 7 willow downstream of Glen Canyon Dam. Reduced flows in the future would tend to 8 continue favoring the establishment of riparian shrub vegetation in this reach. These 9 conditions benefit southwestern willow flycatchers since they inhabit willow and 10 tamarisk plant communities and have generally benefited from post-Glen Canyon 11 Dam conditions. This trend would continue into the future. 12
Action Alternatives. Releases will only deviate from No Action Alternative conditions 13 during the interim period for this reach. Though conditions causing potential impacts 14 would cease after the interim period, effects on vegetation communities from interim 15 period conditions may be observed beyond the interim period. 16
Plants. At the 90th percentile June Glen Canyon Dam releases, the Reservoir Storage 17 Alternative may have spill avoidance releases that would exceed the No Action 18 Alternative. June releases are the highest for the year at the 90th percentile and were 19 used to gage potential impacts to Grand Canyon primrose habitat (Figure P-18 in 20 Appendix P). These higher releases have a greater potential to adversely impact beach 21 habitat and thus Grand Canyon evening primrose. These high flows may approach 22 34,000 cfs, which is still less than recent experimental releases that have exceeded 23 40,000 cfs, so the impacts should be negligible. The Conservation Before Shortage, 24 Water Supply and Basin States alternatives sometimes exceed the No Action 25 Alternative at the 90th percentile, but they are typically in months that are not the 26 annual high release and they still remain relatively close to the No Action Alternative. 27 Therefore, the action alternatives are not expected to result in impacts on Grand 28 Canyon evening primrose. The Reservoir Storage Alternative could potentially have a 29 minor negative impact on Grand Canyon primrose due to occasional spill avoidance 30 releases. 31
Invertebrates. Kanab ambersnail habitat is impacted when flows exceed 17,000 cfs. 32 During the interim period, the Conservation Before Shortage and Basin States 33 alternatives may exceed the flows observed under the No Action Alternative and 34 17,000 cfs in April and May at the 90th percentile (Figures P-16, P-17). The other two 35 action alternatives have only a few isolated years above the No Action Alternative 36 and 17,000 cfs in these months. July releases at the 90th percentile under the 37 Conservation Before Shortage and Basin States Alternatives would be above 17,000 38 cfs, but lower than the No Action Alternative, therefore possibly inundating less 39 Kanab ambersnail habitat in this month. The Conservation Before Shortage and Basin 40 States alternatives could also be above the No Action Alternative and 17,000 cfs at 41 the 50th percentile in August, thus inundating more Kanab ambersnail habitat. The 42 Water Supply Alternative could also have 50th percentile flows that are higher than 43

Environmental Consequences Chapter 4
February 2007 4-182 Draft EIS – Colorado River Interim Guidelines for
Lower Basin Shortages and Coordinated Operations for Lake Powell and Lake Mead
the No Action Alternative and above 17,000 cfs in August, though this is the only 1 month where this may occur for the Water Supply Alternative, and most of the time 2 flows would be similar to the No Action Alternative when above 17,000 cfs. In June, 3 the Reservoir Storage Alternative’s occasional spill avoidance releases up to 6,000 cfs 4 above the No Action Alternative (to 29,500 cfs) would flood additional Kanab 5 ambersnail habitat (Figure P-18 in Appendix P). The Kanab ambersnail population at 6 Vasey’s Paradise survived and recovered from innumerable similar and higher flows 7 during the pre-dam era, and has survived six flows in excess of 45,000 cfs during the 8 post-dam era (1965, 1980, 1983, and 1986). The Reservoir Storage Alternative could 9 also exhibit flows above 17,000 cfs and exceeding the flows observed under the No 10 Action Alternative in December. 11
At the 10th percentile, all the action alternatives may have lower releases from Glen 12 Canyon Dam in some months. Though it is not possible to accurately project under 13 which months those release levels would occur or how many months in a row this 14 would occur, these lower releases would allow spring vegetation at Vasey’s Paradise 15 to develop lower down on the canyon. Ambersnail’s could move into this lower 16 habitat if releases are lower for long enough for such habitat to develop. When 17 releases rise again, this habitat would be inundated and could impact ambersnails. 18 However, this type of impact also occurs under the No Action Alternative. 19 Accordingly, these potential impacts are expected to be minor and the action 20 alternatives should not impact the population that occurs above the zone of 21 fluctuating releases. Reclamation has consulted with the FWS (FWS 1994) on the 22 effects to the Vasey’s Paradise population from the operations of Glen Canyon Dam. 23
The Reservoir Storage Alternative may exceed the No Action Alternative release and 24 20,000 cfs in June and December at the 90th percentile and would thus have a greater 25 potential for a negative impact on Niobrarra ambersnail habitat. When Glen Canyon 26 Dam releases are above 20,000 cfs at the 90th percentile release level, the frequency 27 and magnitude of releases under the Conservation Before Shortage, the Basin States 28 and Water Supply alternatives are equal or less than those under the No Action 29 Alternative, which has a greater potential for a positive impact on Niobrarra 30 ambersnail habitat. 31
The Conservation Before Shortage, Basin States and Water Supply alternatives are 32 not expected to affect the alluvial floodplain in the lower Grand Canyon area and 33 would thus not impact MacNeill’s sooty-winged skipper habitat. Occasional spill 34 avoidance releases in June under the Reservoir Storage Alternative have the greatest 35 potential to impact floodplains and quailbrush, and therefore would have the greatest 36 potential impact on MacNeill’s sooty-winged skipper habitat. 37
Fish. Water temperatures in the Colorado River below Glen Canyon Dam under the 38 Conservation Before Shortage and Basin States alternatives should be similar to those 39 for the No Action Alternative, although the water may be warmer a few weeks earlier 40 under 10th percentile below the Little Colorado River and near Diamond Creek. This 41 would allow the humpback chub and bluehead sucker to spawn and egg incubation to 42 occur a little earlier, which would provide conditions that could benefit these species. 43

Environmental Consequences Chapter 4
Draft EIS – Colorado River Interim Guidelines for Lower Basin Shortages and Coordinated Operations for Lake Powell and Lake Mead
4-183 February 2007
Flannelmouth potentially could spawn under 50th percentile levels below the Little 1 Colorado River, but egg incubation would not occur. Temperatures suitable for 2 growth may occur for about one month longer below the Little Colorado River at 10th 3 percentile elevations and at Diamond Creek under 50th percentile elevations for all 4 three species. Some growth could potentially occur under 50th percentile elevations 5 for all three species below the Little Colorado River as well. 6
Under the Reservoir Storage Alternative, water temperatures in the river would 7 usually be as cold as or sometimes colder than under the No Action Alternative. For 8 the 10th percentile elevation, lower water temperatures could occur in January and 9 February as well as in June through July (near Diamond Creek) or August (at Lees 10 Ferry and below the Little Colorado River). For the 50th percentile elevation, lower 11 water temperatures could occur from September through February at Lees Ferry, from 12 August through March below the Little Colorado River confluence, and from August 13 through February near Diamond Creek. These lower temperatures would not improve 14 spawning or incubation temperatures for any of the native fish. Lower temperatures 15 would have the potential to reduce growth rates for native fish in the Colorado River 16 but would not affect those individuals residing in tributaries. 17
Under the Water Supply Alternative, water released to the Colorado River could be 18 warmer at times. From about May through September, water temperatures at and 19 below the Little Colorado River confluence may be 2 ºC to 5 ºC (35.6 ºF to 41 ºF) 20 warmer than under the No Action Alternative and could be warm enough for 21 humpback chub, flannelmouth, and bluehead sucker spawning to occur in the 22 Colorado River. For the humpback chub, water temperatures near Diamond Creek 23 could be warm enough for spawning and egg incubation May through July under 10th 24 percentile elevations and in June and July under 50th and 90th percentile elevations. 25 Just below the Little Colorado River confluence, temperatures have the potential to be 26 warm enough for humpback chub spawning and egg incubation in May through July 27 under 10th percentile elevations. These 10th percentile temperatures would increase 28 the spawning and incubation time by about one month near the Little Colorado River 29 and provide a greater likelihood of warmer temperatures than under the No Action 30 Alternative. 31
For bluehead sucker, 10th percentile water temperatures could be warm enough for 32 spawning below the Little Colorado River from about June through October and near 33 Diamond Creek from May through October under the Water Supply Alternative. 34 Water temperatures suitable for flannelmouth sucker spawning may occur near 35 Diamond Creek in May and June and under 10th percentile levels in May and June 36 below the Little Colorado River. The timing of these temperatures is similar to that 37 for the No Action Alternative, but the likelihood of their occurrence is greater than 38 under the No Action Alternative. How much of a benefit this could be to these species 39 would depend on the frequency of these warmer temperatures, which is not known. 40
For the Water Supply Alternative, water temperatures may support growth of all three 41 species for one to two months longer from Glen Canyon Dam to Lake Mead than 42 under the No Action Alternative. Near the Little Colorado River, some growth could 43

Environmental Consequences Chapter 4
February 2007 4-184 Draft EIS – Colorado River Interim Guidelines for
Lower Basin Shortages and Coordinated Operations for Lake Powell and Lake Mead
occur under 50th percentile elevations in the late summer to fall (August to October) 1 for all three species. 2
The warmer water temperatures under the Water Supply Alternative would also 3 benefit existing populations of non-native, non-game warmwater species such as carp, 4 fathead minnows, catfish, and red shiner. This could increase competition for 5 resources or predation on the native species that would have a negative impact on the 6 native species, thereby at least partially offsetting the benefits of the warmer 7 temperatures on the native species. 8
The passage of non-native fish through Glen Canyon Dam may occur as the lake 9 levels drop, and the greatest potential for this to occur is under the Water Supply 10 Alternative, which tends to have lower lake levels than all the other alternatives. The 11 Reservoir Storage Alternative has the least potential for non-native fish passage 12 because the lake levels tend to be higher than those under the other alternatives. The 13 Conservation Before Shortage and Basin States alternatives tend to have Lake Powell 14 elevations that are close but somewhat lower than the No Action Alternative, which 15 would result in a small increase in the potential to pass non-native fish through Glen 16 Canyon Dam. These trends occur during the interim period and for varied lengths of 17 time into the modeling period. The Water Supply Alternative could take the longest to 18 return to No Action Alternative conditions after the interim period. As indicated in 19 the No Action Alternative discussion, the increased potential to pass non-native fish 20 could adversely affect native fish below Glen Canyon Dam. 21
The Water Supply Alternative may result in higher Glen Canyon Dam release 22 temperatures than the No Action Alternative. This has the potential to create 23 conditions favorable for upstream migration of warmwater non-native fish into the 24 Grand Canyon and the migration of non-native warmwater fish into the Colorado 25 River from warmer side tributaries. The Reservoir Storage Alternative may have the 26 lowest water temperatures at the Diamond Creek confluence, but similar to the No 27 Action Alternative. The Conservation Before Shortage and Basin States alternatives 28 would have effects similar to the No Action Alternative on conditions favoring 29 upstream migration of non-native warmwater fish into the Grand Canyon and the 30 migration of non-native warmwater fish into the Colorado River from warmer side 31 tributaries. However, there are numerous non-native warmwater fish species that 32 already inhabit the Grand Canyon. 33
Temperatures potentially favoring expansion of the Asian tapeworm and anchorworm 34 into the Colorado River may occur when Lake Powell water levels are drawdown and 35 warmer water is released from Glen Canyon Dam. As noted before, these warmer 36 water temperatures generally coincide with Lake Powell water levels coinciding with 37 the 10th Percentile lake elevation values observed under the No Action Alternative 38 and the action alternatives, a condition that has a low probability of occurrence. Glen 39 Canyon Dam releases made when the Lake Powell water levels are higher, at levels 40 coinciding with the 50th and 90th Percentile elevation values, typically result in cooler 41 downstream river flow temperatures. Under these latter conditions, the river flow 42 temperatures typically remain below 20 °C the majority of the time and these cooler 43

Environmental Consequences Chapter 4
Draft EIS – Colorado River Interim Guidelines for Lower Basin Shortages and Coordinated Operations for Lake Powell and Lake Mead
4-185 February 2007
temperatures are less conducive for migration of the non-native parasites into the 1 mainstream of the Colorado River. The Water Supply Alternative has a greater 2 probability of providing favorable conditions for the migration of the Asian tapeworm 3 and anchorworm into the mainstream of the Colorado River because this alternative 4 provides the lowest Lake Powell water levels and potentially, warmer Glen Canyon 5 Dam release temperatures. The Reservoir Storage Alternative provides higher Lake 6 Powell water levels and generally cooler Glen Canyon Dam release temperatures. As 7 such, the Reservoir Storage Alternative has a lower potential to increase Asian 8 tapeworm and anchorworm expansion into the mainstream Colorado River, compared 9 to the No Action Alternative. The Conservation Before Shortage and Basin States 10 alternatives will have a similar effect as that as of the No Action Alternative. 11
The Conservation Before Shortage and Basin States alternatives should have very 12 similar release temperatures as the No Action Alternative. Temperatures at Lees 13 Ferry, Little Colorado River, and Diamond Creek would also be similar to the No 14 Action Alternative (Appendix P). Therefore, these two alternatives should not have 15 temperature-related impacts on the aquatic foodbase or the food sources for special 16 status fish. The Water Supply Alternative may have warmer releases than No Action 17 at the 10th percentile Lake Powell elevations, which may potentially result in warmer 18 temperatures downstream. The Reservoir Storage Alternative may have colder 19 releases than No Action Alternative at the 10th percentile Lake Powell elevations, 20 which results in colder temperatures downstream. The warmer releases under the 21 Water Supply Alternative may trend further from the preferences of Cladophora, 22 which could affect the other invertebrates which feed on it. However, Cladophora 23 should remain present despite the potential release temperatures above its preferred 24 thermal range, and invertebrates may benefit from warmer temperatures overall. The 25 predominance of Cladophora below Glen Canyon Dam appears to be linked to water 26 clarity. The action alternatives are not expected to have any substantial effects on 27 river clarity trends in the river reach between Glen Canyon Dam and Lake Mead. The 28 Reservoir Storage Alternative tends to create conditions for the aquatic foodbase 29 closer to historic conditions, though still potentially warmer at the 10th percentile lake 30 level releases. Future river flow temperatures are expected to remain within the 31 preferred temperature range for larval chironomids, simuliids, and Gammarus in most 32 years. None of the action alternatives are expected to result in substantial 33 temperature-related impacts to the aquatic foodbase below Glen Canyon Dam, despite 34 the potential differences indicated above. 35
Amphibians. Because leopard frogs preferentially select warmer water for breeding, 36 occasional introduction of warmer water would presumably benefit the frogs. Lake 37 Powell releases and temperatures at Lees Ferry at the 50th percentile reservoir 38 elevations may be almost always colder than 15 °C for all of the alternatives, so there 39 would be no temperature impact to leopard frogs at the 50th percentile Lake Powell 40 elevation releases. The Water Supply Alternative may result in temperatures above 41 15 °C starting in May at the 10th percentile Lake Powell elevations, which would 42 provide a thermal benefit from less thermal shock to eggs and larvae. Modeling 43 indicates this may occur at Glen Canyon Dam and at Lees Ferry. Lake Powell 10th 44

Environmental Consequences Chapter 4
February 2007 4-186 Draft EIS – Colorado River Interim Guidelines for
Lower Basin Shortages and Coordinated Operations for Lake Powell and Lake Mead
percentile release temperatures for the Conservation Before Shortage, Basin States 1 and Reservoir Storage alternatives do not exhibit significant increases in temperature 2 and would result in similar conditions as the No Action Alternative. Following 3 Atkinson (1996), it is possible that the warmer water would increase the rate of 4 metamorphosis but result in a smaller size class of metamorphs. 5
Action alternative flows may inundate the Lees Ferry leopard frog habitat from June 6 through September at 90th percentile releases from Glen Canyon Dam. During the 7 interim period, these high releases may differ from the No Action Alternative. There 8 are no differences from the No Action Alternative beyond the interim period at these 9 higher end releases. When above 21,000 cfs, occasional June spill avoidance releases 10 under the Reservoir Storage Alternative may exceed the releases that occur under the 11 No Action Alternative by up to 6,000 cfs. Though these higher flows would 12 presumably have a greater impact on the Lees Ferry leopard frog habitat, they occur 13 in years where the No Action Alternative may also exceed 21,000 cfs, so the 14 inundation impacts would be similar, though the habitat may be under deeper water 15 than the No Action Alternative. The Conservation Before Shortage, Basin States and 16 Water Supply alternatives may have lower 90th percentile flows in July and 17 September, but still above 21,000 cfs, so the inundation impacts would be similar to 18 that under the No Action Alternative, though the habitat may be under shallower 19 water. 20
Birds. Bald eagles may be indirectly impacted by alterations to the trout fishery. At 21 the 10th percentile, the greatest potential temperature impact to the trout fishery would 22 occur under the Water Supply Alternative. However, these potential temperature 23 effects are mitigated by trout’s ability to move to thermal refugia at different water 24 levels in the Colorado River and because warmer temperatures will occur in some 25 years. Accordingly, despite these potential occasional changes in temperature, 26 population-level impacts to the Lees Ferry trout fishery are not anticipated as a result 27 of the proposed federal action. As noted before, warmer river flow temperatures may 28 affect trout in some years and may benefit warmwater fish which could provide an 29 alternative food source for eagles. The levels of potential flow impacts to vegetation 30 communities anticipated under some alternatives are not likely to cause significant 31 impact to bald eagles. Given bald eagle’s mobility, varied diet, lack of impacts to 32 roost or nest sites, none of the action alternatives would substantially impact bald 33 eagles that inhabit areas downstream of Glen Canyon Dam. 34
Though higher flows, particularly with the Reservoir Storage Alternative in June, 35 may flood riparian habitats, these would not be expected to impact southwestern 36 willow flycatcher populations. Nests are typically above the 45,000 cfs stage. 37 Reclamation concluded that long-term effects of the 42,000 to 45,000 cfs test flow in 38 2002 on Southwestern willow flycatcher habitat are expected to be beneficial 39 (Reclamation 2002). Tamarisk are expected to withstand potential increased flows 40 that may occur under Reservoir Storage peaks in June. The Conservation Before 41 Shortage, Basin States and Water Supply alternatives are higher than the No Action 42 Alternative by up to a few thousand cfs in some months, though these higher flows 43 would not inundate southwestern willow flycatcher nests. When the action 44

Environmental Consequences Chapter 4
Draft EIS – Colorado River Interim Guidelines for Lower Basin Shortages and Coordinated Operations for Lake Powell and Lake Mead
4-187 February 2007
alternatives (all at least in some months) are lower than the No Action Alternative 1 (typically at 10th percentile), these levels would not be expected to kill tamarisk, 2 which is what southwestern willow flycatcher typically nest in below Glen Canyon 3 Dam. 4
The Conservation Before Shortage, Basin States and Water Supply alternatives would 5 have lower 10th percentile releases from April through September and the Reservoir 6 Storage Alternative would have lower 10th percentile releases from June through 7 September. These lower releases may reduce moist soil conditions below nesting 8 sites, which is a preference of southwestern willow flycatcher. Lack of moist soil 9 below nest sites may degrade the habitat for this species, at least temporarily. A lack 10 of moist soil conditions is more likely for all of the action alternatives than for the No 11 Action Alternative at the 10th percentile releases. At the 50th percentile release, the 12 action alternatives would be at or above the No Action Alternative during the 13 southwest willow flycatcher nesting season. So potential impacts to southwest willow 14 flycatcher are only expected at lower releases. 15
Table 4.8-4 displays impacts to special status species in the Glen Canyon Dam to 16 Lake Mead reach for all alternatives. 17
18 Table 4.8-4
Glen Canyon Dam to Lake Mead Special Status Species Impact Summary Comparison of Action Alternatives to No Action Alternative
Species Alternative Impact Rationale
Mammals All Action Alternatives No impact Flow differences not expected to rise to the level of indirectly impacting special
status mammals. Conservation Before Shortage, Basin States, Water Supply
No impact Similar 90th percentile releases to the No Action Alternative.
Grand canyon evening primrose
Reservoir Storage Minor-negative
Higher 90th percentile releases than the No Action Alternative may affect beach habitat more than the No Action Alternative. Interim period only. High flows still less than experimental releases.
Kanab ambersnail
All Action Alternatives
Minor-negative
90th percentile releases exceed the No Action Alternative and 17,000 cfs. Interim period only. High flows still less than past high flows from which Kanab ambersnail has recovered from.
Reservoir Storage Minor-negative
90th percentile releases exceed the No Action Alternative and 20,000 cfs. Interim period only. High flows still less than past high flows. Niobrarra
ambersnail Conservation Before Shortage, Basin States and Water Supply
Minor-positive
When above 20,000 cfs at the 90th percentile release, the alternatives are equal or less than the No Action Alternative.
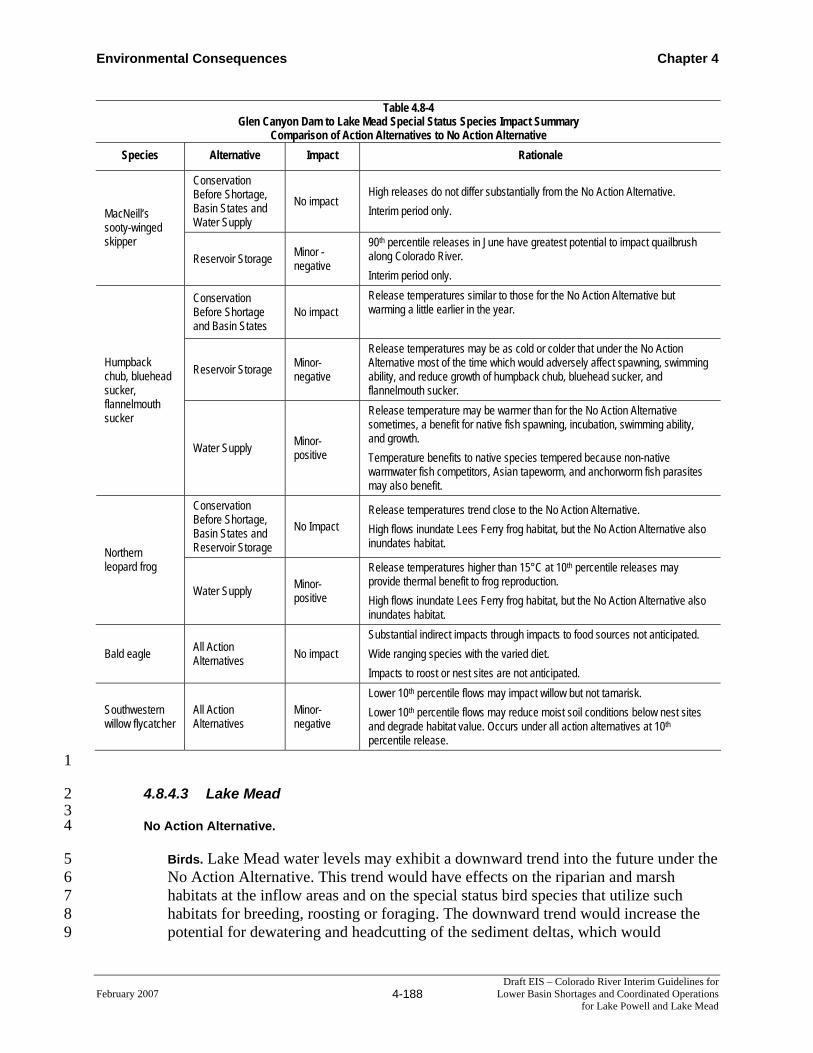
Environmental Consequences Chapter 4
February 2007 4-188 Draft EIS – Colorado River Interim Guidelines for
Lower Basin Shortages and Coordinated Operations for Lake Powell and Lake Mead
Table 4.8-4 Glen Canyon Dam to Lake Mead Special Status Species Impact Summary
Comparison of Action Alternatives to No Action Alternative Species Alternative Impact Rationale
Conservation Before Shortage, Basin States and Water Supply
No impact High releases do not differ substantially from the No Action Alternative. Interim period only. MacNeill’s
sooty-winged skipper
Reservoir Storage Minor - negative
90th percentile releases in June have greatest potential to impact quailbrush along Colorado River. Interim period only.
Conservation Before Shortage and Basin States
No impact Release temperatures similar to those for the No Action Alternative but warming a little earlier in the year.
Reservoir Storage Minor-negative
Release temperatures may be as cold or colder that under the No Action Alternative most of the time which would adversely affect spawning, swimming ability, and reduce growth of humpback chub, bluehead sucker, and flannelmouth sucker.
Humpback chub, bluehead sucker, flannelmouth sucker
Water Supply Minor-positive
Release temperature may be warmer than for the No Action Alternative sometimes, a benefit for native fish spawning, incubation, swimming ability, and growth. Temperature benefits to native species tempered because non-native warmwater fish competitors, Asian tapeworm, and anchorworm fish parasites may also benefit.
Conservation Before Shortage, Basin States and Reservoir Storage
No Impact Release temperatures trend close to the No Action Alternative. High flows inundate Lees Ferry frog habitat, but the No Action Alternative also inundates habitat.
Northern leopard frog
Water Supply Minor-positive
Release temperatures higher than 15°C at 10th percentile releases may provide thermal benefit to frog reproduction. High flows inundate Lees Ferry frog habitat, but the No Action Alternative also inundates habitat.
Bald eagle All Action Alternatives No impact
Substantial indirect impacts through impacts to food sources not anticipated. Wide ranging species with the varied diet. Impacts to roost or nest sites are not anticipated.
Southwestern willow flycatcher
All Action Alternatives
Minor-negative
Lower 10th percentile flows may impact willow but not tamarisk. Lower 10th percentile flows may reduce moist soil conditions below nest sites and degrade habitat value. Occurs under all action alternatives at 10th percentile release.
1
4.8.4.3 Lake Mead 2 3
No Action Alternative. 4
Birds. Lake Mead water levels may exhibit a downward trend into the future under the 5 No Action Alternative. This trend would have effects on the riparian and marsh 6 habitats at the inflow areas and on the special status bird species that utilize such 7 habitats for breeding, roosting or foraging. The downward trend would increase the 8 potential for dewatering and headcutting of the sediment deltas, which would 9

Environmental Consequences Chapter 4
Draft EIS – Colorado River Interim Guidelines for Lower Basin Shortages and Coordinated Operations for Lake Powell and Lake Mead
4-189 February 2007
adversely affect riparian and marsh vegetation that has developed on the deltas. This 1 has the greatest potential to adversely affect special status birds that utilize 2 cottonwood-willow and marsh habitats such as the bald eagle, southwestern willow 3 flycatcher, yellow-billed cuckoo, long-eared owl, American kestrel, osprey, Cooper’s 4 hawk, American peregrine falcon, northern harrier, Clark’s grebe, snowy egret, Yuma 5 clapper rail, California black rail, American bittern, western least bittern, great egret, 6 white-faced ibis, belted kingfisher and American white pelican. 7
Mammals. Townsend’s big-eared bat, pale Townsend’s big-eared bat, occult little 8 brown bat, spotted bat, Allen’s big-eared bat, western red bat, Yuma myotis, western 9 yellow bat, cave myotis, greater western mastiff bat, and small-footed myotis may 10 utilize the riparian and marsh habitats at Lake Mead for foraging and roosting. These 11 bat species utilize a variety of habitats for roosting, including dead trees, so potential 12 vegetation effects should not substantially impact roosting opportunities for these 13 bats. Substantial effects to insect food sources for special status bats is not expected 14 because the Lake Mead water levels will continue to experience annual fluctuations 15 and the downward trend will be gradual over time. The No Action Alternative 16 conditions at Lake Mead would not impact the Yuma hispid cotton rat or Colorado 17 River cotton rat as these species are found further south along the lower Colorado 18 River. 19
Amphibians. Relict leopard frog populations at Lake Mead would not be affected 20 under the No Action Alternative because the known populations are at springs above 21 the influence of Lake Mead’s fluctuation. Colorado River toads are not known at 22 Lake Mead. The No Action Alternative conditions are not expected to affect special 23 status amphibians at Lake Mead. 24
Plants. Sticky buckwheat, Geyer’s milkvetch and Las Vegas bear poppy all occur at 25 the shorelines of Lake Mead. These species typically benefit from lower reservoir 26 levels that expose additional shoreline habitat. Lake Mead would continue to 27 experience lake level fluctuation under the No Action Alternative, which would result 28 in varied levels of exposed shoreline through the year. The general downward lake 29 level trend of Lake Mead that may occur under the No Action Alternative would 30 generally result in increased shoreline exposure which would benefit these species 31 while this trend continues. 32
Invertebrates. MacNeill’s sooty-winged skipper is not known at Lake Mead and would 33 thus not be affected by future conditions under the No Action Alternative. 34
Fish. Under the No Action Alternative, special status fish would experience Lake 35 Mead elevations less than 1,120 feet msl all year for the 50th and 10th percentile 36 conditions. The 90th percentile elevations are generally projected to be near or above 37 1,200 feet msl all year. Modeled Lake Mead elevations for end of March, July and 38 September are provided in Figures P-10 through P-12 in Appendix P. Razorback 39 sucker spawning is known to occur between elevations 1,120 feet msl and 1,150 feet 40 msl, and as elevations have dropped within this range and exposed areas used for 41 spawning in earlier years, the fish have moved their spawning to nearby suitable areas 42

Environmental Consequences Chapter 4
February 2007 4-190 Draft EIS – Colorado River Interim Guidelines for
Lower Basin Shortages and Coordinated Operations for Lake Powell and Lake Mead
(Albrecht and Holden 2006). Based on the modeled reservoir elevations under the No 1 Action Alternative, the preferred spawning sites would be out of the water over 50 2 percent of the time. Razorback sucker would have to move to suitable spawning 3 habitat at lower reservoir elevations, where such habitat is available. 4
Action Alternatives. Lake Mead elevations will deviate from the No Action Alternative 5 conditions during the interim period and the modeling period. 6
Birds. No impacts to riparian or marsh habitats were anticipated at Lake Mead for the 7 Conservation Before Shortage or Basin States alternatives because the Lake Mead 8 elevations under these action alternatives trend close to the No Action Alternative. 9 Therefore, the action alternatives would not impact special status bird species at Lake 10 Mead. 11
The Water Supply Alternative would result in a minor negative impact to 12 cottonwood-willow, tamarisk and marsh vegetation at Lake Mead inflow areas and 13 sediment deltas. These negative impacts would be caused by lower reservoir 14 elevations, increased dewatering of the sediment deltas and delta erosion. However, 15 depending on duration of the lower elevations, the impact may be offset by new 16 vegetation growing on the newly exposed sediments. These vegetation impacts would 17 cause minor negative impact to those special status bird species that forage, breed or 18 roost in cottonwood-willow, tamarisk and marsh habitats. Impacted species include: 19 southwestern willow flycatcher, Clark’s grebe, snowy egret, Yuma clapper rail, 20 yellow-billed cuckoo, California black rail, American bittern, western least bittern, 21 great egret, white faced ibis, long-eared owl, American kestrel, osprey, northern 22 harrier, Cooper’s hawk, bald eagle, belted kingfisher, American peregrine falcon, and 23 American white pelican. 24
The Reservoir Storage Alternative would result in a minor positive impact to 25 vegetation at Lake Mead, primarily at the inflow areas and sediment deltas. These 26 positive impacts would be caused by higher reservoir elevations than under the No 27 Action Alternative, and thus less potential dewatering or sediment delta headcutting 28 than under the No Action Alternative. Positive impacts are anticipated for the 29 southwestern willow flycatcher, Clark’s grebe, snowy egret, Yuma clapper rail, 30 yellow-billed cuckoo, California black rail, American bittern, western least bittern, 31 great egret, white faced ibis, long-eared owl, American kestrel, osprey, northern 32 harrier, Cooper’s hawk, bald eagle, belted kingfisher, American peregrine falcon, and 33 American white pelican. 34
Mammals. Impacts to special status mammals at Lake Mead are not expected to occur 35 for the same reasons provided under the No Action Alternative discussion. 36
Amphibians. Impacts to special status amphibians at Lake Mead are not expected for 37 the reasons described under the No Action Alternative. 38

Environmental Consequences Chapter 4
Draft EIS – Colorado River Interim Guidelines for Lower Basin Shortages and Coordinated Operations for Lake Powell and Lake Mead
4-191 February 2007
Plants. Sticky buckwheat, Geyer’s milkvetch and Las Vegas bear poppy all occur at 1 the shorelines of Lake Mead. These species typically benefit from lower reservoir 2 elevations that expose additional shoreline habitat. The Conservation Before Shortage 3 and Basin States alternatives would not impact these species since reservoir 4 elevations trend close to the elevations under the No Action Alternative. The Water 5 Supply Alternative would provide a minor beneficial impact to these species through 6 lowered elevations. The Reservoir Storage Alternative would cause a minor negative 7 impact to these species through raised elevations and inundation of shoreline habitats. 8
Invertebrates. MacNeill’s sooty winged skipper is not known at Lake Mead, and 9 would thus not be impacted by any action alternative. 10
Fish. Under the Basin States and Conservation Before Shortage alternatives, reservoir 11 elevations may vary from 16 feet above to 12 feet below 50th percentile levels under 12 the No Action Alternative (Figures P-10, P-11, P-12 in Appendix P). The maximum 13 elevation may be 1,128 feet msl with most elevations below 1,100 feet msl. These 14 two alternatives could have minor positive impacts in years when the reservoir 15 elevation is above 1,120 feet msl and no impacts to minor negative impacts when 16 elevations are below that of the No Action Alternative. The Water Supply Alternative 17 would have 50th percentile reservoir elevations near or below those under the No 18 Action Alternative, and a minor negative impact compared to the No Action 19 Alternative. The Reservoir Storage Alternative, however, would have 50th percentile 20 elevations above those under the No Action Alternative with many occurrences of 21 elevations above 1,125 feet msl and the maximum at elevation 1,139 feet msl. Thus, 22 the Reservoir Storage Alternative would maintain reservoir elevations within the 23 range currently used by razorback suckers for spawning more than 50 percent of the 24 time, a moderate positive impact. At the 10th percentile reservoir elevations, all action 25 alternatives would have elevations near or above those under the No Action 26 Alternative but none would be near the current elevations used for razorback 27 spawning. Impacts could range from no effect to a minor positive impact but overall 28 would likely be no impact. 29
Lowered reservoir elevations are known to allow vegetation to grow on the exposed 30 lake bed, and these areas are then inundated at higher reservoir elevations. These 31 submerged vegetated areas can provide cover for juvenile razorback suckers and 32 enhance their survival. Thus, periodic lower reservoir elevations may have some 33 benefits (minor positive impact) to razorback sucker spawning success and 34 recruitment after the reservoir elevations rise and inundate the vegetation growing on 35 the edge. 36
Lowered reservoir elevations under the No Action Alternative and all of the action 37 alternatives would extend the riverine habitat where the Colorado River and the 38 Virgin River enter the reservoir. This would increase habitat for the humpback chub, 39 razorback sucker, flannelmouth sucker, and bluehead sucker that could move 40 downstream and for the woundfin and the Virgin River chub in the Virgin River. 41 Under 50th percentile elevations, the Water Supply Alternative would provide the 42 greatest benefit to those species while the Reservoir Storage Alternative would 43

Environmental Consequences Chapter 4
February 2007 4-192 Draft EIS – Colorado River Interim Guidelines for
Lower Basin Shortages and Coordinated Operations for Lake Powell and Lake Mead
provide the least benefit. Both alternatives would provide minor positive impacts for 1 these species. The other two action alternatives would provide little benefit 2 (essentially no impact) relative to the No Action Alternative. At the 90th percentile 3 elevations, none of the action alternatives differ substantially from the No Action 4 Alternative, i.e., no impact, while under 10th percentile elevations, all but the 5 Reservoir Storage Alternative are similar to the No Action Alternative resulting in no 6 impact. The Reservoir Storage Alternative would provide the least riverine habitat 7 increase, a minor negative impact. The Virgin River chub and bonytail are not known 8 to be present in Lake Mead. 9
Table 4.8-5 describes potential special status species impacts of the action alternatives 10 at Lake Mead. 11
Table 4.8-5 Lake Mead Special Status Species Impact Summary
Comparison of Action Alternatives to No Action Alternative Species Alternative Impact Rationale
Conservation Before Shortage, Basin States
No impact Reservoir elevations trend close to the No Action Alternative.
Reservoir Storage Minor-positive Reservoir elevations trend higher than the No Action Alternative. Birds
Water Supply Minor-negative Reservoir elevations trend lower than the No Action Alternative.
Mammals All Action Alternatives No Impact Substantial impacts to insect food sources for bats not anticipated.
Relict leopard frog All Action Alternatives No impact Overton arm population is located at a spring above Lake Mead’s
influence. MacNeill’s sooty- winged skipper
All Action Alternatives No impact Species not known at Lake Mead.
Conservation Before Shortage and Basin States
No impact Reservoir elevations trend close to the No Action Alternative.
Reservoir Storage Minor-negative
Reservoir elevations trend higher than the No Action Alternative, inundating shoreline habitat. Habitats below full pool elevation considered temporary due to reservoir fluctuation.
Sticky buckwheat, Geyer’s milkvetch and Las Vegas bearpoppy
Water Supply Minor-positive
Reservoir elevations trend lower than the No Action Alternative, exposing additional shoreline habitat. Habitats below full-pool elevation considered temporary due to reservoir elevation fluctuation.
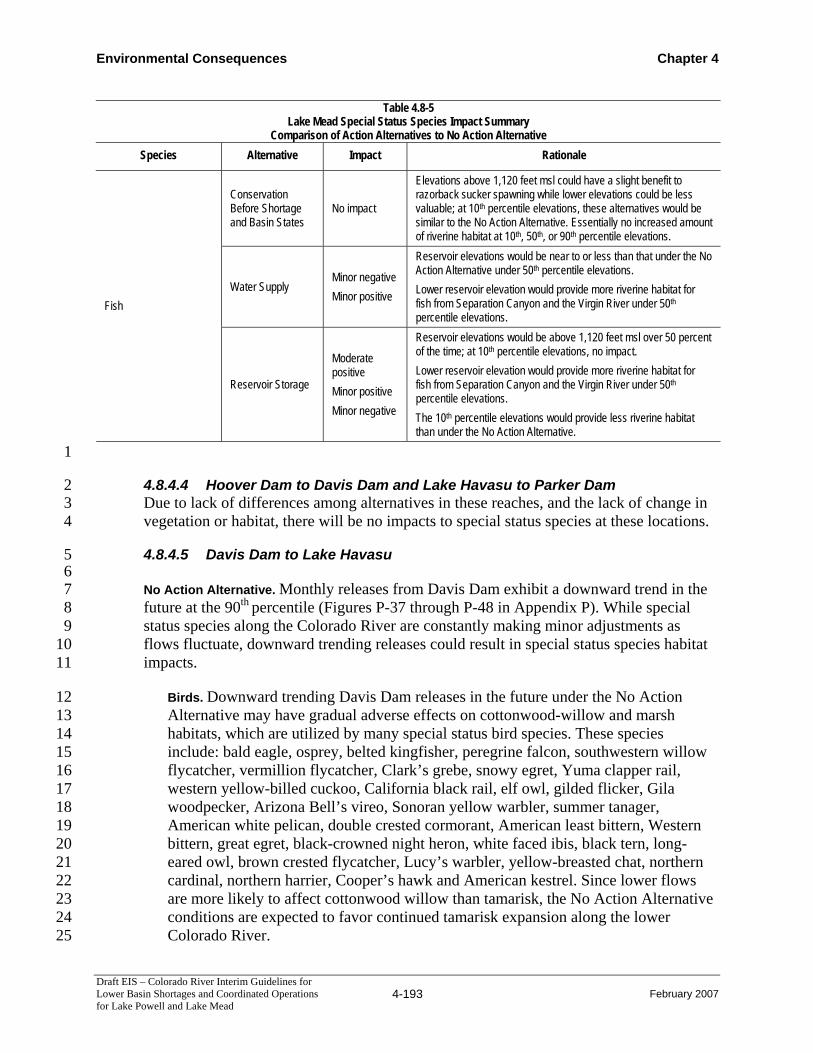
Environmental Consequences Chapter 4
Draft EIS – Colorado River Interim Guidelines for Lower Basin Shortages and Coordinated Operations for Lake Powell and Lake Mead
4-193 February 2007
Table 4.8-5 Lake Mead Special Status Species Impact Summary
Comparison of Action Alternatives to No Action Alternative Species Alternative Impact Rationale
Conservation Before Shortage and Basin States
No impact
Elevations above 1,120 feet msl could have a slight benefit to razorback sucker spawning while lower elevations could be less valuable; at 10th percentile elevations, these alternatives would be similar to the No Action Alternative. Essentially no increased amount of riverine habitat at 10th, 50th, or 90th percentile elevations.
Water Supply Minor negative Minor positive
Reservoir elevations would be near to or less than that under the No Action Alternative under 50th percentile elevations. Lower reservoir elevation would provide more riverine habitat for fish from Separation Canyon and the Virgin River under 50th percentile elevations.
Fish
Reservoir Storage
Moderate positive Minor positive Minor negative
Reservoir elevations would be above 1,120 feet msl over 50 percent of the time; at 10th percentile elevations, no impact. Lower reservoir elevation would provide more riverine habitat for fish from Separation Canyon and the Virgin River under 50th percentile elevations. The 10th percentile elevations would provide less riverine habitat than under the No Action Alternative.
1
4.8.4.4 Hoover Dam to Davis Dam and Lake Havasu to Parker Dam 2 Due to lack of differences among alternatives in these reaches, and the lack of change in 3 vegetation or habitat, there will be no impacts to special status species at these locations. 4
4.8.4.5 Davis Dam to Lake Havasu 5 6
No Action Alternative. Monthly releases from Davis Dam exhibit a downward trend in the 7 future at the 90th percentile (Figures P-37 through P-48 in Appendix P). While special 8 status species along the Colorado River are constantly making minor adjustments as 9 flows fluctuate, downward trending releases could result in special status species habitat 10 impacts. 11
Birds. Downward trending Davis Dam releases in the future under the No Action 12 Alternative may have gradual adverse effects on cottonwood-willow and marsh 13 habitats, which are utilized by many special status bird species. These species 14 include: bald eagle, osprey, belted kingfisher, peregrine falcon, southwestern willow 15 flycatcher, vermillion flycatcher, Clark’s grebe, snowy egret, Yuma clapper rail, 16 western yellow-billed cuckoo, California black rail, elf owl, gilded flicker, Gila 17 woodpecker, Arizona Bell’s vireo, Sonoran yellow warbler, summer tanager, 18 American white pelican, double crested cormorant, American least bittern, Western 19 bittern, great egret, black-crowned night heron, white faced ibis, black tern, long-20 eared owl, brown crested flycatcher, Lucy’s warbler, yellow-breasted chat, northern 21 cardinal, northern harrier, Cooper’s hawk and American kestrel. Since lower flows 22 are more likely to affect cottonwood willow than tamarisk, the No Action Alternative 23 conditions are expected to favor continued tamarisk expansion along the lower 24 Colorado River. 25

Environmental Consequences Chapter 4
February 2007 4-194 Draft EIS – Colorado River Interim Guidelines for
Lower Basin Shortages and Coordinated Operations for Lake Powell and Lake Mead
Mammals. Townsend’s big-eared bat, Pale Townsend’s big-eared bat, spotted bat, 1 Allen’s big-eared bat, Western red bat, occult little brown bat, Yuma myotis, Western 2 Yellow bat, cave myotis, greater western mastiff bat and small-footed myotis utilize 3 riparian and marsh habitats in this reach for foraging and roosting. Downward 4 trending Davis Dam releases under No Action Alternative conditions are expected to 5 be gradual, though they may affect the composition of riparian habitats. Such gradual 6 changes are not expected to substantially affect insect food sources for special status 7 bats. Since these bats typically utilize a variety of roost sites, including live and dead 8 trees, substantial impacts to these species roost sites are not anticipated under the No 9 Action Alternative. 10
The Yuma hispid cotton rat and Colorado River cotton rat are only known from 11 Yuma south. The No Action Alternative will not affect these species in this reach. 12
Amphibians. Relict leopard frogs are known below Hoover Dam at several springs to 13 the north of this reach and are above the influence of the Colorado River. The 14 Lowland Leopard frog is known along the Bill Williams River, but not in this reach. 15 Though potential Colorado River toad occurs in this reach, the species is not known 16 here. The No Action Alternative will have no effects on special status amphibians in 17 this reach. 18
Invertebrates. MacNeill’s sooty-winged skipper is known at scattered sites along the 19 lower Colorado River and is associated with quailbrush (Atriplex) and mesquite 20 communities. The Atriplex land cover type is present in this reach (Table 3.8-2). 21 However, quailbrush typically grows on alluvial floodplains and flow-related impacts 22 from the No Action Alternative are not anticipated to affect alluvial floodplains. 23 Downward trending releases may result in groundwater table impacts in the future. 24 However, because the declines will likely be gradual and that mesquite and 25 quailbrush are not obligate phreatophytes, groundwater-related effects under No 26 Action Alternative conditions are not anticipated. The No Action Alternative should 27 not affect MacNeill’s sooty-winged skipper in this reach. 28
Fish. In the Colorado River between Davis Dam and Lake Havasu, some backwaters 29 are present that could be used by razorback suckers, bonytail, and flannelmouth 30 suckers, the only special status fish species present. Reduced flows in the future in 31 this reach may result in more frequent dewatering of backwaters, resulting in a 32 reduction of habitat for these special status fish species. Backwaters may become 33 vegetated with marsh plants under reduced flow conditions. Non-native fish would 34 continue to be present in this reach and compete with native fish. 35
Action Alternatives. The Conservation Before Shortage and Basin States alternatives 36 would not impact any special status species in this reach because Davis Dam monthly 37 releases trend close to the No Action Alternative. These two action alternatives are not 38 discussed further for this reach. Flow deviations from the No Action Alternative under 39 the Water Supply Alternative and Reservoir Storage alternatives generally return to No 40 Action conditions at the end of the interim period, though the vegetation and associated 41

Environmental Consequences Chapter 4
Draft EIS – Colorado River Interim Guidelines for Lower Basin Shortages and Coordinated Operations for Lake Powell and Lake Mead
4-195 February 2007
special status species effects of interim period conditions may be observed beyond the 1 interim period. 2
Birds. The Reservoir Storage and Water Supply alternatives may result in lower and 3 higher monthly releases respectively. Respective impacts to special status birds would 4 be similar to impacts discussed at Lake Mead. However, a higher number of species 5 may be impacted since this reach includes California special status birds not 6 considered at Lake Mead. The Reservoir Storage Alternative would have a minor 7 negative impact on the following special status birds through flow-related negative 8 impacts to their habitats: bald eagle, osprey, belted kingfisher, peregrine falcon, 9 southwestern willow flycatcher, vermillion flycatcher, Clark’s grebe, snowy egret, 10 Yuma clapper rail, western yellow-billed cuckoo, California black rail, elf owl, gilded 11 flicker, Gila woodpecker, Arizona Bell’s vireo, Sonoran yellow warbler, summer 12 tanager, American white pelican, double crested cormorant, American least bittern, 13 Western bittern, great egret, black-crowned night heron, white faced ibis, black tern, 14 long-eared owl, brown crested flycatcher, Lucy’s yellow warbler, yellow-breasted 15 chat, northern cardinal, northern harrier, Cooper’s hawk and American kestrel. The 16 Water Supply Alternative is expected to have a minor positive impact on these same 17 species. The groundwater changes anticipated for this reach may be on the order of 18 0.5 feet or less (Section 4.3), which contributes to these impacts being minor. 19
Mammals. Though there may be higher and lower Davis Dam releases under the Water 20 Supply and Reservoir Storage alternatives, respectively, these differences are not 21 expected to substantially impact foraging or roosting conditions for special status 22 bats. Impacts from the action alternatives on special status mammals are expected to 23 be similar to the conditions expected under the No Action Alternative. 24
Yuma hispid cotton rat and Colorado River cotton rat are only known along the 25 Colorado River from Yuma south. Therefore, this proposed federal action would not 26 impact these species in this reach. 27
Amphibians. There will be no impacts from the Water Supply and Reservoir Storage 28 alternatives to the Colorado River Toad, relict leopard frog or lowland leopard frog in 29 this reach for the same reasons as described for the No Action Alternative. 30
Invertebrates. There will be no impacts from the Water Supply and Reservoir Storage 31 alternatives to MacNeill’s sooty-winged skipper in this reach for the same reasons as 32 described for the No Action Alternative. 33
Fish. The Reservoir Storage alternative may result in slightly less flow while the 34 Water Supply alternative may result in slightly more flow than under the No Action 35 Alternative in most months of the year under 50th and 10th percentile elevations. 36 Reductions in Colorado River flow below Davis Dam could affect the flannelmouth 37 sucker through loss of spawning habitat in the riverine sections and rearing habitat in 38 backwaters. This would be a minor negative impact for this species. Reduced flows 39 could also have a minor negative impact on razorback sucker and bonytail through 40 loss of rearing habitat. The slightly higher flows under the Water Supply Alternative 41

Environmental Consequences Chapter 4
February 2007 4-196 Draft EIS – Colorado River Interim Guidelines for
Lower Basin Shortages and Coordinated Operations for Lake Powell and Lake Mead
could have a minor positive impact on all three species. Under the 90th percentile, 1 higher releases in the winter for the Reservoir Storage Alternative could have 2 potential benefits or detriments to backwater habitats depending on the amount of 3 sediment scour or deposition. Overall, however, no impact would be expected from 4 higher winter releases. 5
Table 4.8-6 provides a summary of potential impacts that may occur under the action 6 alternatives to special status species in the Davis Dam to Lake Havasu reach. 7
Table 4.8-6 Davis Dam to Lake Havasu Special Status Species Impact Summary
Comparison of Action Alternatives to No Action Alternative Location Alternative Impact Rationale
Conservation Before Shortage and Basin States
No Impact Monthly releases closely follow the No Action Alternative.
Water Supply Minor-positive Monthly releases higher than the No Action Alternative at 10th and 50th percentiles.
Birds
Reservoir Storage Minor-negative Monthly releases lower than the No Action Alternative at 10th and 50th percentiles.
Mammals All Action Alternatives No impact
Conservation Before Shortage and Basin States alternatives monthly releases trend close to the No Action Alternative. Reservoir Storage and Water Supply alternatives differences are not substantial enough to cause indirect impacts to special status mammals.
Amphibians All Action Alternatives No Impact Species not known in this reach.
Invertebrates All Action Alternatives No impact Action alternatives not expected to adversely impact quailbrush or mesquite communities on alluvial floodplains.
Conservation Before Shortage and Basin States
No impact Davis Dam releases trend close to the No Action Alternative.
Water Supply Minor- positive Increased releases at 10th and 50th percentile elevations could benefit razorback sucker, bonytail, and flannelmouth sucker.
Fish
Reservoir Storage Minor- negative
Decreased releases at 10th and 50th percentile elevations could result in habitat reduction for razorback sucker, bonytail, and flannelmouth sucker.
8
4.8.4.6 Parker Dam to NIB 9 10
No Action Alternative. Monthly flows from Parker Dam to Imperial Dam exhibit a level to 11 slightly downward trend in the future mostly because of a reduction in magnitude of 90th 12 percentile flows in some months (Figures P-49 through P-60 in Appendix P). While 13 special status species along the Colorado River are constantly adjusting as flows 14 fluctuate, the slight downward trend in the future could adversely affect cottonwood and 15 marsh communities and the special status species that rely on such habitats. Under the No 16 Action Alternative, shortage conditions would occur without specific operating criteria. 17 The gradual nature of this slight downward trend is such that terrestrial special status 18 species and habitat conditions would not change abruptly or substantially. The No Action 19 Alternative will not affect the Colorado River below Imperial Dam because flows 20 between Imperial Dam and the NIB consist primarily of leakage from Imperial Dam and 21

Environmental Consequences Chapter 4
Draft EIS – Colorado River Interim Guidelines for Lower Basin Shortages and Coordinated Operations for Lake Powell and Lake Mead
4-197 February 2007
return flows from water diverted at Imperial Dam. Accordingly there will be no effects 1 from the proposed federal action on special status species below Imperial Dam. The 2 following discussion applies only to the Colorado River reach between Parker Dam and 3 Imperial Dam. 4
Birds. The gradual and slight downward trend of flows in this reach in the future may 5 adversely affect cottonwood-willow and marsh habitats and thus the special status 6 birds that utilize such habitats. These species include: bald eagle, osprey, belted 7 kingfisher, peregrine falcon, southwestern willow flycatcher, vermillion flycatcher, 8 Clark’s grebe, snowy egret, Yuma clapper rail, western yellow-billed cuckoo, 9 California black rail, elf owl, gilded flicker, Gila woodpecker, Arizona Bell’s vireo, 10 Sonoran yellow warbler, summer tanager, American white pelican, double crested 11 cormorant, American bittern, Western least bittern, great egret, black-crowned night 12 heron, white faced ibis, black tern, long-eared owl, brown crested flycatcher, Lucy’s 13 warbler, yellow-breasted chat, northern cardinal, northern harrier, Cooper’s hawk, 14 and American kestrel. Lower flows would continue to favor expansion of tamarisk 15 along this reach, which tends to reduce the value of the habitats the species invades. 16
Mammals. The gradual and slight downward trend of flows in this reach in the future 17 under the No Action Alternative would have similar effects on special status bats as 18 was described for the No Action Alternative for the Davis Dam to Lake Havasu 19 reach. 20
The Yuma hispid cotton rat and Colorado River cotton rat do occur in this reach and 21 they inhabit moist grassy areas along the lower Colorado River, including wetlands 22 (Arizona Game and Fish 2004) from Yuma and downstream. The downward trend of 23 releases from Parker Dam under the No Action Alternative may have minor effects 24 on the moist riparian habitats these two species prefer. However, since these species 25 also utilize agricultural fields and the downward release trend is gradual and small, 26 effects under the No Action Alternative on these two rat species is expected to be 27 minor. 28
Amphibians. Special status amphibians do not occur in this reach, thus no effects from 29 the No Action Alternative are anticipated. 30
Invertebrates. MacNeill’s sooty-winged skipper may occur in the quailbrush and 31 mesquite communities that are present in this reach. However, the No Action 32 Alternative is not expected to affect alluvial floodplains or otherwise impact these 33 vegetation communities through groundwater effects. The No Action Alternative will 34 not affect MacNeill’s sooty-winged skipper in this reach. 35
Fish. The only listed fish species present in the Colorado River or in-stream reservoirs 36 from Parker Dam to the NIB are the razorback sucker and bonytail chub. The effects 37 of the No Action Alternative on these fish below Parker Dam would be similar to 38 effects below Davis Dam. 39

Environmental Consequences Chapter 4
February 2007 4-198 Draft EIS – Colorado River Interim Guidelines for
Lower Basin Shortages and Coordinated Operations for Lake Powell and Lake Mead
Action Alternatives. Between Parker Dam and the NIB, the Water Supply Alternative 1 flows from Parker Dam to Imperial Dam are similar to the No Action Alternative flows. 2 Therefore, the Water Supply Alternative would have no impacts to special status species 3 and is not discussed further for this reach. Flow deviations from No Action Alternative 4 under the remaining action alternatives generally return to No Action Alternative 5 conditions at the end of the interim period, though the vegetation and associated special 6 status species effects of interim period conditions may be observed beyond the interim 7 period. 8
Birds. Between Parker Dam and Imperial Dam, flows of the Conservation Before 9 Shortage, Basin States, and Reservoir Storage alternatives would be lower than under 10 the No Action Alternative at the 10th and 50th percentiles. The Reservoir Storage 11 Alternative results in the greatest reduction from the No Action Alternative, while the 12 Basin States Alternative results in the least reduction. These lower releases would 13 have a minor negative impact on cottonwood-willow and marsh habitats and thus a 14 correspondingly minor negative impact to special status birds that rely on those 15 habitats. Impacted species include the following: bald eagle, osprey, belted 16 kingfisher, peregrine falcon, southwestern willow flycatcher, vermillion flycatcher, 17 Clark’s grebe, snowy egret, Yuma clapper rail, western yellow-billed cuckoo, 18 California black rail, elf owl, gilded flicker, Gila woodpecker, Arizona Bell’s vireo, 19 Sonoran yellow warbler, summer tanager, American white pelican, double crested 20 cormorant, American bittern, Western least bittern, , great egret, black-crowned night 21 heron, white faced ibis, black tern, long-eared owl, brown crested flycatcher, Lucy’s 22 yellow warbler, yellow-breasted chat, northern cardinal, northern harrier, Cooper’s 23 hawk, and American kestrel. 24
Mammals. The special status bat species would not be impacted in this reach for the 25 same reasons as described for the Davis Dam to Lake Havasu reach. 26
Departures of the action alternatives from the No Action Alternative may be at most 27 0.25 feet stage reduction in the reach from Parker Dam to Imperial Dam. The action 28 alternatives would not alter the historic operational methodology or range of flow 29 volumes in the river channel below Imperial Dam. Therefore, none of the action 30 alternatives would impact the Yuma hispid cotton rat or Colorado River cotton rat, 31 which occur below Imperial Dam. 32
Amphibians. Special status amphibians do not occur in this reach. 33
Invertebrates. MacNeill’s sooty-winged skipper would not be impacted in this reach 34 because alluvial floodplains with quailbrush and mesquite are not expected to be 35 substantially impacted by any alternative. 36
Fish. The Conservation Before Shortage, Basin States and Reservoir Storage 37 alternatives have monthly releases that would be less than those under the No Action 38 at the 10th and 50th percentiles. These lower flows could have impacts on Razorback 39 Sucker and Bonytail chub similar to those described for the Reservoir Storage 40 Alternative in the Davis Dam to Lake Havasu reach. The use of High Levee Pond on 41

Environmental Consequences Chapter 4
Draft EIS – Colorado River Interim Guidelines for Lower Basin Shortages and Coordinated Operations for Lake Powell and Lake Mead
4-199 February 2007
the Cibola NWR for native fishes would not be affected by changes in releases from 1 Parker Dam. 2
Table 4.8-7 summarizes the potential impacts to special status species in the Parker 3 Dam to NIB reach for the action alternatives. 4
Table 4.8-7 Parker Dam to NIB Special Status Species Impact Summary Comparison of Action Alternatives to No Action Alternative
Location Alternative Impact Rationale
Water Supply No Impact Monthly releases closely follow the No Action Alternative. No flow-related impacts anticipated below Imperial Dam.
Birds Conservation Before Shortage, Basin States, Reservoir Storage
Minor-negative
Monthly releases lower than the No Action Alternatives at 10th and 50th percentiles. Small anticipated groundwater level impacts. No flow-related impacts anticipated below Imperial Dam.
Mammals All Action Alternatives No impact
Monthly flows for Water Supply alternative are similar to No Action Alternative. Reservoir Storage, Conservation Before Shortage and Basin States alternatives are not substantially different than No Action Alternative to cause indirect impacts to special status bats. Two cotton rat species occur below Imperial Dam, where flow impacts are not anticipated.
Amphibians All Action Alternatives No Impact Species not known in this reach.
Invertebrates All Action Alternatives No impact Action alternatives not expected to adversely impact quailbrush or mesquite
communities on alluvial floodplains. Water Supply No Impact Monthly flows closely follow the No Action Alternative.
Razorback Sucker and Bonytail chub
Conservation before Shortage, Basin States and Reservoir Storage
Minor-negative
Monthly flows are lower than No Action Alternative at the 10th and 50th percentiles and could result in habitat reduction.
5
4.8.4.7 NIB to SIB 6 7
No Action Alternative. The lack of flows precludes the presence of a significant river 8 fishery in the Colorado River reach between Morelos Diversion Dam and the SIB 9 (Limitrophe Division) and the riparian, marsh habitats, and the special status species that 10 rely on those habitats are adversely affected by this condition. Flows past Morelos 11 Diversion Dam tend to benefit downstream vegetated habitats and associated special 12 status species. The probability of these excess flows occurring in the future under the No 13 Action Alternative is relatively low, typically less than 20 percent. The infrequency of 14 flows under the No Action Alternative would continue to maintain less than ideal 15 conditions for cottonwood-willow and marsh habitats and the species that rely on such 16 habitats. The special status bird and mammal species identified in the Parker Dam to the 17 NIB reach will continue to experience these adverse effects on their habitat below 18

Environmental Consequences Chapter 4
February 2007 4-200 Draft EIS – Colorado River Interim Guidelines for
Lower Basin Shortages and Coordinated Operations for Lake Powell and Lake Mead
Morelos Diversion Dam under the No Action Alternative. The No Action Alternative will 1 not have effects on special status amphibians, plants or fish because none are present in 2 this reach. Infrequent flows in this reach under the No Action Alternative will continue to 3 favor the expansion of tamarisk which may compete with mesquite and quailbrush 4 communities, thus limiting the habitat potential for MacNeill’s sooty-winged skipper in 5 this reach. 6
Action Alternatives. The likelihood of flood control excess flows passing Morelos 7 Diversion Dam under the Basin States and Water Supply alternatives is approximately 8 equal to the No Action Alternative. Therefore these action alternatives would have no 9 impact on special status species in this reach. The Reservoir Storage and Conservation 10 Before Shortage alternatives have a higher likelihood of flood control excess flows 11 passing Morelos Diversion Dam than under the No Action Alternative (Figure P-61 in 12 Appendix P). In addition, due to modeling assumptions under the Reservoir Storage and 13 Conservation Before Shortage alternatives, water is delivered to Mexico through this 14 reach via periodic flows2 of about 40 kafy to 200 kafy (Section 2.4). These pulse flows 15 would occur approximately every other year during the interim period only. The 16 probability of flows past Morelos Diversion Dam under these two action alternatives 17 returns to flows under No Action Alternative conditions after the interim period. These 18 flows would have overall benefits to river flow, riparian and marsh vegetation and special 19 status species that utilize these habitats since substantial flow in this reach is relatively 20 rare. The Reservoir Storage and Conservation Before Shortage alternatives would have a 21 moderate, positive impact on special status species between Morelos Diversion Dam and 22 the SIB. 23
Birds. The species identified as impacted in the Parker Dam to the NIB would be 24 positively impacted by the increased likelihood of flows past Morelos Diversion Dam 25 under the Reservoir Storage and Conservation Before Shortage alternatives. The 26 Basin States and Water Supply alternatives would not impact special status birds 27 since these action alternatives are just as likely as the No Action Alternative to have 28 flows past Morelos Diversion Dam. 29
Amphibians, Plants and Fish. There are no special status amphibians, plants or fish in 30 this reach. 31
Mammals. The increased likelihood of flows past Morelos Diversion Dam under the 32 Reservoir Storage and Conservation Before Shortage alternatives would provide a 33 moderate benefit to riparian and marsh habitats below Morelos Diversion Dam, which 34
2 These flows were modeled as part of the storage and delivery mechanism under the Conservation Before Shortage and Reservoir Storage alternatives. The modeling assumptions were utilized in this Draft EIS in order to analyze the potential impacts to environmental resources of the storage and delivery mechanism, particularly with regard to reservoir elevations and river flow impacts. The use of these modeling assumptions does not represent any determination by Reclamation as to whether, or how, these releases could be made under current administration of the Colorado River.

Environmental Consequences Chapter 4
Draft EIS – Colorado River Interim Guidelines for Lower Basin Shortages and Coordinated Operations for Lake Powell and Lake Mead
4-201 February 2007
would potentially benefit special status bats and the Yuma hispid cotton rat and 1 Colorado River cotton rat in this reach. 2
Invertebrates. The Atriplex land cover type is present in this reach, which may provide 3 habitat for MacNeill’s sooty-winged skipper. Though not specifically known in this 4 reach, the species has been documented in Yuma County, Arizona. The Basin States 5 and Water Supply alternatives are as likely as the No Action Alternative to result in 6 flows past Morelos Diversion Dam. The Reservoir Storage and Conservation Before 7 Shortage alternatives are more likely to have flows past Morelos Diversion Dam. 8 Though an overall benefit to habitat conditions, flows past Morelos Diversion Dam 9 could scour riparian vegetation, potentially including Atriplex, which serves as 10 potential habitat for MacNeill’s sooty-winged skipper. Thus these alternatives would 11 potentially have a minor negative impact on this species, despite overall benefits to 12 the conditions in this reach. 13
Table 4.8-8 summarizes the impacts to special status species in the NIB to the SIB 14 reach for the action alternatives. 15
16 Table 4.8-8
NIB to SIB Special Status Species Impact Summary Comparison of Action Alternatives to No Action Alternatives
Location Alternative Impact Rationale
Basin States and Water Supply No Impact Flows past Morelos Diversion Dam just as likely under the No Action
Alternative.
Birds Reservoir Storage and Conservation Before Shortage
Moderate – positive
Flows past Morelos Diversion Dam more likely than under the No Action Alternative. Flows are rare in this reach, so increased likelihood would benefit the riparian corridor and associated special status species.
Basin States and Water Supply No impact Flows past Morelos Diversion Dam just as likely under the No Action
Alternative.
Mammals Reservoir Storage and Conservation Before Shortage
Moderate- positive
Flows past Morelos Diversion Dam more likely than the No Action Alternative. Flows are rare in this reach, so increased likelihood would benefit the riparian corridor and associated special status species.
Amphibians, Plants and Fish All Action Alternatives No Impact Fish occurrence is problematic due to lack of steady flows. No
special status plants or amphibians are known from this reach. Basin States and Water Supply No impact Flows past Morelos Diversion Dam just as likely under the No Action
Alternative. MacNeill’s sooty-winged skipper Reservoir Storage and
Conservation Before Shortage
Minor-negative Atriplex vegetation occurs in this reach and could be impacted from scouring by increased likelihood of flow past Morelos Diversion Dam.
17

Environmental Consequences Chapter 4
February 2007 4-202 Draft EIS – Colorado River Interim Guidelines for
Lower Basin Shortages and Coordinated Operations for Lake Powell and Lake Mead
4.8.5 Summary 1 2
4.8.5.1 Vegetation and Wildlife 3 4
Lake Powell and Lake Mead. The Water Supply Alternative may have a minor negative 5 impact on obligate phreatophytes, marsh and the wildlife that use such habitats because 6 lake levels tend to be lower than under the No Action Alternative. The Reservoir Storage 7 Alternative may have a minor positive impact on obligate phreatophytes, marsh and 8 associated wildlife because lake levels tend to be higher than under the No Action 9 Alternative. 10
Glen Canyon Dam to Lake Mead. All four action alternatives tend to have lower 10th 11 percentile releases from Glen Canyon Dam than under the No Action Alternative. These 12 lowered releases may negatively impact obligate phreatophytes, marsh and associated 13 wildlife below Lake Powell. The impacts are expected to be minor because though lower, 14 they are within the range of recent history and are anticipated for the interim period only. 15
Hoover Dam to Davis Dam and Lake Havasu to Parker Dam. All four action alternatives 16 would have no impact to vegetation or wildlife in these areas because there may be only 17 small differences in Lake Mead releases and these areas are dominated by Lake Mohave 18 and its backwater and Lake Havasu. Vegetated habitats potentially affected by flow 19 changes between Hoover Dam and Lake Mohave are limited. Lake Mohave and Lake 20 Havasu are operated on monthly rule curves so vegetation and wildlife effects at the lakes 21 under the action alternatives are identical to those under the No Action Alternative. 22
Davis Dam to Lake Havasu. The Water Supply Alternative may have higher 10th and 50th 23 percentile monthly releases from Davis Dam and this may cause a minor positive impact 24 to obligate phreatophytes, marsh and associated and wildlife compared to the No Action 25 Alternative. The Reservoir Storage Alternative may have lower 10th and 50th percentile 26 monthly releases from Davis Dam and this may cause a minor negative impact to obligate 27 phreatophytes, marsh and wildlife compared to the No Action Alternative. These 28 differences remain within the range of annual fluctuation that has occurred and may 29 occur during the interim period only. 30
Parker Dam to Imperial Dam. The Conservation Before Shortage, Basin States and 31 Reservoir Storage alternatives all have lower 10th and 50th percentile releases and may 32 thus have a minor negative impact on obligate phreatophytes, marsh and associated 33 wildlife. 34
Imperial Dam to NIB. All of the action alternatives will have no impact to vegetation and 35 wildlife in this reach. Flow changes in this reach will show up in the AAC rather than in 36 the Colorado River below Imperial Dam. No impacts to vegetation or wildlife are 37 anticipated from flow differences in the AAC. 38
NIB to SIB. Mexico diverts its water at Morelos Diversion Dam (at the NIB) and flows 39 below this dam are rare. There is a higher probability of excess flows passing Morelos 40 Diversion Dam under the Conservation Before Shortage and Reservoir Storage 41

Environmental Consequences Chapter 4
Draft EIS – Colorado River Interim Guidelines for Lower Basin Shortages and Coordinated Operations for Lake Powell and Lake Mead
4-203 February 2007
alternatives than under the No Action Alternative, which is expected to cause a moderate 1 positive benefit to river flow, obligate phreatophytes, marsh and associated wildlife 2 below Morelos Diversion Dam. These benefits were deemed moderate because flows in 3 this reach are currently rare and any additional flow in this reach is assumed to be 4 beneficial. 5
4.8.5.2 Special Status Species 6 7
Lake Powell. Lower Lake Powell elevations under the Conservation Before Shortage, 8 Basin States and Water Supply alternatives may increase the amount of riverine habitat 9 available at the inflow areas to Lake Powell. This may provide a minor positive benefit to 10 Razorback sucker, bonytail, Colorado pikeminnow and flannelmouth sucker found in the 11 lake. The higher lake levels under the Reservoir Storage Alternative may decrease the 12 amount of riverine habitat at the inflow areas, which may not provide this benefit. 13
Clark’s grebe that may inhabit Lake Powell could be impacted by water level changes in 14 Lake Powell that affect marsh habitat at the inflow areas. The Reservoir Storage and 15 Water Supply alternatives may have higher and lower lake levels respectively, which 16 translate into a minor positive and minor negative impact respectively to Clark’s grebe. 17
Glen Canyon Dam to Lake Mead. The Reservoir Storage and Water Supply alternatives may 18 result in lower and higher river temperatures respectively below Glen Canyon Dam. 19 Higher temperatures may provide a minor positive impact to humpback chub, bluehead 20 sucker and flannelmouth sucker. However, these warmer temperatures also benefit non-21 native fish species, which compete with native fish. Lower temperatures may provide a 22 minor negative impact to these native fish species. The warmer river temperatures that 23 may occur under the Water Supply Alternative may have a minor positive impact on 24 Leopard Frogs from reduced thermal shock. Higher 90th percentile releases under the 25 Reservoir Storage Alternative have the potential to have increased impact to beach 26 habitat in the lower Grand Canyon, which could adversely impact Grand Canyon 27 Evening primrose that may inhabit such beaches. All four action alternatives may have 28 flows that could exceed the No Action Alternative and 17,000 cfs in some months, which 29 may cause additional impact to Kanab ambersnail habitat at Vasey’s paradise. The 30 Reservoir Storage Alternative may have flows in June that could exceed the No Action 31 Alternative and exceed 20,000 cfs, thus causing greater impact to Niobrarra ambersnail 32 habitat. The Conservation Before Shortage, Basin States and Water Supply alternatives 33 may have 90th percentile flows that when above 20,000 cfs are equal or less than No 34 Action Alternative, which would provide a minor positive benefit to the Niobrarra 35 ambersnail. High flows in June under the Reservoir Storage Alternative have the greatest 36 potential to impact quailbrush in the Grand Canyon, which could impact MacNeill’s 37 sooty winged-skipper. All four action alternatives may have a minor negative impact on 38 the Southwestern Willow Flycatcher because 10th percentile releases trend lower than No 39 Action Alternative. These lower potential flows could adversely impact Southwestern 40 Willow Flycatcher habitat in the Grand Canyon. 41
Lake Mead. The lower and higher Lake Mead elevations that may occur under the Water 42 Supply and Reservoir Storage Alternatives, respectively, could cause minor negative and 43

Environmental Consequences Chapter 4
February 2007 4-204 Draft EIS – Colorado River Interim Guidelines for
Lower Basin Shortages and Coordinated Operations for Lake Powell and Lake Mead
minor positive impacts, respectively, to special status bird species. Bird impacts may be 1 caused by increased or decreased potential for dewatering of riparian habitats and 2 headcutting at the Lake Mead inflow areas. Higher lake levels under the Reservoir 3 Storage Alternative may inundate additional shoreline habitat for the sticky buckwheat, 4 Geyer’s milkvetch and Las Vegas Bearpoppy and be a minor negative impact. Lower 5 Lake Mead water levels under the Water Supply Alternative may expose additional 6 shoreline habitat for these plants and be a minor positive impact. These impacts were 7 deemed minor because all habitats below the full-pool elevation of Lake Mead are 8 subject to periodic inundation and exposure as the lake fluctuates in the future. The 9 Reservoir Storage and Water Supply alternatives may have both minor positive and 10 negative impacts to special status fish species. This may occur because the amount of 11 riverine habitat for these species at the inflow areas are more and less than under the No 12 Action Alternative at the 10th and 50th percentile levels, respectively. The Reservoir 13 Storage Alternative may result in water levels over elevation 1,120 feet msl 50 percent of 14 the time, which may benefit special status fish spawning in the lake. 15
Hoover Dam to Davis Dam and Lake Havasu to Parker Dam. There is no substantial difference 16 between any of the alternatives in this reach. Accordingly, there will be no special status 17 species impacts here. 18
Davis Dam to Lake Havasu. Lower monthly releases from Davis Dam under the Reservoir 19 Storage Alternative may have a minor negative impact on obligate phreatophytes, marsh 20 and the associated special status bird species. Impacts to these species may occur through 21 adverse effects to their habitats from reduced dam releases. Razorback sucker, 22 flannelmouth sucker and bonytail may experience a minor negative impact because lower 23 potential releases could have adverse impacts to riverine spawning habitat and backwater 24 rearing habitats that these species utilize. Higher monthly releases from Davis Dam under 25 the Water Supply Alternative may have a minor positive impact on obligate 26 phreatophytes, marsh and the associated special status bird species. Razorback sucker, 27 flannelmouth sucker and bonytail may also benefit from these higher flows because there 28 is a reduced likelihood that spawning and rearing habitats may be adversely impacted 29 from flow-related effects. 30
Parker Dam to Imperial Dam. Lower monthly flows under the Conservation Before 31 Shortage, Basin States and Reservoir Storage alternatives may have minor negative 32 impacts to the habitats of the special status bird species. Obligate phreatophytes, marsh 33 and the associated special status bird species would be negatively impacted by lower 34 releases. Razorback sucker and bonytail chub may be negatively impacted by lower flows 35 under the Conservation Before Shortage, Basin States and Reservoir Storage alternatives. 36 Lower flows may negatively impact spawning and rearing habitats for these species. 37
Imperial Dam to NIB. The No Action Alternative and the action alternatives will have no 38 impact to special status species in this reach. Flow changes in this reach will show up in 39 the AAC rather than in the Colorado River below Imperial Dam. No impacts to special 40 status species are anticipated from flow differences in the AAC. 41

Environmental Consequences Chapter 4
Draft EIS – Colorado River Interim Guidelines for Lower Basin Shortages and Coordinated Operations for Lake Powell and Lake Mead
4-205 February 2007
NIB to SIB. Flows past Morelos Diversion Dam are more probable under the Reservoir 1 Storage and Conservation Before Shortage alternatives. The increased probability of 2 flows may have a moderate positive impact on the special status bird species through 3 positive impacts to riparian and marsh habitats these species utilize. These higher 4 probabilities of flows may also positively impact the special status bat species listed in 5 Section 4.8.3.7, the Yuma hispid cotton rat and the Colorado River cotton rat through 6 positive impacts to their riparian and marsh habitats. Though these flows are an overall 7 benefit to the riparian corridor below the NIB, the increased probability of high flows 8 could increase the likelihood of scouring Atriplex vegetation in this reach, which would 9 be a minor impact. 10
11

Environmental Consequences Chapter 4
February 2007 4-206 Draft EIS – Colorado River Interim Guidelines for
Lower Basin Shortages and Coordinated Operations for Lake Powell and Lake Mead
This page intentionally left blank. 1 2

Chapter 4 Environmental Consequences
Draft EIS – Colorado River Interim Guidelines for Lower Basin Shortages and Coordinated Operations for Lake Powell and Lake Mead
4-207 February 2007
4.9 Cultural Resources 1
This section describes the methods used in the analysis and potential effects to cultural resources, 2 including historic properties, Indian sacred sites, and issues of Tribal concern as a result of 3 implementing the alternatives developed under the proposed federal action. 4
4.9.1 Methodology 5 This section provides a general analysis that considers how cultural sites might be 6 exposed and affected by implementation of the proposed federal action. However, the 7 specifics about current integrity of the submerged sites and the impacts that might occur to 8 these sites once they are exposed are mostly unknown. Because of this, Reclamation and the 9 NPS will work together to develop an agreement (acceptable to the consulting parties) that 10 implements an appropriate strategy to identify, analyze, and address potential effects to 11 cultural sites as they are exposed in the future as a consequence of implementing the 12 proposed federal action. 13
For Lake Powell, the 10th percentile was selected as the basis for effect determination 14 because it represents the “worst case” that still has a reasonable probability of occurring. At 15 Lake Mead, elevation 1,080 feet msl was selected as the basis for effect determination.1 16 Processes that might result in a loss of integrity vary by reach and property type; 17 consequently, methods of assessing effects differ by reach. 18
4.9.2 Lake Powell and Glen Canyon Dam 19 20
4.9.2.1 No Action Alternative 21 For the No Action Alternative, the lowest projected elevation of Lake Powell under the 22 10th percentile modeled Lake Powell elevations would be 3,540 feet msl (Appendix P, 23 Figure P-7). Some 193 unexcavated archaeological sites are at or above this elevation. 24
4.9.2.2 Basin States Alternative and Conservation Before Shortage Alternatives 25 For the Basin States and Conservation Before Shortage alternatives, the lowest projected 26 elevation of Lake Powell under the 10th percentile modeled Lake Powell elevations is 27 projected to be 3,550 feet msl. Some 190 unexcavated archaeological sites are at or above 28 this elevation and would therefore be subject to erosion or visitor impacts. This is 29 essentially the same effect as under the No Action Alternative. 30
1 Elevation 1,083 feet msl is the lowest elevation historically observed since Lake Mead filled
Environmental Consequences Chapter 4
February 2007 4-208 Draft EIS – Colorado River Interim Guidelines for
Lower Basin Shortages and Coordinated Operations for Lake Powell and Lake Mead
4.9.2.3 Water Supply Alternative 1 For the Water Supply Alternative, the lowest projected elevation of Lake Powell under 2 the 10th percentile modeled Lake Powell elevations is projected to be 3,505 feet msl. 3 Some 222 unexcavated archaeological sites are at or above this Lake Powell elevation 4 and would therefore be subject to erosion or visitor impacts. This is a greater number of 5 affected sites than under the No Action Alternative. 6
4.9.2.4 Reservoir Storage Alternative 7 For the Reservoir Storage Alternative, the lowest projected elevation of Lake Powell 8 under the 10th percentile modeled Lake Powell elevations is projected to be 3,540 feet 9 msl. Some 193 unexcavated archaeological sites are at or above this elevation and would 10 therefore be subject to erosion or visitor impacts. This is essentially the same result as 11 under the No Action Alternative. 12
4.9.3 Glen Canyon Dam To Lake Mead 13 The Colorado River corridor between Glen Canyon Dam and Separation Canyon contains 14 336 NRHP-eligible properties. These are actively managed by the NPS, Navajo Nation and 15 Hualapai Indian Tribe. In addition, Reclamation’s NHPA Section 106 responsibilities for 16 effects of Glen Canyon Dam operations are managed through a programmatic agreement. A 17 treatment plan for mitigation of adverse impacts to historic properties is in development and 18 will be implemented in 2008. The Grand Canyon Protection Act of 1992 ensures long-term 19 mitigation of effects. Thus, the alternatives currently under analysis pose no additional threat 20 to historic properties not already considered by existing programs. 21
4.9.4 Lake Mead and Hoover Dam 22 Some 32 previously recorded cultural resources are located at or below elevation 1,080 feet 23 msl, although many more undocumented cultural resources are probably submerged in Lake 24 Mead at or below this elevation. If these cultural resources were to emerge, additional 25 impacts would be anticipated as a result of invasion by invasive species of plants and animals 26 (specifically as seen at St. Thomas by tamarisk and Asiatic freshwater clams), cracking and 27 fissuring of sediments as a result of repeated wetting and drying and freeze/thaw cycles 28 (Wyskup 2006), and as a result of visitor impacts. Resources like the B-29 Bomber aircraft 29 and the aggregate classification plant are currently at depths where they cannot be reached 30 without specialized breathing-gas mixture and diving equipment, but a lowering of the 31 reservoir elevation would bring these resources into the range of recreational scuba divers. 32
4.9.4.1 No Action Alternative 33 The probability of Lake Mead pool elevation falling below 1,080 feet msl was analyzed 34 in Section 4.3 (Table 4.3-21). Figure 4.3-21 presents the probabilities of Lake Mead 35 elevation falling below 1,080 feet msl over the period of analysis for all alternatives. 36 Under the No Action Alternative, the probability begins at zero percent in 2008 and 37 increases to 41 percent in 2060. From 2017 through 2040, the probability fluctuates 38 between 38 percent and 44 percent. 39

Chapter 4 Environmental Consequences
Draft EIS – Colorado River Interim Guidelines for Lower Basin Shortages and Coordinated Operations for Lake Powell and Lake Mead
4-209 February 2007
4.9.4.2 Basin States and Conservation Before Shortage Alternatives 1 In 2008, the probability of the Lake Mead elevation falling below elevation 1,080 feet 2 msl is zero under these alternatives. In years 2017 through 2040, the probability is 3 slightly lower than under the No Action Alternative for several years and ranges between 4 36 percent and 47 percent. Given these small differences compared to the No Action 5 Alternative, the differential effect on cultural resources would be negligible. 6
4.9.4.3 Water Supply Alternative 7 In 2008, the probability of the Lake Mead elevation falling below elevation 1,080 feet 8 msl is zero. From 2017 through 2040, the probability fluctuates between 39 percent and 9 51 percent, a relative difference of about one to seven percent under the Water Supply 10 Alternative compared to the No Action Alternative. Consequently, there is a higher 11 probability that cultural resources submerged at or below elevation 1,080 feet msl would 12 emerge under the Water Supply Alternative. 13
4.9.4.4 Reservoir Storage Alternative 14 In 2008, the probability of the Lake Mead elevation falling below elevation 1,080 feet 15 msl is zero. The probability of the Lake Mead elevation falling below elevation 1,080 feet 16 msl is substantially lower (one percent to 23 percent) under this alternative compared to 17 the No Action Alternative. Consequently, there is a lower probability that cultural 18 resources submerged at or below elevation 1,080 feet msl would emerge under the 19 Reservoir Storage Alternative. 20
4.9.5 Hoover Dam to Davis Dam 21 Under all alternatives, Lake Mohave would continue to be operated to meet monthly target 22 elevations. Because there would be no change in reservoir operations, there is no potential for 23 adverse effects to occur to cultural resources submerged in Lake Mohave as a result of the 24 proposed federal action. 25
4.9.6 Davis Dam to Parker Dam 26 Geomorphic processes in lacustrine and fluvial environments differ so the Havasu Reach has 27 been subdivided into sub-reaches for this analysis, a river reach and Lake Havasu. 28
4.9.6.1 Davis Dam to Upper Lake Havasu. 29 There are 10 previously recorded cultural resources located along the reach of the 30 Colorado River from Davis Dam to the upper end of Lake Havasu. Three of these cultural 31 resources span the Colorado River with their end-points anchored in positions well above 32 the river surface. A lowering of the elevation of the river in the area of these sites would 33 have no direct or indirect effect on these resources. Examination of the site forms and 34 map plots for two other previously recorded cultural resources (both segments of 35 railroads) indicate these sites are located in elevated positions back from the riverbank. 36 No direct or indirect effects to these resources are anticipated as a result of the proposed 37 federal action due to their elevated locations. 38
Of the five additional cultural resources in this reach, only two would be directly affected 39 by a drop in river elevation. These two sites represent the remnants of two bridges used 40 by contractors during the construction of Davis Dam. 41
Environmental Consequences Chapter 4
February 2007 4-210 Draft EIS – Colorado River Interim Guidelines for
Lower Basin Shortages and Coordinated Operations for Lake Powell and Lake Mead
Although the proposed federal action may result in reductions in the annual volume 1 released from Davis Dam and the corresponding mean daily releases, the hourly releases 2 will continue to fluctuate between the historical minimum and maximum ranges due to 3 operational considerations and constraints. The corresponding river flows and associated 4 elevations would also continue to fluctuate between the historical minimum and 5 maximum ranges and therefore it is unlikely there would be any changes in depositional 6 or erosional processes along tributary streams or washes, or the Colorado River itself. 7 Furthermore, it is highly unlikely that daily or hourly changes in elevation would result in 8 conditions that would allow for more ready access to cultural resources located 9 immediately adjacent to or in the river. 10
4.9.6.2 Lake Havasu and Parker Dam. 11 Under the alternatives, Lake Havasu will continue to be operated to meet monthly target 12 elevations. Because there will be no change in the manner in which the reservoir has been 13 operated historically, there is no potential for effects to occur to cultural resources 14 submerged in Lake Havasu. 15
4.9.7 Parker Dam to Imperial Dam 16 The IA FEIS identified several cultural resource sites within or proximal to the Parker Dam 17 to Imperial Dam reach. However, most of the historic resources that may be present in the 18 APE, as suggested from plats and site records, have been destroyed by meandering and 19 relocation of the mainstream channel of the Colorado River and agricultural development. 20 Further, the proposed federal action will have no effect on Parker Dam, Imperial Dam or the 21 Old Parker Road. 22
Although the proposed federal action may result in reductions in the annual volume released 23 from Parker Dam and the corresponding mean daily releases, the hourly releases will 24 continue to fluctuate between the historical ranges due to operational considerations and 25 constraints. The corresponding river flows and associated elevations would also continue to 26 fluctuate between the historical minimum and maximum ranges and therefore it is unlikely 27 there would be any changes in depositional or erosional processes along tributary streams or 28 washes, or the Colorado River. Eleven of the twelve sites located proximate to the APE are 29 situated in locations above the river channel, its connected lakes and backwaters, and 30 floodplain. The anticipated changes in elevations would therefore not impact these sites. 31 Also, the prehistoric habitation site listed on the National Register would not be directly 32 impacted by a drop in river elevation. It is conceivable that it could be indirectly impacted by 33 better accessibility if the river drops in elevation more frequently or for longer periods of 34 time. The probability of this occurring is small and would be countered by the emergence of 35 impenetrable vegetation behind the retreating water line. Furthermore, it is highly unlikely 36 that daily or hourly changes in elevation would result in conditions that would allow for more 37 ready access to cultural resources located immediately adjacent to or in the river. 38
4.9.8 Sacred Sites and Other Issues of Tribal Concern 39 As a result of prior government-to-government consultations, several tribes had identified 40 Indian sacred sites located on federal lands within the affected environment. During 41 consultations regarding this proposed federal action, the Hualapai Indian Tribe was the only 42

Chapter 4 Environmental Consequences
Draft EIS – Colorado River Interim Guidelines for Lower Basin Shortages and Coordinated Operations for Lake Powell and Lake Mead
4-211 February 2007
tribe who specifically raised a concern regarding how the alternatives might adversely affect 1 the physical integrity of sacred sites. The Hualapai Indian Tribe also raised concerns 2 regarding biological resources located in the Grand Canyon and on Hualapai Tribal land. 3
Reclamation, the NPS, and the FWS (federal agencies who manage lands within the affected 4 environment) remain committed to accommodating access to and ceremonial use of Indian 5 sacred sites by Indian religious practitioners. The agencies also remain committed to 6 avoiding any adverse effects to the physical integrity of such sites in compliance with Exec. 7 Order No. 13007. None of the alternatives are believed to adversely affect any identified 8 Indian sacred site or alter access to such a site. 9
During consultation for this proposed federal action, several tribes expressed concern that the 10 alternatives might result in inadvertent discoveries of Native American human remains or 11 cultural items as defined under the Native American Graves Protection and Repatriation Act 12 of 1990 (NAGPRA). Reclamation and the federal land-managing agencies remain committed 13 to compliance with both the inadvertent discovery and museum inventory sections of this law 14 and its implementing regulations. 15
With respect to museum inventories from the original Glen Canyon archaeological project, 16 Reclamation is working on cultural affiliation determinations on behalf of tribes seeking 17 repatriation of inventory items from the Glen Canyon archaeological project. 18
4.9.9 Summary 19 For Lake Powell, under the Water Supply Alternative at the 10th percentile, there are at least 20 222 unexcavated sites subject to effect, as compared to about 193 sites under the other 21 alternatives. Consultation is underway regarding eligibility and effect. 22
For the reach from Glen Canyon to Lake Mead, the alternatives pose no additional threat to 23 cultural resources because of the programs already underway. 24
For Lake Mead, there are at least 32 cultural resources located below elevation 1,080 feet 25 msl. The probability of exposing sites below this elevation vary by alternative, with the 26 Reservoir Storage Alternative having the lowest probability (up to 23 percent lower 27 compared to the No Action Alternative) and the Water Supply Alternative having the highest 28 probability (up to seven percent higher compared to the No Action Alternative). The Basin 29 States and Conservation Before Shortage alternatives have probabilities similar to those of 30 the No Action Alternative. 31
For reaches below Lake Mead, no adverse effects are anticipated from any of the alternatives. 32 However, consultation regarding eligibility and effect will be undertaken. 33
For Indian sacred sites and other issues of Tribal concern (not including ITAs), none of the 34 alternatives are expected to restrict access or result in loss of physical integrity to sacred 35 sites. Consultations with Indian tribes are ongoing with respect to these issues and other 36 issues and concerns. 37
38

Environmental Consequences Chapter 4
February 2007 4-212 Draft EIS – Colorado River Interim Guidelines for
Lower Basin Shortages and Coordinated Operations for Lake Powell and Lake Mead
This page intentionally left blank. 1 2

Chapter 4 Environmental Consequences
Draft EIS – Colorado River Interim Guidelines for Lower Basin Shortages and Coordinated Operations for Lake Powell and Lake Mead
4-213 February 2007
4.10 Indian Trust Assets 1
4.10.1 Water Rights and Trust Lands 2 No vested water right of any kind, quantified or unquantified, including federally reserved 3 Indian rights to Colorado River water, rights pursuant to the Consolidated Decree or 4 Congressionally-approved water right settlements utilizing CAP water, will be altered as a 5 result of any of the alternatives under consideration. 6
To the extent that additional Tribal water rights are developed, established or quantified 7 during the interim period of the proposed federal action, the United States will manage 8 Colorado River facilities to deliver water consistent with such additional water rights, if any, 9 pursuant to federal law. Thus, modifications to system operation, in accordance with 10 pertinent legal requirements, will be considered as Tribal water rights and will be exercised 11 in accordance with applicable law. 12
Water deliveries to the Fort Mojave, Chemehuevi, CRIT, and Fort Yuma Indian Reservations 13 will not be affected by the proposed federal action due to their early priority dates. For the 14 Cocopah Indian Reservation, its 1915 and 1917 PPRs would also not be affected. However, 15 the 1974 priority date of 2,026 afy of the Cocopah Indian Reservation may be reduced during 16 certain shortage conditions, as summarized in the Water Delivery Section 4.4. Similarly, the 17 CAP Settlement tribes, with their post-1968 CAP Priority, would also be subject to shortages. 18 However, even when water deliveries are reduced to these Indian Reservations, the 19 underlying water right would not be affected. 20
Water delivery reductions may result in fallowing of some Indian lands; however, these 21 changes in land-use are expected to be temporary and no permanent changes in land-use 22 would occur. In terms of effects to the shorelines of reservations, the fluctuations that might 23 occur as a result of this action downstream of Lake Mead are within historic levels. 24
For the No Action Alternative under the 10th and 50th percentiles, monthly releases from Glen 25 Canyon Dam would range from approximately 9,000 to 14,000 cfs past the Navajo and 26 Hualapai Indian Reservation boundaries. Under the action alternatives, flows would 27 occasionally be reduced by approximately 700 to 2,000 cfs. These slight reductions in flow 28 and concomitant sediment transport differences would not affect Indian trust lands. 29
4.10.2 Hydroelectric Power Generation and Distribution 30 As described in Section 4.11, the energy generated at Headgate Rock Powerplant under the 31 Basin States, Conservation Before Shortage, and Reservoir Storage alternatives could 32 potentially be less than under the No Action Alternative. These reductions in energy 33 generated range from 1.3 percent to 2.5 percent. However, Reclamation has determined that 34 the water appropriated to non-CRIT entities that flows through Headgate Rock Dam and 35 generates electricity is not an ITA. 36

Environmental Consequences Chapter 4
February 2007 4-214 Draft EIS – Colorado River Interim Guidelines for
Lower Basin Shortages and Coordinated Operations for Lake Powell and Lake Mead
4.10.3 Cultural Resources 1 As discussed in the Cultural Resources section (Section 4.9), Reclamation is currently in the 2 process of identifying cultural resources and evaluating potential effects. However, based on 3 what is currently known of Hualapai Indian Tribe historic and traditional cultural properties, 4 there would be no effect on cultural resources of concern to the tribe. Furthermore, under 5 Exec. Order No. 13007, there will be no change in access to Hualapai Indian Tribe or other 6 Indian tribe sacred sites as a result of the proposed federal action. 7
4.10.4 Biological Resources 8 While not necessarily ITAs, the Navajo Nation and Hualapai Indian Tribe have expressed 9 concern over biological resources located on their reservations and in the intervening Grand 10 Canyon. As discussed in the Biological Resources Section (Section 4.8), the action 11 alternatives would result in occasional reductions of approximately 700 to 2,000 cfs past the 12 Navajo Nation and the Hualapai Indian Reservations, compared with the No Action 13 Alternative. These flows would have some potential to impact obligate native phreatophytes 14 such as willow (a plant of concern to many tribes); however the effects on vegetation are 15 likely to be short-term, especially in comparison to the long-term trends favoring tamarisk 16 expansion. 17
The Navajo Nation and the Hualapai Indian Tribe also expressed concern over native fish. 18 The Hualapai Indian Tribe is particularly concerned with razorback sucker in the upper end 19 of Lake Mead. As discussed in the Biology Resources Section, the modeling of Lake Mead 20 elevations indicate that the minimum Lake Mead water levels under the action alternatives 21 would be similar to those under the No Action Alternative. Therefore, the proposed federal 22 action is expected to have either no effects or only minor effects on razorback sucker and 23 other fish of Tribal concern. 24
4.10.5 Summary 25 After analyzing each resource, it is concluded that Tribal trust resources identified in the 26 study area would not be adversely affected by any of the anticipated environmental impacts 27 stemming from the proposed federal action. 28
29

Chapter 4 Environmental Consequences
Draft EIS – Colorado River Interim Guidelines for Lower Basin Shortages and Coordinated Operations for Lake Powell and Lake Mead
4-215 February 2007
4.11 Electrical Power Resources 1
This section analyzes the potential effects of the proposed federal action on electrical power (or 2 hydropower) resources. The following issues are addressed: 3
♦ change in electrical power generated and the associated change in economic value; 4
♦ effect on Upper and Lower Colorado funds that pay for operation, maintenance, 5 replacements of power facilities, and other programs supported by these funds; 6
♦ financial implications associated with implementation of surcharge; 7
♦ potential impact to ancillary services; and 8
♦ change in annual cost of electrical power for pumping water associated with the Navajo 9 Generating Station, City of Page water supply system, SNWA water supply system, and 10 CAP pumping load. 11
4.11.1 Methodology 12 Reclamation conducted a study of the potential effects of the action alternatives on electrical 13 power resources of the Colorado River system that included all major facilities with the 14 exception of generation capacity at Glen Canyon Powerplant. Western conducted a parallel 15 analysis of the potential effects of the action alternatives only on Glen Canyon Powerplant 16 (Appendix O). The two studies show very similar trends among the alternatives and the 17 relative findings of each study are comparable. Western’s analytical methodology includes a 18 more detailed hourly analysis of capacity of the Glen Canyon Powerplant because of 19 operational limitations of hydropower facilities resulting from the 1996 Glen Canyon Dam 20 ROD. The results of Reclamation’s analysis are used throughout this section with the 21 exception of the analysis of generation capacity and the economic value of generation 22 capacity of the Glen Canyon Powerplant, which uses the results of the hourly analysis 23 conducted by Western. 24
4.11.1.1 Electrical Energy Generated 25 The basis for the electrical power analysis is the CRSS model described in Section 4.2 26 and Appendix A. Among other variables, the model simulates monthly turbine release 27 (af) and end-of-month (EOM) reservoir elevation (feet above msl) and calculates monthly 28 generation (MWh) and monthly capacity (MW). The monthly generation data were then 29 aggregated to produce estimates of annual generation. Using the resulting annual data, the 30 mean, median, 90th percentile, and 10th percentile annual energy generation statistics were 31 calculated for each year for Glen Canyon, Hoover, Davis, and Parker Powerplants. 32
Since the elevation behind Headgate Rock Dam is maintained at a relatively constant 33 elevation, electrical power generation at the Headgate Rock Powerplant was calculated 34 based on modeling changes in river flows provided by the CRSS model for the No Action 35 Alternative and action alternatives. The modeled flows available to pass through the 36

Environmental Consequences Chapter 4
February 2007 4-216 Draft EIS – Colorado River Interim Guidelines for
Lower Basin Shortages and Coordinated Operations for Lake Powell and Lake Mead
Headgate Rock Powerplant were first reduced by a 5.96 percent factor to account for 1 water that is likely to be bypassed through the river gates. This factor was derived from 2 actual data from 2001 through 2005. Energy was then calculated using a conversion 3 factor of 12.97 kWh /af, derived by averaging the monthly kWh/af values for the 4 Headgate Rock Powerplant from 1996 through 1998. 5
In general, mean values provide an assessment of the overall impact to hydropower. The 6 mean is the average of all modeled traces, which includes all hydrologic extremes, while 7 the median is the midpoint of all values. Mean energy values higher than median values 8 reflect water released from Glen Canyon Dam for equalization and the existence of the 9 minimum objective release. Mean energy values lower than median values at the Hoover 10 Powerplant are likely due to extreme dry conditions when the Hoover Powerplant may 11 not be generating power. 12
4.11.1.2 Generation Capacity 13 Using the capacity relationships for each powerplant, their respective monthly 14 availability factors and the monthly forebay elevations simulated by the CRSS model, the 15 monthly capacity for each powerplant was computed. The mean, median, 90th percentile 16 and 10th percentile capacity values were then computed for the No Action Alternative and 17 the action alternatives for the Hoover, Davis, and Parker Powerplants. For the Glen 18 Canyon Powerplant, the analysis was conducted by Western (Appendix O) and only the 19 mean, median, and 10th percentile values are presented. The 90th percentile values were 20 not calculated for the Glen Canyon Powerplant because at this level there is no 21 substantial difference among the alternatives. Capacity was not calculated for Headgate 22 Rock Powerplant because no changes in capacity are anticipated. 23
4.11.1.3 Economic Values 24 The economic value of operating an existing hydroelectric powerplant varies 25 considerably with time of day. The cost of meeting demand varies on a second-by-second 26 basis depending on the load, the mix of powerplants being operated to meet load, and 27 their output levels. During off-peak periods, demand is typically satisfied with lower-cost 28 coal, run-of-river hydropower, and nuclear units. During on-peak periods, the additional 29 load is met with more expensive sources such as gas turbine units. Consequently, the 30 economic value of hydropower is greatest during the hours when the demand for 31 electricity, and the variable cost of meeting demand, is the highest. 32
The electrical energy prices used in this analysis were developed from both an hourly 33 price forecast keyed to the Palo Verde Interchange and mean monthly reported price 34 indices for the Palo Verde Interchange obtained from Dow Jones, Inc. The hourly 35 forecast of 2004 electricity prices at the Palo Verde Interchange was developed using the 36 AURORA model (Electric Power Information Solutions, Inc. 2005). 37
Chapter 4 Environmental Consequences
Draft EIS – Colorado River Interim Guidelines for Lower Basin Shortages and Coordinated Operations for Lake Powell and Lake Mead
4-217 February 2007
AURORA model simulations used in this analysis were developed for and used in the 1 Northwest Power and Conservation Council’s (NWPCC) Fifth Northwest Electric Power 2 and Conservation Plan (NWPCC 2005). The NWPCC is primarily interested in 3 Northwestern electricity markets. Relatively less attention is devoted to characterizing 4 market conditions in other areas. Consequently, the forecast described in this analysis 5 primarily reflects the default data supplied with the AURORA model. 6
For purposes of this analysis, the hourly prices developed using the AURORA model 7 were scaled to match the mean monthly reported prices purchased from Dow Jones, Inc. 8 The resulting (scaled) hourly prices exhibit the expected daily, weekly and monthly 9 patterns of price behavior and reflect the mean values actually observed in each month. 10
The underlying hourly prices yielded by this process are for 2004. These prices were 11 escalated by 2.2 percent per year to estimate 2008 prices. For this analysis, estimation of 12 the economic value for the No Action Alternative and each of the action alternatives were 13 analyzed using monthly generation data simulated by the CRSS model as described 14 previously. The value of the monthly generation was then analyzed using the escalated 15 mean price of electricity for that month. The monthly economic value was then 16 aggregated to produce estimates of annual economic value. 17
The costs and benefits associated with electrical power generation are incurred at 18 different times over a long period of time. Because the timing of these costs and benefits 19 differ across the alternatives, the present value of the future stream of costs and benefits 20 for each alternative was computed as a means of assessing the economic value of 21 electrical power for each alternative. 22
All economic value estimates reported in this Draft EIS are measured in present value 23 2008 dollars (PV 2008 $). All annual costs and benefits subsequent to 2008 were 24 escalated at 2.2 percent per year and discounted back to the 2008 base year using a 25 discount rate of 4.875 percent. 26
Similar to the process used in the economic analysis of electrical energy generation, the 27 present value of generation capacity was analyzed. In this instance, the capacity was 28 valued at $6.32/kW-month based upon the alternative market cost of capacity. 29
For Glen Canyon Powerplant, the economic value of electrical energy generated was 30 derived from Reclamation’s analysis, whereas the value of generation capacity was 31 derived from Western’s analysis. 32

Environmental Consequences Chapter 4
February 2007 4-218 Draft EIS – Colorado River Interim Guidelines for
Lower Basin Shortages and Coordinated Operations for Lake Powell and Lake Mead
4.11.2 Electrical Power Generation Facilities 1 2
4.11.2.1 Glen Canyon Powerplant 3 4
No Action Alternative. The No Action Alternative values for annual energy generation, 5 monthly generation capacity, and economic value at Glen Canyon Powerplant for the 6 mean, median, 90th percentile, and 10th percentile values are presented in Table 4.11-1. 7
Table 4.11-1 No Action Alternative Values at Glen Canyon Powerplant
Measure Mean Median 90th Percentile 10th Percentile Annual Energy Generation (MWh) 4,265,749 3,795,040 6,315,161 3,197,806 Monthly Capacity (MW ) 603 546 Not available 455 Economic Value of Electrical Power Generation - Total (PV 2008 $ millions)
6,808 6,823 Not available 5,881
8
Comparison of Action Alternatives to No Action Alternative. Table 4.11.2 shows the change 9 in annual electrical energy generation for each alternative in MWh in comparison to the 10 No Action Alternative, for the mean, median, 90th percentile and 10th percentile values. 11
Table 4.11-2 Change in Glen Canyon Powerplant Annual Energy Generation (MWh)
Alternatives Mean Median 90th Percentile 10th Percentile
Basin States (10,516) 24,121 (39,058) (68,219) Conservation before Shortage (9,093) 24,121 (37,368) (64,149) Water Supply (95,799) 6,768 (67,401) (219,755)
Reservoir Storage 26,668 23,265 55,966 (24,324)
12
Table 4.11-3 shows the percent change in annual energy generation for each alternative, 13 in comparison to the No Action alternative, for each hydrologic level. 14
Table 4.11-3 Percent Change in Glen Canyon Powerplant Annual Generation
Alternatives Mean Median 90th Percentile 10th Percentile Basin States (0.25) 0.64 (0.62) (2.1) Conservation before Shortage (0.21) 0.64 (0.59) (2.0) Water Supply (2.2) 0.18 (1.1) (6.9) Reservoir Storage 0.63 0.61 0.89 (0.76)
15

Chapter 4 Environmental Consequences
Draft EIS – Colorado River Interim Guidelines for Lower Basin Shortages and Coordinated Operations for Lake Powell and Lake Mead
4-219 February 2007
Figure 4.11-1 shows average values of annual electrical energy production for the Glen 1 Canyon Powerplant, over the period of study, for each alternative, including the No 2 Action Alternative. Differences in mean generation values between the No Action 3 Alternative and the action alternatives are the greatest from 2020 through 2050. 4
As noted above, Western conducted a complementary study of energy generation and 5 associated economic value using an hourly time step to simulate hourly Glen Canyon 6 Powerplant generation levels. Western’s model was used to determine the hourly 7 operation schedule that maximized the economic value of the hydropower resource. 8 Hourly pricing data, inflation and discount rates used in Western’s study were the same 9 as those used by Reclamation. 10
The Western study also included an analysis of the impacts to generation capacity at Glen 11 Canyon Powerplant. Table 4.11-4 shows the change in generation capacity for each 12 alternative, as compared to the No Action Alternative, for the mean, median, and 10th 13 percentile hydrologic levels. The corresponding percentage changes are identified in 14 Table 4.11-5. 15
Figure 4.11-1 Glen Canyon Powerplant
Average Values of Annual Electrical Energy Production
3,200
3,300
3,400
3,500
3,600
3,700
3,800
3,900
4,000
4,100
4,200
4,300
4,400
4,500
4,600
2005 2010 2015 2020 2025 2030 2035 2040 2045 2050 2055 2060Year
GW
h
No ActionBasin StatesConservation Before ShortageWater SupplyReservoir Storage
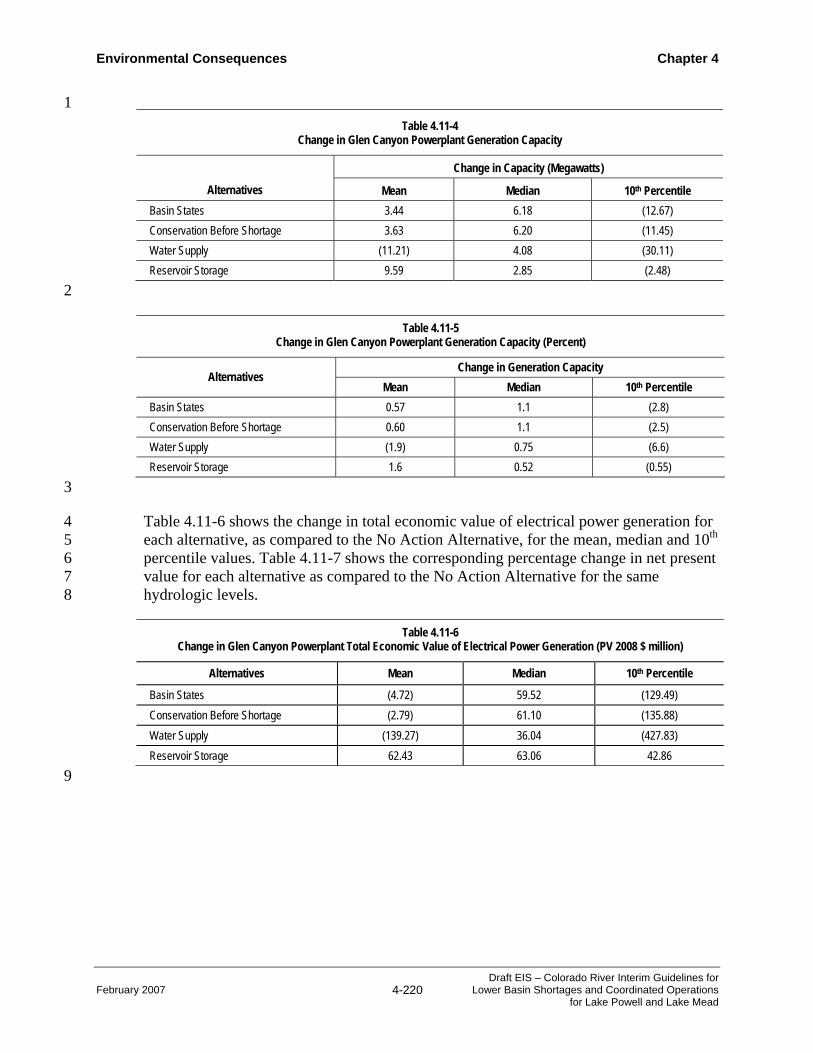
Environmental Consequences Chapter 4
February 2007 4-220 Draft EIS – Colorado River Interim Guidelines for
Lower Basin Shortages and Coordinated Operations for Lake Powell and Lake Mead
1 Table 4.11-4
Change in Glen Canyon Powerplant Generation Capacity
Change in Capacity (Megawatts)
Alternatives Mean Median 10th Percentile Basin States 3.44 6.18 (12.67) Conservation Before Shortage 3.63 6.20 (11.45) Water Supply (11.21) 4.08 (30.11) Reservoir Storage 9.59 2.85 (2.48)
2
Table 4.11-5 Change in Glen Canyon Powerplant Generation Capacity (Percent)
Change in Generation Capacity Alternatives
Mean Median 10th Percentile Basin States 0.57 1.1 (2.8) Conservation Before Shortage 0.60 1.1 (2.5) Water Supply (1.9) 0.75 (6.6) Reservoir Storage 1.6 0.52 (0.55)
3
Table 4.11-6 shows the change in total economic value of electrical power generation for 4 each alternative, as compared to the No Action Alternative, for the mean, median and 10th 5 percentile values. Table 4.11-7 shows the corresponding percentage change in net present 6 value for each alternative as compared to the No Action Alternative for the same 7 hydrologic levels. 8
Table 4.11-6 Change in Glen Canyon Powerplant Total Economic Value of Electrical Power Generation (PV 2008 $ million)
Alternatives Mean Median 10th Percentile
Basin States (4.72) 59.52 (129.49) Conservation Before Shortage (2.79) 61.10 (135.88) Water Supply (139.27) 36.04 (427.83) Reservoir Storage 62.43 63.06 42.86
9

Chapter 4 Environmental Consequences
Draft EIS – Colorado River Interim Guidelines for Lower Basin Shortages and Coordinated Operations for Lake Powell and Lake Mead
4-221 February 2007
1 Table 4.11-7
Change in Glen Canyon Powerplant Total Economic Value of Electrical Power Generation (Percent)
Alternatives Mean Median 10th Percentile
Basin States (0.07) 0.87 (2.20) Conservation Before Shortage (0.04) 0.90 (2.31) Water Supply (2.05) 0.53 (7.27) Reservoir Storage 0.92 0.92 0.73
2
Under all the action alternatives, the greatest impact to power would occur in the dry 3 years. The Reservoir Storage Alternative provides an increased electrical power 4 generation value, a result of higher reservoir elevations, while the other action 5 alternatives show generally decreased electrical power generation values. 6
4.11.2.2 Hoover Powerplant 7 8
No Action Alternative. The No Action Alternative values for annual energy generation, 9 monthly generation capacity, and economic value at Hoover Powerplant for the mean, 10 median, 90th percentile and 10th percentile values are presented in Table 4.11-8. 11
Table 4.11-8 No Action Alternative Values at Hoover Powerplant
Measure Mean Median 90th Percentile 10th Percentile1 Annual Energy Generation (MWh) 3,156,820 3,680,235 5,233,791 0.0 Monthly Capacity (MW) 1,201 1,428 2,067 0.0 Economic Value of Electrical Power Generation - Total (PV 2008 $ millions) 7,351 8,472 10,503 3,592
1 The 10th percentile value for capacity and energy is zero on cumulative distribution function graphs of end-of-December capacity and energy, a result of Lake Mead elevation being less than 1,050 feet msl (the assumed minimum power head). This result cascades in calculating total generation and percentage changes in Tables 4.11-9 through 4.11-14.
12
Comparison of Action Alternatives to No Action Alternative. Table 4.11-9 presents the change 13 in annual electrical energy generation for each action alternative, in comparison to the No 14 Action Alternative, for the mean, median, 90th percentile and 10th percentile values. 15
Table 4.11-9 Change in Hoover Powerplant Annual Electrical Energy Generation (MWh)
Alternatives Mean Median 90th Percentile 10th Percentile Basin States 14,369 (29,186) (15,301) 0.0 Conservation Before Shortage 18,570 (35,081) (1,313) 0.0 Water Supply (48,281) (19,062) (66,444) 0.0 Reservoir Storage 274,019 (29,970) 56,864 0.0
16

Environmental Consequences Chapter 4
February 2007 4-222 Draft EIS – Colorado River Interim Guidelines for
Lower Basin Shortages and Coordinated Operations for Lake Powell and Lake Mead
Table 4.11-10 presents the percent change in annual electrical energy generation for each 1 action alternative, in comparison to the No Action Alternative, for the mean, median, 90th 2 percentile and 10th percentile values. 3
Table 4.11-10 Change in Hoover Powerplant Annual Electrical Energy Generation (Percent)
Alternatives Mean Median 90th Percentile 10th Percentile Basin States 0.46 (0.79) (0.29) 0.0 Conservation Before Shortage 0.59 (0.95) (0.02) 0.0 Water Supply (1.5) (0.52) (1.27) 0.0 Reservoir Storage 8.7 (0.81) 1.1 0.0
4
Figure 4.11-2 depicts average values of annual electrical energy production for the 5 Hoover Powerplant over the period of study for each alternative, including the No Action 6 Alternative. Differences in mean generation values between the No Action Alternative 7 and the action alternatives are the greatest from 2020 through 2050. 8
9
Figure 4.11-2 Hoover Powerplant
Average Values of Annual Electrical Energy Production
3,200
3,300
3,400
3,500
3,600
3,700
3,800
3,900
4,000
4,100
4,200
4,300
4,400
4,500
4,600
2005 2010 2015 2020 2025 2030 2035 2040 2045 2050 2055 2060
Year
GW
h
No ActionBasin StatesConservation Before ShortageWater SupplyReservoir Storage

Chapter 4 Environmental Consequences
Draft EIS – Colorado River Interim Guidelines for Lower Basin Shortages and Coordinated Operations for Lake Powell and Lake Mead
4-223 February 2007
Table 4.11-11 shows the change in the Hoover Powerplant monthly generation capacity 1 (MW) for the action alternatives compared to the No Action Alternative. 2
Table 4.11-11 Change in Hoover Powerplant Monthly Generation Capacity (MW)
Alternatives Mean Median 90th Percentile 10th Percentile Basin States 12.7 6.1 1.4 0.0 Conservation Before Shortage 15.5 8.7 1.5 0.0 Water Supply (22.9) (14.5) (2.5) 0.0 Reservoir Storage 136.0 60.4 5.8 0.0
3
Table 4.11-12 presents the percentage change in Hoover Powerplant monthly capacity for 4 each of the action alternatives as compared to the No Action Alternative. 5
Table 4.11-12 Change in Hoover Powerplant Monthly Generation Capacity (Percent)
Alternatives Mean Median 90th Percentile 10th Percentile Basin States 1.1 0.43 0.06 0.0 Conservation Before Shortage 1.3 0.61 0.07 0.0 Water Supply (1.9) (1.0) (0.12) 0.0 Reservoir Storage 11.3 4.2 0.28 0.0
6
Table 4.11-13 presents the change in each of the action alternatives as compared to the 7 net present value of the total electrical power generation under the No Action Alternative. 8 Table 4.11-14 presents the corresponding percentage change in net present value for each 9 alternative as compared to the No Action Alternative for the same hydrologic levels. 10
Table 4.11-13 Change in Hoover Powerplant Total Economic Value of Electrical Power Generated (PV 2008 $ million)
Alternatives Mean Median 90th Percentile 10th Percentile Basin States 75.39 (250.17) (12.23) 144.33 Conservation Before Shortage 89.97 (226.51) (5.53) 162.20 Water Supply (88.36) (420.49) (41.62) 38.76 Reservoir Storage 742.48 272.25 34.90 1,417.97
11

Environmental Consequences Chapter 4
February 2007 4-224 Draft EIS – Colorado River Interim Guidelines for
Lower Basin Shortages and Coordinated Operations for Lake Powell and Lake Mead
1 Table 4.11-14
Change in Hoover Powerplant Total Economic Value of Electrical Power Generated (Percent)
Alternatives Mean Median 90th Percentile 10th Percentile Basin States 1.03 (2.95) (0.12) 4.02 Conservation Before Shortage 1.22 (2.67) (0.05) 4.52 Water Supply (1.2) (4.96) (0.40) 1.08 Reservoir Storage 10.10 3.21 0.33 39.48
2
In general, the Reservoir Storage Alternative provides the greatest increase in electrical 3 power generation value at Hoover Powerplant, while the Water Supply Alternative 4 proves most adverse to power generation. The Basin States and Conservation Before 5 Shortage alternatives show similar results and they are ranked between the Reservoir 6 Storage Alternative and the Water Supply Alternative in their effect on power resources 7 at Hoover Powerplant. 8
4.11.2.3 Parker and Davis Powerplants 9 10
No Action Alternative. The No Action Alternative values for annual energy generation, 11 monthly generation capacity, and total economic value for Parker and Davis Powerplants 12 for the mean, median, 90th percentile and 10th percentile values are presented in 13 Table 4.11-15. 14
Table 4.11-15 No Action Alternative Values at Parker and Davis Powerplants
Measure Mean Median 90th Percentile 10th Percentile
Annual Energy Generation (MWh) 1,618,736 1,559,622 1,812,884 1,483,907
Monthly Capacity (MW) 331 364 364 286 Economic Value of Electrical Power Generation - Total (PV (2008 $ millions) 2,243 2,258 2,357 2,129
15
Comparison of Action Alternatives to No Action Alternative. Table 4.11-16 presents the 16 change in annual electrical energy generation in MWh for each action alternative, in 17 comparison to the No Action Alternative, for the mean, median, 90th percentile and 10th 18 percentile values. 19

Chapter 4 Environmental Consequences
Draft EIS – Colorado River Interim Guidelines for Lower Basin Shortages and Coordinated Operations for Lake Powell and Lake Mead
4-225 February 2007
1 Table 4.11-16
Change in Parker and Davis Powerplants Annual Electrical Energy Generation (MWh)
Alternatives Mean Median 90th Percentile 10th Percentile
Basin States (9,318) (8,328) (3,969) (10,010)
Conservation Before Shortage (11,210) (12,258) (846) (10,392)
Water Supply 1,593 14,085 (13,162) 2,728
Reservoir Storage (18,252) (24,034) 25,035 (22,156)
2
Table 4.11-17 presents the percent change in generation between the No Action 3 Alternative and the action alternatives for the Parker and Davis Powerplants. 4
Table 4.11-17 Change in Parker and Davis Powerplants Annual Electrical Energy Generation (Percent)
Alternatives Mean Median 90th Percentile 10th Percentile Basin States (0.58) (0.53) (0.22) (0.67) Conservation Before Shortage (0.69) (0.79) (0.05) (0.70) Water Supply 0.10 0.90 (0.73) 0.18 Reservoir Storage (1.1) (1.5) 1.4 (1.5)
5
Table 4.11-18 shows that no changes are anticipated in monthly generation capacity 6 under the action alternatives. 7
Table 4.11-18 Change in Parker and Davis Powerplants Monthly Generation Capacity (MW)
Alternatives Mean Median 90th Percentile 10th Percentile Basin States 0.0 0.0 0.0 0.0 Conservation Before Shortage 0.0 0.0 0.0 0.0 Water Supply 0.0 0.0 0.0 0.0 Reservoir Storage 0.0 0.0 0.0 0.0
8
Figure 4.11-3 and Figure 4.11-4 depict average values of annual electrical energy 9 production for the Davis Powerplant and the Parker Powerplant, respectively, comparing 10 the No Action Alternative and the action alternatives. 11

Environmental Consequences Chapter 4
February 2007 4-226 Draft EIS – Colorado River Interim Guidelines for
Lower Basin Shortages and Coordinated Operations for Lake Powell and Lake Mead
1
2 Figure 4.11-3
Davis Powerplant Average Values of Annual Electrical Energy Production
1,000
1,020
1,040
1,060
1,080
1,100
1,120
1,140
1,160
1,180
2005 2010 2015 2020 2025 2030 2035 2040 2045 2050 2055 2060Year
GW
h
No ActionBasin StatesConservation Before ShortageWater SupplyReservoir Storage
Figure 4.11-4
Parker Powerplant Average Values of Annual Electrical Energy Production
450
460
470
480
490
500
510
520
530
2005 2010 2015 2020 2025 2030 2035 2040 2045 2050 2055 2060Year
GW
h
No ActionBasin StatesConservation Before ShortageWater SupplyReservoir Storage
\

Chapter 4 Environmental Consequences
Draft EIS – Colorado River Interim Guidelines for Lower Basin Shortages and Coordinated Operations for Lake Powell and Lake Mead
4-227 February 2007
Economic value comparisons between the No Action Alternative and the action 1 alternatives are presented in Table 4.11-19. 2
Table 4.11-19 Change in Parker and Davis Powerplants Total Economic Value of Electrical Power Generation (PV 2008 $ million)
Alternatives Mean
Median
90th Percentile
10th Percentile
Basin States (12.39) (11.32) (10.17) (12.05
Conservation Before Shortage (16.43) (18.14) (11.09) (16.26)
Water Supply 6.23 7.90 1.46 10.73
Reservoir Storage (36.91) (33.95) (26.16) (50.50)
3
Table 4.11-20 presents the change in economic value between the No Action Alternative 4 and each of the action alternatives. 5
Table 4.11-20 Change in Parker and Davis Powerplants Total Economic Value of Electrical Power Generated (Percent)
Alternatives Mean Median 90th Percentile 10th Percentile Basin States (0.55) (0.50) (0.43) (0.57) Conservation Before Shortage (0.73) (0.80) (0.47) (0.76) Water Supply 0.28 0.35 0.06 0.50 Reservoir Storage (1.6) (1.5) (1.1) (2.4)
6
In general, the Basin States and Conservation Before Shortage alternatives could 7 potentially provide a slight decline in the economic value of electrical power generated at 8 the Parker and Davis Powerplants. The Reservoir Storage Alternative is expected to 9 result in a greater decline in economic values. The Water Supply Alternative results in 10 slight increases in economic value for the Parker and Davis Powerplants. 11
Because of downstream requirements (i.e., environmental, plant operations and water 12 requirements) the forebay elevations at Davis and Parker Dam Powerplants remain 13 relatively constant and electrical power generation is proportional to inflow. 14 Consequently, the maximum generation capacity at the Parker and Davis Powerplants 15 will not be affected by the any of the action alternatives. 16

Environmental Consequences Chapter 4
February 2007 4-228 Draft EIS – Colorado River Interim Guidelines for
Lower Basin Shortages and Coordinated Operations for Lake Powell and Lake Mead
4.11.2.4 Headgate Rock Powerplant 1 2
No Action Alternative. The No Action Alternative values for annual generation and 3 economic value at Headgate Rock Powerplant for the mean, median, 90th percentile and 4 10th percentile values are presented in Table 4.11-21. 5
Table 4.11-21 No Action Alternative Values at Headgate Rock Power Plant
Measure Mean Median 90th Percentile 10th Percentile Annual Energy Generation (MWh) 77,386 73,666 85,452 69,634 Economic Value of Electrical Power Generation (PV 2008 $) 102,892,840 98,096,022 113,356,265 92,748,408
6
Comparison of Action Alternatives to No Action Alternative. Table 4.11-22 presents the 7 change in annual generation for each action alternative relative to the No Action 8 Alternative. The Water Supply Alternative provides higher median electrical energy 9 generation due to the higher observed flows as compared to the No Action Alternative. 10 The Basin States, Conservation Before Shortage, and Reservoir Storage alternatives 11 provided lower electrical energy generation as compared to the No Action Alternative. 12
Table 4.11-22 Change in Headgate Rock Powerplant Annual Electrical Energy Generation (MWh)
Alternatives Mean Median 90th Percentile 10th Percentile Basin States (934) (956) (438) (1,223) Conservation Before Shortage (1261) (1,187) (415) (1,853) Water Supply (222) 161 (999) 69 Reservoir Storage (1,366) (2,084) 556 (2,371)
13
Table 4.11-23 presents the percent change in annual electrical energy generation for each 14 action alternative relative to the No Action Alternative. 15
Table 4.11-23 Change in Headgate Rock Powerplant Annual Electrical Energy Generation (Percent)
Alternatives Mean Median 90th Percentile 10th Percentile Basin States (1.2) (1.3) (0.51) (1.8) Conservation Before Shortage (1.6) (1.6) (0.49) (2.7) Water Supply (0.29) 0.22 (1.2) 0.10 Reservoir Storage (1.8) (2.8) 0.65 (3.4)
16

Chapter 4 Environmental Consequences
Draft EIS – Colorado River Interim Guidelines for Lower Basin Shortages and Coordinated Operations for Lake Powell and Lake Mead
4-229 February 2007
Figure 4.11-5 depicts average values of annual electrical energy production for Headgate 1 Rock Powerplant, comparing the No Action Alternative and the action alternatives. 2
Table 4.11-24 provides an overview of the potential change in economic value 3 of electrical power generated for each action alternative relative to the No 4 Action Alternative. 5
Table 4.11-24 Change in Headgate Rock Powerplant Total Economic Value of Electrical Power Generated (PV 2008 $ million)
Alternatives Mean Median 90th Percentile 10th Percentile Basin States (1.3) (1.4) (0.5) (1.9) Conservation Before Shortage (2.0) (1.9) (0.6) (3.1) Water Supply (0.20) 0.26 (1.3) 0.18 Reservoir Storage (2.6) (3.7) 0.8 (4.3)
6
7
Figure 4.11-5 Headgate Rock Powerplant
Average Values of Electrical Energy Production
60,000
65,000
70,000
75,000
80,000
85,000
90,000
100 ,000
2005
2010 2015
2020
2025 2030 2035
2040 2045
2050
2055
2060
Year
MW
h
No Action Basin States Conservation Before Shortage Water Supply Reservoir Storage
95,000

Environmental Consequences Chapter 4
February 2007 4-230 Draft EIS – Colorado River Interim Guidelines for
Lower Basin Shortages and Coordinated Operations for Lake Powell and Lake Mead
Table 4.11-25 provides an overview of the potential percent change in economic 1 value of electrical power generated for each action alternative relative to the No 2 Action Alternative. 3
Table 4.11-25 Change in Headgate Rock Powerplant Total Economic Value of Electrical Power Generated (Percent)
Alternatives Mean Median 90th Percentile 10th Percentile Basin States (1.3) (1.4) (0.44) (2.0) Conservation Before Shortage (1.9) (1.9) (0.53) (3.3) Water Supply (0.19) 0.27 (1.2) 0.20 Reservoir Storage (2.5) (3.8) 0.71 (4.6)
4
In general, the value of electrical power generated under the Water Supply Alternative 5 could potentially be slightly higher than under the No Action Alternative. The value of 6 electrical power generated under the Basin States, Conservation Before Shortage, and 7 Reservoir Storage alternatives could potentially be less than under the No Action 8 Alternative. 9
Currently the Headgate Rock Powerplant generates more electrical power than is needed 10 by CRIT. Implementation of either of the action alternatives will not impact the Headgate 11 Rock Powerplant’s ability to meet CRIT’s current electrical power demands. However, a 12 reduction in Headgate Rock Powerplant generation could impact BIA’s ability to meet 13 new Tribal energy demands. 14
4.11.2.5 Basin Power Funds 15 16
Upper Colorado River Basin Fund. As noted in section 3.11, approximately $175 million is 17 needed each year to fund Reclamation and Western operating needs. Western is 18 responsible for transmission and marketing of CRSP power, collecting payment for the 19 power, and the transfer of revenues for repayment to the General Treasury. 20
Implementation of the various alternatives could result in more variation in the Upper 21 Colorado River Basin Fund (Basin Fund), and could lead to additional actions such as 22 power rate adjustments, rate surcharges, or reductions to customer allocations to 23 respond to shortfalls in revenue under dry conditions. Western and its power customers 24 need to quickly respond to changing hydrological conditions to forestall possible 25 financial problems. 26

Chapter 4 Environmental Consequences
Draft EIS – Colorado River Interim Guidelines for Lower Basin Shortages and Coordinated Operations for Lake Powell and Lake Mead
4-231 February 2007
In addition, if an alternative were to increase or decrease Glen Canyon Powerplant 1 electrical power generation over an extended period of time, Western and its power 2 customers might decide to increase or decrease allocations in response, which could, in 3 turn, affect the rate Western charges for the power and its financial reserves in the Basin 4 Fund. A rate increase could affect customers’ generation and power purchase decisions as 5 well as their overall financial condition. 6
An important aspect associated with power delivery is whether and how much one or 7 more of the alternatives alters the probability of a total loss of generation from Glen 8 Canyon Powerplant. Loss of Glen Canyon Powerplant generation would result in a loss 9 of revenue to Western, Reclamation, and various environmental programs in the Upper 10 Basin; loss of generation and replacement costs for power customers; and degradation to 11 power system reliability. 12
Figure 4.11-6 shows the percentage of end-of-March elevations from Reclamation’s 13 CRSS modeling output that are less than or equal to elevation 3,490 feet msl. March 14 typically has the lowest reservoir elevation of the year and elevation 3,490 feet msl is the 15 point at which electrical power can no longer be produced at the Glen Canyon 16 Powerplant. Using this measure, the Water Supply Alternative is more likely to provide 17 conditions that would result in the Lake Powel elevation falling below the minimum 18 power pool elevation of 3,490 feet msl, as compared to the No Action Alternative. The 19 Reservoir Storage, Basin States, and Conservation Before Shortage alternatives have 20 equal or slightly lower probabilities than the No Action Alternative. An analysis of end-21 of-July elevations indicated that these values are less pronounced than the end-of-March 22 elevations, but similar. 23
Lower Colorado River Basin Development Fund. The functions of the Development Fund are 24 to collect revenues and repayment associated with CAP, and to fund expenses related to 25 the Colorado River Salinity Control Program and projects as directed by the Arizona 26 Water Rights Settlements Act (P.L. 108-451). 27
An important aspect associated with power delivery is whether and how much one or 28 more of the alternatives alters the probability of a total loss of generation from the 29 Hoover Powerplant. Loss of Hoover Powerplant generation would result in a loss of 30 revenue to Western, Reclamation and various environmental programs in the Lower 31 Basin; loss of generation and replacement costs for power customers; and, degradation to 32 power system reliability. 33
Figure 4.11-7 shows the percentage of end-of-December elevations from Reclamation’s 34 CRSS modeling output that are less than or equal to elevation 1,050 feet msl. This 35 elevation is the point at which it is currently assumed that power can no longer be 36 produced at the Hoover Powerplant. 37
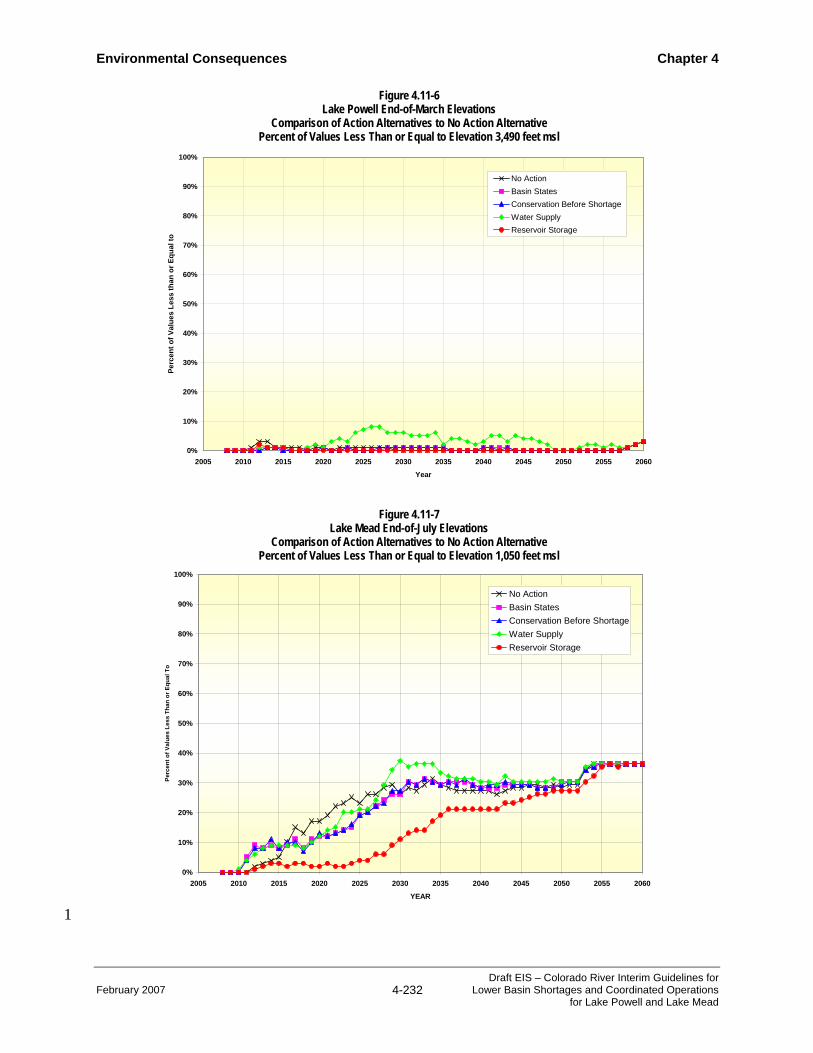
Environmental Consequences Chapter 4
February 2007 4-232 Draft EIS – Colorado River Interim Guidelines for
Lower Basin Shortages and Coordinated Operations for Lake Powell and Lake Mead
1
Figure 4.11-6 Lake Powell End-of-March Elevations
Comparison of Action Alternatives to No Action Alternative Percent of Values Less Than or Equal to Elevation 3,490 feet msl
0%
10%
20%
30%
40%
50%
60%
70%
80%
90%
100%
2005 2010 2015 2020 2025 2030 2035 2040 2045 2050 2055 2060
Year
Perc
ent o
f Val
ues
Less
than
or E
qual
toNo ActionBasin StatesConservation Before ShortageWater SupplyReservoir Storage
Figure 4.11-7 Lake Mead End-of-July Elevations
Comparison of Action Alternatives to No Action Alternative Percent of Values Less Than or Equal to Elevation 1,050 feet msl
0%
10%
20%
30%
40%
50%
60%
70%
80%
90%
100%
2005 2010 2015 2020 2025 2030 2035 2040 2045 2050 2055 2060
YEAR
Perc
ent o
f Val
ues
Less
Tha
n or
Equ
al T
o
No ActionBasin StatesConservation Before ShortageWater SupplyReservoir Storage

Chapter 4 Environmental Consequences
Draft EIS – Colorado River Interim Guidelines for Lower Basin Shortages and Coordinated Operations for Lake Powell and Lake Mead
4-233 February 2007
Using this measure, the Water Supply Alternative is slightly more prone to fall below the 1 minimum power pool than the No Action Alternative, while the Basin States and 2 Conservation Before Shortage alternatives have equal or slightly lower probabilities than 3 the No Action Alternative. The Reservoir Storage Alternative has much lower 4 probabilities of falling below this elevation. Values for end-of-December elevations are 5 less pronounced, but similar. 6
Any of the alternatives that reduce electrical power production would reduce the 7 surcharge revenues available to defray costs associated with the Colorado River Basin 8 Salinity Control Act (Title II) and the CAP repayment. 9
Colorado River Dam Fund. The Colorado River Dam Fund (Dam Fund) is utilized to fund 10 operation and maintenance payments to states, visitor services, up-rating program, 11 replacements, investment repayment and interest expenses of the Boulder Canyon 12 Project. The Annual Revenue Requirement is typically approximately $60 to $70 million 13 per fiscal year. 14
Since implementation of the various alternatives could result in more variation in the 15 Dam Fund cash reserves, this could lead to additional actions, such as power rate 16 adjustments, or reductions to contractors allocations to respond to shortfalls in capacity, 17 energy and revenues under dry conditions. 18
4.11.2.6 System-Wide Electrical Power Issues 19 20
Conservation Before Shortage Surcharge. The Conservation Before Shortage Alternative 21 imposes a power customer surcharge that is expected to amount to between $1.5 million 22 and $12.3 million depending on the level of a voluntary water conservation shortage 23 implemented in a particular year (e.g. 400,000, 500,000, or 600,000 af) and the cost of 24 conserved water. The surcharge on a 600,000 af declared shortage is to cover at a 25 minimum the cost of 122,500 af of water. It is estimated that this would cost between 26 $20 - $100 per af. 27
This surcharge is not included in the current economic analysis at any of the Upper or 28 Lower Basin facilities or Basin Funds. Surcharges imposed are typically not included 29 within Western's or Reclamation's electrical power rate structure. For example, the 30 current 4.5 mil and the 2.5 mil rate imposed on Hoover Powerplant and P-DP power 31 contractors to help repay Reclamation’s CAP project construction costs and to provide 32 funding for salinity projects are a separate part of the contractor’s bill. 33
Imposing a surcharge on power revenues would require separate legislation. Rate making 34 authority, except for Reclamation project use power, lies with Western, therefore such 35 changes would be under the purview of the Secretary of the Department of Energy and 36 the United States Congress. 37

Environmental Consequences Chapter 4
February 2007 4-234 Draft EIS – Colorado River Interim Guidelines for
Lower Basin Shortages and Coordinated Operations for Lake Powell and Lake Mead
Ancillary Service Impacts. In addition to generating electrical power, each of the power 1 generation facilities in the study area provides other electrical products and services 2 referred to as ancillary services. Ancillary services are those services necessary to keep 3 the power grid functioning continuously, safely, and reliably. 4
Western, as an operator of multiple control areas (referred to also as balancing 5 authorities), is required by the Federal Energy Regulatory Commission to offer ancillary 6 services to entities purchasing transmission services in its control areas. Entities 7 purchasing transmission are required to self supply ancillary services or purchase 8 ancillary services from third parties. The Hoover Powerplant capacity and energy is 9 dynamically scheduled to the contractors which allows certain ancillary services to be 10 utilized in other control areas. The Hoover Powerplant is also a significant source of 11 reserves, regulation and frequency control for non-Western control areas in California, 12 Arizona, and Nevada. 13
Reserves. Because of low load factors at the Glen Canyon Powerplant and the Hoover 14 Powerplant, at any given time there are hundreds of megawatts of spinning or 15 supplemental reserves that can be called on to respond to generating unit outages and 16 power system emergencies. The available unscheduled capacity at Davis Powerplant and 17 Parker Powerplant is used primarily for reserves. In addition, the generation units at 18 Davis Powerplant have a portion of their capacity that are used exclusively for reserves. 19
Action alternatives that reduce or eliminate capacity at the Glen Canyon Powerplant and 20 the Hoover Powerplant will reduce or eliminate reserve capacity as well, impacting 21 reliability of the power system, and impacting revenue to Western or specific projects. 22 None of the proposed alternatives are expected to have a significant impact on reserves at 23 Davis Powerplant and Parker Powerplant since the associated lake elevations are not 24 affected. A reduction in electrical power production at these powerplants would create a 25 slight increase in the average reserve capacity available. 26
Regulation and Frequency Control. Regulation and frequency control is needed to maintain 27 power system stability and the moment-to-moment balance between load and generation. 28 Reductions in electrical power generation from the Glen Canyon Powerplant and the 29 Hoover Powerplant would impact the ability of the powerplants to provide regulation 30 services. Although the generating units are able to regulate throughout most of their 31 operating range, the amount of regulation available decreases as generating capability 32 decreases. 33
The Hoover Powerplant is primarily used to provide regulation for the control area. 34 However, the Davis Powerplant has some capability for regulation and frequency control, 35 but the available unscheduled capacity at the Davis Powerplant is used almost exclusively 36 for reserves. 37
Any of the alternatives that cause the Glen Canyon Powerplant or the Hoover Powerplant 38 to stop generating completely due to low reservoir elevation (below the minimum power 39 pool elevation), could potentially eliminate regulation as well. As shown on Figures 4.11-40
Chapter 4 Environmental Consequences
Draft EIS – Colorado River Interim Guidelines for Lower Basin Shortages and Coordinated Operations for Lake Powell and Lake Mead
4-235 February 2007
6 and 4.11-7, the Water Supply Alternative poses the greatest risk to regulation and 1 frequency control at the Glen Canyon and Hoover Powerplants. 2
Reactive Supply and Voltage Control. Reactive power is power required to “charge” the 3 transmission lines and associated electrical equipment that comprise the power grid. 4 Unlike other ancillary services that can assist the power system over large geographical 5 areas, reactive supply and voltage control are limited to small areas. Glen Canyon 6 Powerplant supplies reactive power to northern Arizona and southern Utah. For the 7 Hoover Powerplant, that area would include northwestern Arizona, Southern Nevada and 8 southeastern California. Without an adequate supply of reactive power and constant 9 monitoring, power system voltages can increase or decrease beyond acceptable limits, 10 leading to system instability, cascading outages, and damage to electrical equipment. 11
Black Start Capability. Black Start Service, also referred to as Startup Service consists of 12 providing the electrical power needed to start up a generating plant, usually after a 13 system emergency (e.g. large scale blackout) that causes loss of electricity from the 14 generating station. 15
The Glen Canyon Powerplant is relied upon to provide black start capability to the power 16 system. The Hoover Powerplant is relied upon to provide the same capability to the 17 power system and also for Palo Verde Nuclear Generating Station located outside of 18 Phoenix, Arizona. Similar to regulation and frequency control, the Water Supply 19 Alternative is most prone to cause the Glen Canyon Powerplant and Hoover Powerplant 20 to stop generating completely due to low reservoir elevation conditions. The Davis 21 Powerplant and Parker Powerplant do not provide Black Start Service. 22
Contract Commitments. Western contracts with preference power customers to supply firm 23 energy and capacity. Currently, about 243 municipalities, rural electric cooperatives, 24 Indian tribes, irrigation districts, and state and federal facilities in Arizona, Nevada, New 25 Mexico, Colorado, Utah, and Wyoming are served from Salt Lake City Area Integrated 26 Project (SLCA/IP) power facilities, which includes the Glen Canyon Powerplant. The 27 Hoover Powerplant contractors have an allocation from Western for a specific quantity of 28 contingent capacity and associated firm energy. 29
At the Glen Canyon Powerplant, the current contracts went into effect in October, 2004 30 and extend through September, 2024. At the Hoover Powerplant, the current contracts 31 went into effect in June, 1987 and extend through September, 2017. For the P-DP, current 32 contracts went into effect in October, 1988 and extend through September, 2008. Western 33 is near concluding the process of finalizing these contractual commitments through 34 September 2028. 35
Each contractor has an allocation from Western for a specific quantity of energy and 36 capacity each month. Western guarantees that the minimum quantity of energy will be 37 available for contractors, and purchases power to meet that level whenever hydropower 38 generation is insufficient to supply the required amount (referred to as firming 39 purchases). Hydropower generation above the minimum level is also allocated to 40 contractors on an as-available basis as operational and hydrological conditions allow. 41

Environmental Consequences Chapter 4
February 2007 4-236 Draft EIS – Colorado River Interim Guidelines for
Lower Basin Shortages and Coordinated Operations for Lake Powell and Lake Mead
As has been described earlier in this section, an alternative may increase or decrease 1 energy generation and capacity at the Glen Canyon Powerplant or the Hoover 2 Powerplant. Western has the ability to modify its contract commitments to its electrical 3 power customers when a change in the volume of water released at these dams results in 4 changes in electrical generation and capacity. For example, if an alternative reduced 5 energy generation and capacity at the Glen Canyon Powerplant over the long-term 6 average, Western would have the ability to lower its contract commitments to those 7 customers who have contracts that include Glen Canyon Powerplant electrical power. 8 The lower commitments would cause these customers (electrical utilities) to add new 9 generating facilities, speed up planned construction of new generating facilities or take 10 other action to make up for the reduction in Western's contract commitment. The 11 estimated values of these actions by customers are what is portrayed in the tables in 12 this section. 13
Energy and capacity allocations to contractors can be revised when the contracts are 14 renewed. Allocations to contractors after contract terms expire will depend upon 15 projections of future capacity and energy. 16
4.11.2.7 Electrical Power Use Associated with Water Supply Systems 17 This section discusses potential changes in pumping costs for the following entities that 18 pump water from Lake Powell: the NGS which obtains cooling water from Lake Powell, 19 the City of Page which obtains municipal water from Lake Powell; SNWA which obtains 20 water from Lake Mead; and CAP and MWD which divert water from Lake Havasu. 21 Incremental differences in pumping costs are associated with differences in modeled 22 average Lake Powell, Lake Mead, and Lake Havasu elevations between the No Action 23 Alternative and the action alternatives. 24
River system modeling provided the average elevations for Lake Powell, Lake Mead, and 25 Lake Havasu under the No Action Alternative and the action alternatives. Increases or 26 decreases in net effective pumping head correspond with decreases or increases in 27 reservoir elevations. Estimates of the differences in pumping costs were calculated using 28 these changes in pumping head, as well as estimates of annual pumping volumes, unit 29 electrical power costs and pump efficiency. 30
Navajo Generating Station. The SRP estimates that water use at NGS will be approximately 31 29,000 afy in the future. Power for the intake pumps is obtained from auxiliary power 32 units at the NGS at a cost of $0.0104 per kWh. Table 4.11-26 identifies changes in 33 electrical power requirements for the alternatives and the associated increase or decrease 34 in cost. 35

Chapter 4 Environmental Consequences
Draft EIS – Colorado River Interim Guidelines for Lower Basin Shortages and Coordinated Operations for Lake Powell and Lake Mead
4-237 February 2007
1 Table 4.11-26
Change in Navajo Generating Station Intake Electrical Power Requirements at Lake Powell 1
Alternatives Change in Annual Electrical Power Requirement (kWh)2
Change in Associated Annual Cost ($)
Basin States 124,365 $1,293 Conservation Before Shortage 114,167 $1,187 Water Supply 277,648 $2,888 Reservoir Storage (75,925) ($790)
1. Assumes 29,000 afy of Pumping, Cost = E (kWh) = $0.0104 2. E (kwh) = 1.024 * V (afy) * H (ft)/E (%)
2
City of Page Water Supply. As noted in Section 3.12, the average annual water demand by 3 the City of Page in recent years has been around 2,650 afy. Annual electrical power 4 demand to deliver the water has averaged around 3,900,000 kWh per year over the past 5 10 years. Under the No Action Alternative, using the current rate of $.03286 per kWh 6 (includes overhead), the annual cost of electrical power for pumping the water is around 7 $130,000 per year. 8
Table 4.11-27 summarizes the differences in pumping costs for the Reclamation-operated 9 raw water intake serving the City of Page. The greatest increase would be under the 10 Water Supply Alternative which would be an average $829 per year or, in comparison to 11 the total annual the No Action Alternative cost of $130,000, an approximate increase of 12 less than one percent. In general the effect on City of Page pumping costs would be 13 minor under all alternatives. 14
Table 4.11-27 Change in City of Page Intake Electrical Power Requirements at Lake Powell 1
Alternatives Change in Annual Electrical Power Requirement (kWh)2
Change in Associated Annual Cost ($)
Basin States 11,364 $371 Conservation Before Shortage 10,433 $341 Water Supply 25,371 $829 Reservoir Storage (6,938) ($227)
1. Assumes 2,650 afy of Pumping, Cost = E (kWh) = $0.03286 2. E (kWh) = 1.024 * V (afy) * H (ft) / E(%)
15
SNWA Water Supply. Pumping costs under the No Action Alternative were not calculated. 16 However, under the No Action Alternative, the average elevation of Lake Mead declines 17 from 2008 through 2060. Also, the chance that lake elevations could drop below the 18 minimum power pool elevation of 1,050 feet msl increases for all alternatives, with the 19 Reservoir Storage Alternative resulting in the smallest increase in probability. These 20

Environmental Consequences Chapter 4
February 2007 4-238 Draft EIS – Colorado River Interim Guidelines for
Lower Basin Shortages and Coordinated Operations for Lake Powell and Lake Mead
results also suggest that under the No Action Alternative, SNWA can expect pumping 1 costs to increase due to the increase in net effective pumping head. The cost of pumping 2 varies with each of the action alternatives as an increase or decrease compared to the No 3 Action Alternative. Table 4.11-28 shows the potential differences between pumping costs 4 under the action alternatives to those under the No Action Alternative. 5
Table 4.11-28 Change in Estimated SNWA Pumping Costs
Alternative Change in Cost ($)
Basin States (45,560.76)
Conservation Before Shortage (68,341.14)
Water Supply 273,364.56
Reservoir Storage (1,870,198.68)
6
The change in pumping costs shown in Table 4.11-28 consider the difference in the 7 average of the 50th percentile (median) Lake Mead annual elevation values from 2008 to 8 2060 under each action alternative to that of the No Action Alternative. The differences 9 in the average of the median elevations (between each action alternative and the No 10 Action Alternative) was multiplied by the estimated annual SNWA combined pumping 11 costs for the two SNWA intake pump stations (Levy 2006 personal communication) 12 corresponding to the respective Lake Mead elevations. A positive number in Table 4.11-13 28 indicates an increase in annual SNWA pumping costs and a negative number (in 14 parenthesis) indicates a potential savings in annual SNWA pumping costs. 15
CAP Pumping Load. Under all alternatives, when shortages are imposed on CAP there is 16 an associated reduction in electrical power requirements to pump water and more of 17 CAP’s share of NGS generation is available to be marketed (after 2011). For a 500,000 af 18 shortage (at $48/MWh), the annual market value of the electrical power available to be 19 marketed is approximately $41 million. 20
This revenue would benefit all CAP users to the extent it would be used to offset 21 CAWCD’s repayment obligation, as well as Indian tribes that benefit from the AWSA. 22 The Reservoir Storage Alternative would result in the greatest overall shortages, and 23 therefore the greatest reduction in CAP pumping load. 24
4.11.2.8 Summary Comparison of Alternatives 25 Table 4.11-29 summarizes effects of each of the action alternatives compared to the No 26 Action Alternative for electrical energy generation, generation capacity, and associated 27 economic effects. 28

Chapter 4 Environmental Consequences
Draft EIS – Colorado River Interim Guidelines for Lower Basin Shortages and Coordinated Operations for Lake Powell and Lake Mead
4-239 February 2007
1 Table 4.11-29
Summary Comparison of Action Alternatives to No Action Alternative Mean Values for Electrical Energy Generation, Generation Capacity, and Economic Value
No Action Basin States Conservation Before Shortage Water Supply Reservoir
Storage
Glen Canyon Powerplant Annual Energy Generation (MWh) 4,265,749 4,255,233 4,256,656 4,169,950 4,292,417
Change in Annual Energy Generation (MWh) 0.0 (10,516) (9,093) (95,799) 26,668
Change in Annual Energy Generation (Percent) 0.0 (0.25) (0.21) (2.2) 0.63
Monthly capacity (MW) 603 606 607 592 613
Change in Monthly Capacity (MW) 0.0 3.4 3.6 (11.2) 9.6
Change in Monthly Capacity (Percent) 0.0 0.57 0.60 (1.9) 1.6
Economic Value of Electrical Power Generation – Total (PV 2008 $ Million) 6,808 6,803 6,805 6,669 6,870
Change in present value of Electrical Power Generation (PV 2008 $ Million) 0.0 (4.72) (2.79) (139.27) 62.43
Change in Present Value of Electrical Power Generation (Percent) 0.0 (0.07) (0.04) (2.05) 0.92
Hoover Powerplant Annual Energy Generation (MWh) 3,156,820 3,171,189 3,175,390 3,108,539 3,430,839
Change in Annual Energy Generation (MWh) 0 14,369 18,570 (48,281) 274,019
Change in Annual Energy Generation (Percent) 0.0 0.46 0.59 (1.5) 8.7
Monthly capacity (MW) 1,201 1,214 1,217 1,178 1,337
Change in Monthly Capacity (MW) 0.0 12.7 15.5 (22.9) 136.0
Change in Monthly Capacity (Percent) 0.0 1.1 1.3 (1.9) 11.3
Economic Value of Electrical Power Generation – Total (PV 2008 $ Million) 7,351 7,426 7.441 7,263 8,093
Change in present value of Electrical Power Generation (PV 2008 $ Million) 0.0 75.4 90.0 (88.4) 742.5
Change in Present Value of Electrical Power Generation (Percent) 0.0 1.03 1.22 (1.2) 10.1
2

Environmental Consequences Chapter 4
February 2007 4-240 Draft EIS – Colorado River Interim Guidelines for
Lower Basin Shortages and Coordinated Operations for Lake Powell and Lake Mead
1 Table 4.11-29
Summary Comparison of Action Alternatives to No Action Alternative Mean Values for Electrical Energy Generation, Generation Capacity, and Economic Value
No Action Basin States Conservation Before Shortage Water Supply Reservoir
Storage
Parker and Davis Powerplant Annual Energy Generation (MWh) 1,618,736 1,609,419 1,607,527 1,620,329 1,600,484
Change in Annual Energy Generation (MWh) 0 (9,318) (11,210) 1,593 (18,253)
Change in Annual Energy Generation (Percent) 0.0 (0.58) (0.69) 0.10 (1.1)
Monthly capacity (MW) 331.4 331.4 331.4 331.4 331.4
Change in Monthly Capacity (MW) 0 0 0 0 0
Change in Monthly Capacity (Percent) 0.0 0.0 0.0 0.0 0.0
Economic Value of Electrical Power Generation – Total (PV 2008 $ Million) 2,243 2,230 2,226 2,249 2,206
Change in present value of Electrical Power Generation (PV 2008 $ Million) 0.0 (12.4) (16.4) 6.2 (36.9)
Change in Present Value of Electrical Power Generation (Percent) 0.0 (0.55) (0.73) 0.28 (1.6)
Headgate Rock Powerplant Annual Energy Generation (MWh) 77,386 76,452 77,059 78,425 76,242
Change in Annual Energy Generation (MWh) 0 (934) (1,261) (222) 1,366
Change in Annual Energy Generation (Percent) 0.0 (1.2) (1.6) (0.29) (1.8)
Economic Value of Electrical Power Generation – Total (PV 2008 $ Million) 103 102 101 103 100
Change in present value of Electrical Power Generation (PV 2008 $ Million) 0.0 (1.3) (2.0) (0.20) (2.6)
Change in Present Value of Electrical Power Generation (Percent) 0.0 (1.3) (1.9) (0.19) (2.5)
2
4.11.2.9 Generation Facilities 3 4
Glen Canyon and Hoover Powerplants. Table 4.11-29 presents the potential changes in 5 generation, capacity, and economic value of electrical power. The Basin States, 6 Conservation Before Shortage Alternative, and Water Supply alternative result in minor 7 variations for each of these parameters. Because of generally lower elevations, the Water 8 Supply Alternative would have the greatest adverse effect on electrical power production 9 and value. Most of these changes are less than one percent, however, and these 10 alternatives result in both positive and negative variations. Therefore, these impacts are 11 considered minor. The Reservoir Storage Alternative generally results in greater positive 12 changes with respect to electrical power production and value because of higher reservoir 13

Chapter 4 Environmental Consequences
Draft EIS – Colorado River Interim Guidelines for Lower Basin Shortages and Coordinated Operations for Lake Powell and Lake Mead
4-241 February 2007
elevations and would result in moderate beneficial effects, particularly in the case of the 1 Hoover Powerplant. 2
Parker-Davis Project and Headgate Rock Powerplants. These facilities are generally 3 considered to be “run of the river” electrical power generation facilities and are affected 4 primarily by release volumes from Hoover Dam. As shown in Table 4.11-29, the Basin 5 States, Conservation Before Shortage, and Reservoir Storage Alternatives all generally 6 result in minor decreases in electrical power production and value at these facilities as 7 compared to the No Action Alternative because they result in lower release volumes 8 downstream of Hoover Dam, with the Reservoir Storage Alternative having the greatest 9 adverse effects. Again, these changes are relatively minor (most less than one percent). 10 The Water Supply Alternative results in greater release volumes downstream and 11 therefore slight increases in electrical power production and value as compared to the No 12 Action Alternative. These increases are considered beneficial but also minor as compared 13 to overall electrical power production at these facilities. 14
Water Supply Systems. As presented in Table 4.11-29, the Basin States, Conservation 15 Before Shortage, and Water Supply alternatives would generally result in lower 16 elevations at Lake Powell, as compared to the No Action Alternative, and therefore could 17 potentially result in increased pumping costs for the NGS and City of Page, with the 18 Water Supply Alternative resulting in approximately twice the increase in costs as 19 compared to the other action alternatives 20
The Reservoir Storage Alternative would result in generally higher reservoir elevations 21 and therefore reduced pumping costs as compared to the No Action Alternative. This 22 beneficial effect is also considered minor. 23
Basin Power Funds. Reductions in power revenues could reduce the amount of money 24 available to meet the intended uses of these funds, possibly leading to reductions in 25 allocations to power contractors or power rate adjustments. The action alternatives 26 generally have a minor impact on the economic value of electrical power generation at 27 Glen Canyon and Hoover Powerplants. However, total loss of electrical power generation 28 capabilities would have a substantial effect on the basin power funds. At the Glen 29 Canyon Powerplant, the probability this type of loss in electrical power generation 30 capability is very small (less than five percent) except for the Water Supply Alternative, 31 which would result in as much as a nine percent probability. At the Hoover Powerplant, 32 the probability of total loss of generation is higher, increasing from the current negligible 33 probability to about 30 percent in 2026. As shown in Figure 4.11-7, the Reservoir Storage 34 Alternative is the exception to this, while the remaining alternatives are very similar to 35 the No Action Alternative. 36
37

Environmental Consequences Chapter 4
February 2007 4-242 Draft EIS – Colorado River Interim Guidelines for
Lower Basin Shortages and Coordinated Operations for Lake Powell and Lake Mead
This page intentionally left blank. 1 2

Chapter 4 Environmental Consequences
Draft EIS – Colorado River Interim Guidelines for Lower Basin Shortages and Coordinated Operations for Lake Powell and Lake Mead
4-243 February 2007
4.12 Recreation 1
This section discusses the recreational resources within the study area that may be affected by 2 the proposed federal action. Topics include: 3
♦ Shoreline public use facilities; 4
♦ Reservoir boating; 5
♦ River and whitewater boating; and 6
♦ Sport fishing. 7
4.12.1 Methodology 8 The following methods were used to determine effects of the alternatives on recreation 9 resources. 10
4.12.1.1 Method Used to Assess Shoreline Public Use Facilities 11 These sections examine the probabilities that reservoir elevations would decrease below 12 critical thresholds for use of selected marinas, boat docks, and boat launch ramps. These 13 sections also assess whether impacts would occur in access to or use of attraction 14 features. Threshold reservoir elevations were determined by reviewing published sources 15 and through personal communication with Reclamation, NPS, and resource specialists, 16 and from public comments provided during scoping for this Draft EIS. The threshold 17 elevations were used as indicators of recreational facilities that might be rendered 18 inoperable or require relocation or modification to maintain their operation. Projections 19 of reservoir elevations for 2008, 2016, 2025, 2040, 2050, and 2060 are provided in 20 Section 4.3. The narrative of effects of the alternatives is provided below for selected 21 facilities in July or September, representing relatively high visitation months for both 22 Lake Powell and Lake Mead. These facilities are representative of potential effects of the 23 alternatives on shoreline recreation opportunities at each reservoir. Results are described 24 for 2026, representing the end of the interim period. For Lake Powell, Wahweap Marina 25 was selected for description in the narrative due to its popularity with boaters. For Lake 26 Mead, Pearce Ferry at the in-flow area to the reservoir is described. Effects on Echo Bay 27 Public Launch Ramp are also described in the narrative because it represents a facility 28 that closes at a relatively low reservoir elevation of 1,050 feet msl. 29
4.12.1.2 Method Used to Assess Reservoir Boating 30 This analysis assesses the probabilities that reservoir elevations would decrease below 31 critical thresholds for boating navigation hazards and change navigable areas and 32 passageways, and whether decreases in reservoir surface area might affect safe boating 33 capacities. Threshold pool elevations were determined by reviewing published sources 34 and through personal communication with Reclamation, NPS, and resource specialists, 35 and from public comments. 36

Environmental Consequences Chapter 4
February 2007 4-244 Draft EIS – Colorado River Interim Guidelines for
Lower Basin Shortages and Coordinated Operations for Lake Powell and Lake Mead
In general, the surface area of the reservoirs available for boating is reduced when the 1 reservoir elevation drops and this may affect the number of boats that can safely operate 2 at one time referred to as safe boating density. Safe boating density could be used to 3 assess the effects of each alternative on boating safety if daily boating levels for the 4 reservoirs were available. However, recent and consistent information on the level of 5 daily or peak boating use, such as whether the current boating densities on the reservoirs 6 have approached or exceeded the safe boating density is not available. Without 7 information on current reservoir boating densities, it cannot be determined whether any 8 reductions in pool elevations at Lake Powell and Lake Mead associated with the 9 alternatives would result in unsafe boating conditions due to a corresponding increase in 10 boating density. Personal communications with boaters and NPS managers suggest that 11 Lake Mead and Lake Powell have not exceeded safe boating densities. 12
Navigation hazards and shallow waters require boaters to take detours around 13 inaccessible areas. This may add mileage to trips and may influence recreational boaters 14 to remain in specific areas, which can result in congestion in those areas. Additionally, as 15 reservoir elevations drop and surface area decreases, congestion may become more 16 noticeable in popular areas that receive high-use or where narrow travel corridors exist. 17
4.12.1.3 Method Used to Assess River and Whitewater Boating 18 This analysis uses river flow data from Section 4.3 to analyze whether there would be 19 increased exposures to boating navigation hazards, changes in access or use of rest areas 20 and take-outs, or changes in trip durations resulting from the action alternatives compared 21 to the No Action Alternative. Whitewater boating is the key recreational activity in the 22 Grand Canyon below Lees Ferry and above Lake Mead. Other reaches do not provide 23 whitewater boating opportunities and, therefore, are not addressed. 24
Threshold river flows were determined by reviewing published sources and through 25 personal communication with river managers and from comments received during 26 scoping. These representative river flows were chosen as indicators for whitewater 27 boating safety and the availability of rest areas and take-out points. 28
This analysis also includes a discussion of areas on the river that could become unsafe for 29 whitewater boating at certain flows due to hazards such as exposed rocks, changes in 30 navigation patterns caused by obstructions, and increased or decreased river velocities. 31 These flows were also analyzed to determine elevations at or below which various 32 whitewater boating facilities (rest areas and take-out points) might be rendered inoperable 33 or require modification to maintain their operation. 34
4.12.1.4 Method Used to Assess Sport Fishing 35 This analysis evaluates changes in sport fishing opportunities by reach among the action 36 alternatives compared to the No Action Alternative. The assessment of sport fishing was 37 based on a literature review to determine the current status of fish assemblages in the 38 study area. No specific reservoir pool elevation thresholds related to sport fishing were 39 found. A general discussion about changes in flow and salinity and possible effects on 40 sport fish is also provided. 41

Chapter 4 Environmental Consequences
Draft EIS – Colorado River Interim Guidelines for Lower Basin Shortages and Coordinated Operations for Lake Powell and Lake Mead
4-245 February 2007
A more detailed analysis of effects to rainbow trout based on changes in water 1 temperature is used for the Colorado River reach between Glen Canyon Dam and Lake 2 Mead. Water temperature changes may affect sport fish. Rainbow trout were chosen for 3 the analysis based on the importance of its recreational fishery in the Colorado River 4 reach below Glen Canyon Dam. 5
Striped bass and threadfin shad in Lake Powell and Lake Mead were selected to represent 6 the reservoir sport fishery; striped bass are a sports fish and threadfin shad are their food 7 source. Striped bass feed on threadfin shad, and when shad are abundant, striped bass are 8 able to reproduce and grow quickly. The resulting increased bass population continues 9 feeding on the threadfin shad, and they deplete the shad populations. Striped bass decline 10 in numbers and predation on shad decreases. This causes the threadfin population to 11 increase again. This cycle has been occurring since the first introduction of striped bass 12 into Lake Powell in 1974 and is expected to continue in the future (Gustaveson 1999). 13
Rainbow trout and its water temperature thresholds were used to analyze potential 14 differences in impacts between the alternatives below Glen Canyon Dam. Minimum, 15 maximum, and lethal water temperatures for various life history stages were determined 16 and months that spawning, incubation and growth occur were established. The 10th 17 percentile data were used to analyze potential effects because the 50th and 90th percentile 18 data are essentially identical between the alternatives and no meaningful differences 19 exist. It is important to note that the 10th percentile elevations are unlikely to occur in any 20 given year or consistently over time (Section 4.2). Modeled temperature data at Glen 21 Canyon Dam, the Little Colorado River confluence, and at Diamond Creek were used in 22 the trout fishery analysis. A qualitative analysis of potential water temperature changes 23 and effects on rainbow trout were made by comparing the differences between water 24 temperatures under the No Action Alternative and the action alternatives. 25
Water Temperature Assessment. Surface minimum and maximum monthly water 26 temperature data (up to 10 feet below the surface) for Lake Powell were provided and 27 compared to striped bass and threadfin shad thresholds to determine whether potential 28 surface temperatures would exceed the lethal tolerances of striped bass or threadfin. 29 Striped bass lower lethal limit is 5°C and upper lethal limit is 33°C. Threadfin shad have 30 an upper lethal limit of 37°C and a lower lethal limit of 5°C. 31
Modeled river temperatures (Section 4.5 and Appendix P) were used to assess the 32 possible effects on rainbow trout in the river section from Glen Canyon Dam to Diamond 33 Creek (Tables 4.5-4 to 4.5-9 and Appendix P). Conditions supporting rainbow trout 34 spawning and incubation were assumed to deteriorate as temperature warms beyond 15ºC 35 (Table 4.12-1). Trout eggs that are subjected to temperatures warmer than 15ºC are prone 36 to increased mortality (Table 4.12-1). Juvenile rearing success is assumed to deteriorate 37 at water temperatures ranging from 17ºC to 25ºC. Rainbow trout can be expected to show 38 significant mortality at temperatures exceeding 25ºC (Myrick and Cech 2001; Raleigh et. 39 al. 1984) (Table 4.12-1). 40

Environmental Consequences Chapter 4
February 2007 4-246 Draft EIS – Colorado River Interim Guidelines for
Lower Basin Shortages and Coordinated Operations for Lake Powell and Lake Mead
Table 4.12-1 Water Temperature Tolerances of Rainbow Trout (oC)
Spawning Incubation Growth Lethal
Species Species Code Minim
um
Maxim
um
Optim
um
Minim
um
Maxim
um
Optim
um
Minim
um
Maxim
um
Optim
um
Low
High
Rainbow Trout RBT 8 13 10 7 15 10 12 21 16 0 25
1
In the Colorado River, rainbow trout are year-round residents. Spawning typically begins 2 in January and continues into May, with peak spawning occurring in March and April 3 (Korman et. al. 2005) (Table 4.12-2). During spawning, the female digs a redd (i.e., 4 gravel nest) where the eggs are deposited, and they are then fertilized by the male. The 5 optimal water temperature for trout spawning and incubation has been reported to fall 6 between 7ºC and 15ºC (Table 4.12-1). Incubation lasts from 1.5 months to 4 months, 7 depending on water temperature (Table 4.12-2). 8
Newly emerged fry move to shallow, protected areas along stream banks, but as they 9 grow, they move to faster, deeper areas of the river. Shallow riffles are the most 10 important channel type for trout during their first year (Barnhart 1986). Juvenile trout 11 generally use riffles and runs in the main and secondary channels, along with the head 12 and tail of pools. Juvenile rearing success is assumed to deteriorate at water temperatures 13 ranging from 17ºC to 25ºC. Juvenile trout feed on a variety of aquatic and terrestrial 14 insects and other small invertebrates. 15
Table 4.12-2 Life History of the Rainbow Trout, Phases by Months
Jan
Feb
Mar
Apr
May
Jun
Jul
Aug
Sep
Oct
Nov
Dec
Phases Citations Spawning 2,4,5 Egg Incubation 2,4,5 Juvenile Rearing 2,4,5 Residence 1, 2, 3
1 Lake Powell n.d. Available at: http://www.waterquality.utah.gov/watersheds/lakes/LAKEPOWL.pdf. Accessed October 27, 2006. 2 GCDAMP (Glen Canyon Dam Adaptive Management Program). n.d. Lees Ferry trout fishery. Available at:
http://www.pn.usbr.gov/keyresc/tf.html. Accessed October 27, 2006. 3 Fishing in Laughlin, Nevada. 2006. Available at: http://www.laughlinnevadaguide.com/fish.htm. Accessed October 27, 2006. 4 Valdez 1993. Non-native fishes of Grand Canyon. Available at: http://www.gcrg.org/bqr/6-4/fishes.htm. Accessed: October 27, 2006. 5 Korman et. al. 2005, 21.
16
Chapter 4 Environmental Consequences
Draft EIS – Colorado River Interim Guidelines for Lower Basin Shortages and Coordinated Operations for Lake Powell and Lake Mead
4-247 February 2007
Salinity Assessment. Salinity levels were assessed below Hoover Dam and it was 1 determined that future salinity levels would not affect rainbow trout (Section 4.5). Striped 2 bass are naturally a brackish to salt water species, so the slight increase in salinity should 3 have no effect on striped bass or threadfin shad. Therefore this issue is not discussed 4 further. 5
Flow Assessment. Flow reductions that occur outside of spawning periods of fish are 6 expected to have minimal impacts on fish species because habitat is likely not a factor 7 limiting their populations. Extreme reductions, however, could result in the loss of fish 8 through stranding and reduction in water quality (e.g., dissolved oxygen, temperature). 9 The abundance of sports fishes, however, would be expected to recover following flow 10 reduction periods through natural reproduction and through augmentations under fish 11 stocking programs. 12
Flow reductions during the spawning period could desiccate eggs or strand juvenile fish. 13 Impacts on sport fishes are expected to be minimal because their populations are 14 relatively large and would be expected to recover following reduced flow conditions 15 through natural reproduction and through augmentations under fish stocking programs. 16
Given that releases from Glen Canyon Dam would remain within their historic range, its 17 was concluded that changes in flow would not be a useful tool to analyze effects on sport 18 fish in this reach of the river. The reaches below Hoover Dam are also expected to 19 continue with operations similar to historic conditions. Therefore flow assessment was 20 not used in this analysis. 21
4.12.2 Recreation at Lake Powell 22 Table 3.12-3 identifies the threshold elevations below which shoreline recreational 23 facilities at Lake Powell could be affected. Below these elevations, facility adjustments or 24 capital improvements would be required, creating potential impacts on recreation at Lake 25 Powell. Figures 4.3-3 through 4.3-11 and Tables 4.3-2 through 4.3-10 show the 26 percentage of values less than or equal to these threshold elevations during the study 27 period. 28
4.12.2.1 Access or Use of Lake Powell Boating Facilities 29 30
No Action Alternative. In July 2026, there is a six percent chance that elevations will be 31 less than 3,560 feet msl, resulting in the closure or modification of Wahweap and lower 32 Bullfrog launch ramps. Table 4.3-7 and Figure 4.3-8 provide the data for all years and all 33 alternatives. 34
Basin States and Conservation Before Shortage Alternatives. In July 2026, there is an eight 35 percent chance of closing Wahweap and lower Bullfrog launch ramps under these two 36 alternatives. 37
Water Supply Alternative. In July 2026, there is a 20 percent chance of closing Wahweap 38 and lower Bullfrog launch ramps under this alternative. 39

Environmental Consequences Chapter 4
February 2007 4-248 Draft EIS – Colorado River Interim Guidelines for
Lower Basin Shortages and Coordinated Operations for Lake Powell and Lake Mead
Reservoir Storage Alternative. In July 2026, there is a two percent chance of closing 1 Wahweap and lower Bullfrog launch ramps under this alternative. 2
4.12.2.2 Safe Boating Capacities and Exposure to Navigation Hazards 3 In general, as reservoir elevations drop, hazards such as submerged snags and boulders 4 can become exposed or are closer to the surface, increasing the likelihood that boats can 5 come in contact with such hazards. The elevations of such hazards are often unknown 6 until they become exposed. At elevation 3,620 feet msl, hazardous obstructions result in 7 the NPS prohibiting boating around Castle Rock and Gregory Butte. Table 4.3-5 and 8 Figure 4.3-6 provide the data for all years and all alternatives. 9
No Action Alternative. In September 2026, there is a 29 percent chance the NPS would 10 have to prohibit boating around Castle Rock and Gregory Butte due to navigational 11 hazards. 12
Basin States and Conservation Before Shortage Alternatives. In September 2026, there is a 13 36 percent chance of boating restrictions around Castle Rock and Gregory Butte. 14
Water Supply Alternative. In September 2026, there is a 47 percent chance of boating 15 restrictions around Castle Rock and Gregory Butte. 16
Reservoir Storage Alternative. In September 2026, there is a 21 percent chance of boating 17 restrictions around Castle Rock and Gregory Butte. 18
4.12.2.3 Lake Powell Sport Fish Populations 19 Potential surface temperatures under any alternative could get close to the upper lethal 20 limits for both striped bass and threadfin shad, especially in July and August when 21 maximum temperatures could reach 29°C. However, the maximum lethal limits of 37°C 22 and 33°C for threadfin shad and striped bass, respectively, would not be exceeded. 23 Further, these water temperatures are for the upper 10 feet of the reservoir, and lower 24 depths provide cooler water. It is assumed that striped bass and threadfin shad would be 25 able to move into the cooler thermocline during the summer months (Gustaveson 1999). 26 Water temperatures would not drop below the lower lethal limit of 5°C for striped bass or 27 threadfin shad under any alternative. The coldest winter temperature could be 7°C. 28 Because surface temperatures would not exceed the lethal tolerances of either species, 29 and it is assumed that both species would have adequate thermal refugia, substantial 30 temperature-related impacts to the reservoir sport fishery are not anticipated to occur 31 under any of the alternatives. 32
The general trend for the alternatives indicates that Lake Powell water under the 33 Conservation Before Shortage and Basin States alternatives do not differ substantially 34 from the No Action Alternative. Therefore, Lake Powell conditions are expected to be 35 similar to the No Action Alternative for lake sport fish under these two action 36 alternatives. The Water Supply Alternative tends to have lower reservoir elevations, 37 which makes the lake more susceptible to atmospheric temperature influence. The 38 Reservoir Storage Alternative has generally higher Lake Powell elevations compared to 39 the No Action Alternative, which makes the lake less susceptible to atmospheric 40

Chapter 4 Environmental Consequences
Draft EIS – Colorado River Interim Guidelines for Lower Basin Shortages and Coordinated Operations for Lake Powell and Lake Mead
4-249 February 2007
temperature influence. However, threadfin shad and striped bass should still be able to 1 survive potential winter and summer temperature variations. 2
4.12.2.4 Access or Use of Rainbow Bridge 3 Above a Lake Powell elevation of 3,650 feet msl, Rainbow Bridge is visible from the 4 floating walkway and interpretive platforms at Rainbow Bridge National Monument. If 5 Lake Powell elevations fall below 3,650 feet msl, Rainbow Bridge is no longer visible 6 from the lake and the floating walkway and interpretive platforms are removed and 7 stored. Under this circumstance, dock facilities would be moved to a lower elevation and 8 connected to the land trail with a short walkway, and the old land trail through Bridge 9 Canyon (submerged at full-pool elevation) would be used. Table 4.3-3 and Figure 4.3-4 10 provide the reservoir elevation data for all years and all alternatives. 11
No Action Alternative. In July 2026, there is a 41 percent chance that the NPS would have 12 to close or modify facilities at Rainbow Bridge. 13
Basin States and Conservation Before Shortage Alternatives. In July 2026, there is a 51 14 percent chance that the NPS would have to close or modify facilities at Rainbow Bridge. 15
Water Supply Alternative. In July 2026, there is a 60 percent chance that the NPS would 16 have to close or modify facilities at Rainbow Bridge. 17
Reservoir Storage Alternative. In July 2026, there is a 38 percent chance that the NPS 18 would have to close or modify facilities at Rainbow Bridge. 19
4.12.3 Recreation from Glen Canyon Dam to Lake Mead 20 21
4.12.3.1 Boating 22 Current operation of Glen Canyon Dam requires a minimum flow release of 8,000 cfs 23 between a.m. and 7 p.m., and 5,000 cfs at night. Therefore, daytime flows will not drop 24 lower than the safe whitewater boating threshold flow of 5,000 cfs. In addition, flow 25 releases from Glen Canyon Dam will be within historical operating range. As shown in 26 Tables 4.3-12 through 4.3-14, releases from Glen Canyon Dam would generally be much 27 higher than these minimum flows under all alternatives and hydrological conditions. 28 Therefore, there would be no change in exposure to unsafe boating conditions caused by 29 change in river elevation. Minor changes in exposure to boating navigation hazards 30 caused by change in river velocity; changes in access or use of rest areas and take-out 31 points; changes in trip duration caused by changes in river velocity; or ability to use sport 32 fishing sites caused by change in flows may occur under all alternatives. These changes 33 would not be substantial and would not affect recreation use or opportunities. 34
4.12.3.2 Sport Fish Populations 35 For the reach of the river between Glen Canyon Dam and Lake Mead, water 36 temperatures were used (See Appendix P) from Glen Canyon Dam, Little Colorado River 37 confluence, and below Diamond Creek gage to compare the No Action Alternative with 38 the action alternatives. Rainbow trout are the major sport fish in this reach and are used 39 for the assessment. 40

Environmental Consequences Chapter 4
February 2007 4-250 Draft EIS – Colorado River Interim Guidelines for
Lower Basin Shortages and Coordinated Operations for Lake Powell and Lake Mead
Glen Canyon Dam Releases and Lees Ferry Reach: 1
♦ No Action Alternative. As discussed in Section 4.8.4.2, the historical range of 2 release temperatures from Glen Canyon Dam was relatively stable between 1990 3 and 2002 and typically ranged from 7 °C to12 °C (44.6 °F to 53.6 °F). These 4 relatively stable cold temperatures were favorable for rainbow trout. Beginning in 5 2002, the range of release temperatures increased and the higher end of the range 6 approached 16 °C (60.8 °F) (Appendix F, Figure F-5). Under the No Action 7 Alternative for Glen Canyon Dam releases, the 10th percentile water temperatures 8 were compared against the preferred water temperatures for spawning, incubation, 9 growth and mortality of rainbow trout. In all months (January through December) 10 minimum potential temperatures are below the preferred lowest water temperature 11 (12 °C) suitable for growth. The minimum potential temperatures are below the 12 minimum suitable spawning temperature of 8 °C from January through April 13 (Table 4.12-1). The potential temperature range for the Glen Canyon Dam release 14 and river temperature at Lees Ferry are not expected to exceed 25° C but may 15 reach 20 °C at the 10th percentile Lake Powell elevation release. As indicated in 16 Chapter 4.8, substantial impacts to the aquatic foodbase are not anticipated. 17
♦ Action Alternatives. While the action alternatives compared to the No Action 18 Alternative are similar, the 10th percentile water temperatures show a potential 19 slight warming trend for all of the alternatives except the Reservoir Storage 20 Alternative. The Reservoir Storage Alternative shows only November as being 21 potentially above the preferred temperature for growth. The Water Supply 22 Alternative shows the most potential warming and water temperatures in August 23 and September may exceed the preferred growth temperature. Incubation 24 temperatures may be exceeded from May through August, which could cause egg 25 mortality. The amount of egg mortality would depend on the duration of water 26 temperatures above the limits for incubation, which is not known. Lethal limits 27 for rainbow trout are not exceeded in any month. The Water Supply Alternative 28 may result in a shorter spawning season since the river flow temperatures in this 29 river reach may increase and become too warm for spawning in May. As 30 indicated in Chapter 4.8, substantial impacts to the aquatic foodbase are not 31 anticipated. 32
Little Colorado River Confluence: 33
♦ No Action Alternative. Under the No Action Alternative, the 10th percentile water 34 temperatures were compared against the preferred water temperatures for 35 spawning, incubation, growth and mortality of rainbow trout. In almost all months 36 (January through June, October through December) minimum temperatures may 37 be below the preferred ranges for growth. The minimum temperatures may be 38 below the preferred minimum temperature for spawning (8 °C or 46 °F) in 39 January and February (Table 4.12-1). 40
Chapter 4 Environmental Consequences
Draft EIS – Colorado River Interim Guidelines for Lower Basin Shortages and Coordinated Operations for Lake Powell and Lake Mead
4-251 February 2007
♦ Action Alternatives. While the action alternatives compared to the No Action 1 Alternative are similar, the 10th percentile water temperatures show a slight 2 potential warming trend for all of the alternatives except the Reservoir Storage 3 Alternative, which is slightly cooler. The Reservoir Storage Alternative shows the 4 least potential variation in temperatures. The Water Supply Alternative shows the 5 most potential warming of water from June through October and may exceed 6 suitable thresholds for growth and incubation. (Table 4.12-1 and Table 4.12-2). 7 Preferred growth temperatures may be exceeded from June to October and 8 incubation temperatures (> 15 °C) may be exceeded from April through August. 9 The amount of egg mortality would depend on the duration of water temperatures 10 above the limits for incubation, which is not known. All action alternatives may 11 result in shorter spawning seasons since potential spring high temperatures may 12 exceed the upper spawning threshold. The Water Supply Alternative could 13 potentially provide the shortest spawning season. Lethal limits for rainbow trout 14 are not exceeded in any month. 15
Diamond Creek: 16
♦ No Action Alternative. Under the No Action Alternative for Diamond Creek the 10th 17 percentile water temperatures show that from January through May and 18 November and December, minimum temperatures may be below the suitable 19 range for growth. The minimum temperatures may be below the minimum 20 temperature for spawning (8° C or 46.4 °F) in January and February (Table 4.12-21 1). Lethal water temperatures may be reached in the summer under the No Action 22 Alternative though fish should be able to find thermal refugia. 23
♦ Action Alternatives. While the action alternatives compared to the No Action 24 Alternative are similar, the 10th percentile water temperatures show a potential 25 warming trend for all of the alternatives, except for the Reservoir Storage 26 Alternative. The Reservoir Storage Alternative shows the least potential variation 27 in temperatures but temperatures may exceed all life history thresholds for March, 28 May, September, and December (Table 4.12-1 and Table 4.12-2). The Water 29 Supply Alternative shows the most potential warming of water from April 30 through October. Preferred growth temperatures may be exceeded from May to 31 October and incubation temperatures (> 15 °C) may be exceeded from April 32 through August. The amount of egg mortality would depend on the duration of 33 water temperatures above the limits for incubation, which is not known. Lethal 34 water temperature limits above 25 °C, may be reached in July, August and 35 September. These summer high temperatures would be greater than under the No 36 Action Alternative for these months. The potential spawning season in this reach 37 may be the most limited because the water warms above 13 °C (55.4 °F) earlier in 38 the year than other reaches. The Water Supply and Reservoir Storage alternatives 39 may potentially provide the shortest and longest spawning seasons, respectively, 40 of the action alternatives. However, juvenile and adult fish are able to find 41 thermal refugia by moving upstream into cooler water habitats such as pools and 42

Environmental Consequences Chapter 4
February 2007 4-252 Draft EIS – Colorado River Interim Guidelines for
Lower Basin Shortages and Coordinated Operations for Lake Powell and Lake Mead
may not be substantially affected by warmer water temperatures. Further, this 1 section of river is not as important for trout as the Lees Ferry reach is. 2
4.12.4 Recreation at Lake Mead 3 Table 3.12-7 identifies the threshold elevations below which shoreline recreational facilities 4 at Lake Mead could be affected. Below these elevations, facility adjustments or capital 5 improvements would be required, creating potential impacts on recreation at Lake Mead. 6 Figures 4.3-18 through 4.3-23 and Tables 4.3-18 through 4.3-23 show the percentage of 7 values less than or equal to these thresholds during the study period. 8
4.12.4.1 Access or Use of Lake Mead Boating Facilities 9 10
No Action Alternative. In July 2026, there is a 76 percent probability that Lake Mead 11 elevations may be lower than elevation 1,175 feet msl, resulting in the closure of the 12 Pearce Bay Launch Ramp and the addition of another 16 miles that boaters would have to 13 travel downstream to take-out. Table 4.3-17 and Figure 4.3-17 provide the data for all 14 years and all alternatives. The Echo Bay Public Launch Ramp would close at an elevation 15 of 1,050 feet msl (Figure 4.3-21 and Table 4.3-21). In July 2026, there is a 26 percent 16 chance that this facility would close under the No Action Alternative. 17
Basin States and Conservation Before Shortage Alternatives. In July 2026, there is a 76 and 18 77 percent chance of closing the Pearce Bay Launch Ramp under these two alternatives, 19 respectively. In July 2026, there is a 20 percent chance under both these alternatives that 20 the Echo Bay Public Launch Ramp would close due to low reservoir elevations. 21
Water Supply Alternative. In July 2026, there is a 78 percent chance of closing the Pearce 22 Bay Launch Ramp and adding 16 miles to river trips. In July 2026, there is a 21 percent 23 chance that the Echo Bay Public Launch Ramp would close due to low reservoir 24 elevations. 25
Reservoir Storage Alternative. In July 2026, there is a 68 percent chance of closing the 26 Pearce Bay Launch Ramp and adding 16 miles to river trips. In July 2026, there is a four 27 percent chance that the Echo Bay Public Launch Ramp would close. 28
4.12.4.2 Safe Boating and Navigation Hazards 29 Over the years, sediment has built up in the section of the reservoir between Grand Wash 30 Cliffs and Pearce Ferry. When the Lake Mead elevation drops below elevation 1,170 feet 31 msl, there is no well-defined river channel in this upper portion of Lake Mead, making it 32 dangerous for boaters (NPS 2005a). 33
No Action Alternative. In July 2026, there is a 74 percent probability that boaters may 34 encounter navigational hazards in upper Lake Mead. 35
Basin States and Conservation Before Shortage Alternatives. In July 2026, there is a 73 36 percent probability that boaters may encounter navigational hazards in upper Lake Mead. 37

Chapter 4 Environmental Consequences
Draft EIS – Colorado River Interim Guidelines for Lower Basin Shortages and Coordinated Operations for Lake Powell and Lake Mead
4-253 February 2007
Water Supply Alternative. In July 2026, there is a 77 percent probability that boaters may 1 encounter navigational hazards in upper Lake Mead. 2
Reservoir Storage Alternative. In July 2026, there is a 65 percent probability that boaters 3 may encounter navigational hazards in upper Lake Mead. 4
4.12.4.3 Sport Fish Populations 5 6
No Action Alternative. Rainbow trout (and razorback suckers) are raised in the Lake Mead 7 Fish Hatchery by Nevada Department of Wildlife (NDOW). NDOW obtains its water 8 supply for the fish hatchery from Lake Mead. Their water comes from the Basic 9 Management, Inc. (BMI) intake at reservoir elevation 1,060 feet msl. Under recent 10 conditions, the hatchery has experienced problems with water temperature and total 11 dissolved solids in its water from the intake (Parke 2006). Water temperatures taken from 12 the intake are approximately 24°C (75°F), which is too warm for trout. NDOW has 13 noticed the increase in water temperatures starts when Lake Mead’s elevation is less than 14 100 feet above the BMI intake (elevation 1,160 feet msl and less). The 50th and 10th 15 percentile monthly elevations are never above elevation 1,160 feet msl so temperature 16 problems are likely to persist for future hatchery operations. The 90th percentile 17 elevations are identical for all alternatives and would alleviate the hatchery’s temperature 18 problems. The 50th percentile elevations are always above elevation 1060 feet msl, but the 19 10th percentile elevations for all alternatives will fall below 1,060 feet msl in the future. 20 Thus, the hatchery may have water supply problems at the 10th 21 percentile elevation values. 22
The situation for striped bass and threadfin shad in Lake Powell is expected to be similar 23 at Lake Mead. However, threadfin shad are near the northern limit of their range at Lake 24 Powell so threadfin shad are less likely to be affected by cold winter temperatures at 25 Lake Mead. 26
Action Alternatives. The Basin States and Conservation Before Shortage alternatives 27 would be similar to the No Action Alternative. The Reservoir Storage Alternative is the 28 most beneficial to the hatchery’s water supply and the Water Supply Alternative would 29 have the most adverse effects on water temperature. Effects on threadfin shad and striped 30 bass are expected to be similar to the effects at Lake Powell. 31
4.12.5 Recreation from Hoover Dam to SIB 32 Flow releases from Hoover Dam, Davis Dam, Parker Dam, and Imperial Dam will all be 33 within historical operating range. Therefore, there would be minimal changes in exposure to 34 boating navigation hazards caused by changes in river elevation; changes in exposure to 35 boating navigation hazards caused by changes in river velocity; changes in access or use of 36 rest areas and take-out points; changes in trip duration caused by changes in river velocity; or 37 decrease in access or use of sport fishing sites caused by changes in flows. The sport fishery 38 in this reach is primarily warm water. The minor changes in water temperatures that may 39 occur below Hoover Dam are not expected to affect warmwater sport fish. 40

Environmental Consequences Chapter 4
February 2007 4-254 Draft EIS – Colorado River Interim Guidelines for
Lower Basin Shortages and Coordinated Operations for Lake Powell and Lake Mead
4.12.6 Summary 1 2
4.12.6.1 Shoreline Facilities 3 For shoreline public use facilities at Lake Powell, the No Action, Basin States, 4 Conservation Before Shortage, and Reservoir Storage alternatives provide a two to eight 5 percent probability that the Wahweap and Lower Bullfrog Launch ramps may close in 6 2026, while the Water Supply Alternative provides a 20 percent probability of this 7 occurrence. Other marinas and launch ramps are similarly affected under the 8 different alternatives. 9
For Rainbow Bridge National Monument, in 2026 there is a 41 percent probability under 10 the No Action Alternative that the NPS would have to close or modify recreational 11 facilities at this location. The action alternatives provide a 38 to 60 percent probability of 12 facility closures. 13
At Lake Mead, all of the alternatives provide a 76 to 78 percent probability that the 14 Pearce Bay launch ramp would be closed to boaters, except for the Reservoir Storage 15 Alternative, which provides a 68 percent probability. Similarly, all of the alternatives 16 provide a 20 to 26 percent probability of closure of the Echo Bay Public Launch Ramp 17 (in the north end of the reservoir), except for the Reservoir Storage Alternative which 18 provides only a four percent probability of this occurrence. 19
4.12.6.2 Safe Boating and Navigation 20 For safe boating at Lake Powell, under the No Action Alternative and Reservoir Storage 21 Alternative, probabilities range from 21 to 29 percent that the NPS would have to 22 prohibit boating around Castle Rock and Gregory Butte. Under the Basin States and 23 Conservation Before Shortage alternatives, there is a 36 percent probability that boating 24 prohibitions would need to be put in place. Under the Water Supply Alternative, the 25 probability of this occurrence is 47percent. 26
For Lake Mead, all the alternatives in July 2026 provide a 73 to 77 percent probability 27 that boaters may encounter navigational hazards in the upper end of Lake Mead due to 28 reservoir elevations being drawn down below elevation 1,170 feet msl. The Reservoir 29 Storage Alternative provides a 65 percent probability of a similar recreational impact. 30 Similar effects would occur in the Overton Arm of Lake Mead. 31
For whitewater boating through Grand Canyon, the Glen Canyon Dam ROD flows will 32 be maintained. Even in a 7.0 maf Glen Canyon Dam release year, the minimum daily 33 flow will remain at or above 5,000 cfs, a safe boating threshold. 34
Chapter 4 Environmental Consequences
Draft EIS – Colorado River Interim Guidelines for Lower Basin Shortages and Coordinated Operations for Lake Powell and Lake Mead
4-255 February 2007
4.12.6.3 Sport Fish Populations 1 Sport fish populations would not be adversely affected at Lake Powell under any of the 2 alternatives. Although water surface temperatures may approach lethal levels in the upper 3 10 feet of the reservoir under any alternative, lethal levels for striped bass and threadfin 4 shad should not be exceeded by any alternative. Moreover, cooler temperatures below the 5 lake surface would serve as a refuge for the fish. The situation for striped bass and 6 threadfin shad in Lake Mead is similar to Lake Powell. Higher water temperatures could 7 impair the Lake Mead Fish Hatchery, particularly under the Water Supply Alternative. 8
High water temperatures could affect the rainbow trout in the Lees Ferry reach. Under the 9 No Action Alternative, 10th percentile temperatures are suitable for growth, spawning, 10 and incubation in the months shown in Table 4.12-2. Under the action alternatives, 10th 11 percentile modeling results indicate there could be minor impacts to rainbow trout due to 12 warmer temperatures. The Water Supply Alternative shows the most warming from April 13 through November. The Reservoir Storage Alternative shows only November as being 14 higher than the growth threshold. 15
16
Environmental Consequences Chapter 4
February 2007 4-256 Draft EIS – Colorado River Interim Guidelines for
Lower Basin Shortages and Coordinated Operations for Lake Powell and Lake Mead
This page intentionally left blank. 1 2

Chapter 4 Environmental Consequences
Draft EIS – Colorado River Interim Guidelines for Lower Basin Shortages and Coordinated Operations for Lake Powell and Lake Mead
4-257 February 2007
4.13 Transportation 1
This section describes the methods of analysis and potential effects on transportation, focusing 2 on ferry services, and river taxis. 3
4.13.1 Methodology 4 5
4.13.1.1 Effects on Lake Powell Ferry Service 6 The John Atlantic Burr Ferry becomes inoperable when the Lake Powell elevation falls 7 below elevation 3,550 feet msl, requiring additional driving of approximately 130 miles 8 between the Bullfrog and Halls Crossing marinas. Consequently, for each action 9 alternative, the analysis evaluates the probability the ferry would be inoperable and 10 compares that to the probability under the No Action Alternative. These comparisons 11 were based on the Lake Powell end-of-September elevations between years 2008 12 through 2060. 13
4.13.1.2 Effects on Laughlin River Taxis and Tour Boats 14 Changes in releases from Davis Dam have the potential to impact the operations of the 15 river taxi services and tour boats in Laughlin, Nevada. The projected discharges or flows 16 in cfs were compared to the flows required by the river taxis and the tour boats. 17
4.13.1.3 Effects on Lake Havasu Ferry Service 18 Changes in Lake Havasu elevations could affect the existing ferry service and 19 recreational uses. Effects of changes in Lake Havasu elevations on recreational uses are 20 discussed in the recreational impacts discussion (Section 4.12). The discussion presented 21 below is limited to the potential effects on ferry service provided on Lake Havasu. 22
4.13.2 Lake Powell Ferry Service 23 Table 4.13-1 lists the range of probabilities of Lake Powell elevations being less than or 24 equal to elevation 3,550 feet msl for each alternative. An analysis for each alternative is 25 provided below. 26
Table 4.13-1 Range of Probabilities of Lake Powell Elevations Less Than or Equal to Elevation 3,550 feet msl
Alternative 2008 through 2025 2026 through 2060 No Action 0% to 8.1% 3% to 10.1% Basin States 0% to 6.1% 5.1% to 10.1% Conservation Before Shortage 0% to 6.1% 5.1% to 10.1% Water Supply 0% to 17.1% 7.1% to 17.2% Reservoir Storage 0% to 5.1% 0.1% to 10.1%
27

Environmental Consequences Chapter 4
February 2007 4-258 Draft EIS – Colorado River Interim Guidelines for
Lower Basin Shortages and Coordinated Operations for Lake Powell and Lake Mead
4.13.2.1 No Action Alternative 1 The likelihood that Lake Powell elevations would fall below 3,550 feet msl under the No 2 Action Alternative is not greater than 10 percent for all years until 2060 (zero to 10 3 percent; Figure 4.3-10 and Table 4.13-1). Consequently, the Lake Powell Ferry Service 4 would be able to operate about 90 percent of the time under No Action 5 Alternative conditions. 6
4.13.2.2 Basin States Alternative 7 The Basin States Alternative would result in very similar or slightly lower probabilities 8 (zero to six percent) of Lake Powell elevations being less than 3,550 feet msl when 9 compared to the No Action Alternative from the period 2008 through 2025 (Figure 4.3-10 10 and Table 4.13-1). For the period 2026 through 2060, the Basin States Alternative would 11 result in similar or slightly higher probabilities (five to 10 percent) as compared to the No 12 Action Alternative. The net effect under this alternative is minor. 13
4.13.2.3 Conservation Before Shortage Alternative 14 The Conservation Before Shortage Alternative would result in very similar or slightly 15 lower probabilities (zero to 6.1 percent) of Lake Powell elevations being less than 16 elevation 3,550 feet msl when compared to the No Action Alternative for the period 2008 17 through 2025 (Figure 4.3-10 and Table 4.13-1). For the period 2026 through 2060, the 18 Conservation Before Shortage Alternative would result in similar or slightly higher 19 probabilities (five to 10 percent) as compared to the No Action Alternative. The net effect 20 under this alternative is minor. 21
4.13.2.4 Water Supply Alternative 22 The Water Supply Alternative would result in similar or higher probabilities (zero to 17 23 percent) of Lake Powell elevations being less than elevation 3,550 feet msl when 24 compared to the No Action Alternative for the period 2008 through 2025 (Figure 4.3-10 25 and Table 4.13-1). For the period 2026 through 2060, the Water Supply Alternative 26 would result in higher probabilities (seven to 17 percent) as compared to the No Action 27 Alternative. The net effect under this alternative is moderately adverse. 28
4.13.2.5 Reservoir Storage Alternative 29 The Reservoir Storage Alternative would result in similar or slightly lower probabilities 30 (zero percent to five percent) of Lake Powell elevations being less than 3,550 feet msl 31 compared to the No Action Alternative for the period 2008 through 2025 (Figure 4.3-10 32 and Table 4.13-1). For the period 2026 through 2060, the Reservoir Storage Alternative 33 would result in similar or slightly lower probabilities (zero percent to 10 percent) as 34 compared to the No Action Alternative. The net effect under the Reservoir Storage 35 Alternative is beneficial. 36
4.13.3 Laughlin River Taxis and Tour Boats 37 The minimum future flow under the No Action Alternative and under the action alternatives 38 will continue to be 2,300 cfs, the minimum flow needed to run one turbine of Davis 39 Powerplant at about one-half capacity. The duration of flows in the 2,300 to 4,600 cfs range 40 would not be affected by the proposed federal action. However, the duration of flows in the 41 4,600 cfs to 9,200 cfs range may be affected by the proposed federal action. For example, 42

Chapter 4 Environmental Consequences
Draft EIS – Colorado River Interim Guidelines for Lower Basin Shortages and Coordinated Operations for Lake Powell and Lake Mead
4-259 February 2007
due to changes in annual releases, the duration of hourly flows in the 4,600 to 9,200 cfs range 1 may increase during some days under the Water Supply Alternative and decrease during 2 some days under the Reservoir Storage Alternative. These potential effects would be minor 3 effects on transportation. The duration of hourly flows in the 4,600 cfs to 9,200 cfs range 4 under the Basin Sates Alternative and the Conservation Before Shortage Alternative are 5 expected to be nearly the same as those under the No Action Alternative. 6
4.13.4 Lake Havasu Ferry Service 7 Lake Havasu will continue to be operated to meet monthly elevation targets; therefore, 8 adoption of any of the alternatives would not affect the operation of the Lake Havasu 9 ferry service. 10
4.13.5 Summary 11 For the Lake Powell ferry, the Basin States and Conservation Before Shortage alternatives 12 would have minor effects on ferry service; the Water Supply Alternative would result in 13 moderate adverse effects; and the Reservoir Storage Alternative would have beneficial 14 effects. The probability varies from year to year, but there is up to a 17 percent probability 15 that the Lake Powell ferry may become inoperable under the Water Supply Alternative for 16 some period of time. Conversely, the ferry remains operable with the highest probabilities 17 and greatest durations of time under the Reservoir Storage Alternative. 18
For the Colorado River ferry service below Davis Dam, only under the Reservoir Storage 19 Alternative are there measurable effects and these potential effects would most likely be 20 minor. The other alternatives show no difference from the No Action Alternative. 21
The Lake Havasu ferry service would be unaffected under all of the action alternatives. 22
23
24
25

Environmental Consequences Chapter 4
February 2007 4-260 Draft EIS – Colorado River Interim Guidelines for
Lower Basin Shortages and Coordinated Operations for Lake Powell and Lake Mead
This page intentionally left blank. 1 2

Chapter 4 Environmental Consequences
Draft EIS – Colorado River Interim Guidelines for Lower Basin Shortages and Coordinated Operations for Lake Powell and Lake Mead
4-261 February 2007
4.14 Socioeconomics and Land Use 1
This section describes the environmental consequences related to socioeconomics, agricultural 2 production and other land uses for the alternatives considered in the proposed federal action, and 3 describes the methods used to determine the effects resulting from each alternative. The study 4 area and issues associated with these resources are described in Section 3.14. Additional 5 information on the assessment of socioeconomic and land use effects is provided in Appendix H. 6 Cumulative impacts related to socioeconomics and land use are discussed in Chapter 5. 7
4.14.1 Methodology 8 This section describes the methods used to estimate the effects on socioeconomics resulting 9 from the proposed federal action. The assessment focused on estimating the socioeconomic 10 effects that would occur as a result of potential changes in agricultural production, reservoir-11 related and river-related recreation, and the change in M&I water availability. 12
4.14.1.1 Agriculture 13 The socioeconomic effects of changes in agricultural production were quantitatively and 14 qualitatively assessed. A quantitative assessment was conducted for Arizona counties that 15 may experience a shortage whereas a qualitative assessment was conducted for California 16 and Nevada counties. The quantitative assessment was limited to Arizona counties since 17 a shortage event would potentially have the greatest effect on the CAP service area and 18 the CAP has a large amount of agriculture within its service area. In contrast, Nevada has 19 very little agricultural production, and shortages to California would be unlikely to occur 20 and would only affect the M&I sector. 21
The quantitative assessment was conducted in three major steps: 22
♦ estimating changes in agricultural production as the result of reduced water 23 deliveries; 24
♦ estimating the potential changes in employment, income, and tax revenue as a 25 result of reduced water deliveries; and 26
♦ applying the shortage probabilities for a particular shortage amount and year to 27 understand the likelihood that the potential changes would occur. 28
Figure 4.14-1 provides an overview of the steps followed in conducting the assessment of 29 changes in agricultural production and resulting changes in employment, income, and tax 30 revenues. 31

Environmental Consequences Chapter 4
February 2007 4-262 Draft EIS – Colorado River Interim Guidelines for
Lower Basin Shortages and Coordinated Operations for Lake Powell and Lake Mead
Figure 4.14-1 1 Steps in Analyzing Changes in Agricultural Production 2
and Resulting Changes in Employment, Income, and Tax Revenue 3
4
Identification of Study Area - (Arizona counties that may
experience a shortage)
Shortage Allocation -Geographic Extent
and Amount (Shortage Allocation Model)
Agricultural Change In Production -
(Spreadsheet model)
Change In
Production Value ($)
Change In Employment, Income, and Tax Revenues
(IMPLAN model)
Change In Employment,
Income, and Tax Revenues
Frequency of Affect
(Shortage Probabilities)
Comparison of Alternative
County Crop Patterns
Yield and Prices
Crop Budgets – Crops Affected
Identification of Representative Shortage
Amounts and Years

Chapter 4 Environmental Consequences
Draft EIS – Colorado River Interim Guidelines for Lower Basin Shortages and Coordinated Operations for Lake Powell and Lake Mead
4-263 February 2007
4.14.1.2 Estimating Changes in Agricultural Production Value 1 2
Involuntary Shortages. The purpose of the impact assessment for agriculture is to estimate 3 the change in agricultural production values as a result of the proposed federal action. 4 Specifically, this section focuses on the incidence of these impacts on non-Indian and 5 Indian agricultural production in Pinal, Maricopa, Pima, Mojave, La Paz, Yuma, and 6 Graham Counties for 2008, 2017, 2026, 2027, 2040, and 2060. The seven counties were 7 selected because the irrigation districts that may experience shortages are located within 8 these counties. Impacts to agriculture in the seven-county area were examined by 9 observing modeled changes in industry output and acreage of fallowed lands for 10 agriculture. The years 2008, 2017, and 2026, were selected because they represent the 11 beginning, midpoint, and end of the interim period. The years 2027, 2040, and 2060 were 12 selected because they represent the beginning, midpoint, and end of the recovery period. 13
The objectives of this study were to quantify potential: 14
♦ changes in agricultural production for various levels of shortage; and 15
♦ amounts of fallowed land for various levels of shortage. 16
Key to this impact analysis is the assumption that the most conservative way to estimate 17 impacts is to assume that, if a shortage occurs, farmers would react by fallowing irrigated 18 lands. The decision to fallow lands would rest on the ability of the farmer to cover the 19 variable costs of production for crops grown in the study area. These assumptions are 20 discussed in more detail later in this section. 21
While fallowing of lands may occur during shortages, there are other sources of water 22 that may be used by farmers in order to offset shortages. For example, a farmer may have 23 a groundwater well available and may be able to mitigate shortages in surface water 24 supply by pumping additional groundwater. Other farmers may be able to take delivery of 25 groundwater that is recovered from a groundwater bank. It is difficult, if not impossible, 26 to project exactly how individual farmers, irrigation districts, or the Lower Division states 27 may mitigate potential, future agricultural impacts from shortages. Therefore, for the 28 purposes of this analysis, the projected change in agricultural production was based on 29 the conservative assumption that other sources of water would not be available. 30
The crops considered included cotton, wheat, alfalfa, vegetables and melons, and trees 31 and vines. The primary focus is on cotton, wheat, and alfalfa because these crops have 32 lower earnings per af of water than fruit, vegetable, and nut crops and, therefore, are 33 more vulnerable to changes in water costs and shortages. Farm budgets were developed 34 for cotton, wheat, and alfalfa to determine the maximum water cost a farmer can pay and 35 still produce a particular crop. These budgets represent a generalization of the variable 36 production costs for a particular crop exclusive of water costs. When the cost of water 37 exceeds the maximum water cost a farmer can pay or if water is not available, a crop is 38 taken out of production and the land is fallowed for the year in which a shortage occurs. 39 The data from all of the model runs were compared to the No Action Alternative. 40
Environmental Consequences Chapter 4
February 2007 4-264 Draft EIS – Colorado River Interim Guidelines for
Lower Basin Shortages and Coordinated Operations for Lake Powell and Lake Mead
4.14.1.3 General Assumptions and Data Sources 1 2
Crop Patterns, Yields, and Prices. Crop patterns, yield per acre, and prices were assumed to 3 remain constant for non-Indian and Indian agricultural output for all alternatives during 4 the study period. Crop patterns for the CAP and other irrigation districts in this study are 5 based on historical crop patterns that were reported by irrigation districts to Reclamation 6 for the years 1999 through 2004. These data were averaged and aggregated at the county 7 level for the impact analysis. Cropping patterns for Indian agriculture come from a 8 variety of sources and may be incomplete. Accordingly, it was assumed that cropping 9 patterns on Indian lands were similar to that of nearby irrigation districts. Appendix H 10 includes information on cropping patterns for CAP and other irrigation districts. 11
Yield data was based on five-year average county-level yields for the period 2000 12 through 2005. Prices are based on five-year average statewide prices for Arizona for the 13 period 2000 to 2005. The yield and price data are published by the USDA’s National 14 Agricultural Statistics Service (NASS) for Arizona. Information on county-level yield 15 and price data is provided in Appendix H. 16
Water Costs. The cost of water used in the analysis of agricultural impacts is a blended 17 cost that reflects the price of CAWCD excess water pools, groundwater pumping, and 18 other water. The price of CAWCD excess water was obtained directly from the CAWCD. 19 Cost estimates for groundwater pumping and other water were obtained from various 20 irrigation districts. These data were aggregated to a county-level basis for use in the 21 agricultural impacts analysis. The blended cost of water data for each county is included 22 in Appendix H. 23
Crop Budgeting and Impacts upon Crop Selection due to Water Cost and Water Shortages. 24 Crop budgets were developed to determine the crop types that would be affected as a 25 result of water shortages. A detailed description of how the crop budgets were developed 26 is included in Appendix H. 27
Assessment of Changes in Agricultural Production. It is assumed that the agricultural 28 impacts for involuntary shortages are the same for various levels of shortage for each 29 alternative. As an example, a 600,000 af shortage occurring under the Reservoir Storage 30 Alternative would result in the same change in agricultural production as a 600,000 af 31 shortage occurring under the Basin States Alternative. Shortages may occur more or less 32 frequently under various alternatives, but the change in agricultural production during a 33 particular volume of shortage was assumed to be the same across the alternatives. This is 34 due to the modeling assumptions made with regard to how shortages might be distributed 35 to various water users (Section 4.2, Appendix A, and Appendix G). These assumptions 36 are the same across all alternatives. Changes in agricultural production and resulting 37 changes in production value due to voluntary shortages would likely be different than the 38 changes due to involuntary shortages, discussed in additional detail below. 39
Output from Reclamation’s Shortage Allocation Model (Section 4.2 and Appendix G) 40 was used as input for assessing changes in agricultural production during the involuntary 41 fallowing of agricultural lands. The various levels of shortage were input into the model 42

Chapter 4 Environmental Consequences
Draft EIS – Colorado River Interim Guidelines for Lower Basin Shortages and Coordinated Operations for Lake Powell and Lake Mead
4-265 February 2007
and the amount of shortage that would be allocated to various agricultural users was 1 generated. These results were aggregated on a county-level basis for use in the 2 agricultural impacts analysis. 3
Agricultural impacts for both non-Indian and Indian agriculture were analyzed 4 independently. For both analyses, the amount of shortage allocated to non-Indian and 5 Indian water users in each county for various levels of overall shortage were input into a 6 spreadsheet model developed by Reclamation that estimates changes in agricultural 7 production and production value. Model input includes output from the partial crop 8 budgets, the amount of available surface water in each county, county-wide shortage 9 amounts from the water allocation model, the amount of water applied per acre for each 10 crop, and county-wide water distribution patterns with respect to cotton, wheat, and 11 alfalfa production. Based on the amount of shortage realized in each county, the model 12 estimates the amount of land that would be fallowed using the relative profitability of 13 each crop. The model assumes that the least profitable crops are fallowed first. Once all 14 of the irrigated land associated with the least profitable crop is fallowed, the model 15 assumes that fallowing of the next-least profitable crop would commence. The irrigated 16 acreage associated with fallowing is estimated based on the amount of water allocated to 17 various crops and the crop water use per acre associated with those crops. The resulting 18 direct economic impacts are calculated by multiplying the number of acres fallowed for 19 various crops by the gross output for those crops. 20
The federal government has reserved a volume of CAP water in the range of 47,000 to 21 67,000 af for future water settlements. At some time, this water may be allocated to tribes 22 in Arizona for agricultural or M&I use. Once allocated, this water would potentially be 23 vulnerable to shortages. However, it is not known where or when this water may be 24 allocated. Because of this uncertainty, the reserved federal water has not been included in 25 the analysis. 26
Shortages. The partial farm budgets used in the analysis of involuntary shortages are a 27 potential means to estimate the minimum amount of compensation a farmer would accept 28 to fallow agricultural ground. However, compensation rates included in recently 29 established fallowing programs do not reflect these minimum amounts. It appears that 30 market forces have contributed significantly to the compensation rates paid in fallowing 31 programs for conserved water. As a result, available data from several fallowing 32 programs were used to estimate a range of costs for conserved water and to estimate 33 potential amounts of land that would be fallowed under various levels of shortage. 34
Data from several sources suggest that fallowing agricultural lands would result in a 35 reduction in the consumptive use of water ranging between 4.2 and 6.9 af per acre (Colby 36 et. al. 2006). The amount of acreage that would be fallowed would be dependent on the 37 crops grown and the consumptive use of those crops. However, again, it is difficult to 38 project which irrigators or districts would fallow their land and what crops would not be 39 grown. In lieu of attempting to project the crops that would not be grown, for the 40 purposes of this study, it was assumed that the amount of fallowed land per af of 41
Environmental Consequences Chapter 4
February 2007 4-266 Draft EIS – Colorado River Interim Guidelines for
Lower Basin Shortages and Coordinated Operations for Lake Powell and Lake Mead
conserved water would be similar to the range shown above. It was assumed that all of 1 the potentially conserved water results from agricultural water conservation. 2
Voluntary shortages may result in a beneficial effect on farmers rather than a detriment. 3 The minimum amount of water a farmer would likely accept would be at a break-even 4 price. However, given the demand for water conservation under voluntary shortages, a 5 farmer would be less likely to accept a minimum payment and would be more likely to 6 attempt to maximize economic gain. 7
Implementation of voluntary shortages is the focus of the Conservation Before Shortage 8 Alternative. The water conservation (voluntary shortage) prior to involuntary shortage 9 included in this alternative assumes that farmers would be paid to initiate voluntary water 10 conservation measures. These conservation measures could be implemented in a variety 11 of ways such as on-farm efficiency improvements, canal lining, etc. It is, however, very 12 difficult to project what actions individual farmers or irrigation districts might take in the 13 future to conserve water. Land fallowing programs have frequently been used as a means 14 to voluntarily conserve water and fallowing would likely result in the most significant 15 impacts with regard to land use. For the purposes of this study, it is assumed that land 16 fallowing would be the means of conserving water for the Conservation Before Shortage 17 Alternative. 18
Estimating Changes in Employment, Income, and Tax Revenue. The socioeconomic effects of 19 changes in agricultural production in Arizona were analyzed using the IMPLAN model 20 (Minnesota IMPLAN Group 2006). IMPLAN is a regional economic model that 21 describes the flows from producers to intermediate and final consumers using a series of 22 economic multipliers. The IMPLAN model describes for each county the transfers of 23 money between all industries and institutions. This model of county-level economic 24 interactions is used to project, using the input-output multipliers, total regional economic 25 activity based on a change in expenditures. 26
In addition to the direct loss in agricultural output, reduced expenditures occur from a 27 drop in business-to-business purchases and in reduced household expenditures. These 28 changes, known as indirect and induced economic effects and were also estimated using 29 IMPLAN. The resulting socioeconomic effects were quantified as changes in 30 employment, income, and tax revenue. 31
The qualitative assessment for changes in agricultural production and resulting changes 32 in employment, income, and tax revenues was based on the probability of shortages 33 occurring in the agricultural sector in California and Nevada. 34
Municipal and Industrial Water Uses. The potential socioeconomic consequences of 35 shortages occurring in the M&I sector were qualitatively assessed for Arizona, 36 California, and Nevada. The effects were qualitatively assessed because it was not known 37 to what degree a specific economic sector considered an M&I use would be affected. The 38 analysis was based on the shortage amounts and shortage allocations reported in 39 Section 4.4. 40

Chapter 4 Environmental Consequences
Draft EIS – Colorado River Interim Guidelines for Lower Basin Shortages and Coordinated Operations for Lake Powell and Lake Mead
4-267 February 2007
The analysis first examined the probability of a range of water shortages occurring in 1 different years. The shortages analyzed included 400,000 af, 500,000 af, 600,000 af, 2 800,000 af, 1 maf, 1.2 maf, 1.8maf, and 2.5 maf. Consistent with the assessment of the 3 effects to agriculture, the M&I analysis examined years 2008, 2017, 2026, 2027, 2040, 4 and 2060 for each of the shortage amounts. 5
The analysis focused on those years and shortage levels having the highest probability of 6 occurring and where the probability was substantially different compared to the No 7 Action Alternative. The analysis then examined whether a particular shortage event 8 would affect the M&I sector as compared to the No Action Alternative. For example, a 9 shortage in Arizona would affect the agricultural sector first. In contrast, a shortage in 10 Nevada would affect M&I, primarily because Nevada has a small agricultural sector. 11
For situations likely to have an effect on the M&I sector, the ability of each state to 12 manage shortages to the M&I sector were analyzed. The M&I shortages allocated to each 13 state were compared to the drought plans or actions that state or local agencies could 14 institute during a shortage. The analysis then qualitatively discussed whether such 15 drought planning mechanisms are adequate to address shortages to the M&I sector. 16
Recreation. The recreation-related socioeconomic effects resulting from changes in Lake 17 Powell and Lake Mead elevations and flows in the Colorado River downstream of Lake 18 Powell and Lake Mead were qualitatively assessed. The conclusions regarding the extent 19 of changes in reservoir elevations and river flows reported in Section 4.3 and recreation 20 opportunities reported in Section 4.12 were used to help determine the magnitude of 21 socioeconomic effects. 22
Lake Powell and Lake Mead. The assessment of changes in recreation-related economic 23 activity was based on changes in Lake Powell and Lake Mead elevations. As indicated in 24 Sections 4.3 and 4.12, particular months representative of the primary recreational season 25 were selected for each lake to analyze the potential elevation changes (September for 26 Lake Powell; July for Lake Mead). 27
Figure 4.14-2 depicts the end-of-September Lake Powell elevations and Figure 4.14-3 28 depicts the end-of-July Lake Mead elevations used in this analysis. The years considered 29 in the assessment are 2008, 2016, 2026, and 2060. For each year, lake elevations for each 30 alternative were compared to the No Action Alternative. This comparison was conducted 31 for the 90th, 50th, and 10th percentiles shown in Figures 4.14-2 and 4.14-3. 32
Colorado River Downstream of Lake Powell and Lake Mead. The assessment of 33 socioeconomic effects as result of changes in recreation-related economic activity was 34 based on the results of the recreation assessment. The results of this assessment are 35 provided in Section 4.12. 36

Environmental Consequences Chapter 4
February 2007 4-268 Draft EIS – Colorado River Interim Guidelines for
Lower Basin Shortages and Coordinated Operations for Lake Powell and Lake Mead
1
2 Figure 4.14-2 Lake Powell End-of-September Elevations
Comparison of Action Alternatives to No Action Alternative 90th, 50th, and 10th Percentile Values
3,500
3,525
3,550
3,575
3,600
3,625
3,650
3,675
3,700
2005 2010 2015 2020 2025 2030 2035 2040 2045 2050 2055 2060Year
Wat
er S
urfa
ce E
leva
tion
(feet
msl
)
No ActionBasin StatesConservation Before ShortageWater SupplyReservoir Storage
10th Percentile
50th Percentile
90th Percentile
Figure 4.14-3 Lake Mead End-of-July Elevations
Comparison of Action Alternatives to No Action Alternative 90th, 50th, and 10th Percentile Values
975
1,000
1,025
1,050
1,075
1,100
1,125
1,150
1,175
1,200
1,225
2005 2010 2015 2020 2025 2030 2035 2040 2045 2050 2055 2060
Year
Wat
er S
urfa
ce E
leva
tion
(feet
msl
)
No ActionBasin StatesConservation Before ShortageWater SupplyReservoir Storage
10th Percentile
50th Percentile
90th Percentile

Chapter 4 Environmental Consequences
Draft EIS – Colorado River Interim Guidelines for Lower Basin Shortages and Coordinated Operations for Lake Powell and Lake Mead
4-269 February 2007
4.14.2 Agriculture 1 This section provides the assessment of potential effects on agricultural production and 2 resulting changes in employment, income, and taxes. Table 4.14-1 provides estimates of 3 involuntary fallowed agricultural land for each shortage amount. Table 4.14-2 provides 4 estimates of changes in agricultural production value for each shortage amount. The change 5 in production value was used as input to IMPLAN to estimate changes in employment, 6 income, and tax revenue. 7
Table 4.14-1 Estimate of Involuntarily Fallowed Acres
in Arizona under Various Levels of Shortage for Various Years Non-Indian Agriculture Shortage
(af) 2008 2017 2026 2027 2040 2060 400,000 - 75,824 28,940 - - - 500,000 - 77,150 30,255 17,667 6,034 6,099 600,000 - 78,476 31,569 18,986 7,383 7,460 800,000 - 80,945 34,012 21,436 9,887 9,989 1,000,000 - 83,094 36,134 23,551 11,960 12,043 1,200,000 - - - 25,582 14,083 14,183 1,800,000 - - - - 26,447 26,590 2,500,000 - - - - - -
Indian Agriculture Shortage (af) 2008 2017 2026 2027 2040 2060
400,000 - 1,015 21,912 - - - 500,000 - 3,697 35,403 40,621 38,773 44,185 600,000 - 18,961 40,876 45,692 45,497 49,322 800,000 - 40,824 53,122 56,460 56,469 68,407 1,000,000 - 50,883 62,228 66,832 66,820 72,673 1,200,000 - - - 79,265 78,904 84,723 1,800,000 - - - - 110,010 114,911 2,500,000 - - - - - -
Total Agriculture Shortage (af) 2008 2017 2026 2027 2040 2060
400,000 - 76,840 50,852 - - - 500,000 - 80,847 65,658 58,288 44,808 50,283 600,000 - 97,437 72,446 64,678 52,880 56,782 800,000 - 121,769 87,134 77,897 66,356 78,396 1,000,000 - 133,978 98,361 90,383 78,780 84,716 1,200,000 - - - 104,847 92,987 98,906 1,800,000 - - - - 136,457 141,501
Note: a dash indicates that a shortage of the given magnitude did not occur in the particular year
8

Environmental Consequences Chapter 4
February 2007 4-270 Draft EIS – Colorado River Interim Guidelines for
Lower Basin Shortages and Coordinated Operations for Lake Powell and Lake Mead
Table 4.14-1 provides the total estimated fallowed acreage for each shortage amount for 1 2008, 2017, 2026, 2027, 2040, and 2060. No change in production would occur in 2008 2 because no shortages are projected to occur in that year. In general, for each shortage 3 amount, the amount of fallowed non-Indian agricultural land decreases between 2017 and 4 2060 reflecting the trend of fewer acres of agricultural land being in production in the future. 5 No permanent change in land uses would occur under any of the alternatives because 6 shortages would be of a temporary nature and agricultural lands would likely not be 7 permanently removed from production. 8
The changes in agricultural production values are shown in Table 4.14-2. These changes are 9 a direct result of the amount of land fallowed for each shortage amount. Similar to the 10 acreages of fallowed land, the changes in production value is expected to decrease as a result 11 of less land being fallowed in the future for non-Indian agriculture. 12
Table 4.14-2 Estimated Change in Agricultural Production Value Resulting from Involuntary Land Fallowing
in Arizona under Various Levels of Shortage for Various Years
Non-Indian Agriculture Shortage (af) 2008 2017 2026 2027 2040 2060
400,000 - $51,195,179 $12,387,806 - - - 500,000 - $51,953,661 $13,149,411 $8,006,656 $3,270,691 $3,296,452 600,000 - $52,712,002 $13,910,889 $8,770,989 $4,051,276 $4,082,213 800,000 - $54,433,982 $15,643,948 $10,510,445 $5,830,923 $5,872,090 1,000,000 - $56,268,414 $17,322,373 $12,192,218 $7,566,566 $7,652,684 1,200,000 - - - $13,929,676 $9,340,389 $9,443,813 1,800,000 - - - - $16,709,801 $16,857,520 2,500,000 - - - - - -
Indian Agriculture Shortage (af) 2008 2017 2026 2027 2040 2060
400,000 - $414,478 $9,312,403 - - - 500,000 - $1,519,888 $14,973,885 $17,968,660 $17,145,722 $22,004,969 600,000 - $7,647,965 $17,934,942 $20,962,163 $20,778,353 $23,911,269 800,000 - $17,103,947 $25,412,798 $28,397,854 $28,403,141 $40,722,440 1,000,000 - $23,748,789 $33,894,540 $38,696,649 $38,675,888 $44,848,932 1,200,000 - - - $51,659,413 $51,279,840 $57,414,819 1,800,000 - - - - $83,717,890 $88,879,486 2,500,000 - - - - - -

Chapter 4 Environmental Consequences
Draft EIS – Colorado River Interim Guidelines for Lower Basin Shortages and Coordinated Operations for Lake Powell and Lake Mead
4-271 February 2007
Table 4.14-2 Estimated Change in Agricultural Production Value Resulting from Involuntary Land Fallowing
in Arizona under Various Levels of Shortage for Various Years
Total Agriculture Shortage (af) 2008 2017 2026 2027 2040 2060
400,000 - $51,609,657 $21,700,209 - - - 500,000 - $53,473,550 $28,123,296 $25,975,317 $20,416,414 $25,301,421 600,000 - $60,359,967 $31,845,830 $29,733,152 $24,829,629 $27,993,482 800,000 - $71,537,929 $41,056,747 $38,908,299 $34,234,064 $46,594,531 1,000,000 - $80,017,202 $51,216,914 $50,888,868 $46,242,454 $52,501,616 1,200,000 - - - $65,589,088 $60,620,229 $66,858,632 1,800,000 - - - - $100,427,690 $105,737,006 2,500,000 - - - - - -
Note: a dash indicates that a shortage of the given magnitude did not occur in the particular year
1
4.14.2.1 Changes in Agricultural Production and Resulting Changes in 2 Employment and Income in Arizona 3
This section describes the potential changes in employment and income for each 4 alternative as a result of changes in agricultural production. The discussion is a summary 5 of the impact analysis conducted for the Arizona counties that may experience a shortage 6 resulting in changes in agricultural production. The results of this county-level 7 assessment of changes in employment and income for each shortage amount, year, and 8 county are provided in Appendix H. The counties analyzed are Maricopa, Pinal, Pima, 9 Mohave, La Paz, Yuma, and Graham. A summary comparison of the effects on 10 employment and income among the alternatives is provided at the end of this subsection. 11
Table 4.14-3 presents a comparison of the shortage amounts with the estimated changes 12 in employment and income and lists the probabilities of occurrence for each alternative, 13 based on Tables 4.4-5 through 4.4-9. Shortages generated by the alternatives that were 14 not exactly equal to the amounts shown in Table 4.14-3 were counted at the next highest 15 value for the probabilities listed in Table 4.14-3. 16
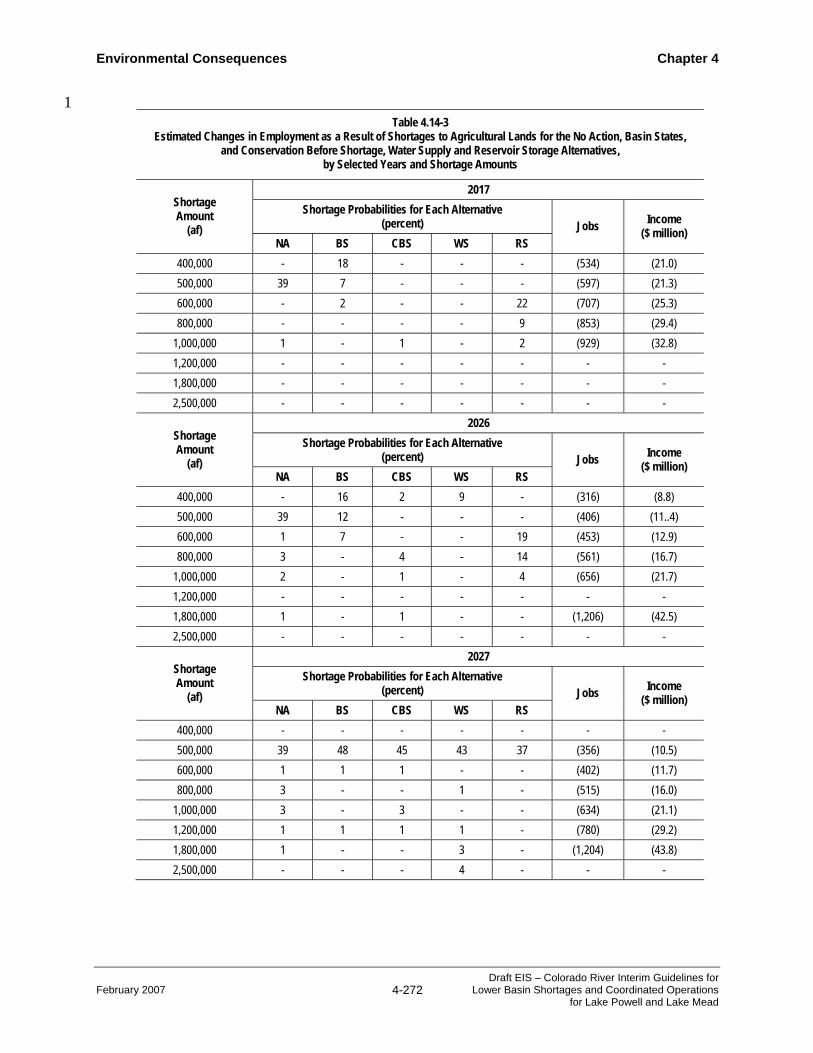
Environmental Consequences Chapter 4
February 2007 4-272 Draft EIS – Colorado River Interim Guidelines for
Lower Basin Shortages and Coordinated Operations for Lake Powell and Lake Mead
1 Table 4.14-3
Estimated Changes in Employment as a Result of Shortages to Agricultural Lands for the No Action, Basin States, and Conservation Before Shortage, Water Supply and Reservoir Storage Alternatives,
by Selected Years and Shortage Amounts
2017 Shortage Probabilities for Each Alternative
(percent)
Shortage Amount
(af) NA BS CBS WS RS
Jobs Income ($ million)
400,000 - 18 - - - (534) (21.0) 500,000 39 7 - - - (597) (21.3) 600,000 - 2 - - 22 (707) (25.3) 800,000 - - - - 9 (853) (29.4)
1,000,000 1 - 1 - 2 (929) (32.8) 1,200,000 - - - - - - - 1,800,000 - - - - - - - 2,500,000 - - - - - - -
2026 Shortage Probabilities for Each Alternative
(percent)
Shortage Amount
(af) NA BS CBS WS RS
Jobs Income ($ million)
400,000 - 16 2 9 - (316) (8.8) 500,000 39 12 - - - (406) (11..4) 600,000 1 7 - - 19 (453) (12.9) 800,000 3 - 4 - 14 (561) (16.7)
1,000,000 2 - 1 - 4 (656) (21.7) 1,200,000 - - - - - - - 1,800,000 1 - 1 - - (1,206) (42.5) 2,500,000 - - - - - - -
2027 Shortage Probabilities for Each Alternative
(percent)
Shortage Amount
(af) NA BS CBS WS RS
Jobs Income ($ million)
400,000 - - - - - - - 500,000 39 48 45 43 37 (356) (10.5) 600,000 1 1 1 - - (402) (11.7) 800,000 3 - - 1 - (515) (16.0)
1,000,000 3 - 3 - - (634) (21.1) 1,200,000 1 1 1 1 - (780) (29.2) 1,800,000 1 - - 3 - (1,204) (43.8) 2,500,000 - - - 4 - - -

Chapter 4 Environmental Consequences
Draft EIS – Colorado River Interim Guidelines for Lower Basin Shortages and Coordinated Operations for Lake Powell and Lake Mead
4-273 February 2007
Table 4.14-3 Estimated Changes in Employment as a Result of Shortages to Agricultural Lands for the No Action, Basin States,
and Conservation Before Shortage, Water Supply and Reservoir Storage Alternatives, by Selected Years and Shortage Amounts
2040 Shortage Probabilities for Each Alternative
(percent)
Shortage Amount
(af) NA BS CBS WS RS
Jobs Income ($ million)
400,000 - - - - - - - 500,000 42 41 40 37 46 (221) (5.7) 600,000 1 1 1 1 - (352) (10.2) 800,000 2 2 2 4 - (454) (14.2)
1,000,000 1 1 1 2 2 (571) (18.4) 1,200,000 3 3 7 4 - (715) (25.2) 1,800,000 4 5 2 5 3 (1,066) (41.6) 2,500,000 - - - - - - -
2060 Shortage Probabilities for Each Alternative
(percent)
Shortage Amount
(af) NA BS CBS WS RS
Jobs Income ($ million)
400,000 - - - - - - - 500,000 55 53 49 53 54 (354) (10.1) 600,000 1 - 3 1 - (388) (11.6) 800,000 4 5 5 4 5 (569) (19.2)
1,000,000 3 2 2 3 1 (640) (21.8) 1,200,000 3 3 4 3 4 (783) (27.9) 1,800,000 4 4 3 4 3 (1,164) (42.9) 2,500,000 - - - - - - -
Note: NA = No Action Alternative WS = Water Supply Alternative CBS = Conservation Before Shortage Alternative BS = Basin States Alternative RS = Reservoir Storage Alternative - = No shortage occurring
1
No Action Alternative. Potential decreases in employment attributable to a shortage 2 occurring under the No Action Alternative for the period 2008 through 2026 would range 3 from a low of 406 jobs during a 500,000 af shortage in 2026 to a high of 1,206 jobs 4 during a 1.8 maf shortage in 2026. Resulting losses in personal income range from a low 5 of approximately $11.4 million to a high of approximately $42.5million (Table 4.14-3). 6

Environmental Consequences Chapter 4
February 2007 4-274 Draft EIS – Colorado River Interim Guidelines for
Lower Basin Shortages and Coordinated Operations for Lake Powell and Lake Mead
For the period 2008 through 2026, a shortage of approximately 500,000 af would have 1 the greatest probability of occurring, estimated at 39 percent. This shortage amount 2 would result in an estimated loss of up to 597 jobs and resulting reduction in personal 3 income of approximately $21.3 million (Table 4.14-3). Even if considered to be 4 permanent, these potential changes in jobs and personal income are not considered 5 substantial because the changes represent less than one percent of total employment and 6 personal income generated within the seven-county study area in Arizona. 7
Potential decreases in employment attributable to a shortage occurring under the No 8 Action Alternative for the period 2027 through 2060 would range from a low of 221 jobs 9 during a 500,000 af shortage in 2040 to high of 1,164 jobs during a 1.8 maf shortage in 10 2060. Resulting losses in personal income over the same period would range from a low 11 of approximately $5.7 million to a high of approximately $42.9 million (Table 4.14-3). 12
For the period 2027 through 2060, a shortage of approximately 500,000 af would have 13 the greatest probability of occurring, ranging from 39 percent in 2027 to 55 percent in 14 2060. In 2060, a 500,000 af shortage would result in an estimated loss of 354 jobs and 15 reduction in personal income of approximately $10.1 million (Table 4.14-3). Even if 16 considered to be permanent, these potential changes in jobs and personal income are not 17 considered substantial because the changes represent less than one percent of total 18 employment and personal income within the seven-county study area in Arizona. 19
Basin States Alternative. Potential decreases in employment attributable to a shortage 20 occurring under the Basin States Alternative for the period 2008 through 2026 would 21 range from a low of 316 jobs during a 400,000 af shortage in 2026 to a high of 707 jobs 22 during a 600,000 af shortage in 2017 resulting in a loss in personal income ranging from 23 approximately $8.8 million to $25.3 million (Table 4.14-3). 24
For the period 2008 through 2026, a shortage of 400,000 af would have the greatest 25 probability of occurring, 18 percent in 2017 and 16 percent in 2026, with corresponding 26 estimated losses of 534 and 316 jobs respectively, and reductions in personal income of 27 approximately $21.0 and 8.8 million respectively. Even if considered to be permanent, 28 these potential changes in jobs and personal income are not considered substantial 29 because the changes represent less than one percent of total employment and personal 30 income within the seven-county study area in Arizona. As with the No Action 31 Alternative, the probabilities of shortages of 600,000 af or greater occurring between 32 2008 and 2026 are very low for the Basin States Alternative. 33
Potential decreases in employment attributable to a shortage occurring under the Basin 34 States Alternative between 2027 and 2060 would range from a low of 221 jobs during a 35 500,000 af shortage in 2040 to a high of 1,164 jobs during a 1.8 maf shortage in 2060. 36 Resulting losses in personal income would range from a low of approximately $5.7 37 million to a high of approximately $42.9 million (Table 4.14-3). 38

Chapter 4 Environmental Consequences
Draft EIS – Colorado River Interim Guidelines for Lower Basin Shortages and Coordinated Operations for Lake Powell and Lake Mead
4-275 February 2007
For the period 2027 through 2060, a shortage of 500,000 af would have the greatest 1 probability of occurring, ranging from 41 to 53 percent. The 500,000 af shortage amount 2 would result in an estimated loss of up to 354 jobs and reduction in personal income of 3 up to $10.1 million (Table 4.14-3). Even if considered to be permanent, these changes in 4 jobs and personal income are not considered substantial because the changes represent 5 less than one percent of total employment and personal income within the seven-county 6 study area in Arizona. The probabilities of shortages of 600,000 af or greater occurring 7 for the period 2027 through 2060 for the Basin States Alternative are higher than during 8 the period 2008 to 2026, but are very similar to the No Action Alternative. 9
Conservation Before Shortage Alternative. It should be noted that the results of the analysis 10 reported in this discussion may underestimate the socioeconomic effects of particular 11 shortages occurring under the Conservation Before Shortage Alternative. This analysis 12 assumes that the voluntary conservation targets (400 kaf, 500 kaf, and 600 kaf at Lake 13 Mead elevations 1,075 feel msl, 1,050 feel msl, and 1,025 feet msl respectively) would be 14 met, assuming that farmers would participate voluntarily in the program and that losses 15 resulting from voluntary shortages would be offset by payments made to farmers to forgo 16 raising crops. With these assumptions, the only the potential impacts of involuntary 17 shortages have been analyzed in this section. 18
Potential decreases in employment attributable to an involuntary shortage occurring 19 under the Conservation Before Shortage Alternative for the period 2008 through 2026 20 would range from a low of 316 jobs during a 400,000 af shortage in 2026 to a high of 21 1206 jobs during a 1.8 maf shortage in 2017. Similarly, estimated losses in personal 22 income would range from a low of approximately $8.8 million to a high of approximately 23 $42.5 million (Table 4.14-3). 24
Shortages of 500,000 af have a much greater probability of occurring under the No 25 Action Alternative than under than under the Conservation Before Shortage Alternative. 26 This suggests for the period 2008 through 2026 the probability of adverse socioeconomic 27 effects occurring under the Conservation Before Shortage Alternative would be much 28 less when compared to the No Action Alternative. 29
Potential decreases in employment attributable to a shortage occurring under the 30 Conservation Before Shortage Alternative for the period 2027 through 2060 would range 31 from a low of 221 jobs during a 500,000 af shortage in 2040 to a high of 1,164 jobs 32 during a 1.8 maf shortage in 2060. Similarly, estimated losses in personal income over 33 the same period would range from a low of approximately $5.7 million to a high of 34 approximately $42.9 million (Table 4.14-3). 35
For the period 2027 through 2060, a shortage of 500,000 af would have the greatest 36 probability of occurring, ranging from 40 percent to 49 percent. This 500,000 af shortage 37 amount would result in an estimated loss of up to 356 jobs and reduction in personal 38 income of approximately $10.5 million (Table 4.14-3). Even if considered permanent, 39 these job losses and reductions in personal income are not considered substantial because 40

Environmental Consequences Chapter 4
February 2007 4-276 Draft EIS – Colorado River Interim Guidelines for
Lower Basin Shortages and Coordinated Operations for Lake Powell and Lake Mead
the changes represent less than one percent of total employment and personal income 1 within both the seven-county study area in Arizona. 2
When compared to the No Action Alternative, the probabilities of shortages in 2027 3 under the Conservation Before Shortage Alternative are higher for shortages of 500,000 4 af and less for greater shortages. However, in 2060 shortages of 500,000 af have a 5 slightly lower probability of occurring under the Conservation Before Shortage 6 Alternative and similar probabilities for higher shortage levels. 7
Water Supply Alternative. For the period 2008 through 2026, potential decreases in 8 employment attributable to a shortage under the Water Supply Alternative would occur 9 only during a 400,000 af shortage in 2026. This would result in an estimated loss of 316 10 jobs and reduction in personal income of $8.8 million (Table 4.14-3). This lack of 11 shortages is a result of this alternative’s strategy to provide full water deliveries until no 12 water remains in Lake Mead, a reservoir draw down situation which has a low probability 13 of occurring during the interim period. 14
Potential decreases in employment attributable to a shortage occurring under the Water 15 Supply Alternative for the period 2027 through 2060 would range from a low of 221 jobs 16 during a 500,000 af shortage in 2040 to a high of 1,164 jobs during a 1.8 maf shortage in 17 2060. Resulting losses in personal income over the same period would range from a low 18 of approximately $5.7 million to a high of approximately $42.9 million (Table 4.14-3). 19
For the period 2040 through 2060, the probability of shortages under the Water Supply 20 Alternative are very similar to those of the other alternatives, and shortages of 500,000 af 21 would have the greatest probability of occurring, ranging from 37 percent to 53 percent. 22 A 500,000 af shortage would result in an estimated loss of up to 356 jobs and reduction in 23 personal income of up to $10.5 million. Even if considered to be permanent, these 24 changes in jobs and personal income are not considered substantial because the changes 25 represent less than one percent of total employment and personal income within the 26 seven-county study area in Arizona. 27
Reservoir Storage Alternative. Potential decreases in employment attributable to a shortage 28 occurring under the Reservoir Storage Alternative for the period 2008 through 2026 29 would range from a low of 453 jobs during a 600,000 af shortage in 2026 to a high of 929 30 jobs during a one maf shortage in 2017. Resulting losses in personal income over the 31 same period would range from a low of approximately $12.9 million to a high of 32 approximately $32.8 million (Table 4.14-3). 33
For the period 2008 through 2026, a shortage of 600,000 af would have the greatest 34 probability of occurring, ranging from 19 percent to 22 percent. A 600,000 af shortage 35 would result in an estimated loss of up to 707 jobs and reduction in personal income of 36 approximately $25.3 million (Table 4.14-3). Even if considered to be permanent, these 37 changes in jobs and personal income are not considered substantial because the changes 38 represent less than one percent of total employment and personal income within the 39 seven-county study area in Arizona. 40
Chapter 4 Environmental Consequences
Draft EIS – Colorado River Interim Guidelines for Lower Basin Shortages and Coordinated Operations for Lake Powell and Lake Mead
4-277 February 2007
When compared to the No Action Alternative, the probabilities of shortages of one maf 1 or greater occurring for the period 2008 through 2026 are similar. However, shortages of 2 500,000 af have a much greater potential of occurring under the No Action Alternative 3 whereas shortages of 600,000 af and 800,000 af have a greater probability of occurring 4 under the Reservoir Storage Alternative. This suggests that for the period 2008 through 5 2026 the probability of adverse socioeconomic effects occurring under the Reservoir 6 Storage Alternative may be slightly less than the No Action Alternative, but when 7 shortages do occur, they are greater in magnitude with increased socioeconomic effects. 8
Potential decreases in employment attributable to a shortage occurring under the 9 Reservoir Storage Alternative for the period 2027 through 2060 would range from a low 10 of 221 jobs during a 500,000 af shortage in 2040 to a high of 1,164 jobs during a 1.8 maf 11 shortage in 2060 (Table 4.14-3). Resulting losses in personal income would range from a 12 low of approximately $5.7 million to a high of approximately $42.9 million 13 (Table .14-3). 14
For the period 2027 through 2060, a shortage of 500,000 af would have the greatest 15 probability of occurring, ranging from 37 percent to 54 percent. A 500,000 af shortage 16 would result in an estimated loss of up to 356 jobs and reduction in personal income of 17 up to $10.5 million (Table 4.14-3). Even if considered to be permanent, these changes in 18 jobs and personal income are not considered substantial because the changes represent 19 less than one percent of total employment and personal income within the seven-county 20 study area and Arizona. 21
When compared to the No Action Alternative, the probabilities of shortages occurring 22 under the Reservoir Storage Alternative are lower than the other alternatives in 2027 but 23 very similar in 2060. 24
4.14.2.2 Changes in Tax Revenues in Arizona 25 This section describes the potential changes in tax revenue for each alternative as a result 26 of changes in agricultural production. Changes in tax revenue would result from the 27 direct reduction in agricultural production, from reduced business-to-business activity, 28 and from reductions in personal income. The tax revenue discussion summarizes the 29 impacts for those Arizona counties that may experience a water shortage resulting in 30 changes in agricultural production. The results of the county-level assessment on tax 31 revenues for each shortage amount, year, and county are provided in Appendix H. The 32 counties analyzed are Maricopa, Pinal, Pima, Mohave, La Paz, Yuma, and Graham. A 33 summary comparison of the effects on tax revenue is provided at the end of 34 this subsection. 35
Table 4.14-4 presents a comparison of the shortage amounts with the estimated changes 36 in tax revenues and lists the probabilities of occurrence for each alternative. Shortages 37 generated by the alternatives that were not exactly equal to the amounts shown in 38 Table 4.14-4 were counted at the next highest value for the probabilities listed in 39 Table 4.14-4. 40

Environmental Consequences Chapter 4
February 2007 4-278 Draft EIS – Colorado River Interim Guidelines for
Lower Basin Shortages and Coordinated Operations for Lake Powell and Lake Mead
1 Table 4.14-4
Estimated Changes in Tax Revenues as a Result of Shortages to Agricultural Lands under the No Action, Basin States, Conservation Before Shortages, Water Supply, and Reservoir Storage Alternatives,
by Selected Year and Shortages 2017
Shortage Probabilities for Each Alternative (percent)
Shortage Amount
(af) NA BS CBS WS RS
Changes in Tax Revenues
($ million)
400,000 - 18 - - - (7.3) 500,000 39 7 - - - (7.5) 600,000 - 2 - - 22 (8.6) 800,000 - - - - 9 (10.1)
1,000,000 1 - 1 - 2 (11.3) 1,200,000 - - - - - - 1,800,000 - - - - - - 2,500,000 - - - - - -
2026 Shortage Probabilities for Each Alternative
(percent)
Shortage Amount
(af) NA BS CBS WS RS
Changes in Tax Revenues
($ million)
400,000 - 16 2 9 - (3.1) 500,000 39 12 - - - (4.0) 600,000 1 7 - - 19 (4.5) 800,000 3 - 4 - 14 (5.8)
1,000,000 2 - 1 - 4 (7.3) 1,200,000 - - - - - - 1,800,000 1 - 1 - - (14.3) 2,500,000 - - - - - -
2027 Shortage Probabilities for Each Alternative
(percent)
Shortage Amount
(af) NA BS CBS WS RS
Changes in Tax Revenues
($ million)
400,000 - - - - - - 500,000 39 48 45 43 37 (3.5) 600,000 1 1 1 - - (4.1) 800,000 3 - - 1 - (5.5)
1,000,000 3 - 3 - - (7.2) 1,200,000 1 1 1 1 - (9.3) 1,800,000 1 - - 3 - (14.8) 2,500,000 - - - 4 - -

Chapter 4 Environmental Consequences
Draft EIS – Colorado River Interim Guidelines for Lower Basin Shortages and Coordinated Operations for Lake Powell and Lake Mead
4-279 February 2007
Table 4.14-4 Estimated Changes in Tax Revenues as a Result of Shortages to Agricultural Lands under the No Action, Basin
States, Conservation Before Shortages, Water Supply, and Reservoir Storage Alternatives, by Selected Year and Shortages
2040 Shortage Probabilities for Each Alternative
(percent)
Shortage Amount
(af) NA BS CBS WS RS
Changes in Tax Revenues
($ million)
400,000 - - - - - - 500,000 42 41 40 37 46 (2.0) 600,000 1 1 1 1 - (3.5) 800,000 2 2 2 4 - (4.9)
1,000,000 1 1 1 2 2 (6.6) 1,200,000 3 3 7 4 - (8.7) 1,800,000 4 5 2 5 3 (11.3) 2,500,000 - - - - - -
2060 Shortage Probabilities for Each Alternative
(percent)
Shortage Amount
(af) NA BS CBS WS RS
Changes in Tax Revenues
($ million)
400,000 - - - - - - 500,000 55 53 49 53 54 (3.6) 600,000 1 - 3 1 - (4.0) 800,000 4 5 5 4 5 (6.6)
1,000,000 3 2 2 3 1 (7.5) 1,200,000 3 3 4 3 4 (9.4) 1,800,000 4 4 3 4 3 (14.6) 2,500,000 - - - - - -
Note: NA = No Action Alternative WS = Water Supply Alternative CBS = Conservation Before Shortage Alternative BS = Basin States Alternative RS = Reservoir Storage Alternative - = No Shortage Occurring
1
Arizona reported a total of $8.477 billion in state taxes collected and $5.943 billion 2 in local government taxes collected for 2001–2002 (<http://ftp2.census.gov/govs/ 3 estimate/02slsstab1a.xls>). These values are compared to the tax impacts associated with 4 the project alternatives, discussed in the following paragraphs and referring to 5 Table 4.14-4 and Appendix H. 6

Environmental Consequences Chapter 4
February 2007 4-280 Draft EIS – Colorado River Interim Guidelines for
Lower Basin Shortages and Coordinated Operations for Lake Powell and Lake Mead
No Action Alternative. Potential decreases in tax revenue for the period 2008 through 2026 1 would range from a low of $4 million during a 500,000 af shortage in 2026 to a high of 2 $14.3 million during a 1.8 maf shortage in 2026. For the period 2008 through 2026, a 3 shortage of approximately 500,000 af would have the greatest probability of occurring, 4 estimated at 39 percent. 5
Potential decreases in tax revenue for the period 2027 through 2060 would range from a 6 low of $2 million during a 500,000 af shortage in 2040 to a high of $14.8 million during a 7 1.8 maf shortage in 2027. For the period 2027 through 2060, a shortage of 500,000 af 8 would have the greatest probability of occurring, estimated at between 39 percent in 2027 9 to 55 percent in 2060. These changes in tax revenues represent a small percentage of total 10 state and local taxes collected. 11
Basin States Alternative. Potential decreases in tax revenue occurring under the Basin 12 States Alternative for the period 2008 through 2026 would range from a low of $3.1 13 million during a 400,000 af shortage in 2026 to a high of $8.6 million during a 600,000 af 14 shortage in 2017. For the period 2008 through 2026, a shortage of 400,000 af would have 15 the greatest probability of occurring, estimated at 16 to 18 percent. 16
Potential decreases in tax revenue attributable to a shortage occurring during the Basin 17 States Alternative during the period 2027 through 2060 would range from a low of $2 18 million during a 500,000 af shortage in 2040 to a high of $14.6 million during a 1.8 maf 19 shortage in 2060. For the period 2027 through 2060, a shortage of 500,000 af would have 20 the greatest probability of occurring, estimated at between 41 percent in 2040 to 53 21 percent in 2060. Although these tax effects are substantial, they represent a small 22 percentage of total state and local taxes collected. 23
Conservation Before Shortage Alternative. This analysis assumes that the voluntary 24 conservation targets (400 kaf, 500 kaf, and 600 kaf at Lake Mead elevations 1,075 feet 25 msl, 1,050 feel msl, and 1,025 feet msl respectively) would be met and therefore only the 26 potential impacts of involuntary shortages have been analyzed. Potential decreases in tax 27 revenue due to an involuntary shortage occurring under the Conservation Before 28 Shortage Alternative during the period 2008 through 2026 would range from a low of 29 $3.1 million during a 400,000 af shortage in 2026 to a high of $11.3 million during a 1 30 maf shortage in 2017. For the period 2008 through 2026, a shortage of 800,000 af would 31 have the greatest probability of occurring, estimated at only four percent. 32
Potential decreases in tax revenue attributable to a shortage occurring under the 33 Conservation Before Shortage Alternative during the period 2027 through 2060 would 34 range from a low of $2 million during a 500,000 af shortage in 2040 to a high of $14.6 35 million during a 1.8 maf shortage in 2060. For the period 2027 through 2060, a shortage 36 of 500,000 af would have the greatest probability of occurring, estimated at between 40 37 percent in 2040 to 49 percent in 2060. Although these tax effects are substantial, they 38 represent a small percentage of total state and local taxes collected. 39
Chapter 4 Environmental Consequences
Draft EIS – Colorado River Interim Guidelines for Lower Basin Shortages and Coordinated Operations for Lake Powell and Lake Mead
4-281 February 2007
Water Supply Alternative. Potential decreases in tax revenue occurring under the Water 1 Supply Alternative during the period 2008 through 2026 would be limited to a loss of 2 $3.1 million during a 400,000 af shortage in 2026. This lack of shortages is a result of 3 this alternative’s strategy to provide full water deliveries until no water remains in Lake 4 Mead, a reservoir draw down situation which has a low probability of occurring during 5 the interim period. 6
Potential decreases in tax revenue attributable to a shortage occurring under the Water 7 Supply Alternative during the period 2027 through 2060 would range from a low of $2 8 million during a 500,000 af shortage in 2040 to a high of $14.6 million during a 1.8 maf 9 shortage in 2060. For the period 2027 through 2060, a shortage of 500,000 af would have 10 the greatest probability of occurring, estimated at between 37 percent in 2040 to 53 11 percent in 2060. Although these tax effects are substantial, they represent a small 12 percentage of total state and local taxes collected. 13
Reservoir Storage Alternative. Potential decreases in tax revenue attributable to a shortage 14 occurring under the Reservoir Storage Alternative during the period 2008 through 2026 15 would range from a low of $4.5 million during a 600,000 af shortage in 2026 to a high of 16 $11.3 million during a 1 maf shortage in 2017. For the period 2008 through 2026, a 17 shortage of 600,000 af in 2017 would have the greatest probabilities of occurring, 18 estimated at 19 to 22 percent. 19
Potential decreases in tax revenue attributable to a shortage occurring under the Reservoir 20 Storage Alternative during the period 2027 through 2060 would range from a low of $2 21 million during a 500,000 af shortage in 2040 to a high of $14.6 million during a 1.8 maf 22 shortage in 2060. For the period 2027 through 2060, a shortage of 500,000 af would have 23 the greatest probability of occurring, estimated at between 37 percent in 2027 to 54 24 percent in 2060. Although these tax effects are substantial, they represent a small 25 percentage of total state and local taxes collected. 26
4.14.2.3 Changes in Agricultural Production in California and Resulting Changes 27 in Employment and Income in California 28
The results of the water allocation modeling indicate that although a portion of the 29 shortages may be shared by California, agricultural users would not be affected in the 30 event a shortage occurs. In California, agricultural rights are senior enough that they are 31 not expected to share in a shortage. None of the alternatives are expected to result in a 32 change in agricultural production. 33
4.14.2.4 Changes in Agricultural Production in Nevada and Resulting Changes in 34 Employment and Income in Nevada 35
The results of the water allocation modeling indicate that although a portion of the 36 shortages may be shared by Nevada, agricultural users would not be affected in the event 37 a shortage occurs. There are very few agricultural users that receive part of Nevada’s 38 Colorado River water allocation. None of the alternatives are expected to result in a 39 change in agricultural production. 40
Environmental Consequences Chapter 4
February 2007 4-282 Draft EIS – Colorado River Interim Guidelines for
Lower Basin Shortages and Coordinated Operations for Lake Powell and Lake Mead
Shortages occurring in Nevada are expected to be limited to the M&I sector. No changes 1 in employment and income as a result of changes in agricultural production in Nevada are 2 expected under any of the alternatives. 3
4.14.3 Municipal and Industrial Water Uses 4 This section provides the results of the assessment of potential changes in M&I water use and 5 resulting socioeconomic effects. The analysis is a qualitative discussion supported by the 6 assessment of the shortage probabilities and volumes described in Section 4.4. 7
For the period 2008 through 2060 the probability of a shortage occurring is highest for 8 shortages ranging from 400,000 to 800,000 af and the probabilities of shortages occurring 9 greater than 800,000 af are very similar among all the alternatives, including the No Action 10 Alternative. Accordingly, the focus of the M&I analysis was to describe the effects of 11 shortages that range from 400,000 af to 800,000 af. 12
For the period 2008 through 2026, the greatest differences in shortage probabilities would 13 occur under the Basin States Alternative and the Reservoir Storage Alternative. In 2017, a 14 600,000 af shortage would have a 22 percent chance of occurring under the Reservoir 15 Storage Alternative compared to a zero percent chance under the No Action Alternative. 16 Conversely, a 500,000 af shortage would have a much greater likelihood of occurring under 17 the No Action Alternative compared to all the action alternatives. 18
For the period 2027 through 2060, the probability of a shortage occurring under each 19 alternative is highest at the 500,000 af shortage level. When compared to the No Action 20 Alternative, shortages of 500,000 af in 2027 have a greater probability of occurring under all 21 the action alternatives. Conversely, in 2040 and in 2060 shortages of 500,000 af have a 22 slightly lower probability of occurring under all the action alternatives when compared to the 23 No Action Alternative. 24
4.14.3.1 Changes in Municipal and Industrial Water Uses In Arizona 25 This section describes the potential socioeconomic effects that would result from changes 26 in deliveries to M&I users in Arizona. As described above, the analysis is based on an 27 analysis of shortage amounts in the range of 400,000 af to 800,000 af. 28
Arizona’s Drought Management Plan serves as an umbrella that provides direction to 29 Arizona state agencies and guidance to regional and local agencies regarding responses to 30 drought conditions (Arizona 2004). Shortages to the Arizona M&I sector would be 31 addressed through the state’s and each local jurisdiction’s drought responses and plans. 32 These responses include supply-side and demand-side actions. Supply-side actions may 33 include groundwater recharge, water purchase agreements, and alternative water supplies 34 such as brackish water and reclaimed water. Demand-side strategies focus on 35 implementing different stages of water conservation measures as a drought progresses. 36 Shortages to the Arizona M&I sector would be addressed through each entity’s supply-37 side and demand-side drought response actions and programs. 38

Chapter 4 Environmental Consequences
Draft EIS – Colorado River Interim Guidelines for Lower Basin Shortages and Coordinated Operations for Lake Powell and Lake Mead
4-283 February 2007
Arizona M&I shortages of up to 283,000 af could occur during shortages in the range of 1 400,000 af to 800,000 af. Implementing statewide and local demand-side and supply-side 2 strategies are expected to minimize adverse socioeconomic effects occurring during the 3 maximum M&I shortage. 4
4.14.3.2 Changes in Municipal and Industrial Water Uses In California 5 The section provides the results of the analysis of changes of potential socioeconomic 6 effects as a result of changes in deliveries to M&I users. The conclusion is based on 7 information provided in the water supply section. In summary, deliveries to MWD are 8 not anticipated to be adversely affected for the Lower Basin shortages up to 1.8 maf 9 because of California’s higher priority relative to Arizona’s and Nevada’s Colorado River 10 water supply priorities. In addition, shortages of 1.8 maf or greater have a low probability 11 of occurring. MWD has or is working on putting in place storage and transfer programs 12 that are expected to provide full supplies when needed even when Colorado River surplus 13 supplies are not available. MWD has implemented and continues to expand storage and 14 transfer programs that could be implemented to make up for water supply shortfalls in the 15 event of a shortage. Examples of MWD actions include agreements with irrigation 16 districts and individual landowners to reduce water use by fallowing lands, funding water 17 efficiency improvements, and banking and exchange programs. 18
MWD is not expected to experience a substantial reduction in deliveries to M&I users 19 during a shortage because of the priority of California’s water rights in combination with 20 the availability of alternative water supplies. The action alternatives are not expected to 21 result in a substantial change in economic activities dependent on M&I deliveries. 22
4.14.3.3 Changes in Municipal and Industrial Water Uses in Nevada 23 This section describes the potential socioeconomic effects that would result from changes 24 in deliveries to M&I users in Nevada. The analysis is based on a comparison of the action 25 alternatives to the No Action Alternative. 26
Shortages to the M&I sector of Southern Nevada would mostly be borne by the SNWA, 27 which has prepared a drought plan (SNWA Drought Plan 2005) to address water 28 shortages. That plan includes two levels – a drought watch and a drought alert and calls 29 for landscape watering restrictions to private lawns, community use recreational turf 30 areas, and golf courses. The plan also includes restrictions on surface, building, 31 equipment, and vehicle washing. 32
Each action alternative would have shortage allocations that are less than or almost 33 equivalent to those under the No Action Alternative. The largest differential would occur 34 under the Water Supply Alternative in 2027, where the shortage would equal 84,290 af as 35 compared to 60,565 af under the No Action Alternative. Even under this most extreme 36 scenario, however, the drought plan would be used to make up the water supply shortfall 37 of less than 25,000 af. For each scenario, the probability of shortages in southern Nevada 38 would not be substantially different than under the No Action Alternative. In addition, 39 with Nevada’s drought plan in place, shortages to the M&I sector (under the No Action 40 Alternative or under either of the action alternatives) would be minimized. Consequently, 41

Environmental Consequences Chapter 4
February 2007 4-284 Draft EIS – Colorado River Interim Guidelines for
Lower Basin Shortages and Coordinated Operations for Lake Powell and Lake Mead
socioeconomic effects on southern Nevada’s M&I sector resulting from the proposed 1 alternatives would not be substantial. 2
4.14.4 Recreation 3 This section describes the changes in reservoir-related and river-related economic activity 4 attributable to implementing the shortage criteria alternatives. The assessment is based, in 5 part, on the conclusions provided in Section 4.3 and Section 4.12. 6
4.14.4.1 Change in Economic Activity as a Result of Changes in Recreation 7 Occurring at Lake Powell 8
The following qualitative assessment of changes in recreation-related economic activity 9 is based on a comparison of Lake Powell elevations modeled for the No Action 10 Alternative and each action alternative. 11
As shown in Figure 4.14-2, at the 90th percentile, there are no differences in Lake Powell 12 end-of-September lake elevations between the alternatives. This suggests that at higher 13 lake elevations there would be no differences in recreation opportunities and associated 14 economic activity among the alternatives. 15
At the 50th percentile, end-of-September reservoir elevations under the Reservoir Storage 16 Alternative would be nearly the same as conditions under the No Action Alternative. This 17 suggests that recreation opportunities and resulting economic activity would not change. 18 Reservoir elevations would be lower under the Conservation Before Shortage, Basin 19 States, and the Water Supply Alternatives when compared to the No Action Alternative, 20 with the Water Supply Alternative showing the lowest 50th percentile elevations. Because 21 the reservoir would have substantial storage under all alternatives at the 50th percentile 22 level, these lower elevations are not expected to result in substantial change in recreation 23 opportunities at Lake Powell and would not result in a substantial change in recreation-24 related economic activity. 25
The greatest differences in Lake Powell elevations would occur at the 10th percentile. 26 Lake Powell elevations would be higher under the Reservoir Storage Alternative when 27 compared to the No Action Alternative. These higher elevations would benefit recreation 28 opportunities at Lake Powell and resulting economic activity. Reservoir levels would be 29 nearly the same for the Basin States, Conservation Before Shortage, and the No Action 30 Alternative. This suggests that recreation-related economic activity would be the same 31 among these three alternatives. Reservoir elevations would be lowest under the Water 32 Supply Alternative and would result in the greatest adverse effect on recreation 33 opportunities and associated reduction in economic activity. 34
4.14.4.2 Change in Economic Activity as a Result of Changes in Recreation 35 Occurring in the Colorado River Below Lake Powell 36
Recreation opportunities and use would not be adversely affected on the Colorado River 37 reach below Lake Powell because flows would not drop below safe boating thresholds for 38 all of the alternatives. There would be no resulting changes in recreation-related 39 economic activity among the alternatives because recreation use is not expected 40 to change. 41
Chapter 4 Environmental Consequences
Draft EIS – Colorado River Interim Guidelines for Lower Basin Shortages and Coordinated Operations for Lake Powell and Lake Mead
4-285 February 2007
4.14.4.3 Change in Economic Activity as a Result of Changes in Recreation 1 Occurring at Lake Mead 2
The following qualitative assessment of changes in recreation-related economic activity 3 is based on a comparison of Lake Powell elevations modeled for the No Action 4 Alternative and each action alternative. 5
As illustrated in Figure 4.14-3, at the 90th percentile, there are essentially no differences 6 in Lake Mead end-of-July lake elevations among the alternatives. This suggests that at 7 the higher lake elevations there would no differences in recreation opportunities and 8 associated economic activity. 9
At the 50th percentile, end-of-July reservoir elevations under the Reservoir Storage 10 Alternative would be higher when compared to the No Action Alternative. This suggests 11 that recreation opportunities and resulting economic activity would be greater under the 12 Reservoir Storage Alternative. Reservoir levels for the Basin States, Conservation Before 13 Shortage, and No Action alternatives would be nearly the same. No substantial 14 differences in economic activity would occur under the Conservation Before Shortage, 15 Basin States, and Water Supply alternatives. 16
The greatest differences in Lake Mead elevations would occur at the 10th percentile. The 17 Lake Mead elevations under the Basin States, Conservation Before Shortage, and Water 18 Supply alternatives would be slightly higher during the interim period when compared to 19 the No Action Alternative. This suggests that there would be only a small, if any, increase 20 in economic activity when compared to the No Action Alternative. The Reservoir Storage 21 Alternative would result in the greatest increase in Lake Mead elevations compared to the 22 No Action Alternative. These higher elevations would benefit recreation opportunities 23 and resulting economic activity. 24
25 4.14.4.4 Changes in Economic Activity as a Result of Changes in Recreation 26
Occurring in the Colorado River Below Lake Mead 27 Recreation opportunities and use would not be adversely affected on the reach of the 28 Colorado River below Lake Mead because releases from Hoover Dam, Davis Dam, 29 Parker Dam, and Imperial Dam would remain within historical ranges. As a result, there 30 would be no change in recreation-related economic activity among the alternatives 31 because recreation opportunities and use are not expected to change. 32
4.14.5 Summary 33 34
4.14.5.1 Employment and Income 35 When compared to the No Action Alternative, none of the action alternatives would 36 result in a substantial change in employment or income attributable to changes in 37 agricultural production. Although a loss in employment and income would occur under 38 each alternative, the probability of shortages occurring would be greater under the No 39 Action Alternative. This suggests that the loss in employment and income estimated for 40 the No Action Alternative would be reduced under each of the action alternatives. Among 41 the action alternatives, shortages would have the greatest probability of occurring under 42

Environmental Consequences Chapter 4
February 2007 4-286 Draft EIS – Colorado River Interim Guidelines for
Lower Basin Shortages and Coordinated Operations for Lake Powell and Lake Mead
the Reservoir Storage and Basin States alternatives, with the Reservoir Storage 1 Alternative producing larger shortages during the interim period. This indicates that these 2 alternatives could potentially result in the greatest loss in employment and income. 3 However, none of the changes in employment and income are considered substantial 4 when compared to total employment and income generated within the study area. 5
For the period 2027 through 2060, the change in employment and income would be 6 similar between the No Action Alternative and the action alternatives. The greatest 7 difference would be in 2027 in which the probabilities would be slightly higher when 8 compared to the No Action Alternatives. However, by 2040, the probabilities of 9 shortages occurring under all alternatives are very similar. 10
4.14.5.2 Tax Revenues 11 When compared to the No Action Alternative, none of the action alternatives would 12 result in a greater change in tax revenues attributable to changes in agricultural 13 production. Although a reduction in tax revenues would occur under each alternative, the 14 probability of a shortage occurring would be greatest under the No Action Alternative. 15 The loss in tax revenue estimated for the No Action Alternative would be lower under 16 each of the action alternatives. Among the action alternatives, shortages would have the 17 greatest probability of occurring under the Reservoir Storage and Basin States 18 alternatives, suggesting that these alternatives would result in the greatest loss in tax 19 revenues. However, none of the changes in tax revenues are considered substantial when 20 compared to total tax revenue generated within the study area. 21
For the period 2027 through 2060, the change in tax revenue would be similar between 22 the No Action Alternative and the action alternatives. The greatest difference would be in 23 2027 in which the shortage probabilities would be slightly higher when compared to the 24 No Action Alternative. However, by 2040, the probabilities of shortages occurring under 25 all alternatives are very similar, suggesting that the change in tax revenues among all 26 alternatives would be similar. 27
4.14.5.3 Municipal and Industrial Water Uses 28 Adverse effects on employment and income in Arizona and Nevada during shortages 29 would be minimized as a result of drought plans being in place. No adverse effects are 30 expected in California because of priority of apportionment and the availability of 31 alternative water supplies. 32
4.14.5.4 Recreation 33 Recreation opportunities and associated economic activity at Lake Powell are not 34 expected to be substantially different between the No Action, Basin States, and 35 Conservation Before Shortage alternatives. Recreation opportunities and associated 36 economic activity would be adversely affected under the Water Supply Alternative. 37 Conversely, recreation opportunities and associated economic activity would benefit 38 under the Reservoir Storage Alternative as a result of higher Lake Powell elevations. 39

Chapter 4 Environmental Consequences
Draft EIS – Colorado River Interim Guidelines for Lower Basin Shortages and Coordinated Operations for Lake Powell and Lake Mead
4-287 February 2007
Recreation opportunities and associated economic activity at Lake Mead are not expected 1 to be substantially different between the No Action Alternative or the Basin States, 2 Conservation Before Shortage, and Water Supply alternatives. Recreation opportunities 3 and associated economic activity would benefit under the Reservoir Storage Alternative 4 as a result of higher Lake Mead elevations. 5
Because flows in the Lake Powell to Lake Mead reach and in the reach downstream of 6 Lake Mead would remain within ranges suitable for boating, there would be no change in 7 river-related economic activity. 8
9

Environmental Consequences Chapter 4
February 2007 4-288 Draft EIS – Colorado River Interim Guidelines for
Lower Basin Shortages and Coordinated Operations for Lake Powell and Lake Mead
This page intentionally left blank. 1 2
Chapter 4 Environmental Consequences
Draft EIS – Colorado River Interim Guidelines for Lower Basin Shortages and Coordinated Operations for Lake Powell and Lake Mead
4-289 February 2007
4.15 Environmental Justice 1
This section describes the methods of analysis, and potential effects on environmental justice 2 communities at the county level. 3
4.15.1 Methodology 4 The nine environmental justice counties were examined by resource to identify whether any 5 of the alternatives are likely to have disproportionate and adverse human health or 6 environmental impacts. 7
4.15.2 Hydrology, Water Deliveries, and Socioeconomics 8 Potential water shortages will not impact water deliveries in Utah (Section 3.2) and would 9 only rarely affect water deliveries in California (Table 4.4-16 and Table 4.4-17). Five of the 10 eight Arizona counties are environmental justice communities. Two of the three counties 11 served by the CAP are environmental justice communities (Pinal and Pima). Under all 12 alternatives, a shortage would cause the reduction of water deliveries first to the CAP and 13 other post-1968 Colorado River contractors in Arizona. While some would consider this a 14 disproportionate impact on these Arizona counties as compared to other Colorado River 15 contractors, this shortage allocation is mandated under the CRBPA, and would occur under 16 all of the action alternatives as well as under the No Action Alternative. 17
As an example of the magnitude of potential socioeconomic impacts, in 2026 a 500,000 af 18 shortage has a 39 percent chance of occurring under the No Action Alternative. This would 19 potentially result in a loss of about 270 jobs. In comparison, under the Basin States 20 Alternative, the probability of occurrence is approximately 12 percent and would result in a 21 loss of the same number of jobs. Under the Conservation Before Shortage Alternative and the 22 Water Supply Alternative, there would be a zero percent probability of this shortage in 2026. 23 Under the Reservoir Storage Alternative, there is a zero percent probability of shortage in 24 2026. The biggest difference in the probability of shortage occurs in 2017 with a 22 percent 25 probability of occurrence under the Reservoir Storage Alternative and a zero percent 26 probability of occurrence under the No Action Alternative. Even so, this effect is projected to 27 only result in the loss of approximately 215 jobs. The loss in the number of jobs is so small 28 compared to the total number of jobs in the environmental justice counties that the effects of 29 the alternatives are negligible. 30
Accordingly, there is no substantive difference among the alternatives with respect to 31 environmental justice impacts from water deliveries and socioeconomics. 32
4.15.3 Water Quality 33 Potential changes to water quality were evaluated for salinity, temperature, metals, and 34 perchlorate. Effects on these parameters would be minor and would not disproportionately 35 affect any environmental justice communities in the study area. For example, in Imperial 36 County, California, the predicted salinity values would range from 740 mg/L to 764 mg/L. 37 All values are below the 879 mg/L numeric criterion established by the Colorado River 38 Salinity Control Forum. 39

Environmental Consequences Chapter 4
February 2007 4-290 Draft EIS – Colorado River Interim Guidelines for
Lower Basin Shortages and Coordinated Operations for Lake Powell and Lake Mead
4.15.4 Air Quality 1 Potential changes to fugitive dust emissions due to exposed shoreline are minor at Lake 2 Powell (San Juan County) and there is no significant difference among alternatives at Lake 3 Mead or downstream. Therefore, the proposed federal action would not disproportionately 4 impact any environmental justice communities. 5
4.15.5 Visual Resources 6 Potential impacts to visual resources were considered for calcium carbonate rings, attraction 7 features, and sediment deltas. While some of these features are located within San Juan 8 County, Utah, (e.g. Rainbow Bridge) an environmental justice community, effects are not 9 disproportionate or unique to any environmental justice community. 10
4.15.6 Biological Resources 11 Potential impacts to biological resources would not disproportionately impact any 12 environmental justice community identified within the study area. Potential impacts to 13 vegetation, wildlife, and fish due to the action alternatives would be minor. 14
Scoping and subsequent consultation did not result in the identification of any environmental 15 justice community for whom indigenous fish, vegetation, or wildlife constituted a significant 16 portion of their diet. There will not be any difference in rates or patterns of subsistence 17 consumption by environmental justice communities, including Indian tribes, in comparison to 18 the general population in the study area. 19
4.15.7 Cultural Resources 20 Potential impacts or access to cultural resources are not expected to be unique to the 21 environmental justice communities identified in the study area. Reclamation and the 22 cooperating agencies are committed to compliance with all laws and regulations associated 23 with historic properties, sacred sites, and cultural resources. Consultations are ongoing with 24 concerned Indian tribes. 25
4.15.8 Indian Trust Assets 26 Reclamation has concluded that the proposed federal action will have no significant impacts 27 on ITAs. Reclamation is committed to protecting and maintaining ITAs and rights reserved 28 by or granted to Indian tribes or individual Indians by treaties, statutes, and executive orders. 29
4.15.9 Electrical Power Resources 30 Changes to electrical power production among the alternatives have the potential to affect 31 environmental justice communities disproportionately through possible minor increases in 32 electricity rates resulting from decreased electrical power generation under some of the 33 action alternatives. However, these changes in electrical power production are generally very 34 minor (less than one percent) and the facilities potentially affected produce less than four 35 percent of the total power produced in the region. Therefore no substantial environmental 36 justice effects are anticipated. 37

Chapter 4 Environmental Consequences
Draft EIS – Colorado River Interim Guidelines for Lower Basin Shortages and Coordinated Operations for Lake Powell and Lake Mead
4-291 February 2007
4.15.10 Recreation 1 Potential recreational impacts are primarily associated with shoreline facilities around Lake 2 Powell and Lake Mead. San Juan County, Utah, which is greater than 50 percent minority, 3 includes a portion of Lake Powell and could be affected by these recreational impacts; 4 however, the effect would not be disproportionate to the recreational impacts experienced by 5 other counties adjacent to Lake Powell and Lake Mead. 6
4.15.11 Transportation 7 Potential transportation impacts are associated primarily with ferry services on Lake Powell 8 and on the Colorado River below Davis Dam. At Lake Powell, both San Juan County and 9 Kane County would be equally affected by any disruption to the ferry service due to low 10 reservoir levels. San Juan County would not be disproportionately affected. Below Davis 11 Dam, the ferry service across the river serves two non-environmental justice counties. 12
4.15.12 Summary 13 After evaluating each resource, it is concluded that the environmental justice communities 14 identified in the study area would not be disproportionately affected by any of the anticipated 15 environmental impacts stemming from the proposed federal action. 16
17
18

Environmental Consequences Chapter 4
February 2007 4-292 Draft EIS – Colorado River Interim Guidelines for
Lower Basin Shortages and Coordinated Operations for Lake Powell and Lake Mead
This page intentionally left blank. 1 2