Embed Size (px)
Citation preview
47
Chapter 4. Construction of Indicators
CONSTRUCTION OF INDICATORS4
In this chapter, criteria for the development and use of indicators areoutlined, and issues to be addressed in their construction are highlighted.The applicability of the criteria developed will depend on the indicatorsin question and on the purpose of the indicator. Issues discussed includethe specification of indicators, measurement units and variables,assessment of data sources, statistical considerations and issues ofinterpretation and risk communication. Examples are given to illustratethese aspects.
4.1 CRITERIA FOR INDICATORS
“Indicators are a way of seeing the big picture by looking at a small piece of it”(46).
Plan Canada (46) has described the process of indicator development as involvingthe following elements:
• definition of the characteristics to be measured• identification of the target audience and the purpose of the indicator• choosing a framework (i.e. one based on goals, issues, sectors or stress-
condition-response)• definition of criteria for selecting indicators• identification and evaluation of a potential indicator on the basis of the
selection criteria• pilot-testing of the indicator• choosing the final set and reviewing the indicator periodically.
Different types of decisions and issues require different types and levels of indicators.To be really useful, indicators should be applicable to the user and not just technicallyrelevant or relevant to the data providers. The choice of indicators will depend onsuch factors as the purpose for their use and the target audience. As stated earlier,indicators can be used for problem definition, policy formulation, policy implementationand evaluation. Sometimes the same indicators can serve many purposes, while inother situations separate sets of indicators may be needed.
Many organizations have attempted to define criteria for the construction and selectionof indicators, depending on whether they apply to policy, analytical soundness ormeasurability. They may also be assessed in relation to factors such as transparency,scientific validity, robustness, sensitivity and the extent to which they are linkable, or
Health in Sustainable Development Planning: The Role of Indicators
48
according to whether they are relevant to the issue they are intended to describe,whether they relate to changes in policy and practice or whether they “strike a chord”with their intended audience (21).
Criteria that could be used in developing indicators are given in the box below. Theapplicability of the criteria depends, however, on the particular indicator and on thepurpose for which it is to be used. For example, if the main concern is long-termenvironmental change, the criteria will include such factors as responsiveness tochanges in the environment and human activities, capacity to provide early warningof pending changes, sensitivity to changes in the environment and so forth. If theindicators are intended primarily to inform the general public, the criteria will includesuch factors as simplicity, ease of interpretation and attractiveness to a range ofinterested parties. No single set of criteria will be applicable to all the indicators derived.Indeed, if all the indicators selected were to conform with all the desired criteria, veryfew would exist. Each situation has its own priorities for data collection and analysis.
As stated earlier, indicators of health and environment are based on the concept of alink between a factor in the environment and a health outcome (22). An environmentalor a health outcome indicator can thus be regarded as an indicator of a health-environment relationship if there is some connection between the health indicatorand the environment or between the environmental indicator and health. This is notas simple as it sounds because of the complexity of the factors involved, which bearon the nature of the relationship between the environment and human health (theseare discussed more fully in Chapter 7). Nevertheless, even if direct evidence of thenature of the relationship cannot be obtained or it cannot be quantified, indirectinformation on interactions between the environment and health can often be obtained,and reasonable inferences can be made on the basis of general knowledge about therelationship.
Indicators must be as specific as possible with respect to a particular issue, in orderto maximize the usefulness of the information for decision-making. Indicators shouldalso be scientifically credible, unbiased and representative of the condition concerned.The aspect of representativeness is particularly important when descriptive indicatorsare used to obtain baseline information on health and environment in a particularsetting (see Section 2.2). Indicators should be consistent and comparable in differentsettings, in both time and space, and should be relatively unaffected by smalldifferences in methods and measurement techniques that may occur in the variouscontexts and settings in which information is collected.
In order to be as useful as possible, indicators should be readily understandable byinterested parties and potential users and should be based on information that iseither readily available or relatively easy and inexpensive to collect. The data shouldalso allow disaggregation in order to assess trends at the lowest possible level ofresolution, to identify groups or areas at risk and to allow identification of inequities(on the basis of geographical patterns, sex, socioeconomic status and other variables).
The general criteria for health and environment indicators listed in the box below aremeant to serve as an overall guide to the types of issues that should be considered.
49
Chapter 4. Construction of Indicators
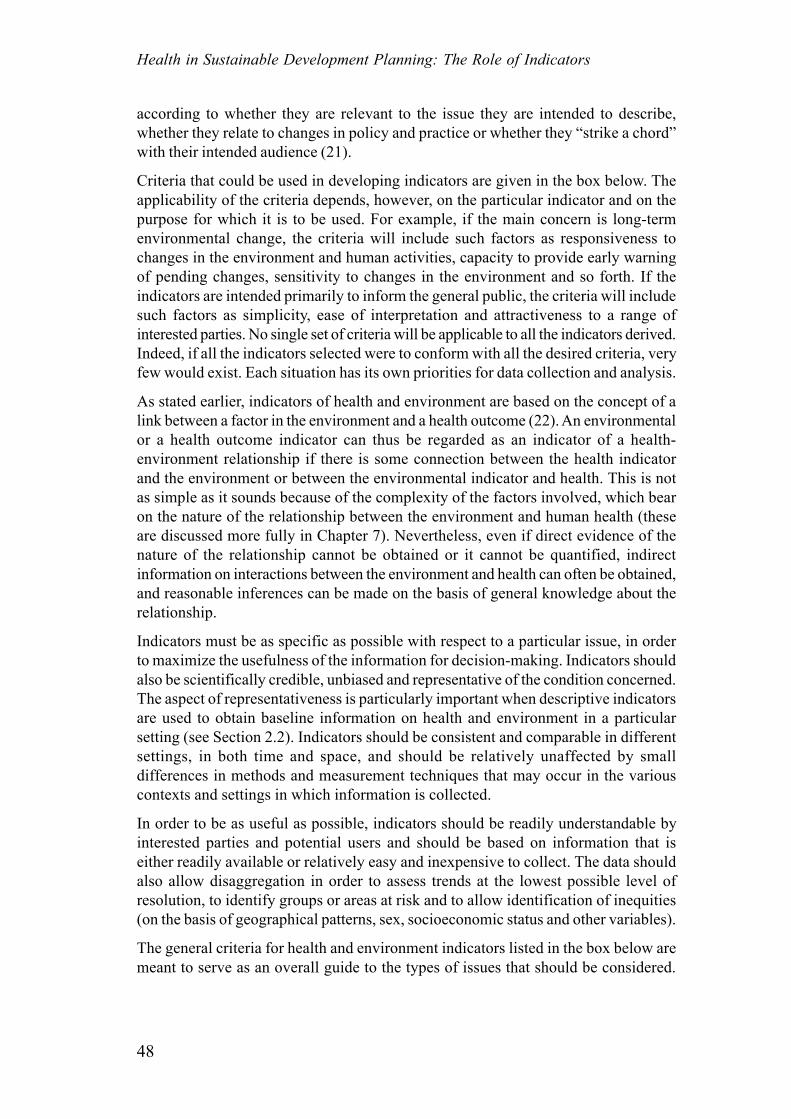
Box 4GENERAL CRITERIA FOR INDICATORS
Indicators should be:
Generally relevant• Related to a specific question or issue of concern• Health-related and linked to environment/development factors• Sensitive to changes in the conditions in question• Give early warning of pending changes
Scientifically sound• Unbiased and representative of the conditions in question• Scientifically credible, reliable and valid• Based on the best available data of acceptable quality• Robust and unaffected by minor changes in the method or scale used in their
construction• Consistent and comparable over time and space
Applicable to users• Relevant to policy and management needs• Based on data that are available or can be collected or monitored with a reasonable
financial/time resource input• Easily understood and applied by potential users• Acceptable to stakeholders
Source: modified and adapted from Briggs et al. (22)
In addition to these general criteria, others for the development of international andlocal indicators may be specified (see also Sections 2.3 and 2.4).
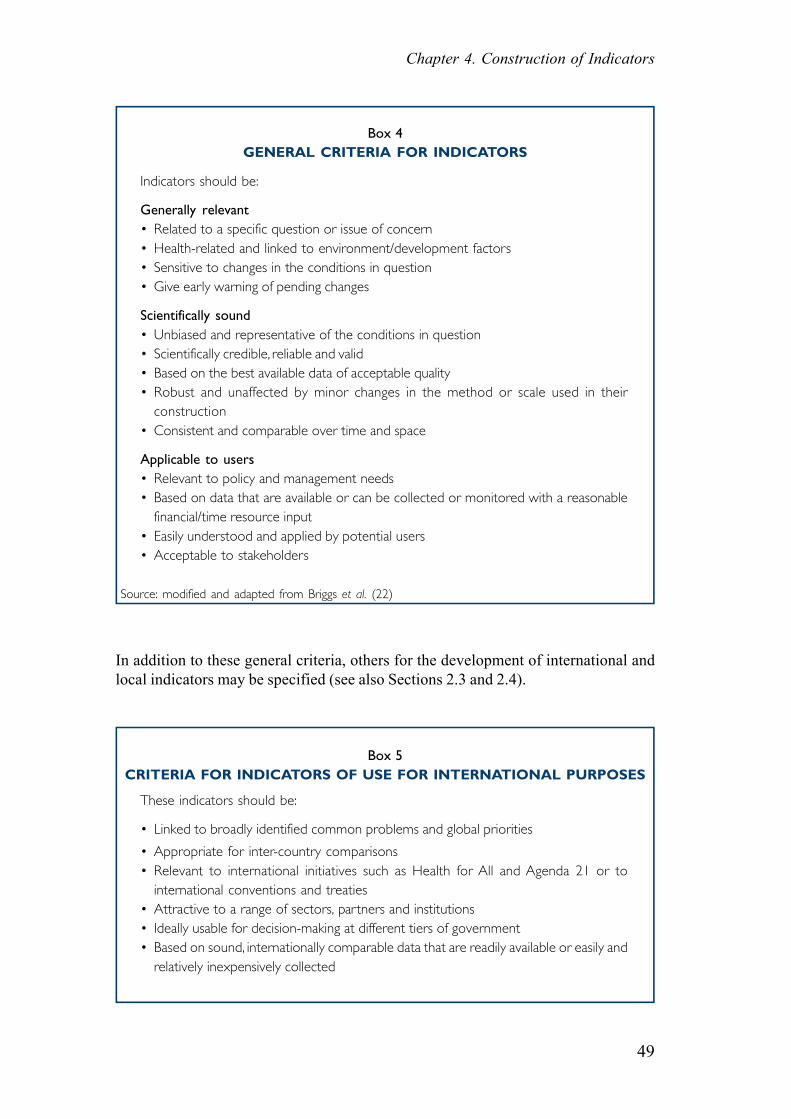
Box 5CRITERIA FOR INDICATORS OF USE FOR INTERNATIONAL PURPOSES
These indicators should be:
• Linked to broadly identified common problems and global priorities
• Appropriate for inter-country comparisons• Relevant to international initiatives such as Health for All and Agenda 21 or to
international conventions and treaties• Attractive to a range of sectors, partners and institutions• Ideally usable for decision-making at different tiers of government• Based on sound, internationally comparable data that are readily available or easily and
relatively inexpensively collected
Health in Sustainable Development Planning: The Role of Indicators
50
Box 6CRITERIA FOR INDICATORS OF USE FOR LOCAL PURPOSES
These indicators should:
• Be relevant both to individual citizens and to local government
• Reflect local circumstances• Be based on information that can be readily collected• Show trends over a reasonable period of time• Be meaningful both in their own right and in conjunction with other indicators• Be clear and easy to understand, in order to educate and inform• Provoke change (for example in policies, services or lifestyles)• Lead to the setting of targets or thresholds
Source: adapted from Local Government Management Board, United Kingdom (47)
While there are no cardinal rules or set procedures to be followed in developingindicators, the issues discussed in the following sections might serve as a usefulguide.
4.2 DEFINITION AND SPECIFICATION OF INDICATORS,MEASUREMENT UNITS AND VARIABLES
In identifying the type of data that will be needed for a particular indicator, the indicatormust be clearly defined and the measurement units and variables specified. Indicatorsmay be defined with different levels of specificity, for instance, as “the amount ofozone-depleting substances eliminated as a result of the Montreal Protocol”, “themedian usable living space per person”, “the percentage of the population living inurban areas”, “emissions of sulfur dioxide into the atmosphere” or “the percentageof people who feel safe going out at night”. Some indicators have precise definitions,others have definitions involving choices, while yet others have only loose definitionsand may be less quantifiable and measurable.
The units of measurement must be clearly defined, for example:
• Tons of sulfur dioxide emitted per year• Annual environmental health expenditure in US$• Tonnes of fertilizer nutrients per 10 km2 of agricultural land• Biological oxygen demand expressed as milligrams per litre of oxygen
consumed in 5 days at a constant temperature of 20º C• Litres of water consumed per capita per day• Proportion of people living in areas with air quality within acceptable
standards• Number of square metres of living space per inhabitant.
51
Chapter 4. Construction of Indicators
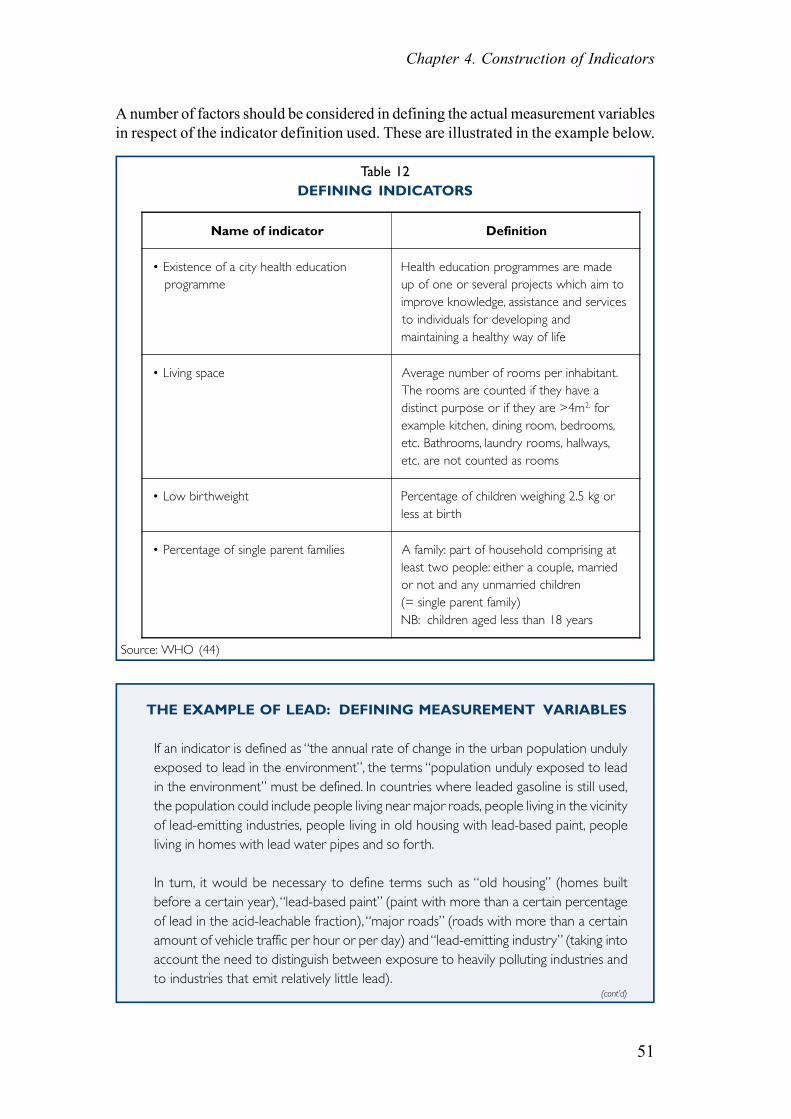
A number of factors should be considered in defining the actual measurement variablesin respect of the indicator definition used. These are illustrated in the example below.
Table 12DEFINING INDICATORS
Source: WHO (44)
THE EXAMPLE OF LEAD: DEFINING MEASUREMENT VARIABLES
If an indicator is defined as “the annual rate of change in the urban population undulyexposed to lead in the environment”, the terms “population unduly exposed to leadin the environment” must be defined. In countries where leaded gasoline is still used,the population could include people living near major roads, people living in the vicinityof lead-emitting industries, people living in old housing with lead-based paint, peopleliving in homes with lead water pipes and so forth.
In turn, it would be necessary to define terms such as “old housing” (homes builtbefore a certain year), “lead-based paint” (paint with more than a certain percentageof lead in the acid-leachable fraction), “major roads” (roads with more than a certainamount of vehicle traffic per hour or per day) and “lead-emitting industry” (taking intoaccount the need to distinguish between exposure to heavily polluting industries andto industries that emit relatively little lead).
Name of indicator Definition
• Existence of a city health education programme
Health education programmes are madeup of one or several projects which aim toimprove knowledge, assistance and servicesto individuals for developing andmaintaining a healthy way of life
• Living space Average number of rooms per inhabitant.The rooms are counted if they have adistinct purpose or if they are >4m2, forexample kitchen, dining room, bedrooms,etc. Bathrooms, laundry rooms, hallways,etc. are not counted as rooms
• Low birthweight Percentage of children weighing 2.5 kg orless at birth
• Percentage of single parent families A family: part of household comprising atleast two people: either a couple, marriedor not and any unmarried children(= single parent family)NB: children aged less than 18 years
(cont’d)
Health in Sustainable Development Planning: The Role of Indicators
52
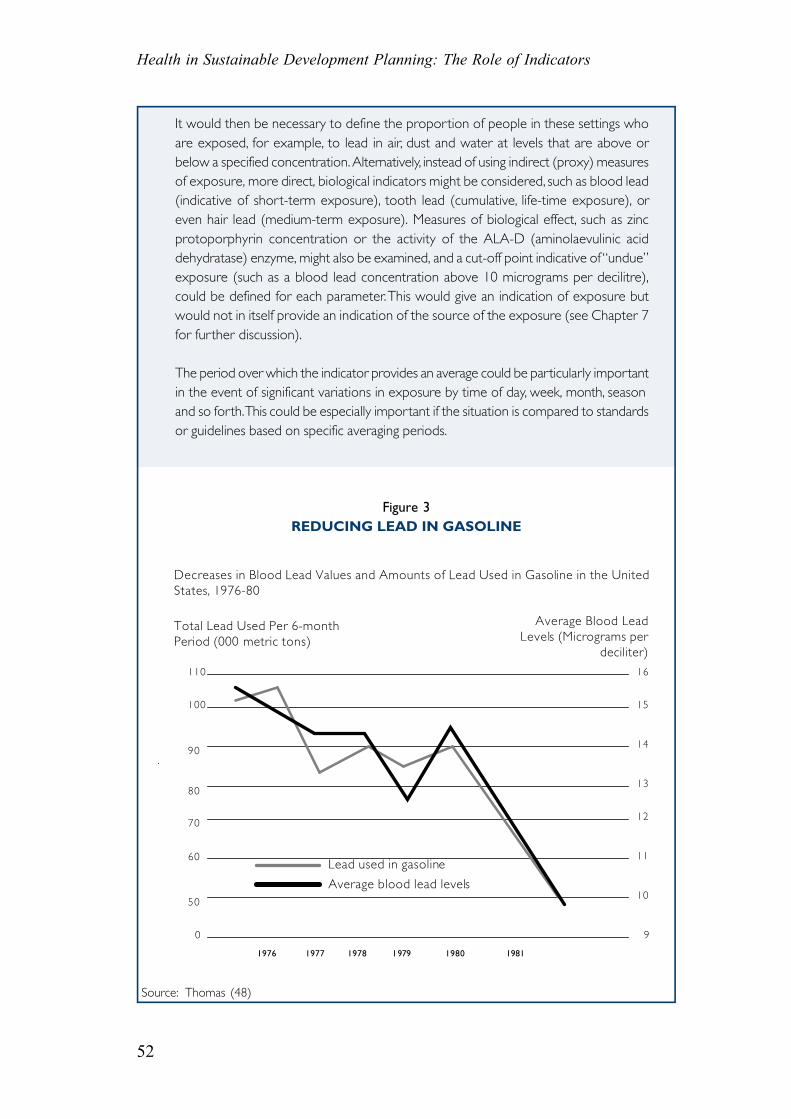
It would then be necessary to define the proportion of people in these settings whoare exposed, for example, to lead in air, dust and water at levels that are above orbelow a specified concentration. Alternatively, instead of using indirect (proxy) measuresof exposure, more direct, biological indicators might be considered, such as blood lead(indicative of short-term exposure), tooth lead (cumulative, life-time exposure), oreven hair lead (medium-term exposure). Measures of biological effect, such as zincprotoporphyrin concentration or the activity of the ALA-D (aminolaevulinic aciddehydratase) enzyme, might also be examined, and a cut-off point indicative of “undue”exposure (such as a blood lead concentration above 10 micrograms per decilitre),could be defined for each parameter. This would give an indication of exposure butwould not in itself provide an indication of the source of the exposure (see Chapter 7for further discussion).
The period over which the indicator provides an average could be particularly importantin the event of significant variations in exposure by time of day, week, month, seasonand so forth. This could be especially important if the situation is compared to standardsor guidelines based on specific averaging periods.
Figure 3REDUCING LEAD IN GASOLINE
Source: Thomas (48)
Decreases in Blood Lead Values and Amounts of Lead Used in Gasoline in the United States, 1976-80
Total Lead Used Per 6-month Period (000 metric tons)
Average Blood Lead Levels (Micrograms per
deciliter)
1976 1977 1978 1979 1980 1981
110
100
90
80
70
60
50
0
16
15
14
13
12
11
10
9
Lead used in gasoline
Average blood lead levels
53
Chapter 4. Construction of Indicators
4.3 SPECIFICATION OF DATA SOURCES
Once the measurement variables have been defined, the data requirements and sourcescan be more readily specified. It is important for countries and organizations to notethe data requirements implied by indicators and to incorporate these data in theirstandard monitoring and reporting systems as far as possible. Local circumstanceswill usually dictate what is feasible in terms of data collection. Monitoring andsurveillance programmes may provide the basic data for indicator construction andindeed may be the only information available for the purpose. Nevertheless, theavailable data may refer to health and environmental conditions at different levels ofresolution, making it difficult to form links between health and environmentalconditions or to identify groups at risk. Data may be available for inadequate timeperiods or intervals and may not suffice to determine spatial or temporal trends.
Obtaining relevant data at country level remains a significant problem, particularly inpoor countries, where there is often inadequate coverage and problems such asmisclassification of illnesses and quality control in measurements may occur.Nevertheless, most countries have some kind of information system, even if it is fairlyrudimentary and the recording systems incomplete. Almost all countries experienceproblems of data coverage and quality, to a greater or lesser degree. When data arenot available or not usable, special surveys could be carried out that are restricted tospecific issues, areas or groups. In many cases, valuable data can be provided simplyby strengthening existing systems. A key priority is to establish informationmanagement systems in countries with poorly developed data sources.
All major sources of information relevant to the measurement variables should beidentified. This will depend on the level of resolution at which the data are required.For most issues, there is no single source of information for any one indicator, so thatmany sources may have to be consulted for different pieces of information. It mightbe necessary to use routine information collected by government departments andagencies (global, national and local) and published in annual reports or censuses, forexample. Information may also be obtainable from universities and researchorganizations, non-governmental organizations and community-based organizations,service organizations, environmental monitoring groups, industry and the privatesector. Reports on the state of the environment, audits, monitoring programmes andcensuses are useful sources of data at all levels.
A relatively large amount of data is available on health and environmental conditionsworld-wide, going back over a long period. For example, much useful data has beengenerated in various global monitoring programmes such as the former UNEP/WHOGlobal Environmental Monitoring System (GEMS) network (49, 50), and trans-nationalinformation systems such as the CORINE system (51). Improvements in fieldmonitoring techniques and advances in modeling and computing have increased theamount of data on the state of the environment at various levels.
The quality and quantity of health information has also improved with advances inhealth information systems and health reporting. Several international sources ofinformation are available on environmental health effects, such as the Environmental
Health in Sustainable Development Planning: The Role of Indicators
54
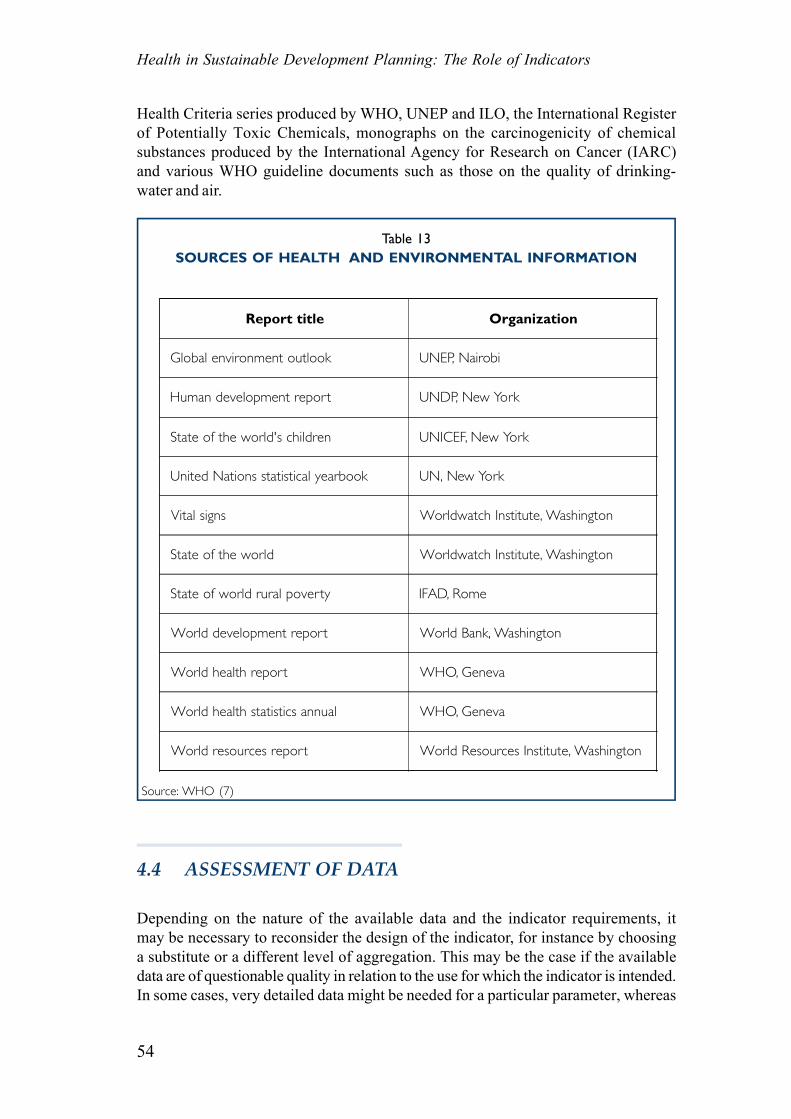
Health Criteria series produced by WHO, UNEP and ILO, the International Registerof Potentially Toxic Chemicals, monographs on the carcinogenicity of chemicalsubstances produced by the International Agency for Research on Cancer (IARC)and various WHO guideline documents such as those on the quality of drinking-water and air.
Table 13SOURCES OF HEALTH AND ENVIRONMENTAL INFORMATION
Source: WHO (7)
Report title Organization
Global environment outlook UNEP, Nairobi
Human development report UNDP, New York
State of the world's children UNICEF, New York
United Nations statistical yearbook UN, New York
Vital signs Worldwatch Institute, Washington
State of the world Worldwatch Institute, Washington
State of world rural poverty IFAD, Rome
World development report World Bank, Washington
World health report WHO, Geneva
World health statistics annual WHO, Geneva
World resources report World Resources Institute, Washington
4.4 ASSESSMENT OF DATA
Depending on the nature of the available data and the indicator requirements, itmay be necessary to reconsider the design of the indicator, for instance by choosinga substitute or a different level of aggregation. This may be the case if the availabledata are of questionable quality in relation to the use for which the indicator is intended.In some cases, very detailed data might be needed for a particular parameter, whereas
55
Chapter 4. Construction of Indicators
in others a rough indication of a parameter might suffice.
Bearing in mind the repercussions (often financial) for decision-makers of acting onthe basis of information conveyed through indicators, it is vital to ensure that theinformation collected is as accurate and reliable as the situation dictates. Qualitycontrol is an important aspect which must be carefully addressed (see further standardtexts on epidemiology). For example, the accuracy and reliability of routine healthdata may differ greatly from one place to another. As already indicated, discrepanciesin diagnosis, notification and reporting (under- and over-reporting) may occur, aswell as differences in referral procedures and misclassification of diseases. The problemis usually more serious with regard to data on morbidity than to that on mortality, forwhich standard classifications exist. Quality control of environmental data is alsosubject to a variety of problems. Differences in sampling and measurement methodsmay affect the results, and the data may be unrepresentative. For all these reasons,procedures for checking accuracy, consistency and comparability should beintroduced.
Trends should be examined for inconsistencies, data sources should be assessed,and “outliers”, or unexpected departures from established relationships, should becarefully checked. The definitions used, the data sources relied upon and the methodsused should be carefully documented, so that the process of information collectionis as transparent as possible, enabling outside parties to cross-check data for theirvalidity (22). For example, if the measurement variable concerned is the concentrationof nitrogen dioxide, the methods used for monitoring (passive versus stationarymonitoring) and the analytical procedures (spectrophotometry, ion chromatographyor others) should be specified. If the measurement variable is blood lead concentration,the blood sampling method (for example intravenous or capillary) and the analyticaltechniques (for example atomic absorption spectrophotometry or gas chromatography)should be specified. Quality control measures should be specified in all cases.
4.5 STATISTICAL CONSIDERATIONS
The form in which an indicator is presented can have important consequences fordecision-making (see also Section 4.6). An indicator can be measured at one time,over several times or continuously, to show changes in a parameter. Indicators canbe presented in a variety of statistical forms, for example as simple frequencies ormagnitudes (number of deaths, number of people with health effects of interest), asrates (emissions, mortality and morbidity), as ratios (for example pollution level inrelation to the WHO guideline level, standardized mortality ratio), as measurementsof rate change (rate of population growth, rate of reduction in air pollution level), orin various more complex forms. The form chosen should reflect the purpose of theindicator.
It is usually necessary to identify the level of geographic aggregation and thedenominator population, the group or groups at risk and the spatial and temporaldimensions of the problem or issue to be addressed. When relevant and possible,
Health in Sustainable Development Planning: The Role of Indicators
56
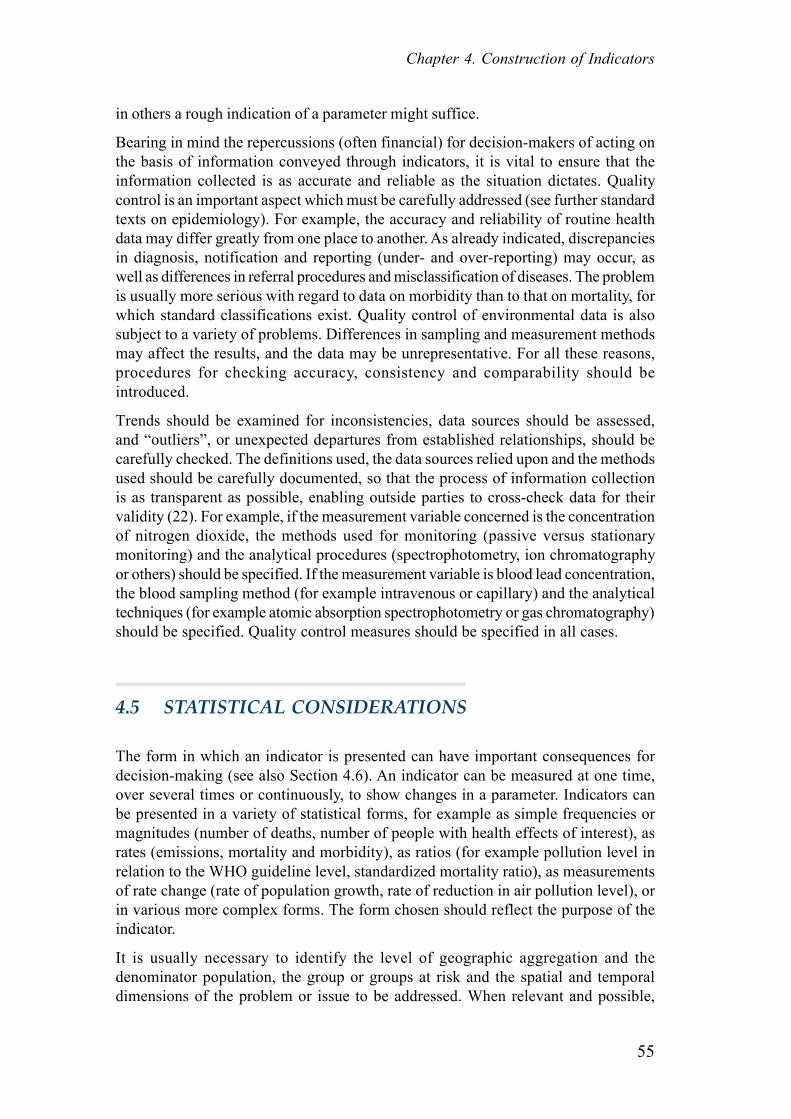
Figure 4NUMBERS OF PEOPLE USING DIFFERENT HOUSEHOLD FUELS,
BY REGION, 1990s
Source: WHO (7)
Source: World Bank (52)
Figure 5AMBIENT CONCENTRATIONS OF AIR POLLUTANTS, 1995 (CHINA)
TOTAL SUSPENDED PARTICULATES SULFUR DIOXIDE
BEIJING
SHENYANG
SHANGHAI
CHONGQING
TAIYUAN
JINAN
BANGKOK
JAKARTA (1991)
LOS ANGELES
TOKYO0 100 200 300 400 500 600 0 50 100 150 200 250 300 350
MICROGRAMS PER CUBIC METER
(annual mean concentration)
1200
1000
800
600
400
200
0
SSA India China OAI LAC MEC FSE EME
Biomass
Non-solid fuel
Region
Coal
Popu
latio
n (m
illio
ns)
SSA: Sub-Saharan Africa
OAI: Other Asia and Islands
LAC: Latin America and the Carribean
MEC: Middle Eastern Crescent
FSE: Former Socialist Economies of Europe
EME: Established Market Economies
57
Chapter 4. Construction of Indicators
data should be disaggregated, for example, by age and sex, geographical area,socioeconomic status, urban-rural divide, national and sub-national level and by otherindicators of inequity and inequality.
Absolute counts or frequencies are usually not very useful, as they do not takeaccount of the size of the population at risk, which may be large or small, increasingor decreasing and will therefore affect the absolute counts of events such as deaths.The rates calculated should relate the event to the population at risk, for example,representing infant deaths per 1000 population or children with raised blood lead
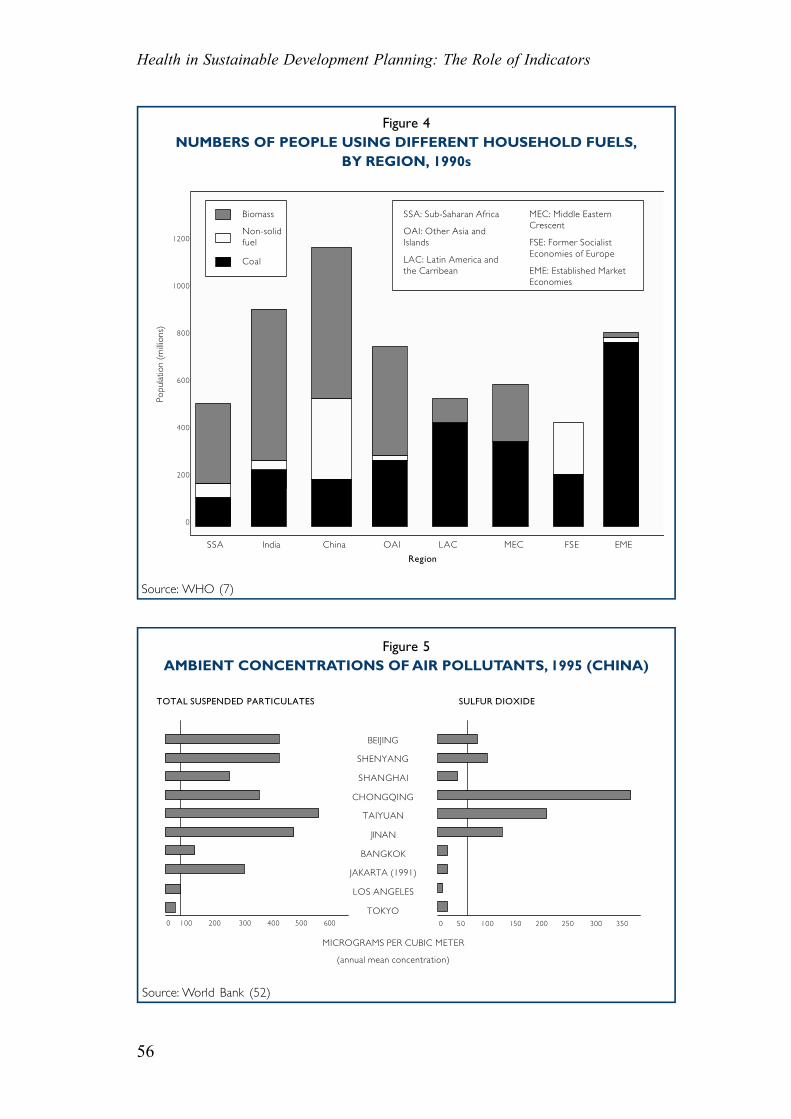
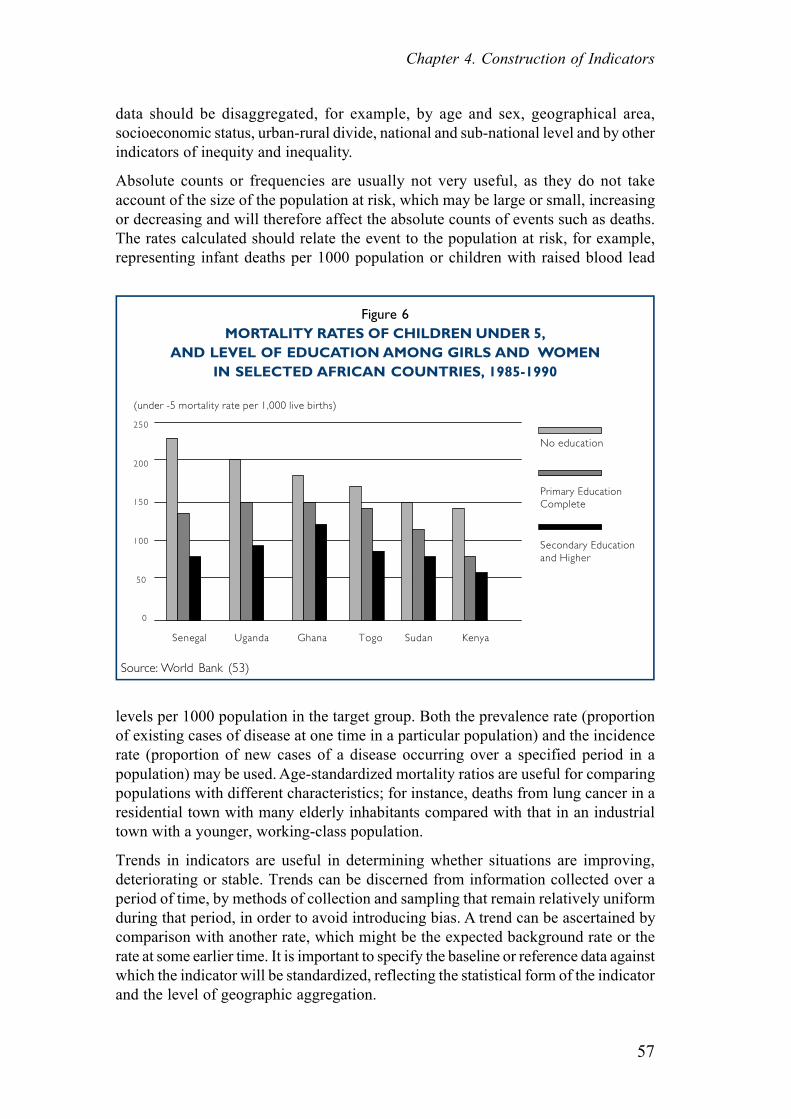
Figure 6MORTALITY RATES OF CHILDREN UNDER 5,
AND LEVEL OF EDUCATION AMONG GIRLS AND WOMENIN SELECTED AFRICAN COUNTRIES, 1985-1990
levels per 1000 population in the target group. Both the prevalence rate (proportionof existing cases of disease at one time in a particular population) and the incidencerate (proportion of new cases of a disease occurring over a specified period in apopulation) may be used. Age-standardized mortality ratios are useful for comparingpopulations with different characteristics; for instance, deaths from lung cancer in aresidential town with many elderly inhabitants compared with that in an industrialtown with a younger, working-class population.
Trends in indicators are useful in determining whether situations are improving,deteriorating or stable. Trends can be discerned from information collected over aperiod of time, by methods of collection and sampling that remain relatively uniformduring that period, in order to avoid introducing bias. A trend can be ascertained bycomparison with another rate, which might be the expected background rate or therate at some earlier time. It is important to specify the baseline or reference data againstwhich the indicator will be standardized, reflecting the statistical form of the indicatorand the level of geographic aggregation.
Source: World Bank (53)
(under -5 mortality rate per 1,000 live births)
250
200
150
100
50
0
Senegal Uganda Ghana Togo Sudan Kenya
No education
Secondary Education and Higher
Primary Education Complete
Health in Sustainable Development Planning: The Role of Indicators
58
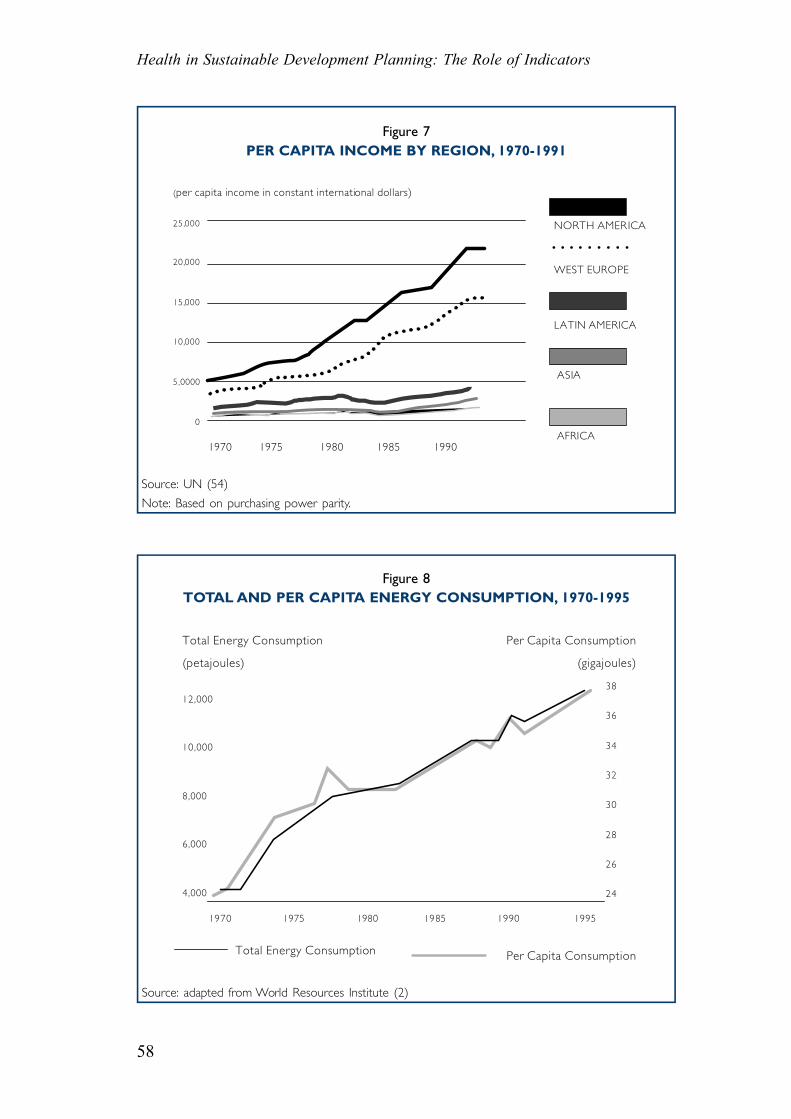
Figure 7PER CAPITA INCOME BY REGION, 1970-1991
Source: UN (54)
Note: Based on purchasing power parity.
Figure 8TOTAL AND PER CAPITA ENERGY CONSUMPTION, 1970-1995
Total Energy Consumption
(petajoules)
Per Capita Consumption
(gigajoules)
12,000
10,000
8,000
6,000
4,000
38
36
34
32
30
28
26
24
1970 1975 1980 1985 1990 1995
Total Energy Consumption Per Capita Consumption
Source: adapted from World Resources Institute (2)
(per capita income in constant international dollars)
25,000
20,000
15,000
10,000
5,0000
0
1970 1975 1980 1985 1990AFRICA
ASIA
LATIN AMERICA
NORTH AMERICA
WEST EUROPE
• • • • • • • • •
59
Chapter 4. Construction of Indicators
Pilot testing is crucial in determining whether an indicator is sensitive to variationsin the conditions concerned, whether the computing methods are sufficiently robustand the data adequate and whether the results of the indicator are interpretable.Problems in obtaining, processing and analysing data need to be ascertained inadvance. Valuable lessons can be learnt from various programmes for field-testingindicators, such as those carried out by the Local Government Management Board inthe United Kingdom (55), by the WHO European Region (Healthy Cities indicators)(44) and the United Nations Sustainable Development Indicator Testing Programme(30).
4.6 INTERPRETATION AND RISK COMMUNICATION
Indicators can be presented in various forms: graphically, as a map, or as a simplestatistic. In deciding on the form of presentation to be used, the target audience mustbe kept in mind, since a form that is suitable for, and understandable to healthprofessionals may not necessarily be appropriate for policy-makers, decision-makersor the general public. Illustrations and diagrams can be useful in making data accessibleand can relay much information in a clear, readily comprehensible way.
The form in which information is conveyed can have a considerable impact on how itis used and interpreted. For example, presentation of the infant mortality rate at aparticular time (perhaps in relation to other countries or cities) conveys differentinformation from a presentation as a trend over time.
POVERTY IN THE USA
Census tracts defined for metropolitan areas, cover 75% of the total US population.The poverty line is defined as the income level at which the estimated cost of a low-cost food plan for a family of three or more would consume 33% of the family’s totalincome. A high poverty census tract is defined as one in which 40% or more of thepopulation is below the poverty line. The percentage of poor people living in highpoverty census tracts is a measure of the concentration of poverty in urban areas. It iswidely believed that poor people are worse off living in areas of concentrated povertythan they would be in other areas, and that society as a whole suffers when theseareas of concentrated poverty exist. Furthermore, growth in areas of concentratedpoverty has negative implications for the future because children reared in very poorneighbourhoods are at risk of poor development outcomes.
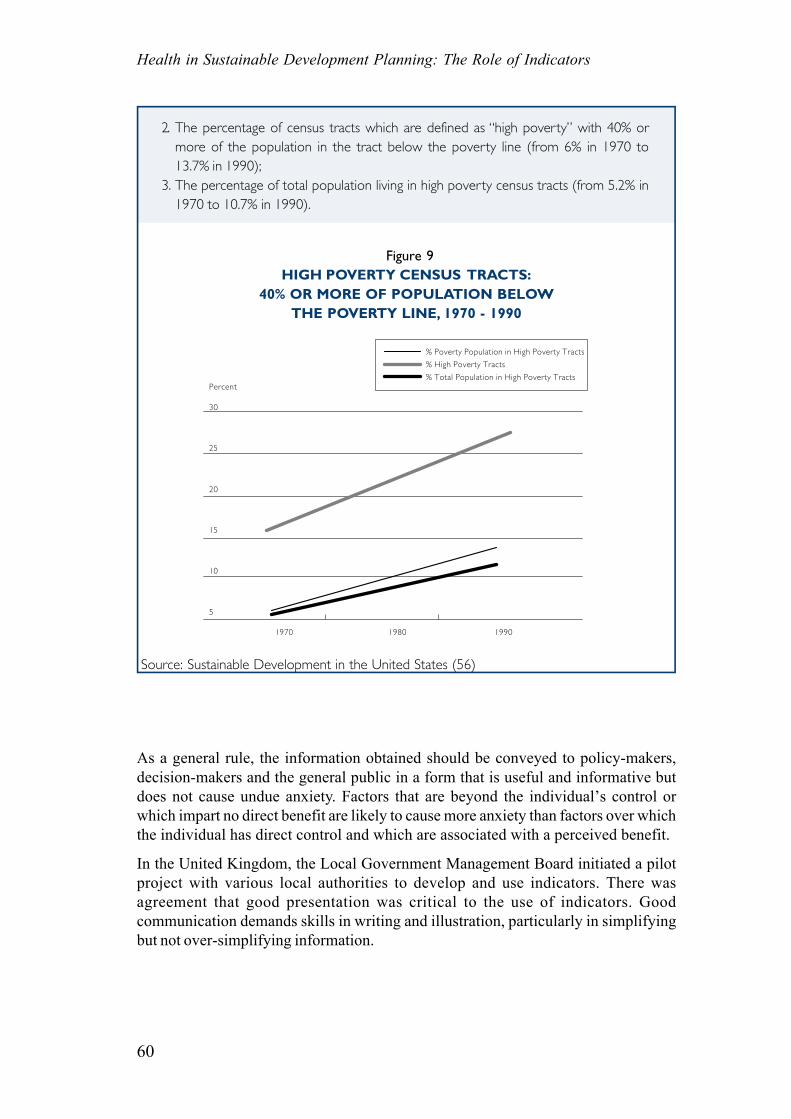
The graph shows three measures of the concentration of poverty in urban areas:
1. The percentage of the population below the poverty line living in high poverty censustracts (from 16.5% in 1970 to 28.2% in 1990);
(cont’d)
Health in Sustainable Development Planning: The Role of Indicators
60
2. The percentage of census tracts which are defined as “high poverty” with 40% ormore of the population in the tract below the poverty line (from 6% in 1970 to13.7% in 1990);
3. The percentage of total population living in high poverty census tracts (from 5.2% in1970 to 10.7% in 1990).
Figure 9HIGH POVERTY CENSUS TRACTS:
40% OR MORE OF POPULATION BELOWTHE POVERTY LINE, 1970 - 1990
As a general rule, the information obtained should be conveyed to policy-makers,decision-makers and the general public in a form that is useful and informative butdoes not cause undue anxiety. Factors that are beyond the individual’s control orwhich impart no direct benefit are likely to cause more anxiety than factors over whichthe individual has direct control and which are associated with a perceived benefit.
In the United Kingdom, the Local Government Management Board initiated a pilotproject with various local authorities to develop and use indicators. There wasagreement that good presentation was critical to the use of indicators. Goodcommunication demands skills in writing and illustration, particularly in simplifyingbut not over-simplifying information.
Source: Sustainable Development in the United States (56)
Percent
30
25
20
15
10
5
1970 1980 1990
% Poverty Population in High Poverty Tracts
% High Poverty Tracts
% Total Population in High Poverty Tracts
61
Chapter 4. Construction of Indicators
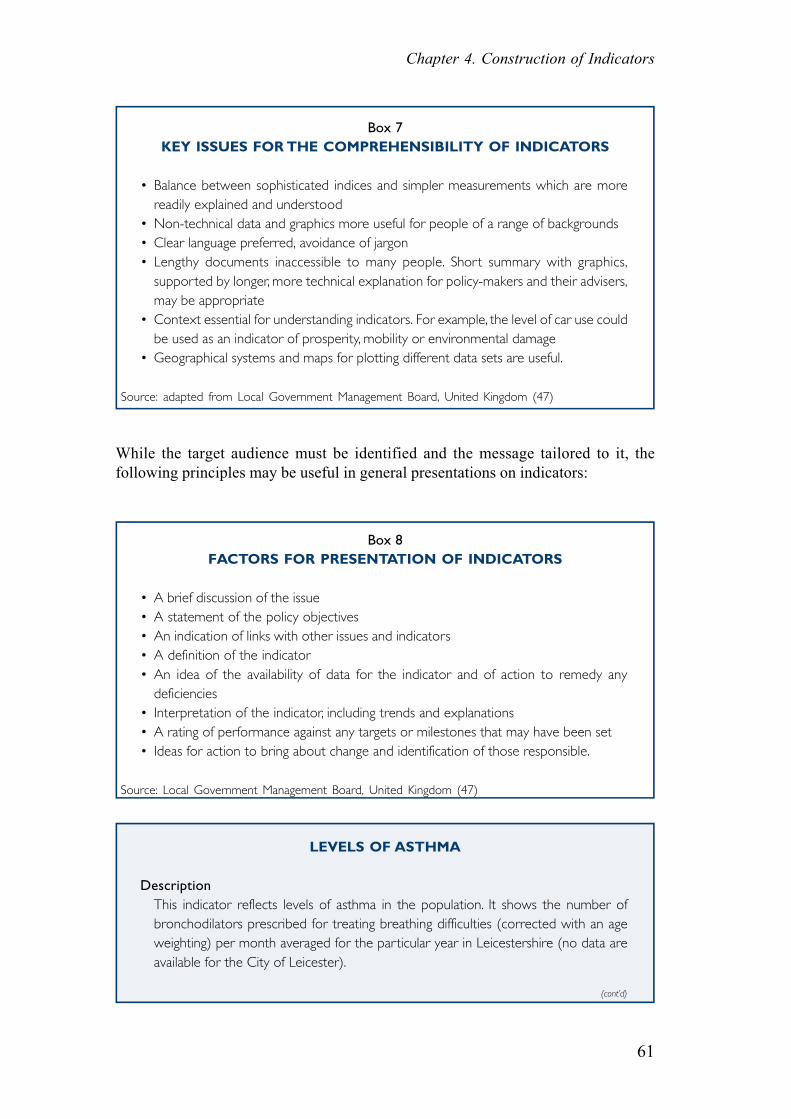
Box 7KEY ISSUES FOR THE COMPREHENSIBILITY OF INDICATORS
• Balance between sophisticated indices and simpler measurements which are morereadily explained and understood
• Non-technical data and graphics more useful for people of a range of backgrounds• Clear language preferred, avoidance of jargon• Lengthy documents inaccessible to many people. Short summary with graphics,
supported by longer, more technical explanation for policy-makers and their advisers,may be appropriate
• Context essential for understanding indicators. For example, the level of car use couldbe used as an indicator of prosperity, mobility or environmental damage
• Geographical systems and maps for plotting different data sets are useful.
Source: adapted from Local Government Management Board, United Kingdom (47)
While the target audience must be identified and the message tailored to it, thefollowing principles may be useful in general presentations on indicators:
Box 8FACTORS FOR PRESENTATION OF INDICATORS
• A brief discussion of the issue• A statement of the policy objectives• An indication of links with other issues and indicators• A definition of the indicator• An idea of the availability of data for the indicator and of action to remedy any
deficiencies• Interpretation of the indicator, including trends and explanations• A rating of performance against any targets or milestones that may have been set• Ideas for action to bring about change and identification of those responsible.
Source: Local Government Management Board, United Kingdom (47)
LEVELS OF ASTHMA
DescriptionThis indicator reflects levels of asthma in the population. It shows the number ofbronchodilators prescribed for treating breathing difficulties (corrected with an ageweighting) per month averaged for the particular year in Leicestershire (no data areavailable for the City of Leicester).
(cont’d)
Health in Sustainable Development Planning: The Role of Indicators
62
ImportanceThere has been a recent sharp increase in the diagnosis of asthma, particularly amongstchildren. In an attempt to explain this epidemic attention has been focused uponseveral factors including increased levels of air conditionning and the prevalence ofthe house dust mite. A consensus does, however, appear to be emerging which linksasthma with a deterioration of air quality, particularly in urban areas. Nitrogen dioxide,a pollutant from petrol and diesel engines, is thought to exacerbate asthma andemissions of this pollutant into the atmosphere have been increasing as a result oftraffic growth. The effects of environmental factors such as air quality on health havelong been recognised and a sustainable society would be one living in surroundingswith minimal pollution and threats to health.
Interpretation and trendsThe prescription of bronchodilator drugs in Leicestershire has shown a steady increasein recent years. This has probably been partly due to increased levels of asthma diagnosisas a result of increased awareness of the symptoms and availability of treatment, but italso reflects a real increase in the levels of asthma. Such an increase probably reflectsa deterioration in air quality and means a reduction in the quality of life of asthmasufferers. The trend represents a movement away from sustainability.
Recent increases in levels of asthma in children have been more pronounced. InLeicester, a small study indicated that the incidence of asthma in 9 year old childrenincreased from 10% to 15% over a 10 year period between the early 1980’s and theearly 1990’s, with up to 20% of children suffering in some inner city areas. Largerscale trials are planned.
Implications and actionIt is not yet possible to state conclusively that air pollution is creating asthma. However,it is certain that air pollution is worsening the suffering of those who have asthma andtherefore effectively increasing tha effects of asthma in Leicester. Following theprecautionary principle action should be taken to improve air quality and (hopefully)reduce asthma, for instance through transport planning measures designed to decreasepollution. This should not rule out the exploration of other avenues that might alsobenefit asthma sufferers.
Measurement and sourceDefinition: The number of bronchodilators prescribed (corrected for age using
the Astro PU weighting) monthly from April in Leicestershire averagedfor the year.
Source: Public Health Directorate, Leicestershire Health, Gwendolen Road,Leicester LE5 4QF.
Geographical Applicability: Leicestershire
63
Chapter 4. Construction of Indicators
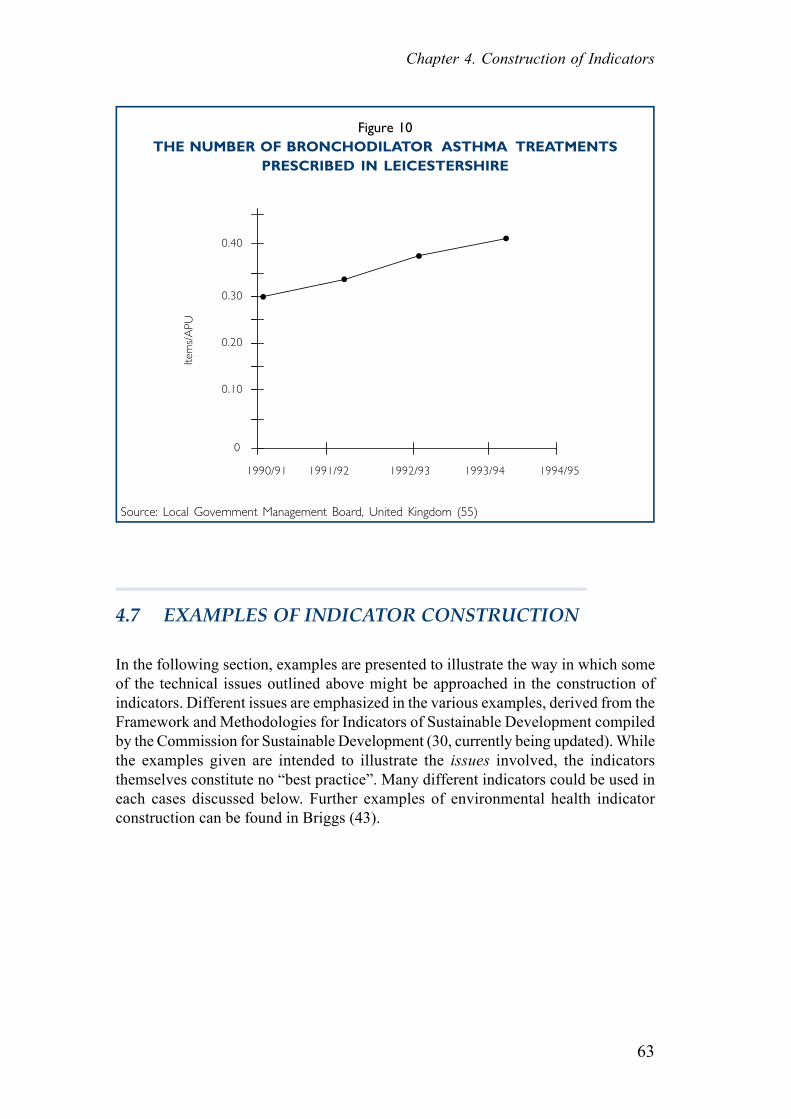
Figure 10THE NUMBER OF BRONCHODILATOR ASTHMA TREATMENTS
PRESCRIBED IN LEICESTERSHIRE
Source: Local Government Management Board, United Kingdom (55)
4.7 EXAMPLES OF INDICATOR CONSTRUCTION
In the following section, examples are presented to illustrate the way in which someof the technical issues outlined above might be approached in the construction ofindicators. Different issues are emphasized in the various examples, derived from theFramework and Methodologies for Indicators of Sustainable Development compiledby the Commission for Sustainable Development (30, currently being updated). Whilethe examples given are intended to illustrate the issues involved, the indicatorsthemselves constitute no “best practice”. Many different indicators could be used ineach cases discussed below. Further examples of environmental health indicatorconstruction can be found in Briggs (43).
••
••
1990/91
Item
s/A
PU
0.40
0.30
0.20
0.10
0
1994/951993/941992/931991/92
Health in Sustainable Development Planning: The Role of Indicators
64
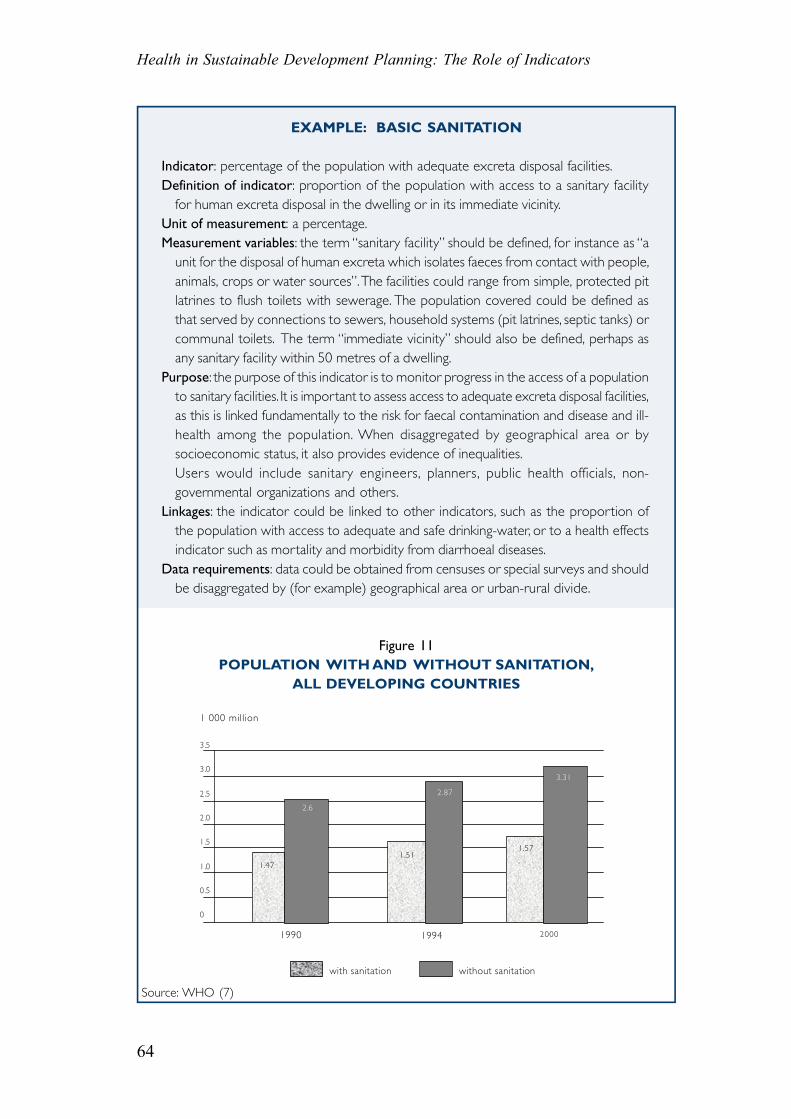
EXAMPLE: BASIC SANITATION
Indicator: percentage of the population with adequate excreta disposal facilities.Definition of indicator: proportion of the population with access to a sanitary facility
for human excreta disposal in the dwelling or in its immediate vicinity.Unit of measurement: a percentage.Measurement variables: the term “sanitary facility” should be defined, for instance as “a
unit for the disposal of human excreta which isolates faeces from contact with people,animals, crops or water sources”. The facilities could range from simple, protected pitlatrines to flush toilets with sewerage. The population covered could be defined asthat served by connections to sewers, household systems (pit latrines, septic tanks) orcommunal toilets. The term “immediate vicinity” should also be defined, perhaps asany sanitary facility within 50 metres of a dwelling.
Purpose: the purpose of this indicator is to monitor progress in the access of a populationto sanitary facilities. It is important to assess access to adequate excreta disposal facilities,as this is linked fundamentally to the risk for faecal contamination and disease and ill-health among the population. When disaggregated by geographical area or bysocioeconomic status, it also provides evidence of inequalities.Users would include sanitary engineers, planners, public health officials, non-governmental organizations and others.
Linkages: the indicator could be linked to other indicators, such as the proportion ofthe population with access to adequate and safe drinking-water, or to a health effectsindicator such as mortality and morbidity from diarrhoeal diseases.
Data requirements: data could be obtained from censuses or special surveys and shouldbe disaggregated by (for example) geographical area or urban-rural divide.
Figure 11POPULATION WITH AND WITHOUT SANITATION,
ALL DEVELOPING COUNTRIES
Source: WHO (7)
1 000 million
3.5
3.0
2.5
2.0
1.5
1.0
0.5
0
with sanitation without sanitation
1.47
2.6
1.51
2.87
1.57
3.31
20001990 1994
65
Chapter 4. Construction of Indicators
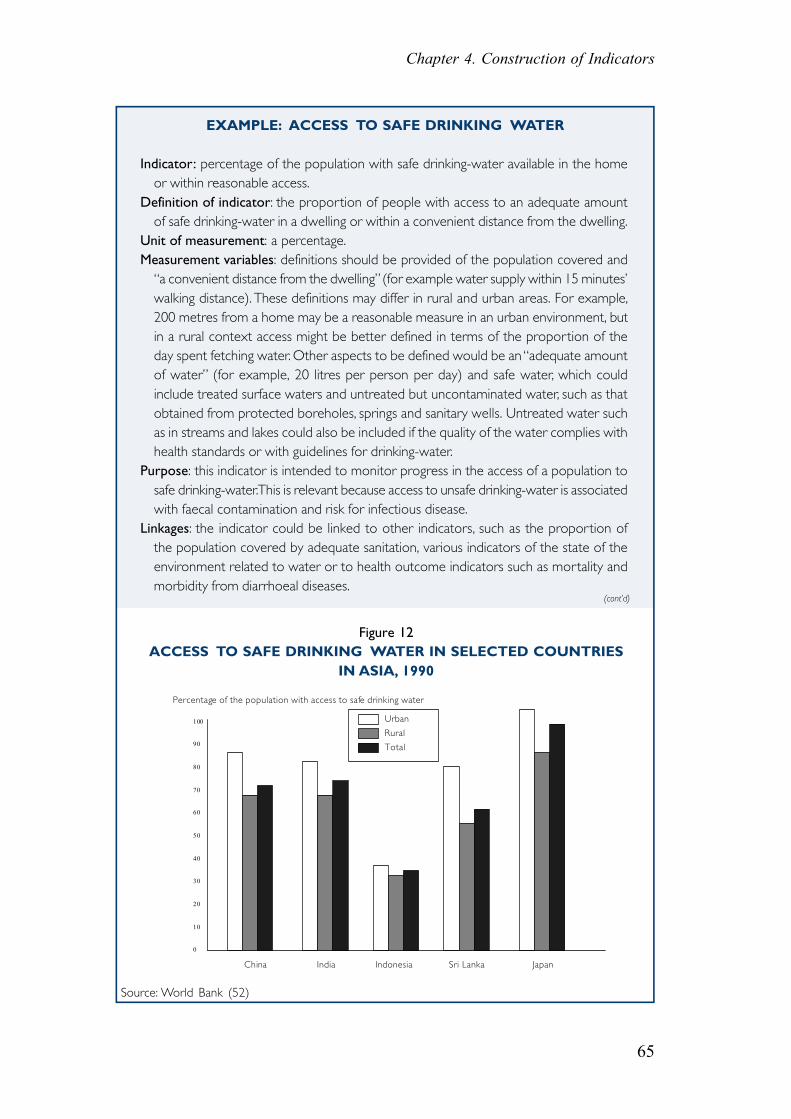
EXAMPLE: ACCESS TO SAFE DRINKING WATER
Indicator: percentage of the population with safe drinking-water available in the homeor within reasonable access.
Definition of indicator: the proportion of people with access to an adequate amountof safe drinking-water in a dwelling or within a convenient distance from the dwelling.
Unit of measurement: a percentage.Measurement variables: definitions should be provided of the population covered and
“a convenient distance from the dwelling” (for example water supply within 15 minutes’walking distance). These definitions may differ in rural and urban areas. For example,200 metres from a home may be a reasonable measure in an urban environment, butin a rural context access might be better defined in terms of the proportion of theday spent fetching water. Other aspects to be defined would be an “adequate amountof water” (for example, 20 litres per person per day) and safe water, which couldinclude treated surface waters and untreated but uncontaminated water, such as thatobtained from protected boreholes, springs and sanitary wells. Untreated water suchas in streams and lakes could also be included if the quality of the water complies withhealth standards or with guidelines for drinking-water.
Purpose: this indicator is intended to monitor progress in the access of a population tosafe drinking-water. This is relevant because access to unsafe drinking-water is associatedwith faecal contamination and risk for infectious disease.
Linkages: the indicator could be linked to other indicators, such as the proportion ofthe population covered by adequate sanitation, various indicators of the state of theenvironment related to water or to health outcome indicators such as mortality andmorbidity from diarrhoeal diseases.
Source: World Bank (52)
Figure 12ACCESS TO SAFE DRINKING WATER IN SELECTED COUNTRIES
IN ASIA, 1990
Percentage of the population with access to safe drinking water
China India Indonesia Sri Lanka Japan
100
90
80
70
60
50
40
30
20
10
0
Urban
Rural
Total
(cont’d)
Health in Sustainable Development Planning: The Role of Indicators
66
Data requirements: data would be needed on the number of people with access, thetotal population, the source of the water, etc. These could be obtained from censusesand special surveys and should be presented in a disaggregated form when possible,for example, by geographical area, urban-rural divide or type of water source.
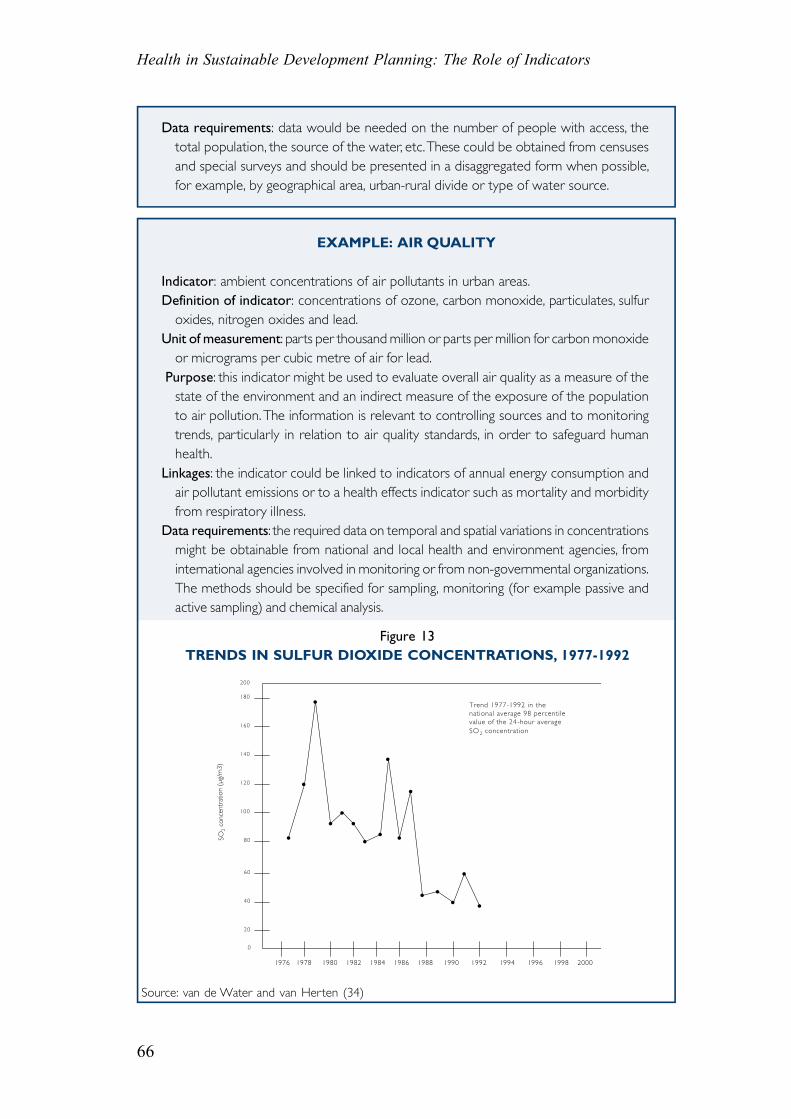
EXAMPLE: AIR QUALITY
Indicator: ambient concentrations of air pollutants in urban areas.Definition of indicator: concentrations of ozone, carbon monoxide, particulates, sulfur
oxides, nitrogen oxides and lead.Unit of measurement: parts per thousand million or parts per million for carbon monoxide
or micrograms per cubic metre of air for lead. Purpose: this indicator might be used to evaluate overall air quality as a measure of the
state of the environment and an indirect measure of the exposure of the populationto air pollution. The information is relevant to controlling sources and to monitoringtrends, particularly in relation to air quality standards, in order to safeguard humanhealth.
Linkages: the indicator could be linked to indicators of annual energy consumption andair pollutant emissions or to a health effects indicator such as mortality and morbidityfrom respiratory illness.
Data requirements: the required data on temporal and spatial variations in concentrationsmight be obtainable from national and local health and environment agencies, frominternational agencies involved in monitoring or from non-governmental organizations.The methods should be specified for sampling, monitoring (for example passive andactive sampling) and chemical analysis.
Figure 13TRENDS IN SULFUR DIOXIDE CONCENTRATIONS, 1977-1992
Source: van de Water and van Herten (34)
Trend 1977-1992 in the national average 98 percentile value of the 24 -hour average SO 2 concentration
200
1976 1978 1980 1982 1984 1986 1988 1990 1992 1994 1996 1998 2000
•
•
•
•
••
•••
•
•
•
•• •
•
SO2
conc
entr
atio
n (µ
g/m
3)
140
120
100
80
60
40
20
0
180
160
67
Chapter 4. Construction of Indicators
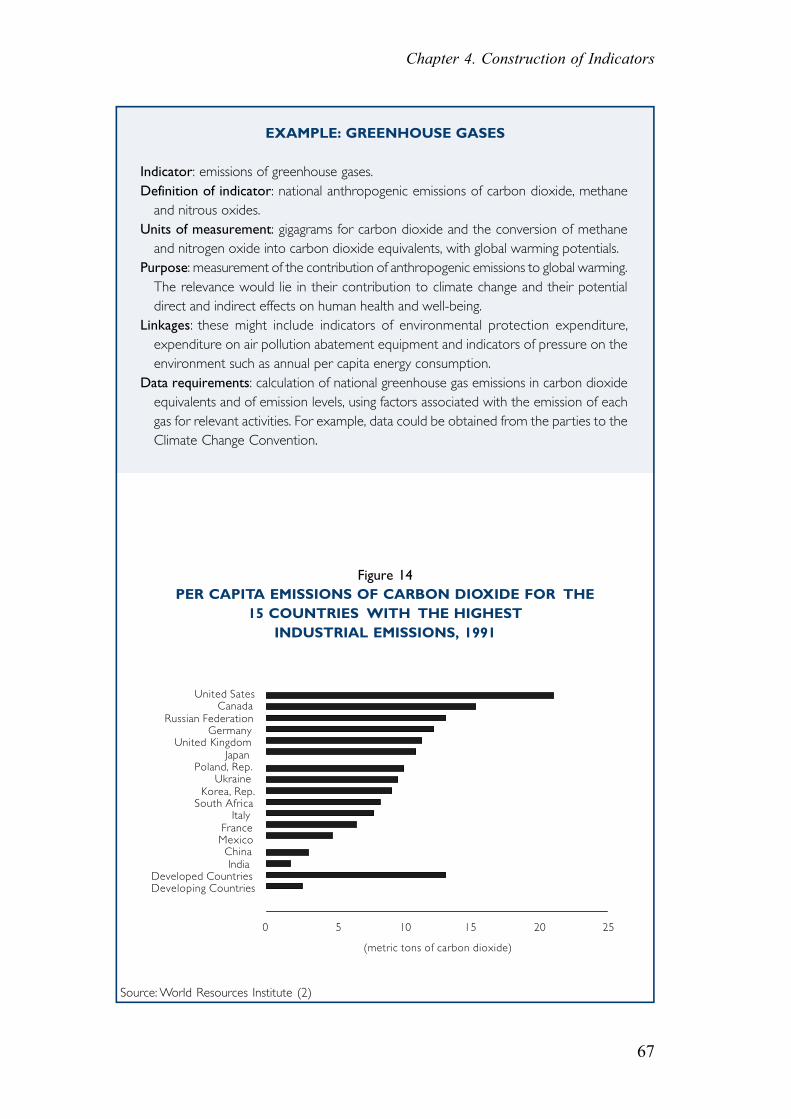
Figure 14PER CAPITA EMISSIONS OF CARBON DIOXIDE FOR THE
15 COUNTRIES WITH THE HIGHESTINDUSTRIAL EMISSIONS, 1991
Source: World Resources Institute (2)
EXAMPLE: GREENHOUSE GASES
Indicator: emissions of greenhouse gases.Definition of indicator: national anthropogenic emissions of carbon dioxide, methane
and nitrous oxides.Units of measurement: gigagrams for carbon dioxide and the conversion of methane
and nitrogen oxide into carbon dioxide equivalents, with global warming potentials.Purpose: measurement of the contribution of anthropogenic emissions to global warming.
The relevance would lie in their contribution to climate change and their potentialdirect and indirect effects on human health and well-being.
Linkages: these might include indicators of environmental protection expenditure,expenditure on air pollution abatement equipment and indicators of pressure on theenvironment such as annual per capita energy consumption.
Data requirements: calculation of national greenhouse gas emissions in carbon dioxideequivalents and of emission levels, using factors associated with the emission of eachgas for relevant activities. For example, data could be obtained from the parties to theClimate Change Convention.
United Sates Canada
Russian FederationGermany
United KingdomJapan
Poland, Rep.Ukraine
Korea, Rep.South Africa
ItalyFranceMexicoChinaIndia
Developed CountriesDeveloping Countries
0 5 10 15 20 25
(metric tons of carbon dioxide)
Health in Sustainable Development Planning: The Role of Indicators
68
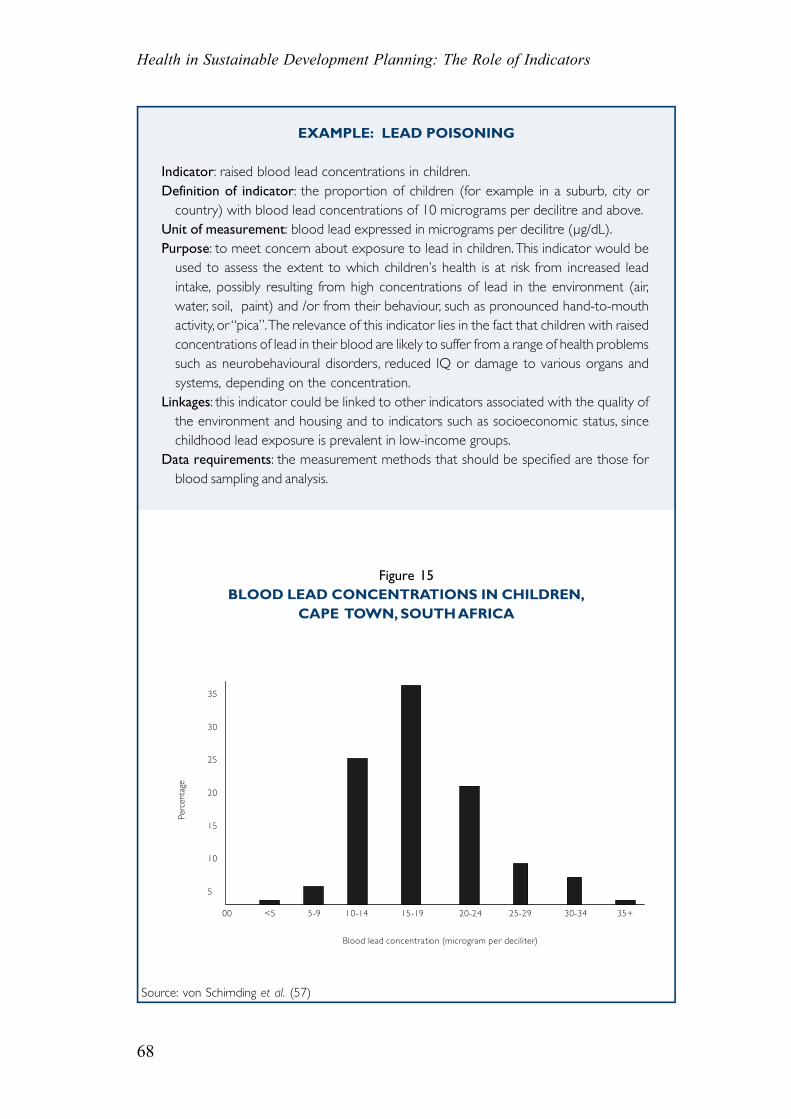
EXAMPLE: LEAD POISONING
Indicator: raised blood lead concentrations in children.Definition of indicator: the proportion of children (for example in a suburb, city or
country) with blood lead concentrations of 10 micrograms per decilitre and above.Unit of measurement: blood lead expressed in micrograms per decilitre (µg/dL).Purpose: to meet concern about exposure to lead in children. This indicator would be
used to assess the extent to which children’s health is at risk from increased leadintake, possibly resulting from high concentrations of lead in the environment (air,water, soil, paint) and /or from their behaviour, such as pronounced hand-to-mouthactivity, or “pica”. The relevance of this indicator lies in the fact that children with raisedconcentrations of lead in their blood are likely to suffer from a range of health problemssuch as neurobehavioural disorders, reduced IQ or damage to various organs andsystems, depending on the concentration.
Linkages: this indicator could be linked to other indicators associated with the quality ofthe environment and housing and to indicators such as socioeconomic status, sincechildhood lead exposure is prevalent in low-income groups.
Data requirements: the measurement methods that should be specified are those forblood sampling and analysis.
Figure 15BLOOD LEAD CONCENTRATIONS IN CHILDREN,
CAPE TOWN, SOUTH AFRICA
Source: von Schirnding et al. (57)
35
30
25
20
15
10
5
00 <5 5-9 10-14 15-19 20-24 25-29 30-34 35+
Blood lead concentration (microgram per deciliter)
Perc
enta
ge