Embed Size (px)
Citation preview

C:\website\atulbackup\docfiles \SER\2aprjob_ganga canal UPharyana\CD-UGC FINAL\Ch-4.doc 1
CHAPTER - 4
ANALYTICAL STUDY OF THE LOSSES
4.1 INTORUDCTION
Daily discharge data (both morning & evening) has been collected from
the field for Upper Ganga Canal right from head at various control points
such as for river at Raiwala; Haridwar Dam; offtakes of Uttari Khand,
Deoband Branch, releases into Mat Branch as well as supplies released
into Hathras Branch. Studies have also been conducted on the disty. &
minor system of Agra canal in Haryana & U.P. as the releases both from
WJC & UGC system merge at Okhla into Agra canal and since water-use
efficiency is being analysed for these two system separately, the resultant
efficiency on waters amalgamated both from WJC & UGC into Agra canal
offtakes offers an opportunity to analyze the results.
The Irrigation Department U.P. in its various divisions was not equipped
with current meters & as such in head reaches the discharges were
observed either by Irrigation Research Institute Roorkee or sometimes by
investigation and planning divisions. One such site is at 21.39 Km of
U.G.C.
River discharge through barrage is computed using formula for discharge
through orifice & ready reckoner discharge tables prepared for different
pond levels on u/s & d/s of barrage. The coefficient of discharge has been
worked out by Irrigation Research Institute, Roorkee with the help of
model studies & as such discharge being reported was ! 10%.
There is incidence of silt movement in canal and %age of normal flow is
stated to go down to about 90% during monsoon when water has high silt
content & bed gets silted up. After monsoons silt in bed is picked up &

C:\website\atulbackup\docfiles \SER\2aprjob_ganga canal UPharyana\CD-UGC FINAL\Ch-4.doc 2
washed down with silt free water and percentage to normal goes up
almost to 105%.
Occasional observations are thus needed. Observation on canals,
branches and distributaries are done with velocity rods & floats.
Calibration of gauges on masonry walls or gauge wells is required to be
rechecked & zero of gauge is to be co-related to GTS bench mark.
4.2 FIELD EFFICIENCY
Field irrigation requirement has been worked out on U.G.C. in UPCIP (U.P
consolidation Irrigation Project) by assessing 35% losses. These losses
include : -
a) Loss in lined watercourse from outlet head to 5-8 ha block
b) Loss in Kacha gul within 5-8 ha block
c) Water application losses
Study conducted already on U.P. channels, assessed losses in Kacha
watercourses @ 4% per 100 metre length. Assuming gul length of 200
metre (average), the gul efficiency has been rated at 0.96 X 0.96 = 0.92
(92%).
It has been assumed in the project that lining of watercourses will reduce
losses to 25%; would render watercourse efficiency to 90%; as such
channel efficiency from outlet to field had been worked out 0.96 x 0.90 =
0.864.
An assumption of 0.80 as average attainable water application efficiency
was made giving field efficiency below outlet as 0.864 X .80 = 69%.
C:\website\atulbackup\docfiles \SER\2aprjob_ganga canal UPharyana\CD-UGC FINAL\Ch-4.doc 3
Canal efficiency : - UP Consolidation Irrigation Project envisaged 30%
losses in canals for the lined system.
With conveyance efficiency of Main canal 95%
Branch canal 90%
Distributary & minors 85%
Conveyance efficiency upto outlet head as 0.95 x 0.90 X 0.85
= 73 %
& overall efficiency thus = 0.73 x 0.69 = 50.4 % for lined system
4.3 SEEPAGE LOSS
The U.G.C. project assumed seepage loss on unlined system at 8 cusecs
per million sq.ft of wetted perimeter (2.44 cumecs per million sq.m. of
wetted perimeter). For lined canal this loss was taken as 25% of above.
The evaporation loss was assessed & assumed as 2 to 5% of the
seepage loss and thus ignored in computations. Seepage loss on the
canal system of U.G.C. depends on
i) Permeability of the soil
ii) Spring level conditions
iii) Quantum & depth of flow in canal
iv) Velocity
Seepage loss per cumecs of water flow are much higher for smaller
channels than bigger channels as wetted perimeter per cumecs discharge
is much higher. Losses as worked out for 20 km length of channel at 2.44
cum / million sq.m of wetted perimeter for lined section are given below :

C:\website\atulbackup\docfiles \SER\2aprjob_ganga canal UPharyana\CD-UGC FINAL\Ch-4.doc 4
S.No.
Discharge at Head Seepage loss % of Discharge at head
(Cumecs)
(Unlined) (Lined)
1 225 1.02 0.22 2 60 1.21 0.44 3 10 5.56 1.18 4 0.6 24.30 5.08
For same channel - seepage loss per cumec more when running with less
discharge or shallow depth.
As observed during various periods of rotational flow, the losses were
more in the initial running period after closure.
UPCIP assumes a percolation rate of 1.0 to 5.0 mm / day for soils suitable
for rice cultivation under puddled conditions, 5 to 7.5 mm for marginally
suitable ones and more than 7.5 mm for soils unsuitable for rice
cultivation.
4.4 LOSSES ASSUMED IN ROTATIONAL PROGRAMME & FIELD OBSERVATIONS OF LOSSES ON UGC SYSTEM
The procedure for distribution of water prescribed and followed on UGC in
the foregoing pages envisages cropwise allocation on probable availability
division-wise as their share. Typical assessment for Kharif & Rabi crop
has been depicted at Annex 4.1. During Rabi period the main line losses
@ 31.15 cumecs and supplies earmarked for Delhi Water Supply
Undertaking are deducted at source from the shares of UGC available at
Dhanauri. The conveyance losses in the branches and distributaries are
however incorporated in the shares of each division.
Typical allotment of Muzafarnagar Division (A) @ 16% includes losses @
9.91 cumecs. Meerut Division, includes losses @ 11.32 cumecs
C:\website\atulbackup\docfiles \SER\2aprjob_ganga canal UPharyana\CD-UGC FINAL\Ch-4.doc 5
Bulandshahar Division includes losses @ 3.39 cumecs. Main line losses
taken as 31.15 cumecs even though actual supply had however been
variable; and share of various divisions kept with losses assumed as
above.
During the period when Lower Ganga Canal & Parallel Lower Ganga
Canal (PLGC) supply have share on Ganga water; the U.G.C. share say
for period of March ranges between 45 to 65% depending upon actual
availability & when L.G.C. has no share; the U.G.C. share increases in
the range of 85%. Agra canal share also increases due to more
availability in the latter case & this canal too can have discharge upto 16%
of total. The regulation instructions expect control points to be strictly
maintained such as
XEN Muzaffarnagar Division to maintain Belra a specified discharge for
different weekly allocations
XEN Meerut division to maintain Newari, similarly
XEN Bulandshahar to maintain Walipure i.e. Boundaries to be maintained
at the cost of channels.
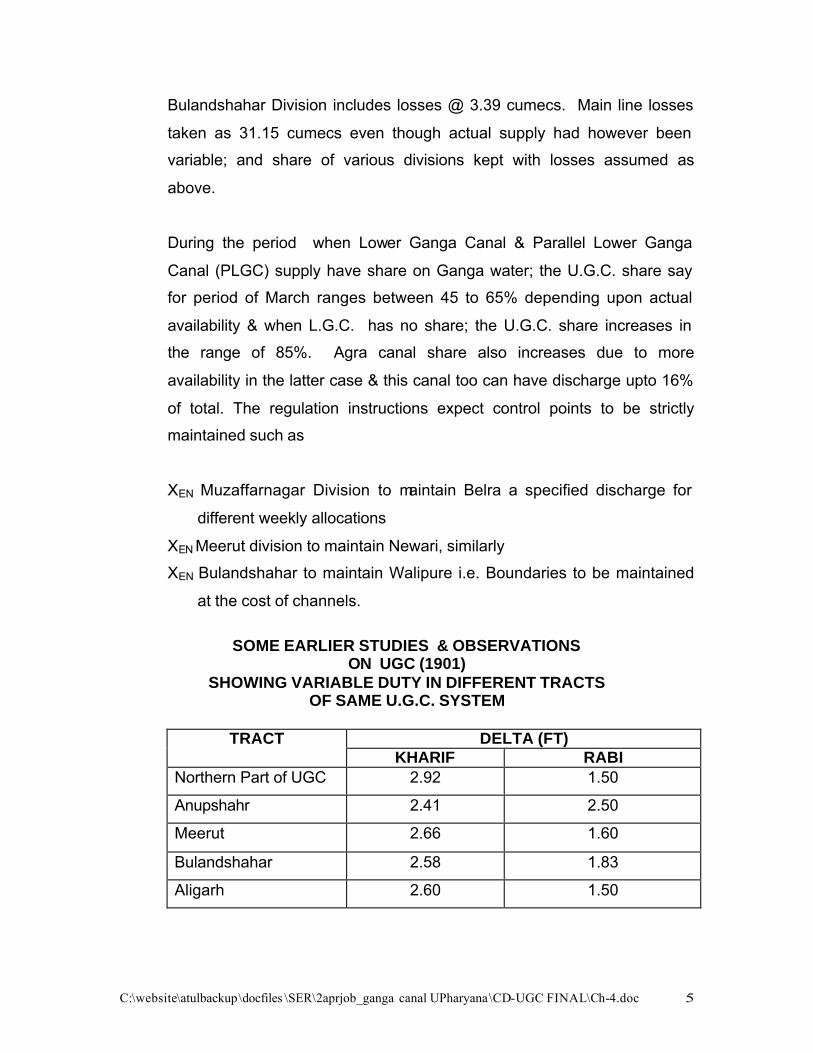
SOME EARLIER STUDIES & OBSERVATIONS
ON UGC (1901) SHOWING VARIABLE DUTY IN DIFFERENT TRACTS
OF SAME U.G.C. SYSTEM
TRACT DELTA (FT) KHARIF RABI
Northern Part of UGC 2.92 1.50
Anupshahr 2.41 2.50
Meerut 2.66 1.60
Bulandshahar 2.58 1.83
Aligarh 2.60 1.50

C:\website\atulbackup\docfiles \SER\2aprjob_ganga canal UPharyana\CD-UGC FINAL\Ch-4.doc 6
Some earlier studies & observations Duty of Water in Kharif (1901) (a comparison)
Canal Average
utilisation in cusecs at
the head of canal during season
B= Base i.e. No. of days canal was in flow
D=Duty of Discharge
utilised
Delta (Feet)
<=equival-ent
aggregate depth of water on the fields
on the basis of utilised
discharge
V=Volume utilised per
acre Irrigated
(Cft.)
Upper Ganga Canal
5152 127 73 3.41 150,320
Lower Ganga Canal
3133 141 67 4.16 181830
Eastern Jamuna Canal
1310 169 120 2.75 121680
Western Jamuna Canal
4200 181 64 5.58 244350
Duty & Delta in Rabi Season (1901 - 02) (a comparison)
(Study carried out by RG Kennedy)
Canal Average utilised
discharge at head of
canal during the
season (Cusecs)
B=Base Number of days the canal in
flow
D=Duty of the
discharge utilised
<=Equival-ent
aggregate depth of water on
the field on the basis of utilised flow
(Feet)
V=Volume utilised per
acre irrigated
(cft.)
Upper Ganga Canal
4290 182 159 2.25 98900
Lower Ganga Canal
2837 182 191 1.83 82330

C:\website\atulbackup\docfiles \SER\2aprjob_ganga canal UPharyana\CD-UGC FINAL\Ch-4.doc 7
Canal Average utilised
discharge at head of
canal during the
season (Cusecs)
B=Base Number of days the canal in
flow
D=Duty of the
discharge utilised
<=Equival-ent
aggregate depth of water on
the field on the basis of utilised flow
(Feet)
V=Volume utilised per
acre irrigated
(cft.)
Agra Canal 1219 182 135 2.66 116480 Eastern Jamuna Canal
1252 170 190 1.75 74940
Western Jamuna Canal
2801 182 115 3.08 136740
DELTA STATEMENT OF VARIOUS CHANNELS
Jatwari Disty. (Jewer System)
(Q=40 cs) S.No. Crop Irrigation
Achieved (Ha) Water
Delivered (Cusec Days)
Delta (ft.)
1 Kharif 1407 349 1880 4.30
2 Rabi 1407 661 2360 2.85
3 Kharif 1408 247 880 2.85
4 Rabi 1408 514 1400 2.17
Baldev Disty
(Lower Mat Branch System)
S.No Crop Irrigation Achieved (Ha)
Water Account (Cusec days)
Delta (ft)
1. Kharif 1407 473 2624 4.43 2. Rabi 1407 915 2271 1.98 3. Kharif 1408 456 3851 6.76
4. Rabi 1408 331 1339 3.23 Proposed discharge = 120 cs Present discharge = 70 cs Outlets = 55

C:\website\atulbackup\docfiles \SER\2aprjob_ganga canal UPharyana\CD-UGC FINAL\Ch-4.doc 8
Dagheta Disty (Lower Mat Branch System)
S.No
Crop Irrigation Achieved
Water Account
Delta Remarks
(Ha) (Cusec Days)
(Ft)
1. Kharif 1407 674 2897 3.43 Tail fed
2. Rabi 1407 900 2685 2.38 Tail fed
3. Kharif 1408 463 3856 6.66 * No supply at Tail
4. Rabi 1408 217 1376 5.07 # No supply at Tail
* Water reached upto 24.4 Km Length # Water reached upto 10.00 Km Length
Chandpur Minor (Jewer Disty System)
Designed Discharge = 4 cusecs ( 0.11 cumec)
Number of Outlets = 12
Crop season Rabi 2000 - 01
Irrigation Achieved = 191 ha
Water delivered = 216 cusec days ( 6.11 cumec days)
Delta = 0.905 feet ( 0.275 mt)
4.4.1 Losses on Main Canal (Head Reach)
In the distribution programme these losses have been assumed between
0.5 to 2.6%, the actual releases data collected from the field (Annexure
4.3,4.4,4.5 & 4.9) show variable figures & average loss in the head reach
is 1.55 %. The first main distribution with branches & offtakes occures in
Muzaffarnagar division & on the offtakes d/s Belra. Losses worked out

C:\website\atulbackup\docfiles \SER\2aprjob_ganga canal UPharyana\CD-UGC FINAL\Ch-4.doc 9
between Belra & Niwari on UGC for various months (discounting non-
reconcilable periods) have been analysed below.
Average Upper Main Line loss on UGC = 1.55 %
Efficiency at Belra = 98.45 %
Month Year
Supplies at Belra (Cusec days)
Utilisation (Cusecs
days)
Availability at Niwari
(Cusec days)
%age loss
Dec 2001 143770 48365 87112 5.76
Dec 2000 180757 70500 99709 5.8
Feb 2001 121474 39421 72101 8.19
Oct 2001 51505 17165 31752 5.02
Sept 2000 173038 - 92652 Discounted (not reconcilable)
July 2002 165915 62900 98289 2.84
June 2000 171726 53005 103242 9
June 2001 227109 81804 128300 7.48
April 2000 184643 86843 82587 8.23
April 2001 156131 - 66339 Not reconciled (discounted)
Average Loss = 6.54 % Main line lower of Upper Ganga Canal = 6.54 % Efficiency at end of UGC upto Niwari = 0.9845 x 0.9346 = 0.9201 = 92 %
C:\website\atulbackup\docfiles \SER\2aprjob_ganga canal UPharyana\CD-UGC FINAL\Ch-4.doc 10
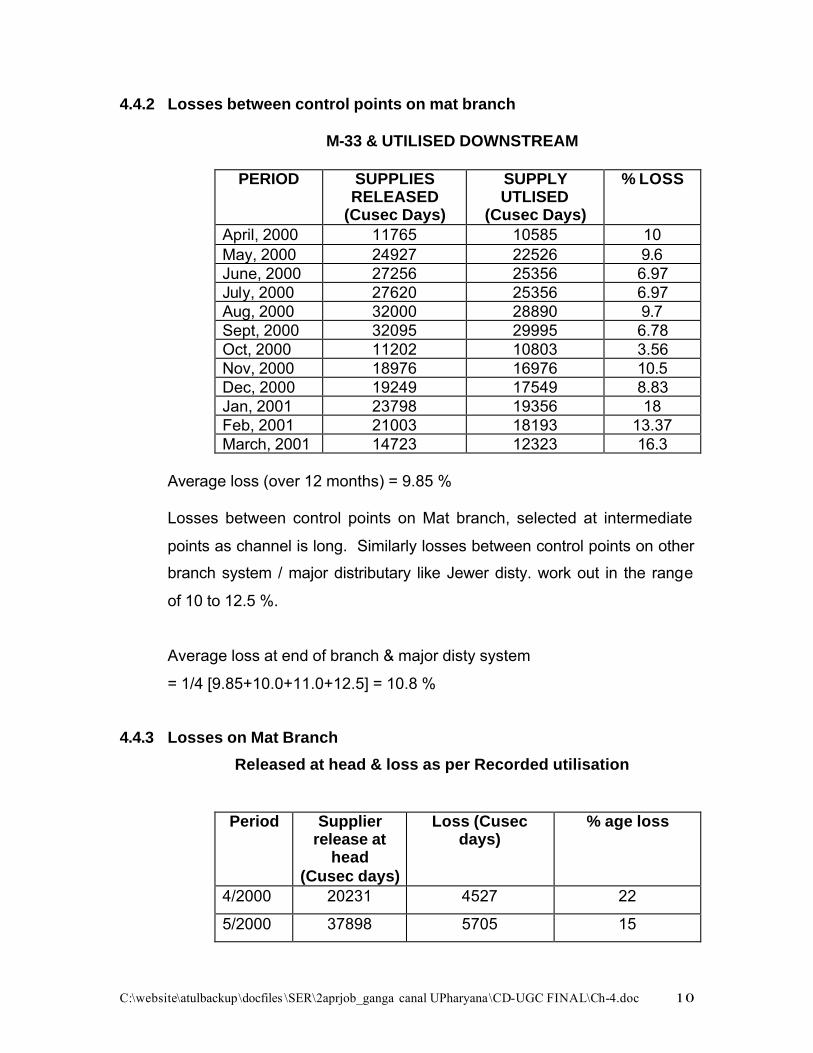
4.4.2 Losses between control points on mat branch
M-33 & UTILISED DOWNSTREAM
PERIOD SUPPLIES RELEASED
(Cusec Days)
SUPPLY UTLISED
(Cusec Days)
% LOSS
April, 2000 11765 10585 10 May, 2000 24927 22526 9.6 June, 2000 27256 25356 6.97 July, 2000 27620 25356 6.97 Aug, 2000 32000 28890 9.7 Sept, 2000 32095 29995 6.78 Oct, 2000 11202 10803 3.56 Nov, 2000 18976 16976 10.5 Dec, 2000 19249 17549 8.83 Jan, 2001 23798 19356 18 Feb, 2001 21003 18193 13.37 March, 2001 14723 12323 16.3
Average loss (over 12 months) = 9.85 % Losses between control points on Mat branch, selected at intermediate
points as channel is long. Similarly losses between control points on other
branch system / major distributary like Jewer disty. work out in the range
of 10 to 12.5 %.
Average loss at end of branch & major disty system
= 1/4 [9.85+10.0+11.0+12.5] = 10.8 %
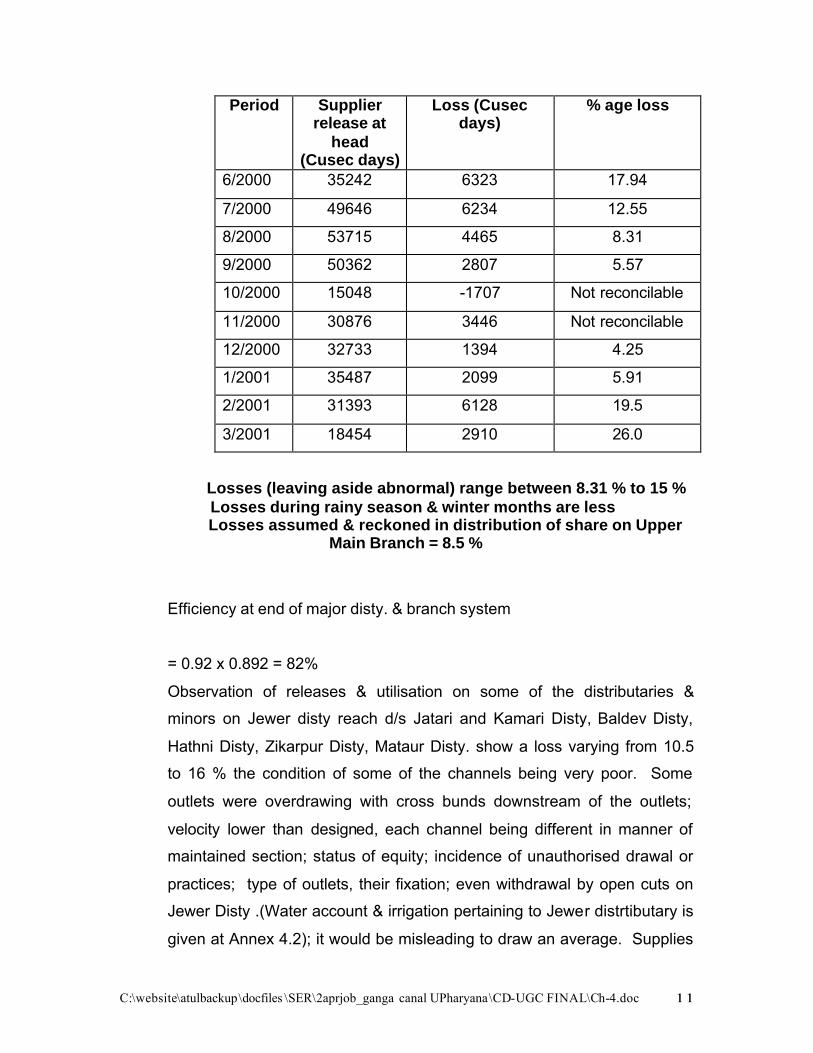
4.4.3 Losses on Mat Branch
Released at head & loss as per Recorded utilisation
Period Supplier release at
head (Cusec days)
Loss (Cusec days)
% age loss
4/2000 20231 4527 22
5/2000 37898 5705 15
C:\website\atulbackup\docfiles \SER\2aprjob_ganga canal UPharyana\CD-UGC FINAL\Ch-4.doc 11
Period Supplier release at
head (Cusec days)
Loss (Cusec days)
% age loss
6/2000 35242 6323 17.94
7/2000 49646 6234 12.55
8/2000 53715 4465 8.31
9/2000 50362 2807 5.57
10/2000 15048 -1707 Not reconcilable
11/2000 30876 3446 Not reconcilable
12/2000 32733 1394 4.25
1/2001 35487 2099 5.91
2/2001 31393 6128 19.5
3/2001 18454 2910 26.0
Losses (leaving aside abnormal) range between 8.31 % to 15 % Losses during rainy season & winter months are less
Losses assumed & reckoned in distribution of share on Upper Main Branch = 8.5 %
Efficiency at end of major disty. & branch system
= 0.92 x 0.892 = 82%
Observation of releases & utilisation on some of the distributaries &
minors on Jewer disty reach d/s Jatari and Kamari Disty, Baldev Disty,
Hathni Disty, Zikarpur Disty, Mataur Disty. show a loss varying from 10.5
to 16 % the condition of some of the channels being very poor. Some
outlets were overdrawing with cross bunds downstream of the outlets;
velocity lower than designed, each channel being different in manner of
maintained section; status of equity; incidence of unauthorised drawal or
practices; type of outlets, their fixation; even withdrawal by open cuts on
Jewer Disty .(Water account & irrigation pertaining to Jewer distrtibutary is
given at Annex 4.2); it would be misleading to draw an average. Supplies

C:\website\atulbackup\docfiles \SER\2aprjob_ganga canal UPharyana\CD-UGC FINAL\Ch-4.doc 12
reaching channels of Mathura division was short of authorized share as
per design & CCA. The officers of Mathura division wished that losses as
per norms fixed showed also be added in the share of Mathura division
which was stated to not being done.
Losses thus averaged upto tail of minor or outlet head of watercourse from
a minor or a disty = 11 %
Efficiency at outlet head would thus work out to 0.82 x 0.89 = 72 %
(Where the system was lined upto disty and minor system)
The system of distributary & minor network of UGC especially on Agra
canal & lower down on Mat tail reaches and Jewar system are unlined or
not maintained in regime. Besides above features there has been vegetal
growth and obstruction in bed. Losses on such like channels upto head of
outlet work out to higher extreme side of variable losses i.e. 16%.
Efficiency with such condition
0.82 x 0.84 = 68.88
Say 69%
LOSSES BASED ON CUSEC PER MILLION SQ. FT OR CUMECS / MILLION SQ. M OF WETTED PERIMETER
The existing section of the channels such as Mat Branch in middle & tail
reaches; Jewer disty in the head, middle & tail reaches and their offtakes
right upto tail end of system in Mathura division; the offtake system of
Agra Canal fed by UGC primarily through Hindon as well as some of the
offtakes of Harduaganj Disty; showed,
i) The existing section of channels is far from designed section both
in bed width; full supply depth & slope

C:\website\atulbackup\docfiles \SER\2aprjob_ganga canal UPharyana\CD-UGC FINAL\Ch-4.doc 13
ii) The supply running in the tail end portion of channels in much less
than full supply; velocity is lower & with pipe outlets not in ideal
proposition for equity in distribution; occasional obstructions; bed
bars, bunds specially on Jewer disty. in division & unauthorised
drawal defeat the observation of discharges made without co-
relation to withdrawal of individual outlets.
Supply at Tail
Upper Ganga Canal system which has comparatively better percentage
availability than W.J.C. has however not been able to feed adequate or
equitable supplies in the tail reaches. System wise drawal on Mat Branch
& Jewer System & their offtaking channels show the supplies do not reach
the tails on many channels. Even the rotational programme or programme
of share distribution amongst various divisions show that supply tapers off
to NIL far ahead and upstream of tail reach. This shows equitable
distribution is not being ensured. The programme indicates that channels
mentioned here under were not expected to be supplied water at tails.
Upper Mat Branch (Kharif) Roster Rabi 1409 Fasli.
Hahepa Minor
Hasauta Minor
Banchawali Minor
Bajanta Minor
Kishorepur Minor
Ranehra Minor
Inayatpur Minor
Uttrawli Minor
Salempur Minor
Tanaga Minor
Baroda Minor

C:\website\atulbackup\docfiles \SER\2aprjob_ganga canal UPharyana\CD-UGC FINAL\Ch-4.doc 14
These offtakes are not even at the tail end of parent channel.
Tails of following channels of Mathura district were not assured /
expected to receive supply in tail reach.
Uttari Minor
Uttasni Minor
Madale Minor
Gaurolla Minor
Kolaua Minor
Tail reach of Jewer Disty.
Lower Mat Branch System Kharif 1408 Falsi (2000)
Following channels not assured of supply
Khanwali Minor
Kupa Minor
Nawipur Minor
Saimra Minor
Naraich Minor
Following channels likely to receive supply only upto certain lengths
Bankner Minor upto 4 Km
Parsauli Minor upto 1 Km
Jarura Minor upto 10 Km
Surir Minor upto 2 KM
Mursan Minor upto 12.2 KM
Haraute Minor upto 3 KM
Gauray Minor upto 7 KM
Sadalead Minor upto 30 KM
Aqira Khera upto 7 KM

C:\website\atulbackup\docfiles \SER\2aprjob_ganga canal UPharyana\CD-UGC FINAL\Ch-4.doc 15
Mahavau upto 11.2 KM
Kursanda Minor upto 10.4 KM
Jugsam upto 20.6 KM
Daghet Minor upto 16.2 KM
Khandauli Minor upto 10 KM
Baldeo Minor upto 16 KM
Awairni upto 9 KM*
Agai Minor upto 4 KM
Daulatpur upto 4 KM
Garhsauli upto 4 KM
* L-Section of Awairni Minor is enclosed at Dwg. 4.1.
Such stipulation or information about some channels which are not likely
to be fed but entitle for supply do not come in schedule printed for
Muzaffarnagar & Meerut circles. This shows the head reach channels of
U.G.C. have preferential or over-riding preferences. Executive Engineer,
Mathura division had during site visit informed that whereas "Losses" were
incorporated while working out shares of other divisions; this was not done
for Mathura division resulting in less supplies. As far as canal act is
concerned, all areas included in CCA have to be ensured pro-rata
available supplies & losses accounted for all channels in interest of equity.
With the existing section of Baldev disty, full supply depth & existing slope;
in a wetted perimeter reach of 514800 sq. feet losses worked out as 3.9 cs
after deducting drawal by outlets, actual loss per million sq. ft of wetted
perimeter worked out to 7.57 cusecs or 0.214 cusecs per million sq.m of
wetted perimeter.
Similarly losses based on wetted perimeter area of various channels such
as Mat Branch lower reach; Jewer Disty (Dwg. 4.2 & Annex. 4.12) &
Baldeo Disty (as described above) Kamary Disty; Awirni Mr;Chandpur Mr.

C:\website\atulbackup\docfiles \SER\2aprjob_ganga canal UPharyana\CD-UGC FINAL\Ch-4.doc 16
Mahavan Disty; Dagheta Disty; Jatari Disty; Hathni's Disty; all indicated
that losses were more than those assumed as 8 cusecs / million sq. ft of
wetted perimeter (approx. 7.5 cusecs as worked out based on share
calculations on UGC barring winter & monsoon months). The loss
between 7.6 to 9 cusecs on unlined channels & poor maintained
channels.
Discharge observed on unlined watercourses, each on Baldev Disty (Mat
Branch System); Jatari Mr. (Jewer System) & Hathni Disty and Palwal
Disty of Agra Canal System served by UGC through Hindon & WJC flows
revealed losses in the range of 11.5 to 16.2% and in the range 9.35 to
12.1 cusecs per million sq. ft of wetted perimeter. None of the water
course had been lined and condition of the water courses ranged from
satisfactory on Baldev disty to poor on Jatari nor and Hathni Disty. The
condition of watercourses on Palwal Disty was comparatively better. The
lining of water course was stated to have been done on some
watercourses partly & as per experiments conducted on the area in
contiguity; losses on lined watercourses were 9 to 11%, the length of
these watercourses were however smaller than on WJC.
4.4.4 Field Application Losses
The length of laterals being small; type of soil; field preparation being
different research cannot be replicated. It was also noticed that discharge
in the outlet itself was variable even for the same week & it fluctuated
even during 24 hrs. The time taken for filling up or watering field varied
and some of the farmers were also doing supplimentary irrigation by wells.
The overall scenario of crop efficiency thus depended on supply for
irrigation for canal as well as from tubewells. No data of actual irrigation
booked was supplied despite requests.
C:\website\atulbackup\docfiles \SER\2aprjob_ganga canal UPharyana\CD-UGC FINAL\Ch-4.doc 17
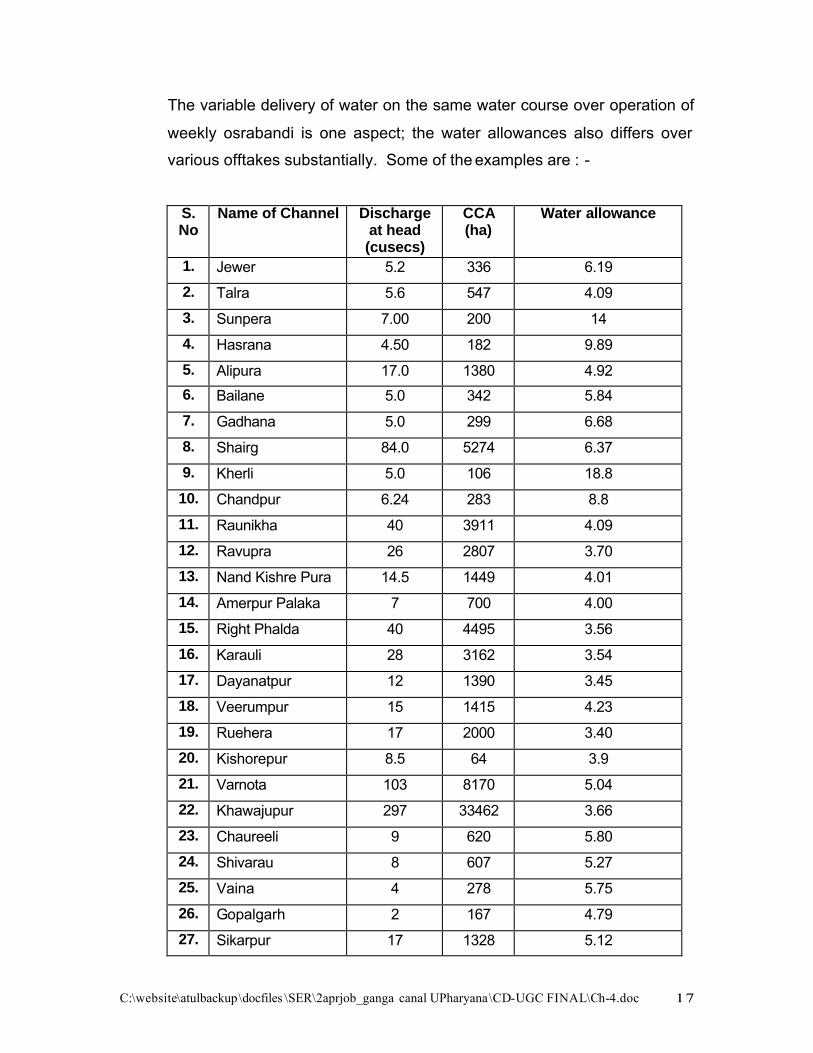
The variable delivery of water on the same water course over operation of
weekly osrabandi is one aspect; the water allowances also differs over
various offtakes substantially. Some of the examples are : -
S. No
Name of Channel Discharge at head (cusecs)
CCA (ha)
Water allowance
1. Jewer 5.2 336 6.19
2. Talra 5.6 547 4.09
3. Sunpera 7.00 200 14
4. Hasrana 4.50 182 9.89
5. Alipura 17.0 1380 4.92
6. Bailane 5.0 342 5.84
7. Gadhana 5.0 299 6.68
8. Shairg 84.0 5274 6.37
9. Kherli 5.0 106 18.8
10. Chandpur 6.24 283 8.8
11. Raunikha 40 3911 4.09
12. Ravupra 26 2807 3.70
13. Nand Kishre Pura 14.5 1449 4.01
14. Amerpur Palaka 7 700 4.00
15. Right Phalda 40 4495 3.56
16. Karauli 28 3162 3.54
17. Dayanatpur 12 1390 3.45
18. Veerumpur 15 1415 4.23
19. Ruehera 17 2000 3.40
20. Kishorepur 8.5 64 3.9
21. Varnota 103 8170 5.04
22. Khawajupur 297 33462 3.66
23. Chaureeli 9 620 5.80
24. Shivarau 8 607 5.27
25. Vaina 4 278 5.75
26. Gopalgarh 2 167 4.79
27. Sikarpur 17 1328 5.12

C:\website\atulbackup\docfiles \SER\2aprjob_ganga canal UPharyana\CD-UGC FINAL\Ch-4.doc 18
S. No
Name of Channel Discharge at head (cusecs)
CCA (ha)
Water allowance
28. Jaitari 5 344 5.81
29. Karanpur 70 6930 4.10
30. Gadak 70 4692 5.97
4.4.5 Losses in the Field
In addition to transit losses in the conveyance system & distribution
network accompained with avoidable losses due to leakages and losses
due to structural defects or inadequacies, studies conducted on overall
evaluation reveals that losses below the outlet & on the field constitute a
major component of loss of irrigation water.
Water is supplied to farmer based on water allowance sub-system wise on
U.G.C. by allocation of size of pipe outlet & this differs as explained
above. The farmer receives the supply as per osrabandi but the actual
results he achieves in productivity per unit volume of water depends upon
the versatility in application of water; the soil character of the fields;
subsoil water table; levels & slope of field etc.
Recommendation for improving water use efficiency by minimising loss
below the water course on field / farm itself.
Water Applied to The Plant Proper & its Consumptive Use
The Water Use Efficiency has been worked out on the conveyance and
distribution system right upto delivery in the command Chak of the outlet
under cultivation & application by different methods.

C:\website\atulbackup\docfiles \SER\2aprjob_ganga canal UPharyana\CD-UGC FINAL\Ch-4.doc 19
Net Water Use Efficiency is the efficiency after application of water in the
root zone of crop & avoidable wastage by evaporation over crop canopy &
in filtration below the root zone. These have to be assessed to work out
actual gainfull utilisation of water released.
In-filtration & Redistribution
Infiltration of Irrigation in the soil profile is modelled by employing
empirically and physically based concepts. In the empirical approach; the
infiltration process is not given any time distribution and soil profile is
treated as a tipping bucket. Each layer is assumed to fill to its field
capacity wetness instantaneously and remaining water is cascaded to
lower layers. Any water passing beyond the bottom layer is lost to deep
drainage.
As with in-filtration, the movement of water in rootzone has been
estimated in a simplified way by transferring water from one layer to
another. Transpiration (T) is the most important component of water
balance from standpoint of bio-mass production. The first step in
simulating T is the estimation of evaporative demand Eo which is satisfied
by interception and soil evaporation and transpiration. Estimation of Eo
with Penman (48); Priestley & Tayler (72); and Monteiths (65) method
makes use of daily meteorology variables and the diffusive resistance of
canopy. Because of the assumptions & approximation, daily pan
evaporative values have been used for computing Eo.
The Pan-evaporative value are available for WJC Command in Haryana &
UGC in (UP). These; for various crops are depicted at Annexure 4.14.1
With these values taken in the command which are quite representative
keeping in view agro-climatic; cropping pattern, irrigation scheduling
C:\website\atulbackup\docfiles \SER\2aprjob_ganga canal UPharyana\CD-UGC FINAL\Ch-4.doc 20
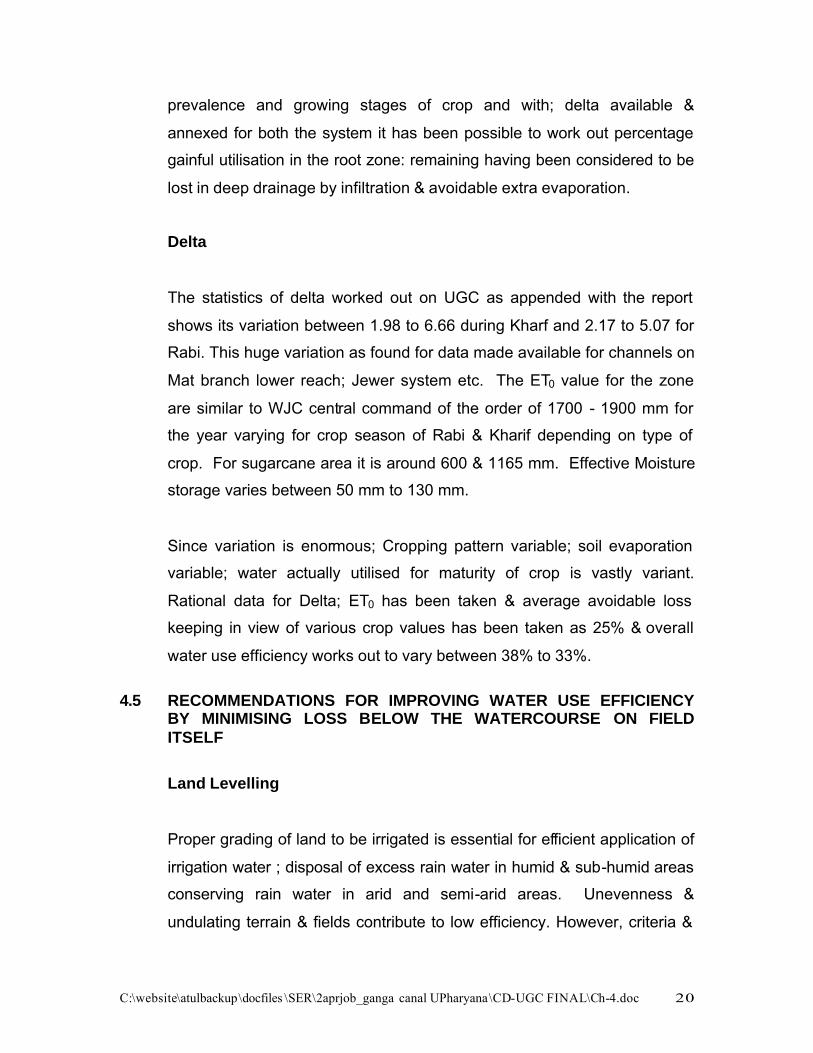
prevalence and growing stages of crop and with; delta available &
annexed for both the system it has been possible to work out percentage
gainful utilisation in the root zone: remaining having been considered to be
lost in deep drainage by infiltration & avoidable extra evaporation.
Delta
The statistics of delta worked out on UGC as appended with the report
shows its variation between 1.98 to 6.66 during Kharf and 2.17 to 5.07 for
Rabi. This huge variation as found for data made available for channels on
Mat branch lower reach; Jewer system etc. The ET0 value for the zone
are similar to WJC central command of the order of 1700 - 1900 mm for
the year varying for crop season of Rabi & Kharif depending on type of
crop. For sugarcane area it is around 600 & 1165 mm. Effective Moisture
storage varies between 50 mm to 130 mm.
Since variation is enormous; Cropping pattern variable; soil evaporation
variable; water actually utilised for maturity of crop is vastly variant.
Rational data for Delta; ET0 has been taken & average avoidable loss
keeping in view of various crop values has been taken as 25% & overall
water use efficiency works out to vary between 38% to 33%.
4.5 RECOMMENDATIONS FOR IMPROVING WATER USE EFFICIENCY
BY MINIMISING LOSS BELOW THE WATERCOURSE ON FIELD ITSELF
Land Levelling
Proper grading of land to be irrigated is essential for efficient application of
irrigation water ; disposal of excess rain water in humid & sub-humid areas
conserving rain water in arid and semi-arid areas. Unevenness &
undulating terrain & fields contribute to low efficiency. However, criteria &

C:\website\atulbackup\docfiles \SER\2aprjob_ganga canal UPharyana\CD-UGC FINAL\Ch-4.doc 21
extent of land levelling for water use efficiency is guided by soil profile,
land slopes; source of irrigation water; method of irrigation, climatic
condition & type of crop to be grown.
Studies conducted in Haryana Agriculture University in plots of 35 x 7.5 m
size by establishing five different levelling indices i.e. 1.2, 2.0, 2.5, 3.0 3.7
and under each levelling index; two irrigation treatments i.e. applying only
a fixed 6 cm depth & applying enough water to irrigate the plot adequately
such as none of it was left unirrigated. Table 4.2,4.3 and 4.4 show results.
The application and distribution efficiencies are much higher with 6 cm
fixed depth of irrigation water applied than when plots are completely
covered (Table 4.2) However, storage efficiency is lower in fi xed depth
treatment. In both the treatments however, three efficiencies decreased
as the levelling index increased. The application & distribution efficiency
in the best levelled treatment 1.2 cm were 15 to 20 and higher as
compared to 3.7 cm levelling index.
Grain yield & water use efficiency versus levelling index
The three-year average data of Wheat and Bajra grain yield & water use
efficiency showed that yields reduced considerably under both the
irrigation treatments as the levelling index increased. However if irrigation
water is not a constraint & farmer tends to overuse it (thus able to waste
it); then by applying complete irrigation or excess water; loss of yield due
to poor levelling can be minimized. The amount of total water used in
Wheat crop showed that about 50 and more irrigation water had been
applied in 3.7 cm levelling index under complete irrigation treatment as
compared to only 30.6 cm in 1.2 cm levelling index and fixed 6 cm
irrigation treatment (Table 4.3). It was observed that considering yield;
cost of levelling, amount of irrigation water applied & water use efficiency,
C:\website\atulbackup\docfiles \SER\2aprjob_ganga canal UPharyana\CD-UGC FINAL\Ch-4.doc 22
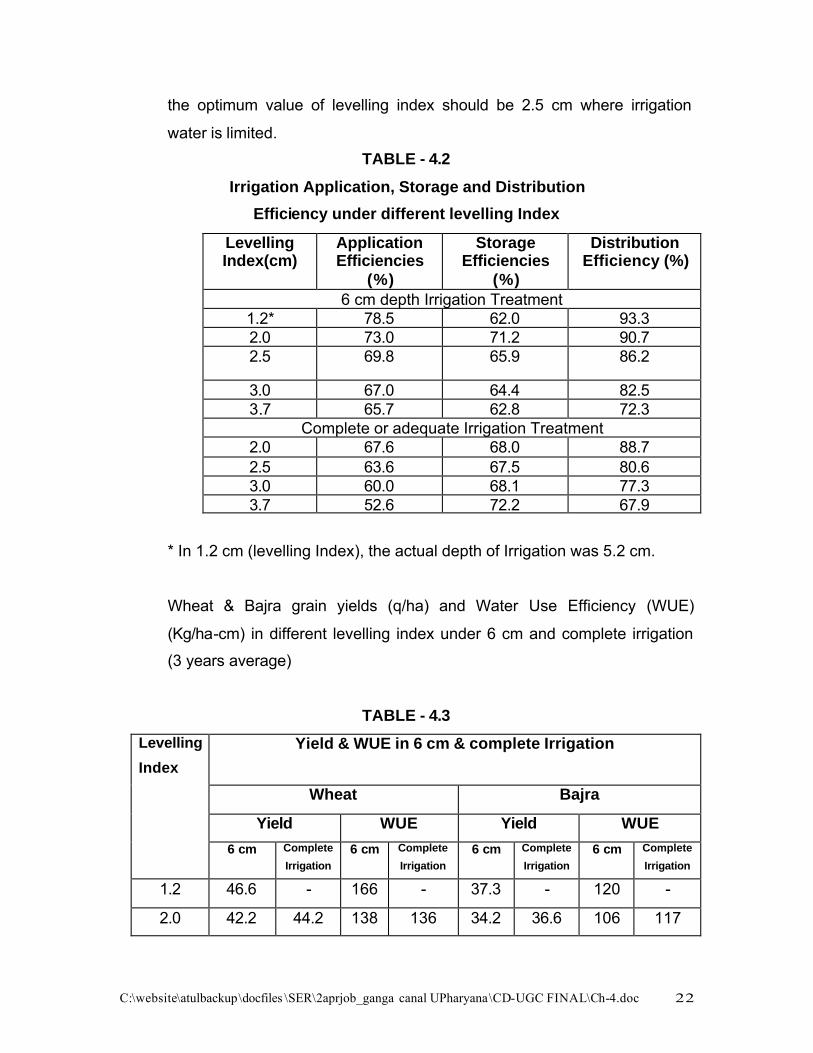
the optimum value of levelling index should be 2.5 cm where irrigation
water is limited.
TABLE - 4.2
Irrigation Application, Storage and Distribution
Efficiency under different levelling Index
Levelling Index(cm)
Application Efficiencies
(%)
Storage Efficiencies
(%)
Distribution Efficiency (%)
6 cm depth Irrigation Treatment 1.2* 78.5 62.0 93.3 2.0 73.0 71.2 90.7 2.5 69.8 65.9 86.2
3.0 67.0 64.4 82.5 3.7 65.7 62.8 72.3
Complete or adequate Irrigation Treatment 2.0 67.6 68.0 88.7 2.5 63.6 67.5 80.6 3.0 60.0 68.1 77.3 3.7 52.6 72.2 67.9
* In 1.2 cm (levelling Index), the actual depth of Irrigation was 5.2 cm.
Wheat & Bajra grain yields (q/ha) and Water Use Efficiency (WUE)
(Kg/ha-cm) in different levelling index under 6 cm and complete irrigation
(3 years average)
TABLE - 4.3
Levelling
Index
Yield & WUE in 6 cm & complete Irrigation
Wheat Bajra
Yield WUE Yield WUE
6 cm Complete
Irrigation
6 cm Complete
Irrigation
6 cm Complete
Irrigation
6 cm Complete
Irrigation
1.2 46.6 - 166 - 37.3 - 120 -
2.0 42.2 44.2 138 136 34.2 36.6 106 117

C:\website\atulbackup\docfiles \SER\2aprjob_ganga canal UPharyana\CD-UGC FINAL\Ch-4.doc 23
Levelling
Index
Yield & WUE in 6 cm & complete Irrigation
Wheat Bajra
Yield WUE Yield WUE
6 cm Complete
Irrigation
6 cm Complete
Irrigation
6 cm Complete
Irrigation
6 cm Complete
Irrigation
2.5 39.3 41.9 128 120 32.9 34.1 99 99
3.0 36.5 40.2 116 108 31.4 29.6 92 82
3.7 34.9 37.3 110 92 27.9 29.7 84 83
TABLE - 4.4
Total Water Use (cm) in different levelling Indices
under 6 cm & complete irrigation
Levelling Index Water Use (CM)*
6 CM
Complete Irrigation
1.2 30.6 -
2.0 34.0 38.3
2.5 34.4 40.8
3.0 34.9 42.8
3.7 35.4 47.0
* Total water use is inclusive of irrigation water, rainfall & profile water
Field observations on selected chaks of Jatari Mr., Baldeo Disty & Hathin
Disty reveal losses in the range of 15-20 %.
Study conducted also showed that on a freshly ploughed up field of size
30 M x 30 M half a cusec canal supply was released. The time taken to
cover the field was observed. Discharge was then increased to double &
it was noticed that 0.5 cusec of water requires 1.40 times the volume of

C:\website\atulbackup\docfiles \SER\2aprjob_ganga canal UPharyana\CD-UGC FINAL\Ch-4.doc 24
water to cover same areas as when as discharge of 1.0 cusec was
released. This experiment was conducted on sandy-loam soil. Results
vary on different types of soils.
4.6 RECOMMENDED METHODS FOR FIELD APPLICATION UNDER DIFFERENT CONDITIONS FOR OPTIMISING WATER USE EFFICIENCIES
Improper methods of water application does not result merely in water
loss due to percolation beyond the reach of crop root zone but also a loss
of nutrients due to leaching. This also results in non-uniform distribution &
reduced crop yields. Efficient water application is one that enables
uniform application of water according to the need of the crop with its
minimum loss and at rate and frequency consistent with intake water
retention characteristics of the soil. Important factors for choice of method
are : -
i) Crop Species Rooting depth; consumptive use and peak daily water use; critical stages for watering criteria
ii) Climate Temperature; relative humidity wind velocity; rainfall
iii) Land topography Depth of soil; land preparation cost iv) Soil Characteristics Water intake & retention properties v) Irrigation Water Supply Canal supply : - Adequacy of water, size of
stream, Delivery schedules, water quality vi) Any problem Salinity / alkalinity' high Sub-soil water level;
Drainage
Irrigation Efficiency: Entire water applied for irrigation can never be stored
in the root zone; even in the most versatile of application techniques;
losses do occur due to non-uniform distribution over the field; waste at
the end of borders and furrows ; some percolation below the root zone
depth & in case of sprinkler irrigation; evaporation from the spray and
retention on the foliage.

C:\website\atulbackup\docfiles \SER\2aprjob_ganga canal UPharyana\CD-UGC FINAL\Ch-4.doc 25
For selecting and evaluating performance of any Irrigation method; the
three irrigation efficiencies i.e. application; storage & distribution have
been kept in view.
Border Irrigation
Field experiments in sandy loam soils were conducted to select optimum
length, width & slopes of border strips. It was observed that grain yield &
WUE of wheat was 8.3 & 8.4 and respectively higher in 70 M long borders
as compared to 50 M, but with regard to slope the level border gave
higher yields than steeper slopes. The WUE decreased with increasing
width & decreasing slope (Refer Table 4.5). In respect of width of borders,
higher wheat yield was obtained in 8 M wide borders than in 10 to 12 M
wide borders. Thus where water is scarce & considering WUE surface
drainage needs in Kharif season & also keeping in view the land grading
cost, border strips of 70 M long and 7.5 M width were found to be most
suitable. However, where water availability is not a constraint level
borders of same width & length result in better performance.
Border method is more suitable to soils having moderately low to
moderately high infiltration rate; not used in coarse sandy soils with high
infiltration rates because of stringent limitation in design; also not suited to
soils with low infiltration rate; since to provide adequate infiltration time
without surface runoff at the lowest end; the irrigation stream may be too
small to completely cover the border strip.
The border strip is suitable to irrigate all close-growing crops like Wheat;
Barley, Fodder crop and legumes. However, not suitable for crops like
rice which requires standing water.
C:\website\atulbackup\docfiles \SER\2aprjob_ganga canal UPharyana\CD-UGC FINAL\Ch-4.doc 26
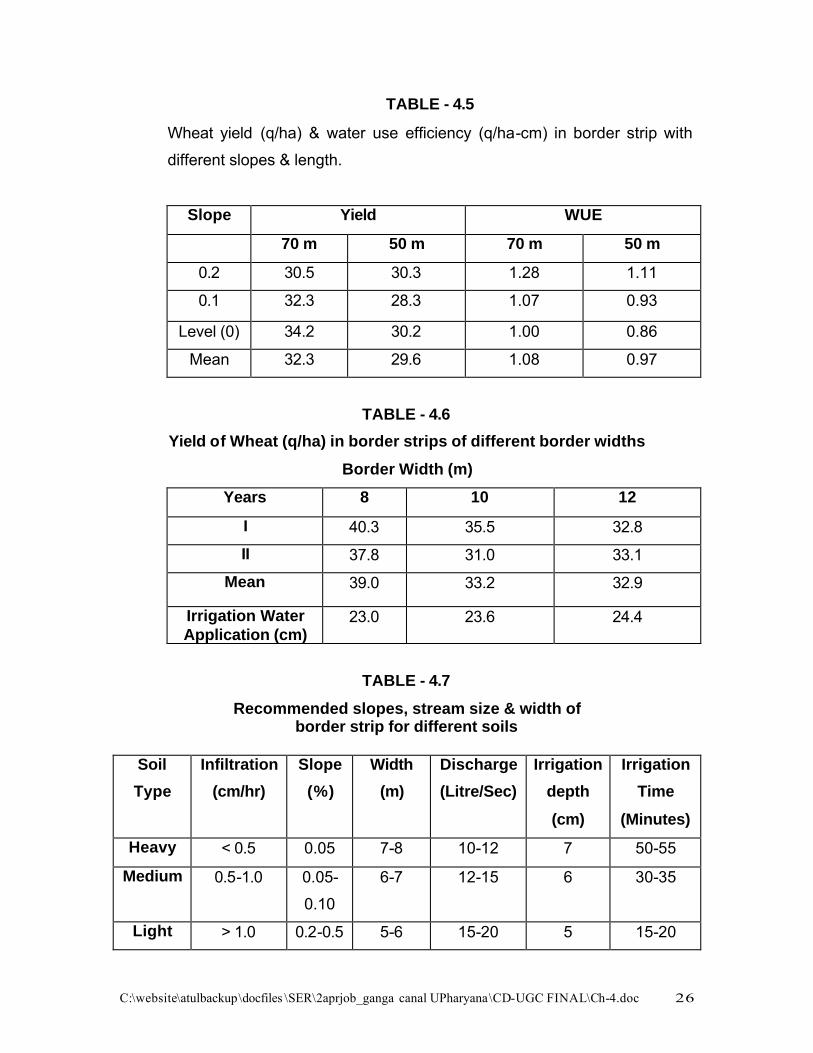
TABLE - 4.5
Wheat yield (q/ha) & water use efficiency (q/ha-cm) in border strip with
different slopes & length.
Slope Yield WUE
70 m 50 m 70 m 50 m
0.2 30.5 30.3 1.28 1.11
0.1 32.3 28.3 1.07 0.93
Level (0) 34.2 30.2 1.00 0.86
Mean 32.3 29.6 1.08 0.97
TABLE - 4.6
Yield of Wheat (q/ha) in border strips of different border widths
Border Width (m)
Years 8 10 12
I 40.3 35.5 32.8
II 37.8 31.0 33.1
Mean 39.0 33.2 32.9
Irrigation Water Application (cm)
23.0 23.6 24.4
TABLE - 4.7
Recommended slopes, stream size & width of border strip for different soils
Soil
Type
Infiltration
(cm/hr)
Slope
(%)
Width
(m)
Discharge
(Litre/Sec)
Irrigation
depth
(cm)
Irrigation
Time
(Minutes)
Heavy < 0.5 0.05 7-8 10-12 7 50-55
Medium 0.5-1.0 0.05-
0.10
6-7 12-15 6 30-35
Light > 1.0 0.2-0.5 5-6 15-20 5 15-20
C:\website\atulbackup\docfiles \SER\2aprjob_ganga canal UPharyana\CD-UGC FINAL\Ch-4.doc 27
i) Border strip is more suitable for medium textured soils.
ii) Length may be 60-70 m.
iii) Inflow is to be stopped when water has advanced to 80 m length of the
border.
iv) When available discharge is much more than required two or more strips
may be watered simultaneously.
v) When land slope is more than recommended & obtaining design slope is
difficult either reduce the discharge or increase the width.
Check Method of Application
Water is applied individually to small & relatively level plots surrounded by
ridges so that required depth is impounded rapidly in the field. In rolling
topography, plots follow contour & application called contour checks. Deep
percolation is directly proportional to the water spread in the plot. Thus
largest available non-erosive stream be adopted for irrigation so that
spread time is shortest. In this method deep percolation losses can be
estimated by an equation & also with help of monograph.
Rough rule being that water spread in the entire plot should be covered in
one fourth of the time required so as to infiltrate the net depth of irrigation.
TABLE - 4.8
Recommended Check Sizes for different soils & size of stream
Soil Type Stream size (litres/ Sec)
14.0 28.0
Heavy 200-240 350-400
Medium 100-125 150-180
Light 16-20 20-25
C:\website\atulbackup\docfiles \SER\2aprjob_ganga canal UPharyana\CD-UGC FINAL\Ch-4.doc 28
Plot size may be rectangular / square but ratio of length / width not more
than 4:1.
Furrow Irrigation
This is used to irrigate row crops with furrows developed between the
rows in the planting and cultivation process. Water in the furrow contacts
only 1/2 to 1/5 of land surface thus reducing puddling and crusting of soils
& renders early cultivation. It is more suitable to crops sensitive to
ponded water. When salinity is a problem; double row beds alternate
furrows avoiding salt accumulation near the young seedling. Furrows are
most commonly made down the slope but when land slope exceed the
safe limit of soil erosion they are made on contour. These are effective in
area needing surface drainage. These also are effective when rain water
is to be conserved. In scarcity areas of water; system of alternate/skip
furrow burrow irrigation results in considerable saving of water.
Furrow stream : - Maximum non-erosive stream size is estimated by
Qm = 0.6 litres / sec
Qm = maxm non-erosive stream size in litres / sec
S = furrow slope
Sprinkler Irrigation
i) It is suitable for almost all crops except rice & Jute. One or more of
following make it a better choice than surface irrigation
ii) Sandy soils or soils with very high infiltration rate (more than 7.5 cm
/ hr)
iii) Shallow soils; the topography of which prevents desired levelling
iv) Small stream & scarce water
v) Undulating topography, sand dunes, too steep to level

C:\website\atulbackup\docfiles \SER\2aprjob_ganga canal UPharyana\CD-UGC FINAL\Ch-4.doc 29
vi) Labour scarce & costly
In Western Yamuna Canal command areas in districts of Bhiwani,
Mohindergarh, parts of Rohtak, Jhajjar, Hissar : Sprinkler Irrigation would
be appropriate. This would add to savings in Water.
4.7 INCREASING WATER USE EFFICIENCY BY IMPROVING UPON CROP
& SOIL MANAGEMENT PRACTICES
Water Use Efficiency (WUE), Crop yield, Evapotranspiration of crop area
is influenced by crop and soil management practices. The numerator i.e.
yield can be changed by management practice whereas denominator is
more difficult to control. WUE is not closely dependent on the water
available if the supply is within the evapotranspiration limit; even though
the crop yields depend on the adequacy of water supply. Storage of more
water in the soil profile increase greatly the WUE of grain crops grown
under conditions of limited water. Allowing an irrigated grain crop like
wheat or maize run out of water at the critical phases of its growing may
reduce yield & WUE drastically without lowering appreciably the total
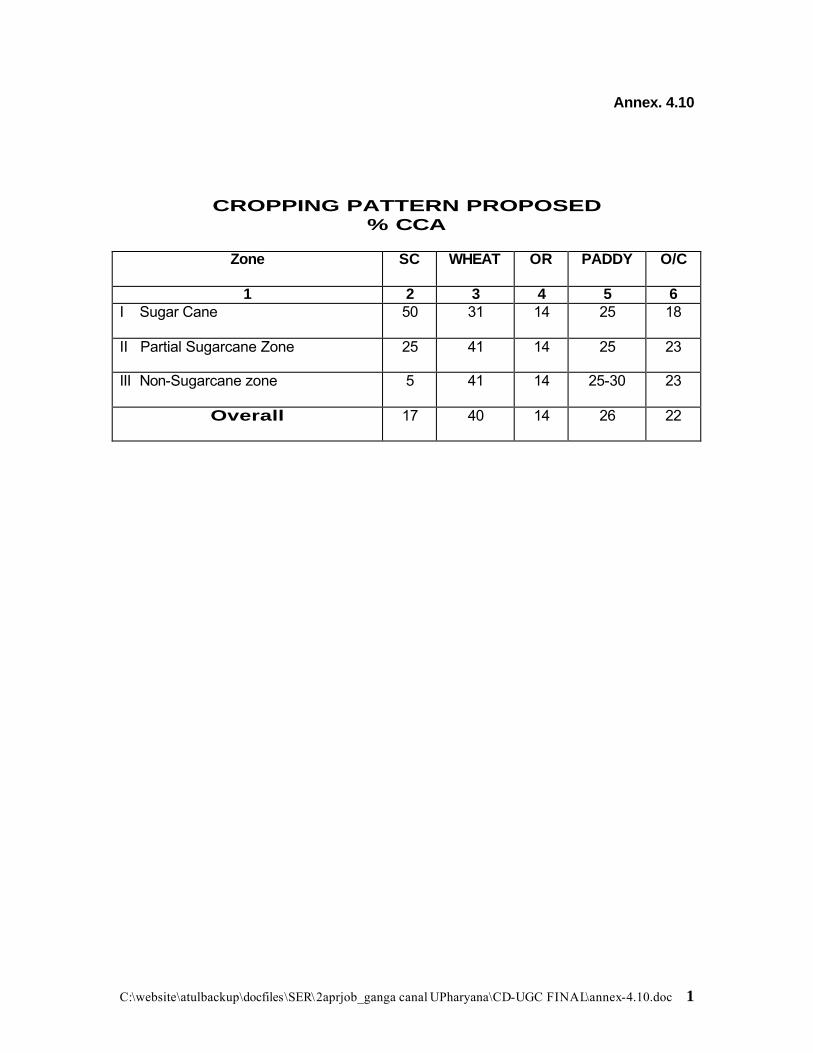
seasonal evapotranspiration. Proposed cropping pattern is given at
Annexure 4.10.
Selection of species
One of the basic approach of increasing crop yield & WUE in a particular
growing environment can be selection of plant species adopted to the total
amount and distribution pattern of water. Plants vary greatly in
requirement of water.
Productivity of Cereal per unit of water (An experiment)
Crop Species Water Requirement cm
Yield (Kg/ha)
Productivity of water kg/ha/cm
Rice 120 4500 3.7 Pearlmillet (Bajra) 50 4000 8.0 Maize 62.5 5000 8.0 Wheat 40.0 5000 12.5
C:\website\atulbackup\docfiles \SER\2aprjob_ganga canal UPharyana\CD-UGC FINAL\Ch-4.doc 30
The plant characteristics which influence water requirement are leaf area;
extent of root system; length of growing season; number, distribution and
size of stomata, inclination of leaves specis ; selection, Plant choice &
breeding can enhance the WUE. Predictions on moisture availability,
rainfall, ground water aid improving WUE.
Planting pattern i.e. density and row spacing; enabling the plant canopy
more effective in intercepting radiant energy and shading weeds;
reduction in rain drop impact on soil structures aid the process. Dwarf
variety of row crops benefit more from narrow rows than tall late maturing
varieties.
Planting dates are extremely important cultural practices in efficient use of
irrigation water. Criteria being to choose date of sowing to ensure good
germination by placing seed in the optimum moisture zone. This is so
very true & essential in semi-arid / arid zones of Western Jamuna Canal .
WEED ELIMINATION
Weeds compete with crops for soil nutrients, water as well as light. Water
requirement of weeds is greater than that of crop. Competition begins
when root system of weed & crop overlap. Eradication & Control of weed
is necessary to increase WUE of crop.
Efficient crop & Water management to increase WUE includes judicious
use of Chemical pesticides in producing healthy crop plant.
Tillage - Principal effect of tillage are the preparation of seed bed
conducive to the germination of seed and growth of seedling; conservation
of soil moisture & providing adequate soil depth for optimum root growth.

C:\website\atulbackup\docfiles \SER\2aprjob_ganga canal UPharyana\CD-UGC FINAL\Ch-4.doc 31
Response of fertilizer to Irrigation : Soil moisture and nutrient availability
have a close relationship. Maximum benefit from fertilizer application can
be obtained under Irrigated agriculture. With adequate nutrient supply;
plants which are limited in growth due to moisture stress would have a
higher content of mineral nutrients than plant under comparable fertility but
not limited in growth by moisture supply.
A detailed module of fertilizer application; after evaluating nutrient
deficiency; calibration of dose; interval; control & variation should be
available to the training & visit Staff to educate the farmer in enhancing
overall WUE.
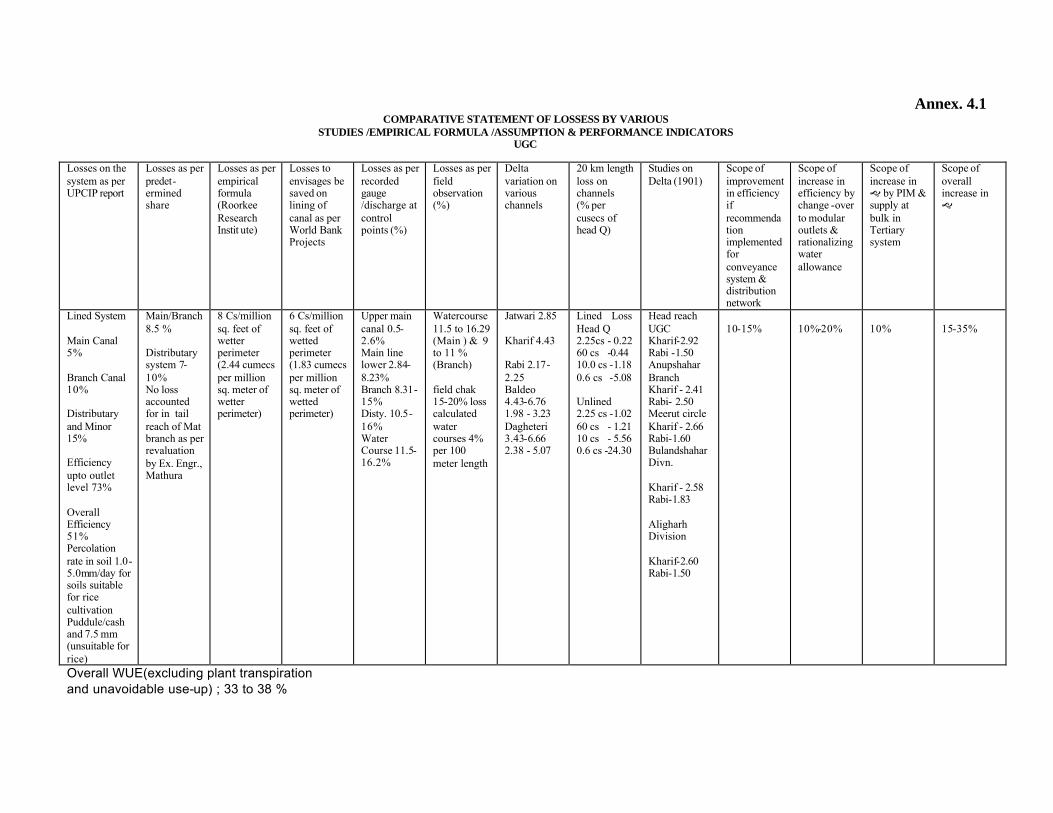
Annex. 4.1 COMPARATIVE STATEMENT OF LOSSESS BY VARIOUS
STUDIES /EMPIRICAL FORMULA /ASSUMPTION & PERFORMANCE INDICATORS UGC
Losses on the system as per UPCIP report
Losses as per predet-ermined share
Losses as per empirical formula (Roorkee Research Instit ute)
Losses to envisages be saved on lining of canal as per World Bank Projects
Losses as per recorded gauge /discharge at control points (%)
Losses as per field observation (%)
Delta variation on various channels
20 km length loss on channels (% per cusecs of head Q)
Studies on Delta (1901)
Scope of improvement in efficiency if recommendation implemented for conveyance system & distribution network
Scope of increase in efficiency by change -over to modular outlets & rationalizing water allowance
Scope of increase in g by PIM & supply at bulk in Tertiary system
Scope of overall increase in g
Lined System Main Canal 5% Branch Canal 10% Distributary and Minor 15% Efficiency upto outlet level 73% Overall Efficiency 51% Percolation rate in soil 1.0-5.0mm/day for soils suitable for rice cultivation Puddule/cash and 7.5 mm (unsuitable for rice)
Main/Branch 8.5 % Distributary system 7-10% No loss accounted for in tail reach of Mat branch as per revaluation by Ex. Engr., Mathura
8 Cs/million sq. feet of wetter perimeter (2.44 cumecs per million sq. meter of wetter perimeter)
6 Cs/million sq. feet of wetted perimeter (1.83 cumecs per million sq. meter of wetted perimeter)
Upper main canal 0.5-2.6% Main line lower 2.84-8.23% Branch 8.31-15% Disty. 10.5-16% Water Course 11.5-16.2%
Watercourse 11.5 to 16.29 (Main ) & 9 to 11 % (Branch) field chak 15-20% loss calculated water courses 4% per 100 meter length
Jatwari 2.85 Kharif 4.43 Rabi 2.17-2.25 Baldeo 4.43-6.76 1.98 - 3.23 Dagheteri 3.43-6.66 2.38 - 5.07
Lined Loss Head Q 2.25cs - 0.22 60 cs -0.44 10.0 cs -1.18 0.6 cs -5.08 Unlined 2.25 cs -1.02 60 cs - 1.21 10 cs - 5.56 0.6 cs -24.30
Head reach UGC Kharif-2.92 Rabi -1.50 Anupshahar Branch Kharif - 2.41 Rabi- 2.50 Meerut circle Kharif - 2.66 Rabi-1.60 Bulandshahar Divn. Kharif - 2.58 Rabi-1.83 Aligharh Division Kharif-2.60 Rabi-1.50
10-15%
10%-20%
10%
15-35%
Overall WUE(excluding plant transpiration and unavoidable use-up) ; 33 to 38 %

Discharge
Days Run Irrigation Discharge Days Run IrrigationDischarg
eDays Run
A B C A X B A B C A X B A B1 Jewer 300.00 83.00 3344.00 24900.00 290.00 105.00 3588.00 30450.00 289.00 74.002 Talra 14.00 81.00 246.00 1134.00 3.68 10.00 76.00 226.00 760.00 2.69 14.00 67.003 Sunpera 2.50 57.00 14.00 142.50 8.00 2.00 10.00 20.00 2.50 67.004 Hasrana 2.00 81.00 39.00 162.00 3.32 1.50 80.00 33.00 120.00 2.90 2.00 67.005 Alipura 1.07 71.00 15.00 75.97 4.04 1.00 41.00 41.00 1.07 67.006 Bailane 1.06 67.00 10.00 71.02 5.68 1.00 10.00 10.00 1.06 67.007 Gadhana 2.00 81.00 30.00 162.00 4.32 1.50 89.00 23.00 133.50 4.64 2.00 67.008 Shairg 5.00 77.00 99.00 385.00 3.11 3.00 56.00 45.00 168.00 2.98 5.00 40.009 Kherli 3.00 77.00 53.00 231.00 3.48 1.50 68.00 35.00 102.00 2.33 3.00 33.0010 Chandpur 4.00 77.00 140.00 308.00 1.76 2.00 45.00 44.00 90.00 1.63 4.00 54.0011 Raunikha 5.00 77.00 144.00 385.00 2.13 3.00 43.00 56.00 129.00 1.84 5.00 42.0012 Ravupra 3.00 63.00 127.00 189.00 1.19 2.10 74.00 160.00 155.40 0.80 3.00 56.0013 Nand Kishore Pura 4.00 77.00 51.00 308.00 4.83 2.80 73.00 45.00 204.40 3.63 4.00 57.0014 Amerpur Palaka 3.60 53.00 70.00 190.80 2.18 3.00 - - 0.00 3.60 50.0015 Right Phalda 5.00 53.00 157.00 265.00 1.35 4.00 81.00 167.00 324.00 1.55 5.00 53.0016 Karauli 6.00 70.00 146.00 420.00 2.30 4.00 104.00 115.00 416.00 2.90 6.00 63.0017 Dayanatpur 23.00 76.00 264.00 1748.00 5.29 15.00 104.00 259.00 1560.00 4.91 23.00 53.0018 Veerumpur 7.00 61.00 220.00 427.00 1.55 5.00 87.00 197.00 435.00 1.77 7.00 55.0019 Ruhera 4.00 62.00 195.00 248.00 1.02 3.00 98.00 77.00 294.00 3.05 4.00 44.0020 Kishorepur 5.50 62.00 125.00 341.00 3.18 3.00 93.00 47.00 279.00 4.70 5.50 30.0021 Varnota 52.00 69.00 999.00 3588.00 2.87 40.00 108.00 1109.00 4320.00 3.12 52.00 63.0022 Khawajupur 5.00 69.00 37.00 345.00 7+ 2.00 95.00 36.00 190.00 4.22 5.00 60.0023 Chaureeli 15.00 59.00 195.00 885.00 3.60 8.00 95.00 228.00 760.00 2.66 15.00 62.0024 Shivarau 8.00 67.00 284.00 536.00 1.50 4.00 97.00 225.00 388.00 1.38 8.00 48.0025 Vaina 8.50 61.00 427.00 518.50 0.97 4.20 104.00 503.00 436.80 0.70 8.50 58.0026 Gopalgarh 7.00 61.00 138.00 427.00 2.47 3.50 104.00 107.00 364.00 2.72 7.00 55.0027 Sikarpur 15.00 69.00 509.00 1035.00 1.63 7.00 103.00 402.00 721.00 1.43 15.00 22.0028 Jaitari 40.00 59.00 661.00 2360.00 2.85 20.00 94.00 349.00 1880.00 4.30 40.00 35.0029 Karanpur 5.80 6.00 65.00 34.80 0.42 0.00 5.80 16.0030 Gadak 16.00 34.00 170.00 544.00 2.56 5.00 6.00 27.00 30.00 0.80 16.00 7.0031 Untasani 25.00 25.00 111.00 625.00 4.50 8.00 18.00 10.00 144.00 11.50 25.00 20.0032 Malab33 Gaurola34 kolana
DATA NOT RECEIVED
DeltaS.No.
CROP SEAON RABI CROP SEASON KHARIF CROP SEASON RABI Name of Channel (Minor)
Delta
UPPER GANGA CANAL SYSTEMWATER ACCOUNT & IRRIGATION ON
DISTRIBUTARY & MINOR SYSTEM OF JEWAR DISTRIBUTARY
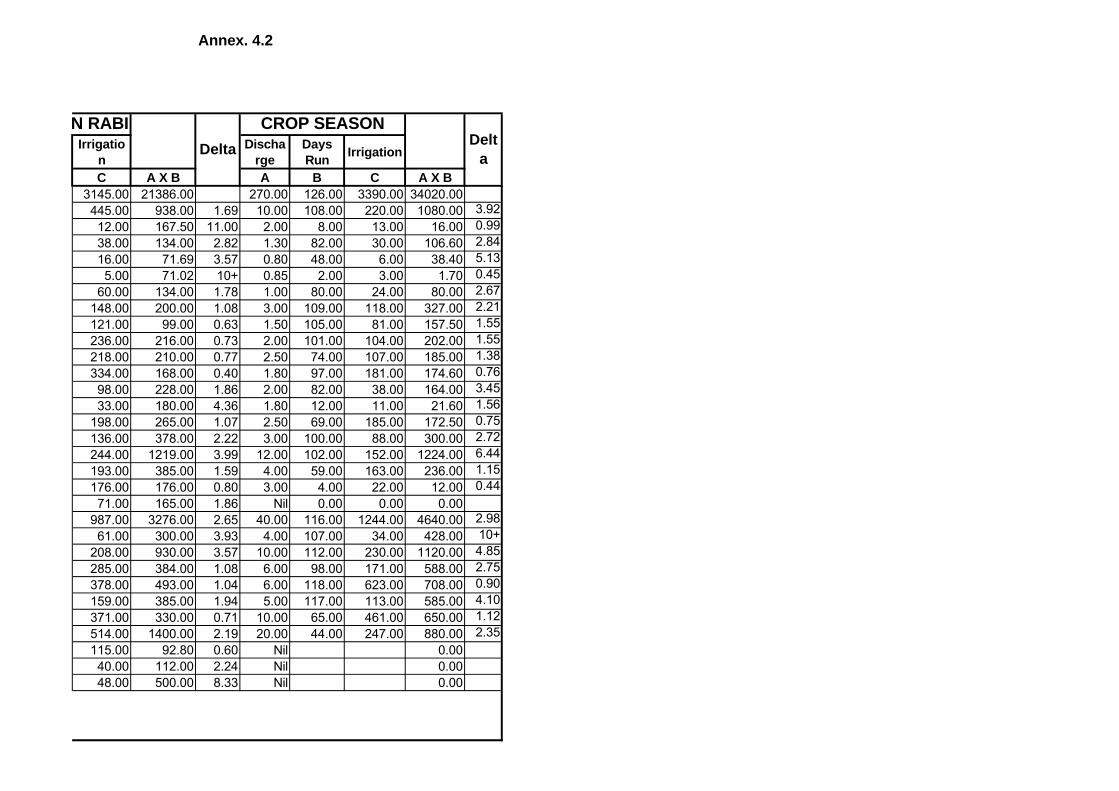
Irrigation
Discharge
Days Run
Irrigation
C A X B A B C A X B3145.00 21386.00 270.00 126.00 3390.00 34020.00445.00 938.00 1.69 10.00 108.00 220.00 1080.00 3.9212.00 167.50 11.00 2.00 8.00 13.00 16.00 0.9938.00 134.00 2.82 1.30 82.00 30.00 106.60 2.8416.00 71.69 3.57 0.80 48.00 6.00 38.40 5.135.00 71.02 10+ 0.85 2.00 3.00 1.70 0.45
60.00 134.00 1.78 1.00 80.00 24.00 80.00 2.67148.00 200.00 1.08 3.00 109.00 118.00 327.00 2.21121.00 99.00 0.63 1.50 105.00 81.00 157.50 1.55236.00 216.00 0.73 2.00 101.00 104.00 202.00 1.55218.00 210.00 0.77 2.50 74.00 107.00 185.00 1.38334.00 168.00 0.40 1.80 97.00 181.00 174.60 0.7698.00 228.00 1.86 2.00 82.00 38.00 164.00 3.4533.00 180.00 4.36 1.80 12.00 11.00 21.60 1.56
198.00 265.00 1.07 2.50 69.00 185.00 172.50 0.75136.00 378.00 2.22 3.00 100.00 88.00 300.00 2.72244.00 1219.00 3.99 12.00 102.00 152.00 1224.00 6.44193.00 385.00 1.59 4.00 59.00 163.00 236.00 1.15176.00 176.00 0.80 3.00 4.00 22.00 12.00 0.4471.00 165.00 1.86 Nil 0.00 0.00 0.00
987.00 3276.00 2.65 40.00 116.00 1244.00 4640.00 2.9861.00 300.00 3.93 4.00 107.00 34.00 428.00 10+
208.00 930.00 3.57 10.00 112.00 230.00 1120.00 4.85285.00 384.00 1.08 6.00 98.00 171.00 588.00 2.75378.00 493.00 1.04 6.00 118.00 623.00 708.00 0.90159.00 385.00 1.94 5.00 117.00 113.00 585.00 4.10371.00 330.00 0.71 10.00 65.00 461.00 650.00 1.12514.00 1400.00 2.19 20.00 44.00 247.00 880.00 2.35115.00 92.80 0.60 Nil 0.0040.00 112.00 2.24 Nil 0.0048.00 500.00 8.33 Nil 0.00
Annex. 4.2
CROP SEASON
DeltaDelt
a
CROP SEASON RABI

Annex. 4.3
GAUGE DISCHARGE GAUGEDISCHARGE GAUGE DISCHARGE
(ft) (Cusecs) (ft) (Cusecs) (ft) (Cusecs)2.0 1923 4.7 4592 7.4 85342.1 1996 4.8 4656 7.5 87182.2 2069 4.9 4720 7.6 89022.3 2142 5.0 4786 7.7 90862.4 2215 5.1 4924 7.8 92702.5 2288 5.2 5062 7.9 94542.6 2361 5.3 5200 8.0 96382.7 2434 5.4 5338 8.1 98222.8 2507 5.5 5476 8.2 100062.9 2580 5.6 5614 8.3 101903.0 2654 5.7 5752 8.4 103743.1 2802 5.8 5890 8.5 105583.2 2950 5.9 6028 8.6 107423.3 3099 6.0 6166 8.7 109263.4 3148 6.1 6329 8.8 111103.5 3297 6.2 6492 8.9 112943.6 3546 6.3 6655 9.0 114783.7 3695 6.4 68183.8 3843 6.5 69813.9 3991 6.6 71444.0 4140 6.7 73074.1 4205 6.8 74714.2 4270 6.9 76354.3 4335 7.0 77984.4 4400 7.1 79824.5 4464 7.2 81664.6 4528 7.3 8350
DISCHARGE TABLE OF CONTROL POINT AT BELARA (UGC)
C:\UGC-FINAL\annex-4.3.xls

Annex. 4.4
GAUGE DISCHARGE GAUGE DISCHARGE GAUGE DISCHARGE(ft) (cusecs) (ft) (Cusecs) (ft) (Cusecs)2.0 1380 4.7 29652.1 1450 4.8 30202.2 1510 4.9 30802.3 1570 5.0 31572.4 1630 5.1 32102.5 1700 5.2 32802.6 1760 5.3 33502.7 1820 5.4 34202.8 1870 5.5 35002.9 1940 5.6 35803.0 2000 5.7 36703.1 2060 5.8 37603.2 2110 5.9 38503.3 2170 6.0 39303.4 2230 6.1 4030 1.1 8403.5 2280 6.2 4108 7.5=54003.6 2340 6.3 4200 7.6=55003.7 2400 6.4 4300 7.7=56003.8 2460 6.5 4380 7.8=57003.9 2520 6.6 4480 7.9=58004.0 2570 6.7 4590 8.0=59004.1 2620 6.8 47004.2 2680 6.9 48004.3 2740 7.0 49004.4 2785 7.1 500 04.5 2840 7.2 51004.6 2900 7.3 5200
7.4 5300
DISCHARGE TABLE OF CONTROL POINT AT NIWARI (UGC)
C:\UGC-FINAL\annex-4.4.xls
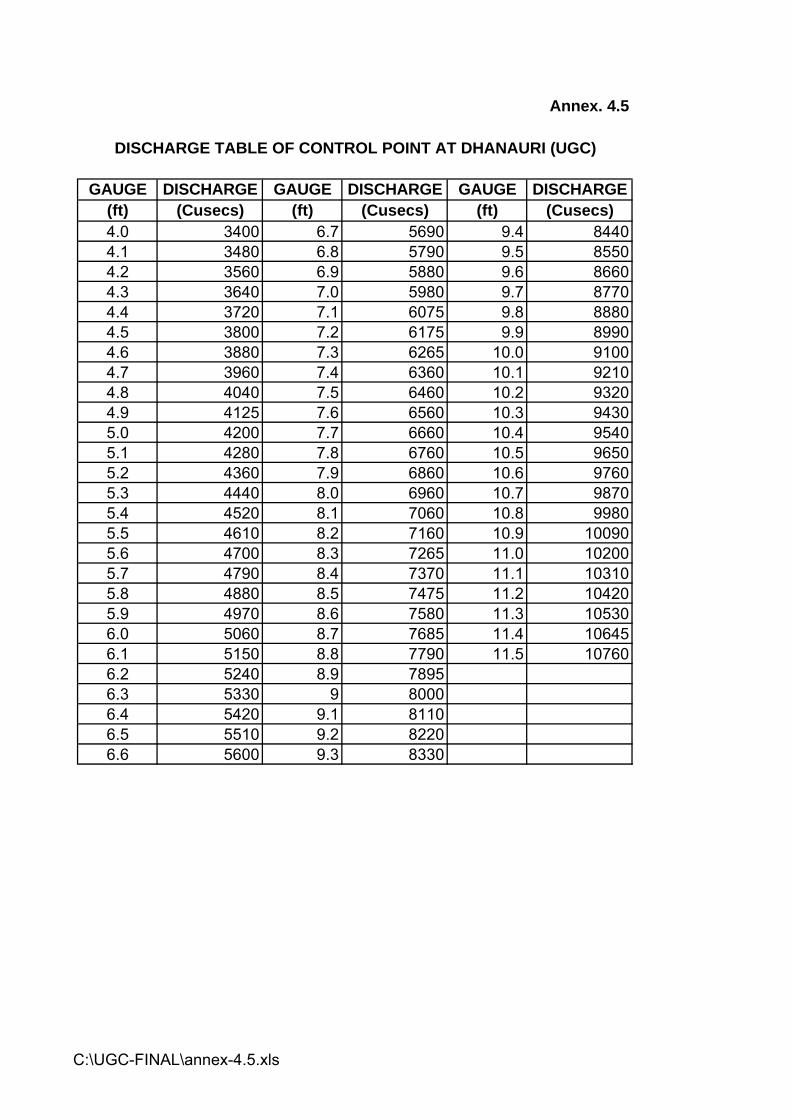
Annex. 4.5
GAUGE DISCHARGE GAUGE DISCHARGE GAUGE DISCHARGE(ft) (Cusecs) (ft) (Cusecs) (ft) (Cusecs)4.0 3400 6.7 5690 9.4 84404.1 3480 6.8 5790 9.5 85504.2 3560 6.9 5880 9.6 86604.3 3640 7.0 5980 9.7 87704.4 3720 7.1 6075 9.8 88804.5 3800 7.2 6175 9.9 89904.6 3880 7.3 6265 10.0 91004.7 3960 7.4 6360 10.1 92104.8 4040 7.5 6460 10.2 93204.9 4125 7.6 6560 10.3 94305.0 4200 7.7 6660 10.4 95405.1 4280 7.8 6760 10.5 96505.2 4360 7.9 6860 10.6 97605.3 4440 8.0 6960 10.7 98705.4 4520 8.1 7060 10.8 99805.5 4610 8.2 7160 10.9 100905.6 4700 8.3 7265 11.0 102005.7 4790 8.4 7370 11.1 103105.8 4880 8.5 7475 11.2 104205.9 4970 8.6 7580 11.3 105306.0 5060 8.7 7685 11.4 106456.1 5150 8.8 7790 11.5 107606.2 5240 8.9 78956.3 5330 9 80006.4 5420 9.1 81106.5 5510 9.2 82206.6 5600 9.3 8330
DISCHARGE TABLE OF CONTROL POINT AT DHANAURI (UGC)
C:\UGC-FINAL\annex-4.5.xls

Annex. 4.6
Some Earlier Studies & observations (1901)
On UGC
Showing variable duty in different tracts of same UGC System
Tarct Delta
D = depth of water (feet)
Kharif Rabi
Northern part Ganga 2.92 1.50
Anupshahr 2.41 2.50
Meerut 2.66 1.60
Bulandsharhr 2.58 1.83
Aligarh 2.60 1.50
Some earlier studies & observations
Duty of Water (Kharif 1901) - A Comparison
Canal Average utilisation in cusecs at the head of canal during season
B=base i.e. No. of days canal was in
flow
D = Duty of
discharge utilised
D = equivalent aggregate depth of water on the
fields on the basis of utilised
discharge (feet)
V=Volume utilised per acre irrigated (Cuft)
Upper Ganga
Canal
5152 127 73 3.41 150,320
Lower Ganga
Canal
3133 141 67 4.16 181,830
Eastern
Jamuna Canal
1310 169 120 2.75 121,680
Western
Jamuna Canal
4200 181 64 5.58 244,350
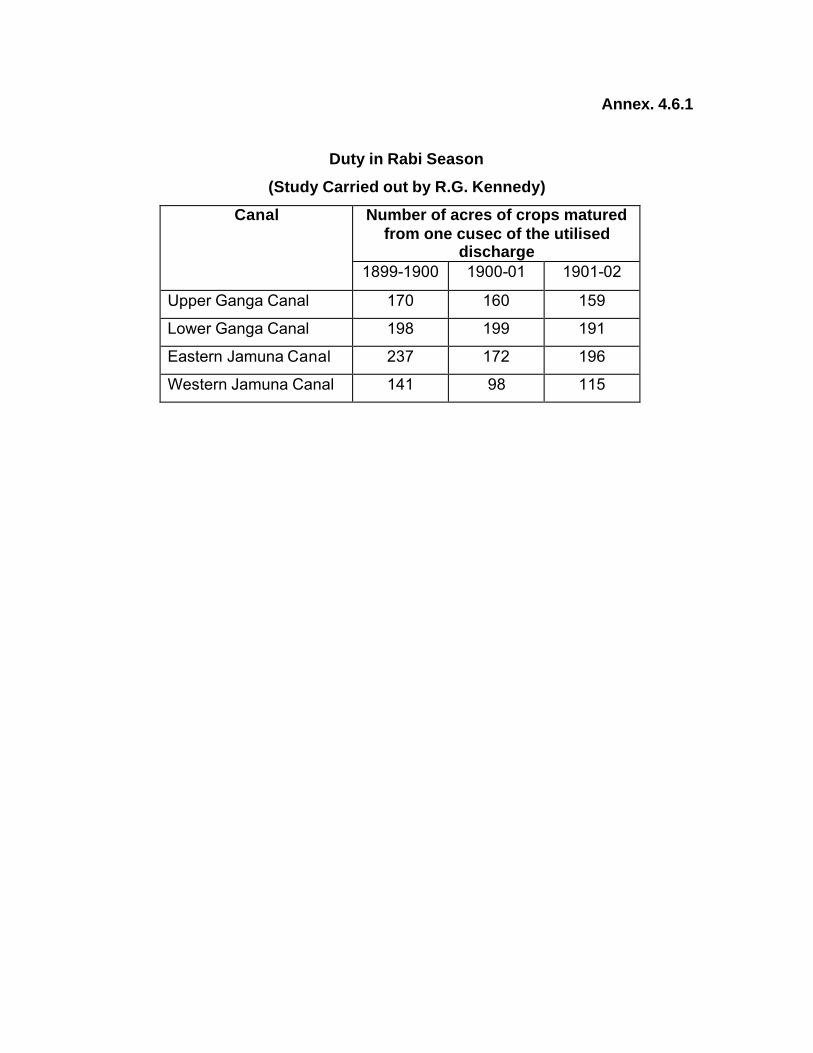
Annex. 4.6.1
Duty in Rabi Season
(Study Carried out by R.G. Kennedy)
Canal Number of acres of crops matured from one cusec of the utilised
discharge 1899-1900 1900-01 1901-02
Upper Ganga Canal 170 160 159
Lower Ganga Canal 198 199 191
Eastern Jamuna Canal 237 172 196
Western Jamuna Canal 141 98 115
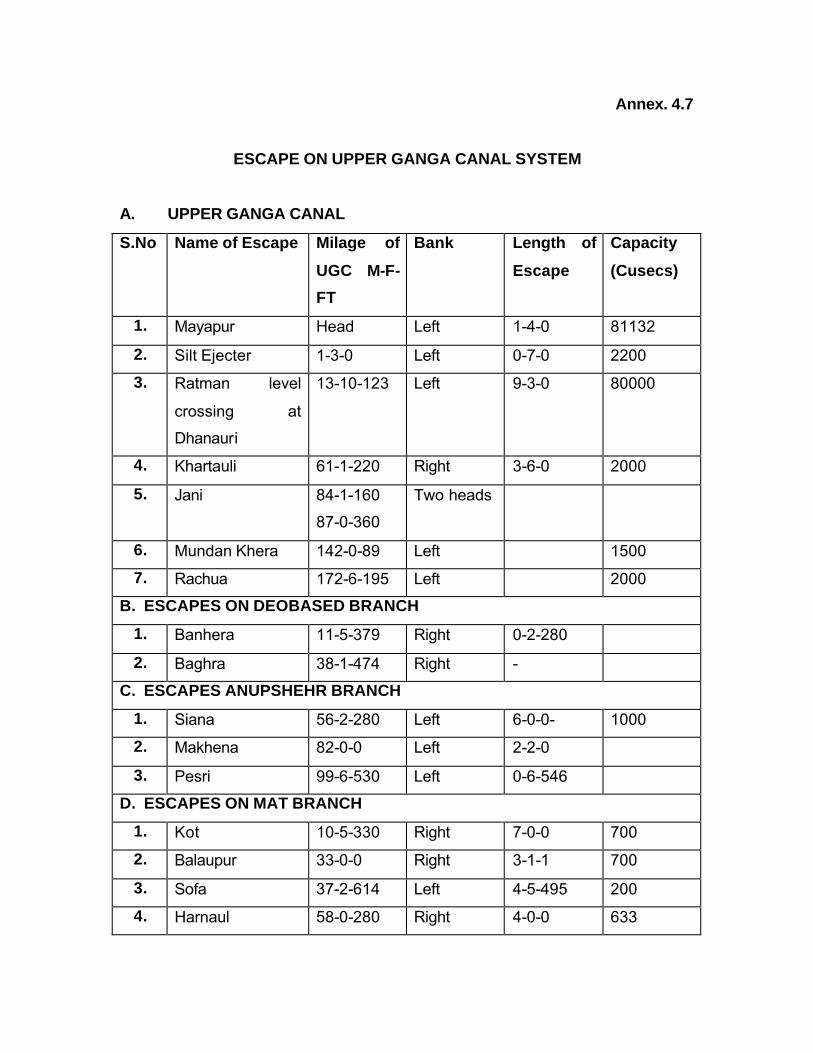
Annex. 4.7
ESCAPE ON UPPER GANGA CANAL SYSTEM
A. UPPER GANGA CANAL
S.No Name of Escape Milage of
UGC M-F-
FT
Bank Length of
Escape
Capacity
(Cusecs)
1. Mayapur Head Left 1-4-0 81132
2. Silt Ejecter 1-3-0 Left 0-7-0 2200
3. Ratman level
crossing at
Dhanauri
13-10-123 Left 9-3-0 80000
4. Khartauli 61-1-220 Right 3-6-0 2000
5. Jani 84-1-160
87-0-360
Two heads
6. Mundan Khera 142-0-89 Left 1500
7. Rachua 172-6-195 Left 2000
B. ESCAPES ON DEOBASED BRANCH
1. Banhera 11-5-379 Right 0-2-280
2. Baghra 38-1-474 Right -
C. ESCAPES ANUPSHEHR BRANCH
1. Siana 56-2-280 Left 6-0-0- 1000
2. Makhena 82-0-0 Left 2-2-0
3. Pesri 99-6-530 Left 0-6-546
D. ESCAPES ON MAT BRANCH
1. Kot 10-5-330 Right 7-0-0 700
2. Balaupur 33-0-0 Right 3-1-1 700
3. Sofa 37-2-614 Left 4-5-495 200
4. Harnaul 58-0-280 Right 4-0-0 633

Annex. 4.8
Chachura Down Kharif 1407 Crop Gauge & Discharge
(Gauge in ft. and discharge in cusecs)
Date April May June July Aug Sept
1 4.7.=1180 4.1-940 3.9.=692 4.4.=901 4.6.=969 4.4.901
2. 4.7.-1180 4.01=940 3.9=692 4.6=969 4.6=969 4.55=952
3. 4.0=900 3.9=865 4.1=752 4.8=1041 4.7=1003 4.65=981
4. 4.0=900 4.1=940 4.2=784 4.95=1092 4.75=1020 4.65=981
5. 3.5=700 4.1=940 4.0=720 4.9=1075 4.8=1041 4.7=1003
6. - 4.1=940 4.2=784 3.0=471 4.8=1041 4.7=1003
7. - 4.1=940 4.3=816 4.7=1003 4.75=1020 4.5=935
8. - 4.1=940 4.3=816 4.6=969 4.75=1020 4.5=935
9. - 4.3=1020 4.3=816 4.2=833 4.75=1020 4.4=901
10. - 4.2=980 4.3=816 4.7=1003 4.6=969 4.5=935
11. - 4.3=1020 4.3=816 4.8=1041 4.5=935 4.5=935
12. - 4.3=1020 4.35=832 4.95=1092 4.5=935 4.0=765
13. - 4.3=1020 4.2=784 4.9=1075 4.3=867 4.0=765
14. - 4.3=1020 4.3=867 4.3=867 4.4=901 4.0=765
15. 3.2=620 4.4=848 4.45=918 4.2=833 4.4=901 4.0=765
16. 3.2=620 4.4=848 4.3=867 4.1=799 4.2=833 3.7=671
17. 4.2=980 4.4=848 4.3=867 4.0=765 4.2=833 3.7=671
18. 4.4=1060 4.6=912 4.3=867 4.4=901 4.2=833 3.7=671
19. 4.25=990 4.5=880 4.1=799 4.75=1022 4.5=935 3.5=603
20. 4.4=1060 4.4=848 4.2=833 4.8=1041 4.6=969 3.5=603
21. 4.4=1060 4.1=752 4.2=833 4.8=1041 4.6=\969 3.5=603
22. 4.1=940 4.4=848 4.3=867 4.7=1003 4.6=969 3.5=603
23. 4.1=940 4.4=848 4.3=867 4.5=935 4.5=942 3.5=603
24. 4.1=940 4.55=896 4.3=867 4.8=1041 4.6=969 4.3=867
25. 4.0=900 4.55=896 4.3=867 4.5=935 4.6=969 4.4=901
26. 4.0=900 4.55=896 4.1=799 4.3=867 4.7=1002 4.4=901
27. 4.2=980 4.2=784 4.1=799 4.5=935 4.6=969 4.2=833
28. 4.1=940 4.2=784 4.1=799 4.6=969 4.7=1003 4.2=833
29. 4.1=940 4.0=720 4.1=799 4.6=969 4.5=935 4.2=833
30. 4.2=980 4.0=720 4.2=833 4.6=969 4.5=935 4.2=833
31. 4.2=720 4.4=902 4.6=969 4.0=765
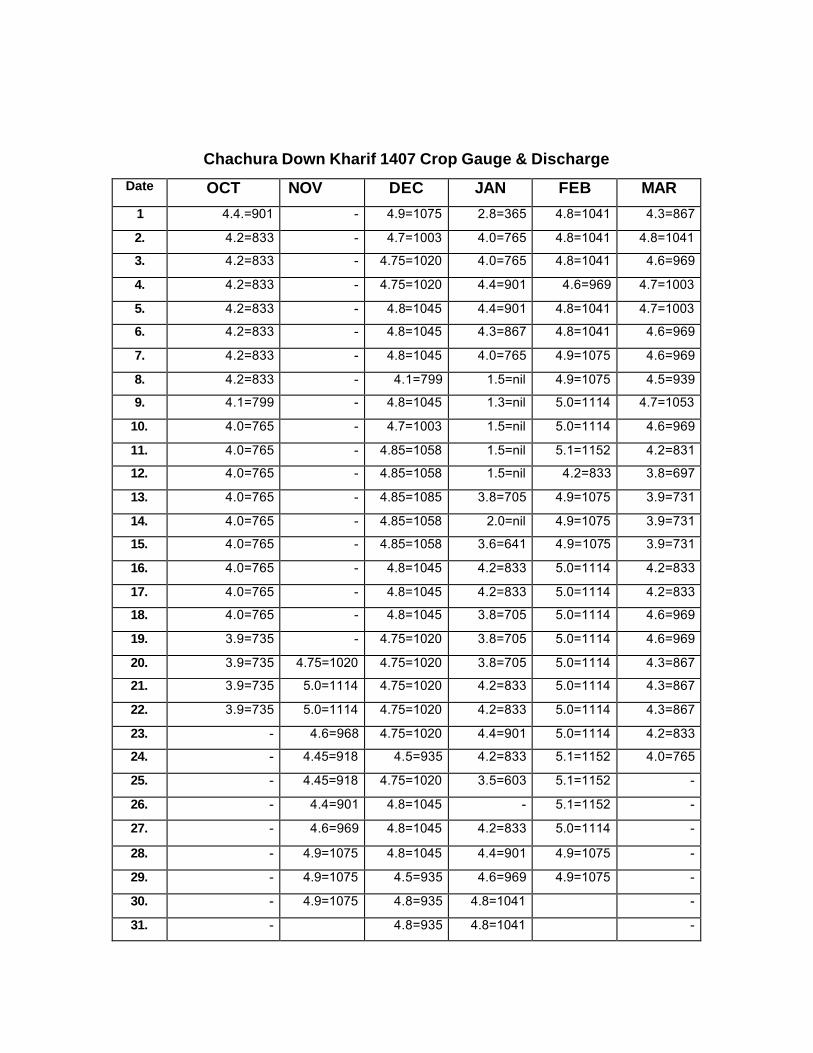
Chachura Down Kharif 1407 Crop Gauge & Discharge
Date OCT NOV DEC JAN FEB MAR
1 4.4.=901 - 4.9=1075 2.8=365 4.8=1041 4.3=867
2. 4.2=833 - 4.7=1003 4.0=765 4.8=1041 4.8=1041
3. 4.2=833 - 4.75=1020 4.0=765 4.8=1041 4.6=969
4. 4.2=833 - 4.75=1020 4.4=901 4.6=969 4.7=1003
5. 4.2=833 - 4.8=1045 4.4=901 4.8=1041 4.7=1003
6. 4.2=833 - 4.8=1045 4.3=867 4.8=1041 4.6=969
7. 4.2=833 - 4.8=1045 4.0=765 4.9=1075 4.6=969
8. 4.2=833 - 4.1=799 1.5=nil 4.9=1075 4.5=939
9. 4.1=799 - 4.8=1045 1.3=nil 5.0=1114 4.7=1053
10. 4.0=765 - 4.7=1003 1.5=nil 5.0=1114 4.6=969
11. 4.0=765 - 4.85=1058 1.5=nil 5.1=1152 4.2=831
12. 4.0=765 - 4.85=1058 1.5=nil 4.2=833 3.8=697
13. 4.0=765 - 4.85=1085 3.8=705 4.9=1075 3.9=731
14. 4.0=765 - 4.85=1058 2.0=nil 4.9=1075 3.9=731
15. 4.0=765 - 4.85=1058 3.6=641 4.9=1075 3.9=731
16. 4.0=765 - 4.8=1045 4.2=833 5.0=1114 4.2=833
17. 4.0=765 - 4.8=1045 4.2=833 5.0=1114 4.2=833
18. 4.0=765 - 4.8=1045 3.8=705 5.0=1114 4.6=969
19. 3.9=735 - 4.75=1020 3.8=705 5.0=1114 4.6=969
20. 3.9=735 4.75=1020 4.75=1020 3.8=705 5.0=1114 4.3=867
21. 3.9=735 5.0=1114 4.75=1020 4.2=833 5.0=1114 4.3=867
22. 3.9=735 5.0=1114 4.75=1020 4.2=833 5.0=1114 4.3=867
23. - 4.6=968 4.75=1020 4.4=901 5.0=1114 4.2=833
24. - 4.45=918 4.5=935 4.2=833 5.1=1152 4.0=765
25. - 4.45=918 4.75=1020 3.5=603 5.1=1152 -
26. - 4.4=901 4.8=1045 - 5.1=1152 -
27. - 4.6=969 4.8=1045 4.2=833 5.0=1114 -
28. - 4.9=1075 4.8=1045 4.4=901 4.9=1075 -
29. - 4.9=1075 4.5=935 4.6=969 4.9=1075 -
30. - 4.9=1075 4.8=935 4.8=1041 -
31. - 4.8=935 4.8=1041 -

Chachura Down Kharif 1407 Crop Gauge & Discharge
Date April May June July Aug Sept
1 - 4.8=1041 4.9=1075 4.1=799 4.0=765 5.1=1152
2. - 4.8=1041 5.0=1114 4.1=799 4.5=935 5.1=1152
3. - 4.9=1075 4.4=901 4.1=799 4.7=1003 5.1=1152
4. - 4.8=1041 4.6=969 4.3=867 4.6=969 5.1=1152
5. - 4.5=935 4.9=1075 4.5=935 4.5=935 5.1=1152
6. - 4.65=986 4.8=1041 4.5=939 4.5=935 5.1=1152
7. - 4.65=986 4.8=1041 4.6=969 4.6=969 5.1=1152
8. - 4.65=986 4.8=1041 4.6=969 4.7=1003 5.1=1152
9. - 4.65=986 4.7=1003 4.5=935 4.7=1003 5.1=1152
10. - 4.65=986 4.6=969 4.5=935 4.7=1003 5.1=1152
11. - 4.8=1041 4.5=935 4.5=935 4.8=1041 5.1=1152
12. - 4.9=1075 - 4.7=1003 4.8=1041 5.1=1152
13. - - 4.4=901 4.7=1003 4.8=1041 5.1=1152
14. - - 4.4=901 4.7=1003 4.8=1041 5.1=1152
15. - - 4.4=901 4.5=935 4.8=1041 5.1=1152
16. - - 4.5=935 4.6=969 4.8=1041 5.0=1113
17. 4.75=1025 - 4.5=935 4.6=969 4.8=1041 4.7=1113
18. 4.7=1003 - 4.5=933 4.6=969 4.4==901 4.7=1003
19. - - 4.5=933 4.6=969 4.8=1041 4.9=1075
20. - 4.5=935 4.5=933 4.6=969 5.0=1113 4.9=1075
21. 3.0=467 5.0=1114 4.5=933 4.6=969 5.0=1114 4.7=1003
22. 4.2=833 4.9=1075 4.5=935 4.6=969 4.9=1075 4.6=969
23. 4.7=1003 4.9=1075 4.5=935 4.6=969 5.0=1113 4.7=1003
24. 5.0=1114 4.9=1075 4.3=867 4.6=969 5.0=1114 4.8=10
25. 5.0=1114 4.9=1075 4.6=969 4.6=969 4.9=1075 4.5=93
26. 4.5=935 4.9=1075 4.6=969 4.6=969 4.9=1075 4.8=10
27. 4.8=1041 4.85=1058 4.7=1003 4.6=969 5.0=1114 4.9=1075
28. 4.8=1041 4.85=1058 4.7=1003 4.6=969 5.0=1114 4.9=1075
29. 4.9=1075 4.85=1058 =4.7=1003 4.7=1003 5.0=1114 5.0=1114
30. 5.0=114 4.9=1075 4.7=1003 4.7=1003 5.0=1114 4.8=1041
31. 4.9=1075 4.7=1003 5.0=1114
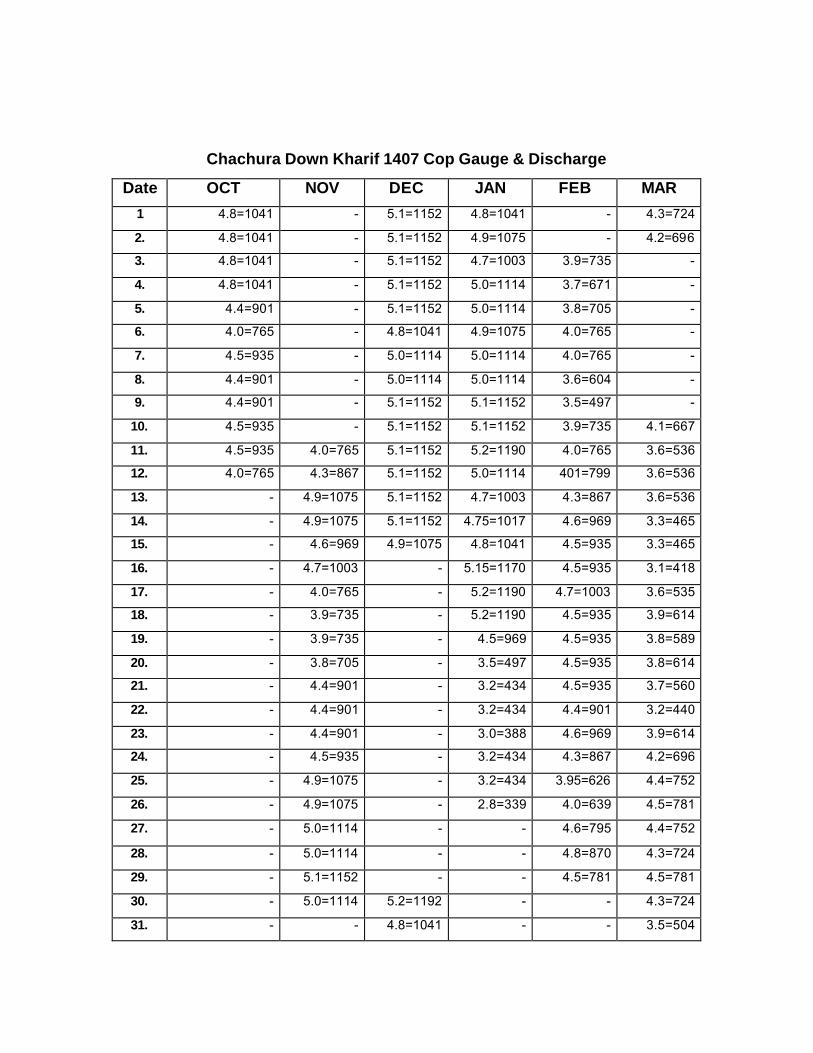
Chachura Down Kharif 1407 Cop Gauge & Discharge
Date OCT NOV DEC JAN FEB MAR
1 4.8=1041 - 5.1=1152 4.8=1041 - 4.3=724
2. 4.8=1041 - 5.1=1152 4.9=1075 - 4.2=696
3. 4.8=1041 - 5.1=1152 4.7=1003 3.9=735 -
4. 4.8=1041 - 5.1=1152 5.0=1114 3.7=671 -
5. 4.4=901 - 5.1=1152 5.0=1114 3.8=705 -
6. 4.0=765 - 4.8=1041 4.9=1075 4.0=765 -
7. 4.5=935 - 5.0=1114 5.0=1114 4.0=765 -
8. 4.4=901 - 5.0=1114 5.0=1114 3.6=604 -
9. 4.4=901 - 5.1=1152 5.1=1152 3.5=497 -
10. 4.5=935 - 5.1=1152 5.1=1152 3.9=735 4.1=667
11. 4.5=935 4.0=765 5.1=1152 5.2=1190 4.0=765 3.6=536
12. 4.0=765 4.3=867 5.1=1152 5.0=1114 401=799 3.6=536
13. - 4.9=1075 5.1=1152 4.7=1003 4.3=867 3.6=536
14. - 4.9=1075 5.1=1152 4.75=1017 4.6=969 3.3=465
15. - 4.6=969 4.9=1075 4.8=1041 4.5=935 3.3=465
16. - 4.7=1003 - 5.15=1170 4.5=935 3.1=418
17. - 4.0=765 - 5.2=1190 4.7=1003 3.6=535
18. - 3.9=735 - 5.2=1190 4.5=935 3.9=614
19. - 3.9=735 - 4.5=969 4.5=935 3.8=589
20. - 3.8=705 - 3.5=497 4.5=935 3.8=614
21. - 4.4=901 - 3.2=434 4.5=935 3.7=560
22. - 4.4=901 - 3.2=434 4.4=901 3.2=440
23. - 4.4=901 - 3.0=388 4.6=969 3.9=614
24. - 4.5=935 - 3.2=434 4.3=867 4.2=696
25. - 4.9=1075 - 3.2=434 3.95=626 4.4=752
26. - 4.9=1075 - 2.8=339 4.0=639 4.5=781
27. - 5.0=1114 - - 4.6=795 4.4=752
28. - 5.0=1114 - - 4.8=870 4.3=724
29. - 5.1=1152 - - 4.5=781 4.5=781
30. - 5.0=1114 5.2=1192 - - 4.3=724
31. - - 4.8=1041 - - 3.5=504
C:\website\atulbackup\docfiles\SER\2aprjob_ganga canal UPharyana\CD-UGC FINAL\annex-4.10.doc 1
Annex. 4.10
CROPPING PATTERN PROPOSED % CCA
Zone
SC WHEAT OR PADDY O/C
1 2 3 4 5 6 I Sugar Cane 50
31 14 25 18
II Partial Sugarcane Zone
25
41 14 25 23
III Non-Sugarcane zone
5
41 14 25-30 23
Overall 17 40 14 26
22
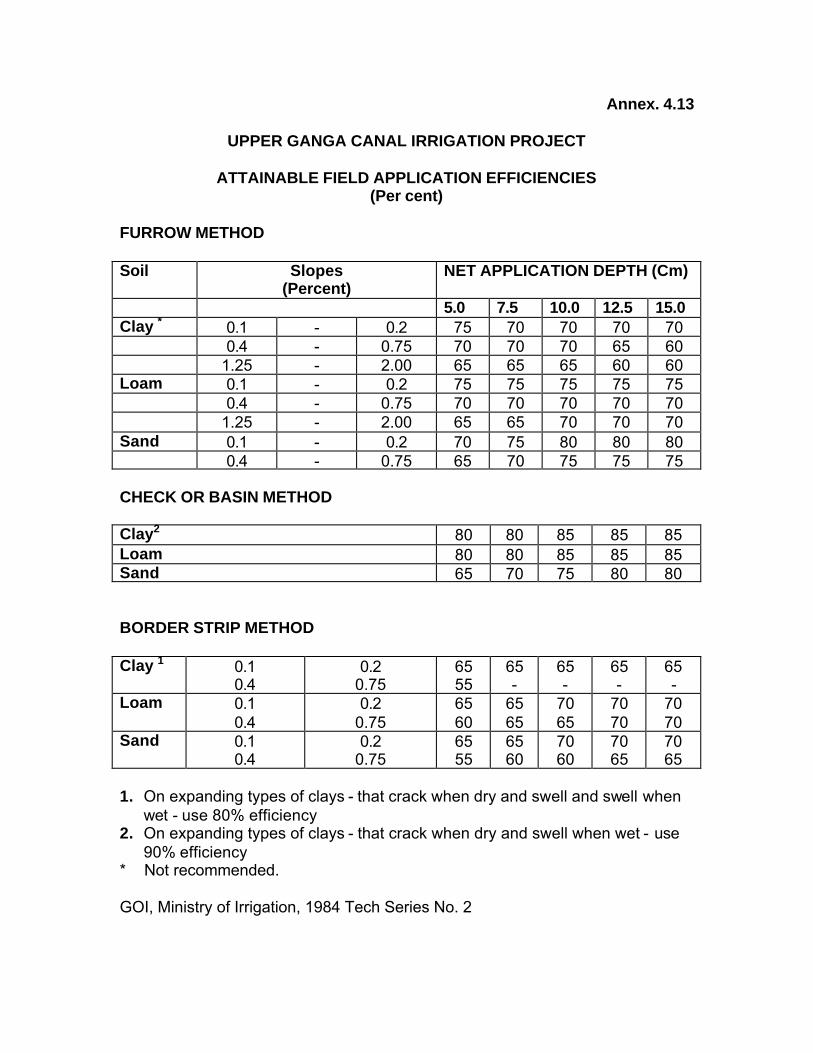
Annex. 4.13
UPPER GANGA CANAL IRRIGATION PROJECT
ATTAINABLE FIELD APPLICATION EFFICIENCIES (Per cent)
FURROW METHOD Soil Slopes
(Percent) NET APPLICATION DEPTH (Cm)
5.0 7.5 10.0 12.5 15.0 Clay * 0.1 - 0.2 75 70 70 70 70 0.4 - 0.75 70 70 70 65 60 1.25 - 2.00 65 65 65 60 60 Loam 0.1 - 0.2 75 75 75 75 75 0.4 - 0.75 70 70 70 70 70 1.25 - 2.00 65 65 70 70 70 Sand 0.1 - 0.2 70 75 80 80 80 0.4 - 0.75 65 70 75 75 75 CHECK OR BASIN METHOD Clay2 80 80 85 85 85 Loam 80 80 85 85 85 Sand 65 70 75 80 80 BORDER STRIP METHOD Clay 1 0.1
0.4 0.2
0.75 65 55
65 -
65 -
65 -
65 -
Loam 0.1 0.4
0.2 0.75
65 60
65 65
70 65
70 70
70 70
Sand 0.1 0.4
0.2 0.75
65 55
65 60
70 60
70 65
70 65
1. On expanding types of clays - that crack when dry and swell and swell when
wet - use 80% efficiency 2. On expanding types of clays - that crack when dry and swell when wet - use
90% efficiency * Not recommended. GOI, Ministry of Irrigation, 1984 Tech Series No. 2

C:\website\atulbackup\docfiles\SER\2aprjob_ganga canal UPharyana\CD-UGC FINAL\annex-4.14.doc 1
Annex. 4.14
Weighted Average ETo for the I Agroclimatic Zones
and Weighted Average Rainfall for the 3 Agroclimatic Zones
(in mm) Month Fortnight Sugarcane Partial Sugarcane Non Sugarcane
ETo Rainfall ETo Rainfall ETo Rainfall
Jan. I II
35 38
9 12
40 45
6 8
38 42
5 6
Feb. I II
41 52
11 10
47 58
8 8
46 57
6 5
Mar. I II
67 87
8 6
74 94
6 5
73 90
5 3
Apr. I II
94 109
3 3
98 112
3 3
95 108
3 3
May I II
119 129
5 8
124 130
5 8
119 127
3 5
June I II
122 111
26 47
130 117
17 30
128 119
14 27
Jul. I II
96 85
94 131
101 86
70 108
106 92
67 103
Aug. I II
80 75
116 95
77 74
119 103
80 75
103 89
Sep. I II
76 73
78 44
82 81
73 41
80 79
69 40
Oct. I II
73 61
12 6
80 67
13 7
81 68
14 7
Nov. I II
49 39
2 2
52 43
2 2
53 42
1 1
Dec. I II
36 34
3 5
39 37
3 4
38 36
2 3
Total 1776 736 1888 652 1872 584