Embed Size (px)
Citation preview
Chapter 4
Advanced Vehicles -- Technical Potential and Costs
This chapter discusses the potential for advanced light-duty vehicles that are capable of veryhigh levels of fuel efficiency and excellent emissions performance, to be introduced during thenext 10 to 20 years. The focus of this analysis is on mass-market vehicles (e.g., those produced involumes of over 100,000 per year) because major reductions in U.S. oil use and vehicle emissionscan be achieved only by drastically improving this class of vehicles.
As discussed below, the Office of Technology Assessment (OTA) chose to focus on “fillservice” advanced vehicles that have comparable performance to conventional vehicles, ratherthan limited service or specialty vehicles that might be suitable for certain market niches (e.g.,delivery vans, city-only commuter vehicles). The only exception to this is OTA’s consideration ofbattery electric vehicles (EVs), which are certain to have a more limited range than conventionalcars, at least for the next 10 to 15 years. Even in the EV case, however, the vehicles are requiredto have peak power (for acceleration) and continuous power (for grade climbing or other long-term, high-load conditions) comparable to conventional vehicles.
This comparable performance requirement implies larger electric motors and energy storagedevices than are assumed in some other analyses, and may explain, at least in part, why OTA’sprice estimates are higher than those made by some other sources. By relaxing the powerrequirements, which are somewhat arbitrary, significant cost reductions can be achieved, makingthe “advanced” vehicles more price-competitive with conventional vehicles.
OTA’s Methodology
OTA and its contractors gathered data for its analysis from several sources:
a wide-ranging review of the literature, including papers given at recent conferences on automotivetechnology;
a series of detailed interviews with the research -and technical staffs of eleven auto manufacturers; l
interviews with a range of manufacturers and researchers of advanced technologies; and
published data on the fuel economy performance of existing commercial vehicles.
1In Europe, interviews were conducted with VW, BMW, Mercedes-Benz and Porsche. In Japan, interviews were conducted with Honda, Nissan,
Toyota and Mitsubishi, and with selected research laboratories and supplier industries. Interviews were also held with General Motors, Ford, and
Chrysler in the United States.
1 5 2

To evaluate the performance and costs of advanced vehicles, OTA conducted a series ofcalculations based on physical principles and cost accounting methods. The performancecalculations are explained in more detail in appendix A. Briefly, most vehicle fuel economycalculations follow the work of GM Research Laboratory scientists Sovran and Bohn,2 whoderived an equation for vehicle fuel consumption over the Environmental Protection Agency(EPA) test cycle. Fuel economy calculations for so-called parallel hybrids--vehicles that have twoseparate power sources driving the wheels--require more sophisticated computation, and OTA’sestimates for these vehicles are rougher approximations than those of the others.
OTA’s cost calculations derive a “retail price effect” (RPE) of new technologies--the change inretail price that would occur if a new technology is substituted for a baseline technology whendesigning a new vehicle--based on tracking variable and fixed costs from component supplier tovehicle assembler to sales outlet. This methodology uses an approach followed by industry andregulatory agencies. A primary assumption in the analysis is that the industry is competitiveenough that manufacturers earn only the normal returns on capita13--that is, they are not able tocharge a premium because no one else has the technology. The estimated RPE may notcorrespond to a particular model because companies sometimes subsidize one model or size classwith another; however, the RPEs should be good reflections of the industry average.
Types of Vehicles Examined
The discussion first establishes a baseline--vehicles believed to be representative of the mass-market fleets in 2005 and 2015 without shifts in energy policy, large changes in oil prices, ormajor technical breakthroughs. As will be seen, these vehicles are projected to be both moreefficient than today’s and superior in safety, acceleration performance, and other characteristicsimportant to consumers. The projected improvements are based on an evaluation that they makemarket sense under an assumption of oil prices rising at a moderate pace, either because fuelsavings are sufficiently high (at sufficiently low cost for the improvements) to attract consumers,or because the improvements add value to the vehicles in terms of performance and othercustomer attributes.
Four kinds of advanced vehicles are then discussed that might have the technical potential toenter the marketplace in this time frame, if very strong research and development efforts werepursued:
● Advanced conventional vehicles. These vehicles have conventional drivetrains--internal combustionengines (ICES) and transmissions--but each part of the vehicle is substantially improved from today’sand is superior to what otherwise would be expected in this time frame.
2G. Sovran and M.S. Bohn, "Formulae for the Tractive Energy Requirements of Vehicles Driving the EPA Schedule," SAE paper 810184,
February 1981.3These returns reflect the oligopolistic nature of the auto industry, and are somewhat higher than they would be if the industry were perfectly
competitive.
153
●
●
●
Electric Vehicles. These are vehicles that rely on stored electrical energy (in batteries or, conceivably, ina flywheel) as their sole energy source. Electric motors drive the wheels.
Hybrid Vehicles. Hybrids are vehicles that combine two energy sources in a single vehicle. Forexample, an ICE may be paired with a battery or flywheel. In a series hybrid, both energy sources areused to power one or more electric motors driving the wheels--the engine is connected to a generatorwhose output power can be fed into the battery and, in some configurations, directly to the motor aswell. In a parallel hybrid, both the engine and electric motor(s) can directly drive the wheels.
Fuel Cell Vehicles. These are vehicles powered by an electrochemical device called a fuel cell, whichconverts a replaceable fuel directly into electricity without combustion. Although considered separately,they are a type of electric vehicle, and they are also likely to be hybrids.
Four classes of vehicles--subcompact cars, mid-size cars, compact vans, and full size, orstandard pickups--are modeled to capture the effect of size and fictional variations. Thesemarket classes were chosen as they represent the two most popular classes of cars and lighttrucks, respectively. Even with this size specification, however, manufacturers have the option ofvarying body rigidity, interior volume (within limits), safety and luxury options, and accelerationperformance. In the last decade, all of these have increased significantly for almost every marketclass of car and light truck. For this analysis, the median 1995 characteristics of vehicles in each ofthe four segments are used as a reference, and these vehicles’ attributes are held constant to defineone maximum technology scenario. Other scenarios such as changed performance and increasedbody rigidity are discussed only qualitatively.
We have set performance requirements as follows: Continuous power demand (i.e., poweroutput that must be sustained indefinitely) is set to a level that enables the vehicle to climb a 6percent grade at 60 mph with a modest payload, which equates to about 30 kW (40 hp) per ton.Of course, such a long grade is encountered rarely, but this requirement is to cover numerous ofother situations where the vehicle is fully loaded with five passengers and luggage, such as 55mph climb up a 3 or 4 percent grade. Peak power demand is based on a O to 60 mph accelerationtime under 11 seconds, with a nominal load. This equates to about 60 kW (8O hp)/ton for anormal gasoline drivetrain, but about 50 kW (67 hp)/ton for an electric drive because of anelectric motor’s excellent torque characteristics. We have required that peak power be sustainedfor over one minute, to cover situations where two highway “merge” cycles are required back-to-back, or the vehicle must climb a steep highway entrance ramp (for an elevated highway) and thenhave enough power to merge into 70 mph traffic. Hence, the 60 kW/ton and 30 kW/ton powerrequirements are to cover a wide variety of traffic conditions under full load, not just the examplecases cited above, and most ICE-powered vehicles meet these performance levels.
Vehicle Attributes
This report focuses on vehicles that might essentially replace the conventional ICE-poweredvehicles of our current light-duty fleet. There is some controversy about how well replacementvehicles must perform to be viable candidates in a competitive market. Some analysts claim thatconsumers are unlikely to accept vehicles that have important limitations in performance and
1 5 4
range; others claim that consumers will accept limitations once they examine and betterunderstand their actual travel patterns and requirements.
With the possible exception of electric vehicles, there are some configurations of each of thevehicle types examined that appear to have the potential to match or exceed the generalperformance characteristics of both current vehicles and the baseline vehicles that, if OTA’sprojections are correct, will form “the competition” in future years. OTA has chosen to focus onthese “competitive” configurations of the vehicle types in this report, but the reader shouldrecognize that other configurations that might underperform the baseline vehicles might haveother advantages, particularly in cost. For example, the discussion of EVs concludes that designswith reduced range and performance can be built at prices that are considerably more competitive(in first cost) with conventional vehicles than are the more robust vehicles examined in detail.
The vehicles examined here are required to satisfy performance requirements for range,gradeability (ability to climb hills) and acceleration performance; these requirements determinesuch parameters as battery size and motor horsepower. Owners judge the value of their vehiclesby a variety of characteristics, however, and these should be understood by those seeking toevaluate the competitiveness of new designs. For example, the vehicles adopted by the PNGV astargets--the Taurus, Lumina, and Concorde--as well as most other modem cars and light-dutytrucks, are extremely versatile vehicles with robust performance. Although most of their use is forlightly loaded, short-distance travel (average auto occupancy is 1.4 occupants per car, averagetrip length is 9 miles4), they are also extremely competent as long-distance haulers--filly loadedwith passengers and luggage.
There is substantial market evidence that this versatility is highly valued by vehicle buyers.Automakers have found themselves forced by consumer complaints and poor sales to upgradeperformance on new models and have consistently found purchasers upgrading to more powerfulengines although base engines appear adequate to handle most vehicle tasks. It appears thatpurchasers are selecting vehicle size and performance capability based on the most demanding 5percent of their trips rather than the most common 95 percent--for example, the once or twiceyearly family vacation rather than the daily commute or after-school carpool. If this purchasingbehavior remains the norm, it will have a substantial influence on the types of technologiesintroduced into the marketplace and the designs of the vehicles that carry them.
This type of purchasing behavior cannot be assumed to be irreversible, of course. Consumersurveys performed by the University of California at Davis and others have found that potentialvehicle purchasers who became more knowledgeable about their actual driving patterns oftenreport they would be willing to purchase limited-capability vehicles (e.g., electrics) if cost weresimilar. Some researchers, however, contend that “stated preference” surveys of this type, wherethose being surveyed are reporting only their hypothetical behavior, are inherently unreliable andtend to overstate the likelihood of limited-capability vehicles being sold.
4P.S. Hu and J. Young, Summary of Travel Trends: 1990 Nationwide Personal Transportation Survey, FHWA-PL-92-027 (Washington, DC:Federal Highway Adminstration, March 1992).
155
OTA remains uncertain about the prospects for a large shift in consumer preferences towardvehicles with limited range or other performance limitations. Where possible, however, itsanalyses focus on vehicle designs that can match conventional ICE vehicles in overallperformance. For example, as discussed below, there are virtually limitless variations on potentialconfigurations for hybrid vehicles, but this report focuses on those hybrids with the fewestperformance limitations.
Technologies Introduced Individually or in Combination
The vehicles examined here are maximum technology vehicles; that is, they combine a widerange of new advanced technologies in one vehicle. This is distinctly not in the mold of historicvehicle innovation, which has tended to be more incremental in nature. Generally, newtechnologies have been introduced singly, in limited-edition (often luxury) vehicles to test theirreadiness for the mass market in a way that limits risks to the automaker. Only after a few years ofsuch “testing” are new technologies moved into the heart of an automaker’s fleet. Thus, if thefuture is like the past, the vehicles examined here may be unrealistic in their capability to modelreal world events. The existence of the Partnership for a New Generation of Vehicles (PNGV),however, which is attempting to develop such a maximum technology vehicle, the technology-forcing nature of California’s zero emission vehicle (ZEV) mandates, and the potential for futurefuel economy regulations may make such vehicles more likely in the future.
Uncertainty in Technology Forecasting
There is now considerable literature evaluating the prospects for substantial advances inautomotive technology. Unfortunately, a reading of this literature leaves the reader with a wide--and confusing--range of views about the likely timing, cost, and performance of advanced vehiclesand vehicle technologies.
It is useful for the reader to recognize that the history of technology forecasting, andforecasting in the automotive arena, is rife with failure, particularly when forecasts are aimed attechnologies that are clear departures from those in use at the time of the forecast. Manytechnologies that were forecast to be commercialized and to have made extensive inroads inmarket share have dropped from the menu of technology options by the target date of theprojection. Others have been added to the menu despite widespread pessimism about theirchances for commercialization or intensive penetration into the fleet. Reasons for incorrecttechnology forecasts include:
● the possibility that the market rejected the technology because of its expense or perceived disadvantages(high rates of failure, adverse effect on noise or ride quality, and so forth), and/or market preferencesmay have changed after the forecast was made;
● other technologies that are lower cost or have lower operating expenses may do a better job;
1 5 6
●
●
●
●
the technical “context” that made the technology attractive or unattractive--the prevalent fuel or thenature of the technologies affecting or affected by the technology--may change;
new regulations (for example, emission standards not easily complied with by the technology) can eitherhinder or enhance technology introduction;
manufacturing the technology in large quantities can turn out to be more difficult and expensive thanwas expected, or improvements in manufacturing can do the reverse;
problems may occur in the “real world” operating environment that are difficult to overcome (someautomotive technologies fail because they require levels of maintenance that are difficult to get U.S. carowners to comply with, or because driving patterns place more severe strains on performance than wereoriginally forecast by test results).
Moreover, when technologies enter the marketplace, their effect on vehicle performance may beconsiderably different from projected levels because of unforeseen changes in measuredperformance as the technology moves from the laboratory bench to prototype to productionmodel. These changes may come from physical scaling effects that were not widely understood atthe time of the forecast; from the need to change design to deal with an emerging problem; oreven from design changes that deliberately trade off one performance characteristic againstanother (for example, sacrificing efficiency to achieve lower cost, or vice versa).
Forecasts also may go astray because of incorrect methodology--for example, not accountingfor costs such as dealer markups and transportation costs (or not accounting for cost savings)--orsimply by the acceptance of exaggerated claims (positive or negative) from sources with afinancial or ideological stake in the technology or one of its competitors.
Considering the limitations of technology forecasting, OTA’s forecast is meant to serve alimited purpose:
●
●
●
to gain a rough estimate of the magnitude of fuel economy improvement potential over the next 20 years;
to identify future policy challenges associated with advanced vehicles, such as potential for higher costs,difficult market challenges, potential safety problems; and
to provide assistance in evaluating existing and proposed vehicle research programs.
ENERGY USE AND REDUCTION IN LIGHT-DUTY VEHICLES
Vehicles use energy primarily to produce power at the wheels to overcome three tractive forcesthat would otherwise prevent the vehicle from moving: aerodynamic drag forces, the force of airfiction on the body surfaces of the vehicle; rolling resistance, the resistive forces between thetires and the road; and inertial force, the resistance of any mass tovehicle is climbing a grade, its mass exerts a downward restrainingmust produce energy to power accessories such as heating fan, air
1 5 7
acceleration. Moreover, if theforce. In addition, the vehicleconditioner, lights, radio, and
power steering. And, unless the engine is turned off, during idle and braking the engine energy islargely wasted because it is not being used to provide motive force.
To produce usable energy, the vehicle must take fuel energy and translate it to shaft powerthrough the engine; most of this power is then directed through the remainder of the vehicle’sdrivetrain to drive the wheels. Generally, this is a relatively inefficient process. Energy is lostbecause moving parts in the engine create friction; because air and fuel must be pumped throughthe engine, causing aerodynamic and fluid drag losses; because much of the heat generated bycombustion cannot be used for work and is wasted; and because slippage in the transmissioncauses losses. As discussed later, a conventional vehicle drivetrain generally will be able totransform about 14 (city) to 23 (highway) percent of the fuel energy into usable power at thewheels.5
In an attempt to reduce vehicle fuel consumption, vehicle designers can work to reduce all ofthe forces acting on the vehicle (the tractive forces), as well as the losses in turning fuel intomotive power. Tractive forces may be reduced by smoothing out body surfaces to reduceaerodynamic drag, by redesigning tires to reduce their rolling resistance, or by making the vehiclelighter, through use of lighter materials and redesign of the vehicle structure and interior, toreduce inertia forces as well as to further reduce rolling resistance. Accessory losses may bereduced by improving the design of air conditioners, water and oil pumps, power steering, andother power equipment, or by reducing the work these accessories must do (for example, heatingand cooling loads can be reduced by providing insulation and coating window surfaces withcoatings that reflect unwanted solar radiation). Drivetrain losses may be reduced through variousstrategies--ranging from redesign of conventional engines and transmissions to shifting toalternative types of drivetrains that may offer increased efficiency.
Fuel consumption may also be reduced by sacrificing consumer amenities--reducing the size ofthe passenger compartment (and, consequently, the size and weight of the vehicle), using a lesspoweful engine that cannot provide the same acceleration (and that may cause greater noise andvibration), designing transmission shifts that achieve higher efficiency at the cost of moreharshness, reducing the number of accessories such as air conditioning or power locks andwindows, and so forth. Most modem attempts to reduce fuel consumption do not contemplatesacrificing these amenities,6 but some types of vehicle redesigns may achieve higher efficiencyonly at the cost of such a sacrifice.7 As discussed later, comparisons of vehicle fuel economyachievements should carefully consider of any differences in vehicle performance or amenities.
To obtain an idea of target areas for saving fuel the following are a few quantitative indicatorsfor a typical mid-size car that gets 27.7 mpg on the EPA test cycle (22.7 mpg city; 38.0 mpg,highway):
5Counting the energy not used for power during the time the vehicle is idling and braking.6For example, the Partnership for a New Generation of Vehicles has as a key goal the development of an 80 mpg vehicle that essentially matches
the7
performance of the current class of intermediate autos.With vehicles that rely on batteries or chemical fuels with low energy densities for energy storage, designers may have to sacrifice range to
maintain efficiency.
1 5 8
The engine efficiency--the fraction of fuel energy that emerges as shaft horsepower--is about 22 percenton the city part of the test and 27 percent on the highway, 24 percent composite. Strategies that increaseengine efficiency, by changing the engine type, improving its design and components, or helping it tooperate at its most efficient points attack the three quarters of fuel energy lost in the engines Raisingengine efficiency from 24 to 25 percent would reduce fuel consumption by 4 percent.
Of the energy that is converted by the engine to actual shaft horsepower:
* 16 percent (city), 2 percent (highway), 11 percent (composite) is lost because it cannot be used
when the vehicle is braking or idling. Systems that turn the engine off during braking and idle(engine off or electric drivetrains), or store the energy produced (hybrid systems can do this), canrecover much of this 11 percent;
* 10 percent (city), 7 percent (highway), 9 percent (composite) is lost by transmission inefficiencies.This is the target for improved transmissions or, for electric vehicles, avoiding the need for atransmission;
* 11 percent (city), 7 percent (highway), 9 to 10 percent (composite) is used to power theaccessories. Aside from conventional strategies to improve accessory efficiency or to reduceheating and cooling loads, electric vehicles have a different mix of accessories--some differenceshelp (no oil pump), and some hurt (may need a heat pump to generate cabin heat);
* 63 percent (city), 84 percent (highway), 71 percent (composite) is actually used to overcome thetractive forces on the vehicle.
The three tractive forces play different roles at different speeds:
*
*
*
rolling resistance accounts for 28 percent of total tractive forces in the city, and 35 percent on thehighway, 31 percent composite. Both improvement to tires and weight reduction work to reducethis large fiction of tractive forces;
aerodynamic drag accounts for 18 percent (city) and 50 percent (highway), 30 percent composite;and
inertia (weight) force accounts for 54 percent (city) and 14 percent (highway), 40 percentcomposite. Weight reduction directly attacks this force, or some of the energy used to overcome itcan be recovered by regenerative braking.
BASELINE
The analytical model used to forecast baseline fuel economy is the Fuel Economy Model(FEM), used by the Department of Energy (DOE) Energy Information Administration as one ofthe submodels in the National Energy Modeling System (NEMS). The fuel economy is forecast asa function of input fuel prices, personal income and Corporate Average Fuel Economy (CAFE)standards, and its methodology is summarized in appendix A. The FEM incorporates both
technological and econometric models to estimate technological improvements by size class andperformance and size class mix choices by consumers.
Under OTA’s assumptions about future gasoline prices and economic growth--prices increasingto $1.55/gallon by 2015, from $1.15/gallon in 1994, in constant (1994) dollars 9 (growth rate ofabout 1.5 percent per year), personal income growing at 0.9 percent per year--the model projectsa fuel economy of 34.0 mpg for domestic cars and 24.9 mpg for domestic light trucks in2015, which is a 24 percent increase relative to 1995. These increases are expected to beattained even in the absence of new fuel economy standards or other measures aimed at increasingautomotive efficiency. Details on the four vehicle classes are provided below.
In general, a number of new technologies are expected to be gradually introduced into the fleetduring the 1995 to 2015 period, simply because the technologies are relatively cost-effective, andfor competitive reasons. For example, high-strength, low-alloy steel optimized structures shouldbe used widely by 2005, while plastic parts (mostly non-load bearing) will be widespread by 2015.Drag reduction to CD levels of 0.28 will be commonplace for cars by 2015 and a significantfraction will be at CD levels of 0.25. Four-valve engines will almost completely replace two-valveengines in cars by 2005, and in light trucks by 2015. Variable valve timing of both the “two stage”type and fully variable type will be widespread. Major technological changes to the four classesconsidered for 2005 and 2015 are summarized in table 4-1.
The general trends in technology adoption are quite similar across classes, although thecompact van and pickup truck classes lag the two-car classes technologically. This is based on thehistorical fact that introduction of new technologies into the light-duty truck (LDT) fleet hastypically lagged by five to seven years behind their introduction in Cars. l0 Table 4-2 has the fueleconomy forecast for each class along with vehicle weight and horsepower. Fuel economy of thecars is expected to increase by about 24 percent between 1995 and 2015, while the light-truckfuel economy increase is a little less than 20 percent.
These overall fuel economy increases hide the fact that technologies contribute about 10percent additional fuel economy that is lost to changes in other vehicle attributes. Safetystandards and customers’ choices of safety equipment such as antilock brakes and traction controlwill add 60 to 80 lbs per vehicle, affecting subcompacts disproportionately in weight. Thesesafety improvements are expected to cause a 1.5 to 2 percent decrease in fuel economy. Theforecast also assumes that federal Tier II standards will essentially equal low emission vehicle(LEV) standards and be in place by 2005. Unless there are significant improvements intechnology, LEV standards will cause about a 2 percent fuel economy penalty. Consumerdemand for size, luxury, and performance will increase both weight and horsepower of thevehicle. In the OTA baseline, increases to body rigidity and size within each market class willcontribute to a 6 percent increase in weight (over what it would be otherwise), and a 4percent decrease in fuel economy. Finally, the model predicts that, if fuel prices rise asprojected, performance increases will likely be restrained and lead to only a small 2 percentreduction in fuel economy.
9Based on U.S. Department of Energy, Energy Information Administration, Annual Energy Outlook, 1994 (Washington, DC: February 1994),
baseline case.1 0Energy and Environmental Analysis, Inc., “The Fuel Economy Model: Documentation Report to EIA,” October 1993.
160
The projections of fuel economy changes are quite sensitive to assumptions about futuregasoline prices. If fuel prices were twice the base-case levels, to $3.10 per gallon in 2015,fleet fuel economy climbs to 39.0 mpg for cars and 28.5 mpg for light trucks, although one-third of the difference in fuel economy over the base case is attributable to changes in sales mix. Ineffect, of the 6 mpg difference for cars between the base case and the high fuel price scenario,about 2 mpg is attributable to consumers switching to smaller cars. The differences between thetwo scenarios are much smaller in 2005 owing to the reluctance of automakers to acceleratemodel life cycles (which would cut profits) and limits on the rate that new technology can beintroduced.
Table 4-3 shows the approximate changes in drivetrain efficiency, weight, forces on the vehicle,and fuel economy of a “best-in-class” mid-size car in 2015. This car is projected to attain a 25percent reduction in fuel consumption, or a 33 percent increase in fuel economy, which is about 9percent better than the average increase for the fleet.
The changes relative to current 1995 cars and light trucks are easier to understand in aqualitative form. The vehicles in each size class will be somewhat roomier, and their bodies will bestronger and more rigid. Along with other safety improvements such as dual air bags, side impactrestraints, roof crush strength improvements, antilock braking system, and traction control, theseimprovements imply that the vehicles will be much safer than today’s vehicle, if driven in similarconditions. Engines will be much smaller in displacement (by 20 to 30 percent), and most of thesecars will feature variable valve timing, although only about 35 to 40 percent of light trucks willhave this technology. However, the smaller engines will produce nearly equal torque and 20percent more power (at high rpm) relative to today’s engines, so that maximum performance willbe actually enhanced, with some loss in “elasticity,” or the ability to accelerate without shiftinggears. The use of five-speed automatic transmissions and even some continuously variabletransmissions should, however, make the loss almost invisible to most drivers. In other words, the2015 cars will be better in most respects such as roominess, safety, performance, and fueleconomy relative to current cars, and their emissions will meet the California-mandatedLEV standards. Hence, the cost increases need not be justified on the basis of fuel savings alone,but also on the basis of perceived and real quality improvements.
ADVANCED CONVENTIONAL VEHICLES
The baseline projection suggests that considerable technological improvements will occur in allcars even in the absence of any intervention in market forces. This section characterizes themaximum potential of conventional technology in 2005 and 2015, using the technology benefitsdescribed in the sections on individual technologies.
Attaining these high levels of technology would require some form of intervention in themarket to become a reality. In this context, we have constructed two scenarios for each date,one using the mean or manufacturers’ average estimate (designated as “m”) of technology benefit,and the second using the most optimistic benefit estimates (designated “o”) obtained from theauto manufacturers (virtually all of the data on conventional technologies was obtained from automanufacturers).
161
—
.,.
Many of the available advanced technologies are relatively cost-effective, and design andtechnology changes to reduce aerodynamic drag, tire rolling resistance, engine friction, andtransmission loss are expected to be adopted even in the baseline scenario, although thereductions are not as large as those postulated in this maximum scenario. Other technologies suchas four-valves/cylinder, variable valve timing, advanced fuel injection, and variable-tuned intakemanifolds are likely to be adopted for reasons of performance, drivability, and low emissionspotential, although the market penetrations of these technologies are expected to grow slowlyover the next two decades. This section examines the fuel economy potential of a hypothetical“best-in-class” car, if all technologies that are fully developed and available forcommercialization are adopted in such a way as to maximize fuel economy, while keepinginterior volume and performance constant at 1995 levels.
Because this analysis is not based on costs, cost-effectiveness, or on vehicle life-cycleconsiderations, the best-in-class vehicle in all four market classes uses the same set oftechnologies with only a few exceptions (as discussed below). Hence, focusing in on one marketclass and describing the changes in detail provides a comprehensive picture of the changes to allclasses considered. The intermediate car class is selected for this description, and the mostpopular car in this class, the Ford Taurus, is the 1995 benchmark, or reference, vehicle. Thecurrent vehicle has an interior volume of 100 cu ft and trunk volume of 18 cu ft. It is powered byan overhead valve (OHV) two-valve V-6 that produces 140 horsepower, and has a peak torque of165 ft. lb @ 3,250 rpm. It uses a four-speed automatic transmission with lockup torque converter,an axle ratio of 3.37, and a relatively steep overdrive ratio of 0.67. The Taurus weighs 3,130 lbsand is tested at 3,500-lb inertia weight. Its composite fuel economy is 28.0 mpg, which is 1.5 to 2mpg higher than many other competitors in its class. Its performance is characterized by its O to60 mph time of about 10.4 seconds (based on car enthusiast magazine tests). The Taurus has aremarkably high ratio of highway to city fuel economy of about 1.69, probably as a result of itslow numerical overdrive ratio. This number is usually closer to 1.5 in most cars.
Table 4-4 traces the hypothetical evolution of a mid-size car equivalent to the Taurus under thetwo scenarios for 2005 and 2015. The greatest difference between the baseline and the advancedtechnology scenarios is in material substitution and the resultant weight. Four weight-reductionscenarios were considered for this analysis. The assumptions involved in each case are describedin more detail in box 4-1, along with the approximate material compositions of the vehicles. 11 The2005(m) vehicle is made of steel, but substantial weight has been removed by optimizing thedesign and using an aluminum engine. It weighs 15 percent less than the current Taurus. The2005(0) vehicle uses considerable aluminum in the body as well, but the design does not take fulladvantage of aluminum’s properties and achieves only a 20 percent weight reduction. For 2015,the (m) vehicle’s aluminum body is optimized and attains a 30 percent weight savings, whereas the(o) vehicle has a carbon fiber composite structure yielding a 40 percent weight reduction from thecurrent Taurus. The costs of these material changes range from modest ($200 to $400) for thesteel redesign and aluminum engine to high ($2,000 to $8,000) for the carbon fiber Taurus.
11 Energy and Environmental Analysis, Inc., “Domestic Manufacturers Light Duty Truck Fuel Economy Potential to 2005,” prepared for Martin
Marietta Energy Systems, January 1994.
1 6 2
In other respects, the 2005 scenario projections are relatively mundane. In 2005, the 3.0L V-6engine is expected to be replaced by a 2.3L, four-valve four-cylinder engine with variable valvetiming,l2 and the four-speed automatic transmission will be replaced with a five-speed automatic.There are no differences in the assumptions on the types of drivetrain technologies for 2005between the mean and optimistic scenarios, but the benefit for each technology is different,leading to different fuel economy estimates. In many respects, the 2005 hypothetical vehicle is nottechnologically very different from the baseline 2015 vehicle. The 2015 baseline vehicle, however,is expected to use a 2.5L V-6 and offer better performance and comfort than the 2005hypothetical vehicle, which explains the difference in fuel economy.
For 2015, the mean scenario includes the weight projections discussed above, and includes theuse of a direct injection stratified charge (DISC) engine with variable valve timing. This assumesof course, that lean nitrogen oxide (NOx) catalyst technology is perfected to meet a NOX standardof 0.2 g/mile. The reduced weight results in a small displacement engine, and the resultant fueleconomy estimate is 53.2 mpg. It is also possible that the direct injection diesel can meet thisstringent emission standard by 2015, and OTA has estimated its fuel economy at 59.0 mpg ondiesel fuel The high efficiency of the DISC engine essentially narrows the difference betweengasoline and diesel versions to almost identical levels on an energy content basis as diesel hasabout 12 percent more energy per gallon than gasoline. The optimistic 2015 scenario forecastsa hypothetical vehicle with a carbon fiber body and a small displacement DISC engine, andis estimated to attain 63.5 mpg.
Price differentials (over prices of the 1995 Taurus) of the vehicles are calculated using themethodologies described in appendix B, and are mid-range estimates. Uncertainties in incrementalprice are about ±10 percent for 2005 estimates and ±20 percent for the 2015 (m) estimates. The2015(0) price estimates are extremely uncertain owing to the wide variations in potential futureprice estimates for carbon fiber based body construction. These estimates do not include the costof emission control and safety related equipment (which do not vary across scenarios), with oneexception. For the 2015 cases, the incremental cost of the lean-NOX catalyst for the DISC anddiesel is included, because the conventional engines in the baseline will not require such a catalyst.
Improvements to other market classes (subcompact, van, pickup) are quite similar to those forthe hypothetical Taurus, allowing for some variation in baseline technology. For example, theabsolute drag coefficients for the compact van and pickup truck are different from those for cars,but the percentage reductions relative to the base are quite similar. The only major exception tothis similarity in technology improvements is for the pickup truck; owing to its greater weight,meeting a 0.2 g/mi NOX standard is considered very difficult and, hence, the DISC is adopted onlyin the “optimistic” scenario for 2015.
While estimates of intermediate car fuel economy of 53 to 65.5 mpg in 2015 may seemremarkably high, there currently are some highly fiel-efficient cars that rival this type ofperformance. For example, VW produces a 1.9L turbocharged direct injection (DI) diesel car
12Low speed performance is kept constant by controlling the variable: Torque x Axle Ratio / Weight to the baseline level, based on Torque at
2000 RPM, an engine speed typical of 30 mph in second gear or 45 mph in third gear. This leads to an axle ratio of 3.18, which would normally b e
very low for a 4-valve engine. However, in this ease. the VVT is optimized for low speed torque making the low axle ratio possible.
1 6 3
with a fuel efficiency of almost 55 mpg13 (European 1/3 mix cycle) on a car of weight similarto that estimated for the hypothetical Taurus in 2015. If the DISC engine turns out to be asefficient as the DI diesel (as is widely expected), the estimates of 53.2 and 59.0 mpg seem quitereasonable and possibly conservative. Costs and fuel economy for all four classes of vehiclesexamined in all scenarios are shown in table 4-5.
An important point to note is that these hypothetical maximum scenarios hold size,performance, and (implicitly) vehicle features constant over time--that is, the 2005 and 2015Taurus vehicles are identical in size, performance, and features to the 1995 Taurus. However,OTA expects size, performance, body rigidity, and other features to increase over time;consequently, except for their higher fuel economy, vehicles in these scenarios are less desirablethan the ones in the baseline. Changing the attributes of body rigidity, size, and performance tolevels equivalent to those defined under the “baseline” scenario will reduce fuel economy by 6 to 7percent from the values shown in table 4-5. In other words, the advanced 2015 Taurus wouldobtain a fuel economy of about 50 (DISC) to 55 (DI diesel) mpg, if its performance andother features matched the 2015 Taurus baseline.
The emissions of these advanced technology vehicles are expected to meet California LEVlevels. In 2005, the engine technology forecast is quite similar to the “baseline scenario”technology forecast for 2015, and smaller displacement engines with VVT on light-weight cars(relative to the baseline) actually have an advantage in meeting LEV standards. The 2015 scenarioassumes that DISC engines and the diesel can meet LEV standards through the use of a lean NOX
catalyst. Because direct injection engines, both diesel and gasoline, have lower cold start andacceleration enrichment related emissions than conventional gasoline engines, their overall impacton in-use emissions is expected to be positive.
ELECTRIC VEHICLES
EVs substitute a battery (or other device capable of storing electricity in some form) andelectric motor for the gas tank/ICE/transmission components of a conventional vehicle. Asdiscussed earlier, the key drawback of EVs has been the inability of batteries to store sufficientenergy to allow a large enough range capability.
Although batteries can store only a small fraction of the energy in the same weight and volumeof gasoline, EVs may gain back some of this disadvantage because of several efficiencyadvantages. First, conventional ICE vehicles use about 10.8 percent of their fuel during brakingand at idle when the engine contributes no useful work; electric motors need not work during EVbraking and idling. Second, most of the accessories used in an ICE-powered car, such as thewater pump, oil pump, cooling fan, and alternator can be eliminated if battery heat losses are nothigh, as motor and electronics cooling requirements do not require much power. In addition, thehydraulic power steering in a conventional vehicle must be replaced by electric power steering,which consumes only a fraction of the power of conventional systems.14 The reduction in
164
accessory use saves as much as 9.5 percent of fuel consumption on the EPA test cycle. (Realworld fuel efficiency and range are considered following the discussion of the EV’s efficiency onthe EPA test) And although the EV may need some power for the brakes, this requirement isprobably small owing to the use of regenerative braking, as described below.
Third, some of the energy lost during braking can be recovered by an EV, because the motorcan act as a generator when it absorbs power from the wheels. The energy can be stored in thebattery and later released to drive the motor. As noted earlier, the energy lost to the brakes in aconventional car is about 35 percent of total tractive energy. For various reasons--transmissionand generator losses, battery charge/discharge loss, requirement for some conventional brakingcapacity--the actual energy recovery is considerably less than this.15 Actual systems in the ToyotaEV16 and the Cocconi CRX,17 which have the best regenerative braking efficiencies reported,provide range increases of about 17 to 18 percent maximum. An 8 to 10 percent range extensionis more typical of current EVs, such as the BMW El.
Fourth, the motor is quite efficient in converting electrical energy to shaft energy, with cycleaverage efficiencies for good motors in the 75 to 80 percent range in the city cycle, as opposed togasoline engines, which have an efficiency of only 20 to 23 percent on the fuel economy testcycle.
There are several factors working in the opposite direction. Losses from the primary energysource to energy delivered to the vehicle--critical for concerns about greenhouse gas production--generally are much higher for EVs than for gasoline vehicles, because electricity generationefficiency is quite often low (about 34 percent for a conventional coal-fired powerplant), andelectricity generation may add another 10 percent in losses. Additional losses occur at the batterycharger, in losses in discharging the battery, and in battery internal self discharge, wherein thebattery (or flywheel, or ultracapacitor) gradually suffers losses over time. Another importantfactor is that EVs may be much heavier than an ICE-powered vehicle of similar performance (andhave lower range18), because battery size is critical to range and power--the added weight thencreates higher rolling resistance and higher inertia losses (of which only a portion are regainedfrom the regenerative braking).
Considering the fill range of energy losses, an EV may well be less efficient on a primaryenergy basis than a conventional vehicle of equal size and acceleration performance, especially if
15For the motor to convert braking energy to electricity, transmission loss and motor loss in generator mode must first be considered. Typically,
transmissions for electric motors are simple drive gears, and can be 95 to 96 percent efficient. Motors operated in reverse generator mode typically
have cycle average efficiency in the 80 to 84 percent range. Hence, only 78 percent of the braking energy can be converted to electricity, which isabout 27.0 percent of traction energy. The storage and retrieval of electricity in a battery causes further loss, but this is very dependent on the battery
type, and its efficiency in terms of absorbing power pulses. This efficiency is only 80 percent or lower for lead acid and nickel-cadmium batteries, sothat regenerative braking recaptures only 0.82 x 0.95 x 0.80 x 0.35, or 21.8, percent of tractive energy. This assumes that all of the braking can bedone regeneratively but this is not true in practice, since the motor is connected to only two wheels, leaving the other two wheels to be braked
conventionally (proper handling during hard braking requires that all four wheels be braked for stability). 16K. Kanamaru, "Toyota EV-50: An Effort To Realize Practical EVs,” paper presented at the 12th International Electric Vehicle Symposium
,December, 1994.
17A. Burke, Institute of Transportation Studies, University of California at Davis, “Dynamometer and Road Testing of Advanced E1ectric
Vehicle,” 1995.18Matching the range of a similarly sized ICE vehicle may well be impossible for an EV, because the ability to increase battery size is limited by
the effect of the added weight on motor and structural weight. Consequently, “fair” comparisons of EVs and ICE vehicles may try to match
acceleration performance, especially at low speeds, but rarely try to match range.
1 6 5
the ICE vehicle is particularly fuel efficient. One such primary energy comparison between aBMW El and VW Polo diesel,19 which are comparable in size, is shown in figure 4-1. In thiscomparison, the overall BMW El motor efficiency is very low, at 66 percent rather than 75 to 80percent; if this were changed to 80 percent, then the EV would have the same primary energyefficiency as the diesel car.
The BMW comparison also shows some real world effects of energy loss owing to batteryheating--the battery is a high-temperature Na-S battery--and includes accessory losses. Internalself discharge or battery heating losses reduce efficiency in inverse proportion to miles driven perday. Accessories such as the power steering and power brake consume a few hundred watts ofpower typically, but the air conditioner, heater, and window defrosters are major drains on power.Some EVs, such as the GM Impact, have replaced the conventional air-conditioner or heater witha heat pump which increases accessory load to 3 kW.20 A typical advanced EV will consumeabout 12 to 15 kW at 60 mph (see table 4-621), so that accessory load represents a substantialfraction of the total power demand of the vehicle. Thus, with these accessories on, highwayrange can be reduced 20 to 25 percent; range in city driving can be reduced 50 percent.
Cold or hot temperatures also impact the battery storage capacity, so that the range reductionsowing to accessory power loss are only one part of the picture. In very cold weather, alkalinebatteries and lead-acid batteries have significantly lower energy storage capacities, as discussedearlier. Peak power is also affected, so that both range and acceleration capability suffers. At20oF, the effect of accessory loads is also very high, as it is not unusual to need headlights, wipers,defroster, and passenger heating in such situations. The combined effect of reduced batterycapacity and higher loads can reduce the range in city driving by as much as 80 percent. In hotweather, the battery can be power limited owing to the difficulty of removing the heat createdwhen high power is demanded from the battery, and internal self discharge of batteries can also behigher. Unfortunately, hard data on battery losses in hot weather is not available publicly.
The analysis of overall vehicle weight, and the tradeoffs among range, performance, and batteryweight are especially important for an electric vehicle. Generally, adding more battery weightallows greater vehicle range and power. However, there is a limit to this relationship: as batteryweight increases, structural weight must also increase to carry the loads, and a larger--andheavier--motor is required to maintain performance. This weight spiral effect leads to rapidlydeclining benefits to each additional battery weight increment, and finally to zero benefit.
It is possible to examine these tradeoffs by using energy balance equations similar to those usedfor ICE engines, coupled with some simplifying assumptions about motor output requirements fornormal performance requirements (50 kW/ton of vehicle weight to allow normal levels ofacceleration and hill climbing), and using a “best-in-class” specific traction energy measured inkilowatt hours per ton-kilometer (kWh/ton-km), that is, assuming the vehicle being analyzedattains the energy efficiency of the best available EVs with regenerative braking, which is about0.1 kWh/ton-km.
19K. Scheurer et al., "The Electric Car: An Attractive Concept for City Traffic,” BMW Publications, 1993.20K. Scheurer, "The BMW E-1, A Purpose Designed EV,” paper presented at the 11th International EV Symposium, September 1992.21At 60 mph or 97 km/hr, an average fuel consumption of 0.15 kWh/km implies a power use of 97* 0.15 = 14.6 kW.
166
Figure 4-2 shows the relationship between battery weight and rangetimes the specific energy of the battery, battery weight gets impossiblyweight of the battery does not provide enough energy to increaseperformance.
What does this figure say about the relationship between battery
As range approaches sixlarge, because the addedrange while maintaining
weight and range for aparticular vehicle? If an EV were made by using a 1995 Taurus as a “glider,” with beefed-upstructure and suspension if necessary, obtaining a 90-mile range with an advanced semi-bipolar lead acid battery22 would require 1,600 lbs of battery, and the total weight of thecar would increase from the current 3,100 lbs to 5,240 lbs (in reality, useful range would beonly about 70 miles since lead acid batteries should be discharged only to 20 percent ofcapacity). 23 In contrast, a nickel-metal hydride (Ni-MH) battery, with an SE of 72 Wh/kg, of thesame weight will provide a range of more than 150 miles. The weight of nickel-metal hydridebattery to provide a 100-mile range is 957 pounds, while the car weight falls to 3,305 lbs,illustrating the importance of weight compounding effects in an EV.
The second constraint on the battery size is that it must be large enough to provide the peak-power requirement of the motor, or else some peak-power device such as an ultracapacitor orflywheel may be necessary. Using the same assumptions as before (about vehicle powerrequirements and energy efficiency): to obtain a range of 100 miles, the specific power capabilityof the battery divided by its specific energy must be at least 3.125 hr -1, or else the powerrequirement becomes the limiting factor on battery size. If the range requirement is doubled to200 miles, then the minimum ratio declines to 1.56 hr -1. For a 100-mile range, only the advancedsemi-bipolar lead-acid battery meets this requirement, with an SP/SE ratios of almost 5, while theNi-MH battery has a ratio of about 3. The existing “hot-battery” designs provide ratios of only1.25, while more recent advanced designs provide ratios closer to 2. The important point of thisdiscussion is that doubling the specific energy (e.g., by substituting a battery with betterenergy storage capability) does not automatically lead to half the battery size, if thebattery’s power capability is inadequate to provide “average performance.” Relaxing theperformance requirement reduces the required ratio, illustrating that hot batteries with goodspecific energy but low specific power are best applied to commercial vehicles, where range ismore important than performance. One alternative is to include peak-power devices such asultracapacitors with these batteries to provide adequate peak power.
In evaluating the characteristics of EVs in each of the four market classes, OTA made severalassumptions about EV production. We assumed that each EV make/model could be manufacturedon a “conversion” assembly line to produce 2,000 vehicles per month (24,000 per year), implyingtotal EV sales (across all models and manufacturers) of at least several hundred thousand vehiclesper year. This assumption is required to establish economies of scale, and the assumption thatEVs will be based on “gliders” (conventional vehicles stripped of their drivetrain and modified asnecessary) is required to establish that the vehicle body technology will be similar to the
22Assumed specific energy, SE,of 42 Wh/kg.23When battery weight equals body weight on the graph, the value of R/SE is 3.6. With an SE of 3.6, the semi-bipolar battery will obtain a range
of 150 km (42 x 3.6) or 90 miles when zero engine body weight (theoretical weight of the body with a weightless powertrain and secondary weightreductions accounted for) equals battery weight- For a current (1995) mid-size ear like the Taurus, the zero engine body weight is about 730 kg or
1600 lbs. Methodology to use these values is described in appendix A
1 6 7
technology of the baseline vehicles. Total investment in assembly line equipment, tooling,development, and launch is estimated at $60 million for this type of facility based on recent DOEstudies24 and is amortized over a four-year cycle. It should be noted, however, that total costs aredominated by battery costs, so that EV cost is not greatly affected by modest errors in the $60million estimate.
GM and BMW, among others, have displayed purpose designed EVs, which are vehiclesdesigned from the start to be electrically powered. It is unclear, however, how the design andengineering costs for such vehicles can ever be amortized over their likely low production rates,and GM officials have publicly stated that the $250 million invested in the Impact to date willnever be recouped.25 The advantage of purpose designed EVs is that design decisions about itemssuch as lightweight materials would tend to be different depending on whether the end result wasa gasoline-powered vehicle or an electrically powered one; EV designers would favor energyefficiency to a greater extent than gasoline vehicle designers. Building EVs from gliders based onOTA’s advanced vehicle designs eliminates these differences, however, as these designs also aregeared toward maximum energy efficiency.
Table 4-7 shows the battery and total vehicle weight, energy efficiency, and incremental priceof several EVs in each market class in 2005. In each case, the level of body technology and tiretechnology is identical to the level used in the advanced conventional vehicle scenarios, and pricesare calculated as an increment over the advanced conventional vehicle in the same scenario,consistent with the “glider” approach to manufacturing EVs. Note that the vehicles’ priceincrements over the business-as-usual vehicles (which may be the better comparison) wouldbe higher than the values given in the table.
In 2005, an EV powered by an advanced semi-bipolar lead-acid battery with an 80-mile rangeappears to be a viable though expensive prospect for the subcompact and intermediate car, butless viable for the compact van or a standard pickup truck. The EV version of the intermediatecar is about $11,000 more than the gasoline-powered car, which is consistent with theresults of some other studies.26 In going from gasoline to electricity, weight increases fromless than 1,300 kg (2,860 lbs) to over 2,030 kg (4,400 lbs). An EV pickup truck could weighover 6,400 lbs, rendering it an unrealistic proposition. Very significant weight reductions wouldoccur, if the battery used were a Ni-MH design and range restricted to about 100 miles.Incremental prices are almost twice that for the lead acid battery-powered EV if the Ni-MHbattery costs the expected $400 per kilowatt hour.27 However, if Ovonic’s claims for the Ni-MHbattery28 prove correct, the EVs powered by the Ni-MH battery at $200/kWh would be lower incost than those powered by the lead-acid battery (at $150/kWh) owing to the weightcompounding effects, and the incremental vehicle price would be about $8,800.
24Energy and Environmental Analysis, Inc., ‘Characteristics of Alternative Fuel Vehicles: Imputs to the AFVTM,” prepared for Martin Marietta,1995 .
25"Shocker at GM:: People Like the Impact,” Business Week, Jan. 23, 1995, p. 47.26 Sierra Research, "The Cost-Effectiveness of Further Regulating Mobile Source Emissions,” prepared for the American Automobile
Manufacturers Association, Febuary 1994.27Although this is nearly three times the lead acid battery's cost, there are some cost savings in the vehicle structure and motor because of the Ni-
MH battery’s lighter weight.28See the section on batteries in chapter 3.
1 6 8
Table 4-8 shows how the costs were calculated for the year 2005 mid-size EV. Battery andmotor/controller costs are as specified in chapter 3, while incremental costs of electric powersteering and heat pump air conditioner over conventional systems were derived from supplierquotes. 29 Those “costs” are the costs to an auto manufacturer buying the components at a salesvolume of 20,000 to 25,000 per year for this model, but there is an implicit assumption that totalbattery and motor sales across all models is over 100,000 units per year. Costs of engine,transmission and emission control systems are based on earlier studies by Energy andEnvironmental Analysis, Inc. for DOE, adjusted for inflation. Analysis of fixed costs is based onthe formula presented in appendix A. Note that learning curve effects are included in the costingof batteries, motors, and controllers, but there is no learning curve effect for assembly.
Computations for a range of 200 miles were performed with the Ni-MH and sodium sulfur(Na-S) batteries; only the Na-S battery appears to be a realistic proposition from a weightstandpoint. However, the Na-S battery-powered EV is estimated to cost from $27,000 to $54,000more than an advanced conventional vehicle, depending on vehicle type; the EV powered by Ni-MH would cost even more if the projected $400/kWh proves correct.
These prices could be lowered significantly, if the range and power criteria were relaxed. Usingthe same methodology as for the analysis above, a lead acid battery-powered subcompact EVcan be produced for an incremental price of about $3,000, if range is relaxed to 40 milesand power degraded to about 40 HP/ton. Hence, many of the disagreements about future EVprices can be resolved on the basis of vehicle performance and range assumptions, or owing to thefact that some estimates cite “cost” instead of price. In fact, Renault and Peugeot have chosen thelimited-range, low-performance EV to reduce incremental prices to about $3,000, consistent withthis estimate. The Citroen AX EV, for example, has a range of about 45 to 50 miles and a topspeed of about 55 mph, with poor acceleration.30
Table 4-9 shows the EV characteristics for 2015. As body weight is reduced with new materialstechnology, and modest battery improvements to increase specific energy are expected to occurby 2015, the weight compounding effects provide for more reasonable prices by 2015.Incremental price for an intermediate-sized lead acid-powered EV with a range of 80 miles andwith reasonable performance is estimated at less than $3,200 over a similar conventional car withadvanced technology, while a Ni-MH powered version could retail for $2,750 to $8,83031 moreand offer a range of 100 miles. In a more optimistic scenario, even a 200-mile range is possiblewith Ni-MH batteries at price differentials of about half the 2005 levels, while sodium sulphurbatteries can also provide this range for about half of the 2005 price differential, although this isstill expensive at nearly $18,000. If the lithium polymer batteries succeed in meeting U.S.Advanced Battery Consortium (USABC) expectations, however, an EV with a 300-mile rangecould become available at an incremental price of $10,400 for a mid-size car, even afteraccounting for the fact that these batteries are likely power limited and will need ultracapacitors toprovide the peak power requirements for acceleration. These price estimates clearly explain thereason for the interest in the lithium polymer battery. To model the case where the battery is
169

power limited, we have sized the battery to be able to indefinitely sustain a 60 mph climb on a 6percent grade, and provided for peak acceleration power capability to be sustained for twominutes.
All of these estimates are based on a set of assumed performance levels and OTA’s best guessesabout future battery costs and component efficiencies. Ongoing research programs, such as theUSABC, have as their goals improving EV component costs and efficiencies to values belowOTA’s values, and success at achieving these clearly would impact EV price and performance.Moreover, some EV advocates have concluded that vehicle purchasers can be convinced topurchase vehicles with generally lower performance than current vehicles, in particular with lowerrange. To examine the implications of R&D success and shifts in vehicle purchasing behavior, weestimated the effects of battery cost reductions, performance reductions, range reductions, andcomponent efficiency changes on the 2005 lead acid-battery-powered, intermediate-size EV.Range reductions have a very large effect on vehicle cost and battery requirements; reducing therange to 50 miles (real) reduces EV incremental price to $3,170 (from about $11,000), andreduces battery size to less than 40 percent the size required for a range of 80 miles. Reducingperformance levels (with a range of 50 miles) provides only modest reductions in battery weight,but reducing motor and controller costs reduces incremental price to $2,130. If battery costs fallto $100 per kWh from $150, vehicle incremental price is reduced to $960, and including themaximum level of component efficiency of motor/controllers and drivetrain reduces vehicleincremental price to $410. Hence, it is theoretically possible to build a reduced range EV for avery low incremental price in 2005, if the most optimistic assumptions were used in allfacets of the analysis. Even if range were kept at 80 miles, incremental price would be $4,125, ifvery optimistic assumptions regarding performance, component efficiency and battery cost wereused. These findings are summarized in table 4-10, but it is emphasized that the base attributesrepresent what OTA believes to be the most likely outcome of current R&D trends.
OTA’s analysis of EV performance and costs shows that the following four factors havesignificant influence on the analysis results.
●
●
●
●
Range. Vehicle weight and costs increase nonlinearly with range increases.
Battery specifications. The usable specific energy and power strongly affect battery size for a givenrange and performance level. Power requirements can set the minimum size for a battery in manyapplications.
Performance requirements. Relaxing the continuous and peak performance requirement has only a smalleffect on battery and motor requirements, where batteries are sized for range, but can have a large effect,if batteries are power limited.
Component efficiency. Assumptions regarding the overall efficiency of the drivetrain (including motors,power controllers, and gears) as well as the battery charge/discharge efficiency can affect the results,with very optimistic assessments reducing casts by as much as 30 percent over the median estimates.
In summary, the analysis finds that in 2005, mid-size EVs with a range of 80 to 100 milesand reasonable performance would be priced about $11,000 more than an equivalent
1 7 0
advanced conventional midsized car, assuming no subsidies. A reduced (50-mile) range EVcan be offered for a price of only $3,000 more than an advanced conventional car. EVs witha range of 200 miles however, are expected to be too heavy and unrealistically expensive in2005.
By 2015, incremental prices for an intermediate-size EV with a 100-mile range couldcome down to the $3,000 range. A 200-mile range intermediate-size EV would still probablybe priced about $24,000 more than an equivalent conventional car, unless the lithiumpolymer cell battery becomes a reality. If this were the case, it is possible that an EV with a300-mile range could be priced about $12,000 more than an equivalent intermediate car.Note, however, that these comparisons are to OTA’s advanced conventional cars, which havecostly body structures (especially the 2015 optimistic case, with a carbon fiber compositebody).
Public estimates of EV prices are often not well documented in terms of the assumptionsregarding battery size, vehicle size, vehicle range, and performance, which are all critical to thevalue of price obtained. For example, a major study for the Northeast Alternative VehicleConsortium 32 used cost numbers with no specific estimate of motor size and rating, and used afixed battery capacity (21 kWh) regardless of vehicle weight. In addition, the methodology usedto convert cost to price does not follow standard costing guidelines; for example, a fixed amountof the investment is amortized each year instead of being allocated to each EV produced, so thatas production rises, unit costs fall. Other studies, such as one by the California Air ResourcesBoard33 ignores the difference between cost and price, which understates EV prices dramatically.Many estimates of very low EV costs from environmental or conservation groups are,indeed, referring to manufacturer costs rather than vehicle prices, or do not control forrange or performance. It is quite possible that, if these calculations were made more explicit interms of assumed EV size, range, and performance, and the methodology were corrected totransform cost to price, then much of the difference in price estimates could be easily explained.
Emission Effects
The key emissions advantage of EVs is that they have virtually no vehicular emissions34
regardless of vehicle condition or age--they will never create the problems of older ormalfunctioning “superemitters,” which are now a significant concern of the current fleet. BecauseEVs are recharged with power-plant-generated electricity, however, EV emissions performanceshould be viewed from the standpoint of the entire fuel cycle, not just the vehicle. From thisstandpoint, EVs have a strong advantage over conventional vehicles in emissions of hydrocarbons(HC) and carbon monoxide (CO), because power generation produces little of these pollutants.Where power generation is largely coal-based--as it is in most areas of the country--some netincreases in sulfur dioxide might occur. However, Clean Air Act rules “cap” national powerplant
32International En vironment and Resource Program, “Near Term EV Costs,” prepared for Northeast Alternative Vehicle Consortium October
1994.33Air Resources Board, "Technical Support Document: Zero Emission Vehicle Update,” April 1994.34EVs with unsealed batteries will sometimes generate emission from deteriorating anodes and cathodes and vaporizing electrolyte.
171
emissions of sulfur oxides (SOX) at 10 million tons per year--limiting the potential adverse effectsof any large scale increase in power generation associated with EVs.
Any net advantage (or disadvantage) in NOX and particulate emissions of EVs overconventional vehicles is dependent on several factors. All fossil and biomass-fueled powergeneration facilities are significant emitters of NOX, and most are significant emitters ofparticulate, although there are wide variations depending on fuel generation technology, andemission controls. Analyses of the impact of EVs on NOX and particulate emissions are extremelysensitive to different assumptions about which powerplants will be used to recharge the vehicles,as well as assumptions about the energy efficiency of the EVs and competing gasoline vehicles 35
and the likely on-road emissions of the gasoline vehicles.
Aside from the magnitude of emissions, location plays an important role in impacts--althoughsome forms of pollution tend to travel long distances, generally pollution emitted close topopulation centers will have a greater impact on human health than does pollution emitted faraway. Most electric power plants are located out of major urban areas, while most gasolinevehicles are operated within urban areas. Because of this, use of EVs generally sharply reducesemissions of NOX, SOX, and particulate as well as HC and CO in urban areas. The increases inSOX and particulate emissions by use of EVs occur primarily out of urban areas. The increases inSOX, NOX, and particulate emissions in remote areas may cause less damage to human health,since human exposure to air pollution is low in remote areas; however, long range transport offine particulate, including sulfates formed from SOX emissions, is widely recognized as a majorhealth concern, so a fair risk assessment should include a careful examination of pollutiontransport issues.
As noted, EV emission reductions are affected significantly by several important factors. First,electric generation mix is a dominant factor. In regions where clean fuels or renewable fuels areused for electricity generation (such as hydropower and natural gas), EVs are expected to achievelarge emission reductions. In regions where less benign fuels such as coal are used, use of EVsachieves lower emission reductions. For example, nationwide, 51 percent of electricity isgenerated from coal, 13 percent from natural gas, 18 percent from nuclear, 3 percent from oil, and11 percent from hydropower and other renewables.36 In California, about 36 percent of electricityis generated from natural gas, 5 percent from oil, 47 percent from nuclear and hydropower, andonly 12 percent from coal.37 Because of the difference in generation mix between the UnitedStates and California, EV emission reduction benefits in California are much greater than in theUnited States as a whole.
Even where alternative studies are examining the same region, there may be sharp differences inthe power mix assumed because the mix of generating plants likely to be used to add power whenEVs need recharging may be quite different from the area’s overall mix. The area’s mix reflectsprimarily the power generated during the daytime, when power demands peak; the EV mix
35It is not un common for analysts to compare small, low-powered limited range EVs to large full-powered gasoline vehicles, clearly to the EVs’
advantage.3 6Energy Information Administration, Annual Energy Outlook, 1995, DOE/EIA-0383(95) (Washington DC: January 1995), table A8.37California Energy Commission data, supplemented by other sources.
172
reflects those plants that will be dispatched during the night over and above the normal nighttimebaseload.
Second, EV per-mile electricity consumption is important in determining per-mile EV emissionsand net emissions reductions. Although existing EV technologies have relatively high per-mileelectricity consumption and fuel-cycle emissions, future, more efficient, EV technologies may welllead to substantial reductions in EV electricity consumption and corresponding improvements inthe emissions “balance” between EVs and competing gasoline vehicles.38
Third, the level of emission control in power plants is a key determinant of EV fuel-cycleemissions. Eventually, old power plants with fewer controls will be retired, and new plants thatare subject to stringent emission requirements will come into service with low emissions. Thus,future EVs will automatically have lower fuel-cycle emissions.
Finally, the estimates of gasoline vehicle (GV) emissions are critical. Most past studies of EVemissions impacts used either emission standards or computer model-estimated emissions torepresent GV emissions. It is well known now that emission standards and most previousestimates of on-road emissions are substantially lower than actual on-road emissions. Use of lowbaseline GV emissions will cause underestimation of EV emission reductions. OTA used anexisting computer model--EPA’s Mobile5--to project gasoline emissions, and our estimatedgasoline vehicle emissions are likely to be somewhat low. Another problem with some past studieswas the use of gasoline vehicles for comparison that were relatively inefficient, and thus hadcorrespondingly high-fuel-cycle emissions. This analysis compares EVs with gasoline vehicles thatare identical to the EVs except for their powertrain and energy storage, that is, EVs withaluminum bodies are compared with gasoline vehicles with aluminum bodies.
Using a fuel-cycle model developed for the project,39 OTA evaluated and compared the fuelcycle emissions of EVs and the corresponding advanced conventional vehicles sharing the sameefficiency characteristics (except powertrain). In calculating GV emissions, the federal Tier 2standards are assumed to be implemented. For EVs a national electric generation mix is used,assuming most recharge will occur at night and use surplus off-peak (baseload or intermediate)power.40 The use of the national mix here certainly underestimates EV emission benefits in areaslike California that have relatively clean power.
The 80 to 100-mile range 2005 MY EV technologies, using lead acid and Ni-MH batterytechnology, almost eliminate emissions of HC and CO, and achieve 50 percent to 70 percentreductions in emissions of very fine particulate, PM10.41 These high PM10 emission reductions,which are different from the results in many previous studies, are owing to the very high GV fuel
3 8Battery research is aiming to improve substantially the charge/recharge efficiency and specific energy (energy storage per unit of weight) of EV
batteries both of which will have a great impact on EV energy requirements and emissions (better energy storage will yield a lighter, more efficientvehicle if range is unchanged).
39M.Q. Wang, Argonne National Laboratory, "Fuel-Cycle Energy Requirements and Emissions of Advanced Automotive Technologies," draft
prepared for the Office of Technology Assessment, July 5, 1995.40Assumed generation mix: coal, 50 percent; natural gas, 30 percent; nuclear, 10 percent; oil, 5 percent; and hydropower, 5 percent. This mix
reflects the assumption that much nuclear and hydropower generation capability is already fully subscribed and will not be available for dispatch to
recharge EVs41PM10 refers to particulate matter below 10 microns in diameter, that is, fine particulates.
173
cycle PM10 emissions estimated in this study.42 The EVs cause 200-400 percent increases in per-mile SOX emissions. Also, the lead acid EV causes an increase in NOX of nearly 90 percent, withthe Ni-MH EV causing a small increase.
The 2015 EV results are somewhat better. Again, both the lead acid and Ni-MH almosteliminate emissions of HC and CO, and they achieve a 60 percent to 70 percent reduction inPM10 emissions. SOX emissions still increase, as they must considering the high forecasted coaluse in power generation, but the increases are basically cut in half from the 2005 results. Thechanges in NOX emissions vary substantially with the battery technologies, with Ni-MH achievingnearly a 30 percent reduction, while the Pb-acid still causes NOX emissions to increase, by 20percent.
These results are generally in line with the results of other studies except for the NOX results.Past studies often have projected a more uniform reduction in NOX emissions from the use ofEVS,43 though this is by no means universal. OTA’s projections for gasoline vehicles’ NOX
emissions may be optimistic, however. Unless there are strong improvements in inspection andmaintenance programs, and excellent success for projected changes in EPA’s certification testingprogram (designed to reduce emissions during vehicle acceleration and other high-loadconditions), gasoline vehicles may have substantially higher on-road emissions than projected inthis analysis--especially as they age. Given the virtual certainty of obtaining low EV fuel cycleemissions, these results indicate that EVs generally will yield significant emissions benefits on a“per-vehicle” basis.
HYBRID VEHICLES
As noted in the introduction to this section, hybrid vehicles combine two energy sources withan electric drivetrain, with one or both sources providing electric power to the motor. Thissection examines hybrids that incorporate an internal combustion engine as one of the energysources, with batteries, flywheels, or ultracapacitors also providing electric energy to the motor.Moreover, although gas turbines can be used in a hybrid, turbines of the size optimal for 1ight-duty vehicles are unlikely to be more efficient than piston engines of the same performancecapacity; consequently, only piston engines are considered in this section. Other combinations ofenergy sources, such as a fuel cell and a battery, can also be used in a hybrid, however.
The conceptual advantage of a hybrid is that it gains the range provided by an engine using ahigh-density fuel, but avoids the energy losses associated with forcing the engine to operate atspeed/load combinations that degrade its efficiency. In other words, the engine can run at nearlyconstant output, near its optimum operating point, with the other energy source providing muchof the load-following capability that undermines the engine’s efficiency in a conventional vehicle.
The term hybrid is applied to a wide variety of designs with different conceptual strategies onthe use and size of the two drivetrains. One form of classification for hybrids is a division into so-
174
called series and parallel hybrids. In a series hybrid, the power generated by the ICE is alwaysconverted to electricity, and either stored (in a battery, flywheel, or ultracapacitor) or useddirectly to drive a motor, which is connected to the vehicle’s wheels. In a parallel hybrid, theengine or the motor, or both, can drive the wheels directly. The two design types are shownschematically in figure 4-3. Although both systems have advantages and disadvantages, mostmanufacturers who have displayed prototype hybrid vehicles have selected the series design. Theexception is VW, and its engineers believe that series designs are being displayed largely becausethey are very easy to develop, but are inefficient for reasons explained later. Another classificationmethod is according to whether the vehicles require externally supplied electrical power (as an EVdoes), or can operate solely on gasoline, and these are labeled as nonautonomous andautonomous hybrids, respectively..
For either the series or parallel type hybrid, the ICE and the electrical system can be of widelydifferent sizes. In both hybrid types, one extreme would be to have the engine act as a “rangeextender” by charging the battery (or other electricity storage device) while the electric drivetrainis quite similar in size to that of a pure EV. With this type of setup, sizing the engine’s maximumoutput close to the vehicle’s average power demand during highway cruise (e.g., 15 to 20 kW/tonof vehicle weight) would allow the range of the vehicle to be similar to that of a conventional car.Moreover, unless there were an abnormally long hill climb, the battery state of charge could bemaintained at near constant level. At the other end of the spectrum, an engine could be large insize and the battery or power storage device made relatively small, so that the engine could beemployed to provide peak power for acceleration and battery recharging capability. Obviously,there are infinite combinations in between the two extremes. The amount of energy stored in thebattery or other storage device, as well as the device’s peak-power capability, are keydeterminants of how the engine and storage device will interactively supply power to thedrivetrain under any arbitrary driving cycle. Autonomous hybrids of either the parallel or seriestype usually utilize larger engines than nonautonomous ones.
The hybrid vehicle concept is neither new nor revolutionary. The earliest hybrids were built in1917, and DOE funded a large research program in the late-1970s and early 1980s. Many of thesame arguments and analyses in vogue now in support of hybrid powertrains were voiced after thetwo oil crises of the 1970s.44 The Jet Propulsion Laboratory and General Electric developedstudies, published in 1980, that estimated that a mid-sized car could attain 33 mpg on the citycycle, which was about 40 to 50 percent better than vehicles of that era. A prototype in the early1980s demonstrated about 50 percent improvement in fuel economy relative to a early-1980sconventional vehicle of the same size, though it had lower performance.45
More recently, several papers46 have claimed that hybrid vehicles using lightweight bodyconstruction, can provide a fuel economy increase of about 100 percent, while one paper claimsan improvement potential of several hundred to several thousand percent for a hybridconfiguration with a carbon fiber body, superb aerodynamics, and improved tires. 47 Moreover,PNGV contractors have discussed charts where some form of hybrid powertrain (undefined) was
44General Electric, "New Term Hybrid Vehicle Program,” report No. SRD-79-134, 1979.45General Electric, "Hybrid Vehicle Program: Final Report,” report No. SRD-83-031, November, 1993.46 E.g., A. F. Burke, "Hybrid Vehicles,” Encyclopedia of Energy and Technology (New York, NY: John Wiley, 1995) pp. 1709-1723.47A.B. Lovins et a1., "Supercars: The Coming Light Vehicle Revolution," ECEEE Conference Proceedings, June 1993.
175

by itself (that is, without changes in body construction, aerodynamics, and tires) to provide a 100percent benefit in fuel economy,
48 and this value currently is the target for the DOE hybrid
program. DOE has also sponsored several college-level competitions, called the Hybrid VehicleChallenge, where colleges have displayed hybrid vehicles of both the series and parallel type thathave attained relatively high fuel economy levels. For example, the 1994 entries from Universityof California at Davis and the University of Maryland have claimed fuel economy levels of 75 to80 mpg at constant speed (-40 to 50 mph) in small or compact cars.49 Given these demonstrationsand programs, there is a widespread belief among many observers that hybrid powertrainscan easily achieve 100 percent improvements in fuel economy, and that even higher benefitsare possible in the future. An added attraction is that hybrids can potentially act as limited-rangeelectric vehicles, and thus can be zero emission vehicles in select urban areas.
This positive view of hybrids is by no means unanimous. On the other side of the argument,several auto manufacturers and EV manufacturers have told OTA that hybrid drivetrains producesmall or no benefits to fuel economy .50 Several series hybrids displayed by BMW,51 Mercedes,and Nissan,52 for example, have displayed virtually no benefit in fuel economy relative to gasolineengine-powered vehicles of similar performance. VW has developed parallel hybrids using a dieselengine and a small electric motor that have displayed good diesel fuel efficiency but highelectricity consumption. The VW Golf hybrid requires that batteries be charged from the grid, andthey are not charged by the engine. In the Federal Test Procedure, this hybrid attained 80 mpg ofdiesel fuel but also consumed 0.122 kW/km (about 0.20 kW/mi) of electrical energy .53 Thiselectric energy consumption is similar to that of a comparable EV.
Series Hybrids
In a series hybrid, the engine is used only to drive a generator, while the wheels are poweredexclusively by an electric motor. A battery (or flywheel or ultracapacitor) is used to store energy,obtaining some energy input from regenerative braking, and most of the input from theengine/generator. The motor can be powered either directly by the engine/generator, by thebattery, or by both simultaneously (at high-power demand). Strategy considerations about whento use the battery or the motor/generator lead to decisions about the relative power output ofeach unit and the energy storage capacity of the battery.
The popular vision of a series hybrid has a small engine operating at constant output, providingthe average power needed over the driving cycle, with a battery, flywheel, or ultracapacitorproviding additional power when needed, such as for acceleration or hill-climbing. When the
48P.G. Patil, "Partnership for a New Generation of Vehicles,” Automotive Technology Development Contractors Coordination Meeting, U.S.
Department of Energy, October 1994.49S.A. Merit and K. Wipke, “The 1994 Hybrid Electric Vehicle Challenge,” Automotive Technology Development Contractors Coordination
Meeting, U.S. Department of Energy, October 1994.50Office of Technology Assessment project team meetings with automobile manufacturers in Europe and Japan, May/June 1994.51S. Friedman and K. Scheurer, "On The Way to Clean(er) Vehicles,” SAE paper 94C052, 1994.52Nissan, personal communications June 16, 1994.53W. Josefowitz and S. Kohle, "The Volkswagen Golf Hybrid,” paper prepared for the 1lth International EV Symposium, September 1992.
1 7 6
vehicle’s power needs are below the engine output, the excess energy goes to recharge the storagedevice.
A careful examination of the vehicle’s energy requirements and the characteristics of theavailable power sources is necessary to show whether the popular vision will work in practice.First, examining an engine’s power characteristics does make it clear that the engine should beused to provide the total energy for driving, while the battery or other storage device should besized to provide peak power. Although an ICE does have high specific power (power output perkilogram of engine weight) under normal operation, keeping the engine at its peak efficiency pointsharply limits specific power. That is, a typical engine operating at its best efficiency pointproduces only about 40 percent of its peak output.54 Such an engine, combined with a generator,radiator, and other engine components, would weigh 7.5 to 8.5 kg/kW and have specific powerabout 117 to 130 W/kg.55 In contrast, advanced lead acid batteries of the semi-bipolar or bipolartype provide specific power of over 300 W/kg for a 30-second rating, while ultracapacitors andflywheels can provide 2,000 W/kg or more. That is, the storage devices can have higher specificpower than the engine itself.
Second, the storage mechanisms are limited in the amount of power they can provide, whichhas important implications for engine sizing and operations. The battery, for example, is capableof providing peak power in short bursts only, because of heat removal requirements.Ultracapacitors are limited by their low specific energy; they would have to be very large toprovide high power for a long period. Consequently, while the storage devices can be used tosatisfy high-power requirements that last a short period, the engine itself must be sized largeenough to take care of any high-power requirements that may be of long duration.Consistent with the analysis for EVs OTA has imposed the requirement that the vehicle becapable of sustaining a long climb of a 6 percent grade at 60 mph.56
Sizing the hybrid’s engine in this manner--to provide enough power to climb a long hill--impliesthat the engine, when operating at its most efficient speed, is providing a higher average poweroutput than needed for most driving. This means that much of the time the engine is operating, itwill be charging the battery or other storage device. When the storage device becomes fullycharged, the engine must be turned off and the vehicle operated in the following manner:
. As long as power demands are moderate, the vehicle operates as an EV, until the storage is drawn downfar enough to allow the engine to be turned on again. Depending on the energy storage capacity of thebuffer, then, the engine might be turned off and on several times (for low-energy storage, such as with anultracapacitor) or possibly just once during an average drive (with battery storage). The engine must beturned on well before the buffer is drained of its energy, however, because the buffer must still beavailable to provide a power boost, if needed.
. During the period when the engine is turned off, it will have to be restarted, if there is a demand forpower that exceeds the capacity of the buffer. In a hilly area, the engine may need to be restarted often.
177
This operating mode is far more complex than implied by most discussions of series hybrids,which often give the impression that the engine runs at one speed during the entire trip, with thebuffer providing occasional bursts of power on demand. Moreover, the need to turn the engine onand off may have important implications for pollution control.
The imposition of a 6 percent grade-climbing ability at 60 mph, when coupled with therequirement that the engine run at constant output, has a startling impact on engine size andvehicle design. This grade-climbing capability requires about 30 kw/ton of vehicle and payloadweight. Because attaining a desirable O to 60 mph acceleration time of about 12 seconds requiresabout 50 kW/ton of vehicle and payload (for a vehicle with an electric drivetrain), the batteries (orother storage devices) must supply (50-30) kW/ton for peak accelerations. Given thesespecifications, a mid-size Taurus hybrid would have the following characteristics:
● Vehicle curb weight: 1843 kg
● Engine output (nominal): 61.3 kw
● Battery peak output: 40.9 kw
● Battery weight: 136.2 kg
● Battery type: semi-bipolar lead acid, 300 W/kg.
The engine must be a 3.3L four-valve engine rated at 155 kw at its normal peak. The amazingresult is that the engine must actually be substantially more powerful than that of thecurrent Taurus. The reason, of course, is that the engine of the current Taurus already operatesnear the maximum efficiency point at a 6 percent grade climb at 60 mph. Hence, if the engine ofthe hybrid electric vehicle (HEV) is sized in the same proportion, it must be larger to provide theincreased power to overcome the weight associated with the motor, battery, electrical system, andgenerator, which adds 800 lbs to the weight--and the larger engine also adds to the vehicle’sweight. The result is that the Taurus hybrid weighs over 900 pounds more than the currentTaurus.
This is only one of the unattractive aspects of limiting engine operation to only one outputlevel. Another problem is that on the FTP city cycle, the engine operates for a very brief duration.The 23-minute cycle requires about 2.3 kWh of energy at the motor to cover the cycle, whichmeans that the engine needs to run about 1.1 minutes,57 and be shut off the rest of the time.Hence, cold-start fuel consumption will add a significant penalty to total fuel consumption.Interestingly, because the battery is capable of storing 5.7 kwh, the vehicle could be run as an EVover the entire FTP cycle, if it started with the battery fully charged--though its performancewould be quite limited.
57Time of running = energy required/power output of the engine = 2.3 kWh/61.3kW * 0.8 percent (where 61.3 * 0.8 is the electrical output of the
engine in kW stored in the battery) * 6O minutes/hour.
1 7 8
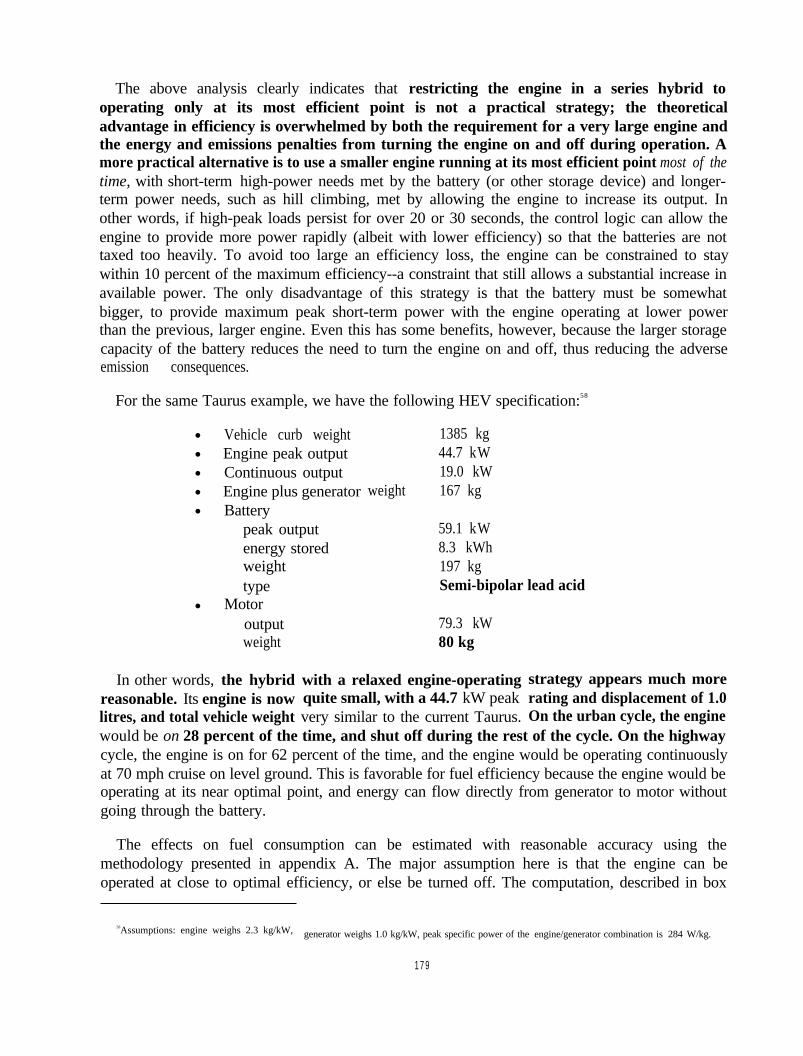
The above analysis clearly indicates that restricting the engine in a series hybrid tooperating only at its most efficient point is not a practical strategy; the theoreticaladvantage in efficiency is overwhelmed by both the requirement for a very large engine andthe energy and emissions penalties from turning the engine on and off during operation. Amore practical alternative is to use a smaller engine running at its most efficient point most of thetime, with short-term high-power needs met by the battery (or other storage device) and longer-term power needs, such as hill climbing, met by allowing the engine to increase its output. Inother words, if high-peak loads persist for over 20 or 30 seconds, the control logic can allow theengine to provide more power rapidly (albeit with lower efficiency) so that the batteries are nottaxed too heavily. To avoid too large an efficiency loss, the engine can be constrained to staywithin 10 percent of the maximum efficiency--a constraint that still allows a substantial increase inavailable power. The only disadvantage of this strategy is that the battery must be somewhatbigger, to provide maximum peak short-term power with the engine operating at lower powerthan the previous, larger engine. Even this has some benefits, however, because the larger storagecapacity of the battery reduces the need to turn the engine on and off, thus reducing the adverseemission consequences.
For the same Taurus example, we have the following HEV specification:58
● Vehicle curb weight● Engine peak output● Continuous output● Engine plus generator● Battery
peak outputenergy storedweighttype
● Motoroutputweight
In other words, the hybridreasonable. Its engine is nowlitres, and total vehicle weight
1385 kg44.7 kW19.0 kW
weight 167 kg
59.1 kW8.3 kWh197 kgSemi-bipolar lead acid
79.3 kW80 kg
with a relaxed engine-operatingquite small, with a 44.7 kW peakvery similar to the current Taurus.
strategy appears much morerating and displacement of 1.0On the urban cycle, the engine
would be on 28 percent of the time, and shut off during the rest of the cycle. On the highwaycycle, the engine is on for 62 percent of the time, and the engine would be operating continuouslyat 70 mph cruise on level ground. This is favorable for fuel efficiency because the engine would beoperating at its near optimal point, and energy can flow directly from generator to motor withoutgoing through the battery.
The effects on fuel consumption can be estimated with reasonable accuracy using themethodology presented in appendix A. The major assumption here is that the engine can beoperated at close to optimal efficiency, or else be turned off. The computation, described in box
58Assumptions: engine weighs 2.3 kg/kW, generator weighs 1.0 kg/kW, peak specific power of the engine/generator combination is 284 W/kg.
1 7 9
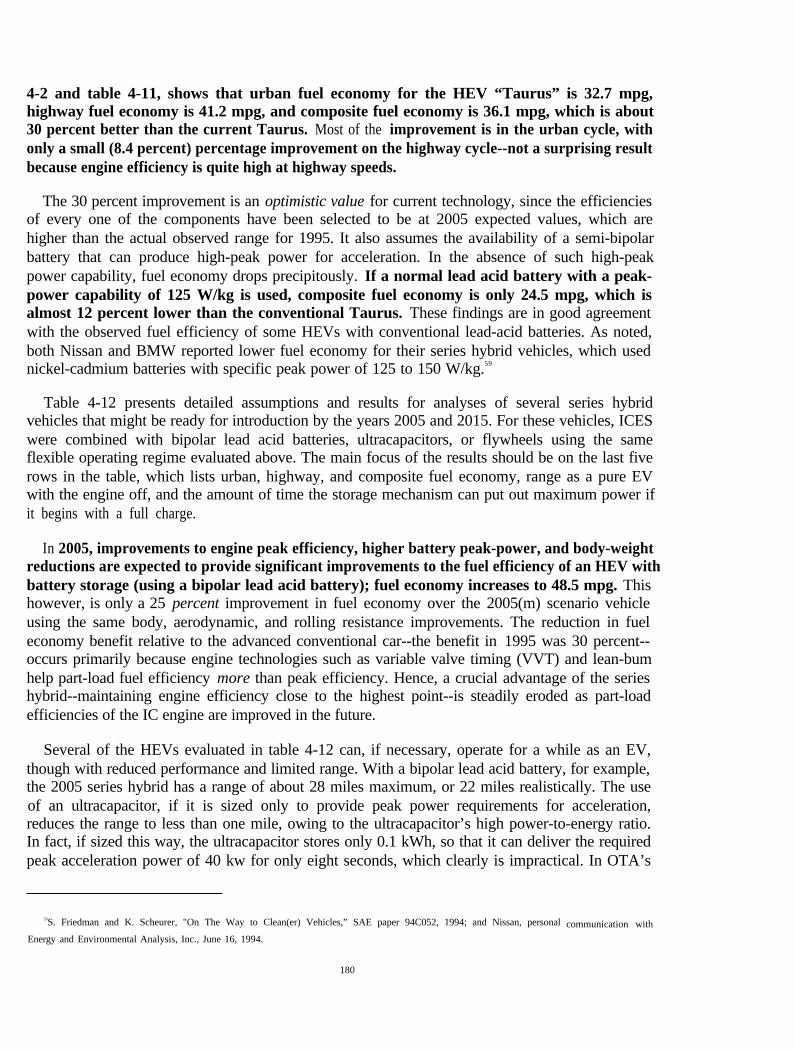
4-2 and table 4-11, shows that urban fuel economy for the HEV “Taurus” is 32.7 mpg,highway fuel economy is 41.2 mpg, and composite fuel economy is 36.1 mpg, which is about30 percent better than the current Taurus. Most of the improvement is in the urban cycle, withonly a small (8.4 percent) percentage improvement on the highway cycle--not a surprising resultbecause engine efficiency is quite high at highway speeds.
The 30 percent improvement is an optimistic value for current technology, since the efficienciesof every one of the components have been selected to be at 2005 expected values, which arehigher than the actual observed range for 1995. It also assumes the availability of a semi-bipolarbattery that can produce high-peak power for acceleration. In the absence of such high-peakpower capability, fuel economy drops precipitously. If a normal lead acid battery with a peak-power capability of 125 W/kg is used, composite fuel economy is only 24.5 mpg, which isalmost 12 percent lower than the conventional Taurus. These findings are in good agreementwith the observed fuel efficiency of some HEVs with conventional lead-acid batteries. As noted,both Nissan and BMW reported lower fuel economy for their series hybrid vehicles, which usednickel-cadmium batteries with specific peak power of 125 to 150 W/kg.59
Table 4-12 presents detailed assumptions and results for analyses of several series hybridvehicles that might be ready for introduction by the years 2005 and 2015. For these vehicles, ICESwere combined with bipolar lead acid batteries, ultracapacitors, or flywheels using the sameflexible operating regime evaluated above. The main focus of the results should be on the last fiverows in the table, which lists urban, highway, and composite fuel economy, range as a pure EVwith the engine off, and the amount of time the storage mechanism can put out maximum power ifit begins with a full charge.
In 2005, improvements to engine peak efficiency, higher battery peak-power, and body-weightreductions are expected to provide significant improvements to the fuel efficiency of an HEV withbattery storage (using a bipolar lead acid battery); fuel economy increases to 48.5 mpg. Thishowever, is only a 25 percent improvement in fuel economy over the 2005(m) scenario vehicleusing the same body, aerodynamic, and rolling resistance improvements. The reduction in fueleconomy benefit relative to the advanced conventional car--the benefit in 1995 was 30 percent--occurs primarily because engine technologies such as variable valve timing (VVT) and lean-bumhelp part-load fuel efficiency more than peak efficiency. Hence, a crucial advantage of the serieshybrid--maintaining engine efficiency close to the highest point--is steadily eroded as part-loadefficiencies of the IC engine are improved in the future.
Several of the HEVs evaluated in table 4-12 can, if necessary, operate for a while as an EV,though with reduced performance and limited range. With a bipolar lead acid battery, for example,the 2005 series hybrid has a range of about 28 miles maximum, or 22 miles realistically. The useof an ultracapacitor, if it is sized only to provide peak power requirements for acceleration,reduces the range to less than one mile, owing to the ultracapacitor’s high power-to-energy ratio.In fact, if sized this way, the ultracapacitor stores only 0.1 kWh, so that it can deliver the requiredpeak acceleration power of 40 kw for only eight seconds, which clearly is impractical. In OTA’s
59S. Friedman and K. Scheurer, "On The Way to Clean(er) Vehicles,” SAE paper 94C052, 1994; and Nissan, personal communication with
Energy and Environmental Analysis, Inc., June 16, 1994.
180
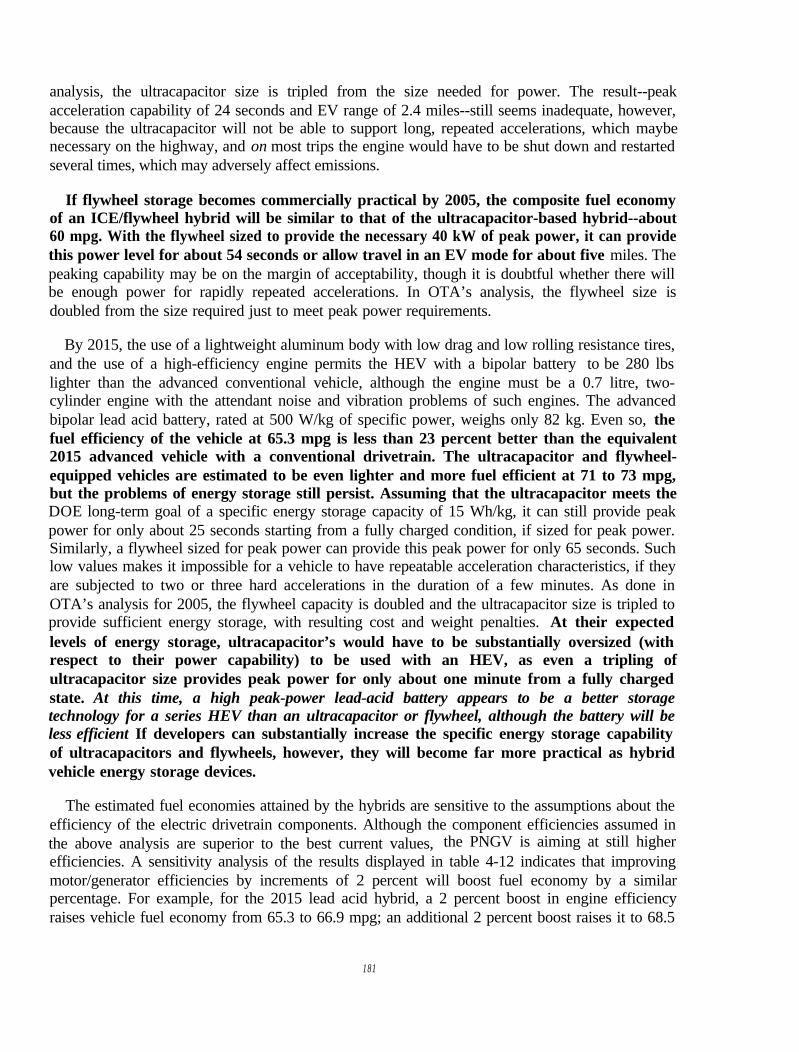
analysis, the ultracapacitor size is tripled from the size needed for power. The result--peakacceleration capability of 24 seconds and EV range of 2.4 miles--still seems inadequate, however,because the ultracapacitor will not be able to support long, repeated accelerations, which maybenecessary on the highway, and on most trips the engine would have to be shut down and restartedseveral times, which may adversely affect emissions.
If flywheel storage becomes commercially practical by 2005, the composite fuel economyof an ICE/flywheel hybrid will be similar to that of the ultracapacitor-based hybrid--about60 mpg. With the flywheel sized to provide the necessary 40 kW of peak power, it can providethis power level for about 54 seconds or allow travel in an EV mode for about five miles. Thepeaking capability may be on the margin of acceptability, though it is doubtful whether there willbe enough power for rapidly repeated accelerations. In OTA’s analysis, the flywheel size isdoubled from the size required just to meet peak power requirements.
By 2015, the use of a lightweight aluminum body with low drag and low rolling resistance tires,and the use of a high-efficiency engine permits the HEV with a bipolar battery to be 280 lbslighter than the advanced conventional vehicle, although the engine must be a 0.7 litre, two-cylinder engine with the attendant noise and vibration problems of such engines. The advancedbipolar lead acid battery, rated at 500 W/kg of specific power, weighs only 82 kg. Even so, thefuel efficiency of the vehicle at 65.3 mpg is less than 23 percent better than the equivalent2015 advanced vehicle with a conventional drivetrain. The ultracapacitor and flywheel-equipped vehicles are estimated to be even lighter and more fuel efficient at 71 to 73 mpg,but the problems of energy storage still persist. Assuming that the ultracapacitor meets theDOE long-term goal of a specific energy storage capacity of 15 Wh/kg, it can still provide peakpower for only about 25 seconds starting from a fully charged condition, if sized for peak power.Similarly, a flywheel sized for peak power can provide this peak power for only 65 seconds. Suchlow values makes it impossible for a vehicle to have repeatable acceleration characteristics, if theyare subjected to two or three hard accelerations in the duration of a few minutes. As done inOTA’s analysis for 2005, the flywheel capacity is doubled and the ultracapacitor size is tripled toprovide sufficient energy storage, with resulting cost and weight penalties. At their expectedlevels of energy storage, ultracapacitor’s would have to be substantially oversized (withrespect to their power capability) to be used with an HEV, as even a tripling ofultracapacitor size provides peak power for only about one minute from a fully chargedstate. At this time, a high peak-power lead-acid battery appears to be a better storagetechnology for a series HEV than an ultracapacitor or flywheel, although the battery will beless efficient If developers can substantially increase the specific energy storage capabilityof ultracapacitors and flywheels, however, they will become far more practical as hybridvehicle energy storage devices.
The estimated fuel economies attained by the hybrids are sensitive to the assumptions about theefficiency of the electric drivetrain components. Although the component efficiencies assumed inthe above analysis are superior to the best current values, the PNGV is aiming at still higherefficiencies. A sensitivity analysis of the results displayed in table 4-12 indicates that improvingmotor/generator efficiencies by increments of 2 percent will boost fuel economy by a similarpercentage. For example, for the 2015 lead acid hybrid, a 2 percent boost in engine efficiencyraises vehicle fuel economy from 65.3 to 66.9 mpg; an additional 2 percent boost raises it to 68.5
181
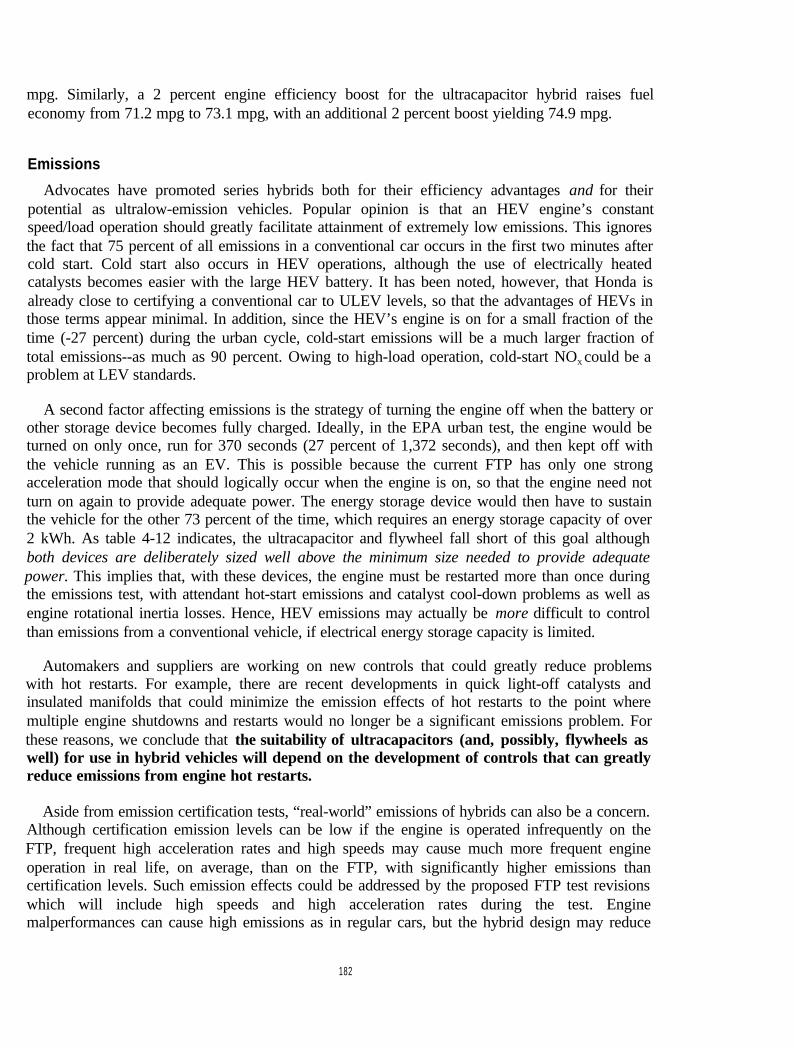
mpg. Similarly, a 2 percent engine efficiency boost for the ultracapacitor hybrid raises fueleconomy from 71.2 mpg to 73.1 mpg, with an additional 2 percent boost yielding 74.9 mpg.
Emissions
Advocates have promoted series hybrids both for their efficiency advantages and for theirpotential as ultralow-emission vehicles. Popular opinion is that an HEV engine’s constantspeed/load operation should greatly facilitate attainment of extremely low emissions. This ignoresthe fact that 75 percent of all emissions in a conventional car occurs in the first two minutes aftercold start. Cold start also occurs in HEV operations, although the use of electrically heatedcatalysts becomes easier with the large HEV battery. It has been noted, however, that Honda isalready close to certifying a conventional car to ULEV levels, so that the advantages of HEVs inthose terms appear minimal. In addition, since the HEV’s engine is on for a small fraction of thetime (-27 percent) during the urban cycle, cold-start emissions will be a much larger fraction oftotal emissions--as much as 90 percent. Owing to high-load operation, cold-start NOX could be aproblem at LEV standards.
A second factor affecting emissions is the strategy of turning the engine off when the battery orother storage device becomes fully charged. Ideally, in the EPA urban test, the engine would beturned on only once, run for 370 seconds (27 percent of 1,372 seconds), and then kept off withthe vehicle running as an EV. This is possible because the current FTP has only one strongacceleration mode that should logically occur when the engine is on, so that the engine need notturn on again to provide adequate power. The energy storage device would then have to sustainthe vehicle for the other 73 percent of the time, which requires an energy storage capacity of over2 kWh. As table 4-12 indicates, the ultracapacitor and flywheel fall short of this goal althoughboth devices are deliberately sized well above the minimum size needed to provide adequatepower. This implies that, with these devices, the engine must be restarted more than once duringthe emissions test, with attendant hot-start emissions and catalyst cool-down problems as well asengine rotational inertia losses. Hence, HEV emissions may actually be more difficult to controlthan emissions from a conventional vehicle, if electrical energy storage capacity is limited.
Automakers and suppliers are working on new controls that could greatly reduce problemswith hot restarts. For example, there are recent developments in quick light-off catalysts andinsulated manifolds that could minimize the emission effects of hot restarts to the point wheremultiple engine shutdowns and restarts would no longer be a significant emissions problem. Forthese reasons, we conclude that the suitability of ultracapacitors (and, possibly, flywheels aswell) for use in hybrid vehicles will depend on the development of controls that can greatlyreduce emissions from engine hot restarts.
Aside from emission certification tests, “real-world” emissions of hybrids can also be a concern.Although certification emission levels can be low if the engine is operated infrequently on theFTP, frequent high acceleration rates and high speeds may cause much more frequent engineoperation in real life, on average, than on the FTP, with significantly higher emissions thancertification levels. Such emission effects could be addressed by the proposed FTP test revisionswhich will include high speeds and high acceleration rates during the test. Enginemalperformances can cause high emissions as in regular cars, but the hybrid design may reduce
182
intentional maladjustment or tampering as engine operation is at near constant speed/load.Malperformance-related issues are a major concern for regulatory agencies, however, especiallyas the vehicles age, and the hybrid may offer no benefit over conventional vehicles in this arena.Hence, hybrids may have no significant benefit in emissions relative to conventionalvehicles, with the possible exception of their capability to act as limited-range EVs inspecific urban areas.
Other Studies
The results presented here are radically different from these presented by some analysts, and acomparison of the assumptions employed is provided here for a few selected papers. A recentpaper by Mason and Kristiansson60 of Volvo showed low fuel economy levels for all types ofhybrids and claimed that series hybrids were more efficient than parallel hybrids. The analysispresented in the paper incorporated several assumptions that do not appear defensible, forexample:
Engine efficiency under urban driving was assumed to be 10 percent, and 20 percent for highway drivingfor conventional vehicles. A 30 percent efficiency was used to model the series hybrid, and the incorrectlarge difference in efficiencies explains the poor results for the parallel hybrids.
Weights for alternative configurations of hybrids were not calculated, but were assumed to be equal tothe conventional vehicle. This leads to gross error in some cases. ‘
A very rigid operating strategy was dictated by assuming that the vehicle would behave as an EV for thefirst 30 miles, and as a hybrid for the next 60 miles.
The issue of engine sizing and on/off operation were not addressed.
The battery was expected to supply the worst-case requirements for power unaided by the engine, whichdictated the need for an excessively large battery.
As a result of what we consider as unrealistic input assumptions, the fuel economy for a mid-sizedHEV was estimated at about 34 mpg for a series hybrid and 19 mpg for the parallel hybrid.
Some analysts have obtained substantially more optimistic results than OTA. One analyst haspublished studies on hybrid vehicles for the past 15 years, and has used a relatively sophisticatedmodel (SIMPLEV) to estimate their benefits. In recent work, he has reported fuel efficiencybenefits for series hybrids of 40 to 60 percent on the city cycle and in the 30 percent range for thehighway cycle.61 Direct comparisons between this analyst’s simulations and OTA’s results werefacilitated by a special run of his model using values quite similar to those used by OTA forvehicle characteristics. His results provide for a direct comparison of the results of the twomodeling methods for a hybrid using an ultracapacitor for energy storage (see table 4- 13).
60W. Mason and U. Kristianson, “Hybrid versus Pure EVs Which Gives Greater Benefits,” SAE paper 94C017, 1994.
1 8 3
It appears the OTA results are very similar to the SIMPLEV results on the highway cycle butdiffer significantly on the city cycle. The reason maybe partly because there is no hot or cold-startfuel penalty in the SIMPLEV model, partly because OTA assumes that the engine operatesaround but not exactly at the optimal bsfc, and partly because of OTA’s assumed lowerregenerative braking efficiency.
Another researcher62 estimates a 100 percent fuel economy improvement from a series hybridconfiguration, in a comprehensive analysis that fortunately uses a mid-size car for its startingpoint, facilitating comparisons with OTA’s analysis. Many of the assumptions in the analysis donot appear to be consistent with OTA’s stated objective of obtaining vehicle performance thatrivals that of conventional vehicles. Among the major differences are:
●
●
●
●
●
●
The small engine operates at a single point and provides 35 kW of power. Its efficiency is rated at 36.5percent, which is higher than any engine of that size available today.
The entire energy storage is by an ultracapacitor that stores only 0.5 kwh.ultracapacitor scenario considered by OTA, but the paper does not addressacceleration or gradability, or multiple hot restarts.
This is similar to thethe issue of sustained
Generator efficiency is assumed at 96 percent, and the engine operates 11 percent of the time on theFTP.
The efficiencies of electric storage, motor, and transmission are combined and are assumed to be 80percent. In OTA’s analysis, the battery, motor and transmission combined efficiency is around 0.68.
All inertia loss is assumed to be braking loss, and braking energyanalysis, the value of recovered inertia loss is less than 60 percent.
Cold start and hot restart fuel consumption penalties are ignored.
recovery is 90 percent. In OTA’s
This researcher also combines the hybrid configuration with a lower weight, lower air drag, andlower rolling resistance design and calculates a fuel efficiency of 83.1 mpg. The car weight, drag,and rolling resistance are roughly comparable to the 2005(0) scenarios used here, for which OTAcalculates a 61 mpg fuel economy.
A third paper63 concludes that a subcompact car can attain several hundred mpg based on anunusually optimistic set of input assumptions;
61A. Burke, "Electric-Hybrid SuperCar Designs Using Ultracapacitors," preprint of paper to be presented at 30th IECEC Conference, August
1995.62M. Ross and W. Wu, "Fuel Economy of a Hybrid Car Based On a Buffered Fuel: Engine Operating at its Optimal Point,” SAE paper 95000,”
February 1995.63Lovins, et al., see footnote 47.
184
●
●
●
●
●
Car weight (total) would be 580 to 400 kg, less than half of what is estimated by OTA even with carbonfiber construction.
Drag co-efficients are reduced to 0.14 to 0.10, about half the best levels forecast by OTA.
Switched reluctance motors that drive the wheels directly are assumed to have an average efficiency overthe EPA test cycle of 93 percent. This is an unusally high average value for a motor.
Accessory loads on the engine would be reduced to zero.
Regenerative braking efficiency is assumed to have very high (>75%) recovery of inertia losses.
If these input assumptions were used by OTA in our analysis, we would obtain fuel economylevels of over 100 mpg. However, the above analysis does not specify the size and power of themotors or engine, and it is unclear what such a vehicle’s performance would be with any payload.
Aside from theoretical analyses, some actual hybrid vehicles have been built and tested. Forexample, a number of series hybrid vehicles have been developed by universities. These vehicleshave been reported to have achieved high fuel efficiencies, but OTA’s examination of the actualdata showed that the efficiencies achieved were not unusually high. At a constant speed (40 to 50mph), the best car showed about 60 mpg, while many cars achieved 20 mpg or lower. The bestseries hybrid vehicle (Michigan State) was a converted Ford Escort that had low performancerelative to our benchmark of 50 kW per ton of weight plus payload; its power rating was only22.8 kW per ton, implying that it had less than half the power level required to be equivalent to anaverage car in today’s fleet.64 In addition, the constant speed 40 mph mode is one where even aconventional Escort can attain 50 mpg (the Escort’s highway fuel economy on the EPA test isover 45 mpg) while providing much better performance. Rather than proving the potential forhigh fuel economy, these early hybrid demonstrations have shown how difficult it is to gainany benefit in fuel economy from shifting to a hybrid drivetrain.
Parallel Hybrids
In a parallel hybrid, both the engine and the motor can drive the wheels. The close couplingbetween engine and motor duty cycles makes the parallel hybrid difficult to analyze without adetailed simulation model that computes efficiencies as a function of operating speed/load foreach of the two prime movers. Conceptually, however, the general strategy of a parallel hybrid isto downsize the engine, so that the maximum power requirement of the vehicle is satisfied byhaving both engine and motor operate simultaneously. The motor size required in a parallel hybridis much smaller than that required in a series hybrid, because in the latter, the motor is the onlysource of power driving the wheels.
185
1
2%
There are two possible operating strategies for a parallel hybrid:
Use the electric motor for base (light) loads, while using the engine to provide power at higherloads. Depending on vehicle load requirements, the engine is turned on and off.
Use the engine for the light load and the electric motor for short-term peak loads. In this case,the engine operates steadily.
VW has chosen the first approach, and has used a small electric motor with 9 kW peak output toaid a diesel or gasoline engine. The motor is used exclusively at all loads below 7 kW,corresponding to a cruise speed of 40 mph on a level road; the engine is started instantaneouslywhen more power is needed. This vehicle, based on the VW Golf, consumes 2.8 litres of dieselper 100 km, and 15.8 kWh of electric power, on the FTP urban cycle. 65 If the electricity weregenerated (for example) at 34 percent energy efficiency at the wall plug from primary fuel thehybrid would have a fuel consumption of 4.05 litres/100 km diesel equivalent, which is 35.8percent better fuel economy than the conventional Golf diesel.
.Project staff had an opportunity to drive the hybrid Golf, and the impression was that the
vehicle behaved quite differently (uncomfortably so) from a conventional auto. In particular, thetransitions between electric motor operation and engine operation during city driving weredisconcerting, although this impression may disappear with driving experience or with a moreadvanced design. For this type of vehicle, the diesel is the more suitable engine because its hotrestart occurs in half a revolution of the engine, whereas hot restart on a gasoline engine is slowerand could have significant emission penalties. With a diesel engine, however, emissions over thedriving cycle are reduced significantly. It seems possible that a diesel-based parallel hybridusing this operating strategy might be capable of meeting the ultralow emission vehicle(ULEV) standard.
In the second type of strategy, where the ICE is on continuously (except possibly at idle, whereit could be turned off) and the electric motor is used for peak loads, most of the fuel economygains are associated with engine downsizing, at least on the FTP cycle, where hard accelerationsare not required. For a “type 2“ parallel hybrid, the electric motor power and battery storagecapacity are relatively small; coupled with the smaller engine, the overall vehicle weight shoulddecrease.
Two alternative specifications for mid-size parallel hybrid vehicles that provide near equalperformance (at speeds below 70 mph) to the baseline vehicle are shown in Table 4-14. The firsthybrid uses a 2.0-litre engine and a flywheel for energy storage, while the second uses a 1.0 litreengine with a battery for energy storage. Either type of strategy can be incorporated with bothhybrid vehicles. The type 2 strategy of using the engine for peak loads could provide fueleconomy gains of approximately 25 to 30 percent in the first vehicle, and 30 to 35 percentin the second, compared with equivalent vehicles with conventional drivetrains. However,drivability and hot restart problems (with a gasoline engine) with these configurationscould be daunting. The fuel economy gains are estimated to be half as much using a type 2
186

strategy where the engine is on all the time; however, emissions and drivability for the type2 hybrid should be much easier to perfect. The type 2 hybrid may make more sense ifsimplicity, reliability, and low cost are more important than attaining maximum fueleconomy.
The percentage changes in fuel economy should be generally applicable to all size classesexamined, given the inaccuracies inherent in our simple methodology. Available data from existingsimulations provided by Chrysler66 are consistent with the estimates provided above.
Data from parallel hybrid vehicles in the most recent “HEV challenge” were also examined. It isinteresting to note that the winning cars in this event have almost always used a parallel design,and series hybrids have fared poorly. The University of California at Davis achieved the best fueleconomy (by far) in the road rally segment. Its vehicle used only 0.45 gallons of gasoline and8.51 kwh of electricity to cover 134.86 km67--a “gasoline equivalent” fuel economy of 69.32mpg if the electricity generation efficiency is about 34 percent. Although this is an impressiveattainment for a student competition, this is not a uniquely high fuel economy (severalconventional vehicles attain equivalent fuel economy on the EPA highway test), and the vehicleitself is limited in its capabilities. The vehicle is basically an EV with a small engine that isstarted only when the battery is discharged by over 50 percent or when the vehicle is travelingfaster than 70 mph. Range as a pure EV is 60 miles, and about 180 miles as a hybrid withavailable battery power; after 180 miles, the battery must be recharged or the vehicle can limphome powered only by the engine, which produces 15 kW (20 hp). Although the vehicle’s totalpower output with fully charged battery and engine available is 60 kW (which provides almostexactly 50 kW/ton of peak power for acceleration68), the power drops off once the battery isdepleted to 50 percent DoD. Hence, vehicles such at the UCDavis hybrid demonstrate thathigh levels of fuel economy can be obtained while overcoming some of the range limitationsof pure EVs--but these vehicles are far from the “full capability” hybrids that OTAexamines in this report.
Prices
Prices for the series and parallel hybrids were computedemployed for EVs. Battery costs and motor costs areestimates. The generator is assumed to be less expensive
using a methodology similar to the oneidentical to those used for EV costthan the motor owing to its restricted
speed range, and we have estimated costs at $25/kWh (peak). Ultracapacitor and flywheel costsare as outlined in chapter 3 and are DOE goals rather than real cost estimates. Investments wereestimated at $200 million (incremental) for an HEV facility designed to produce 100,000vehicles/year.
66Chrysler, presentation to OTA, September 8, 1994.67E. Chattot et al., "The Continuing Development of a Charge Depletion HEV, Aftershock, at UC-Davis”, SAE Paper 95000.68Actually, a parallel hybrid will require greater 50 kW/ton of available peak power to match OTA’s power requirement, because part of the
power for peak acceleration is provided by the vehicle’s electric motor, at 50 kW/ton required and part by the engine, at 60 kW/ton required.
187
Incremental prices (relative to the advanced conventional vehicles) for the mid-size seriesHEVs are as shown in table 4-15, for the different energy storage devices. The bipolar lead acidbattery is the cheapest solution, as both flywheel and ultracapacitor are relatively expensive forenergy storage, which becomes a limiting constraint in our analysis. By 2015, costs are very lowbecause large cost savings are realized from eliminating the advanced DISC engine andcontinuously variable transmission (CVT).69 The subcompact car price will increase by about 80percent of the costs shown above, compact vans by 110 percent, and standard pickups by 140percent.
Prices for parallel hybrids are only slightly lower than those for a series hybrid, but OTA didnot estimate them in as much detail. Costs are lowered for the Case 1 type hybrid owing to theabsence of a separate generator, and the use of a small flywheel energy storage system, but areincreased by the need for a larger engine and transmission. In Case 2, the engine size is similar tothat of the series hybrid, as is the battery size. The motor is smaller, and the vehicle does not needa separate generator, but this is partially offset as a transmission is not eliminated. Hence, weexpect costs to be similar to that for a series hybrid, but they may be slightly lower depending onthe specific strategies chosen. The same scaling laws should apply for the different classes withinthe range of accuracy of this analysis.
FUEL CELL VEHICLES
Two types of fuel cells are considered in this section, the zinc air cell and the proton exchangemembrane (PEM) cell fueled with methanol. The zinc air cell is very much like a high specificenergy/low specific power battery, so that all of the equations derived for EVs (see appendix A)are directly applicable. The PEM/methanol fuel cell is power limited, not energy limited, because aregular gasoline tank size can carry enough methanol for a range of over 300 miles. Hence, PEMceils can be sized according to requirements for short-term peak power (that is, rapidaccelerations) or maximum continuous power (long hill climbs). In the latter case, thePEM/methanol cell will require additional electric storage in the form of a flywheel, battery, orultracapacitor to provide an occasional power boost, and this combination is sometimes called afuel cell hybrid.
The zinc-air fuel cell has a high specific energy of over 200 Wh/kg, but a low specific power ofless than 100 W/kg. The vehicle power requirements demand either a very large fuel cell, or asmaller cell coupled with a peak power device such as an ultracapacitor or flywheel. As is true ofthe hybrid vehicle, the issue of ultracapacitor sizing for repeatability of acceleration performanceis an important consideration. A second consideration is the 6 percent grade-climb requirement,which defines the continuous power requirement of 30 kW/ton. Because the zinc air cell has sucha low specific power, the cell weight needed to provide even the continuous power requirement istoo high, and the cell too expensive, for commercial viability in 1995 and 2005. However, the
69The benefits of the DISC engine are essentially negated by the series hybrid configuration, since the engine operates close to its moat efficient
point at all times, and the DISC technology improves part load efficiency. Consequently, a less expensive engine will give the same efficiency. Thetransmission is not needed in the hybrid configuration.
188
reductions in vehicle body weight by 2015 make it possible to meet the 6 percent grade climbrequirement with a zinc-air cell of reasonable size.
OTA’s analysis shows that the (mechanically recharged) zinc-air fuel ceil can provide a 200-mile range and reasonable performance--but not the capability for a sustained 60 mph, 6 percenthill climb--for a car (subcompact) price increment of less than $10,000 in 2005 (see table 4-16).This, of course assumes that a zinc reprocessing infrastructure is developed. The zinc-air system’sinability to sustain the 6 percent grade climb specified for EVs, however, implies that a directcomparison with a battery-powered EV would be unfair. The zinc-air fuel cell becomes even morecost effective with incremental prices in the range of $8,700 to $11,900 for cars and $13,000 to$19,000 for trucks by 2015, while providing a 200-mile range and being able to sustain a 6percent grade climb.
The zinc-air fuel cell or battery is “recharged” by mechanically replacing the electrolyte and zincanodes, so that a zinc refueling infrastructure must be developed; no estimate of the refuelinginfrastructure costs and zinc reprocessing facility requirements are included here. The vehicleenergy consumption estimates shown in table 4-16, however, take into account the electric energyefficiency of the zinc-processing facility.
Use of zinc-air fuel cell vehicles may be limited from a practical standpoint to commercial,centrally fueled fleets. It is not clear that the cells can be “topped off, ” which makes their rangelimitations onerous for private users. Moreover, the air handling systems that scrub intake air freeof carbon dioxide may require frequent maintenance, which is impractical for such users.
In evaluating PEM fuel cell vehicles, we have assumed that the fuel cell can be packaged to fitinto a car without interfering with passenger or trunk space. Such an assumption is necessarysince current fuel cells, even those powered by hydrogen, are quite large in volume.
OTA does not expect that a PEM fuel cell for light-duty vehicles can be commercializedby 2005. The vehicle evaluated for 2015 uses a fuel cell sized to provide the continuous powerrequirement of 30 kW/ton, while ultracapacitors or batteries are used to provide peak powerrequirements of 50 kW/ton. Fuel cells attain maximum efficiency at about 40 to 50 percent ofmaximum power, so that the most efficient operating strategy is to operate much as an engine-powered hybrid that operates near its optimum bsfc point, unless high continuous power isrequired. Two vehicles are examined, one using a semi-bipolar lead acid battery for peak powerand cold-start energy storage, and the second using an ultracapacitor; in both cases, bodymaterials, aerodynamics, and rolling resistance correspond to the 2015 (m) scenario for vehicletechnology.
Table 4-16 shows the results for a mid-size car, for the two cases. The ultracapacitor is sized toprovide about one minute of peak-power availability and is, therefore, energy storage limited.Nevertheless, the two scenarios provide nearly equivalent results in all areas except one--thebattery offers superior range as an EV or in cold-start conditions. Costs are highly dependent onthe fuel cell/reformer cost. At $650 per kW for the combination, the incremental RPE for the fuelcell vehicle over a 2015(m) conventional mid-size vehicle is close to $40,000. Even at $65/kW,the incremental price is $4,500 to $5,000. Fuel economy has increased to the low 80 mpg range ingasoline equivalent terms. This is in line with the fact that a methanol-PEM cell is not substantially
189
. . -
.,
more efficient than an advanced ICE, gasoline or diesel, at its best operating point, so the fueleconomy figures for hybrids are relatively similar whichever prime mover is used.
CONCLUSIONS ABOUT PERFORMANCE AND PURCHASE PRICE
Detailed analysis of potential improvements in fuel economy for a range of vehicle sizesindicates that, in percentage terms, similar levels of increases can be expected for the differentvehicle sizes, if the same kind of efficiency improvements are added. Using a mid-size car as anexample, and holding its space, acceleration performance, and other comfort features constant at1995 levels, it appears likely that a fuel efficiency level of about 53 mpg with a gasoline ICE, or59 mpg with an advanced diesel engine can be attained in the year 2015 by using a combination ofadvanced engine technology, improved materials and structural design, better aerodynamic design,and improved tires. Such vehicles would cost $2,500 to $3,000 (in constant 1994 dollars) morethan a current mid-size vehicle. If very optimistic estimates are used for technology, an additional10 mpg may be available, but costs may increase to over $6,000, largely owing to thishypothetical vehicle’s carbon-fiber construction. OTA is somewhat skeptical that mass-producedcarbon-fiber auto bodies will be practical in this time frame.
A mid-size electric vehicle would not have the same range capability but could be designed tomatch a conventional mid-size vehicle’s performance and other attributes. Such a vehicle involume production could cost as little as $2,600 over the 53 mpg advanced conventional vehicle,if powered by advanced lead acid batteries, and have a range of 80 miles. If nickel metal hydridebatteries can be produced cheaply ($180/kWh), an electric vehicle using them would be muchlighter, and have a range of 100 miles at about the same additional cost as a lead acid battery-powered vehicle. Many observers believe that actual costs of the nickel metal hydride battery willbe twice as high as the most optimistic estimate, causing incremental vehicle price to about$8,800. There is also the possibility of a 300-mile-range EV if lithium polymer batteries aresuccessfully manufactured, and such a mid-size EV could potentially be made for about $10,000more than the 53 mpg advanced mid-size car. EV prices are quite sensitive to range orperformance assumptions, or both, so that relaxing the requirement to match conventional vehicleperformance characteristics can reduce EV prices. In particular, reducing range requirements willsharply reduce EV prices.
Hybrid vehicles offer the range of a conventional vehicle with potentially superior fuel economyand the ability to operate as an electric vehicle with limited range. OTA chose to analyze onlyautonomous hybrids--that is, vehicles that recharge their electrical storage systems through theirprime mover (engine, fuel cell), not from an external source (e.g., the utility grid). Autonomoushybrids will be fuel efficient only if a good high-power storage medium (with specific power>400 W/kg) is available that can be charged and discharged with high efficiency. No suchmedium exists now, but there are numerous potential candidates under development much as thebipolar battery, ultracapacitor and flywheel. OTA’s analysis shows that a hybrid mid-size car withbasically the same performance capability as a current mid-size vehicle can attain about 65 mpgusing a battery, and about 72 mpg using an ultracapacitor or flywheel in 2015, using bodytechnology similar to the 2015 advanced conventional mid-size car. Cost is estimated at about$3,200 over the 2015 advanced conventional vehicle, if a battery is used, and about $6,000 to
190
$8,000 more if an ultracapacitor or flywheel is used. The battery version is preferable becausesuch a hybrid can be operated as an EV with a range of 25 to 30 miles, compared with five mileswith an ultracapacitor, or 10 miles with a flywheel. When not operated as an EV, a hybrid vehiclemay not have any emissions advantage over the advanced conventional vehicle.
OTA estimates that a PEM fuel cell hybrid vehicle, using hydrogen from methanol reformedonboard, could attain a fuel economy of about 80 mpg, if its structural and other characteristicsmatched the 2015 advanced conventional vehicle. Such a vehicle probably could not becommercialized in a mass-market vehicle before 2015 or so. Currently, the PEM fuel cell’s powerdensity and cost are ill-suited to a light-duty vehicle, and considerable improvements are required.If fuel-cell costs decrease by one order of magnitude from current levels, a mid-size car poweredby a PEM fuel cell/battery hybrid drivetrain could be available for about $39,000 over anadvanced conventional vehicle in 2015. If costs came down by twO orders of magnitude, thevehicle price increment could decrease to less than $5,000, but the potential for such largedecreases is highly uncertain. Even if such price decreases were possible, the marginal fueleconomy benefit over an ICE hybrid is small--the fuel cell vehicle’s zero emission potentialappears to be its primary value.
LIFECYCLE COSTS
Cost and price analyses in this report have focused primarily on vehicle purchase price.Although vehicle purchasers have tended to weigh initial purchase price extremely heavily in theirbuying decisions, there are strong reasons to examine differences in operating and maintenance(O&M) costs, as well as differences in trade-in value or vehicle longevity, or both, in attemptingto measure the commercial potential of advanced vehicles. First, there iS evidence that manyvehicle purchasers strongly consider lifecycle costs in choosing vehicles. For example, diesel-powered vehicles traditionally have been more expensive and less powerful than otherwise-identical gasoline vehicles, but diesels are extremely popular in Europe because of their lowermaintenance costs, greater longevity, and lower fuel costs. Similarly, they enjoyed a period ofpopularity in the United States when diesel fuel prices were below gasoline prices and publicconcern about oil prices was high. Second, differences in O&M costs among the alternativevehicles examined here are likely to be much larger than the differences among current vehiclealternatives. For example, the limited lifespan of the batteries in EVs and HEVs and their highcosts imply that owners of these vehicles must contend with one or more payments of thousandsof dollars for battery replacement during their vehicle’s lifetime. Also, there are sharp differencesin “per unit of energy” prices for the various fuels--gasoline, diesel, electricity, methanol, andhydrogen--considered here, which, coupled with substantial differences in fuel efficiency, willcause overall fuel charges for the different vehicles to vary considerably.
A few simple calculations show how a higher vehicle purchase price may be offset by lowerO&M costs or longer vehicle lifetime. Assuming a 10 percent interest rate and 10-year vehiclelifetime, a $1,000 increase in purchase price would be offset by a $169/year reduction in O&Mcosts. Similarly, an increase in vehicle price of about 25 percent--such as from $20,000 to$25,000--would be offset by an increase in longevity of five years, assuming the less expensivevehicle would last 10 years.
191
In OTA’s analysis, the alternative vehicles are essentially identical in size, aerodynamiccharacteristics, 70 body material and design, tire characteristics, and types of accessories.Consequently, the primary physical differences among the different vehicles are powertraincomponents (engine, transmission, electric motors and controllers, energy storage devices, andany peak-power devices), some differences in accessories depending on availability of waste heat,and any differences in body structure, suspension system, and tires caused by differences inpowertrain weight.
Based on these differences among the vehicles, corresponding differences in operation andmaintenance costs are likely to arise primarily from:
. battery replacement costs,
. differences in maintenance costs between electric drivetrains and ICE drivetrains,
. differences in longevity between electric and ICE drivetrains, and
. differences in energy costs.
Battery Replacement Costs
A battery for a mid-size EV with significant range (80 miles or longer) can cost $10,000 atretail, and the high-power density battery a hybrid vehicle would use is likely to cost at least a fewthousand dollars. Although the long-term PNGV goal for battery lifetime is 10 years, no currentEV battery has yet demonstrated a life of five years. If EV and hybrid batteries do not last thelifetime of the car--which seems likely--the substantial expense of battery replacement will play aweighty role in lifecycle O&M costs.
Differences in Maintenance Costs and Longevity Between EV and ICE Drivetrains
There is a widespread belief among analysts that electric drivetrains will prove to besubstantially more robust than ICE drivetrains, requiring less maintenance and lasting longer.OTA’s interviewees in the industry readily agreed that maintenance costs (both scheduled andunscheduled) would be lower in vehicles. with electric drivetrains. This view is based onexperience with EVs in Europe and elsewhere and extrapolation of the characteristics ofdrivetrain components in other settings, such as electric motor use in factories. The value of thisexperience as a predictor of future performance may be compromised somewhat, however, by thesubstantial differences in component characteristics between future electric vehicles and currentand older vehicles (e.g., future electric motors will be much lighter), and the harsh environmentthat EV and HEV components must endure (unlike a factory environment). Also, low EV
70In reality, there would likely be differences in aerodynamics among the different types of vehicles. The drivetrain differences might allow more
or less flexibility in aerodynamic design depending on cooling requirement and the ability, or lack of it to use conformal shapes for energy storage
and for the basic power system.
192
maintenance will be achieved only if the power electronics, sensing, and computer control systemsin these vehicles (which may be more extensive than in conventional vehicles) are relativelymaintenance-free--not a foregone conclusion. Finally, many of the batteries that are candidates forEVs are not sealed and maintenance-free.
Maintenance costs for ICEVs typically are low for scheduled maintenance, on average about$100/year for the first 10 years 71; unscheduled72 costs may be closer to $400/year for that timeperiod. 73 These costs maybe changing with technological change, however. Engines and emissioncontrol systems are becoming more complex, incorporating monitoring and control of moreparameters (e.g., valve timing) and adding components such as additional catalytic converters forcontrolling cold-start emissions. New engines now being introduced into the market, however, donot require tuneups for 100,000 miles and generally have fewer parts than the engines theyreplace; in addition, automakers are succeeding in improving quality control to the point that theycan offer extended warranties for up to 100,000 miles at real costs (to them) of only a fewhundred dollars.
Because hybrid vehicles (HEVs) combine elements of ICE and electric drivetrains, cleardifferences in maintenance costs between ICEVs and HEVs are more difficult to predict. Serieshybrids, which have no multispeed transmission, are less complex than parallel hybrids and mayretain some maintenance advantages over ICEVs. This potential advantage will depend onwhether the smaller engines in series hybrids, with limited speed ranges and gentler load changeswithin these ranges, will require substantially less maintenance than conventional ICES; whichseems likely. On the other hand, parallel hybrids may enjoy no clear advantages, or may havehigher maintenance requirements, because they retain an engine and transmission and add acomplete electric drivetrain.
Fuel cell vehicles (FCEVs) are basically EVs with the fuel cell stack and hydrogen storagesystem or methanol reformer (with methanol fuel system) substituting for the larger EV battery,or hybrids with the fuel cell/fuel system providing the base power and a battery, flywheel, or otherstorage device providing peaking power and cold start capability. Fuel cells have fewer movingparts and a less severe operating environment than ICES, and some analysts have concluded thatfuel cells will require little maintenance. One analyst, for example, estimates that fuel cell stackswill cost less than $40/yr to maintain.74 It appears premature, however, to draw such conclusions.The fuel cells considered here have a fairly complex “balance of plant,” and a methanol reformer,with required gas cleanup to avoid poisoning the fuel cell’s catalysts, will be similarly complex.Problems such as oxidation of the graphite cathode and deterioration of membranes must besolved. Further, vehicle designers may make tradeoffs--for example, choosing lower qualitymembranes to reduce first cost--that might add to fuel cell maintenance requirements.
71Maintenance costs will be higher if owners follow the dealers recommended maintenance schedules, which typically call for much more
ded by owner's manual. maintenance than recommen7 2 C o s t s cannot be scheduled even if they are regular, e.g., brake repairs.73M. Delucchi, University of California at Davis, Hydrogen Fuel Cell Vehicles, UCD-ITS-RR-92-14, September 1992, table B-3.74Ibid. Delucchi estimates that the annual levelized maintenance costs of mid-size FCEVs will be $390, compared to $430 for EVs and $520 for
ICEVs.
193
Differences in longevity between conventional ICEVs and advanced vehicles depend on boththe longevity of the alternative drivetrains and the importance of drivetrain deterioration in futuredecisions about vehicle scrappage. It is not really clear that, for the vehicles analyzed here,drivetrain condition is likely to be a critical determinant of scrappage decisions. For example,although material shifts in vehicle skins and structures should improve the longevity of thesecomponents, deterioration of body parts may still remain a problem. Vehicles will either havealuminum or composite-based skins and structures, or their steel equivalents will likely haveexcellent weathering characteristics to compete with these materials. Manufacturers ofcomposites, however, must solve some problems of delaminating that have occurred in aircraft,and even aluminum oxidizes, albeit slowly. There have been some legitimate concerns about therepairability of aluminum and composites, which raise the possibility that moderate accidents--anot-infrequent occurrence--could lead to early retirement of future vehicles. This is extremelyunlikely, however, as materials that are not easily repaired will not be commercially successful.
Delucchi estimates that the average lifetime of EVs and FCEVs will be about one-third longerthan ICEVs--160,000 miles compared to 120,000 miles.75 This differential seems possible but notcompelling; the level of uncertainty is, again, extremely high. As for ICE-powered hybrids, theadded complexity coupled with reduced stress on the engine might best be interpreted as implyingthat vehicle longevity may be similar to that of the conventional ICEV, and possibly even shorter.
Trade-In Value
Automotive marketers pay significant attention to trade-in value in their advertising campaignswhen the vehicles being promoted have values that are sharply higher than fleet averages. Thisattention implies that the industry believes that expected trade-in value is an important element ofpurchase decisions--not surprising considering the comparatively short periods that the averagevehicle remains in the hands of its first owner.
Over the long term, when advanced technology vehicles become commercially accepted andwidespread in the fleet, and technologies become relatively mature, there should be littledifference in patterns of trade-in values among alternative vehicle types, except as a direct resultof different expected vehicle lifetimes. There is a good chance, however, that trade-in values foradvanced vehicles will fall short of fleet averages for a number of years for two reasons:
●
●
�
Many early vehicles will serve niche markets; the buyer pool for used vehicles would then be limited,depressing prices;
For a number of years following commercialization, innovation of drivetrain technologies should berapid, making older vehicles less attractive in comparison.
194
Energy Costs
Differences in energy prices coupled with differences in energy efficiency will yield somesignificant differences among alternative annualized energy costs of the different vehicles.
OTA has assumed a baseline retail price of gasoline of $1.50/gallon (in 1995 dollars) in 2015.This choice is somewhat arbitrary, but reflects a future of relatively plentiful supplies of oil, withpressures generated by sharply higher worldwide vehicle populations alleviated by continuedadvances in oilfield technologies, some use of alternative transportation fuels, 76 and widespreadavailability of nonoil fuels (including nuclear and other nonfossil sources) for power generation. 77
The series of vehicles evaluated in this report for 2015, their fuel consumption, and yearly fuelcosts (based on 10,000 miles per year, 7 cents/kWh offpeak electricity, $.75 per gallonmethanol 78) are shown in table 4-17.
At the assumed prices of fuels and electricity, the relative advantage in fuel costs of movingbeyond the 53 mpg advanced conventional vehicle is relatively small, about $200/year in the bestcase (EV with Ni-MH batteries). This conclusion would change substantially, of course, withhigher gasoline prices and lower electricity prices. At European gasoline price levels of$4.00/gallon and electricity prices of 5 cents/kWh, the owner of the advanced conventionalvehicle would pay nearly $800/year more than the owner of the Ni-MH-powered EV, and about$730/year more than the owner of the lead acid-powered EV.
Conclusions
If advanced vehicles yield substantial savings over conventional vehicles in O&M costs, andalso last significantly longer, they will be cost-effective even if their initial purchase price is a fewthousand dollars greater than conventional vehicles. Although experts contacted by OTAgenerally agree that electric drivetrains should experience lower maintenance costs and last longerthan ICE drivetrains, the magnitude of savings is difficult to gauge because of continuingimprovements in ICE drivetrains and the likelihood that future electric drivetrains will undergoprofound changes from those of today. Further, battery replacement costs could overwhelm othersavings, although this, too, will be uncertain until battery development matures. Finally, vehicleswith hybrid drivetrains may experience no O&M savings because of their complexity; and,although analysts have claimed that fuel cell vehicles will be low maintenance and long-lived,79 thevery early development state of PEM cells demands caution in such assessments, and there is littleobvious basis for them.
76Obviously, the relative success of advanced technologies for light-duty vehicles, including EVs, could begin to play a depressing role in oil
prices by 2015, although this role might primarily be anticipatory (that is, giving buyers a psychological advantage over sellers) rather than physical
(depressing oil demand) at this relatively early date.77The choice has evoked reactions from study reviewers ranging from indifference (presumably acceptance) to sharp disagreement, with most of
the disagreement from those who foresee much higher oil prices in this time frame.
195
Unless gasoline prices eventually increase substantially, any energy savings associated withlower fuel use or a shift to electricity will provide only a moderate offset against high purchaseprice--primarily because annual fuel costs are not high in efficient conventional vehicles. In themid-size vehicles OTA examined for 2015, for $1.50/gallon gasoline, the maximum savings(NiMH battery-powered EV versus baseline vehicle) would offset about $2,300 in higherpurchase price for the EV.80 OTA expects the Ni-MH EV to cost about $10,000 more than thebaseline vehicle, although the sharp reductions in cost projected by one battery developer--Ovonics--would reduce this to about $4,000.
SAFETY OF LIGHTWEIGHT VEHICLES
Although some of the vehicles examined by OTA will weigh as much or more than currentconventional vehicles, many will weigh substantially less. For example, the advanced conventionalvehicles in the year 2015 will weigh approximately 30 to 40 percent less than current conventionalvehicles. In other words, a mid-size car with a current weight of 3,250 pounds conceivably couldweigh less than 2,000 pounds in 2015, if maximum weight reductions are sought.
Strong concerns about vehicle safety would likely accompany such dramatic weight reductions.Weight reductions of lesser magnitude have been associated in the past with significant increasesin fatality and injury rates in the U.S. fleet; the National Highway Traffic Safety Administration(NHTSA) concluded that changes in the size and weight composition of the new car fleet from1970 to 198281 “resulted in increases of nearly 2,000 fatalities and 20,000 serious injuries peryear” 82 over the number that would have occurred had there been no downsizing occurred.Moreover, during the early 1990s, the congressional debate on proposed new fuel economystandards was strongly influenced by claims and counterclaims about the potential adverse effectson vehicle safety of size and weight reductions that supposedly would be forced by the standards.It would be surprising if future attempts to speed the commercialization of these lighter weightdesigns were not accompanied by a renewal of the safety debate.
Much of the “accepted wisdom” of automotive safety comes from the statistical analysis of thenation’s database on automobile accidents, especially from the Fatal Accident Reporting Systemand other government data repositories. Unfortunately, attempts to determine the impact ofweight reduction on car safety suffer from the close association of vehicle weight with wheelbaseand other size measures (including the amount of crush space) that also impact safety. In other
78We have assumed that methanol price, including highway taxes, will approximate the energy-equivalent price of gasoline, for competitive
reasons. The imposition of taxes equivalent to gasoline’s tax burden yields a methanol price net of taxes of about 50¢/gallom which is low by today’s
standards.79Delucchi, see footnote 73.80For a 10 percent discount rate, assumed 10-year vehicle lifetime. This calculation assumes near constant miles driven over time for the new
vehicles. Historically, vehicles tend to be driven most when they are new, with mileage dropping off quite rapidly as they age. Were these vehicles to
fit the historic pattern, our calculation of a $2,300 offset would be much too low because in a discount calculation, early savings count more than laterones, and the more efficient vehicle would save more money on energy in its first few years than it did in later years. However, the increasing
reliability and longevity of modern vehicles appears likely to shift annual driving patterns in the direction of more uniform mileage overtime.81For new cars involved in fatal collisions, median curb weight shrank by 1,000 lbs, wheelbase by 10 inches, and track width by 2 to 3 inches.82U.S.. . Department of Transportation National Highway Traffic Safety Administration, ‘Effect of Car Size on Fatality and Injury Risk,” 1990.
196
words, analysts often have a hard time determining whether it is weight or size (or even someother measure) that is the primary determinant of safety, because large cars are usually heavy cars,and small cars are usually light. One analysis concluded that weight was the more important factorin vehicle safety.83 This conclusion has been disputed by others, who claim that extremelylightweight vehicles can be made as safe as heavier ones.
The Role of Weight in Accident Prevention and Crashworthiness
An examination of the role that vehicles play in maintaining occupant safety can be instructivein determining the potential impact of sharp weight reductions. The vehicle must do the following:
1
2
3
4
5.
Aid the driver in keeping the vehicle on the roadway.
If the vehicle leaves the roadway, avoid a rollover.
In a crash, absorb crash forces in such a way that no intrusion of the passenger compartmentoccurs.
Also, control the deceleration of the vehicle so that it occurs in as uniform a way as possible,over as long a crush distance84 as possible.
Finally, prevent the passenger from crashing against interior surfaces and/or minimize damage ifhe does, prevent ejection of the passenger, and control the way deceleration forces affect thepassenger.
Weight plays a different role in each of these vehicle tasks. In (l), weight may be protective inkeeping vehicles from being adversely affected by crosswinds, but directional stability andhandling are affected far more by wheelbase, suspension, and steering system design, tire designand maintenance, and other nonweight-related factors.
In (2), rollover can be weight-related because in lightweight cars, the payload will have agreater effect on the height of the center-of-gravity than it will in heavier cars. This effect maybepositive or negative depending on vehicle design, and specifically on the location of the payloadvis-à-vis the location of the empty vehicle’s center-of-gravity. However, rollover propensity isprimarily a function of wheelbase, track width, suspension design, and overall vehicle design; asmall increase in track width can compensate for any increase in rollover propensity that mightoccur from “lightweighting” a vehicle.
In (3) and (4), the role of weight is complex. The ability of the vehicle structure to controlcrash forces and prevent penetration of the passenger space for a given set of forces on thevehicle is dependent on vehicle design and the strength, rigidity, and deformation characteristicsof the structure--not specifically on weight. Thus, it would appear at first glance that substitution
of stronger materials, or materials with better energy absorption characteristics, should allowweight reduction without compromising a vehicle’s crashworthiness, or even with an improvementin crashworthiness, with proper design. In virtually all accidents, however, vehicle weight doesplay an important role, because it determines the forces on the vehicles and their relativedecelerations.
In a head-on collision between two vehicles of different weights but identical designs, theheavier vehicle will drive the lighter one backward, and the passengers in the lighter car willexperience higher decelerations. The precise balance of forces depends on how the car structurescollapse. If the heavier car is twice the weight of the lighter one, if they collide head-on while eachtraveling at 30 mph and become entangled, the law of conservation of momentum dictates that theheavier car would end up traveling 10 mph in the same direction it was going, while the lighter carwould wind up going backward at 10 mph. The change in speed of the lighter car (30+10, or 40mph) would be twice that of the heavier one (30-10, or 20 mph). Because deceleration isproportional to the change in velocity divided by the amount of time the velocity change requires,the passengers in the lighter car would experience about twice the deceleration experienced by thepassengers in the heavier car. Consequently, passengers in light cars are at increased danger inmulti-vehicle collisions. Although a widespread shift to lighter vehicles will eventually lessen thedanger by reducing each vehicle’s exposure to heavier vehicles, the continued existence of freight-carrying vehicles on roadways would prevent this problem from being cancelled out.
Light vehicles are also at a disadvantage in collisions with deformable obstacles. Decelerationforces on passengers are directly proportional to the distance they travel during the deceleration--this distance is the sum of the few inches an airbag may allow them to move forward, the foot orso that the front end of the vehicle will crush in a controlled, relatively uniform manner, 85 and anydistance that the obstacle deforms. Because a heavier car will cause a larger deformation in anobstacle than a lighter car (all else being equal), the distance of deceleration will be greater for theheavier car--and the deceleration forces on the passengers will be smaller. This difference could bedramatic, if the heavier car actually knocks over the obstacle (e.g., a collapsible light post or atree) and the lighter car is stopped by it.
This issue has great importance to the design of the many thousands of manmade roadsideobjects--e. g., signposts, lampposts, cable boxes, and crash barriers--that can either pose hazardsor play a protective role to vehicles that have left the road. Current designs for these objects aimat directing vehicles to safety or at breaking away in high-energy collisions. The existing array ofroadside objects, however, have been designed for the current and past fleet, and may posesignificant dangers to lightweight vehicles. In-fact, the fleet downsizing that followed the 1972 oilembargo encountered significant problems with breakaway designs formulated for the pre-1972fleet, 86 and these problems could easily be repeated with another round of fleet lightweighting,unless significant planning is accomplished and capital investments are made.
Weight plays a role even in two-vehicle collisions where the weights of the vehicles are similar,or in collisions into rigid, impenetrable barriers. In such collisions, the vehicles’ front structures
85 Vehicle structures cannot collapse in a completely uniform manner, so that deceleration-and deceleration forces on passengers-varies over the
brief period of the crash. . ,"Emerging Roadside Safety Issues,” TR News, vol. 177, March-April 1995.
198
must absorb all of the initial kinetic energy of the vehicles. Since kinetic energy is proportional tomass, heavier vehicle(s) must absorb more impact energy than lighter vehicles in the same types ofcrash. This has both positive and negative implications. First, assume that the differences betweenthe heavy and light vehicles are differences in materials and design, and that their bodies areequally stiff and strong. Given the higher forces, the heavier vehicles will experience a greaterdepth of crush and greater crash duration, yielding reduced deceleration forces on theirpassengers--a substantial benefit. The heavier vehicles, however, may run a somewhat greater riskof intrusion into the passenger compartment, if the accidents are unusually severe. Althoughmaking the front end of lighter vehicles less stiff would address part of this problem, this wouldleave these vehicles more vulnerable in accidents involving heavier vehicles and higher speeds, andmight adversely affect handling characteristics.
Finally, in (5), the design of passenger restraint systems and the interior space itself is thecritical factor, although an unrestrained passenger will crash against the interior with a velocitythat is dependent on the velocity change of the vehicle--which is weight-related in a multiple-vehicle collision.
What Accident Statistics Tell Us
Safety analysts have exhaustively studied accident statistics to gain a better understanding ofthe relative roles of various vehicle characteristics in passenger safety. It is clear from thesestudies and from physics, as noted above, that occupants of lighter vehicles are at a basicdisadvantage to those of heavier vehicles in two-vehicle collisions. However, if most vehicles inthe fleet are made lighter, the relative weights of vehicles in most collisions will not change.Consequently, a key issue here is whether reducing the weight of most vehicles in the fleet whilemaintaining basic structural integrity will adversely impact vehicle safety--beyond the adverseimpact caused by those remaining vehicles that retain higher weight (older vehicles and freighttrucks).
Some analysts have argued that weight reductions will have strongly negative impacts on fleetsafety even in accidents where the role of weight is ambiguous--for example, in accidents wheretwo (lighter) vehicles collide with each other. In the current fleet, in accidents where two cars ofidentical weight collide with each other, the occupants have an injury risk roughly proportional tothe weights of the vehicle pairs; occupants of 2,000-pound vehicles colliding with each otherwould have roughly one and one half times the risk of occupants of 3,000-pound vehicles in a
199
similar collision.87 This seems to imply, at face value, that weight reductions will increase injuries.The basic problem with all such interpretations, however, is that they are derived from data on avehicle fleet in which car size and car mass are strongly related to one another. In other words, intoday’s fleet, if a car is lighter, it is also smaller--and has a smaller front end with which to absorbthe energy of a crash. Consequently, some portion of the greater risk of lighter cars will beassociated with their size (and perhaps structural strength) rather than their weight. The dilemmafor analysts is figuring out the relevant importance of each.
Some analyses have identified vehicle mass as the more important factor than size.88 A recentstudy concludes, however, that virtually all of the variation in injury risk for accidents such as“collisions between cars of equal weight” can be explained by the differences in car length amongdifferent pairs of equal weight vehicles. 89 In other words, the study found that, in today’s fleet: 1)lighter cars generally are smaller cars with smaller crush zones, 2) small cars generally are scaleddown versions of large cars, that is, cars’ overall design do not vary much with size, and theiroverall energy absorption characteristics do not vary either, so that 3) for the same accidentseverity, the deceleration imposed on the occupant compartment is inversely proportional to carlength.
Even if the second study is correct, there still are important categories of accidents, asdiscussed above, where weight will play a protective role--by reducing the velocity change anddeceleration of the vehicle in a collision. Consequently, at best, a reduction in the weight of light-duty vehicles will have some adverse impacts on the safety of the light-duty fleet, even if crushspace and structural integrity are maintained--especially during the time when heavier light-dutyvehicles remain in the fleet, but perhaps permanently in collisions with freight vehicles and off-road obstacles. Also, the net impact of weight reduction on barrier crashes and crashes intovehicles of similar weight remains unclear. Quantifying this impact will require substantial analysisof available accident statistics, and perhaps the collection of additional data, to determine therelative importance of each accident type and the impact of vehicle weight on that type.
Design Solutions
Various design solutions have been proposed to compensate for the automatic momentumdisadvantage experienced by lightweight cars in collisions. Because crush space is a critical factorin passenger safety, designs that increase crush space can compensate somewhat for the increasedvelocity change experienced by lightweight cars in collisions. Although increased crush space canbe achieved by structural design, an interesting possibility is to deploy an external air bagimmediately before a crash.90 Such a bag, deployed by a radar warning of the impending crash,would create a substantial temporary addition to crush space. The availability of low-cost radarsystems and strong, flexible materials for the bag make this system an interesting one that may
87Evans and Frick, see footnote 83.8 8I b i d89D.P. Wood et al., "The Influence of Car Crush Behaviour on Frontal Collision Safety and on the Car Size Effect," SAE paper 930893, 1993.90C. Clark, "The Crash Anticipating Extended Air Bag Bumper Systems," paper presented at the 14th International Technical Conference on the
Enhanced Safety of Vehicles, Munich, Germany, May 23-26, 1994, cited in B. O’NeiIl, Insurance Institute for Highway Safety, memo to Policy
Dialog Advisory Committee on Greenhouse Gas Emissions from Personal Motor Vehicles, Jan. 12, 1995.
200
bear increased attention. As a possible adjunct to such a system, automatic braking activated bythe same radar signal could reduce crash severity.
Another interesting design solution proposed by the Swiss involves building the lightweightvehicle with an extremely stiff “impact belt” around the exterior of the vehicle. 91 The idea here isthat, in case of a collision with a heavier vehicle, the rigidity of the vehicle shell would cause thefront of the heavier vehicle to deform substantially. In essence, the lighter vehicle uses the crushspace of the heavier vehicle as its own crush space, and the heavier vehicle absorbs most of thekinetic energy released in the crash.92 This design also includes very strong and stiff side beamsthat prevent intrusion of the car door into the passenger compartment during a side impact,avoiding the main cause of severe injuries during this type of collision.93
This type of design demands that restraint systems and interior padding bear much of the taskof dealing with deceleration, especially in accidents where the vehicle strikes largely immovableobjects. Although the structure does not eliminate crush space--it does deform in a crash--itreduces crush space and will increase the deceleration forces on passengers in many crashes. 94 Italso demands that heavy cars be built with lower rigidity in their front and rear structures, so theycan absorb most of the kinetic energy of crashes with lighter vehicles. 95 Another concern of thistype of design is its potential to increase the aggressivity of light cars in collisions into the sides ofother vehicles. Of particular concern is the incidence of vehicle-to-vehicle crashes where bothvehicles are of this design. In such collisions, deceleration forces on the passengers would besubstantially higher than in collisions between vehicles of more conventional design. Thus far, theSwiss have focused this design on very small vehicles, and this maybe where the design makes themost sense--when there simply is no room for much crush space. In OTA’s view, this type ofdesign, if used in standard-size vehicles, would be likely to create more problems than iteliminates.
Improvements in restraint systems will increase safety in all vehicles. In particular, crashsensors with very fast response times allow more time for deploying airbags and thus allowdeployment to be less aggressive. This might mitigate some of the injuries that rapidly deployingairbags have been known to cause. Also, so-called “smart” restraint systems potentially maydeploy the air bag differently depending on crash severity, position of the vehicle occupant, andcharacteristics of the occupant (e.g., size, sex, age), yielding greater protection.
Additional Issues
OTA’s workshop on the safety of lightweight vehicles identified numerous additional issues.First, regardless of whether or not lightweight vehicles adopt any kind of “impact belt” design,
91R. Kaeser et al., "Collision Safety of a Hard-Shell Low-Mass Vehicle,” Accident Analysis and Prevention, vol. 26, No. 3, 1994, pp. 399-406.9 2Ibid.93Ibid. Although passengers are likely to strike the door whether or not the doors are pushed in or the entire vehicle is pushed sideways as a unit,
the impact forces are far lower in the latter case.94In a very small vehicle that would not have much crush space to begin with, this type of design has fewer tradeoffs. However, the vehicles we
are considering here are lighter but not smaller than conventional vehicles.9 5Ibid.
201
vehicle compatibility problems may pose a major challenge to lightweight vehicle safety design. Aconcern here was that current barrier tests might force even the heaviest vehicles to have stifffront ends, making them quite dangerous. to all of the other, lighter vehicles on the road. Thus far,however, NHTSA has found that application of the barrier tests to heavier vehicles--such as full-size pickups and vans, as well as heavy luxury cars--has tended to force them to soften their frontends, making them less aggressive to other vehicles. 96 Nevertheless, NHTSA might want to takespecial care that its current frontal crash requirements will create maximum fleet safety, if anotherround of vehicle weight reductions occur. Further, in adopting new side impact standards,NHTSA should take care to examine the impact of such standards on the feasibility of moving tonew lightweight designs.
Another compatibility issue may be with roadside hardware such as collapsible light posts andvehicle barriers. Lightweight vehicles may pose problems for this hardware, because it is designedto give or collapse under impact forces that may be above the levels achieved by some of thesmaller vehicles.
As discussed elsewhere (discussion on advanced materials), current vehicle structural modelingdepends on extensive experience with steel structures. Shifting to aluminum or composites willprovide a substantial challenge to vehicle safety designers, one that may take some time toovercome. Before the requisite knowledge is obtained, automakers may be forced to “play it safe”with designs that do not take full advantage of the properties of nonsteel materials.
Many safety advances in the past occurred because biomechanical research identified injurymechanisms and provided the data that allowed engineers to design restraint systems, padding,and collapsible vehicle structures (e.g., steering wheels) to appropriate human tolerances.97 Suchresearch also has led to the design of improved crash dummies that have greatly improved thevalue of crash testing. Further improvement in understanding of injury mechanisms would beespecially valuable, if substantial vehicle weight reduction occurs and adds increased risks to thevehicle fleet. Unfortunately, biomechanical research is funded at a relatively low level in NHTSAand is extremely limited elsewhere.98 This conceivably may limit the industry’s ability to respondfully to the challenges presented by lightweight advanced vehicles.
Finally, current safety standards focus on designing to protect unbelted occupants as well asbelted ones. Some analysts believe that requirements to protect unbelted occupants compromisethe ability of vehicle designers to provide maximum protection for belted occupants.99 This issuemay become more intense with extensive reductions in vehicle weights, and the potential forhigher accident intensities that would occur- with such reductions. This is a complex issue thatOTA is not prepared to address at this time, but it is well worth a careful examination.
very high passenger decelerations in the barrier tests.9 7
Transportation Research Board, Safety Research for a Changing Highway Environment; Special Report 229 (Washington, DC: National
R esearch Council, 1990).9 8Ibid.99U.S. Congress, Office of Technology Assessment Workshop on the Safety of Lightweight Vehicles, Sept. 12, 1994.
202
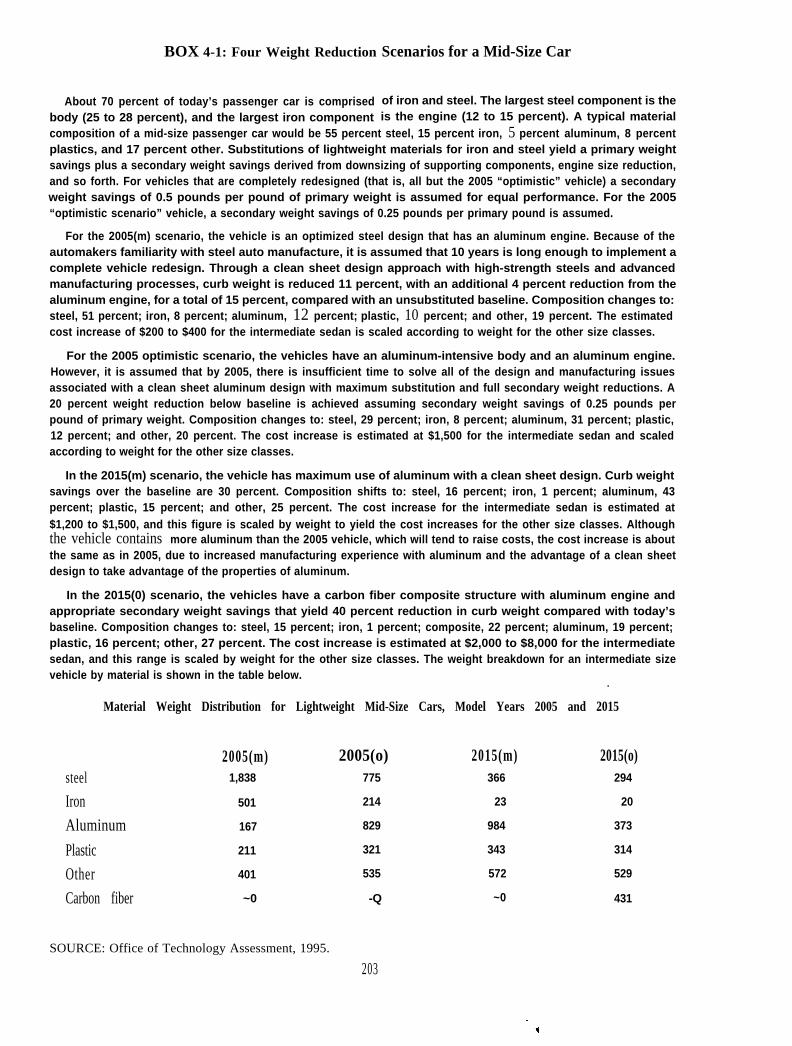
BOX 4-1: Four Weight Reduction
About 70 percent of today’s passenger car is comprisedbody (25 to 28 percent), and the largest iron component
Scenarios for a Mid-Size Car
of iron and steel. The largest steel component is theis the engine (12 to 15 percent). A typical material
composition of a mid-size passenger car would be 55 percent steel, 15 percent iron, 5 percent aluminum, 8 percentplastics, and 17 percent other. Substitutions of lightweight materials for iron and steel yield a primary weightsavings plus a secondary weight savings derived from downsizing of supporting components, engine size reduction,and so forth. For vehicles that are completely redesigned (that is, all but the 2005 “optimistic” vehicle) a secondaryweight savings of 0.5 pounds per pound of primary weight is assumed for equal performance. For the 2005“optimistic scenario” vehicle, a secondary weight savings of 0.25 pounds per primary pound is assumed.
For the 2005(m) scenario, the vehicle is an optimized steel design that has an aluminum engine. Because of theautomakers familiarity with steel auto manufacture, it is assumed that 10 years is long enough to implement acomplete vehicle redesign. Through a clean sheet design approach with high-strength steels and advancedmanufacturing processes, curb weight is reduced 11 percent, with an additional 4 percent reduction from thealuminum engine, for a total of 15 percent, compared with an unsubstituted baseline. Composition changes to:steel, 51 percent; iron, 8 percent; aluminum, 12 percent; plastic, 10 percent; and other, 19 percent. The estimatedcost increase of $200 to $400 for the intermediate sedan is scaled according to weight for the other size classes.
For the 2005 optimistic scenario, the vehicles have an aluminum-intensive body and an aluminum engine.However, it is assumed that by 2005, there is insufficient time to solve all of the design and manufacturing issuesassociated with a clean sheet aluminum design with maximum substitution and full secondary weight reductions. A20 percent weight reduction below baseline is achieved assuming secondary weight savings of 0.25 pounds perpound of primary weight. Composition changes to: steel, 29 percent; iron, 8 percent; aluminum, 31 percent; plastic,12 percent; and other, 20 percent. The cost increase is estimated at $1,500 for the intermediate sedan and scaledaccording to weight for the other size classes.
In the 2015(m) scenario, the vehicle has maximum use of aluminum with a clean sheet design. Curb weightsavings over the baseline are 30 percent. Composition shifts to: steel, 16 percent; iron, 1 percent; aluminum, 43percent; plastic, 15 percent; and other, 25 percent. The cost increase for the intermediate sedan is estimated at$1,200 to $1,500, and this figure is scaled by weight to yield the cost increases for the other size classes. Althoughthe vehicle contains more aluminum than the 2005 vehicle, which will tend to raise costs, the cost increase is aboutthe same as in 2005, due to increased manufacturing experience with aluminum and the advantage of a clean sheetdesign to take advantage of the properties of aluminum.
In the 2015(0) scenario, the vehicles have a carbon fiber composite structure with aluminum engine andappropriate secondary weight savings that yield 40 percent reduction in curb weight compared with today’sbaseline. Composition changes to: steel, 15 percent; iron, 1 percent; composite, 22 percent; aluminum, 19 percent;plastic, 16 percent; other, 27 percent. The cost increase is estimated at $2,000 to $8,000 for the intermediatesedan, and this range is scaled by weight for the other size classes. The weight breakdown for an intermediate sizevehicle by material is shown in the table below.
.
Material Weight Distribution for Lightweight Mid-Size Cars, Model Years 2005 and 2015
steelIron
Aluminum
Plastic
Other
Carbon fiber
2005(m) 2005(o) 2015(m) 2015(o)1,838 775 366 294
501 214 23 20
167 829 984 373
211 321 343 314
401 535 572 529
~0 -Q ~0 431
SOURCE: Office of Technology Assessment, 1995.
203
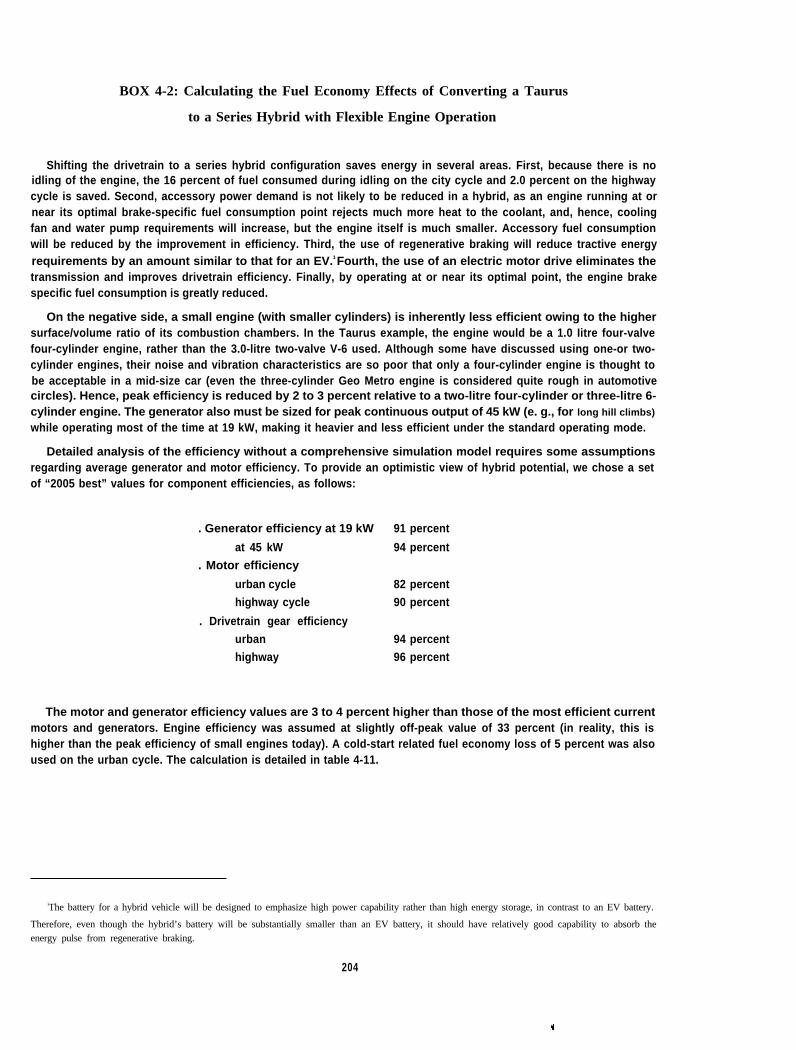
BOX 4-2: Calculating the Fuel Economy Effects of Converting a Taurus
to a Series Hybrid with Flexible Engine Operation
Shifting the drivetrain to a series hybrid configuration saves energy in several areas. First, because there is noidling of the engine, the 16 percent of fuel consumed during idling on the city cycle and 2.0 percent on the highwaycycle is saved. Second, accessory power demand is not likely to be reduced in a hybrid, as an engine running at ornear its optimal brake-specific fuel consumption point rejects much more heat to the coolant, and, hence, coolingfan and water pump requirements will increase, but the engine itself is much smaller. Accessory fuel consumptionwill be reduced by the improvement in efficiency. Third, the use of regenerative braking will reduce tractive energyrequirements by an amount similar to that for an EV.1 Fourth, the use of an electric motor drive eliminates thetransmission and improves drivetrain efficiency. Finally, by operating at or near its optimal point, the engine brakespecific fuel consumption is greatly reduced.
On the negative side, a small engine (with smaller cylinders) is inherently less efficient owing to the highersurface/volume ratio of its combustion chambers. In the Taurus example, the engine would be a 1.0 Iitre four-valvefour-cylinder engine, rather than the 3.0-litre two-valve V-6 used. Although some have discussed using one-or two-cylinder engines, their noise and vibration characteristics are so poor that only a four-cylinder engine is thought tobe acceptable in a mid-size car (even the three-cylinder Geo Metro engine is considered quite rough in automotivecircles). Hence, peak efficiency is reduced by 2 to 3 percent relative to a two-litre four-cylinder or three-litre 6-cylinder engine. The generator also must be sized for peak continuous output of 45 kW (e. g., for long hill climbs)
while operating most of the time at 19 kW, making it heavier and less efficient under the standard operating mode.
Detailed analysis of the efficiency without a comprehensive simulation model requires some assumptionsregarding average generator and motor efficiency. To provide an optimistic view of hybrid potential, we chose a setof “2005 best” values for component efficiencies, as follows:
. Generator efficiency at 19 kW
at 45 kW
. Motor efficiency
urban cycle
highway cycle
. Drivetrain gear efficiency
urban
highway
91 percent
94 percent
82 percent
90 percent
94 percent
96 percent
The motor and generator efficiency values are 3 to 4 percent higher than those of the most efficient currentmotors and generators. Engine efficiency was assumed at slightly off-peak value of 33 percent (in reality, this ishigher than the peak efficiency of small engines today). A cold-start related fuel economy loss of 5 percent was alsoused on the urban cycle. The calculation is detailed in table 4-11.
lThe battery for a hybrid vehicle will be designed to emphasize high power capability rather than high energy storage, in contrast to an EV battery.
Therefore, even though the hybrid’s battery will be substantially smaller than an EV battery, it should have relatively good capability to absorb the
energy pulse from regenerative braking.
204
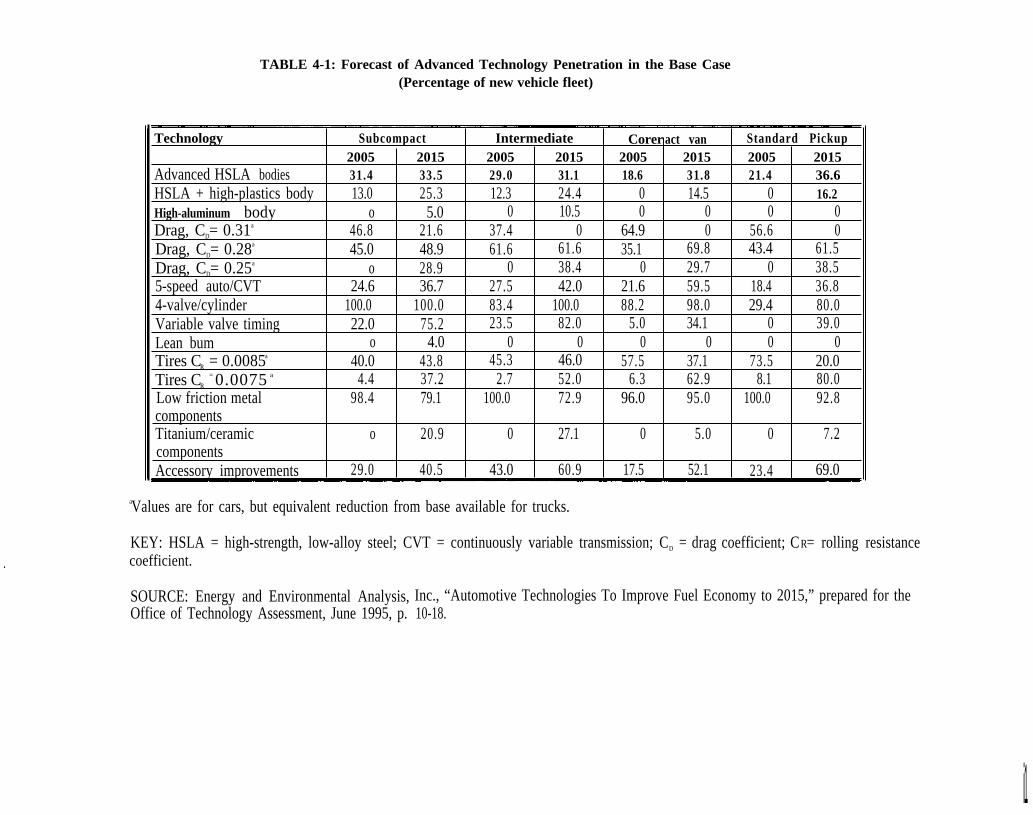
TABLE 4-1: Forecast of Advanced Technology Penetration in the Base Case(Percentage of new vehicle fleet)
Technology Subcompact Intermediate Corer act van Standard Pickup2005 2015 2005 2015 2005 2015 2005 2015
Advanced HSLA bodies 31.4 33.5 29.0 31.1 18.6 31.8 21.4 36.6HSLA + high-plastics body 13.0 25.3 12.3 24.4 0 14.5 0 16.2High-aluminum body o 5.0 0 10.5 0 0 0 0Drag, CD= 0.31a 46.8 21.6 37.4 0 64.9 0 56.6 0Drag, CD= 0.28a 45.0 48.9 61.6 61.6 35.1 69.8 43.4 61.5Drag, CD= 0.25a o 28.9 0 38.4 0 29.7 0 38.55-speed auto/CVT 24.6 36.7 27.5 42.0 21.6 59.5 18.4 36.84-valve/cylinder 100.0 100.0 83.4 100.0 88.2 98.0 29.4 80.0Variable valve timing 22.0 75.2 23.5 82.0 5.0 34.1 0 39.0Lean bum o 4.0 0 0 0 0 0 0Tires CR = 0.0085a 40.0 43.8 45.3 46.0 57.5 37.1 73.5 20.0Tires CR
= 0.0075 a 4.4 37.2 2.7 52.0 6.3 62.9 8.1 80.0Low friction metal 98.4 79.1 100.0 72.9 96.0 95.0 100.0 92.8componentsTitanium/ceramic o 20.9 0 27.1 0 5.0 0 7.2componentsAccessory improvements 29.0 40.5 43.0 60.9 17.5 52.1 23.4 69.0
aValues are for cars, but equivalent reduction from base available for trucks.
KEY: HSLA = high-strength, low-alloy steel; CVT = continuously variable transmission; CD = drag coefficient; CR= rolling resistancecoefficient.
SOURCE: Energy and Environmental Analysis,Office of Technology Assessment, June 1995, p.
Inc., “Automotive Technologies To Improve Fuel Economy to 2015,” prepared for the10-18.
1i
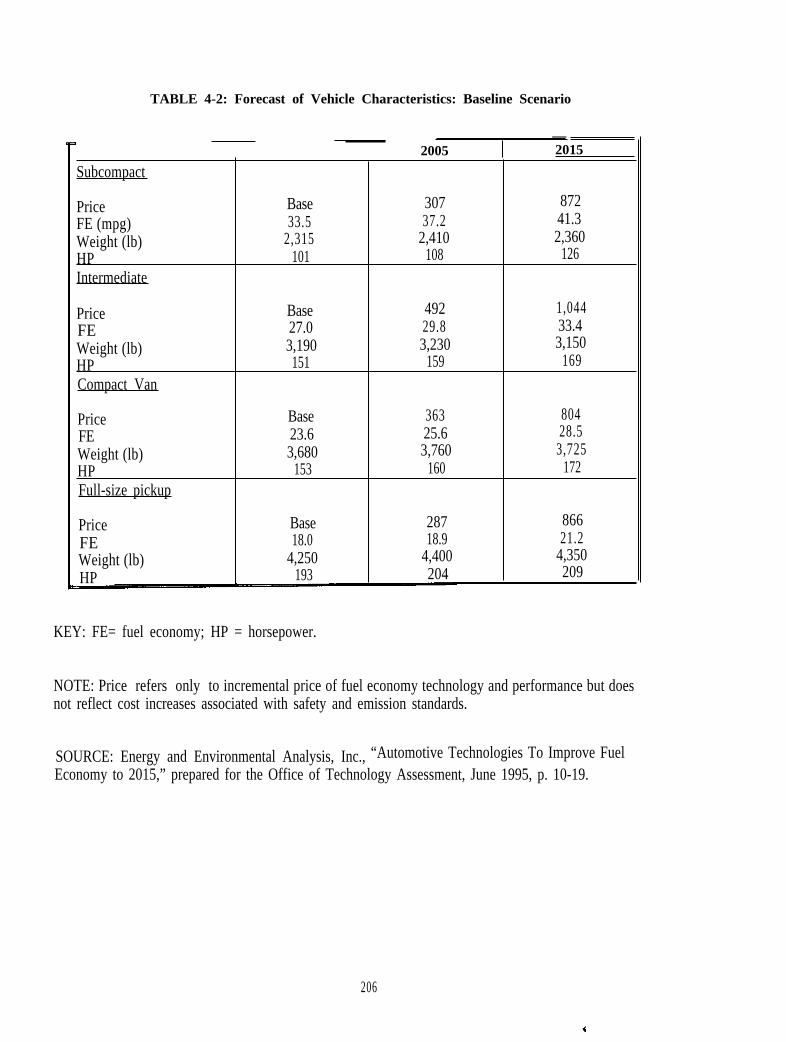
TABLE 4-2: Forecast of Vehicle Characteristics: Baseline Scenario
—2005 2015
Subcompact
Price Base 307 872FE (mpg) 33.5 37.2 41.3Weight (lb) 2,315 2,410 2,360HP 101 108 126
Intermediate
Price Base 492 1,044FE 27.0 29.8 33.4Weight (lb) 3,190 3,230 3,150HP 151 159 169
Compact Van
Price Base 363 804FE 23.6 25.6 28.5Weight (lb) 3,680 3,760 3,725HP 153 160 172Full-size pickup
Price Base 287 866FE 18.0 18.9 21.2Weight (lb) 4,250 4,400 4,350HP 193 204 209
KEY: FE= fuel economy; HP = horsepower.
NOTE: Price refers only to incremental price of fuel economy technology and performance but doesnot reflect cost increases associated with safety and emission standards.
SOURCE: Energy and Environmental Analysis, Inc., “Automotive Technologies To Improve FuelEconomy to 2015,” prepared for the Office of Technology Assessment, June 1995, p. 10-19.
206
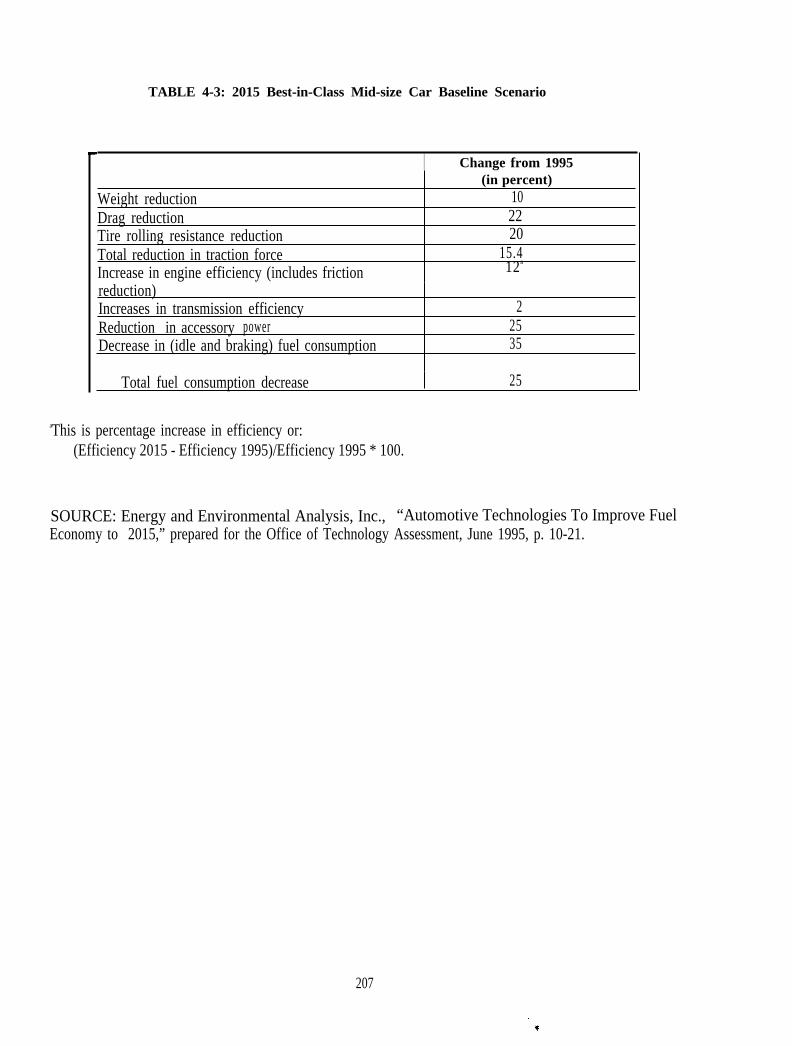
TABLE 4-3: 2015 Best-in-Class Mid-size Car Baseline Scenario
I Change from 1995(in percent)
Weight reduction 10Drag reduction 22Tire rolling resistance reduction 20Total reduction in traction force 15.4Increase in engine efficiency (includes friction 12a
reduction)Increases in transmission efficiency 2Reduction in accessory power 25Decrease in (idle and braking) fuel consumption 35
Total fuel consumption decrease 25
aThis is percentage increase in efficiency or:(Efficiency 2015 - Efficiency 1995)/Efficiency 1995 * 100.
SOURCE: Energy and Environmental Analysis, Inc., “Automotive Technologies To Improve FuelEconomy to 2015,” prepared for the Office of Technology Assessment, June 1995, p. 10-21.
207
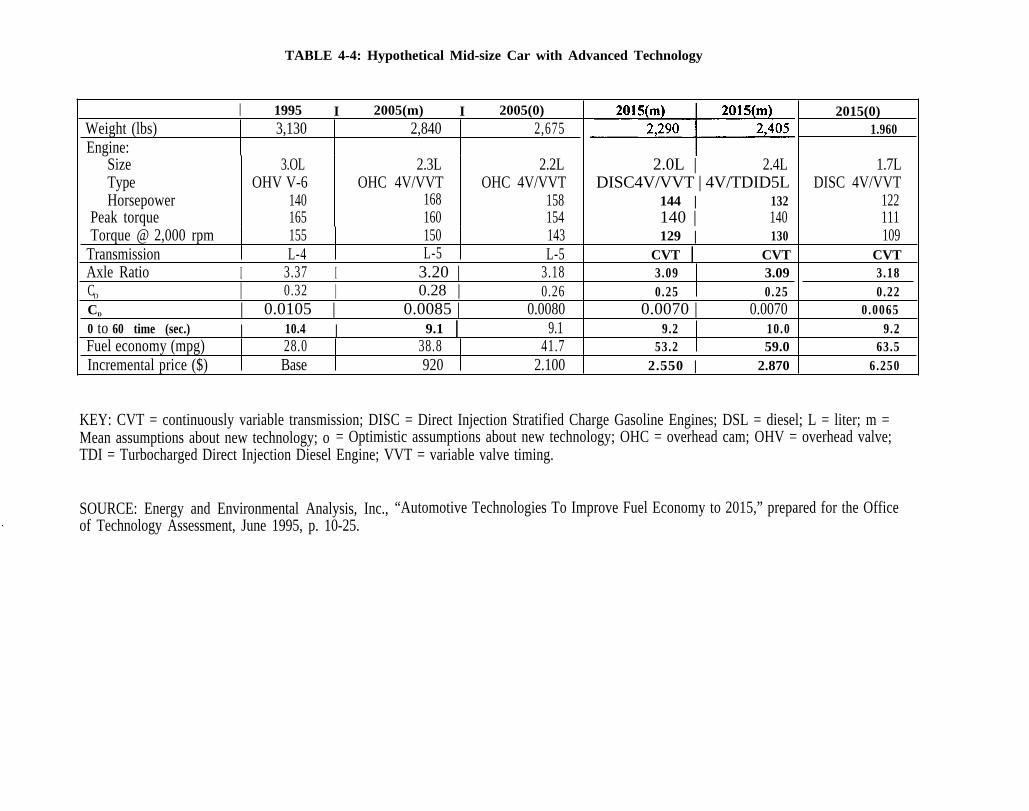
TABLE 4-4: Hypothetical Mid-size Car with Advanced Technology
I 1995 I 2005(m) I 2005(0)Weight (lbs) 3,130 2,840 2,675Engine:
Size 3.OL 2.3L 2.2LType OHV V-6 OHC 4V/VVT OHC 4V/VVTHorsepower 140 168 158
Peak torque 165 160 154Torque @ 2,000 rpm 155 150 143
Transmission L-4 L-5 L-5Axle Ratio I 3.37 I 3.20 | 3.18CD | 0.32 | 0.28 | 0.26CD | 0.0105 | 0.0085 | 0.00800 to 60 time (sec.) | 10.4 | 9.1 | 9.1Fuel economy (mpg) 28.0 38.8 41.7Incremental price ($) Base 920 2.100
2.0L | 2.4LDISC4V/VVT | 4V/TDID5L
144 | 132140 | 140129 | 130
CVT | CVT3.09 3.090.25 0.25
0.0070 | 0.00709.2 10.0
53.2 59.02.550 | 2.870
2015(0)1.960
1.7LDISC 4V/VVT
122111109
CVT3.180.22
0.00659.2
63.56.250
KEY: CVT = continuously variable transmission; DISC = Direct Injection Stratified Charge Gasoline Engines; DSL = diesel; L = liter; m =Mean assumptions about new technology; o = Optimistic assumptions about new technology; OHC = overhead cam; OHV = overhead valve;TDI = Turbocharged Direct Injection Diesel Engine; VVT = variable valve timing.
SOURCE: Energy and Environmental Analysis, Inc., “Automotive Technologies To Improve Fuel Economy to 2015,” prepared for the Officeof Technology Assessment, June 1995, p. 10-25.
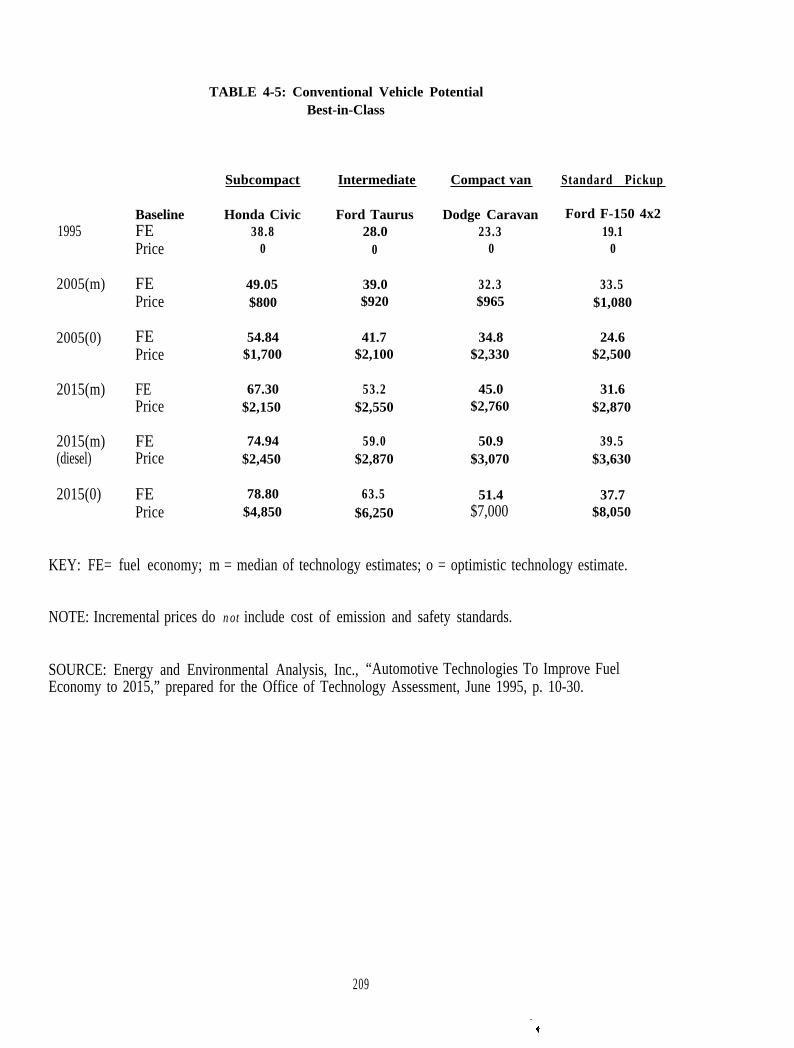
TABLE 4-5: Conventional Vehicle Potential
Best-in-Class
1995
2005(m)
2005(0)
2015(m)
2015(m)(diesel)
2015(0)
BaselineFEPrice
FEPrice
FEPrice
FEPrice
FEPrice
FEPrice
Subcompact
Honda Civic38.8
0
49.05$800
54.84$1,700
67.30$2,150
74.94$2,450
78.80$4,850
Intermediate
Ford Taurus28.0
0
39.0$920
41.7$2,100
53.2$2,550
59.0$2,870
63.5$6,250
Compact van Standard Pickup
Dodge Caravan23.3
0
32.3$965
34.8$2,330
45.0$2,760
50.9$3,070
51.4$7,000
Ford F-150 4x219.1
0
33.5$1,080
24.6$2,500
31.6$2,870
39.5$3,630
37.7$8,050
KEY: FE= fuel economy; m = median of technology estimates; o = optimistic technology estimate.
NOTE: Incremental prices do not include cost of emission and safety standards.
SOURCE: Energy and Environmental Analysis, Inc., “Automotive Technologies To Improve FuelEconomy to 2015,” prepared for the Office of Technology Assessment, June 1995, p. 10-30.
209

TABLE 4-6: Specifications of Some Advanced Electric Vehicles
Total weightVehicle Type (kg)GM Impact 1.348Cocconi Honda CRX 1,225BMW E-1 880Chrysler Van 2,340Ford Ecostar 1,405Honda CUV-4 1.680
| Fuel |Motor output consumption P
peak (hp) (kWh/km) (hp/kg)137 0.115 0.091120 | 0.103 | 0.08745 0.133 0.04470 0.300 0.02875 | 0.188 | 0.04066 | 0.155 | 0.036
E(Wh/kg-km)
0.0860.0840.1510.1280.1340.093
KEY: P = performance rating of vehicle + payload; E = specific efficiency of vehicle.
SOURCE: Energy and Environmental Analysis, Inc., “Automotive Technologies To Improve FuelEconomy to 2015,” prepared for the Office of Technology Assessment, June 1995, p. 10-39.
210
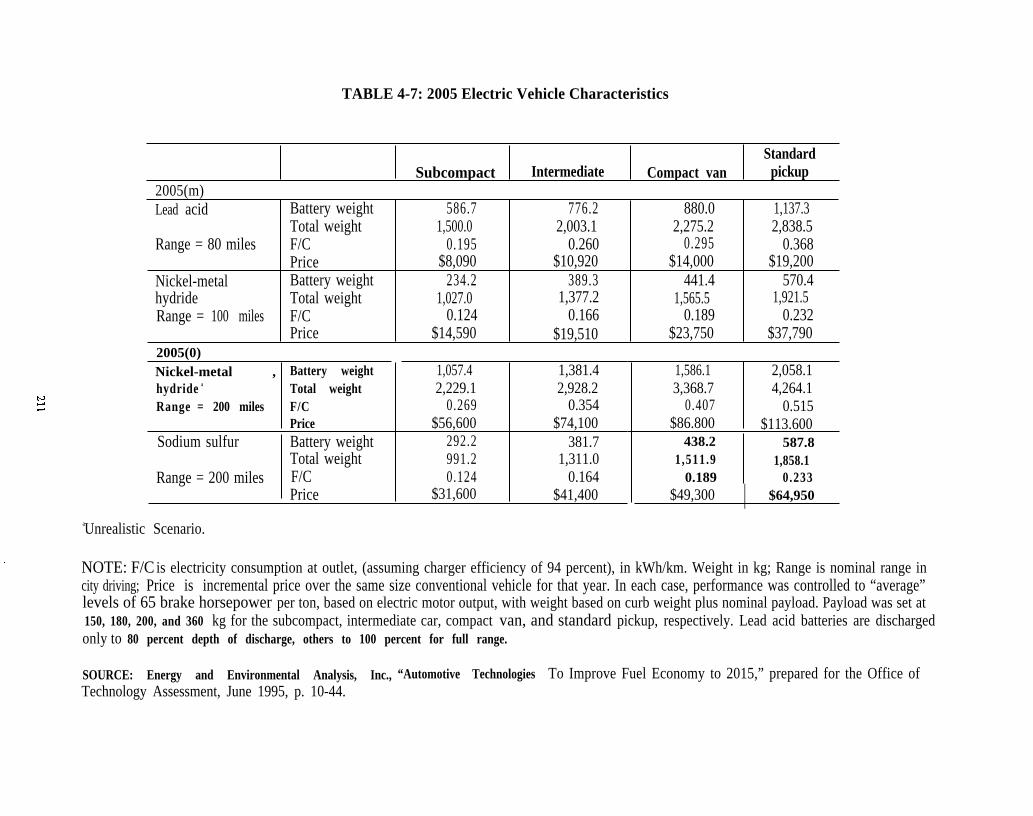
TABLE 4-7: 2005 Electric Vehicle Characteristics
StandardSubcompact Intermediate Compact van pickup
2005(m)Lead acid Battery weight 586.7 776.2 880.0 1,137.3
Total weight 1,500.0 2,003.1 2,275.2 2,838.5Range = 80 miles F/C 0.195 0.260 0.295 0.368
Price $8,090 $10,920 $14,000 $19,200Nickel-metal Battery weight 234.2 389.3 441.4 570.4hydride Total weight 1,027.0 1,377.2 1,565.5 1,921.5Range = 100 miles F/C 0.124 0.166 0.189 0.232
Price $14,590 $19,510 $23,750 $37,7902005(0)Nickel-metal , Battery weighthydride a Total weightRange = 200 miles F/C
PriceSodium sulfur Battery weight
Total weightRange = 200 miles F/C
Price
1,057.4 1,381.42,229.1 2,928.2
0.269 0.354$56,600 $74,100
292.2 381.7991.2 1,311.00.124 0.164
$31,600 $41,400
1,586.1 2,058.13,368.7 4,264.1
0.407 0.515$86.800 $113.600
438.2 587.81,511.9 1,858.1
0.189 0.233$49,300 | $64,950
aUnrealistic Scenario.
NOTE: F/C is electricity consumption at outlet, (assuming charger efficiency of 94 percent), in kWh/km. Weight in kg; Range is nominal range incity driving; Price is incremental price over the same size conventional vehicle for that year. In each case, performance was controlled to “average”levels of 65 brake horsepower per ton, based on electric motor output, with weight based on curb weight plus nominal payload. Payload was set at150, 180, 200, and 360 kg for the subcompact, intermediate car, compact van, and standard pickup, respectively. Lead acid batteries are dischargedonly to 80 percent depth of discharge, others to 100 percent for full range.
SOURCE: Energy and Environmental Analysis, Inc., “Automotive Technologies To Improve Fuel Economy to 2015,” prepared for the Office ofTechnology Assessment, June 1995, p. 10-44.
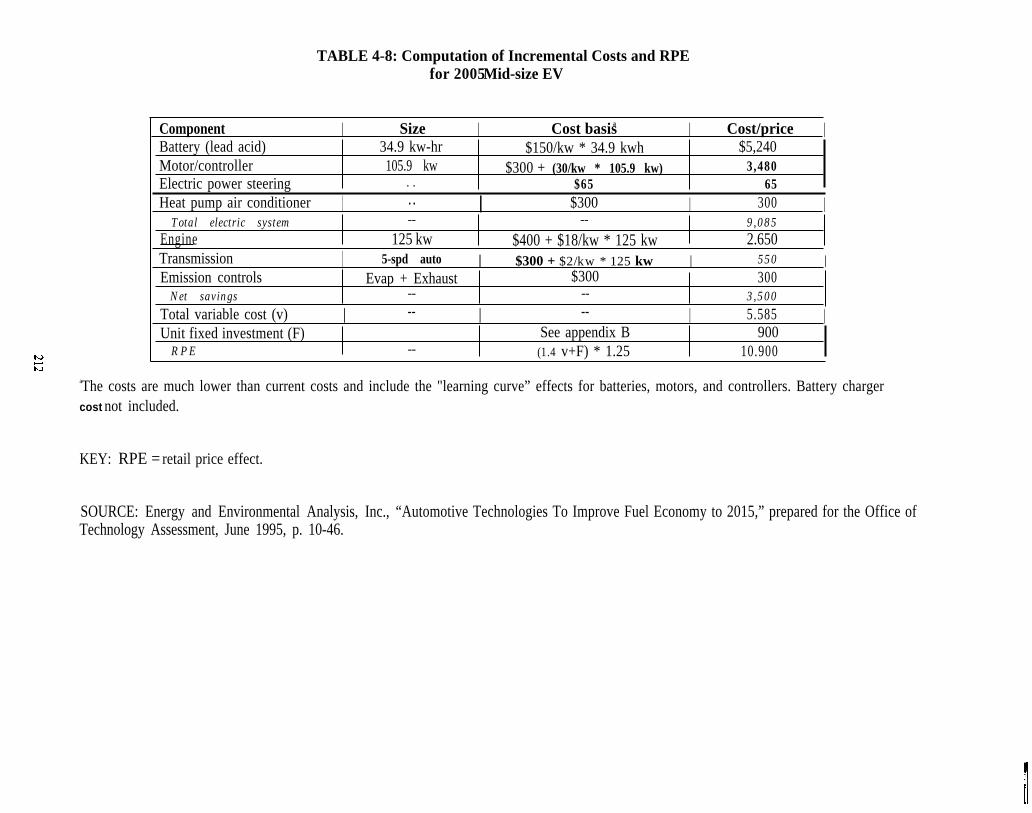
TABLE 4-8: Computation of Incremental Costs and RPEfor 2005 Mid-size EV
Component | Size | Cost basisa | Cost/price |Battery (lead acid) 34.9 kw-hr $150/kw * 34.9 kwh $5,240Motor/controller 105.9 kw $300 + (30/kw * 105.9 kw) 3,480Electric power steering . . $65 65Heat pump air conditioner | .. | $300 | 300 |
Total electric system -- -- 9,085Engine 125 kw $400 + $18/kw * 125 kw 2.650Transmission | 5-spd auto | $300 + $2/kw * 125 kw | 550 |Emission controls Evap + Exhaust $300 300
Net savings -- -- 3,500Total variable cost (v) | -- | -- | 5.585 |Unit fixed investment (F) See appendix B 900
RPE -- (1.4 v+F) * 1.25 10.900
aThe costs are much lower than current costs and include the "learning curve” effects for batteries, motors, and controllers. Battery chargercost not included.
KEY: RPE = retail price effect.
SOURCE: Energy and Environmental Analysis, Inc., “Automotive Technologies To Improve Fuel Economy to 2015,” prepared for the Office ofTechnology Assessment, June 1995, p. 10-46.
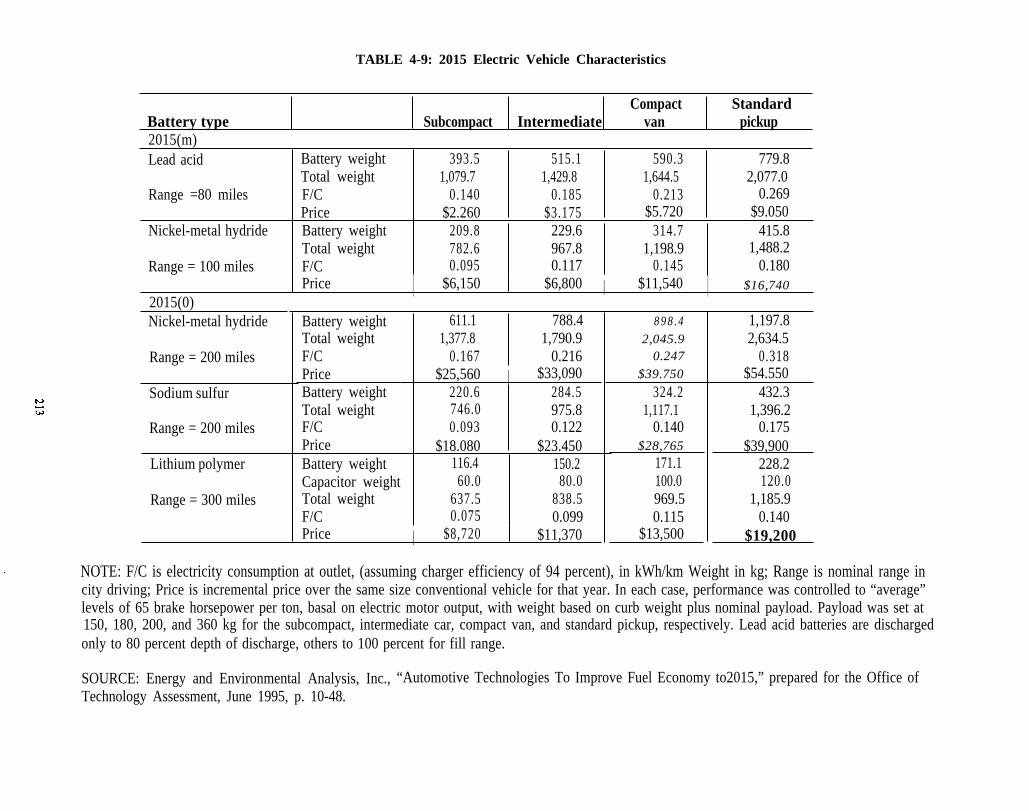
TABLE 4-9: 2015 Electric Vehicle Characteristics
Compact StandardBattery type Subcompact Intermediate van pickup2015(m)Lead acid
Range =80 miles
Nickel-metal hydride
Range = 100 miles
2015(0)Nickel-metal hydride
Range = 200 miles
Sodium sulfur
Range = 200 miles
Lithium polymer
Range = 300 miles
Battery weightTotal weightF/CPrice
393.5 515.1 590.3 779.81,079.7 1,429.8 1,644.5 2,077.0
0.140 0.185 0.213 0.269$2.260 $3.175 $5.720 $9.050
Battery weightTotal weightF/C
209.8 229.6 314.7 415.8782.6 967.8 1,198.9 1,488.20.095 0.117 0.145 0.180
Price | $6,150 $6,800 | $11,540 | $16,740
Battery weightTotal weightF/CPriceBattery weightTotal weightF/CPrice
611.1 788.41,377.8 1,790.9
0.167 0.216$25,560 | $33,090
220.6 284.5746.0 975.80.093 0.122
$18.080 $23.450Battery weightCapacitor weightTotal weightF/C
116.4 150.260.0 80.0
637.5 838.50.075 0.099
Price | $8,720 $11,370
898.42,045.9
0.247$39.750
324.21,117.1
0.140$28,765
171.1100.0969.50.115
$13,500
1,197.82,634.5
0.318$54.550
432.31,396.2
0.175$39,900
228.2120.0
1,185.90.140
$19,200
NOTE: F/C is electricity consumption at outlet, (assuming charger efficiency of 94 percent), in kWh/km Weight in kg; Range is nominal range incity driving; Price is incremental price over the same size conventional vehicle for that year. In each case, performance was controlled to “average”levels of 65 brake horsepower per ton, basal on electric motor output, with weight based on curb weight plus nominal payload. Payload was set at150, 180, 200, and 360 kg for the subcompact, intermediate car, compact van, and standard pickup, respectively. Lead acid batteries are dischargedonly to 80 percent depth of discharge, others to 100 percent for fill range.
SOURCE: Energy and Environmental Analysis, Inc., “Automotive Technologies To Improve Fuel Economy to2015,” prepared for the Office ofTechnology Assessment, June 1995, p. 10-48.
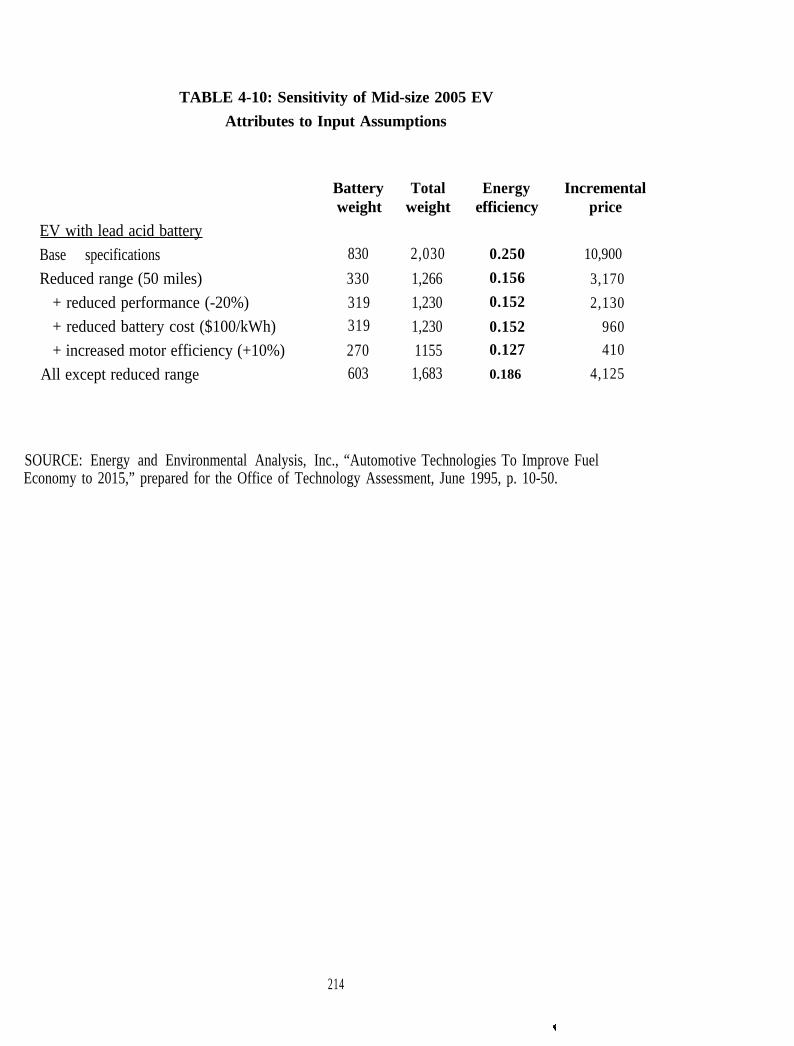
TABLE 4-10: Sensitivity of Mid-size 2005 EV
Attributes to Input Assumptions
Battery Totalweight weight
EV with lead acid battery
Base specifications 830 2,030
Reduced range (50 miles) 330 1,266
+ reduced performance (-20%) 319 1,230
+ reduced battery cost ($100/kWh) 319 1,230
+ increased motor efficiency (+10%) 270 1155
All except reduced range 603 1,683
Energyefficiency
0.250
0.156
0.152
0.1520.127
0.186
Incrementalprice
10,900
3,170
2,130
960
410
4,125
SOURCE: Energy and Environmental Analysis, Inc., “Automotive Technologies To Improve FuelEconomy to 2015,” prepared for the Office of Technology Assessment, June 1995, p. 10-50.
214
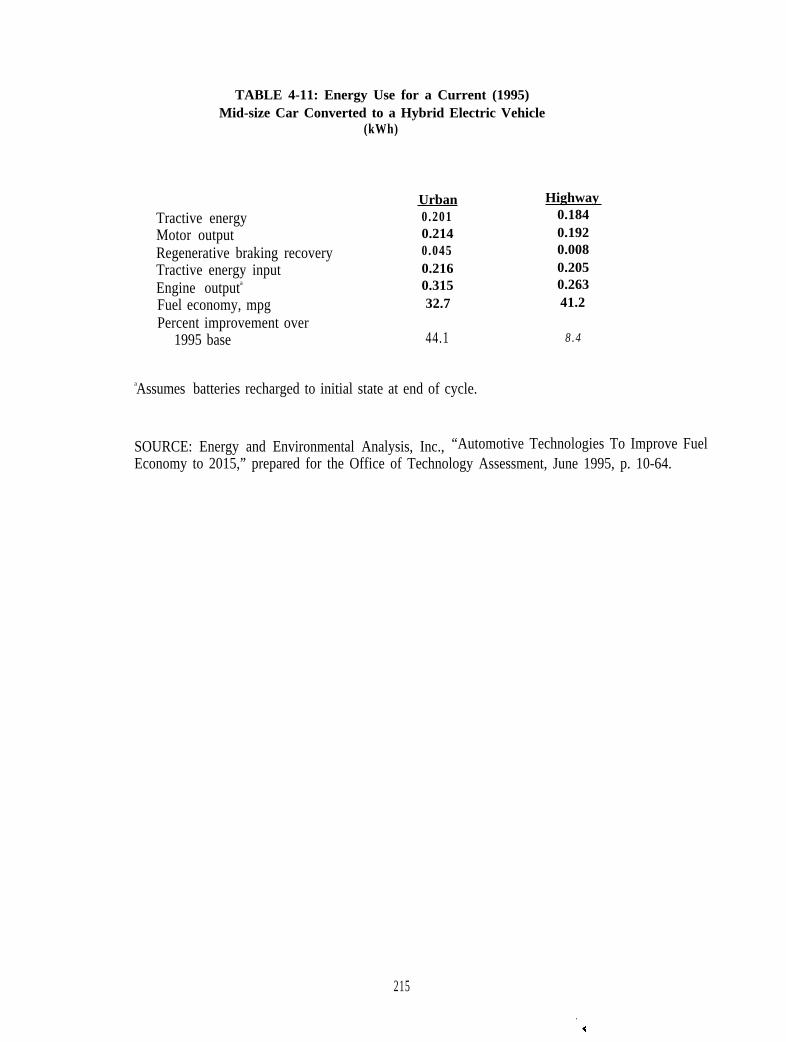
TABLE 4-11: Energy Use for a Current (1995)Mid-size Car Converted to a Hybrid Electric Vehicle
(kWh)
Tractive energyMotor outputRegenerative braking recoveryTractive energy inputEngine outputa
Fuel economy, mpgPercent improvement over
1995 base
Urban0.2010.2140.0450.2160.31532.7
44.1
aAssumes batteries recharged to initial state at end of cycle.
Highway0.1840.1920.0080.2050.26341.2
8.4
SOURCE: Energy and Environmental Analysis, Inc., “Automotive Technologies To Improve FuelEconomy to 2015,” prepared for the Office of Technology Assessment, June 1995, p. 10-64.
215
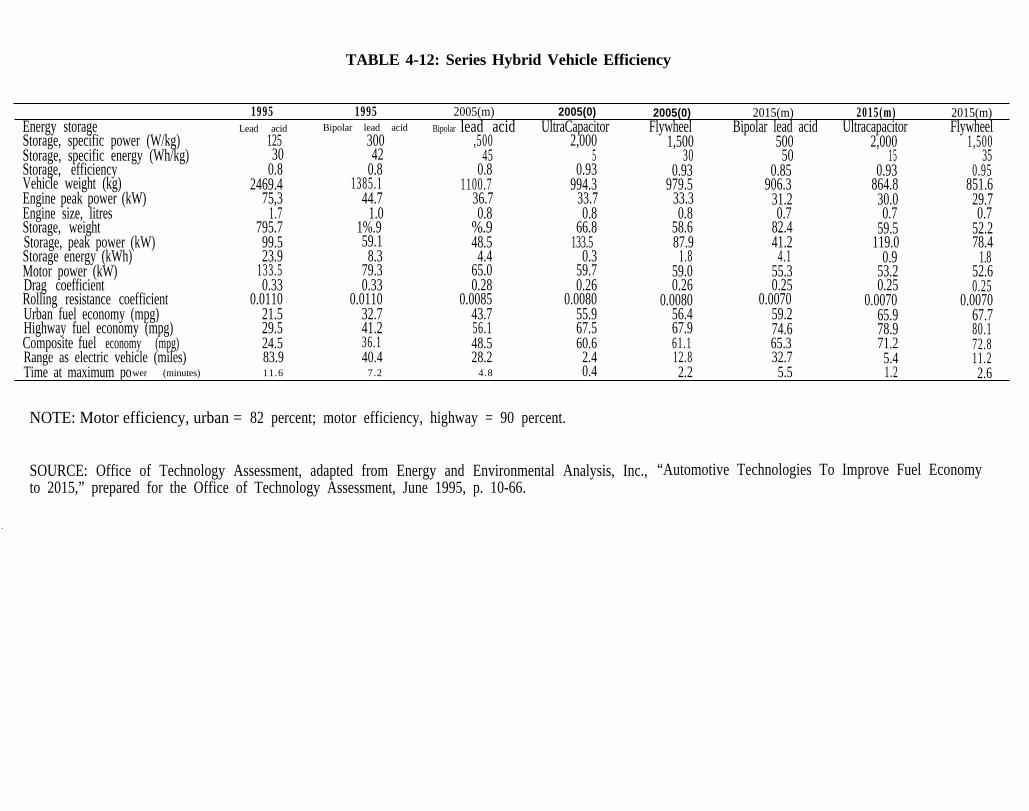
TABLE 4-12: Series Hybrid Vehicle Efficiency
1995 1995 2005(m) 2005(0) 2005(0) 2015(m) 2015(m) 2015(m)Energy storage Lead acid Bipolar lead acid Bipolar lead acid UltraCapacitor Flywheel Bipolar lead acid Ultracapacitor FlywheelStorage, specific power (W/kg) 125 300 ,500 2,000 1,500 500 2,000 1,500Storage, specific energy (Wh/kg) 30 42 45 5 30 50 15 35Storage, efficiency 0.8 0.8 0.8 0.93 0.93 0.85 0.93 0.95Vehicle weight (kg) 2469.4 1385.1 1100.7 994.3 979.5 906.3 864.8 851.6Engine peak power (kW) 75,3 44.7 36.7 33.7 33.3 31.2 30.0 29.7Engine size, litres 1.7 1.0 0.8 0.8 0.8 0.7 0.7 0.7Storage, weight 795.7 1%.9 %.9 66.8 58.6 82.4 59.5 52.2Storage, peak power (kW) 99.5 59.1 48.5 133.5 87.9 41.2 119.0 78.4Storage energy (kWh) 23.9 8.3 4.4 0.3 1.8 4.1 0.9 1.8Motor power (kW) 133.5 79.3 65.0 59.7 59.0 55.3 53.2 52.6Drag coefficient 0.33 0.33 0.28 0.26 0.26 0.25 0.25 0.25Rolling resistance coefficient 0.0110 0.0110 0.0085 0.0080 0.0080 0.0070 0.0070 0.0070Urban fuel economy (mpg) 21.5 32.7 43.7 55.9 56.4 59.2 65.9 67.7Highway fuel economy (mpg) 29.5 41.2 56.1 67.5 67.9 74.6 78.9 80.1Composite fuel economy (mpg) 24.5 36.1 48.5 60.6 61.1 65.3 71.2 72.8Range as electric vehicle (miles) 83.9 40.4 28.2 2.4 12.8 32.7 5.4 11.2Time at maximum power (minutes) 11.6 7.2 4.8 0.4 2.2 5.5 1.2 2.6
NOTE: Motor efficiency, urban = 82 percent; motor efficiency, highway = 90 percent.
SOURCE: Office of Technology Assessment, adapted from Energy and Environmental Analysis, Inc., “Automotive Technologies To Improve Fuel Economyto 2015,” prepared for the Office of Technology Assessment, June 1995, p. 10-66.
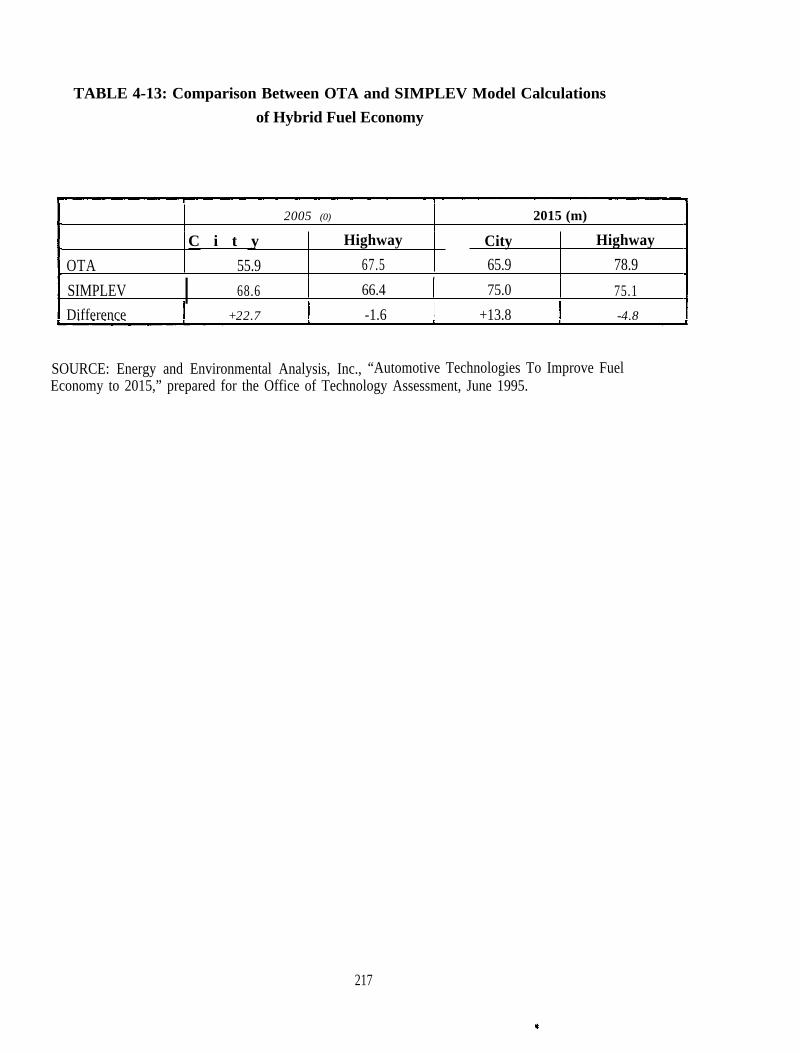
TABLE 4-13: Comparison Between OTA and SIMPLEV Model Calculations
of Hybrid Fuel Economy
2005 (0) 2015 (m)
C i t y Highway City Highway
OTA 55.9 67.5 65.9 78.9,SIMPLEV | 68.6 66.4 75.0 75.1
-1.6Difference +22.7 +13.8 -4.8
SOURCE: Energy and Environmental Analysis, Inc., “Automotive Technologies To Improve FuelEconomy to 2015,” prepared for the Office of Technology Assessment, June 1995.
217
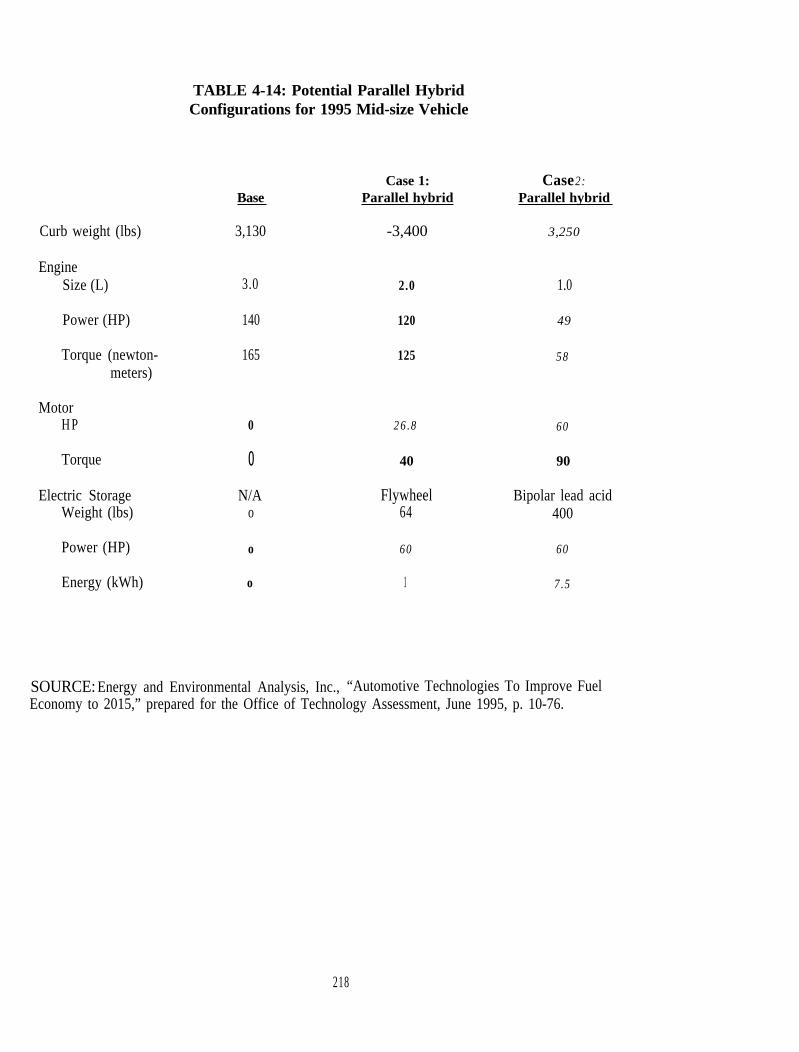
TABLE 4-14: Potential Parallel HybridConfigurations for 1995 Mid-size Vehicle
Case 1:Parallel hybrid
Case 2:Parallel hybridBase
3,130Curb weight (lbs) -3,400 3,250
EngineSize (L) 3.0
140
165
2.0
120
125
1.0
49
58
Power (HP)
Torque (newton-meters)
MotorH P 26.80 60
Torque 0 40 90
Electric StorageWeight (lbs)
N/Ao
Flywheel64
Bipolar lead acid400
Power (HP) o 60 60
Energy (kWh) o 1 7.5
SOURCE: Energy and Environmental Analysis, Inc., “Automotive Technologies To Improve FuelEconomy to 2015,” prepared for the Office of Technology Assessment, June 1995, p. 10-76.
218
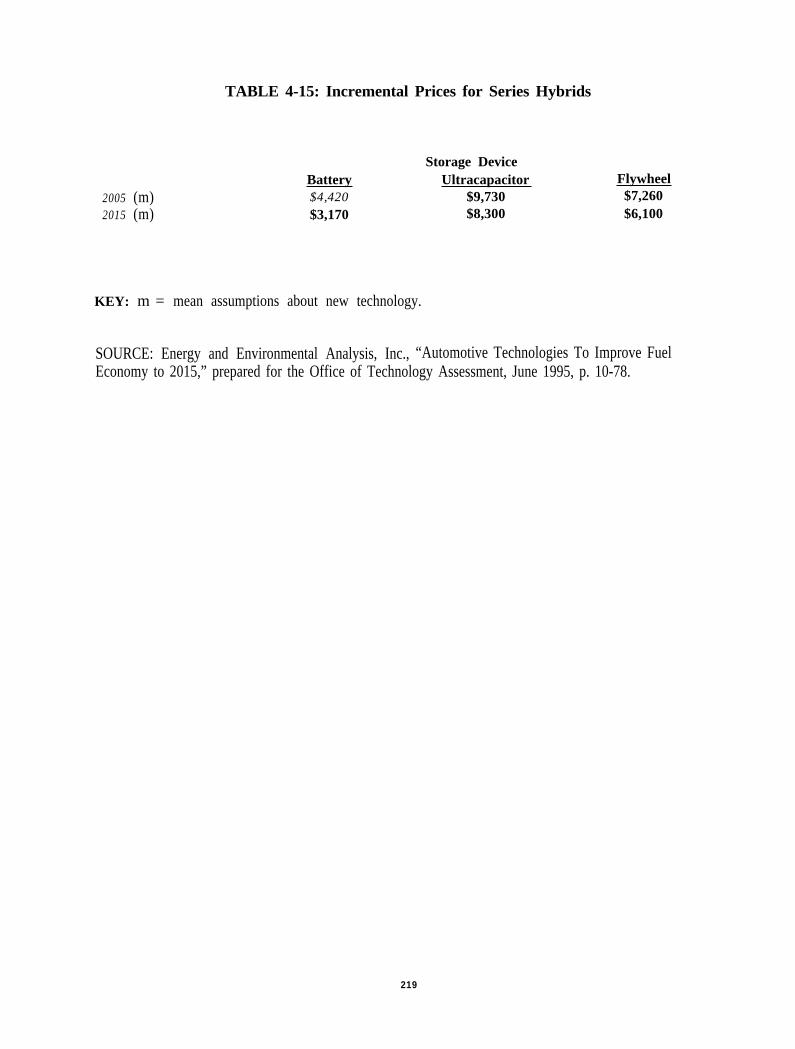
TABLE 4-15: Incremental Prices for Series Hybrids
Battery2005 (m) $4,4202015 (m) $3,170
KEY: m = mean assumptions about new technology.
Storage DeviceUltracapacitor Flywheel
$9,730 $7,260$8,300 $6,100
SOURCE: Energy and Environmental Analysis, Inc., “Automotive Technologies To Improve FuelEconomy to 2015,” prepared for the Office of Technology Assessment, June 1995, p. 10-78.
219
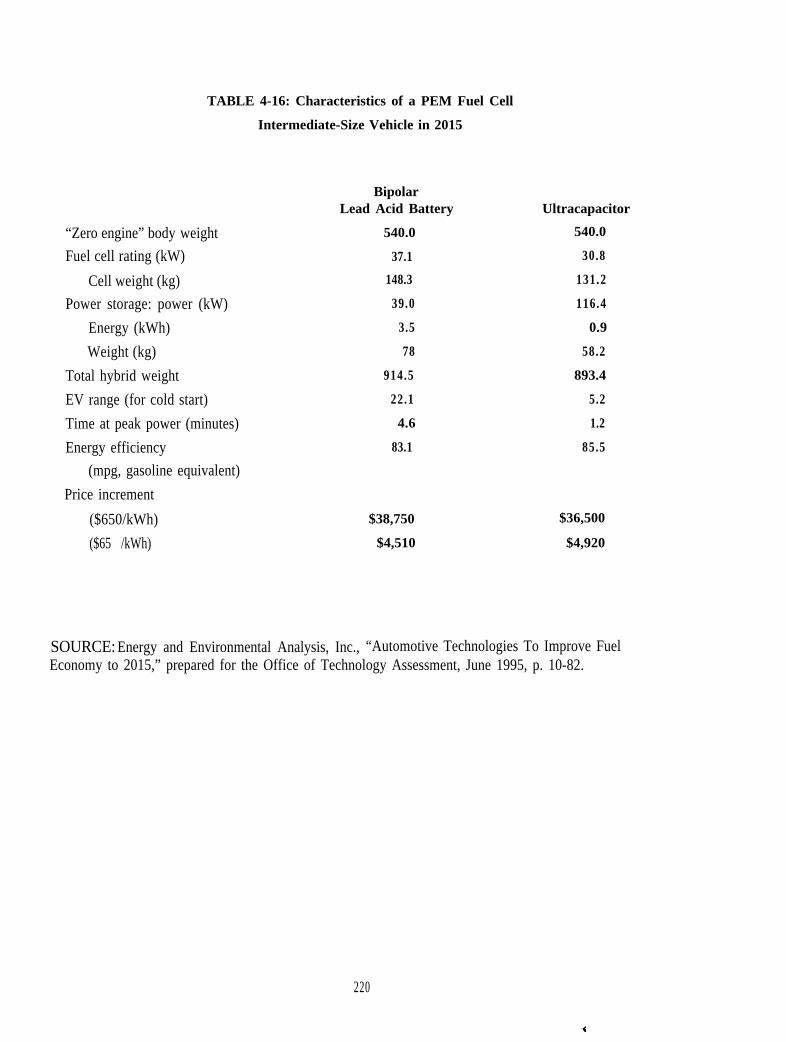
TABLE 4-16: Characteristics of a PEM Fuel Cell
Intermediate-Size Vehicle in 2015
“Zero engine” body weight
Fuel cell rating (kW)
Cell weight (kg)
Power storage: power (kW)
Energy (kWh)
Weight (kg)
Total hybrid weight
EV range (for cold start)
Time at peak power (minutes)
Energy efficiency
(mpg, gasoline equivalent)
Price increment
($650/kWh)
($65 /kWh)
BipolarLead Acid Battery
540.0
37.1
148.3
39.0
3.5
78
914.5
22.1
4.6
83.1
$38,750
$4,510
Ultracapacitor
540.0
30.8
131.2
116.4
0.9
58.2
893.4
5.2
1.2
85.5
$36,500
$4,920
SOURCE: Energy and Environmental Analysis, Inc., “Automotive Technologies To Improve FuelEconomy to 2015,” prepared for the Office of Technology Assessment, June 1995, p. 10-82.
220
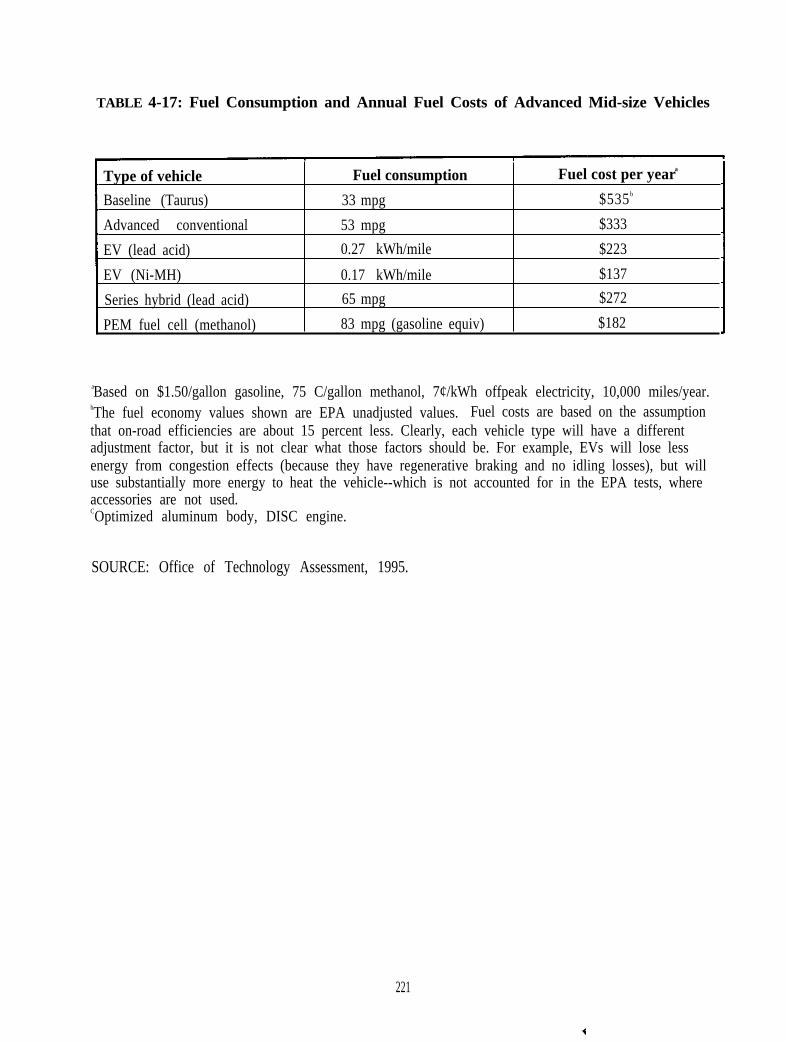
TABLE 4-17: Fuel Consumption and Annual Fuel Costs of Advanced Mid-size Vehicles
Type of vehicle Fuel consumption Fuel cost per yeara
Baseline (Taurus) 33 mpg $535 b
Advanced conventional 53 mpg $333
EV (lead acid) 0.27 kWh/mile $223
EV (Ni-MH) 0.17 kWh/mile $137
Series hybrid (lead acid) 65 mpg $272
PEM fuel cell (methanol) 83 mpg (gasoline equiv) $182
aBased on $1.50/gallon gasoline, 75 C/gallon methanol, 7¢/kWh offpeak electricity, 10,000 miles/year.bThe fuel economy values shown are EPA unadjusted values. Fuel costs are based on the assumptionthat on-road efficiencies are about 15 percent less. Clearly, each vehicle type will have a differentadjustment factor, but it is not clear what those factors should be. For example, EVs will lose lessenergy from congestion effects (because they have regenerative braking and no idling losses), but willuse substantially more energy to heat the vehicle--which is not accounted for in the EPA tests, whereaccessories are not used.COptimized aluminum body, DISC engine.
SOURCE: Office of Technology Assessment, 1995.
221
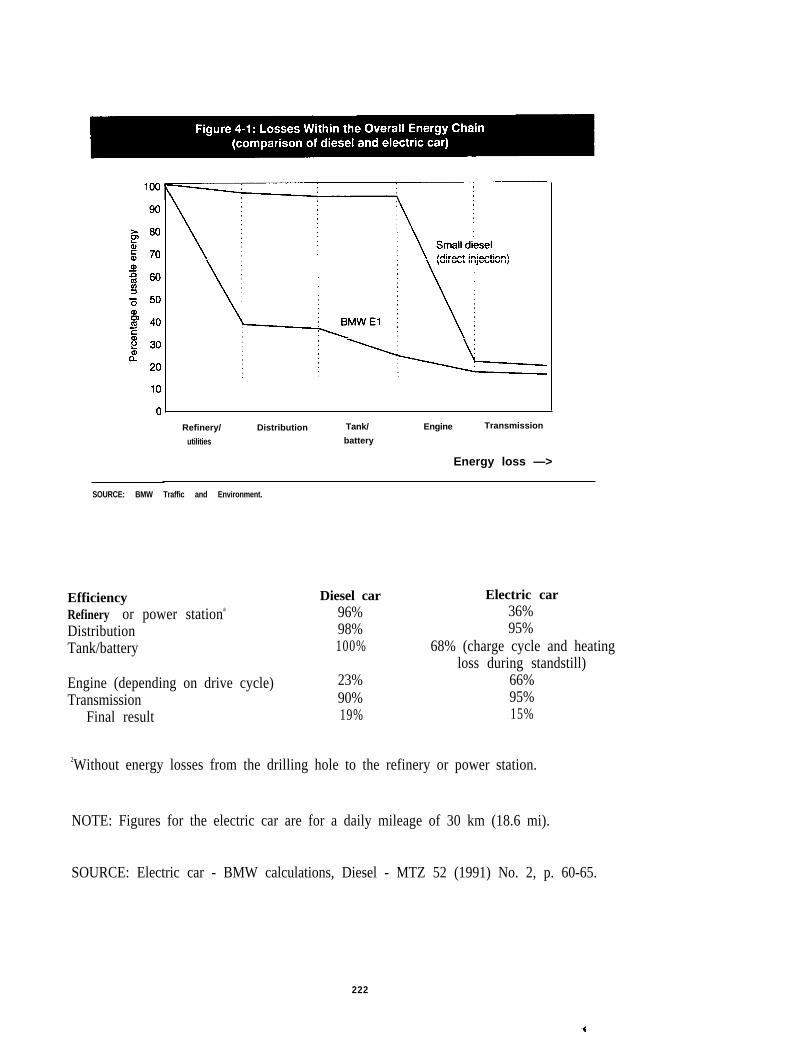
Refinery/ Distribution Tank/ Engine Transmission
utilities battery
Energy loss —>
SOURCE: BMW Traffic and Environment.
Efficiency Diesel car Electric carRefinery or power stationa 96% 36%Distribution 98% 95%Tank/battery 100% 68% (charge cycle and heating
loss during standstill)Engine (depending on drive cycle) 23% 66%Transmission 90% 95%
Final result 19% 15%
2Without energy losses from the drilling hole to the refinery or power station.
NOTE: Figures for the electric car are for a daily mileage of 30 km (18.6 mi).
SOURCE: Electric car - BMW calculations, Diesel - MTZ 52 (1991) No. 2, p. 60-65.
222
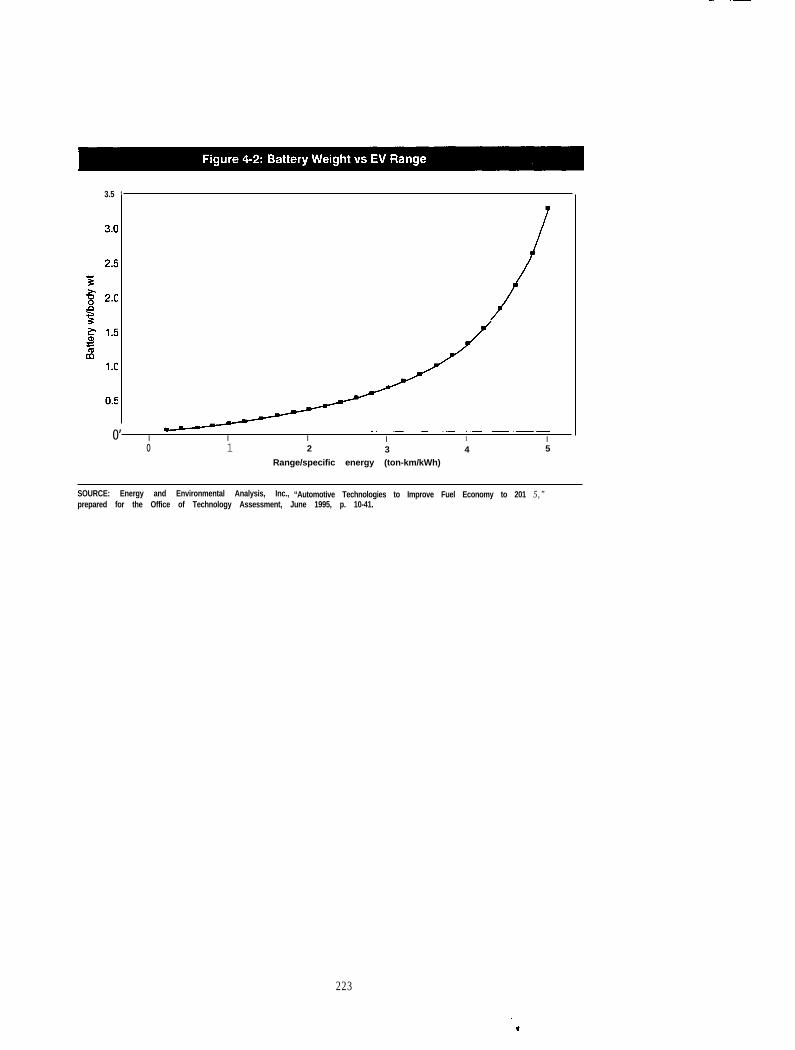
3.5 ‘
0’ | | | | 1 |
o 1 2 3 4 5
Range/specific energy (ton-km/kWh)
SOURCE: Energy and Environmental Analysis, Inc., “Automotive Technologies to Improve Fuel Economy to 201 5,”prepared for the Office of Technology Assessment, June 1995, p. 10-41.
223
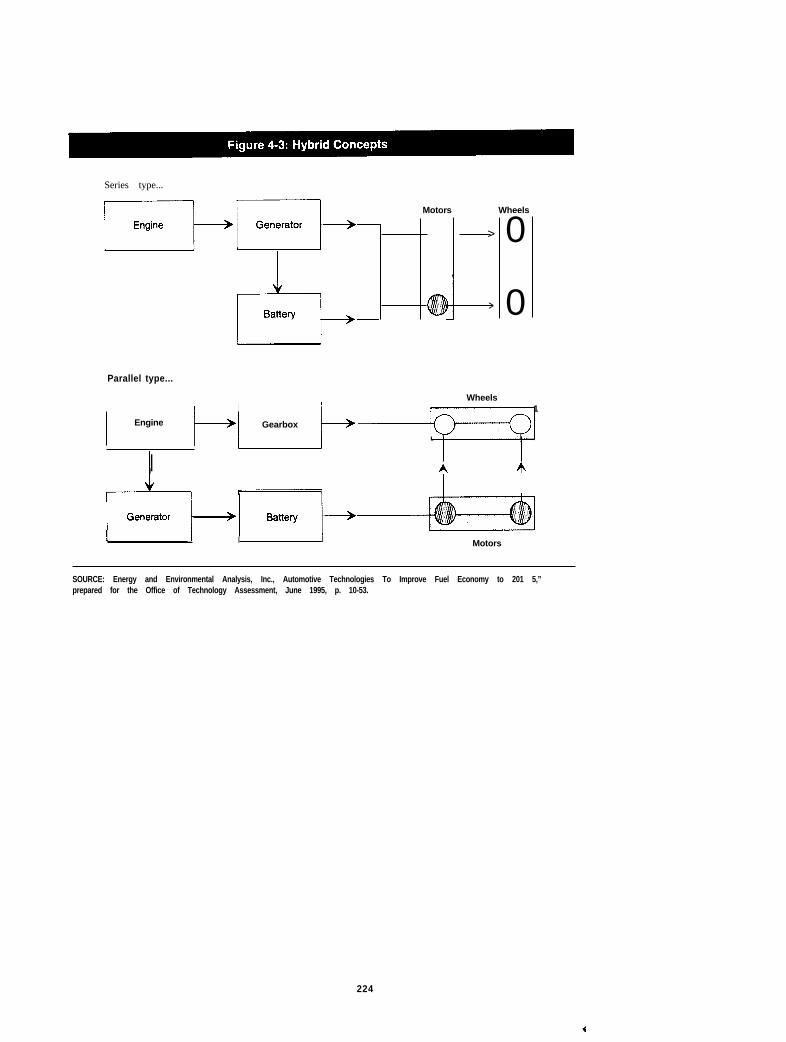
Series type...
Motors Wheels
>
>
0
0
Parallel type...
Wheels1
Engine Gearbox
||
L |
| |Motors
SOURCE: Energy and Environmental Analysis, Inc., Automotive Technologies To Improve Fuel Economy to 201 5,”prepared for the Office of Technology Assessment, June 1995, p. 10-53.
224