Embed Size (px)
Citation preview
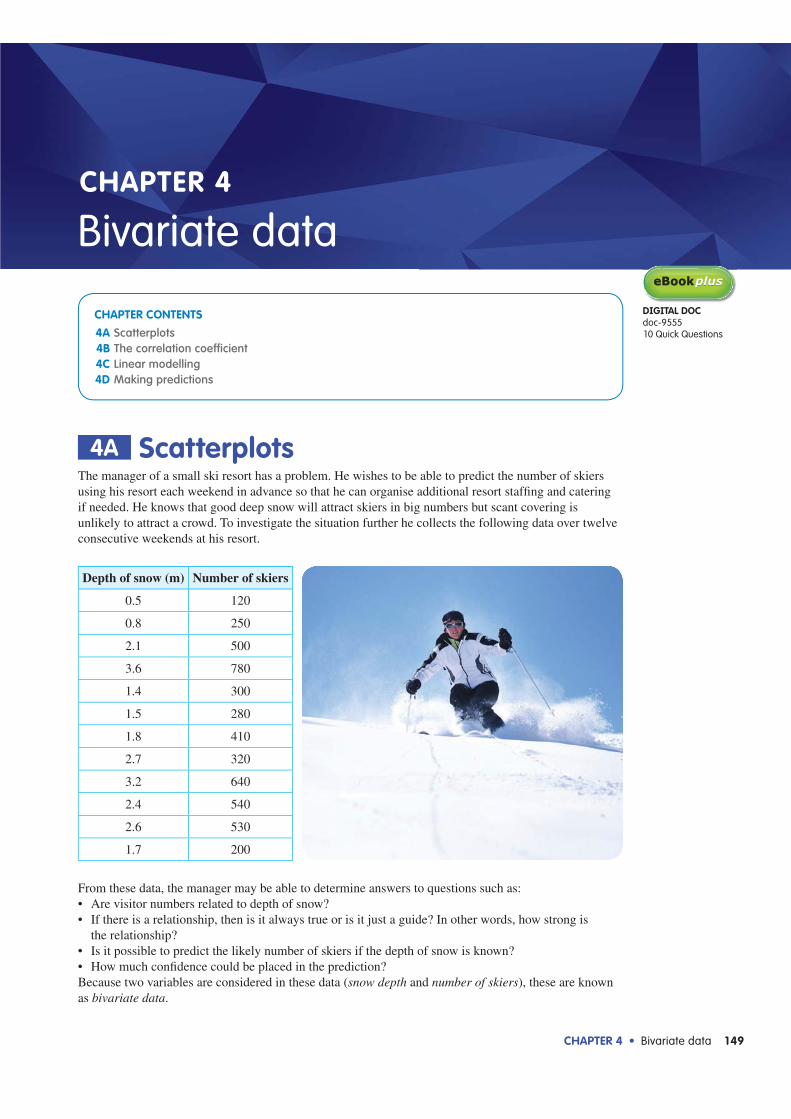
CHAPTER 4 Bivariate data 149
CHAPTER CONTENTS 4A Scatterplots 4B The correlation coefficient 4C Linear modelling 4D Making predictions
DIGITAL DOCdoc-955510 Quick Questions
CHAPTER 4
Bivariate data
4A ScatterplotsThe manager of a small ski resort has a problem. He wishes to be able to predict the number of skiers using his resort each weekend in advance so that he can organise additional resort staffi ng and catering if needed. He knows that good deep snow will attract skiers in big numbers but scant covering is unlikely to attract a crowd. To investigate the situation further he collects the following data over twelve consecutive weekends at his resort.
Depth of snow (m) Number of skiers
0.5 120
0.8 250
2.1 500
3.6 780
1.4 300
1.5 280
1.8 410
2.7 320
3.2 640
2.4 540
2.6 530
1.7 200
From these data, the manager may be able to determine answers to questions such as:Are visitor numbers related to depth of snow?If there is a relationship, then is it always true or is it just a guide? In other words, how strong is the relationship?Is it possible to predict the likely number of skiers if the depth of snow is known?How much confi dence could be placed in the prediction?
Because two variables are considered in these data (snow depth and number of skiers), these are known as bivariate data.
150 Maths Quest 11 Standard General Mathematics
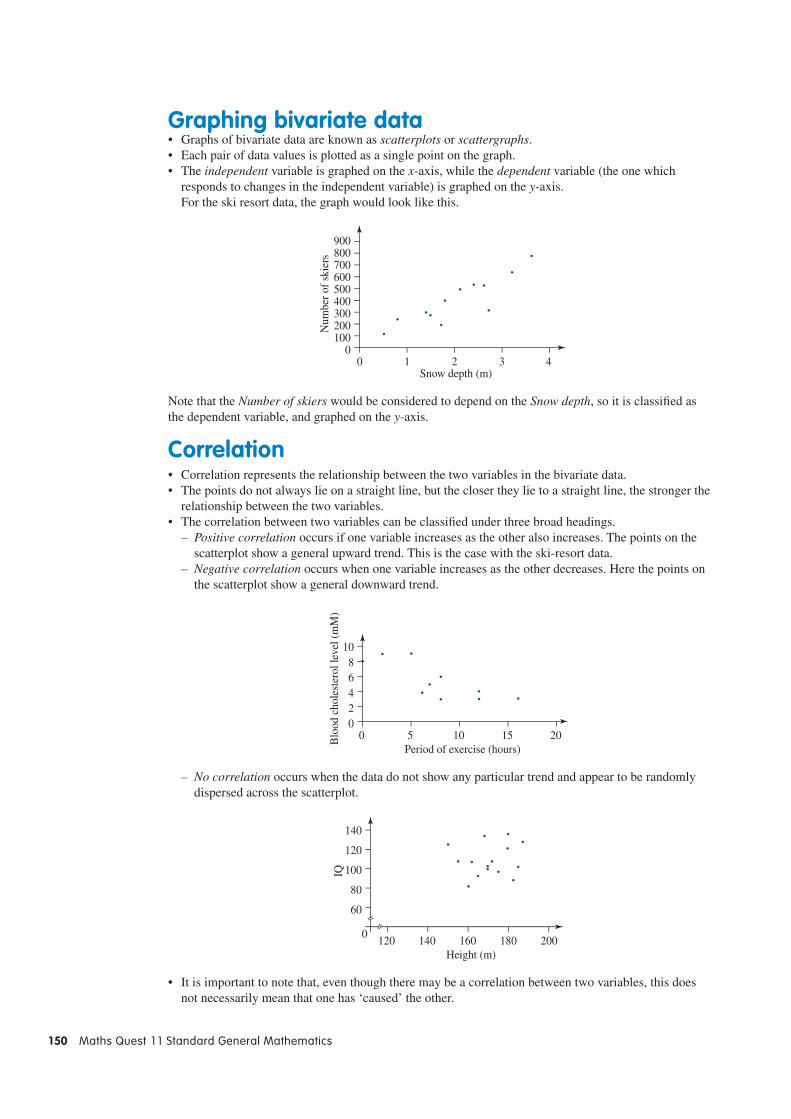
Graphing bivariate dataGraphs of bivariate data are known as scatterplots or scattergraphs.Each pair of data values is plotted as a single point on the graph.The independent variable is graphed on the x-axis, while the dependent variable (the one which responds to changes in the independent variable) is graphed on the y-axis.For the ski resort data, the graph would look like this.
00
100200300400500600700800900
1 2 3 4Snow depth (m)
Num
ber
of s
kier
s
Note that the Number of skiers would be considered to depend on the Snow depth, so it is classified as the dependent variable, and graphed on the y-axis.
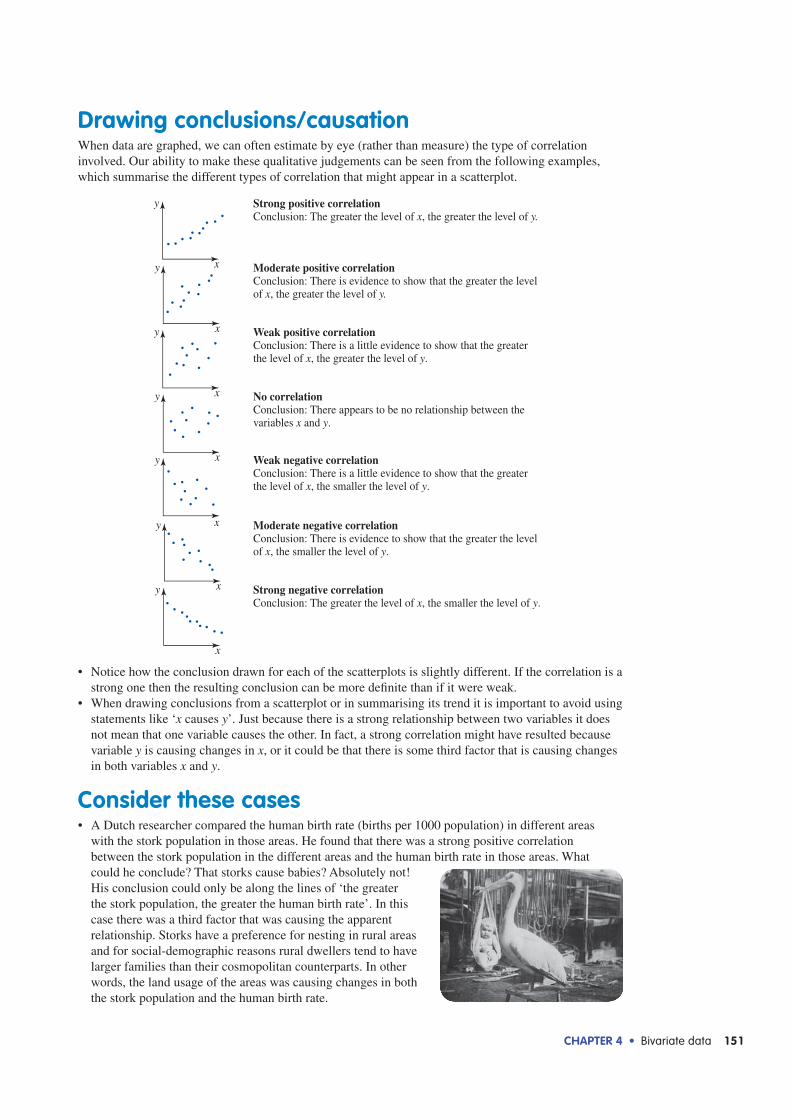
CorrelationCorrelation represents the relationship between the two variables in the bivariate data.The points do not always lie on a straight line, but the closer they lie to a straight line, the stronger the relationship between the two variables.The correlation between two variables can be classified under three broad headings.– Positive correlation occurs if one variable increases as the other also increases. The points on the
scatterplot show a general upward trend. This is the case with the ski-resort data.– Negative correlation occurs when one variable increases as the other decreases. Here the points on
the scatterplot show a general downward trend.
00246
108
5 10 15 20Period of exercise (hours)
Blo
od c
hole
ster
ol le
vel (
mM
)
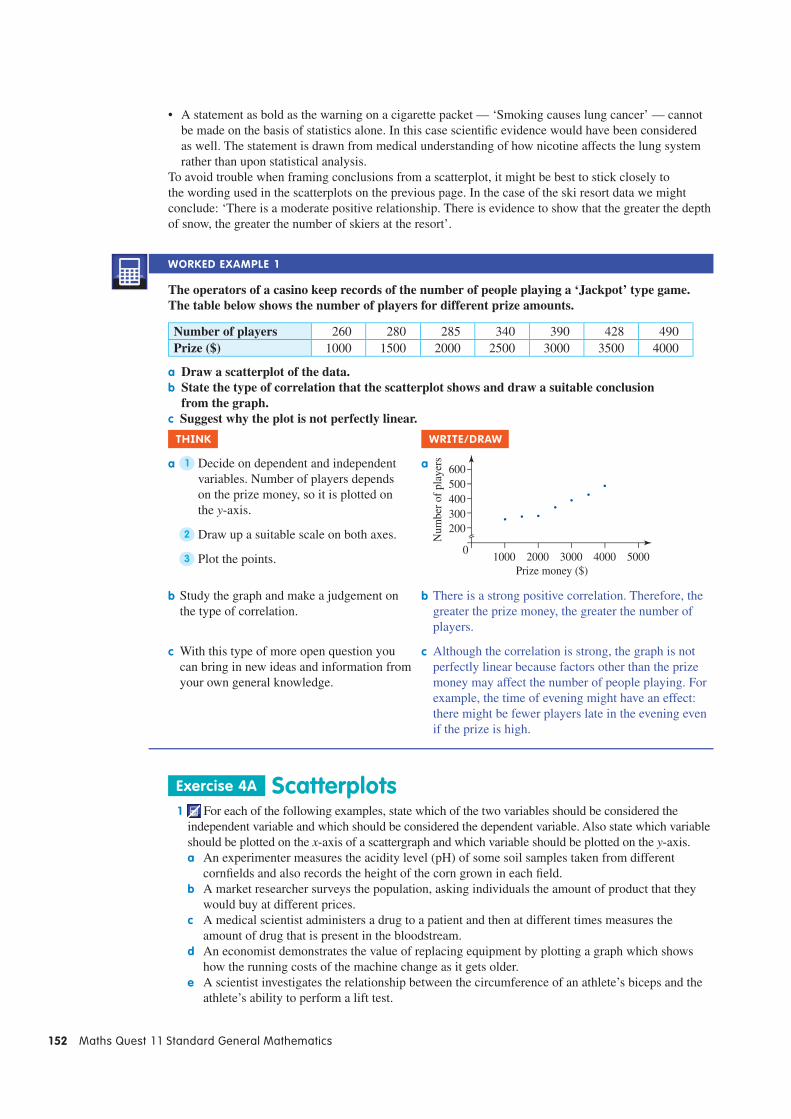
– No correlation occurs when the data do not show any particular trend and appear to be randomly dispersed across the scatterplot.
1200
60
80
100
120
140
140 160 180 200Height (m)
IQ
It is important to note that, even though there may be a correlation between two variables, this does not necessarily mean that one has ‘caused’ the other.
CHAPTER 4 Bivariate data 151
Drawing conclusions/causationWhen data are graphed, we can often estimate by eye (rather than measure) the type of correlation involved. Our ability to make these qualitative judgements can be seen from the following examples, which summarise the different types of correlation that might appear in a scatterplot.
Strong positive correlationConclusion: The greater the level of x, the greater the level of y.
Moderate positive correlationConclusion: There is evidence to show that the greater the level of x, the greater the level of y.
Weak positive correlationConclusion: There is a little evidence to show that the greater the level of x, the greater the level of y.
No correlationConclusion: There appears to be no relationship between the variables x and y.
Weak negative correlationConclusion: There is a little evidence to show that the greater the level of x, the smaller the level of y.
Moderate negative correlationConclusion: There is evidence to show that the greater the level of x, the smaller the level of y.
Strong negative correlationConclusion: The greater the level of x, the smaller the level of y.
x
y
x
y
x
y
x
y
x
y
x
y
x
y
Notice how the conclusion drawn for each of the scatterplots is slightly different. If the correlation is a strong one then the resulting conclusion can be more definite than if it were weak.When drawing conclusions from a scatterplot or in summarising its trend it is important to avoid using statements like ‘x causes y’. Just because there is a strong relationship between two variables it does not mean that one variable causes the other. In fact, a strong correlation might have resulted because variable y is causing changes in x, or it could be that there is some third factor that is causing changes in both variables x and y.
Consider these casesA Dutch researcher compared the human birth rate (births per 1000 population) in different areas with the stork population in those areas. He found that there was a strong positive correlation between the stork population in the different areas and the human birth rate in those areas. What could he conclude? That storks cause babies? Absolutely not! His conclusion could only be along the lines of ‘the greater the stork population, the greater the human birth rate’. In this case there was a third factor that was causing the apparent relationship. Storks have a preference for nesting in rural areas and for social-demographic reasons rural dwellers tend to have larger families than their cosmopolitan counterparts. In other words, the land usage of the areas was causing changes in both the stork population and the human birth rate.
152 Maths Quest 11 Standard General Mathematics
A statement as bold as the warning on a cigarette packet — ‘Smoking causes lung cancer’ — cannot be made on the basis of statistics alone. In this case scientifi c evidence would have been considered as well. The statement is drawn from medical understanding of how nicotine affects the lung system rather than upon statistical analysis.
To avoid trouble when framing conclusions from a scatterplot, it might be best to stick closely to the wording used in the scatterplots on the previous page. In the case of the ski resort data we might conclude: ‘There is a moderate positive relationship. There is evidence to show that the greater the depth of snow, the greater the number of skiers at the resort’.
WORKED EXAMPLE 1
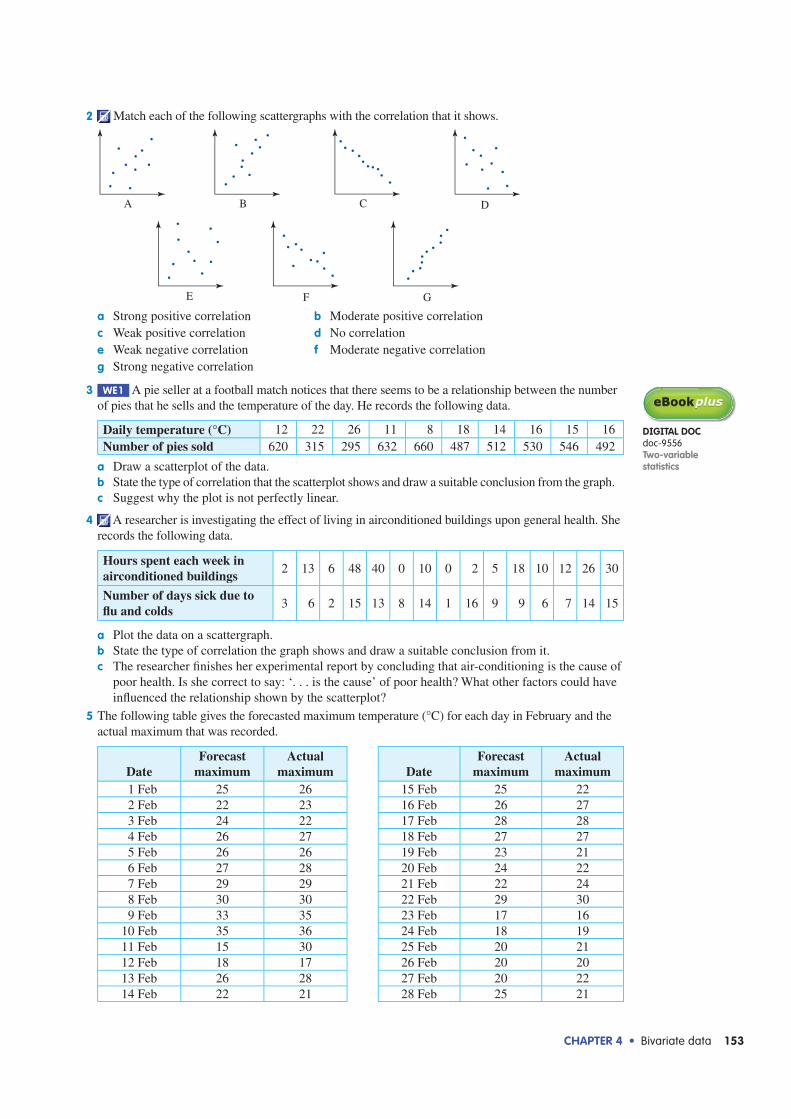
The operators of a casino keep records of the number of people playing a ‘Jackpot’ type game. The table below shows the number of players for different prize amounts.
Number of players 260 280 285 340 390 428 490Prize ($) 1000 1500 2000 2500 3000 3500 4000
a Draw a scatterplot of the data.b State the type of correlation that the scatterplot shows and draw a suitable conclusion
from the graph.c Suggest why the plot is not perfectly linear.
THINK WRITE/DRAW
a 1 Decide on dependent and independent variables. Number of players depends on the prize money, so it is plotted on the y-axis.
a
0
200300400500600
1000 2000 3000 4000 5000Prize money ($)
Num
ber
of p
laye
rs
2 Draw up a suitable scale on both axes.
3 Plot the points.
b Study the graph and make a judgement on the type of correlation.
b There is a strong positive correlation. Therefore, the greater the prize money, the greater the number of players.
c With this type of more open question you can bring in new ideas and information from your own general knowledge.
c Although the correlation is strong, the graph is not perfectly linear because factors other than the prize money may affect the number of people playing. For example, the time of evening might have an effect: there might be fewer players late in the evening even if the prize is high.
Exercise 4A Scatterplots 1 For each of the following examples, state which of the two variables should be considered the
independent variable and which should be considered the dependent variable. Also state which variable should be plotted on the x-axis of a scattergraph and which variable should be plotted on the y-axis.a An experimenter measures the acidity level (pH) of some soil samples taken from different
cornfi elds and also records the height of the corn grown in each fi eld.b A market researcher surveys the population, asking individuals the amount of product that they
would buy at different prices.c A medical scientist administers a drug to a patient and then at different times measures the
amount of drug that is present in the bloodstream.d An economist demonstrates the value of replacing equipment by plotting a graph which shows
how the running costs of the machine change as it gets older.e A scientist investigates the relationship between the circumference of an athlete’s biceps and the
athlete’s ability to perform a lift test.
CHAPTER 4 Bivariate data 153
2 Match each of the following scattergraphs with the correlation that it shows.
A
B
C
D
E
F
G
a Strong positive correlation b Moderate positive correlationc Weak positive correlation d No correlatione Weak negative correlation f Moderate negative correlationg Strong negative correlation
3 WE1 A pie seller at a football match notices that there seems to be a relationship between the number of pies that he sells and the temperature of the day. He records the following data.
Daily temperature (°C) 12 22 26 11 8 18 14 16 15 16Number of pies sold 620 315 295 632 660 487 512 530 546 492
a Draw a scatterplot of the data.b State the type of correlation that the scatterplot shows and draw a suitable conclusion from the graph.c Suggest why the plot is not perfectly linear.
4 A researcher is investigating the effect of living in airconditioned buildings upon general health. She records the following data.
Hours spent each week in airconditioned buildings
2 13 6 48 40 0 10 0 2 5 18 10 12 26 30
Number of days sick due to fl u and colds
3 6 2 15 13 8 14 1 16 9 9 6 7 14 15
a Plot the data on a scattergraph.b State the type of correlation the graph shows and draw a suitable conclusion from it.c The researcher fi nishes her experimental report by concluding that air-conditioning is the cause of
poor health. Is she correct to say: ‘. . . is the cause’ of poor health? What other factors could have infl uenced the relationship shown by the scatterplot?
5 The following table gives the forecasted maximum temperature (°C) for each day in February and the actual maximum that was recorded.
DateForecast
maximumActual
maximum DateForecast
maximumActual
maximum 1 Feb 25 26 15 Feb 25 22 2 Feb 22 23 16 Feb 26 27 3 Feb 24 22 17 Feb 28 28 4 Feb 26 27 18 Feb 27 27 5 Feb 26 26 19 Feb 23 21 6 Feb 27 28 20 Feb 24 22 7 Feb 29 29 21 Feb 22 24 8 Feb 30 30 22 Feb 29 30 9 Feb 33 35 23 Feb 17 1610 Feb 35 36 24 Feb 18 1911 Feb 15 30 25 Feb 20 2112 Feb 18 17 26 Feb 20 2013 Feb 26 28 27 Feb 20 2214 Feb 22 21 28 Feb 25 21
DIGITAL DOCdoc-9556Two-variablestatistics
154 Maths Quest 11 Standard General Mathematics
a Plot the data on a scattergraph. (You may like to attempt this using a CAS calculator.)b State the type of correlation the graph shows and draw a suitable conclusion from it.c What can you say about the ability of weather forecasters to ‘get it right’?
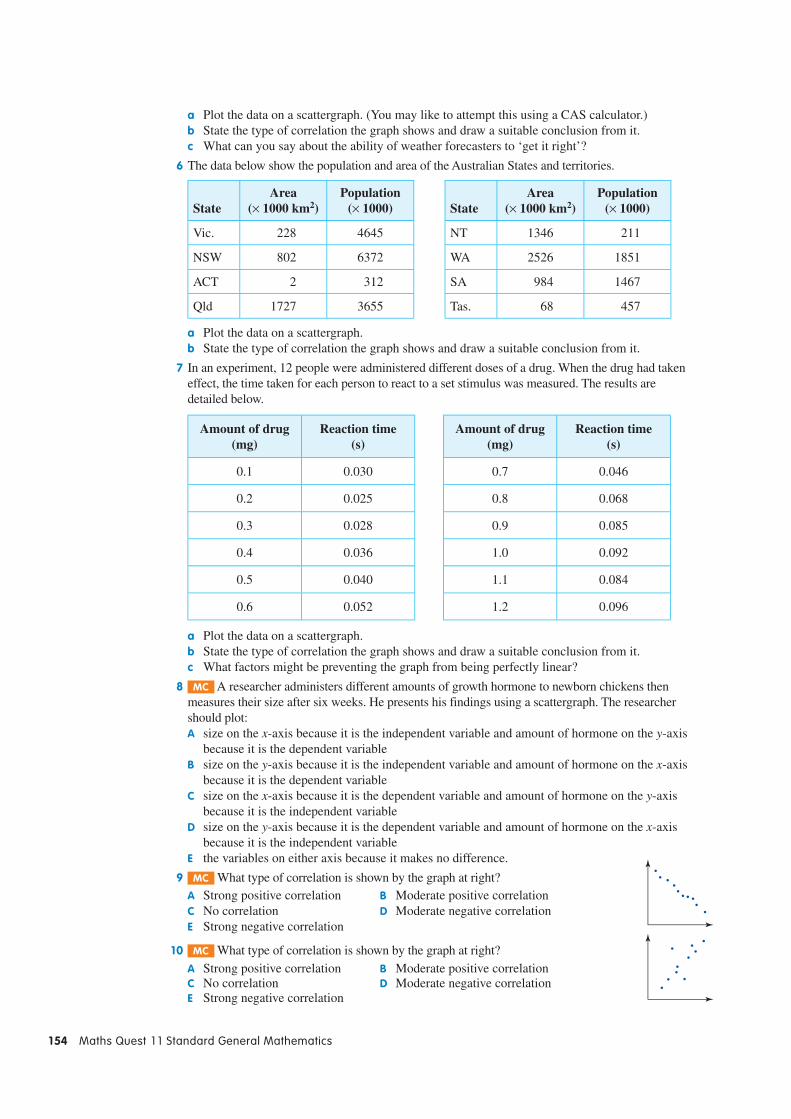
6 The data below show the population and area of the Australian States and territories.
StateArea
(× 1000 km2)Population
(× 1000) StateArea
(× 1000 km2)Population
(× 1000)
Vic. 228 4645 NT 1346 211
NSW 802 6372 WA 2526 1851
ACT 2 312 SA 984 1467
Qld 1727 3655 Tas. 68 457
a Plot the data on a scattergraph.b State the type of correlation the graph shows and draw a suitable conclusion from it.
7 In an experiment, 12 people were administered different doses of a drug. When the drug had taken effect, the time taken for each person to react to a set stimulus was measured. The results are detailed below.
Amount of drug (mg)
Reaction time (s)
Amount of drug (mg)
Reaction time (s)
0.1 0.030 0.7 0.046
0.2 0.025 0.8 0.068
0.3 0.028 0.9 0.085
0.4 0.036 1.0 0.092
0.5 0.040 1.1 0.084
0.6 0.052 1.2 0.096
a Plot the data on a scattergraph.b State the type of correlation the graph shows and draw a suitable conclusion from it.c What factors might be preventing the graph from being perfectly linear?
8 MC A researcher administers different amounts of growth hormone to newborn chickens then measures their size after six weeks. He presents his findings using a scattergraph. The researcher should plot:A size on the x-axis because it is the independent variable and amount of hormone on the y-axis
because it is the dependent variableB size on the y-axis because it is the independent variable and amount of hormone on the x-axis
because it is the dependent variableC size on the x-axis because it is the dependent variable and amount of hormone on the y-axis
because it is the independent variableD size on the y-axis because it is the dependent variable and amount of hormone on the x-axis
because it is the independent variableE the variables on either axis because it makes no difference.
9 MC What type of correlation is shown by the graph at right?A Strong positive correlation B Moderate positive correlationC No correlation D Moderate negative correlationE Strong negative correlation
10 MC What type of correlation is shown by the graph at right?A Strong positive correlation B Moderate positive correlationC No correlation D Moderate negative correlationE Strong negative correlation
CHAPTER 4 Bivariate data 155
11 MC A researcher finds that there is a moderate negative correlation between the amount of pollution found in water samples collected from different sites and the fish population of the sites. The researcher can conclude that:A Pollution is causing strain on the fi sh population.B There is evidence to show that the greater the level of pollution, the
lower the fi sh population.C There is evidence to show that the greater the level of pollution, the
greater the fi sh population.D Dead fi sh are causing the sites to become polluted.E Pollution has a negative effect on the environment.
4B The correlation coefficientSo far, our assessment of the type of correlation shown between two variables has been based upon subjective judgement. However, for more advanced work, we need a quantitative measurement of the strength of the relationship shown between a pair of variables. This measurement is known as a correlation coeffi cient.
There are several methods used for obtaining the correlation coeffi cient. The method which is used in this course is called the q-correlation coeffi cient. It can be found by using the steps detailed below.
Step 1. Draw a scatterplot of the data.Step 2. Find the position of the median. Remember the median is the
n 1
2
+th score if the scores are
arranged in order of size.Step 3. Draw a vertical line on the scatterplot of the data to indicate
the position of the median of the x-values. There should be an equal number of points on each side of this line. Then draw a horizontal line to indicate the position of the median of the y-values. Note that these lines may or may not pass through one or more of the data points.
Step 4. The scatterplot is now divided into four sections or quadrants (hence the name ‘q’-correlation coeffi cient) that are labelled A, B, C and D as in the diagram at right. (The order of the labelling is important.)
Step 5. Count the number of data points that lie in each of the quadrants. Points which lie on either of the median lines are omitted.
Step 6. The correlation coeffi cient is calculated using the formula:
qb d
a b c d
( )a c ( )b d=
−)c
+b
where a is the number of data points in Ab is the number of data points in Bc is the number of data points in Cd is the number of data points in D.
Step 7. The correlation coeffi cient may be interpreted by using the scale below.
Strong positive correlation (for 0.75 ≤ q ≤ 1)1.0
0.75
0.5
0.25
0
−0.25
−0.5
−0.75
Moderate positive correlation (for 0.5 ≤ q < 0.75)
Weak positive correlation (for 0.25 ≤ q < 0.5)
No correlation (for −0.25 < q < 0.25)
Weak negative correlation (for −0.5 < q ≤ −0.25)
Moderate negative correlation (for −0.75 < q ≤ −0.5)
Strong negative correlation (for −1 ≤ q ≤ −0.75)−1
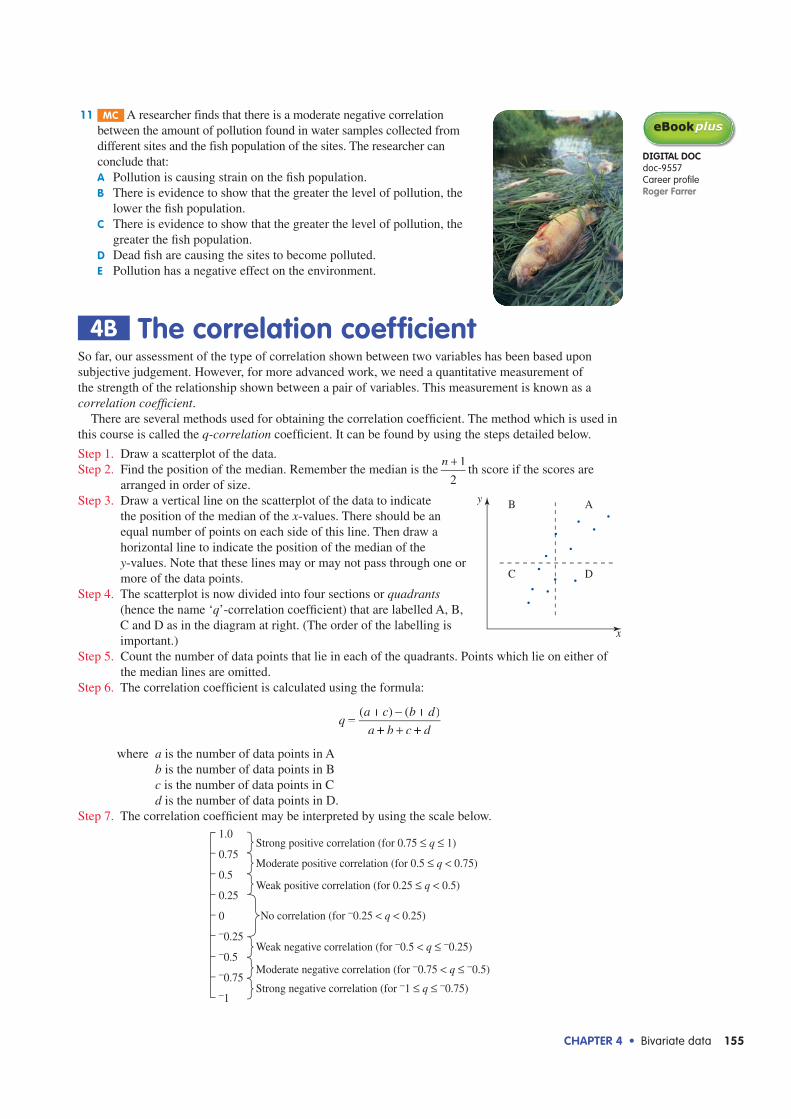
DIGITAL DOCdoc-9557Career profileRoger Farrer
x
y AB
DC
156 Maths Quest 11 Standard General Mathematics
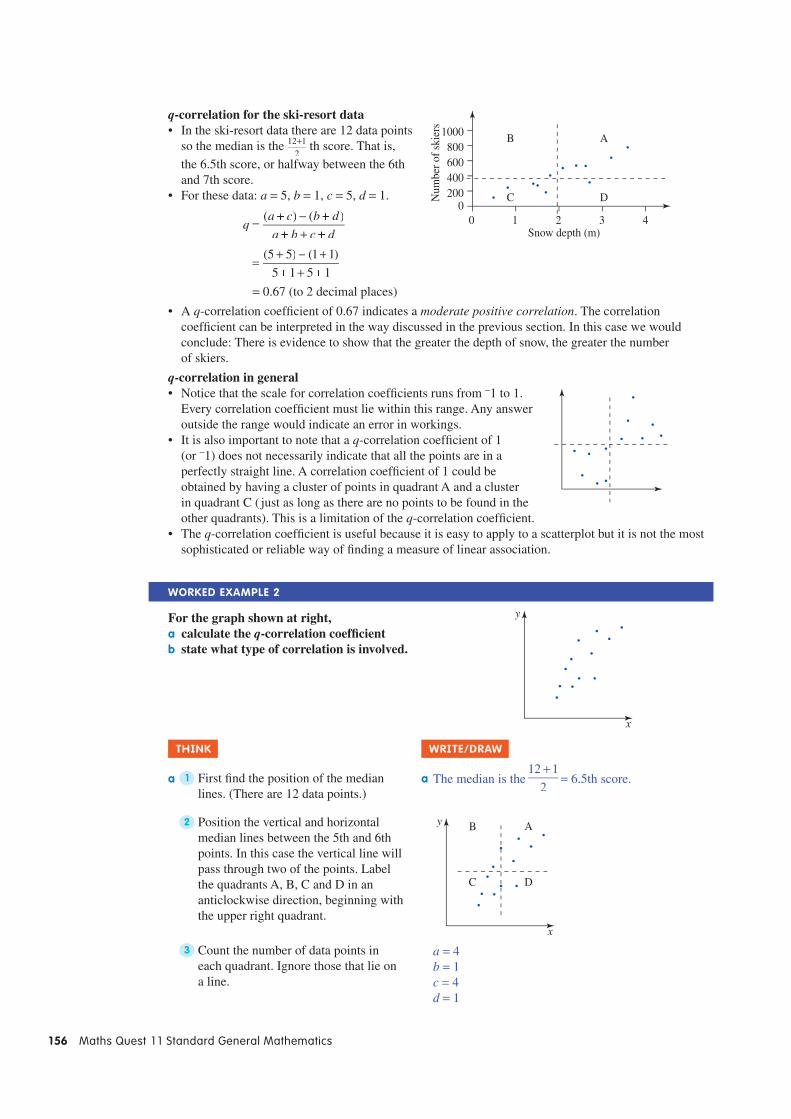
q-correlation for the ski-resort dataIn the ski-resort data there are 12 data points so the median is the 12 1
2+ th score. That is,
the 6.5th score, or halfway between the 6th and 7th score.For these data: a = 5, b = 1, c = 5, d = 1.
qb d
a b c d
( )a c ( )b d=
−)c
+b
(5 5) (1 1)
5 1 5 1=
+ −5) ++1
= 0.67 (to 2 decimal places)
A q-correlation coeffi cient of 0.67 indicates a moderate positive correlation. The correlation coeffi cient can be interpreted in the way discussed in the previous section. In this case we would conclude: There is evidence to show that the greater the depth of snow, the greater the number of skiers.
q-correlation in generalNotice that the scale for correlation coeffi cients runs from −1 to 1. Every correlation coeffi cient must lie within this range. Any answer outside the range would indicate an error in workings.It is also important to note that a q-correlation coeffi cient of 1 (or −1) does not necessarily indicate that all the points are in a perfectly straight line. A correlation coeffi cient of 1 could be obtained by having a cluster of points in quadrant A and a cluster in quadrant C ( just as long as there are no points to be found in the other quadrants). This is a limitation of the q-correlation coeffi cient. The q-correlation coeffi cient is useful because it is easy to apply to a scatterplot but it is not the most sophisticated or reliable way of fi nding a measure of linear association.
WORKED EXAMPLE 2
For the graph shown at right,a calculate the q-correlation coeffi cientb state what type of correlation is involved.
THINK WRITE/DRAW
a 1 First fi nd the position of the median lines. (There are 12 data points.)
a The median is the12 1
2
+= 6.5th score.
2 Position the vertical and horizontal median lines between the 5th and 6th points. In this case the vertical line will pass through two of the points. Label the quadrants A, B, C and D in an anticlockwise direction, beginning with the upper right quadrant.
AB
C D
x
y
3 Count the number of data points in each quadrant. Ignore those that lie on a line.
a = 4b = 1c = 4d = 1
00
200400600
1000800
1
B A
C D
2 3 4Snow depth (m)
Num
ber
of s
kier
s
x
y
CHAPTER 4 Bivariate data 157
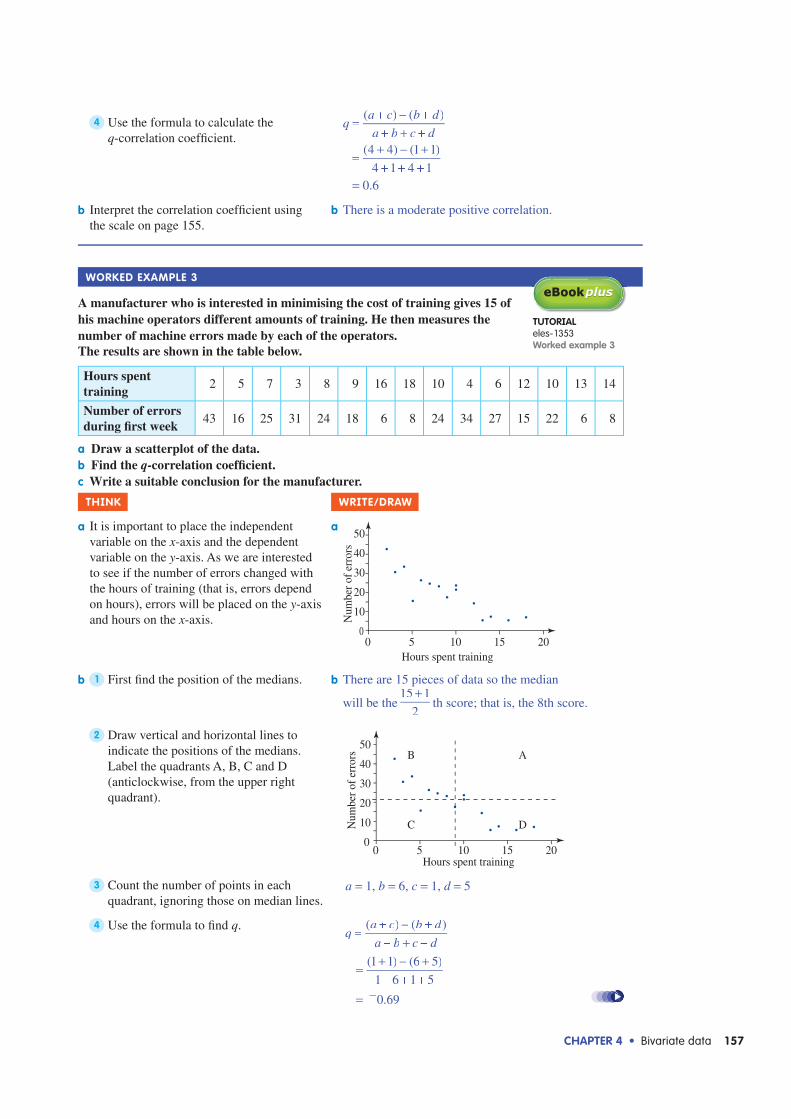
4 Use the formula to calculate the q-correlation coeffi cient.
qb d
a b c d
( )a c ( )b d=
−)c
+b(4 4) (1 1)
4 1 4 1=
+ −4) +11
= 0.6
b Interpret the correlation coeffi cient using the scale on page 155.
b There is a moderate positive correlation.
WORKED EXAMPLE 3
A manufacturer who is interested in minimising the cost of training gives 15 of his machine operators different amounts of training. He then measures the number of machine errors made by each of the operators. The results are shown in the table below.
Hours spent training
2 5 7 3 8 9 16 18 10 4 6 12 10 13 14
Number of errors during fi rst week
43 16 25 31 24 18 6 8 24 34 27 15 22 6 8
a Draw a scatterplot of the data.b Find the q-correlation coeffi cient.c Write a suitable conclusion for the manufacturer.
THINK WRITE/DRAW
a It is important to place the independent variable on the x-axis and the dependent variable on the y-axis. As we are interested to see if the number of errors changed with the hours of training (that is, errors depend on hours), errors will be placed on the y-axis and hours on the x-axis.
a
00
10
30
40
50
20
5 10 15 20Hours spent training
Num
ber
of e
rror
s
b 1 First fi nd the position of the medians. b There are 15 pieces of data so the median
will be the15 1
2
+th score; that is, the 8th score.
2 Draw vertical and horizontal lines to indicate the positions of the medians. Label the quadrants A, B, C and D (anticlockwise, from the upper right quadrant).
00
10
30
40
50
20
5 10 15 20Hours spent training
Num
ber
of e
rror
s B A
C D
3 Count the number of points in each quadrant, ignoring those on median lines.
a = 1, b = 6, c = 1, d = 5
4 Use the formula to fi nd q.q
a b c d
( )a c ( )b d
(1 1) (6 5)
1 6 1 5
0.69
=−)c
+b
=+ −1) +
66
= −
TUTORIALeles-1353Worked example 3
158 Maths Quest 11 Standard General Mathematics
c Interpret the correlation coeffi cient using the scale presented on page 155.
c There is moderate negative correlation. There is evidence to show that the greater the number of hours spent in training, the lower the number of machine errors.
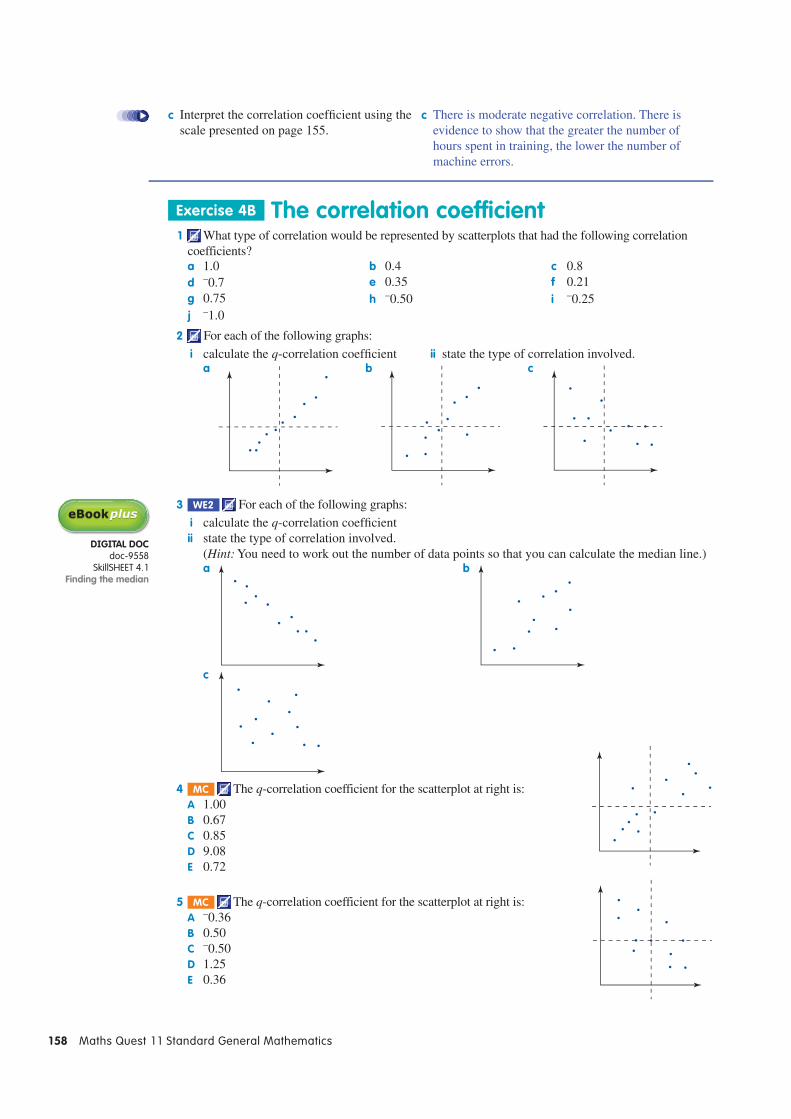
Exercise 4B The correlation coefficient 1 What type of correlation would be represented by scatterplots that had the following correlation
coefficients?a 1.0 b 0.4 c 0.8d −0.7 e 0.35 f 0.21g 0.75 h −0.50 i −0.25j −1.0
2 For each of the following graphs:
i calculate the q-correlation coeffi cient ii state the type of correlation involved.a b c
3 WE2 For each of the following graphs:
i calculate the q-correlation coeffi cientii state the type of correlation involved.
(Hint: You need to work out the number of data points so that you can calculate the median line.)a b
c
4 MC The q-correlation coefficient for the scatterplot at right is:A 1.00B 0.67C 0.85D 9.08E 0.72
5 MC The q-correlation coefficient for the scatterplot at right is:A −0.36B 0.50C −0.50D 1.25E 0.36
DIGITAL DOCdoc-9558
SkillSHEET 4.1Finding the median
CHAPTER 4 Bivariate data 159
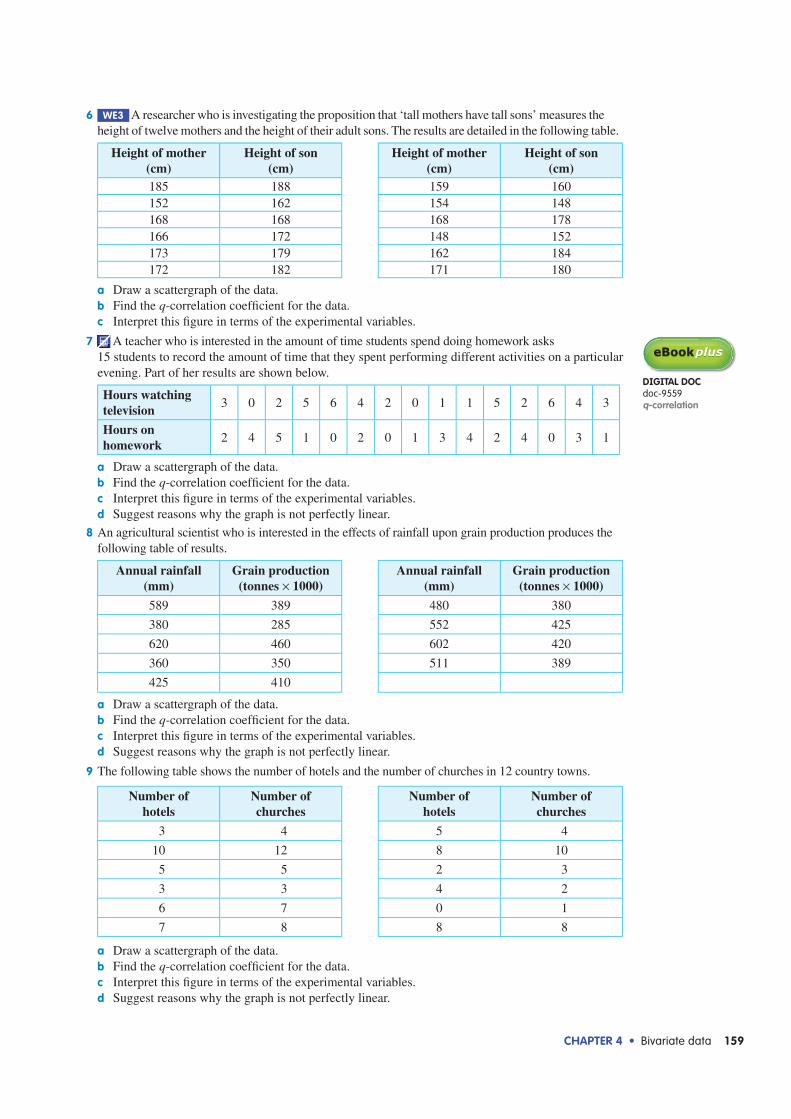
6 WE3 A researcher who is investigating the proposition that ‘tall mothers have tall sons’ measures the height of twelve mothers and the height of their adult sons. The results are detailed in the following table.
Height of mother (cm)
Height of son(cm)
Height of mother (cm)
Height of son(cm)
185 188 159 160152 162 154 148168 168 168 178166 172 148 152173 179 162 184172 182 171 180
a Draw a scattergraph of the data.b Find the q-correlation coeffi cient for the data.c Interpret this fi gure in terms of the experimental variables.
7 A teacher who is interested in the amount of time students spend doing homework asks15 students to record the amount of time that they spent performing different activities on a particular evening. Part of her results are shown below.
Hours watching television
3 0 2 5 6 4 2 0 1 1 5 2 6 4 3
Hours on homework
2 4 5 1 0 2 0 1 3 4 2 4 0 3 1
a Draw a scattergraph of the data.b Find the q-correlation coeffi cient for the data.c Interpret this fi gure in terms of the experimental variables.d Suggest reasons why the graph is not perfectly linear.
8 An agricultural scientist who is interested in the effects of rainfall upon grain production produces the following table of results.
Annual rainfall (mm)
Grain production (tonnes × 1000)
Annual rainfall (mm)
Grain production (tonnes × 1000)
589 389 480 380
380 285 552 425
620 460 602 420
360 350 511 389
425 410
a Draw a scattergraph of the data.b Find the q-correlation coeffi cient for the data.c Interpret this fi gure in terms of the experimental variables.d Suggest reasons why the graph is not perfectly linear.
9 The following table shows the number of hotels and the number of churches in 12 country towns.
Number of hotels
Number of churches
Number of hotels
Number of churches
3 4 5 4
10 12 8 10
5 5 2 3
3 3 4 2
6 7 0 1
7 8 8 8
a Draw a scattergraph of the data.b Find the q-correlation coeffi cient for the data.c Interpret this fi gure in terms of the experimental variables.d Suggest reasons why the graph is not perfectly linear.
DIGITAL DOCdoc-9559q-correlation
160 Maths Quest 11 Standard General Mathematics
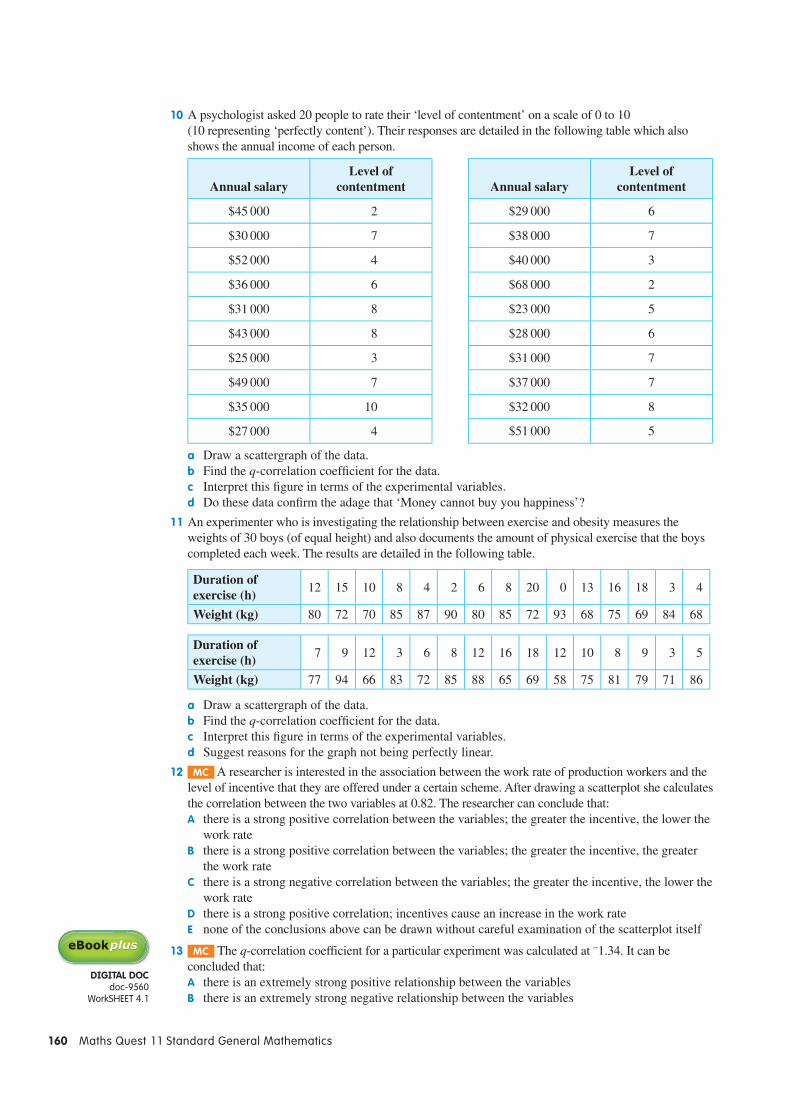
10 A psychologist asked 20 people to rate their ‘level of contentment’ on a scale of 0 to 10 (10 representing ‘perfectly content’). Their responses are detailed in the following table which also shows the annual income of each person.
Annual salaryLevel of
contentment Annual salaryLevel of
contentment
$45 000 2 $29 000 6
$30 000 7 $38 000 7
$52 000 4 $40 000 3
$36 000 6 $68 000 2
$31 000 8 $23 000 5
$43 000 8 $28 000 6
$25 000 3 $31 000 7
$49 000 7 $37 000 7
$35 000 10 $32 000 8
$27 000 4 $51 000 5
a Draw a scattergraph of the data.b Find the q-correlation coeffi cient for the data.c Interpret this fi gure in terms of the experimental variables.d Do these data confi rm the adage that ‘Money cannot buy you happiness’?
11 An experimenter who is investigating the relationship between exercise and obesity measures the weights of 30 boys (of equal height) and also documents the amount of physical exercise that the boys completed each week. The results are detailed in the following table.
Duration of exercise (h)
12 15 10 8 4 2 6 8 20 0 13 16 18 3 4
Weight (kg) 80 72 70 85 87 90 80 85 72 93 68 75 69 84 68
Duration of exercise (h)
7 9 12 3 6 8 12 16 18 12 10 8 9 3 5
Weight (kg) 77 94 66 83 72 85 88 65 69 58 75 81 79 71 86
a Draw a scattergraph of the data.b Find the q-correlation coeffi cient for the data.c Interpret this fi gure in terms of the experimental variables.d Suggest reasons for the graph not being perfectly linear.
12 MC A researcher is interested in the association between the work rate of production workers and the level of incentive that they are offered under a certain scheme. After drawing a scatterplot she calculates the correlation between the two variables at 0.82. The researcher can conclude that:A there is a strong positive correlation between the variables; the greater the incentive, the lower the
work rateB there is a strong positive correlation between the variables; the greater the incentive, the greater
the work rateC there is a strong negative correlation between the variables; the greater the incentive, the lower the
work rateD there is a strong positive correlation; incentives cause an increase in the work rateE none of the conclusions above can be drawn without careful examination of the scatterplot itself
13 MC The q-correlation coefficient for a particular experiment was calculated at −1.34. It can be concluded that:A there is an extremely strong positive relationship between the variablesB there is an extremely strong negative relationship between the variables
DIGITAL DOCdoc-9560
WorkSHEET 4.1
CHAPTER 4 Bivariate data 161
C there is no relationship between the variablesD the experiment was a failureE there was an error in calculations
14 a Calculate the q-correlation coefficient for the scatterplot at right.b Are the data truly linear (a totally straight line)? Explain the discrepancy
that has occurred.
15 The data in the table below show the population density and unemployment rates for nine countries. Use the data to test the hypothesis that overcrowding causes unemployment.
CountryPopulation density
(people/sq km)Unemployment
%Australia 2 9.4Canada 3 10.4France 102 9.4Germany 217 4.3Italy 189 10Japan 328 2.1New Zealand 13 10.2United Kingdom 235 8.9USA 27 6.8
4C Linear modellingIf a linear relationship exists between a pair of variables then it is useful to be able to summarise the relationship in terms of an equation. This equation can then be used to make predictions about the levels of one variable given the value of the other.The process of fi nding the equation is known as linear modelling. An equation can be found to represent the line which passes through any two points by using two coordinate geometry formulas.The gradient of the line, passing through (x1, y1) and (x2, y2) is given by:
my y
x x.
1y
2 1x=
The equation of a straight line with the gradient m and passing through (x1, y1) is given by:y − y1 = m(x − x1).
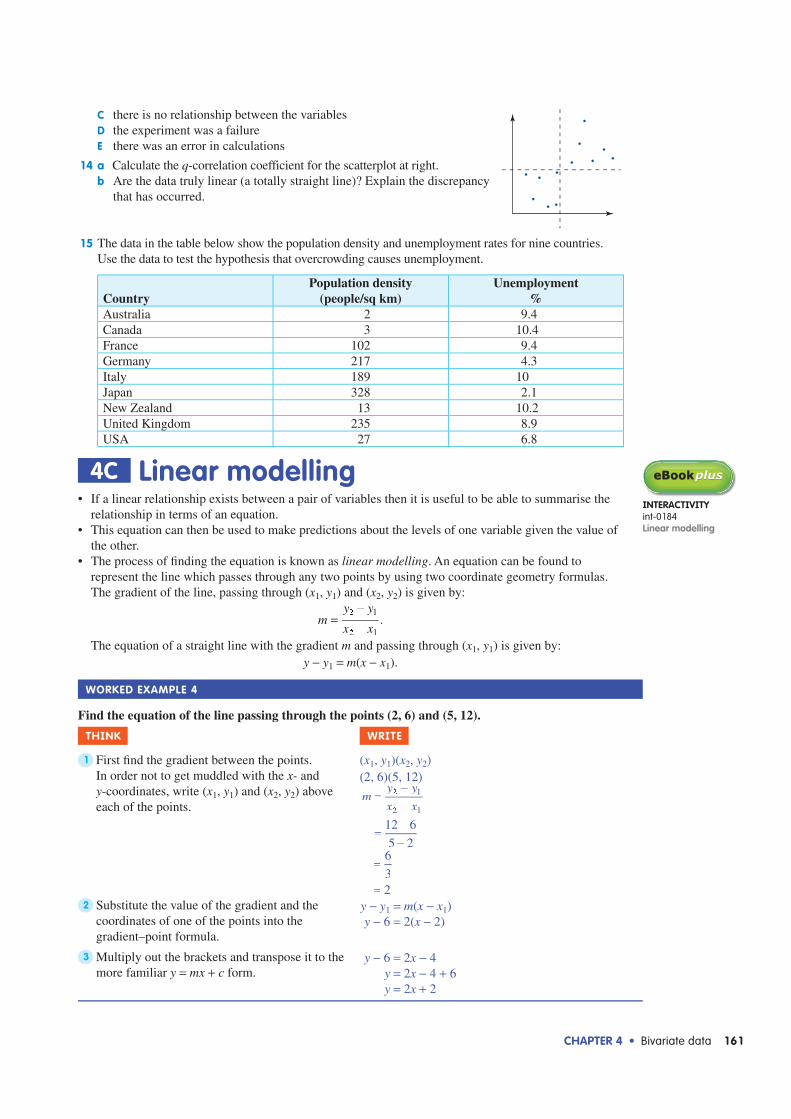
WORKED EXAMPLE 4
Find the equation of the line passing through the points (2, 6) and (5, 12).
THINK WRITE
1 First fi nd the gradient between the points. In order not to get muddled with the x- and y-coordinates, write (x1, y1) and (x2, y2) above each of the points.
(x1, y1)(x2, y2)(2, 6)(5, 12)
my y
x x
12 6
5 2
1y
2 1x=
=−
6
32
=
=2 Substitute the value of the gradient and the
coordinates of one of the points into the gradient–point formula.
y − y1 = m(x − x1)y − 6 = 2(x − 2)
3 Multiply out the brackets and transpose it to the more familiar y = mx + c form.
y − 6 = 2x − 4y = 2x − 4 + 6y = 2x + 2
INTERACTIVITYint-0184Linear modelling
162 Maths Quest 11 Standard General Mathematics
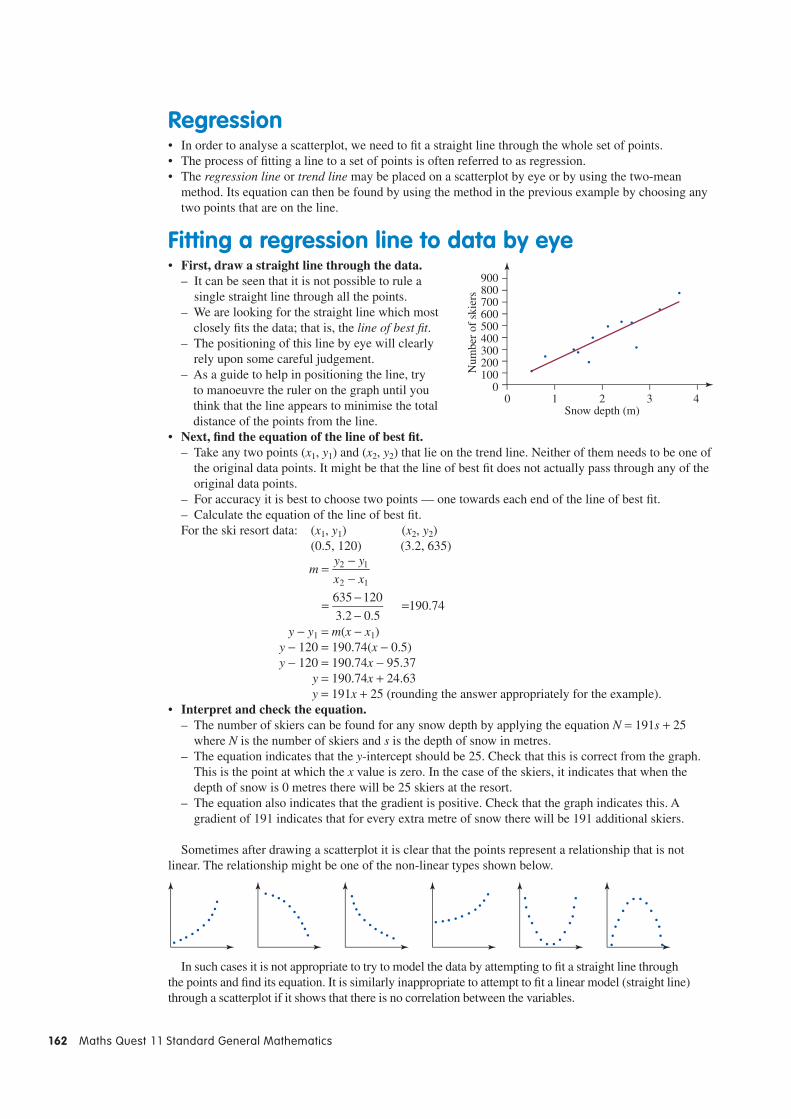
RegressionIn order to analyse a scatterplot, we need to fit a straight line through the whole set of points.The process of fitting a line to a set of points is often referred to as regression.The regression line or trend line may be placed on a scatterplot by eye or by using the two-mean method. Its equation can then be found by using the method in the previous example by choosing any two points that are on the line.
Fitting a regression line to data by eyeFirst, draw a straight line through the data.– It can be seen that it is not possible to rule a
single straight line through all the points.– We are looking for the straight line which most
closely fits the data; that is, the line of best fit.– The positioning of this line by eye will clearly
rely upon some careful judgement.– As a guide to help in positioning the line, try
to manoeuvre the ruler on the graph until you think that the line appears to minimise the total distance of the points from the line.
Next, find the equation of the line of best fit.– Take any two points (x1, y1) and (x2, y2) that lie on the trend line. Neither of them needs to be one of
the original data points. It might be that the line of best fit does not actually pass through any of the original data points.
– For accuracy it is best to choose two points — one towards each end of the line of best fit.– Calculate the equation of the line of best fit.For the ski resort data: (x1, y1) (x2, y2)
(0.5, 120) (3.2, 635)
my y
x x
635 120
3.2 0.5
2 1
2 1=
−−
=−−
=190.74
y − y1 = m(x − x1) y − 120 = 190.74(x − 0.5)
y − 120 = 190.74x − 95.37 y = 190.74x + 24.63
y = 191x + 25 (rounding the answer appropriately for the example).Interpret and check the equation.– The number of skiers can be found for any snow depth by applying the equation N = 191s + 25
where N is the number of skiers and s is the depth of snow in metres.– The equation indicates that the y-intercept should be 25. Check that this is correct from the graph.
This is the point at which the x value is zero. In the case of the skiers, it indicates that when the depth of snow is 0 metres there will be 25 skiers at the resort.
– The equation also indicates that the gradient is positive. Check that the graph indicates this. A gradient of 191 indicates that for every extra metre of snow there will be 191 additional skiers.
Sometimes after drawing a scatterplot it is clear that the points represent a relationship that is not linear. The relationship might be one of the non-linear types shown below.
In such cases it is not appropriate to try to model the data by attempting to fit a straight line through the points and find its equation. It is similarly inappropriate to attempt to fit a linear model (straight line) through a scatterplot if it shows that there is no correlation between the variables.
00
100200300400500600700800900
1 2 3 4Snow depth (m)
Num
ber
of s
kier
s
CHAPTER 4 Bivariate data 163
WORKED EXAMPLE 5
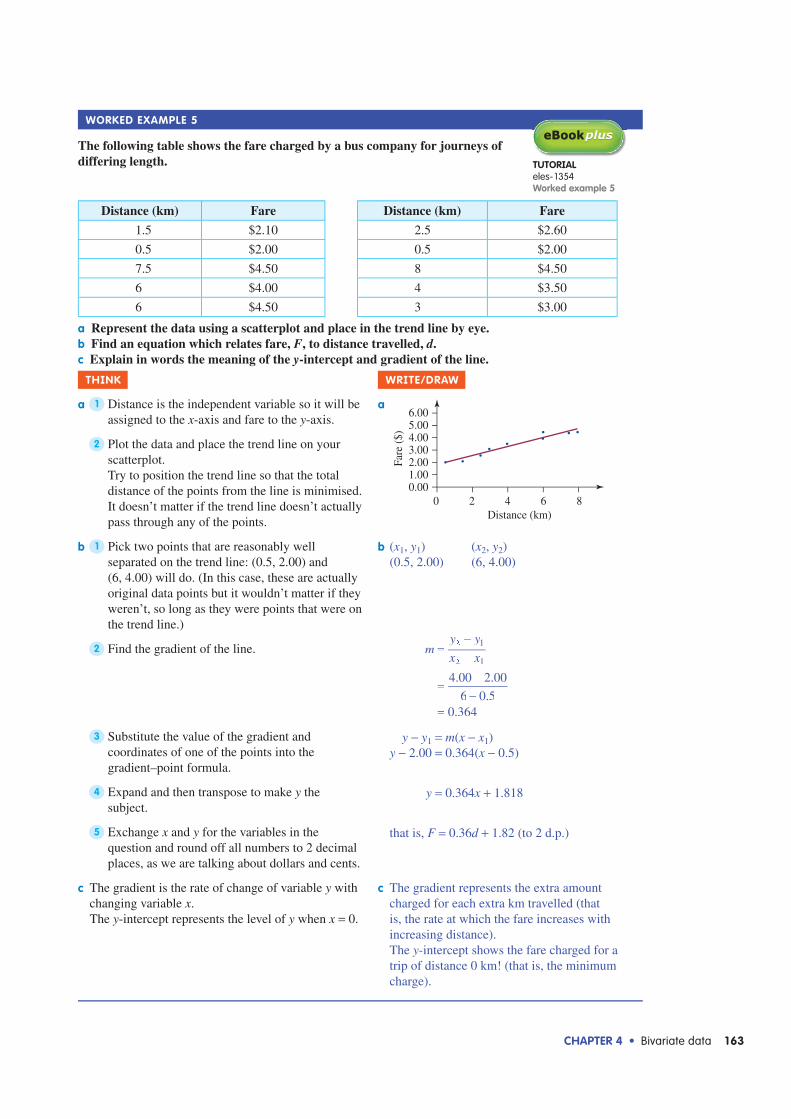
The following table shows the fare charged by a bus company for journeys of differing length.
Distance (km) Fare Distance (km) Fare
1.5 $2.10 2.5 $2.60
0.5 $2.00 0.5 $2.00
7.5 $4.50 8 $4.50
6 $4.00 4 $3.50
6 $4.50 3 $3.00
a Represent the data using a scatterplot and place in the trend line by eye.b Find an equation which relates fare, F, to distance travelled, d.c Explain in words the meaning of the y-intercept and gradient of the line.
THINK WRITE/DRAW
a 1 Distance is the independent variable so it will be assigned to the x-axis and fare to the y-axis.
a
0
6.005.004.003.002.001.000.00
2 4 6 8Distance (km)
Fare
($)
2 Plot the data and place the trend line on your scatterplot.Try to position the trend line so that the total distance of the points from the line is minimised. It doesn’t matter if the trend line doesn’t actually pass through any of the points.
b 1 Pick two points that are reasonably well separated on the trend line: (0.5, 2.00) and (6, 4.00) will do. (In this case, these are actually original data points but it wouldn’t matter if they weren’t, so long as they were points that were on the trend line.)
b (x1, y1) (x2, y2)(0.5, 2.00) (6, 4.00)
2 Find the gradient of the line. my y
x x
4.00 2.00
6 0.50.364
1y
2 1x=
=−
−=
3 Substitute the value of the gradient and coordinates of one of the points into the gradient–point formula.
y − y1 = m(x − x1)y − 2.00 = 0.364(x − 0.5)
4 Expand and then transpose to make y the subject.
y = 0.364x + 1.818
5 Exchange x and y for the variables in the question and round off all numbers to 2 decimal places, as we are talking about dollars and cents.
that is, F = 0.36d + 1.82 (to 2 d.p.)
c The gradient is the rate of change of variable y with changing variable x.The y-intercept represents the level of y when x = 0.
c The gradient represents the extra amount charged for each extra km travelled (that is, the rate at which the fare increases with increasing distance).The y-intercept shows the fare charged for a trip of distance 0 km! (that is, the minimum charge).
TUTORIALeles-1354Worked example 5
164 Maths Quest 11 Standard General Mathematics
Scatterplots can be drawn manually or using a calculator. If using a calculator when the scatterplot is on the screen, the trend line can be fi tted by eye. That is, a movable line can be added to the scatterplot and rotated until it fi ts the data well. The equation of the line will appear on the screen.
WORKED EXAMPLE 6
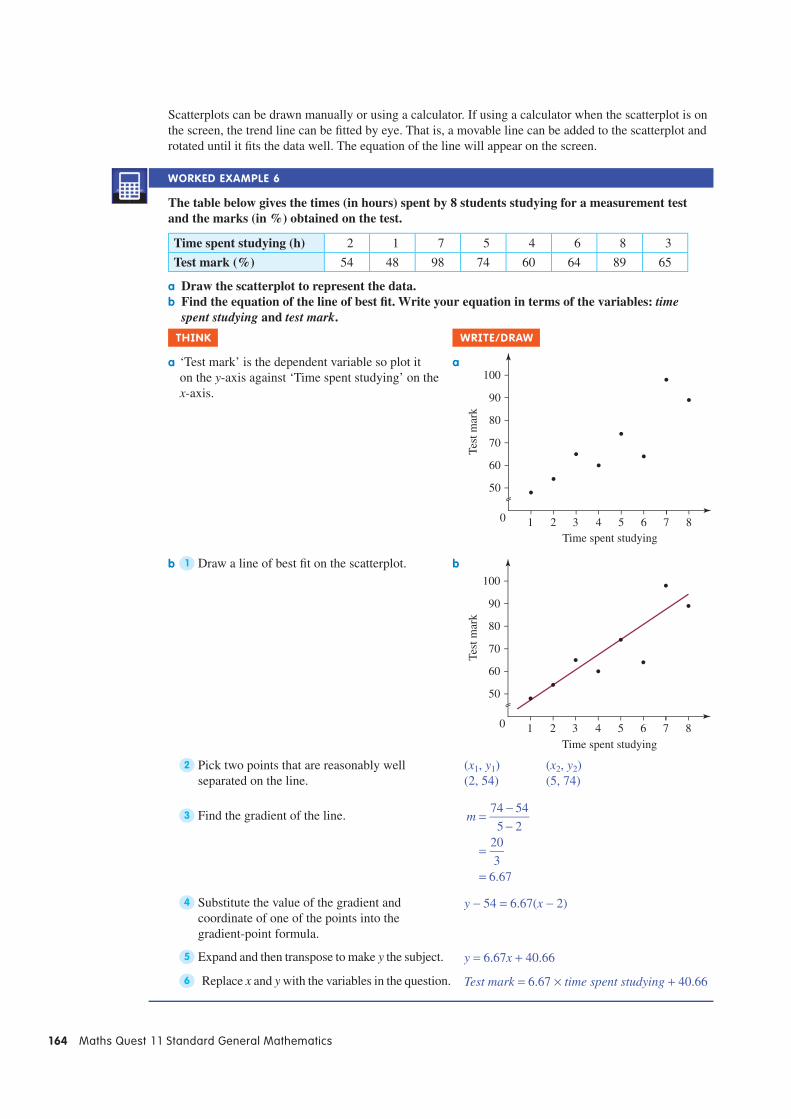
The table below gives the times (in hours) spent by 8 students studying for a measurement test and the marks (in %) obtained on the test.
Time spent studying (h) 2 1 7 5 4 6 8 3
Test mark (%) 54 48 98 74 60 64 89 65
a Draw the scatterplot to represent the data.b Find the equation of the line of best fi t. Write your equation in terms of the variables: time
spent studying and test mark.
THINK WRITE/DRAW
a ‘Test mark’ is the dependent variable so plot it on the y-axis against ‘Time spent studying’ on the x-axis.
a
10 3 4Time spent studying
Test
mar
k
5 6 7 82
50
70
60
80
100
90
b 1 Draw a line of best fi t on the scatterplot. b
10 3Time spent studying
Test
mar
k
4 5 6 7 82
50
70
60
80
100
90
2 Pick two points that are reasonably well separated on the line.
(x1, y1) (x2, y2)(2, 54) (5, 74)
3 Find the gradient of the line. m74 54
5 220
36.67
=−−
=
=
4 Substitute the value of the gradient and coordinate of one of the points into the gradient-point formula.
y − 54 = 6.67(x − 2)
5 Expand and then transpose to make y the subject. y = 6.67x + 40.66
6 Replace x and y with the variables in the question. Test mark = 6.67 × time spent studying + 40.66
CHAPTER 4 Bivariate data 165
The two-mean regression lineThe equation of the regression (or trend) line can also be found using the two-mean method. This method also involves fi nding the equation of the straight line using two points (x1, y1) and (x2, y2). However, unlike the method of fi tting the line by eye, where any two points can be selected, the coordinates of the two points used here need to be calculated in a certain way, as follows.1. First, we need to ensure the data points are arranged so that the x-coordinates are in increasing order.2. Next, we divide the data into two sets, upper and lower.3. We then calculate the mean value of the x- and y-coordinates of each half, to obtain the two points
(x L, y L) and (x U, y U). (That is, we fi nd the mean value of the x-coordinates of all data points in the lower half, x L, and the mean value of the y-coordinates of those points, y L.)
4. We then repeat the process for the data points in the upper half to obtain the mean values (x U and y U).
5. Once the coordinates of the two points are obtained, we fi nd the equation of the line, using the same method as in the previous two worked examples. That is, we fi rst fi nd the gradient, which is given by
my y
x x1y
2 1x= , where (x1, y1) is (x L, y L) and (x2, y2) is (x U, y U).
6. We then substitute the value of the gradient and the coordinates of either of the two points into gradient–point formula, y − y1 = m(x − x1) to fi nd the equation of the regression line.
Note: If there is an even number of data points, we can easily divide the data into two sets by placing an equal number of points in each half. If, however, the number of data points is odd, we have to include the middle point in both sets. This is shown in the following worked example.
WORKED EXAMPLE 7
For each of the following data sets, fi nd the equation of the regression line using the two-mean method.a
x 20 50 70 30 60 90 80 40
y 72 77 66 68 70 59 62 61
b x 10 15 20 25 30 35 40 45 50
y 33 42 54 61 72 83 95 101 113
THINK WRITE
a 1 Rearrange the data points so that the x-coordinates are in increasing order.
ax 20 30 40 50 60 70 80 90
y 72 68 61 77 70 66 62 59
Lower half Upper half
2 Divide the data into two sets. Since there are 8 data points, place the fi rst four in the lower half and the last four in the upper half.
3 Calculate the mean of the x-values and the mean of the y-values for the lower half.
x
y
20 30 40 50
4140
435
72 68 61 77
4278
469.5
L
L
=+ +30 +
=
=
=+ +68 +
=
=
4 Write the mean values in coordinate form. (x L, y L) = (35, 69.5)
TUTORIALeles-1355Worked example 7
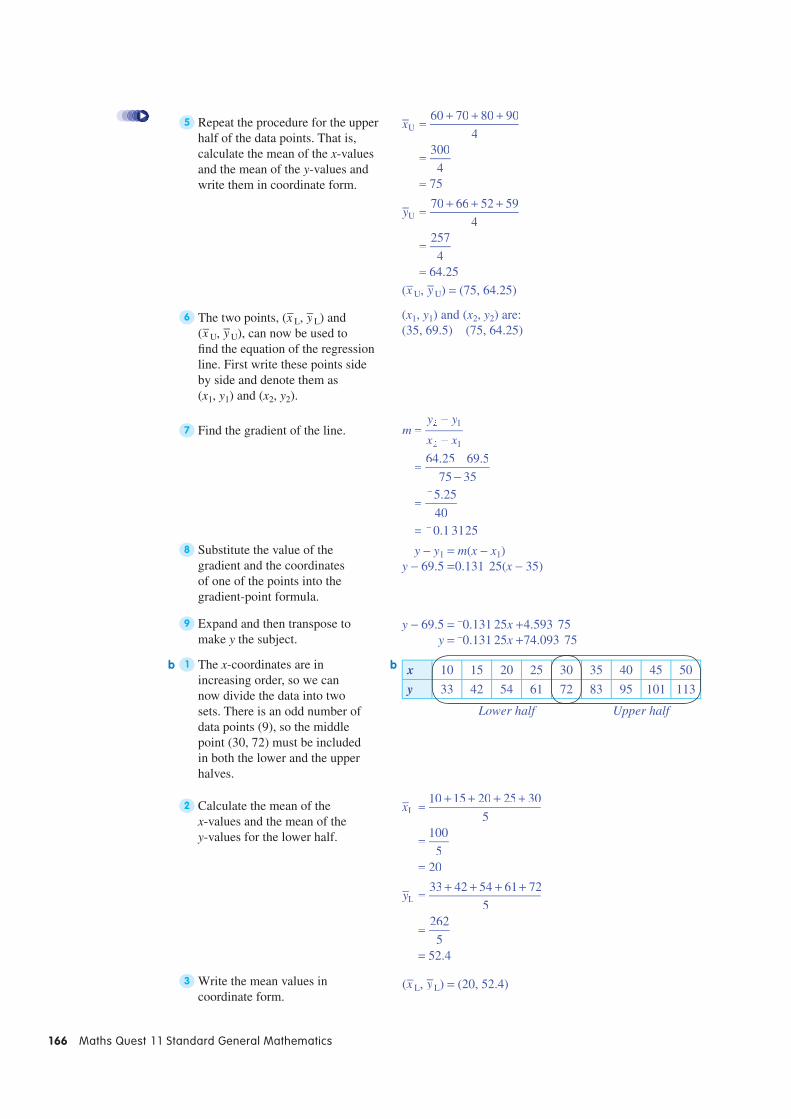
166 Maths Quest 11 Standard General Mathematics
5 Repeat the procedure for the upper half of the data points. That is, calculate the mean of the x-values and the mean of the y-values and write them in coordinate form.
x
y
60 70 80 90
4300
475
70 66 52 59
4257
464.25
U
U
=+ +70 +
=
=
=+ +66 +
=
=(x U, y U) = (75, 64.25)
6 The two points, (x L, y L) and (x U, y U), can now be used to fi nd the equation of the regression line. First write these points side by side and denote them as (x1, y1) and (x2, y2).
(x1, y1) and (x2, y2) are: (35, 69.5) (75, 64.25)
7 Find the gradient of the line. my y
x x
64.25 69.5
75 355.25
400.1 3125
1y
2 1x=
=−−
=
=
−
−
8 Substitute the value of the gradient and the coordinates of one of the points into the gradient-point formula.
y − y1 = m(x − x1)y − 69.5 = 0.131 25(x − 35)
9 Expand and then transpose to make y the subject.
y − 69.5 = −0.131 25x + 4.593 75y = −0.131 25x + 74.093 75
b 1 The x-coordinates are in increasing order, so we can now divide the data into twosets. There is an odd number of data points (9), so the middle point (30, 72) must be included in both the lower and the upper halves.
b x 10 15 20 25 30 35 40 45 50
y 33 42 54 61 72 83 95 101 113
Lower half Upper half
2 Calculate the mean of the x-values and the mean of the y-values for the lower half.
x
y
10 15 20 25 30
5100
520
33 42 54 61 72
5262
552.4
L
L
=+ +15 + +25
=
=
=+ + +42 54 +
=
=
3 Write the mean values in coordinate form.
(x L, y L) = (20, 52.4)
CHAPTER 4 Bivariate data 167
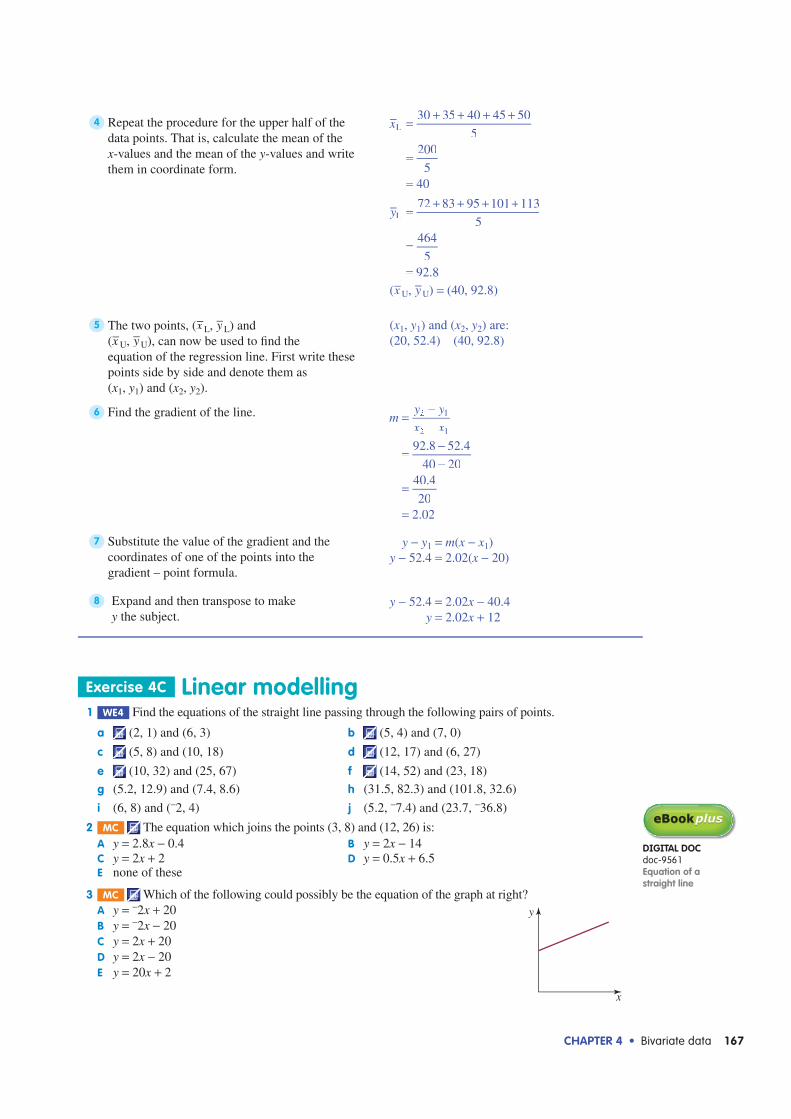
4 Repeat the procedure for the upper half of the data points. That is, calculate the mean of the x-values and the mean of the y-values and write them in coordinate form.
x
y
30 35 40 45 50
5200
540
72 83 95 101 113
5464
592.8
L
L
=+ +35 + +45
=
=
=+ +83 + +101
=
=(x U, y U) = (40, 92.8)
5 The two points, (x L, y L) and (x U, y U), can now be used to fi nd the equation of the regression line. First write these points side by side and denote them as (x1, y1) and (x2, y2).
(x1, y1) and (x2, y2) are: (20, 52.4) (40, 92.8)
6 Find the gradient of the line. my y
x x
92.8 52.4
40 2040.4
202.02
1y
2 1x=
=−−
=
=
7 Substitute the value of the gradient and the coordinates of one of the points into the gradient – point formula.
y − y1 = m(x − x1)y − 52.4 = 2.02(x − 20)
8 Expand and then transpose to make y the subject.
y − 52.4 = 2.02x − 40.4y = 2.02x + 12
Exercise 4C Linear modelling 1 WE4 Find the equations of the straight line passing through the following pairs of points.
a (2, 1) and (6, 3) b (5, 4) and (7, 0)
c (5, 8) and (10, 18) d (12, 17) and (6, 27)
e (10, 32) and (25, 67) f (14, 52) and (23, 18)g (5.2, 12.9) and (7.4, 8.6) h (31.5, 82.3) and (101.8, 32.6)
i (6, 8) and (−2, 4) j (5.2, −7.4) and (23.7, −36.8)
2 MC The equation which joins the points (3, 8) and (12, 26) is:A y = 2.8x − 0.4 B y = 2x − 14C y = 2x + 2 D y = 0.5x + 6.5E none of these
3 MC Which of the following could possibly be the equation of the graph at right?A y = −2x + 20B y = −2x − 20C y = 2x + 20D y = 2x − 20E y = 20x + 2
DIGITAL DOCdoc-9561Equation of a straight line
x
y
168 Maths Quest 11 Standard General Mathematics
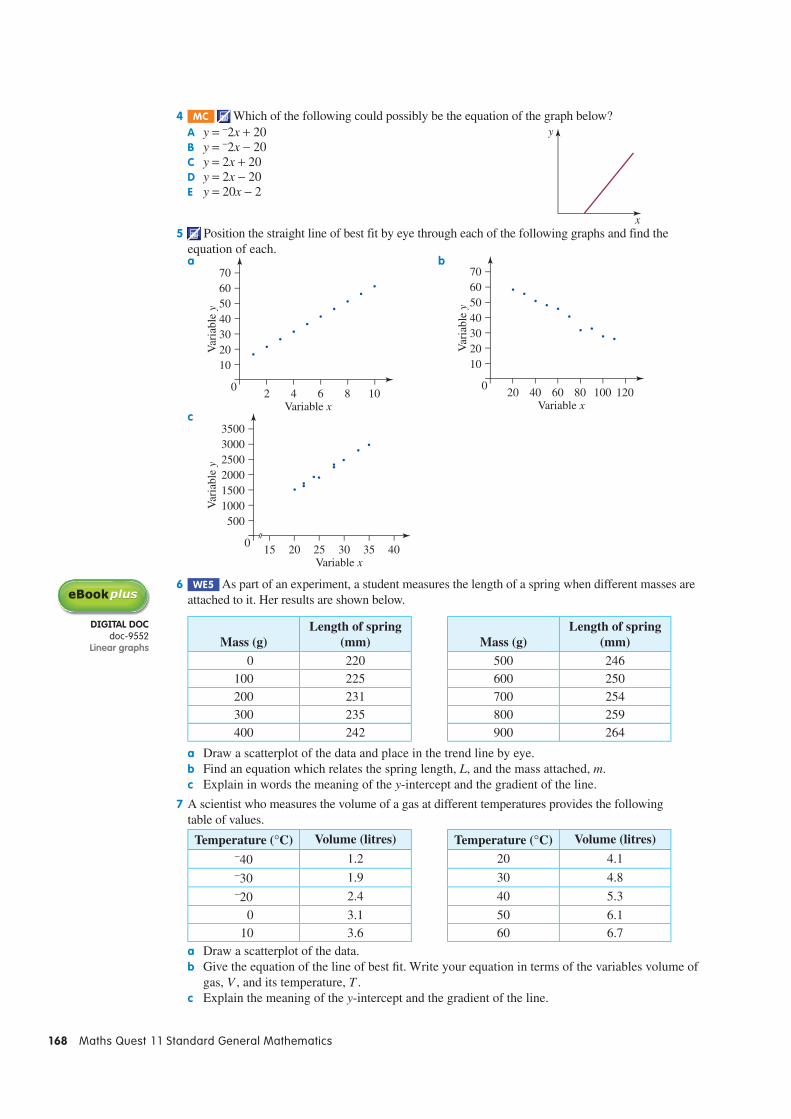
4 MC Which of the following could possibly be the equation of the graph below?A y = −2x + 20B y = −2x − 20C y = 2x + 20D y = 2x − 20E y = 20x − 2
5 Position the straight line of best fit by eye through each of the following graphs and find the equation of each.a
0
70605040302010
2 64 8 10Variable x
Var
iabl
e y
b
0
70605040302010
20 6040 80 120100Variable x
Var
iabl
e y
c
150
350030002500
15001000500
2000
20 3025 35 40Variable x
Var
iabl
e y
6 WE5 As part of an experiment, a student measures the length of a spring when different masses are attached to it. Her results are shown below.
Mass (g)Length of spring
(mm) Mass (g)Length of spring
(mm) 0 220 500 246100 225 600 250200 231 700 254300 235 800 259400 242 900 264
a Draw a scatterplot of the data and place in the trend line by eye.b Find an equation which relates the spring length, L, and the mass attached, m.c Explain in words the meaning of the y-intercept and the gradient of the line.
7 A scientist who measures the volume of a gas at different temperatures provides the following table of values.
Temperature (°C) Volume (litres) Temperature (°C) Volume (litres)−40 1.2 20 4.1−30 1.9 30 4.8−20 2.4 40 5.3
0 3.1 50 6.1 10 3.6 60 6.7
a Draw a scatterplot of the data.b Give the equation of the line of best fi t. Write your equation in terms of the variables volume of
gas, V , and its temperature, T .c Explain the meaning of the y-intercept and the gradient of the line.
x
y
DIGITAL DOCdoc-9552
Linear graphs
CHAPTER 4 Bivariate data 169
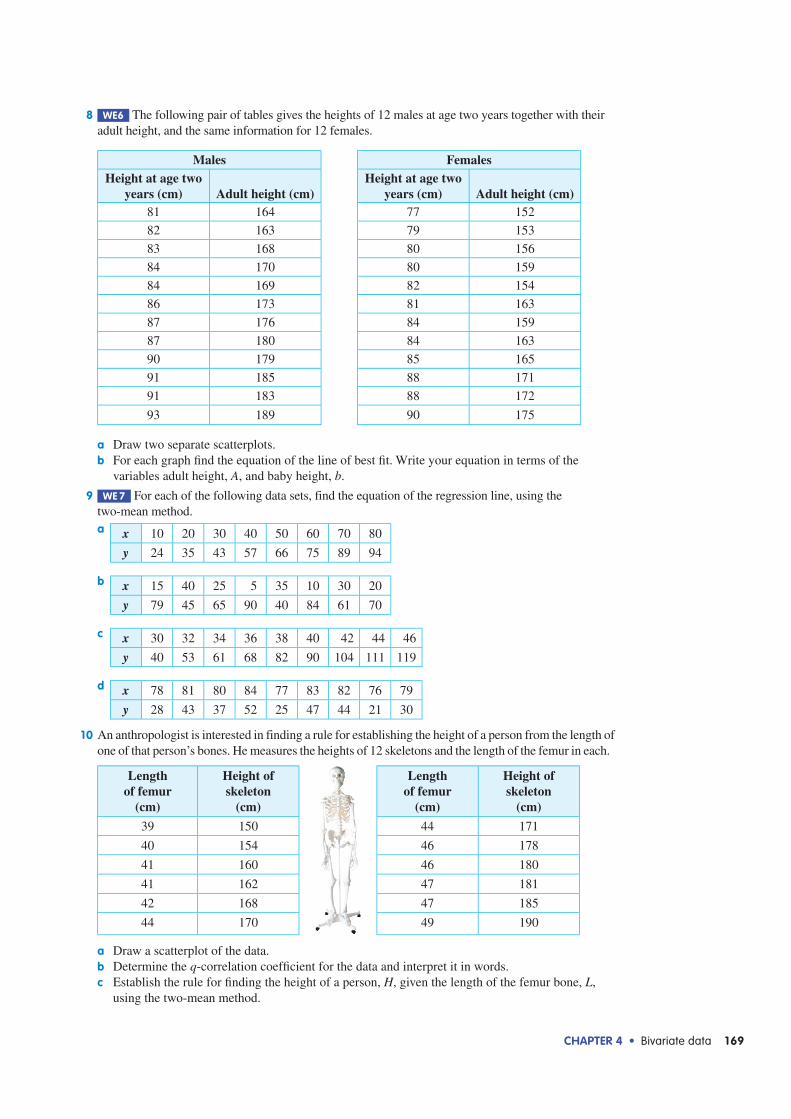
8 WE6 The following pair of tables gives the heights of 12 males at age two years together with their adult height, and the same information for 12 females.
Males FemalesHeight at age two
years (cm) Adult height (cm)Height at age two
years (cm) Adult height (cm)81 164 77 152
82 163 79 153
83 168 80 156
84 170 80 159
84 169 82 154
86 173 81 163
87 176 84 159
87 180 84 163
90 179 85 165
91 185 88 171
91 183 88 172
93 189 90 175
a Draw two separate scatterplots.b For each graph fi nd the equation of the line of best fi t. Write your equation in terms of the
variables adult height, A, and baby height, b.
9 WE 7 For each of the following data sets, find the equation of the regression line, using the two-mean method.a x 10 20 30 40 50 60 70 80
y 24 35 43 57 66 75 89 94
b x 15 40 25 5 35 10 30 20
y 79 45 65 90 40 84 61 70
c x 30 32 34 36 38 40 42 44 46
y 40 53 61 68 82 90 104 111 119
d x 78 81 80 84 77 83 82 76 79
y 28 43 37 52 25 47 44 21 30
10 An anthropologist is interested in finding a rule for establishing the height of a person from the length of one of that person’s bones. He measures the heights of 12 skeletons and the length of the femur in each.
Lengthof femur
(cm)
Height of skeleton
(cm)
Lengthof femur
(cm)
Height of skeleton
(cm)
39 150 44 171
40 154 46 178
41 160 46 180
41 162 47 181
42 168 47 185
44 170 49 190
a Draw a scatterplot of the data.b Determine the q-correlation coeffi cient for the data and interpret it in words.c Establish the rule for fi nding the height of a person, H, given the length of the femur bone, L,
using the two-mean method.
170 Maths Quest 11 Standard General Mathematics
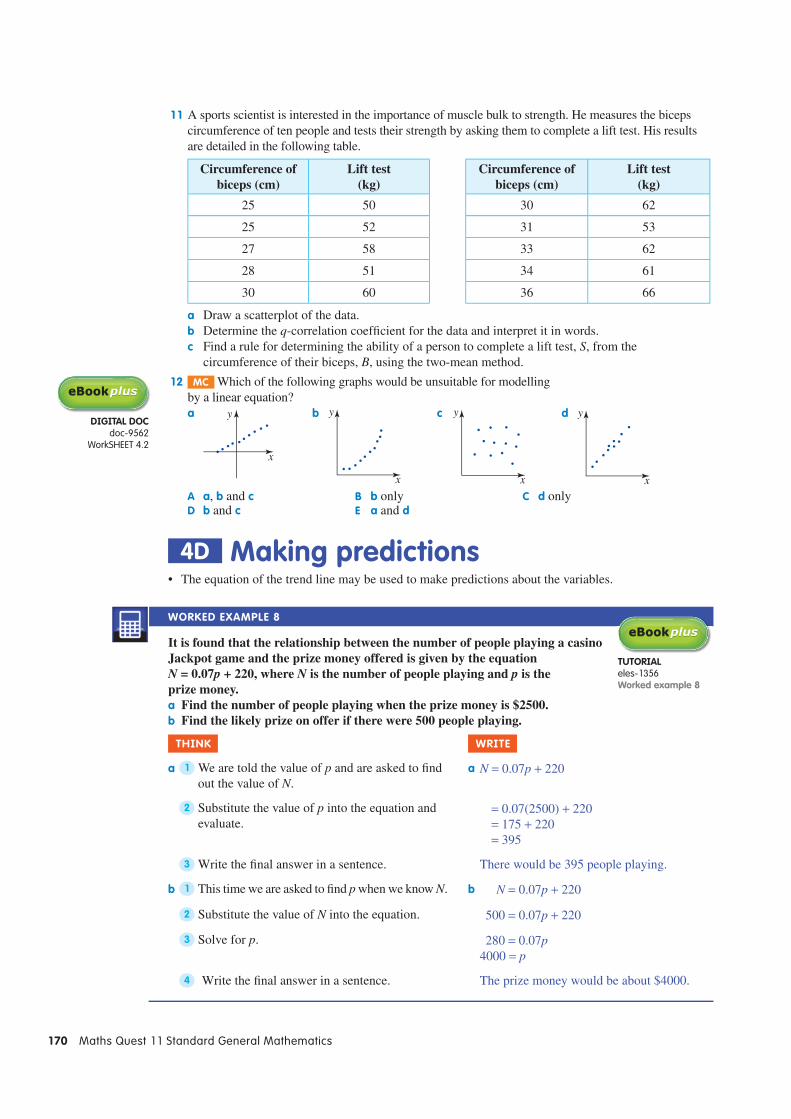
11 A sports scientist is interested in the importance of muscle bulk to strength. He measures the biceps circumference of ten people and tests their strength by asking them to complete a lift test. His results are detailed in the following table.
Circumference of biceps (cm)
Lift test(kg)
Circumference of biceps (cm)
Lift test(kg)
25 50 30 62
25 52 31 53
27 58 33 62
28 51 34 61
30 60 36 66
a Draw a scatterplot of the data.b Determine the q-correlation coeffi cient for the data and interpret it in words.c Find a rule for determining the ability of a person to complete a lift test, S, from the
circumference of their biceps, B, using the two-mean method.
12 MC Which of the following graphs would be unsuitable for modelling by a linear equation?a
x
y b
x
y c
x
y d
x
y
A a, b and c B b only C d onlyD b and c E a and d
4D Making predictionsThe equation of the trend line may be used to make predictions about the variables.
WORKED EXAMPLE 8
It is found that the relationship between the number of people playing a casino Jackpot game and the prize money offered is given by the equation N = 0.07p + 220, where N is the number of people playing and p is the prize money.a Find the number of people playing when the prize money is $2500.b Find the likely prize on offer if there were 500 people playing.
THINK WRITE
a 1 We are told the value of p and are asked to fi nd out the value of N.
a N = 0.07p + 220
2 Substitute the value of p into the equation and evaluate.
= 0.07(2500) + 220= 175 + 220= 395
3 Write the fi nal answer in a sentence. There would be 395 people playing.
b 1 This time we are asked to fi nd p when we know N. b N = 0.07p + 220
2 Substitute the value of N into the equation. 500 = 0.07p + 220
3 Solve for p. 280 = 0.07p4000 = p
4 Write the fi nal answer in a sentence. The prize money would be about $4000.
DIGITAL DOCdoc-9562
WorkSHEET 4.2
TUTORIALeles-1356Worked example 8
CHAPTER 4 Bivariate data 171
Alternatively, predictions can be made from the graph’s trend line. These predictions are often less accurate than those made using the equation of the trend line.
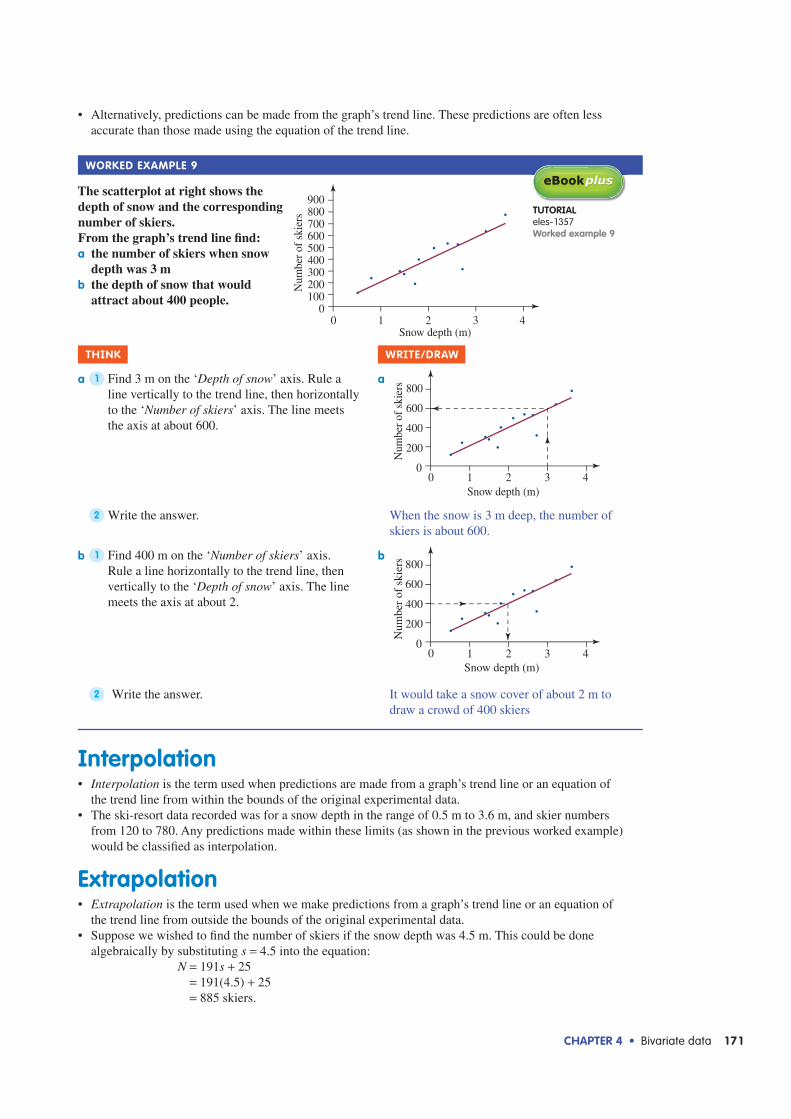
WORKED EXAMPLE 9
The scatterplot at right shows the depth of snow and the corresponding number of skiers.From the graph’s trend line fi nd:a the number of skiers when snow
depth was 3 mb the depth of snow that would
attract about 400 people.
THINK WRITE/DRAW
a 1 Find 3 m on the ‘Depth of snow’ axis. Rule a line vertically to the trend line, then horizontally to the ‘Number of skiers’ axis. The line meets the axis at about 600.
a
00
200
400
600
800
1 2 3 4Snow depth (m)
Num
ber
of s
kier
s
2 Write the answer. When the snow is 3 m deep, the number of skiers is about 600.
b 1 Find 400 m on the ‘Number of skiers’ axis. Rule a line horizontally to the trend line, then vertically to the ‘Depth of snow’ axis. The line meets the axis at about 2.
b
00
200
400
600
800
1 2 3 4Snow depth (m)
Num
ber
of s
kier
s
2 Write the answer. It would take a snow cover of about 2 m to draw a crowd of 400 skiers
InterpolationInterpolation is the term used when predictions are made from a graph’s trend line or an equation of the trend line from within the bounds of the original experimental data.The ski-resort data recorded was for a snow depth in the range of 0.5 m to 3.6 m, and skier numbers from 120 to 780. Any predictions made within these limits (as shown in the previous worked example) would be classifi ed as interpolation.
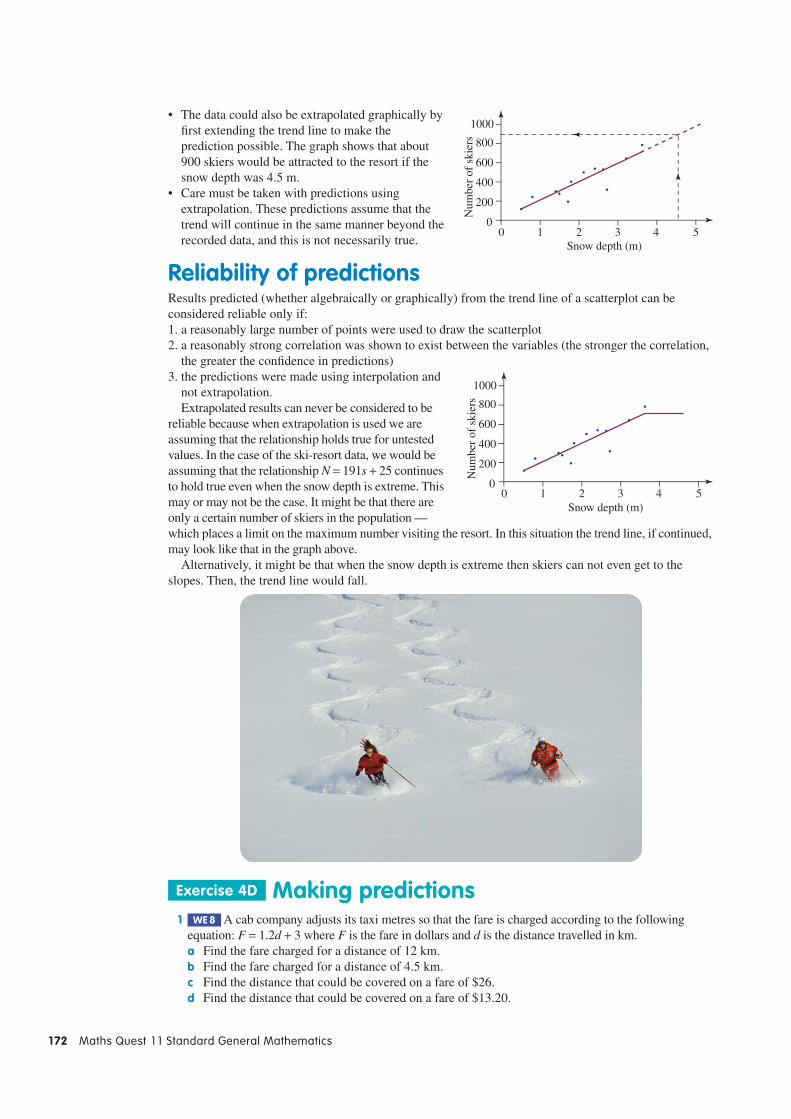
ExtrapolationExtrapolation is the term used when we make predictions from a graph’s trend line or an equation of the trend line from outside the bounds of the original experimental data.Suppose we wished to fi nd the number of skiers if the snow depth was 4.5 m. This could be done algebraically by substituting s = 4.5 into the equation:
N = 191s + 25= 191(4.5) + 25= 885 skiers.
TUTORIALeles-1357Worked example 9
00
100200300400500600700800900
1 2 3 4Snow depth (m)
Num
ber
of s
kier
s
172 Maths Quest 11 Standard General Mathematics
The data could also be extrapolated graphically by first extending the trend line to make the prediction possible. The graph shows that about 900 skiers would be attracted to the resort if the snow depth was 4.5 m.Care must be taken with predictions using extrapolation. These predictions assume that the trend will continue in the same manner beyond the recorded data, and this is not necessarily true.
Reliability of predictionsResults predicted (whether algebraically or graphically) from the trend line of a scatterplot can be considered reliable only if:1. a reasonably large number of points were used to draw the scatterplot2. a reasonably strong correlation was shown to exist between the variables (the stronger the correlation,
the greater the confidence in predictions)3. the predictions were made using interpolation and
not extrapolation.Extrapolated results can never be considered to be
reliable because when extrapolation is used we are assuming that the relationship holds true for untested values. In the case of the ski-resort data, we would be assuming that the relationship N = 191s + 25 continues to hold true even when the snow depth is extreme. This may or may not be the case. It might be that there are only a certain number of skiers in the population — which places a limit on the maximum number visiting the resort. In this situation the trend line, if continued, may look like that in the graph above.
Alternatively, it might be that when the snow depth is extreme then skiers can not even get to the slopes. Then, the trend line would fall.
Exercise 4D Making predictions 1 WE 8 A cab company adjusts its taxi metres so that the fare is charged according to the following
equation: F = 1.2d + 3 where F is the fare in dollars and d is the distance travelled in km.a Find the fare charged for a distance of 12 km.b Find the fare charged for a distance of 4.5 km.c Find the distance that could be covered on a fare of $26.d Find the distance that could be covered on a fare of $13.20.
00
200
400
600
800
1000
1 2 3 4 5Snow depth (m)
Num
ber
of s
kier
s0
200
400
600
800
1000
0 1 2 3 4 5Snow depth (m)
Num
ber
of s
kier
s
CHAPTER 4 Bivariate data 173
2 Detectives can use the equation H = 6.1f − 5 to determine the height of a burglar who leaves footprints behind. (H is the height of the burglar in cm and f is the length of the footprint.)a Find the height of a burglar whose footprint is 27 cm in length.b Find the height of a burglar whose footprint is 30 cm in length.c Find the footprint length of a burglar of height 185 cm.d Find the footprint length of a burglar of height 152 cm.
3 Computer equipment devalues according to the equation V = −500t + 2500, where V is the value of the equipment after t years.a Find the value of the equipment after 4 years.b Find the value of the equipment after 2 years and 9 months.c Find the value of the equipment when it was new.d How old will the equipment be when its value is $1000?e How old will the equipment be when it becomes worthless?
4 A football match pie seller finds that the number of pies that she sells is related to the temperature of the day. The situation could be modelled by the equation N = −23t + 870, where N is the number of pies sold and t is the temperature of the day.a Find the number of pies sold if the temperature was 5 degrees.b Find the number of pies sold if the temperature was 25 degrees.c Find the likely temperature if 400 pies were sold.d How hot would the day have to be before the pie seller sold no pies at all?
5 An electronics repair shop charges according to the equation C = 40h + 35, where C is the cost of the repairs and h is the number of hours spent working on the repair.a Find the cost of repairing an amplifi er if the job took 2 hours.b Find the cost of repairing a television if the job took 1 hour and 15 minutes.c How long would the repairers have to spend on a job before the charge exceeded $175?d How long would the repairers have to spend on a job before the charge exceeded $215?
6 MC The linear relationship between two variables, X and Y, is given by the equation Y = −6.2X + 20. Predict the level of X when Y = 4.5.A X = −7.9 B X = −96.1 C X = −20.73 D X = 2.5E The level of X cannot be found using this equation. This equation gives the level of Y only.
7 WE 9 a Use the graph to predict: i the value of y when x = 12 ii the value of y when x = 6 iii the value of y when x = 23 iv the value of x when y = 600 v the value of x when y = 1000 vi the value of x when y = 320.b Find the equation of the trend line.c Now use the equation to confi rm the answers given in part a.
8 The following table shows the average annual costs of running a car. It includes all fixed costs (registration, insurance etc.) as well as running costs (petrol, repairs, etc.).
Distance(km)
Annual cost($)
Distance(km)
Annual cost($)
5 000 4 000 20 000 10 400
10 000 6 400 25 000 12 400
15 000 8 400 30 000 14 400
a Draw a scatterplot of the data.b Draw in the line of best fi t by eye. How close are the data points to your line?c Find an equation which represents the relationship between the cost of running a vehicle, C, and
the distance travelled, d.d i What is the y-intercept of the line? ii Interpret the signifi cance of the y-intercept.e i What is the gradient of the line? ii Interpret the signifi cance of the gradient.f Find the annual cost of running a car if it is driven 15 000 km. (Answer this question from your
equation and from your graph.)
10 20
12001000
800600400200
0
Variable x
Var
iabl
e y
174 Maths Quest 11 Standard General Mathematics
g Find the annual cost of running a car if it is driven 1000 km. (Answer this question from your equation and from your graph.)
h Find the likely number of kilometres driven if the annual costs were $8000.i Find the likely number of kilometres driven if the annual costs were $16 000.j Which of your answers to parts f to i do you consider reliable? Why?
9 A market researcher finds that the number of people who would purchase ‘Wise-up’ (the thinking man’s deodorant) is related to its price. He provides the following table of values.
PriceWeekly sales
(× 1000) PriceWeekly sales
(× 1000)
$1.40 105 $2.60 81
$1.60 101 $2.80 77
$1.80 97 $3.00 73
$2.00 93 $3.20 69
$2.20 89 $3.40 65
$2.40 85
a Draw a scatterplot of the data.b Draw in the line of best fit by eye.c Find an equation which represents the relationship between the number of cans of ‘Wise-up’ sold,
N, and its price, p.d Use the equation to predict the number of cans sold each week if the price was $3.10.e Use the equation to predict the number of cans sold each week if the price was $4.60.f At what price should ‘Wise-up’ be sold if the manufacturers wished to sell 80 000 cans?g Given that the manufacturers of ‘Wise-up’ can produce only 100 000 cans each week, at what
price should it be sold to maximise production?h Which of your answers to parts d to g do you consider reliable? Why?
10 The following table gives the adult return business class air fares between some Australian cities.
City Distance (km) Price ($)
Melbourne–Sydney 713 580
Perth–Melbourne 2728 1490
Adelaide–Sydney 1172 790
Brisbane–Melbourne 1370 890
Hobart–Melbourne 559 520
Hobart–Adelaide 1144 820
Adelaide–Melbourne 669 570
a Draw a scatterplot of the data.b Find the q-correlation coefficient for the data and interpret it in terms of the variables in the
question.c Suggest reasons for the points on the scatterplot not being perfectly linear.d Find an equation that represents the relationship between the air fare, A, and the distance
travelled, d, using the two-mean method.e Use the equation to predict the likely air fare from Sydney to the Gold Coast (671 km).f Use the equation to predict the likely air fare from Perth to Adelaide (2125 km).g Use the equation to predict the likely air fare from Hobart to Sydney (1024 km).h Use the equation to predict the likely air fare from Perth to Sydney (3295 km).i Which of your answers to parts e to h do you consider reliable? Why?
CHAPTER 4 Bivariate data 175
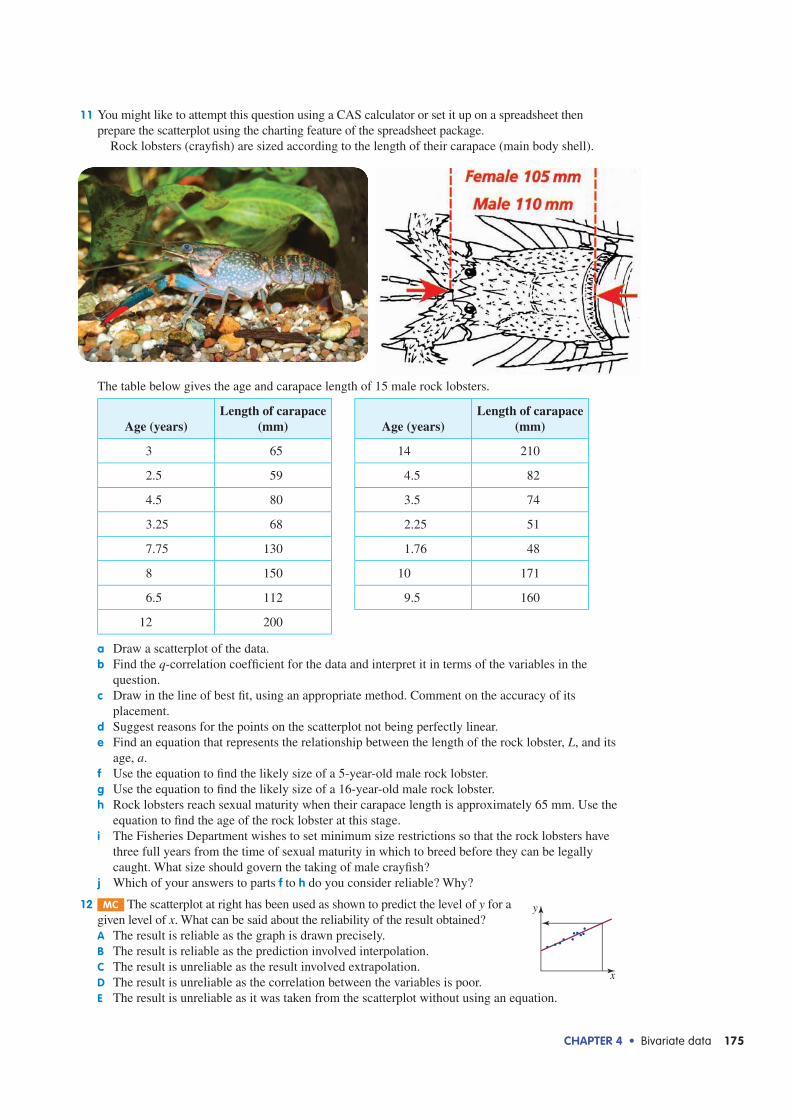
11 You might like to attempt this question using a CAS calculator or set it up on a spreadsheet then prepare the scatterplot using the charting feature of the spreadsheet package.
Rock lobsters (crayfish) are sized according to the length of their carapace (main body shell).
The table below gives the age and carapace length of 15 male rock lobsters.
Age (years)Length of carapace
(mm) Age (years)Length of carapace
(mm)
3 65 14 210
2.5 59 4.5 82
4.5 80 3.5 74
3.25 68 2.25 51
7.75 130 1.76 48
8 150 10 171
6.5 112 9.5 160
12 200
a Draw a scatterplot of the data.b Find the q-correlation coefficient for the data and interpret it in terms of the variables in the
question.c Draw in the line of best fit, using an appropriate method. Comment on the accuracy of its
placement.d Suggest reasons for the points on the scatterplot not being perfectly linear.e Find an equation that represents the relationship between the length of the rock lobster, L, and its
age, a.f Use the equation to find the likely size of a 5-year-old male rock lobster.g Use the equation to find the likely size of a 16-year-old male rock lobster.h Rock lobsters reach sexual maturity when their carapace length is approximately 65 mm. Use the
equation to find the age of the rock lobster at this stage.i The Fisheries Department wishes to set minimum size restrictions so that the rock lobsters have
three full years from the time of sexual maturity in which to breed before they can be legally caught. What size should govern the taking of male crayfish?
j Which of your answers to parts f to h do you consider reliable? Why?
12 MC The scatterplot at right has been used as shown to predict the level of y for a given level of x. What can be said about the reliability of the result obtained?A The result is reliable as the graph is drawn precisely.B The result is reliable as the prediction involved interpolation.C The result is unreliable as the result involved extrapolation.D The result is unreliable as the correlation between the variables is poor.E The result is unreliable as it was taken from the scatterplot without using an equation.
x
y
176 Maths Quest 11 Standard General Mathematics
13 MC The scatterplot at right has been used as shown to predict the level of y for a given level of x. What can be said about the reliability of the result obtained?A The result is reliable as the graph is drawn precisely.B The result is reliable as the prediction involved interpolation.C The result is unreliable as the result involved extrapolation.D The result is unreliable as the correlation between the variables is poor.E The result is unreliable as it was taken from the scatterplot without using an equation.
14 MC Which of the following is the best explanation of why extrapolated results can never be considered as reliable?A Extrapolation is unreliable because it uses too few data points to establish a general rule.B Extrapolation is unreliable because it assumes a cause and effect relationship between
the variables.C Extrapolation is unreliable because it assumes that the relationship between the variables holds
true for untested values.D Extrapolation is unreliable because it relies upon the accuracy of plotted points.E Extrapolation is unreliable because it can be used to predict only the level of y from x and
not x from y.
15 The table below shows world population during the years 1955 to 1985.
Year 1955 1960 1965 1970 1975 1980 1985
World population (millions)
2757 3037 3354 3696 4066 4432 4828
a Use a CAS calculator to create a scatterplot of the data.b Does the scatterplot of the Population-versus-Year data appear to be linear?c Investigate how the CAS calculator can be used to fit a regression line to the data; hence find the
equation of the line and graph it on the scatterplot.d Use the equation to predict the world population in 1950.e Use the equation to predict the world population in 1982.f Use the equation to predict the world population in 1997.g Which of your answers to parts d to f do you consider reliable? Why?h In fact the world population in 1997 was 5840 million. Account for the discrepancy between this
and your answer to part f.
x
y
CHAPTER 4 Bivariate data 177
SummaryScatterplots Bivariate data results from measurements being made on each of two variables for a given set of
items. Bivariate data can be represented on a scatterplot.The pattern of the scatterplot gives an indication of the strength of the relationship or level of association between the variables. This level of association is called correlation.
Strongpositive
correlation
Moderatepositive
correlation
Weakpositive
correlation
Nocorrelation
Weaknegative
correlation
Moderatenegative
correlation
Strongnegative
correlation
A strong correlation between variables does not imply that one variable causes the other to occur.
The correlation coefficient
Correlation can be quantifi ed by using a correlation coeffi cient.The q-correlation coeffi cient can be found by dividing the scatterplot into quadrants by positioning vertical and horizontal lines which represent the positions of the medians.The coeffi cient is determined using the formula:
qb d
a b c d
( )a c ( )b d=
−)c
+b where a is the number of data points in A
b is the number of data points in Bc is the number of data points in Cd is the number of data points in D.
The q-correlation coeffi cient may be interpreted as follows:
0.75 ≤ q ≤ 1 Strong positive correlation 0.5 ≤ q < 0.75 Moderate positive correlation 0.25 ≤ q < 0.5 Weak positive correlation −0.25 < q < 0.25 No correlation −0.5 < q ≤ −0.25 Weak negative correlation −0.75 < q ≤ −0.5 Moderate negative correlation −1 ≤ q ≤ −0.75 Strong negative correlation
The correlation coeffi cient will always be a number between −1 and 1.If q = 1 (or −1) it does not necessarily indicate that all points are in a perfect straight line.
Linear modelling A line of best fi t or trend line may be fi tted through the points on a scatterplot.The equation of the trend line can be found using (a) any two points (x1, y1) and (x2, y2) that lie on the line and (b) the gradient–point form of the equation of a straight line, y − y1 = m(x − x1), where
my y
x x1y
2 1x=
The two points used to fi nd the equation of the trend line are not necessarily actual data points.It is best to choose two points that are not too close to each other.To fi nd the equation of the regression line using the two-mean method:1. rearrange (if necessary) the data points so that the x-coordinates are in increasing order2. divide the data into halves (upper and lower)3. calculate the mean value of the x- and y-coordinates of each half, to obtain the two
points x y( ,x )yLyy and x( ,x )yU Uyy4. use the coordinates of the two points to fi nd the equation of the regression line.
x
y AB
DC
178 Maths Quest 11 Standard General Mathematics
If there is an even number of data points, place an equal number of points in each set. If the number of data points is odd, include the middle point in both sets.The y-intercept of the regression line represents the value of y when the level of x is 0.The gradient of the regression line represents the rate of change of y with changing x.If the scatterplot shows no correlation between the variables, or indicates a non-linear relationship, it is not appropriate to attempt to fi t a linear model through it.
Making predictions The equation and the graph of the trend line may be used to make predictions about the level of one variable given the level of the other variable.Interpolation is the process by which a prediction about the level of either variable is made(either from the trend line of the graph or from its equation) from within the bounds of the original data points.Extrapolation is the process by which a prediction is made about the level of either variable(either from the trend line of the graph or from its equation) from outside the bounds of the original data points.Results predicted from the trend line can be considered reliable only if the scatterplot indicates a reasonably strong correlation between the variables and consists of a reasonably large number of points, and if the predictions were made using interpolation.
CHAPTER 4 Bivariate data 179
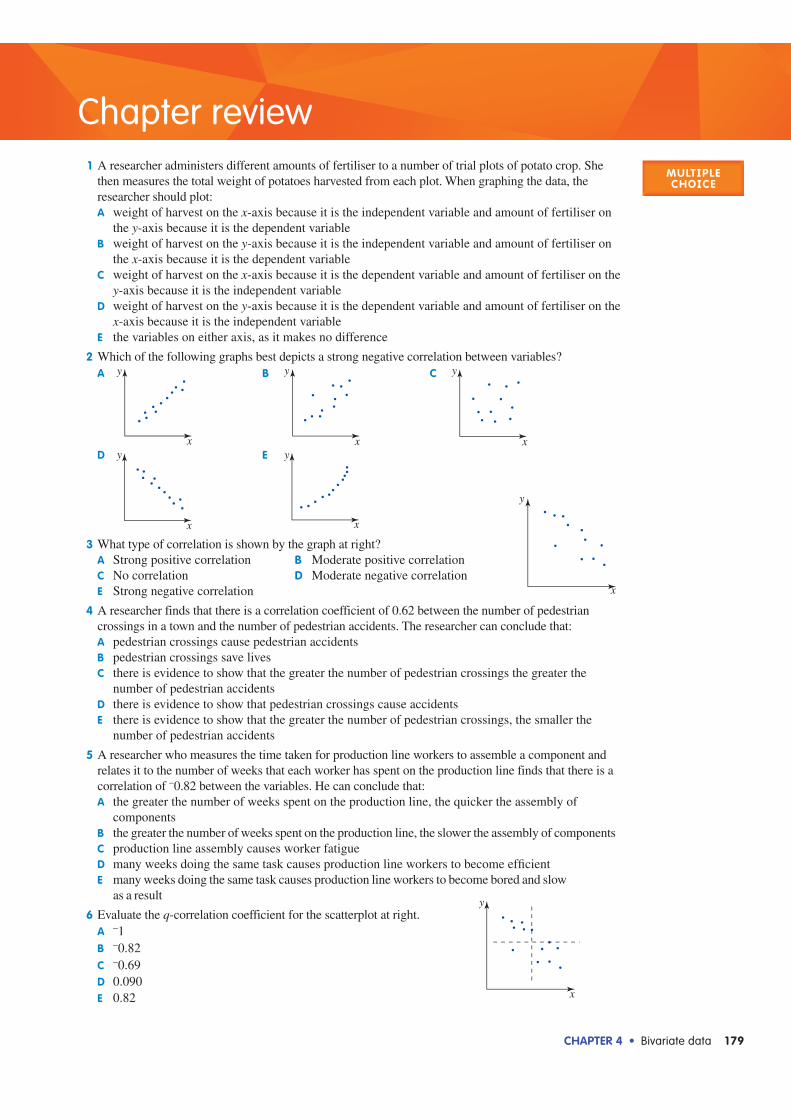
Chapter review 1 A researcher administers different amounts of fertiliser to a number of trial plots of potato crop. She
then measures the total weight of potatoes harvested from each plot. When graphing the data, the researcher should plot:A weight of harvest on the x-axis because it is the independent variable and amount of fertiliser on
the y-axis because it is the dependent variableB weight of harvest on the y-axis because it is the independent variable and amount of fertiliser on
the x-axis because it is the dependent variableC weight of harvest on the x-axis because it is the dependent variable and amount of fertiliser on the
y-axis because it is the independent variableD weight of harvest on the y-axis because it is the dependent variable and amount of fertiliser on the
x-axis because it is the independent variableE the variables on either axis, as it makes no difference
2 Which of the following graphs best depicts a strong negative correlation between variables?A
x
y B
x
y C
x
y
D
x
y E
x
y
3 What type of correlation is shown by the graph at right?A Strong positive correlation B Moderate positive correlationC No correlation D Moderate negative correlationE Strong negative correlation
4 A researcher finds that there is a correlation coefficient of 0.62 between the number of pedestrian crossings in a town and the number of pedestrian accidents. The researcher can conclude that:A pedestrian crossings cause pedestrian accidentsB pedestrian crossings save livesC there is evidence to show that the greater the number of pedestrian crossings the greater the
number of pedestrian accidentsD there is evidence to show that pedestrian crossings cause accidentsE there is evidence to show that the greater the number of pedestrian crossings, the smaller the
number of pedestrian accidents
5 A researcher who measures the time taken for production line workers to assemble a component and relates it to the number of weeks that each worker has spent on the production line finds that there is a correlation of −0.82 between the variables. He can conclude that:A the greater the number of weeks spent on the production line, the quicker the assembly of
componentsB the greater the number of weeks spent on the production line, the slower the assembly of componentsC production line assembly causes worker fatigueD many weeks doing the same task causes production line workers to become effi cientE many weeks doing the same task causes production line workers to become bored and slow
as a result
6 Evaluate the q-correlation coefficient for the scatterplot at right.A −1B −0.82C −0.69D 0.090E 0.82
MULTIPLECHOICE
x
y
x
y
180 Maths Quest 11 Standard General Mathematics
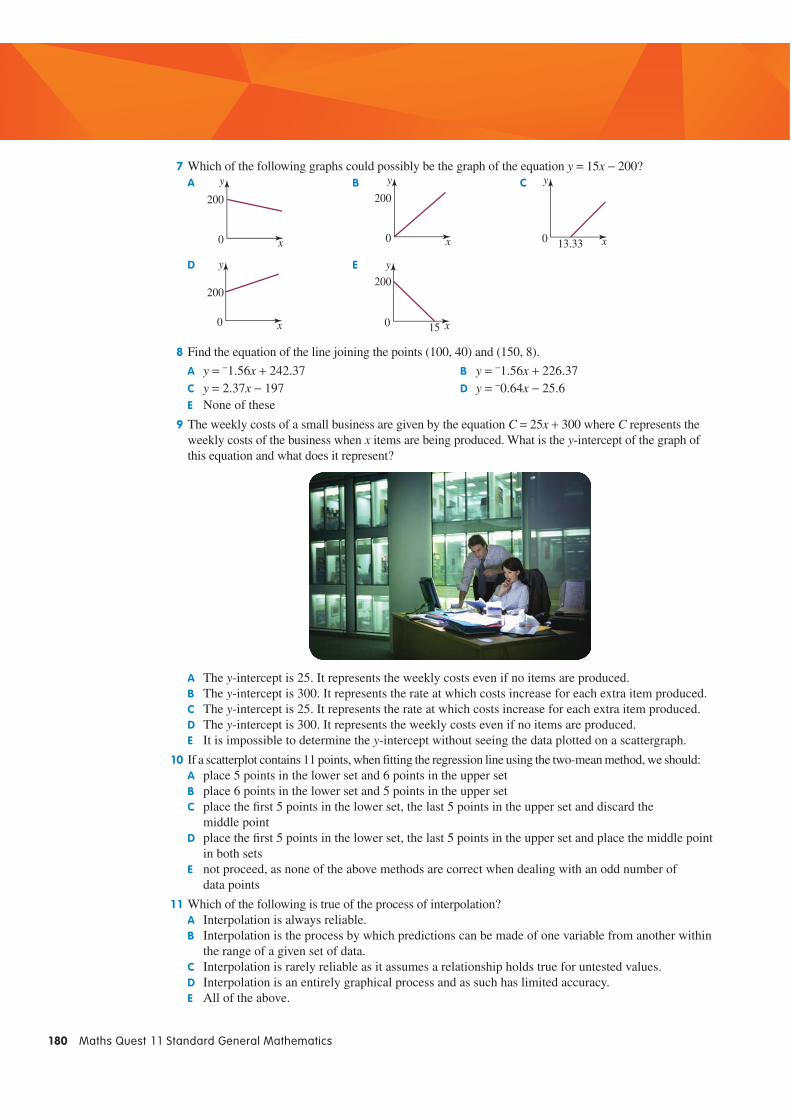
7 Which of the following graphs could possibly be the graph of the equation y = 15x − 200?A
200
0 x
y B200
0 x
y C
13.330 x
y
D
200
0 x
y E200
150 x
y
8 Find the equation of the line joining the points (100, 40) and (150, 8).
A y = −1.56x + 242.37 B y = −1.56x + 226.37C y = 2.37x − 197 D y = −0.64x − 25.6E None of these
9 The weekly costs of a small business are given by the equation C = 25x + 300 where C represents the weekly costs of the business when x items are being produced. What is the y-intercept of the graph of this equation and what does it represent?
A The y-intercept is 25. It represents the weekly costs even if no items are produced.B The y-intercept is 300. It represents the rate at which costs increase for each extra item produced.C The y-intercept is 25. It represents the rate at which costs increase for each extra item produced.D The y-intercept is 300. It represents the weekly costs even if no items are produced.E It is impossible to determine the y-intercept without seeing the data plotted on a scattergraph.
10 If a scatterplot contains 11 points, when fitting the regression line using the two-mean method, we should:A place 5 points in the lower set and 6 points in the upper setB place 6 points in the lower set and 5 points in the upper setC place the fi rst 5 points in the lower set, the last 5 points in the upper set and discard the
middle pointD place the fi rst 5 points in the lower set, the last 5 points in the upper set and place the middle point
in both setsE not proceed, as none of the above methods are correct when dealing with an odd number of
data points
11 Which of the following is true of the process of interpolation?A Interpolation is always reliable.B Interpolation is the process by which predictions can be made of one variable from another within
the range of a given set of data.C Interpolation is rarely reliable as it assumes a relationship holds true for untested values.D Interpolation is an entirely graphical process and as such has limited accuracy.E All of the above.
CHAPTER 4 Bivariate data 181
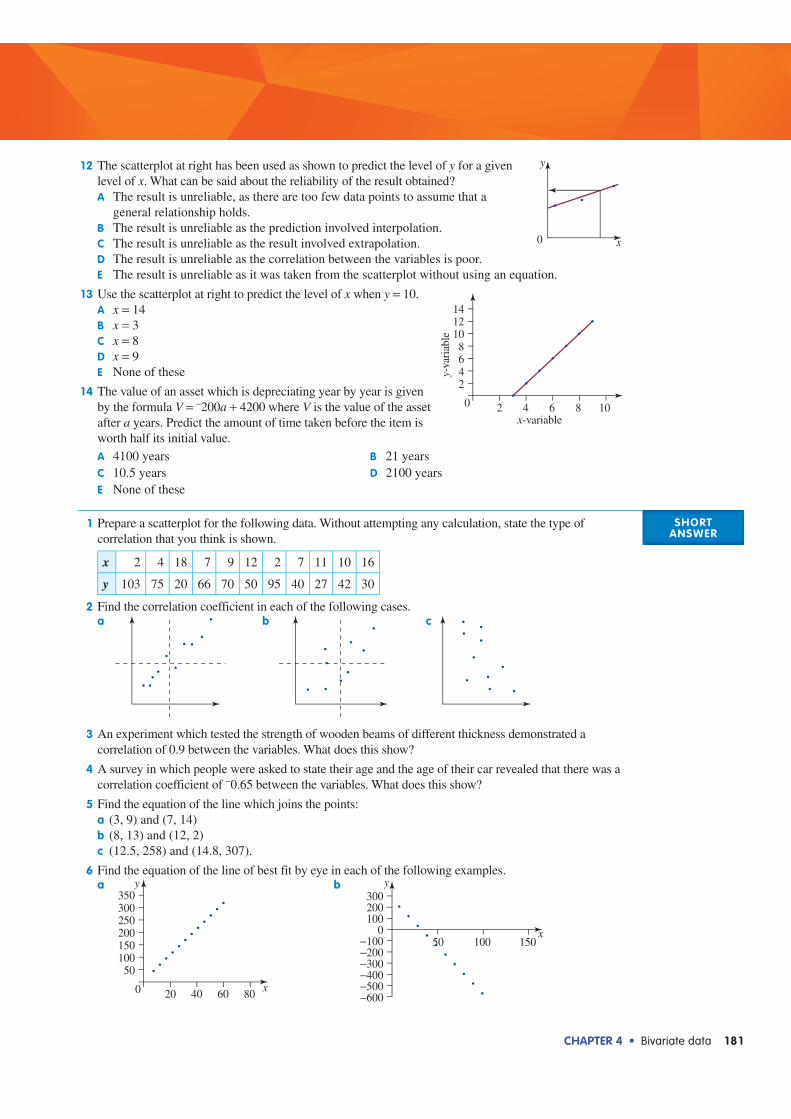
12 The scatterplot at right has been used as shown to predict the level of y for a given level of x. What can be said about the reliability of the result obtained?A The result is unreliable, as there are too few data points to assume that a
general relationship holds.B The result is unreliable as the prediction involved interpolation.C The result is unreliable as the result involved extrapolation.D The result is unreliable as the correlation between the variables is poor.E The result is unreliable as it was taken from the scatterplot without using an equation.
13 Use the scatterplot at right to predict the level of x when y = 10.A x = 14B x = 3C x = 8D x = 9E None of these
14 The value of an asset which is depreciating year by year is given by the formula V = −200a + 4200 where V is the value of the asset after a years. Predict the amount of time taken before the item is worth half its initial value.A 4100 years B 21 yearsC 10.5 years D 2100 yearsE None of these
SHORT ANSWER
1 Prepare a scatterplot for the following data. Without attempting any calculation, state the type of correlation that you think is shown.
x 2 4 18 7 9 12 2 7 11 10 16
y 103 75 20 66 70 50 95 40 27 42 30
2 Find the correlation coefficient in each of the following cases.a b c
3 An experiment which tested the strength of wooden beams of different thickness demonstrated a correlation of 0.9 between the variables. What does this show?
4 A survey in which people were asked to state their age and the age of their car revealed that there was a correlation coefficient of −0.65 between the variables. What does this show?
5 Find the equation of the line which joins the points:a (3, 9) and (7, 14)b (8, 13) and (12, 2)c (12.5, 258) and (14.8, 307).
6 Find the equation of the line of best fit by eye in each of the following examples.a
0
50100150200250300350
y
x20 40 60 80
b
−600−500−400−300−200−100
0100200300
15010050
y
x
0 x
y
0
2468
101214
2 4 6 8 10x-variable
y-va
riab
le
182 Maths Quest 11 Standard General Mathematics
7 For each of the following data sets, find the equation of the regression line, using the two-mean method.a x 70 40 90 50 30 80 60 20
y 33 46 26 41 49 31 39 53
b x 55 56 57 58 59 60 61 62 63
y 12 24 35 48 62 70 85 99 109
8 The equation of the line of best fit for certain data is found to be C = 3.6d + 250.a Find the level of d when C = 430.b Find the level of C when d = 40.
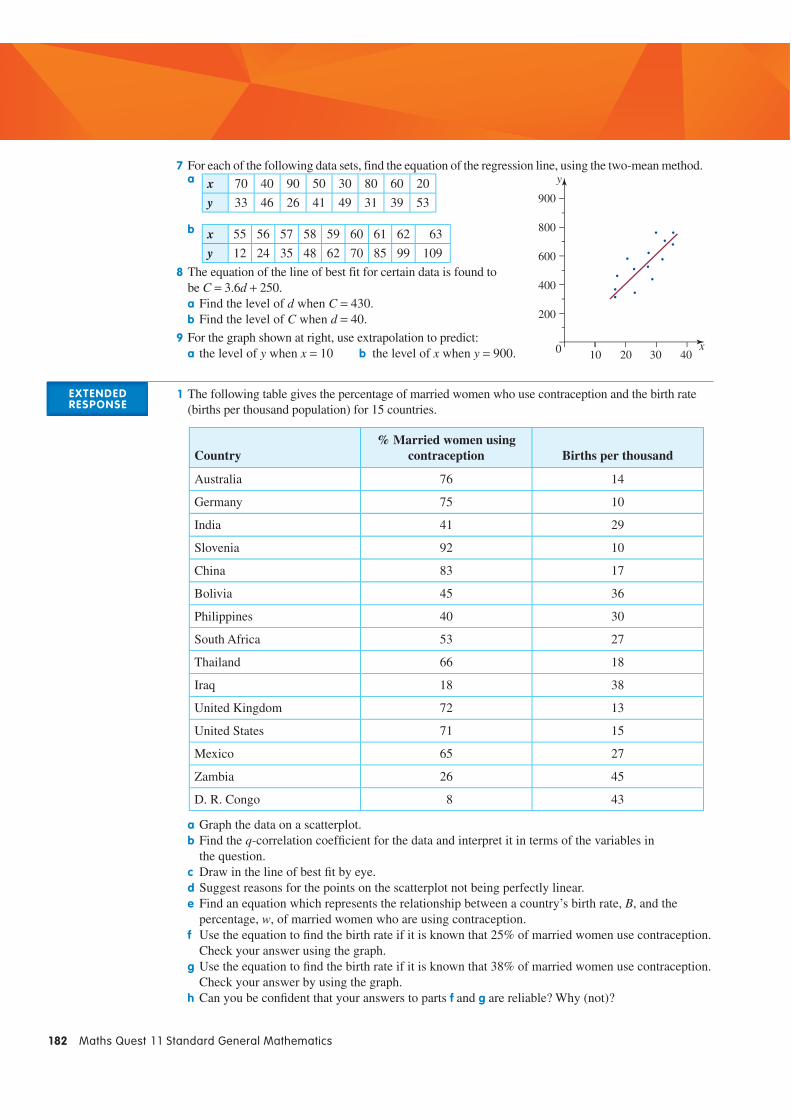
9 For the graph shown at right, use extrapolation to predict:a the level of y when x = 10 b the level of x when y = 900.
EXTENDED RESPONSE
1 The following table gives the percentage of married women who use contraception and the birth rate (births per thousand population) for 15 countries.
Country% Married women using
contraception Births per thousand
Australia 76 14
Germany 75 10
India 41 29
Slovenia 92 10
China 83 17
Bolivia 45 36
Philippines 40 30
South Africa 53 27
Thailand 66 18
Iraq 18 38
United Kingdom 72 13
United States 71 15
Mexico 65 27
Zambia 26 45
D. R. Congo 8 43
a Graph the data on a scatterplot.b Find the q-correlation coeffi cient for the data and interpret it in terms of the variables in
the question.c Draw in the line of best fi t by eye.d Suggest reasons for the points on the scatterplot not being perfectly linear.e Find an equation which represents the relationship between a country’s birth rate, B, and the
percentage, w, of married women who are using contraception.f Use the equation to fi nd the birth rate if it is known that 25% of married women use contraception.
Check your answer using the graph.g Use the equation to fi nd the birth rate if it is known that 38% of married women use contraception.
Check your answer by using the graph.h Can you be confi dent that your answers to parts f and g are reliable? Why (not)?
0
400
200
800
900
600
y
x2010 30 40
CHAPTER 4 Bivariate data 183
2 An entomologist conducted an experiment in which small amounts of insecticide were introduced into a container of 100 blowflies. The results are detailed below.
Insecticide (micrograms) 1 2 3 4 5 6 7 8 9 10
Number of fl ies remaining after 2 hours
99 92 81 74 62 68 52 45 38 24
a Graph the data on a scatterplot.b Find the q-correlation coeffi cient for the data and interpret it in terms of the variables in the question.c Draw in the line of best fi t by eye.d Suggest reasons for the points on the scatterplot not being perfectly linear.e Find an equation which represents the relationship between the number of survivors, S, and the
amount of insecticide, I.f Explain the signifi cance of the y-intercept and gradient of the equation.g Use the equation to fi nd the number of survivors if 8.5 micrograms of insecticide is used. Check
your answer using the graph.h Use the equation to fi nd the number of survivors if 12.5 micrograms of insecticide is used.i How much insecticide would have to be used before no fl ies survived?j Can you be confi dent that your answers to parts g, h and i are reliable? Why (not)?
3 Rachel decided to attend an intensive Russian language course before travelling to Moscow and St Petersburg early next year. The table below shows her vocabulary size, that is, the total number of Russian words that she has learned over the first two weeks of study.
Number of days from the beginning of the intensive course
Total number of words learned from the beginning of the course
1 24
2 50
3 78
4 97
5 127
6 149
7 175
8 196
9 223
10 248
11 280
12 300
13 321
14 350
a Which of the variables is independent and which is dependent?b Represent the data on a scatterplot.c State the type of correlation indicated by the scatterplot.d Find an equation that represents the relationship between the number of days of studying the
language, n, and the vocabulary size, V, using the two-mean method.e Explain the meaning of the gradient of the regression line.f Use the equation of the regression line to predict the size (to the nearest number) of Rachel’s
vocabulary by the end of the third week (that is, by day 21).g According to the linear model established in d, how long will it take Rachel to learn
500 Russian words?h Explain whether or not your answer to g is reliable.
184 Maths Quest 11 Standard General Mathematics
4 An investigation was made into the relationship between the number of working hours per week and the average weekly amount of money (in $) spent on junk and takeaway food by a group of twelve women.
Time at work (h) 20 33 36 38 34 27 35 40 22 37 30 25
Amount spent ($) 10 25 30 36 25 19 28 37 12 35 22 16
a Which of the variables is independent and which is dependent?b Represent the data on a scatterplot.c What type of correlation between the two variables does the scatterplot suggest?d Find an equation that represents the relationship between the number of working hours per week,
n, and the average weekly amount of money spent on junk and take-away food, A, using the two-mean method.
e Explain the meaning of the gradient of the regression line.f If Maya worked 29 hours in one week, how much money (according to the equation obtained in d)
would she spend on junk and take-away food that week?g Did you use extrapolation, or interpolation to answer the previous question?h Explain whether or not your answer to f is reliable.
5 Michael, a bricklayer, likes to keep records of his jobs. He always keeps track of the amount of time it takes him to complete any particular job and the amount he is paid. He also records the area (in square metres) of the walls he needs to build and the total number of bricks (including waste) used for the job. An extract from his records is shown below.
Area (m2) 12 17 24 10 23 20 14 26 15
Number of bricks 686 965 1357 572 1323 1150 800 1502 863
a Construct a scatterplot for the data shown in the table.b Describe the relationship as seen from the scatterplot.c Calculate the q-correlation coeffi cient for the data. Does this value match your answer to the
previous question? Explain.d Use the two-mean method to establish the rule connecting the area of the brick wall, a, that needs
to be built and the number of bricks, N, required to complete the job.e Complete the following statement by fi lling in the correct number in the space provided:
‘According to the equation of the regression line, ______ bricks are required to construct each extra square metre of the brick wall.’
f Michael is about to start working on a new project. According to specifi cations, 18 m2 of bricks need to be laid and he has 1000 bricks at his disposal. Using the rule obtained in d, check whether the available number of bricks is enough to complete the job
g Complete the following statement by selecting one of the two words offered in brackets: ‘To predict the amount of bricks needed to build a wall with the total area of 18 m2, __________ can be used. (extrapolation/interpolation).’
h Explain why (or why not) your answer to f could be considered reliable.
DIGITAL DOCdoc-9564
Test YourselfChapter 4

CHAPTER 4 Bivariate data 185
ICT activitiesChapter openerDIGITAL DOC
10 Quick Questions doc-9555: (page 149)
4A ScatterplotsDIGITAL DOCS
doc-9556: (page 153)Career profile doc-9557:
(page 155)
4B The correlation coefficientTUTORIAL
WE3 eles-1353:q (page 157)
DIGITAL DOCSSkillSHEET 4.1 doc-9558: (page 158)doc-9559: q (page 159)WorkSHEET 4.1 doc-9560:
q (page 160)
4C Linear modellingINTERACTIVITY
Transforming data int-0184: (page 161)
TUTORIALS WE5 eles-1354:
y (page 163)
WE 7 eles-1355: (page 165)
DIGITAL DOCSdoc-9561: (page 167)doc-9552: (page 168)WorkSHEET 4.2 doc-9562:
(page 170)
4D Making predictionsTUTORIALS
WE8 eles-1356: (page 170)
WE9 eles-1357: (page 171)
Chapter reviewDIGITAL DOC
Test Yourself Chapter 4 doc-9564: (page 184)
To access eBookPLUS activities, log on to www.jacplus.com.au
186 Maths Quest 11 Standard General Mathematics
ICT activitiesAnswers CHAPTER 4
BIVARIATE DATANote: In cases where lines of best fi t are to be obtained by eye, answers will vary. The answers given in such cases should be used as a guide only.
Exercise 4A Scatterplots 1 a Acidity is the independent variable
(x-axis). Height of corn is the dependent variable (y-axis).
b Price is the independent variable (x-axis). Amount purchased is the dependent variable (y-axis).
c Time is the independent variable (x-axis). Amount of drug in the bloodstream is the dependent variable (y-axis).
d Age is the independent variable (x-axis). Running cost is the dependent variable (y-axis).
e Circumference of biceps is the independent variable (x-axis). Performance on lift test is the dependent variable (y-axis).
2 A c, B b, C g, D e, E d, F f, G a 3 a
0
100
200
300
400
500
600
700
2 4 6 8 101214161820222426Temperature(°C)
Num
ber
of p
ies
sold
b Strong negative correlation. The greater the temperature, the lower the number of pies sold.
c Various answers 4 a
005
101520
20 40 60Weekly hours in air-conditioning
Num
ber
of s
ick
days
b Moderate positive correlation. There is evidence to show that the greater the number of hours spent in airconditioned buildings, the greater the number of days sick.
c Various answers 5 a
00
10203040
10 20 30 40Forecast maximum (°C)
Act
ual m
axim
um (
°C)
b Strong positive correlation. The greater the forecast maximum, the greater the actual maximum.
c Various answers
6 a
00
2000400060008000
1000 2000 3000Area (’000 sq km)
Popu
latio
n (’
000)
b No correlation. There is no relationship between the variables.
7 a
0.0
0.1200.1000.0800.0600.0400.0200.000
0.5 1.0 1.5Amount of drug (mg)
Rea
ctio
n tim
e (s
)
b Strong positive correlation. The greater the amount of drug, the greater the time taken to react.
c Various answers. Age or body size of people being given the drug.
8 D 9 E 10 B 11 B
Exercise 4B The correlation coefficient 1 a Strong positive correlation b Weak positive correlation c Strong positive correlation d Moderate negative correlation e Weak positive correlation f No correlation g Strong positive correlation h Moderate negative correlation i Weak negative correlation j Strong negative correlation 2 a i 1.0 ii Strong positive correlation b i 0.6 ii Moderate positive correlation c i −0.75 ii Strong negative correlation 3 a i −1.0 ii Strong negative correlation b i 0.6 ii Moderate positive correlation c i −0.11 ii No correlation 4 B 5 C 6 a
200180160140120
1801701601501400 190Height of mother (cm)
Hei
ght o
f so
n (c
m)
b 0.67; Moderate positive correlation c There is evidence to show that the taller
the mother, the taller the son. 7 a
00246
42 6
(2)
8Hours television
Hou
rs o
n ho
mew
ork
b −0.45; Weak negative correlation c There is a little evidence to show that the
greater the amount of television viewed, the less the amount of homework done.
d Various answers
8 a
200250300350400450500
4003000 500 600Annual rainfall (mm)
Gra
in p
rodu
ctio
n(t
× 1
000)
b 0.71; Moderate positive correlation c Evidence shows that the greater the
amount of rainfall, the greater the grain production.
d Various answers 9 a
005
1015
5 10Number of hotels
Num
ber
of c
hurc
hes
b 1.0; Strong positive correlation c The greater the number of hotels, the
greater the number of churches. d Various answers 10 a
024
1086
8040 60200Salary ($’000)
Lev
el o
f co
nten
tmen
t
b −0.18; No correlation c There is no relationship between salary
and level of contentment. d Various answers 11 a
1009080706050
20
(2)
(3)
151050 25Exercise (hours)
Wei
ght (
kg)
b −0.47; Weak negative correlation c There is a little evidence to show that
the greater the amount of exercise, the lower the body weight.
d Various answers 12 B 13 E 14 a q = 1 b Various answers 15 There is little evidence to suggest that the
greater the overcrowding, the lower the unemployment. Therefore, the hypothesis that overcrowding causes unemployment is incorrect.
Exercise 4C Linear modelling 1 a y = 0.5x b y = −2x + 14 c y = 2x − 2 d y = −1.67x + 37 e y = 2.33x + 8.7 f y = −3.78x + 104.92 g y = −1.95x + 23.04 h y = −0.71x + 104.67 i y = 0.5x + 5 j y = −1.59x + 0.87 2 C 3 C 4 D
CHAPTER 4 Bivariate data 187
5 These answers should be used as a guide only.
a y = 5x + 12 b y = −0.4x + 67 c y = 100x – 500 6 a
270260250240230
210220
8006004002000 1000Mass (g)
Len
gth
(mm
)
b L = 0.05m + 220 c The y-intercept is the natural length of
the spring. The gradient represents the extra length of the spring for each extra gram added.
7 a86420
500−50 100Temperature
Vol
ume
b V = 0.05T + 3.3 c The y-intercept gives the volume of gas
at 0 °C. The gradient gives the increase in volume for each additional degree in temperature.
8 a
195
185190
180175170
160165
9085800 95Height at age two
Adu
lt he
ight
(m
ales
)
180175170
160
150
0
155
165
908575 80 95Height at age two
Adu
lt he
ight
(fe
mal
es)
b Males: A = 2.1b − 6.4; Females: A = 1.8b + 13
9 a y = 1.031 25x + 13.968 75 b y = −1.4x + 98.25 c y = 5.05x – 110.9 d y = 4.1x – 291.6 10 a
200
180
160
140
40 4535300 50Length of femur (cm)
Skel
eton
hei
ght (
cm)
b q = 1.0; There is a strong positive correlation. The greater the length of the femur, the greater the height of the person.
c H = 3.78l + 5.01
11 a70
60
50
40
30 3525200 40Circumference of biceps (cm)
Lif
t tes
t (kg
)
b q = 0.75; There is a strong positive correlation. The greater the biceps circumference, the greater the performance on the lift test.
c S = 1.138b + 23.474 12 D
Exercise 4D Making predictions 1 a $17.40 b $8.40
c 19.17 km d 8.5 km 2 a 159.7 cm b 178 cm
c 31.1 cm d 25.7 cm 3 a $500 b $1125 c $2500
d 3 years e 5 years 4 a 755 b 295 c 20.4 degrees d 37.8 degrees 5 a $115 b $85 c 3 hours 30 minutes d 4 hours 30 minutes 6 D 7 a i 700 ii 450 iii 1170
iv 9.5 v 19 vi 3b y = 42x + 198 c Various answers
8 a
121416
810
6420
20 30100 40Distance (’000 km)
Ann
ual c
ost (
$ ’0
00)
b Various answers c C = 0.4d + 2400d i $2400 ii It is the cost of running
a car which is not driven at all.
e i 0.4 ii It is the additional cost of running a car per kilometre travelled.
f $8400 g $2800 h 14 000 km i 34 000 km j Parts f and h may be considered to be
reliable. 9 a
120
80100
604020
043210
Price ($)
Wee
kly
sale
s ($
’000
)
b Various answers c N = −20p + 135 where N is the number
of cans sold in thousands. d 73 000 e 43 000 f $2.75 g $1.75 h Parts d, f and g may be considered to be
reliable.
10 a200015001000
5000
1000 20000 3000Distance (km)
Pric
e $
b q = 1; There is a strong positive correlation. The greater the distance, the greater the air fare.
c Other factors affect air fare price such as fuel costs and number of passengers.
d A = 0.45d + 275.44 e $577.39 f $1231.69 g $736.24 h $1758.19 i Parts e, f and g may be considered to be
reliable. 11 a
250
100150200
500
5 100 15Age (years)
Car
apac
e le
ngth
(m
m)
b q = 1.0; There is a strong positive correlation. The greater the age of the crayfi sh, the greater the carapace length.
c and d Various answers e L = 14.35a + 21.72 f 93.47 mm g 251.32 mm h 3 years i 107.82 mm j Parts f and h may be considered to be
reliable. 12 C 13 D 14 C 15 a
50006000
200030004000
10000
1960 1970 19801950 1990Year
Wor
ld p
opul
atio
n (m
illio
ns)
b Yes. Straight line. c W = 71.4y − 136.873
Year
Wor
ld p
opul
atio
n (m
illio
ns)
1985
1980
1975
1970
1965
1960
1955
1950
2000
4000
1000
0
3000
5000
6000
d 2357 million e 4642 million f 5713 million g Only answer to part e as others are
extrapolated. h Lines of best fi t are only approximations.
188 Maths Quest 11 Standard General Mathematics
CHAPTER REVIEWMULTIPLE CHOICE
1 D 2 D 3 D 4 C5 B 6 B 7 C 8 E9 D 10 D 11 B 12 A
13 C 14 C
SHORT ANSWER
1 150100
500
105 150 20x-variable
y-va
riab
le
Moderate negative 2 a 0.6 b 0.43 c −0.75 3 There is a strong positive correlation.
The greater the thickness, the greater the strength.
4 There is a moderate negative correlation. There is evidence to show that the greater the age of the person, the lower the age of their car.
5 a y = 1.25x + 5.25 b y = −2.75x + 35 c y = 21.30x − 8.25 6 a y = 5x b y = −8.5x + 300 7 a y = −0.375x + 60.375 b y = 12.2x – 659.2 8 a 50 b 394 9 a 200 b 48
EXTENDED RESPONSE
1 a
30
5040
20100
4020 60 800 100% married, using contraception
Bir
ths
per
thou
sand
b q = −1.0; There is a strong negative correlation. The greater the percentage of married women using contraception, the lower the birth rate.
c and d Various answers. e B = −0.45w + 49 f 38 births/thousand
g 32 births/thousand h Both answers can be considered reliable. 2 a
80
120100
6040200
42 6 80 10Insecticide (micrograms)
Num
ber
rem
aini
ng b q = −0.6; There is a moderate negative
correlation. There is evidence to show that the greater the amount of insecticide, the lower the number of survivors.
c and d Various answers e S = −7.8I + 108 f The y-intercept is the number of
survivors if no insecticide is used. The gradient gives the decrease in the number of survivors per microgram of insecticide used.
g About 42 will survive. h 10 survivors i 13.85 micrograms j Part g can be considered reliable. 3 a Number of days from the beginning
of the course: independent; size of vocabulary: dependent
b
1 2 3 4
Number of days
Num
ber
of w
ords
lear
ned
5 6 7 8 9 10 11 12 13 14
3503253002752502252001751501251007550250
c Strong positive linear correlation
d V = 246
7n + 4
7
e On average, Rachel learned about 25 new words per day.
f 522 words g 20 days h No, because the result is obtained using
extrapolation.
4 a Time spent working: independent; amount spent on junk and take-away food: dependent
b
200 22 24 26
Number of hours worked
Am
ount
spe
nt (
$)
28 30 32 34 36 38 40
383634323028262422201816141210
c Strong positive correlation d A = 1.38n – 18.80 e With every extra hour of work, the
amount spent per week on junk and take-away food increases by $1.38.
f $21.20 g Interpolation h Reliable, because interpolation has been
used to obtain the result. 5 a
100 11 12 13
Area (m2)
Num
ber
of b
rick
s
14 15 16 17 18 19 20 21 22 23 24 25 26
1600150014001300120011001000
900800700600500
b Strong positive relationship c q = 1; Yes, the value of the q-correlation
coeffi cient suggests a strong positive relationship, which closely matches to the observation from b.
d N = 57.40a – 3.44 e 57.40 f 1030 bricks are required. Michael needs
to obtain another 30 bricks. g Interpolation h Reliable, because interpolation has been
used.
Exam practice 1 189
Exam practice 1 CHAPTERS 1–4
The following information relates to Questions 1, 2 and 3.
Thirty fi ve Year 11 students were surveyed about the time they spent using their mobile phone each day for either text messaging or phone calls. The results were noted for male and females students and are recorded in the table below.
Gender
Phone usage Male Female
Less than 10 minutes 8 4
Between 10 to 20 minutes 7 6
More than 20 minutes 3 7
TOTAL 18 17
1 The number of females who used their mobile phones for 20 minutes or less was:A 4 B 6 C 7 D 8 E 10
2 The data represented in the table are best described as: A numerical and continuous dataB numerical and discrete dataC categorical and nominal dataD categorical and ordinal data E counted and ordered data
3 Which one of the following is incorrect?A 25% of all students surveyed used their mobile phones less than 20 minutes each day.B 29% of all students surveyed used their mobile phones more than 20 minutes each day.C 34% of all students surveyed used their mobile phones less than 10 minutes each day.D 56% of the males surveyed used their mobile phones more than 10 minutes each day.E 76% of the females surveyed used their mobile phones more than 10 minutes each day.
4 Each month Ming pays $20 as a flat fee and then 25 cents for each phone call she makes on her mobile phone. If during one month Ming makes a total of 15 calls on her mobile phone then her monthly phone bill, in dollars, will be:A 20.25 B 23.75 C 28.00 D 325 E 395
5 Seth changes his mobile phone plan to EasyDial. He is charged a flat fee of $45 plus 28 cents per call. If C represents the monthly mobile phone cost, in dollars, and n represents the number of monthly calls made. Which one of the following of the following equations determines the Seth’s monthly charges?A C = 45n + 28 B C = 28n + 45C C = 0.45n + 28 D C = 0.28n + 45E C = 45.28n
6 The cost of Stephen’s monthly phone plan is Cs = 0.27n + 50, where n is the number of calls per month and C is the cost per month. Which one of the following graphs represents Stephen’s monthly phone plan?
A
50
C
n
B
50
C
n
C
50
C
n
D C
n0
E
0.27
C
n
MULTIPLECHOICE15 minutes
Each question is worth one mark.
190 Maths Quest 11 Standard General Mathematics
In the Year 11 Mathematics class, 10 students who use a mobile phone were randomly selected and asked to record on a particular day the number of calls they made and the number of SMS text messages they sent. Their responses are recorded in Table 1 below.
Table 1
Student SMS text messages, s Phone calls, pA 5 3B 10 4C 2 6D 12 1E 6 1F 1 8G 3 8H 7 2I 6 3J 9 2
a For the number of SMS text messages: i Determine the mean and the standard deviation of the data. Express your answers correct to
1 decimal place. 2 marks
ii What percentage of the data lies between 3 and 9? 1 mark
b The scatterplot in Figure A below has been constructed from the data in Table 1. On Figure A, mark with an X the point for Student J. 1 mark
420 6Number of SMS text
messages, s
Num
ber
of p
hone
cal
ls, p
8 10 12
123456789
14
Figure A
c The coordinates for (xu, yu) are (8.8, 2.6); determine the coordinates of (xL, yL). 2 marks
d Using the two-mean method, determine the equation of the regression line in terms of the number of phone calls, p, and the number of SMS text messages, s. Express values correct to 2 decimal places. 3 marks
e i The median for the number of SMS text messages is 6. Show this as a vertical line on Figure A. ii Determine the median of the number of phone calls. Clearly show this as a horizontal line on
Figure A. iii Determine the q-correlation. 1 + 1 + 2 = 4 marks
iv EasyDial is planning a new campaign encouraging students to use their mobile phones for both SMS text messages and phone calls. Using your results from part e, should EasyDial spend money on this new campaign? 3 marks
EXTENDED RESPONSE
25 minutes
DIGITAL DOCdoc-9639Solutions
Exam practice 1
CHAPTER 5 Sequences and series 191
CHAPTER CONTENTS 5A Describing sequences 5B Arithmetic sequences 5C Arithmetic series 5D Geometric sequences 5E Geometric series 5F Applications of sequences and series
DIGITAL DOCdoc-956510 Quick Questions
CHAPTER 5
Sequences and series
5A Describing sequencesOur world today appears to be in a state of disorder. In reality, however, there is much order.
This chapter investigates different types of patterns, and how they can be manipulated mathematically.
SequencesThe dictionary describes a sequence as, ‘a number of things, actions, or events arranged or happening in a specifi c order or having a specifi c connection’. In mathematics, the term ‘sequence’ is used to represent an ordered set of elements.
Examples include:1, 2, 3, 4, ……. 12, which represents the sequential values of the months in a year.2, 4, 8, 16, 32, ……, which represents the sequential value when 2 is doubled indefi nitely.
It is important to note that:sequences may have a fi nite length (as in the fi rst case), or may be infi nite (as in the second example)sequences may have a defi nite pattern (as in these two examples), or simply be a sequence of numbers with no recognisable pattern (such as the random numbers obtained when throwing a pair of dice)In this chapter we are concerned with numerical sequences which have a recognisable pattern.
192 Maths Quest 11 Standard General Mathematics
Recognising patternsWORKED EXAMPLE 1
Describe the following patterns in words, then write down the next three numbers in the pattern.a 4, 8, 12, . . .b 4, 8, 16, . . .
THINK WRITE
a 1 The next number is found by adding 4 to the previous number.
a Next number = previous number + 4
4, 8, 12,+4 +4 +4
2 Add 4 each time to get the next three numbers and write them down.
The next three numbers are 16, 20, 24.
b 1 The next number is found by multiplying the previous number by 2.
b Next number = previous number × 2
4, 8, 16,×2 ×2 ×2
2 Multiply by 2 each time to get the next three numbers. Write them down.
The next three numbers are 32, 64, 128.
Using a rule to generate a number patternSometimes a rule is provided in words to generate a number pattern.
WORKED EXAMPLE 2
Use the following rules to write down the first five numbers of each number pattern.a Start with 32 and divide by 2 each time.b Start with 2, multiply by 4 and subtract 3 each time.
THINK WRITE
a 1 Start with 32 and divide by 2. Keep dividing by 2 until four more numbers have been calculated.
a 32 ÷ 2 = 1616 ÷ 2 = 8 8 ÷ 2 = 4 4 ÷ 2 = 2
2 Write the answer. The first five numbers are 32, 16, 8, 4 and 2.
b 1 Start with 2 then multiply by 4 and subtract 3. Continue to apply this rule until four more numbers have been calculated.
b 2 × 4 − 3 = 5 5 × 4 − 3 = 1717 × 4 − 3 = 6565 × 4 − 3 = 257
2 Write the answer. The first five numbers are2, 5, 17, 65 and 257.
Describing sequences with a recognisable pattern
The individual numbers of a sequence are called terms. The first term is written as t1, the second term as t2, and so on. The subscript indicates the term number.It is necessary to have some method of representing a general term, and this is written as tn (the nth term).
CHAPTER 5 Sequences and series 193
WORKED EXAMPLE 3
Consider the sequence generated by 7n. Generate some terms of the sequence, examine their values, then describe the pattern which occurs in the final digit of the terms.
THINK WRITE
1 The term number is n, so the first term is 71. Calculate a few of the terms, continuing until a pattern in the last digit is noticed. It is only necessary to look at the final digit in each term.
71 = 772 = 7 × 7 = 4973 = 49 × 7 = 34374 = 343 × 7 = 240175 = 2401 × 7 = 16 80776 = ....7 × 7 = …..9
2 A pattern has been noticed, so there is no need to continue any further. Describe the pattern.
The pattern in the last digit of the terms is:7, 9, 3, 1 repeated.
Exercise 5A Describing sequences1 WE1 Describe the following patterns in words, then write down the next three numbers in the pattern.
a 2, 4, 6, 8, . . . b 3, 8, 13, 18, . . . c 27, 24, 21, 18, . . . d 1, 3, 9, 27, . . . e 128, 64, 32, 16, . . . f 1, 4, 9, 16, . . .
2 Fill in the missing numbers in the following number patterns.a 3, ___, 9, 12, ___, ___ b 8, ___, ___, 14, ___c 4, 8, ___, 32, ___ d ___, ___, 13, 15, ___e 66, 77, ___, 99, ___, 121 f 100, ___, ___, 85, 80, ___
3 WE2 Using the following rules, write down the first five terms of the number patterns.a Start with 1 and add 4 each time.b Start with 5 and multiply by 3 each time.c Start with 50 and take away 8 each time.d Start with 64 and divide by 2 each time.e Start with 1, multiply by 2 and add 2 each time.f Start with 1, add 2 then multiply by 2 each time.
4 Each of the following represents a special number set. What is common to the numbers within the set?a 2, 4, 6, 8, 10 b 1, 8, 27, 64 c 2, 3, 5, 7, 11d 1, 1, 2, 3, 5, 8 e 1, 2, 3, 4, 6, 12 f 3, 9, 27, 81
5 WE3 Investigate the pattern which occurs in the final digit of the terms of the following sequences. Describe the pattern in each case.a 2n b 3n c 4n
d 5n e 8n
5B Arithmetic sequencesIt is said that, if you wake in the middle of the night and have trouble getting back to sleep, try counting backwards from 300 in 3s. The task is considered to be so tricky, that you eventually give up, and fall back to sleep! You are, in effect, performing an arithmetic sequence.
An arithmetic sequence is one in which the difference between any two consecutive terms is the same.In other words, the next term in the sequence is found by adding the same number repeatedly.
Consider the arithmetic sequence 2, 5, 8, 11, 14, ….The difference between consecutive terms is 3 (5 − 2 = 3, 8 − 5 = 3, 11 − 8 = 3, etc).The next term is found by adding 3 to the precious term (2 + 3 = 5, 5 + 3 = 8, 8 + 3 = 11, etc).The difference between consecutive terms is known as the common difference and is referred to as ‘d’.− In this case d = +3, and you will notice that consecutive terms of the sequence are increasing.− When the value of d is negative, consecutive terms of the sequence decrease in value.The first term in an arithmetic sequence is referred to as ‘a’. In this case a = 2.The terms are labelled t1, t2, ...... tn. In this case, t1 = 2, t2 = 5, and so on.
194 Maths Quest 11 Standard General Mathematics
Recognising an arithmetic sequenceIn order to determine whether a sequence is an arithmetic sequence, a common difference must be established.
WORKED EXAMPLE 4
For each of the following,a 8, 14, 20, 26, .....b 2, 4, 8, 16, ....c 100, 91, 82, 73, ..... i decide whether it is an arithmetic sequence ii state the values of a and d, if it is an arithmetic sequence.
THINK WRITE
a i 1 Write the numbers and calculate the difference between consecutive terms.
a i 8, 14, 20, 26, .....t2 − t1 = 14 − 8 = 6t3 − t2 = 20 − 14 = 6t4 − t3 = 26 − 20 = 6
2 There is a common difference, so it is an arithmetic sequence.
There is a common difference of 6 between consecutive terms, so it is an arithmetic sequence.
ii Determine the values of a and d. ii The fi rst term is a, so a = 8The common difference is d, so d = 6.
b i 1 Write the numbers and calculate the difference between consecutive terms.
b i 2, 4, 8, 16, .....t2 − t1 = 4 − 2 = 2t3 − t2 = 8 − 4 = 4t4 − t3 = 16 − 8 = 8
2 There is a no common difference, so it is not an arithmetic sequence.
There is a no common difference, so it is not an arithmetic sequence.
c i 1 Write the numbers and calculate the difference between consecutive terms.
c i 100, 91, 82, 73, .....t2 − t1 = 91 − 100 = −9t3 − t2 = 82 − 91 = −9t4 − t3 = 73 − 82 = −9
2 There is a common difference, so it is an arithmetic sequence.
There is a common difference of −9 between consecutive terms, so it is an arithmetic sequence.
ii Determine the values of a and d. ii The fi rst term is a, so a = 100The common difference is d, so d = −9.
Graphing an arithmetic sequenceSince an arithmetic sequence involves adding or subtracting the same value repeatedly, the relationship between the terms is a linear one.This means that the graph of terms of an arithmetic sequence is a straight line.
WORKED EXAMPLE 5
For the arithmetic sequence 2, 4, 6, 8, 10, . . .a draw up a table showing the term number, with its value.b graph the values in the table.c from your graph, determine the value of the tenth term in the sequence.
CHAPTER 5 Sequences and series 195
THINK WRITE/DRAW
a Draw up a table showing the term number and its value.
a Term number 1 2 3 4 5
Term value 2 4 6 8 10
b This graph can be drawn by hand, or by using a calculator.The value of the term depends on the term number, so ‘value’ is graphed on the y-axis. Draw up a suitable scale on both axes, plot the points and join with a straight line. Note that, even though the graph is a straight line, values on the line only have meaning for integer values of the term number.
b
Term
val
ue
0 1 2 3 4 5 6 7 8 9 10 11 12 1314 1502468
1012141618202224
Term number
(5, 10)
(1, 2)
tn = 20
n = 10
tn
n
c 1 Find the term number 10 on the x-axis, and draw a vertical line from the x-axis to meet the straight line. Read the y-value of this point.
2 Write the answer. c The tenth number in this sequence is 20.
Pat terns in shapesSome patterns found in shapes are in the form of an arithmetic sequence.
WORKED EXAMPLE 6
Consider a set of hexagons constructed with matches according to the pattern shown below.
a Draw the next two fi gures in the series.b Draw up a table showing the relationship between the number of hexagons in the fi gure and the
number of matches used to construct the fi gure.c Devise a rule to describe the number of matches required for each fi gure in terms of the number
of hexagons in the fi gure.d Use your rule to determine the number of matches required to make a fi gure consisting of
20 hexagons.
THINK WRITE/DRAW
a 1 Examine the fi gures, and note the number of additional matches it takes to progress from one fi gure to the next.
a It takes 5 additional matches to progress from one fi gure to the next.
2 Draw the next two fi gures. The next two fi gures are:
196 Maths Quest 11 Standard General Mathematics
b Draw up a table showing the number of matches needed for each fi gure (m) in terms of the number of hexagons (h). Fill in the table by looking at the fi gures.
bNumber of hexagons h
1 2 3 4 5
Number of matches m
6 11 16 21 26
c Look for a pattern and devise a rule.By taking the number of hexagons, multiplying by 5, then adding 1, this gives the number of matches required for the shape.
c The number of matches increases by 5 in going from one fi gure to the next.Number of matches = number of hexagons × 5 + 1m = 5h + 1
d Substitute in the rule to calculate the number of matches required for a shape consisting of 20 hexagons.
d Number of matches for 20 hexagons= 5 × 20 + 1= 101So, 101 matches are required to build a fi gure consisting of 2 hexagons.
Arithmetic sequences generated by recursionA sequence can be generated by the repeated use of an instruction. This is known as recursion.Term n is represented by tn, the next term after this one is represented by tn+1, while the term before tn is tn–1.
For these sequences, the fi rst term must be stated.
WORKED EXAMPLE 7
Consider the arithmetic sequence generated by the matches and hexagons in Worked example 6:6, 11, 16, 21, 26, .......a Represent this sequence as a recursive equation.b Use your equation to write the fi rst fi ve terms of the sequence, verifying that they do match the
fi rst fi ve terms of the stated arithmetic sequence.
THINK WRITE
a 1 Note the value of the fi rst term. a The fi rst term has a value of 6, so t1 = 6.
2 Investigate how each term is obtained from the previous term. In this case, it is by repeatedly adding 5 to the previous term.A general term is defi ned as tn, and the next term is represented as tn+1. so this repeated procedure can be written as:tn+1 = tn + 5.
The sequence can be represented by the recursive equation: Next term = previous term + 5
tn+1 = tn + 5
3 Write the full statement, including the fi rst term.
So the full recursive equation is:tn+1 = tn + 5, t1 = 6
b 1 Generate values for each of the terms in the sequence by substituting values for n.The fi rst term is given as t1 = 6For term 2, use tn+1 = tn + 5, where n = 1For term 3, use tn+1 = tn + 5, where n = 2For term 4, use tn+1 = tn + 5, where n = 3For term 5, use tn+1 = tn + 5, where n = 4
b The fi rst term is t1 = 6t2 = t1 + 5 = 6 + 5 = 11t3 = t2 + 5 = 11 + 5 = 16t4 = t3 + 5 = 16 + 5 = 21t5 = t4 + 5 = 21 + 5 = 26
CHAPTER 5 Sequences and series 197
2 Write the fi rst fi ve terms of the sequence. Using the recursion equation, the fi rst fi ve terms of the sequence are 6, 11, 16, 21, 26.This confi rms that the recursive equation is correct.
The restriction on using a recursive equation to generate an arithmetic sequence is that the value of the previous term must be known before you can calculate the next term.
There is an alternative method which can be used, and this enables us to calculate the value of any term in an arithmetic sequence.
Finding the terms of an arithmetic sequenceConsider the arithmetic sequence in the previous worked example: 6, 11, 16, 21, 26, ..... The fi rst term is 6, and the common difference is 5, so this can be written as a = 6 and d = 5.
An analysis of these terms shows the following.
t1 = 6 t1 = at2 = 6 + 5 t2 = a + d t2 = a + 1dt3 = 6 + 5 + 5 t3 = a + d + d t3 = a + 2dt4 = 6 + 5 + 5 + 5 t4 = a + d + d + d t4 = a + 3dand so on
In this case, it gives rise to the pattern tn = 6 + (n − 1) × 5, where n represents the term number of the sequence.Noting that a = 6 and d = 5, this can be expressed as tn = a + (n − 1) × d.In general terms, the rule for all arithmetic sequences can be expressed as:
tn = a + (n − 1)d
where tn is the nth terma is the fi rst term
d is the common difference.
Provided we know values for a and d, this rule can be used to fi nd any term in an arithmetic sequence.
WORKED EXAMPLE 8
Consider the arithmetic sequence22, 30, 38, 46, ......a Write a rule for the sequence of the form tn = a + (n − 1)d.b Use your rule to determine the value of the 20th term in the sequence.
THINK WRITE
a 1 Using the rule tn = a + (n − 1)d, fi rst determine the values of a and d.
a a = 22d = t2 − t1
= 30 − 22= 8
2 Substitute values for a and d into the rule for an arithmetic sequence.
tn = a + (n − 1)dThe rule for this arithmetic sequence is:tn = 22 + (n − 1) × 8
b 1 The 20th term has a value of n = 20. Substitute into the formula, and calculate its value.
b t20 = 22 + (20 − 1) × 8= 22 + 19 × 8= 174
2 Write the answer. The 20th term in the sequence is 174.
198 Maths Quest 11 Standard General Mathematics
An alternative method would be to use a calculator or a spreadsheet to determine the 20th term.
1 Using a spreadsheet, head up the columns by entering the title ‘Term number’ in cell A1. and the title ‘Term value’ in cell B1.
2 In cell A2, enter the value 1. In cell A3, enter the formula: =A2 + 1. Copy this formula down to a value of 20.
3 In cell B2, enter the value 22. In cell B3, enter the formula: =B2 + 8. Copy this down to coincide with column A.
4 The term value appears for the term number 20. Write its value.
The 20th term in the sequence is 174.
Exercise 5B Arithmetic sequences 1 WE4 For each of the following,
i decide whether it is an arithmetic sequence ii state the values of a and d, if it is an arithmetic sequence.
a 5, 10, 15, 20, ...... b −5, −10, −15, −20, .....c 5, 10, 20, 40, .... d −1, 1, 3, 5, .....e 6, −1, −7, −12, ...... f 2, 22, 23, 24, .....
g 2, 4, 8, 16, ...... h 1
2
1
4
1
8
1
16, , , , .......
i 3, 0, −3, −6, ...... j −2, 2, −4, 4, .....
2 WE5 For the following arithmetic sequences, i draw up a table showing the term number, with its value ii graph the values in the table iii from your graph, determine the value of the tenth term in the sequence.a 3, 6, 9, 12, 15 b 5, 7, 9, 11, 13c 4, 8, 12, 16, 20 d 10, 13, 16, 19, 22
3 WE6 Consider each of the following geometric shapes constructed with matches. i Draw the next two fi gures in the series. ii Draw up a table showing the relationship between the number of shapes in each fi gure and the
number of matches used to construct the fi gure. iii Devise a rule to describe the number of matches required for each fi gure in terms of the number
of shapes in the fi gure.
CHAPTER 5 Sequences and series 199
iv Use your rule to determine the number of matches required to make a fi gure consisting of 20 shapes.
a b
c
d
4 WE7 Consider the following arithmetic sequences. i Represent each one as a recursive equation. ii Use your equation to write the fi rst fi ve terms of the sequence, verifying that they do match the
fi rst fi ve terms of the stated arithmetic sequence.a 3, 5, 7, 9, 11, ......... b 4, 2, 0, −2, −4, .......c 14, 7, 0, −7, −14, ....... d 2, 10, 18, 26, 34, .........
e 1
4,
1
2,
3
4, 1, 1
1
4, ........ f 1.2, 1.5, 1.8, 2.1, 2.4, ......
5 WE8 Consider the arithmetic sequences in question 4. i Write a rule for each sequence of the form tn = a + (n − 1)d.ii Use your rule to determine the value of the 20th term in the sequence.
6 MC Which of the following definitions could be used to describe the sequence 3, 1, −1, …?A tn = n − 2 B tn = 2n − 5C tn = 5n − 2 D tn = 5 − 2nE tn = 2(5 − n)
7 MC Which of the following recursive equations could be used to describe the sequence:20, −10, −40, …..A tn + 1 = tn − 20, t1 = 20 B tn + 1 = tn − 20, t1 = −30C tn + 1 = tn + 20, t1 = 30 D tn + 1 = tn + 30, t1 = −20E tn + 1 = tn − 30, t1 = 20
8 MC Which of the following sequences is generated by the formula tn = −2n + 3?A 3, 1, −1, ….. B −2, 1, 4, …..C 1, −1, −3, ….. D 5, 8, 11, …..E −2, 3, −2, ……
9 MC The first term in a sequence is −2. The second term is obtained by multiplying the value of the first term by 3, then adding 1. The third term is obtained by multiplying the value of the second term by 3, then adding 1. If this pattern continues, the equation which generates this sequence is:A tn = 3tn+1 + 1, where t1 = −2 B tn+1 = 3tn + 1, where t1 = −2C 3tn+1 = tn + 1 where t1 = −2 D 3tn = tn+1 + 1 where t1 = −2E tn+1 + 1 = 3tn where t1 = −2
5C Arithmetic seriesA series is the term used for the sum of all the terms in a sequence.An arithmetic series is the sum of all the terms in an arithmetic sequence.
Adding the terms in an arithmetic sequenceThis story is told of Carl Frederich Gauss, the son of poor working-class German parents.
When he was a small boy at school, his teacher gave the class the task of summing the numbers from 1 to 100 to keep them busy. Carl immediately wrote down the correct answer of 5050. How did he arrive at the correct answer so quickly?
DIGITAL DOCdoc-9638Arithmetic sequences
200 Maths Quest 11 Standard General Mathematics
Here’s the problem: 1 + 2 + 3 + ……………………… + 98 + 99 + 100 = ?One method, obviously, is to add the numbers in sequence ……………1 + 2 = 3, 3 + 3 = 6, and so on.This is a very tedious process, and could not have been the method young Carl used, since he arrived
at the answer so quickly.Let’s investigate to see whether there is some shortcut method.Let the sum of the numbers be represented by S; i.e.,S = 1 + 2 + 3 + ……………………… + 98 + 99 + 100Since addition is commutative, the numbers can be added in any order. First write down the set of numbers in ascending order. Underneath, write down the numbers in descending order.S = 1 + 2 + 3 + …………………. + 98 + 99 + 100S = 100 + 99 + 98 + …………………. + 3 + 2 + 1Looking at these two sets of numbers vertically, it can be seen that 1 + 100 = 101, 2 + 99 = 101, etc., to the very end. Adding the two sets, we get:2S = 101 + 101 + 101 + …………….. +101 + 101 + 101There are 100 of the numbers 101 in the addition, so this becomes:2S = 100 × 101 = 10 100Dividing both sides by 2, we get:
S10 100
25050
=
=This was exactly Carl’s answer!In general terms, this translates to the following method:– Add the first and last terms in the sequence.– Multiply by the number of terms.– Divide by 2.We can use this method to develop a general formula for the summation of a specified number of terms in an arithmetic sequence.
Developing a general formula for adding the terms in an arithmetic sequence
If Sn represents the sum of n terms in an arithmetic sequence, a represents the first term and l the last
term, the sum of the n terms is given by Sn
a l2
( )n = + .
There may be instances when we don’t know the value of the last term (e.g., finding the sum of the first 20 terms in the sequence 12, 25, 38, ….), so we need an alternative formula.– We saw previously that the nth term can be written as tn = a + (n − 1)d.– So, if we sum to the nth term, the last term is tn. This means that l = a + (n − 1)d.
– The formula now becomes Sn
a a n d2
( 1)n [ ]= + + − .
– Simplifying the expression on the right-hand side, Sn
a n d2
2 ( 1)n [ ]= + − .
– This formula allows us to find the sum of a given number of terms (n) in an arithmetic sequence, as long as we know the value of the first term (a), and can determine the common difference (d).
WORKED EXAMPLE 9
Find the sum of the first 20 terms in the sequence 12, 25, 38, …..
THINK WRITE
1 Write the formula for the sum of the first n terms in the arithmetic sequence. S
na n d
22 ( 1)n [ ]= + −
2 Identify values for the variables. n = 20a = 12d = 25 − 12 = 13
CHAPTER 5 Sequences and series 201
3 Substitute into the formula and evaluate.S
20
22 12 (20 1)13
10 24 247
10 271
2710
20 [ ][ ]
= × + −
= × += ×=
4 Answer the question. The sum of the fi rst 20 numbers in the sequence is 2710.
It is worthwhile noting that we can determine the value of a particular term in a sequence by using the sum formula. Consider the following simple example.
The sum of the fi rst four numbers in the sequence 1, 3, 5, 7, …… is S4 = 1 + 3 + 5 + 7 = 16The sum of the fi rst three numbers is S3 = 1 + 3 + 5 = 9Note that S4 − S3 = 16 − 9 = 7 (the fourth term).This is logical since, if we add the value of the 4th term to the sum of the fi rst three terms, we get the sum of the fi rst four terms.This can be expressed in a general form as Sn+1 = Sn + tn+1.This formula can then be used to determine the value of tn+1 by rearranging to give:
tn+1 = Sn+1 − Sn.
A spreadsheet or a CAS calculator can be used to reduce the calculations.The following simple example illustrates this technique. The answers can readily be checked using manual calculations.
WORKED EXAMPLE 10
Consider the sequence 9, 11, 13, ……a Determine the value of S5.b Determine the value of t5.c Use a spreadsheet (or CAS calculator) to check the answers.
THINK WRITE
a 1 Write the formula for the sum of the fi rst n terms in the arithmetic sequence.
a Sn
a n d2
2 ( 1)n [ ]= + −
2 Identify values for the variables. n = 5a = 9d = 11 − 9
= 2
3 Substitute into the formula and evaluate.
S5
22 9 (5 1)2
2.5 18 8
2.5 26
65
5 [ ][ ]
= × + −
= × += ×=
b 1 Write the appropriate sum formula. b tn+1 = Sn+1 − Sn.
2 Substitute n = 4 to obtain t5. t5 = S5 − S4
3 The value of S5 is known. Calculate S4 using the technique employed in part (a).
S4
22 9 (4 1)2
2 18 6
2 24
48
4 [ ][ ]
= × + −
= × += ×=
202 Maths Quest 11 Standard General Mathematics
4 Calculate t5 by subtracting the sum of the fi rst four terms from the sum of the fi rst fi ve terms.
t5 = 65 − 48 = 17
Note: This answer is readily verifi ed manually, by writing out the fi rst fi ve terms.
c 1 Set up the spreadsheet columns by heading column A ‘Term number’, column B ‘Term value’ and column C ‘Sum’.
c
2 In cell A2, enter the value 1. In cell A3, enter the formula: =A2 + 1. Copy this formula down until you have up to at least term 5.
3 In cell B2, enter the value 9. In cell B3, enter the formula: =B2 + 2. Copy this formula down to the level of column A.
4 In cell C2, enter the formula: =A2/2*(2*9+(A2−1)*2Copy the formula down to the level of the two other columns.
5 Look for the answers to the two questions.
ab
The value of S5 is 65.The value of t5 is 17.
Exercise 5C Arithmetic series 1 Find the sum of the first 50 positive integers.
2 Find the sum of all the positive half-integers up to 100.
(Note: The sequence of half-integers is 1
2, 1
1
2, 2
1
2, 3
1
2,.........)
3 Explain how your answer in Question 2 compares with that of the sum of the all the positive integers up to 100.
4 Determine the sum of the even integers in the range 1 to 100.
5 Explain the relationship between the sum of the even integers in the range 1 to 100 and the sum of the odd integers in the range 1 to 100.
6 WE9 For the sequence 10, 13, 16, ….., find the sum of the first:a 5 terms b 10 terms
7 For the sequence 11, 7, 3, ….., find the sum of the first:a 5 terms b 10 terms
8 For the sequence tn+1 = tn + 5.5 where a = 2.5, find the sum of the first:a 5 terms b 10 terms c 20 terms.
9 The first term of an arithmetic sequence is 4, and the common difference is 3. Find:a S4 b S16 c S64
10 The first term of an arithmetic sequence is 14, and the common difference is 31
2− . Find:
a S4 b S9 c S14
11 WE10 For the sequence 50, 40, 30, ….., determine:a S10b t10
12 A sequence is defined as 15, 9, 3, ……a Find S13. b The sum of terms t10 to t15.
13 A sequence is defined as −5, −3, −1, 1, …… Find the average of the first 40 terms.
DIGITAL DOC doc-9638
Arithmetic series
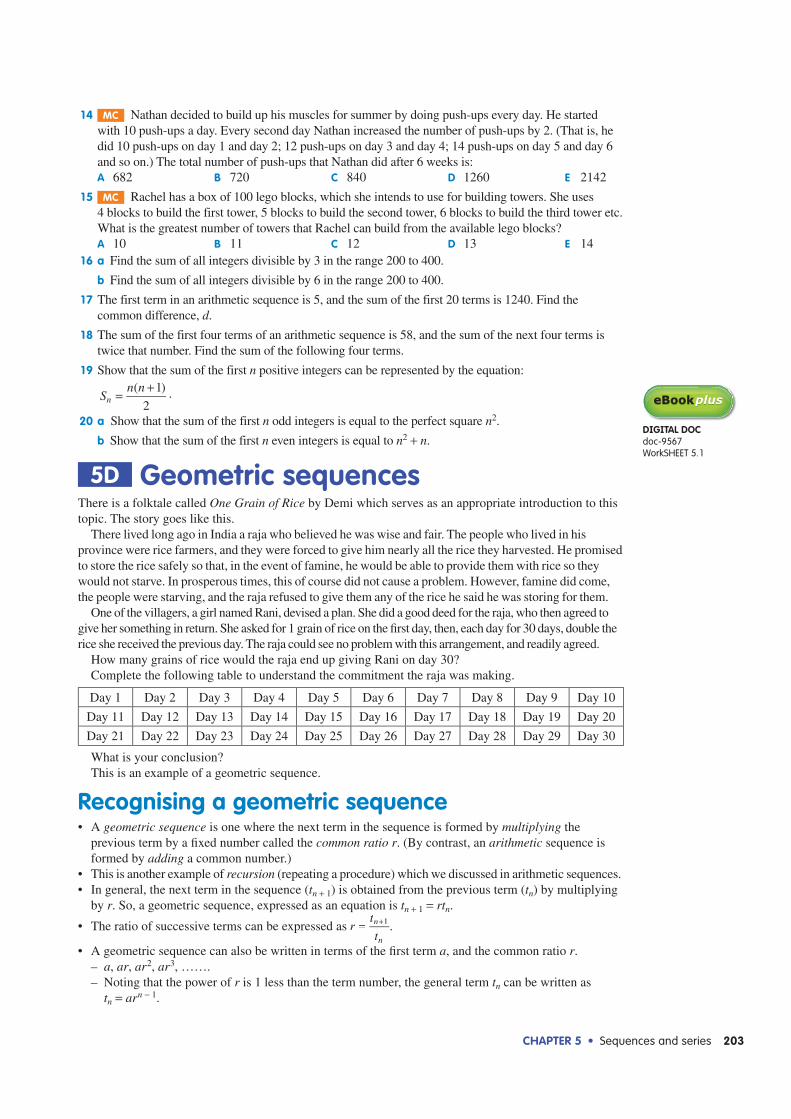
CHAPTER 5 Sequences and series 203
14 MC Nathan decided to build up his muscles for summer by doing push-ups every day. He started with 10 push-ups a day. Every second day Nathan increased the number of push-ups by 2. (That is, he did 10 push-ups on day 1 and day 2; 12 push-ups on day 3 and day 4; 14 push-ups on day 5 and day 6 and so on.) The total number of push-ups that Nathan did after 6 weeks is:A 682 B 720 C 840 D 1260 E 2142
15 MC Rachel has a box of 100 lego blocks, which she intends to use for building towers. She uses 4 blocks to build the first tower, 5 blocks to build the second tower, 6 blocks to build the third tower etc. What is the greatest number of towers that Rachel can build from the available lego blocks?A 10 B 11 C 12 D 13 E 14
16 a Find the sum of all integers divisible by 3 in the range 200 to 400.
b Find the sum of all integers divisible by 6 in the range 200 to 400.
17 The first term in an arithmetic sequence is 5, and the sum of the first 20 terms is 1240. Find the common difference, d.
18 The sum of the first four terms of an arithmetic sequence is 58, and the sum of the next four terms is twice that number. Find the sum of the following four terms.
19 Show that the sum of the first n positive integers can be represented by the equation:
Sn n( 1)
2n = + .
20 a Show that the sum of the first n odd integers is equal to the perfect square n2.
b Show that the sum of the first n even integers is equal to n2 + n.
5D Geometric sequencesThere is a folktale called One Grain of Rice by Demi which serves as an appropriate introduction to this topic. The story goes like this.
There lived long ago in India a raja who believed he was wise and fair. The people who lived in his province were rice farmers, and they were forced to give him nearly all the rice they harvested. He promised to store the rice safely so that, in the event of famine, he would be able to provide them with rice so they would not starve. In prosperous times, this of course did not cause a problem. However, famine did come, the people were starving, and the raja refused to give them any of the rice he said he was storing for them.
One of the villagers, a girl named Rani, devised a plan. She did a good deed for the raja, who then agreed to give her something in return. She asked for 1 grain of rice on the fi rst day, then, each day for 30 days, double the rice she received the previous day. The raja could see no problem with this arrangement, and readily agreed.
How many grains of rice would the raja end up giving Rani on day 30?Complete the following table to understand the commitment the raja was making.
Day 1 Day 2 Day 3 Day 4 Day 5 Day 6 Day 7 Day 8 Day 9 Day 10
Day 11 Day 12 Day 13 Day 14 Day 15 Day 16 Day 17 Day 18 Day 19 Day 20
Day 21 Day 22 Day 23 Day 24 Day 25 Day 26 Day 27 Day 28 Day 29 Day 30
What is your conclusion?This is an example of a geometric sequence.
Recognising a geometric sequenceA geometric sequence is one where the next term in the sequence is formed by multiplying the previous term by a fi xed number called the common ratio r. (By contrast, an arithmetic sequence is formed by adding a common number.)This is another example of recursion (repeating a procedure) which we discussed in arithmetic sequences.In general, the next term in the sequence (tn + 1) is obtained from the previous term (tn) by multiplying by r. So, a geometric sequence, expressed as an equation is tn + 1 = rtn.
The ratio of successive terms can be expressed as rt
tn
n
1= + .
A geometric sequence can also be written in terms of the fi rst term a, and the common ratio r.– a, ar, ar 2, ar 3, …….– Noting that the power of r is 1 less than the term number, the general term tn can be written as
tn = ar n − 1.
DIGITAL DOCdoc-9567WorkSHEET 5.1
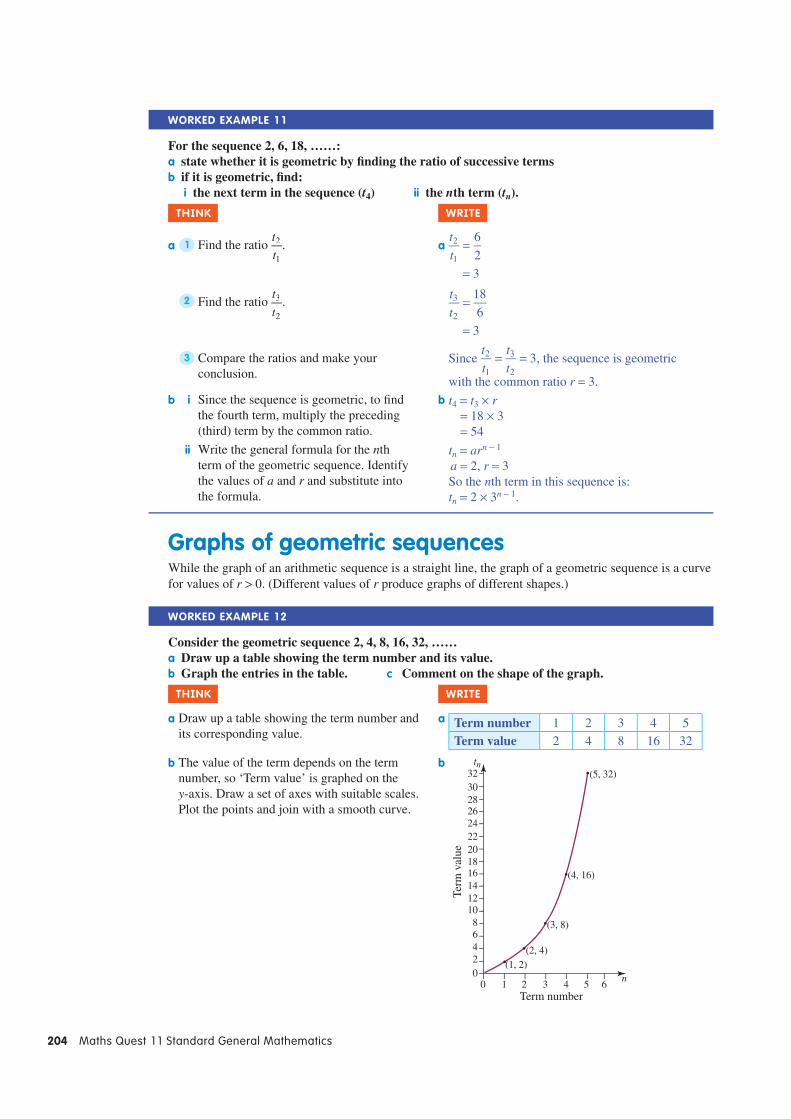
204 Maths Quest 11 Standard General Mathematics
WORKED EXAMPLE 11
For the sequence 2, 6, 18, ……:a state whether it is geometric by fi nding the ratio of successive termsb if it is geometric, fi nd: i the next term in the sequence (t4) ii the nth term (tn).
THINK WRITE
a 1 Find the ratio t
t2
1
. at
t
6
2
3
2
1=
=
2 Find the ratio t
t3
2
.t
t
18
6
3
3
2=
=
3 Compare the ratios and make your conclusion.
Since t
t
t
t32
1
3
2= = , the sequence is geometric
with the common ratio r = 3.b i Since the sequence is geometric, to fi nd
the fourth term, multiply the preceding (third) term by the common ratio.
b t4 = t3 × r= 18 × 3= 54
ii Write the general formula for the nth term of the geometric sequence. Identify the values of a and r and substitute into the formula.
tn = ar n − 1
a = 2, r = 3So the nth term in this sequence is:tn = 2 × 3n − 1.
Graphs of geometric sequencesWhile the graph of an arithmetic sequence is a straight line, the graph of a geometric sequence is a curve for values of r > 0. (Different values of r produce graphs of different shapes.)
WORKED EXAMPLE 12
Consider the geometric sequence 2, 4, 8, 16, 32, ……a Draw up a table showing the term number and its value.b Graph the entries in the table. c Comment on the shape of the graph.
THINK WRITE
a Draw up a table showing the term number and its corresponding value.
a Term number 1 2 3 4 5Term value 2 4 8 16 32
b The value of the term depends on the term number, so ‘Term value’ is graphed on the y-axis. Draw a set of axes with suitable scales. Plot the points and join with a smooth curve.
b
Term number
Term
val
ue
100
2
2468
101214161820222426283032
3 4 5 6n
tn(5, 32)
(4, 16)
(3, 8)
(2, 4)(1, 2)
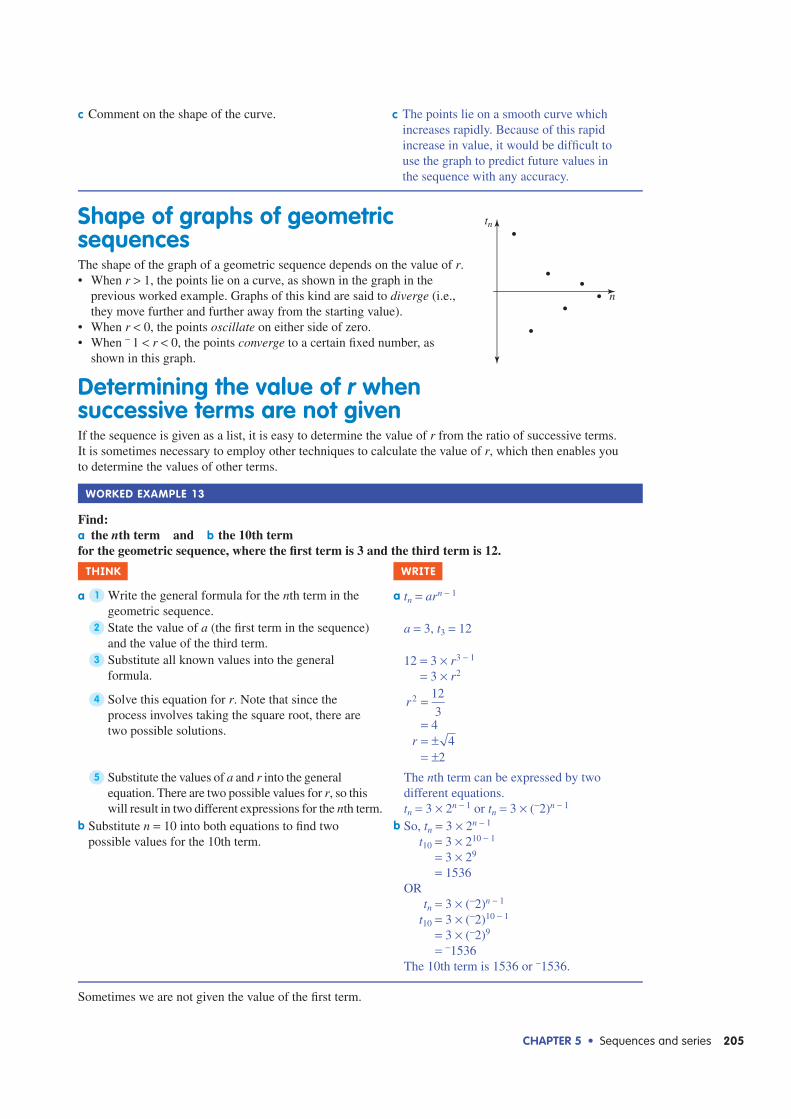
CHAPTER 5 Sequences and series 205
c Comment on the shape of the curve. c The points lie on a smooth curve which increases rapidly. Because of this rapid increase in value, it would be difficult to use the graph to predict future values in the sequence with any accuracy.
Shape of graphs of geometric sequencesThe shape of the graph of a geometric sequence depends on the value of r.
When r > 1, the points lie on a curve, as shown in the graph in the previous worked example. Graphs of this kind are said to diverge (i.e., they move further and further away from the starting value).When r < 0, the points oscillate on either side of zero.When − 1 < r < 0, the points converge to a certain fixed number, as shown in this graph.
Determining the value of r when successive terms are not givenIf the sequence is given as a list, it is easy to determine the value of r from the ratio of successive terms. It is sometimes necessary to employ other techniques to calculate the value of r, which then enables you to determine the values of other terms.
WORKED EXAMPLE 13
Find:a the nth term and b the 10th termfor the geometric sequence, where the first term is 3 and the third term is 12.
THINK WRITE
a 1 Write the general formula for the nth term in the geometric sequence.
a tn = ar n − 1
2 State the value of a (the first term in the sequence) and the value of the third term.
a = 3, t3 = 12
3 Substitute all known values into the general formula.
12 = 3 × r 3 − 1
= 3 × r 2
4 Solve this equation for r. Note that since the process involves taking the square root, there are two possible solutions.
r
r
12
34
42
2 =
== ±= ±
5 Substitute the values of a and r into the general equation. There are two possible values for r, so this will result in two different expressions for the nth term.
The nth term can be expressed by two different equations.tn = 3 × 2n − 1 or tn = 3 × (−2)n − 1
b Substitute n = 10 into both equations to find two possible values for the 10th term.
b So, tn = 3 × 2n − 1
t10 = 3 × 210 − 1
= 3 × 29
= 1536OR
tn = 3 × (−2)n − 1
t10 = 3 × (−2)10 − 1
= 3 × (−2)9
= −1536The 10th term is 1536 or −1536.
Sometimes we are not given the value of the first term.
n
tn
206 Maths Quest 11 Standard General Mathematics
WORKED EXAMPLE 14
The 5th term in a geometric sequence is 14, and the seventh term is 0.56. Find:a the common ratio, r b the fi rst term, a and the nth termfor the sequence.
THINK WRITE
a 1 Write the general formula for the nth term of the geometric sequence.
a tn = ar n − 1
2 Use the information about the 5th term to form an equation. Label it [1].
When n = 5, tn = 1414 = ar 5 − 1
14 = ar 4 [1]
3 Similarly, use the information about the 7th term to form an equation. Label it [2].
When n = 7, tn = 0.560.56 = ar 7 − 1
0.56 =ar 6 [2]
4 Divide equation [2] by equation [1] to eliminate a.
Divide equation [2] by equation [1].ar
arr
0.56
140.04
6
4
2
=
=
5 Solve to fi nd the value of r. r 0.04
0.2
= ±= ±
b 1 Since there are two values for r, each of these needs to be considered.Consider the positive value of r fi rst, substitute into either equation [1] or [2] and solve for a.
b If r = +0.2, equation [1] becomesa
a
a
(0.2) 14
0.0016 14
14
0.00168750
4× ==
=
=
2 Use the values of r and a to write the nth term. The nth term is:tn = 8750 × (0.2)n − 1
3 Apply a similar procedure for the negative value of r.
If r = −0.2, equation [1] becomesa
a
a
( 0.2) 14
0.0016 14
14
0.00168750
4× ==
=
=
−
4 Use the values of r and a to write the nth term. The nth term is:tn = 8750 × (−0.2)n − 1
Exercise 5D Geometric sequences 1 WE11 State whether each of the following is a geometric sequence by finding the ratio of successive
terms.a 3, 6, 9, ……. b 4, 12, 36, ….. c 3, 6, 12, ……….
d 4, 6, 9, ……… e 3
4,
3
2,
3
1, ........ f
3
4,
3
2,
9
4, .......
2 WE11 For each of those which are geometric sequences in Question 1, find: i the next term in the sequence (t4)ii the nth term (tn).
TUTORIALeles-1361Worked example 14
CHAPTER 5 Sequences and series 207
3 WE12 For each of the following geometric sequences:i Draw up a table showing the term number and its value.ii Graph the entries in the table.iii Comment on the shape of the graph.a 1, 4, 9, 16, 15 b 1, 8, 27, 64, 125
4 For each of the following:i show that the sequence is geometricii find the nth term, and consequently the 6th and the 10th terms.a 5, 10, 20, ….. b 2, 5, 12.5, ….. c 2.3, 3.45, 5.175, …..
d 1
2, 1, 2, ...... e
1
3,
1
12,
1
48, ......
5 WE13 Find the nth term and the 10th term in the following geometric sequences. In some cases, more than one answer is possible. Explain why this is so.a The first term is 2 and the third term is 18. b The first term is 1 and the third term is 4.c The first term is 5 and the fourth term is 40. d The first term is −1 and the second term is 2.
6 For the geometric sequence 3, ___, ___, 192, find the values of the two missing terms.
7 Consider the graphs below. Which one represents a geometric sequence such that a > 0 and r < 0?
A
0 1
1234567
2 3 4 5 6 7n
tn B
0 1
1234567
2 3 4 5 6 7n
tn C
01
1
−1−2−3−4−5
2345
2 3 4 5 6 7n
tn
D
01
1
−1−2−3−4−5
2345
2 3 4 5 6 7n
tn E
8 For the geometric sequence a, 15, b, 0.0375, ….., find the values of a and b, given that they are positive numbers.
9 WE14 The third term in a geometric sequence is 100, and the fifth term is 400. Find:a the common ratio, r b the first term, a and the nth termfor the sequence.
10 Insert three terms within the sequence 8, ___, ___, ___, 132
such that the sequence of numbers is geometric.
11 The first two terms in a geometric sequence are 124, 24, and the kth term is 0.0384. Find the vakue of k.
5E Geometric seriesReturning to the story of One Grain of Rice, the answer you found to the question:
How many grains of rice would the raja end up giving Rani on day 30?is not the total number of grains of rice Rani received over the 30 days. To determine the total number she received, you would have to find the sum of all the entries for each of the 30 days. How much would this amount to?
A geometric series is the sum of the terms in a geometric sequence.
208 Maths Quest 11 Standard General Mathematics
The formula for the sum of the terms in a geometric sequence
The sum of the fi rst n terms in a geometric sequence can be written as:Sn = a + ar + ar 2 + ……………….. + ar n − 3 + ar n − 2 + ar n − 1 [1]Multiply both sides of this equation by r.rSn = ar + ar 2 + ar 3 +………………….. + ar n − 2 + ar n − 1 + ar n [2]Note that the terms for equations [1] and [2] are the same, except for the fi rst term in equation [1] and the last term in equation [2]. This means that, if we subtract the two equations, all the terms on the right-hand side will be eliminated except for those two terms. Perform the subtraction [2] − [1].rSn − Sn = ar n − aFactorise the left-hand side and the right-hand side.Sn(r − 1) = a(r n − 1)Divide both sides by (r − 1).
= −−
≠Sa r
rr
( 1)
1, 1n
n
Note that the value of r can not be 1, as this would make the value of the denominator 0.In summary, the sum of the fi rst n terms of a geometric sequence is given by:
= −−
≠Sa r
rr
( 1)
1, 1n
n
where
a is the fi rst term of the sequencer is the common ratio.
WORKED EXAMPLE 15
Find the sum of the fi rst fi ve terms (S5) of these geometric sequences.
a 1, 4, 16, ….. b tn = 2 × 2n − 1 c = =+
−t t t
14
,1
2n n1 1
THINK WRITE
a 1 Write the general formula for the sum of the fi rst n terms of the geometric sequence.
a Sa r
r
( 1)
1n
n
= −−
2 Write the sequence. The sequence is: 1, 4, 16, ……
3 Identify the variables: a is the fi rst term; r can be established by fi nding the ratio; n is known from the question.
a = 1, r = 4
1, n = 5
4 Substitute the values of a, r and n into the formula, then evaluate.
S1(4 1)
4 11024 1
3341
5
5
= −−
= −
=b 1 Write the sequence. b tn = 2 × 2n − 1
2 Identify the variables. This is in the general form for the nth term of a geometric sequence tn = ar n − 1, so a and r are shown. The value of n is known from the question.
a = 2, r = 2, n = 5
3 Substitute the values of a, r and n into the formula, then evaluate.
S2(2 1)
2 12(32 1)
162
5
5
= −−
= −
=