Embed Size (px)
Citation preview
Cisco Prime In
C H A P T E R 34
Using Wireless MapsAbout Prime Infrastructure Site MapsPrime Infrastructure site maps represent the geographical locations and physical structures where your organization maintains network assets and provides network services to its staff and guests.
Maps are a familiar way to visualize networks and services. Prime Infrastructure uses them to support many tasks, including:
• Displaying the physical locations of network devices, including wired routers, wireless access points and controllers, and client devices like laptops, tablets and mobile phones.
• Showing wireless network coverage, including “heatmap” displays of signal strength and quality, the locations of RF interferers, chokepoints, and so on.
• Diagramming the network topology.
Related Topics
• Site Map Hierarchy
• Site Map Graphics
• Network Elements on Site Maps
• Preparing Image Files for Use with Prime Infrastructure Maps
• Working With Site Maps
• Creating Campus Maps
• Associating Endpoints with a Site
Site Map Hierarchy
Prime Infrastructure maps have a predetermined hierarchy:
• Campus (or site) maps are the highest level in the map hierarchy and represent a single business location or site. Typically, a campus map will consist of at least one building, with one or more floor areas, and any outside areas adjacent to the buildings that are served by your organization’s network devices.
• Buildings represent single structures within a campus, serving to organize related floor-area maps. You can add as many buildings as you like to a single campus map. A building can have one or more floor and outside areas associated with it, but can only be added to one campus map.
34-1frastructure 3.0 Technology Package User Guide
Chapter 34 Using Wireless Maps About Prime Infrastructure Site Maps
• Floor areas map the levels within a building interior, including working areas, cubicles, walled offices, wiring closets, and the like. Floor areas can only be added to building maps. You can add up to 100 floor areas and up to 100 basement levels to each building map you create.
• Outside areas map exterior locations served by your organization’s network (usually by its wireless network). Although they are typically associated with buildings, outside areas must be added directly to campus maps, at the same level as buildings. You can add as many outside areas to a campus map as you want.
Within these restrictions, you can create as many site maps as you need, arranged as you choose.
Related Topics
• Site Map Graphics
• Network Elements on Site Maps
• Wireless Coverage Areas, Inclusion/Exclusion Regions and Rail Lines on Maps
• Working With Site Maps
Site Map Graphics
When you create your site maps, you can import them into aerial photos, map images, architectural layouts, and other graphics, specifying dimension and position information with the imported file. Prime Infrastructure scales imported map image files automatically, so that they fit the specified dimensions and position information.You can also specify contact data, civic address, and geographic longitude and latitude information for every campus and building.
Related Topics
• About Prime Infrastructure Site Maps
• Adding Floor Plans to a Standalone Building
Network Elements on Site Maps
Once you have created your maps, you can assign network elements to them. You normally do this manually, selecting individual devices and assigning them to campuses, buildings, floors and outside areas as needed. In the case of wireless access points and access controllers, you can also add them to your maps automatically, using your organization’s AP/WAC naming hierarchy.
Related Topics
• About Prime Infrastructure Site Maps
• Working With Site Maps
Wireless Coverage Areas, Inclusion/Exclusion Regions and Rail Lines on Maps
In addition to the basic site map hierarchy, Prime Infrastructure’s floor and outside area maps allow you to place the following features, which help you map wireless coverage more usefully:
34-2Cisco Prime Infrastructure 3.0 Technology Package User Guide

Chapter 34 Using Wireless Maps Preparing Image Files for Use with Prime Infrastructure Maps
• Coverage Areas: Any floor area or outside area defined as part of a building map is by default considered a wireless coverage area. Assuming that you have enabled
• Inclusion regions define areas within a floor or outside area map where wireless coverage data, such as signal strength, will be either mapped (included) or ignored (excluded). Defining inclusion and exclusion regions can helps you focus Prime Infrastructure processing to just those areas of the map where you want to manage your wireless coverage, and ignores others.
• Exclusion regions define areas within a floor or outside area map where wireless coverage data, such as signal strength, will be ignored. Defining an exclusion region can helps you focus Prime Infrastructure processing to just those areas of the map where you want to manage your wireless coverage, and ignores others.
• Rail lines act as collection points for clients who are constantly roaming within a floor or outside area map. Wireless clients within a specified distance of a rail line will be shown as connected at the rail line, rather than at their actual location. This is handy for conveyor belts, internet cafes and other areas within a floor or outside area where many wireless clients cluster while remaining mobile.
Related Topics
• About Prime Infrastructure Site Maps
• Working With Site Maps
Preparing Image Files for Use with Prime Infrastructure Maps
As explained in the topic “Site Map Concepts”, you can import image files into any Prime Infrastructure campus, building, floor or outside area map. These image files will usually show:
• For campus/site maps: An aerial view or overhead diagram of the campus, showing all of the buildings on that campus or site.
• For floors, basements, and outside areas: Architectural layout diagrams.
Follow these guidelines when preparing map image files for import:
• Create the campus/site, floor, or outside area map image using any graphics application that saves to the raster image file formats PNG, JPG, JPEG or GIF.
• For floor and outside area maps only: You can also create the images as DXF or DWG CAD files, or as Qualcomm MET files. Prime Infrastructure will automatically convert these files to your choice of PNG, JPG, JPEG or GIF file formats.
• Always ensure that the dimensions of any campus/site map image are larger than the combined dimensions of all the buildings and outside areas you plan to add to the campus map.
• Your map image files can be of any size. Prime Infrastructure imports the original image to its database at full definition, but during display, automatically resizes them to fit the workspace.
• To make it easier to browse to select image files, copy them to a location in the file system of the client you use to access Prime Infrastructure before you import them. You can delete the image files from the client once they have been imported, as Prime Infrastructure makes them part of its image database.
• Gather the horizontal and vertical dimensions of the entire site, in feet or meters, so that you can specify these dimension during import.
34-3Cisco Prime Infrastructure 3.0 Technology Package User Guide

Chapter 34 Using Wireless Maps Preparing Image Files for Use with Prime Infrastructure Maps
• If you plan on entering campus, building, floor or outside area dimensions in meters, change the default map measurement unit to meters. For details, see “Changing Default Map Measurement Units” in Related Topics.
Related Topics
• About Prime Infrastructure Site Maps
• Troubleshooting Problems With CAD Image File Imports
• Changing Default Map Measurement Units
Troubleshooting Problems With CAD Image File Imports
Prime Infrastructure uses a native image-conversion library to convert CAD and MET vector files into raster format. You must select one of the following supported target raster formats during the CAD or MET file import: PNG, JPEG or (JPG), and GIF.
If for some reason Prime Infrastructure cannot load the native image-conversion library, it will display an “unable to convert the autocad file” error message. If you receive this error, make sure all the required dependencies are met for the native library, using the Linux ldd commad. The following four DLLs must be present under the Prime Infrastructure installation directory /webnms/rfdlls: LIBGFL254.DLL, MFC71.DLL, MSVCR71.DLL, and MSVCP71.DLL. If dependency problems exist, you may need to install the required libraries and then restart the Prime Infrastructure server.
Floor and outside area map images imported from CAD files are enhanced for zooming and panning. Without zoom, the image clarity will be close to that of the original CAD file. But an imported CAD file can appear blurred during zoom. If you are having problems with blurred floor map images, first make sure all relevant parts of the image are clearly visible in the original CAD file. Then import the CAD file again, and choose PNG or GIF as the target conversion file format, instead of JPEG or JPG.
Large floor map images can take time to import. While the conversion is going on, not all of the image will be visible on the map. For example, if you have a high-resolution image (e.g., an image with a resolution of 180 megapixels and a file size of 60 MB), it may take two minutes or more for the imported image to appear on the map.
Related Topics
• Adding Floor Plans to a Standalone Building
• Administrator Guide restart link
Default Campus Maps
Prime Infrastructure comes with two default campus maps:
• System Campus: This is the default campus map. If you create any building, floor or outside area map, but do not create your own campus map, these subordinate maps are automatically created as children of the System Campus map.
• Unassigned: This is the default map for all network endpoints and hosts not assigned to any other map (including the System Campus).
Related Topics
• Adding Floor Plans to a Standalone Building
34-4Cisco Prime Infrastructure 3.0 Technology Package User Guide
Chapter 34 Using Wireless Maps Working With Site Maps
Disabling Next Generation Maps
Starting with version 2.0, Prime Infrastructure introduced Next Generation maps. These maps offer better performance and larger, more detailed map information than in previous versions of the product. Next Generation maps are enabled by default.
Step 1 Select Settings > My Preferences.
Step 2 Click the Use Next Generation Maps checkbox to unselect it.
Step 3 Click Save.
Related Topics
• Adding Floor Plans to a Standalone Building
Working With Site MapsYou can choose to organize your site maps any way you wish. The workflow you will follow is similar:
1. Create a new campus map. Choose Maps > Site Maps, then from the Select a command list, choose New Campus.
2. Add a building to the campus map. Choose Maps > Site Maps, then from the Select a command list, choose New Building.
3. Add a floor to the building map. Choose Maps > Site Maps, then Select a command > New Floor Area > Go.
4. Add an outside area to the campus map. Choose Maps > Site Maps, then Select a command > New Outside Area > Go.
5. Use Map Editor to draw inclusion/exclusion regions and rail lines on your floor and outside areas. Choose Maps > Site Maps, select the floor or outside area, then choose Map Editor.
Related Topics
• Adding Floor Plans to a Standalone Building
• Adding Floor Areas to Buildings
• Adding Floor Plans to a Standalone Building
• Configuring Floor Settings
• Import Map and AP Location Data
• Placing Access Points
Creating Campus MapsYou must enter a unique name for the campus when you create it. Optionally, you can also:
• Specify an email, telephone, or other contact to be used for inquiries about the campus.
• Import a map image file into the campus map.
34-5Cisco Prime Infrastructure 3.0 Technology Package User Guide

Chapter 34 Using Wireless Maps Adding Image Files to Campus Maps
• Specify location information for the campus, including its mailing or street address and its longitude and latitude.
Once you have created a campus map, you will want to make it more useful by:
• Adding an image file showing an overview of the campus site.
• Add location information for the campus.
• Adding buildings to the campus.
For details on these tasks, see Related Topics.
Step 1 Choose Maps > Site Maps.
Step 2 Choose Select a command > New Campus > Go.
Step 3 On the Maps > New Campus page, enter the campus name and (optionally) a campus contact name.
Step 4 Click OK to add the campus map. Prime Infrastructure adds a hyperlink to the campus map in the Map Tree View.
Related Topics
• Adding Floor Plans to a Standalone Building
• Adding Image Files to Campus Maps
• Adding Location Information to Campus Maps
• Adding Buildings to Campus Maps
• Changing Default Map Measurement Units
Adding Image Files to Campus MapsImporting a map image file into the background of a campus map helps you visualize and recognize the campus and its layout. When added with accurate location and dimension data, it also serves to locate your buildings and devices exactly.
To import a map image file into a previously created campus map, follow the steps below. Note that you can also import map image files when creating a campus map, by clicking Image File and specifying the campus map image file you want to import.
Before you begin, be sure you have prepared your campus map image as explained in “Preparing Image Files for User With Prime Infrastructure Maps”.
Step 1 Choose Maps > Site Maps.
Step 2 Click the name of the campus map to which you want to import the image file. The Site Maps > Campus Name page appears.
Step 3 From the Select a command list, choose Edit Campus/Site and click Go.
Step 4 Next to Image File Name, click Choose File.
Step 5 Browse to and choose the file containing the campus map image, then click Open.
Step 6 Click Next.
Step 7 Select the Maintain Aspect Ratio check box.
34-6Cisco Prime Infrastructure 3.0 Technology Package User Guide
Chapter 34 Using Wireless Maps Adding Location Information to Campus Maps
Selecting this setting prevents distortion when Prime Infrastructure resizes the imported map image.
Step 8 Enter the campus site’s horizontal and vertical dimensions, in feet or meters.
Step 9 Click OK. Prime Infrastructure displays the Campus/Site View page for the selected campus map, with the image file in the background.
Related Topics
• Adding Floor Plans to a Standalone Building
• Creating Campus Maps
• Adding Location Information to Campus Maps
Adding Location Information to Campus MapsLocation information for a campus map includes the site’s mailing or street address and its geographical longitude and latitude. Adding this information is optional.
Step 1 Choose Maps > Site Maps.
Step 2 Click the name of the desired campus map. The Site Maps > Campus Name page appears.
Step 3 From the Select a command list, choose Edit Campus/Site and click Go.
Step 4 Click Next.
Step 5 Enter the site’s address and longitude/latitude information.
Step 6 Click OK. Prime Infrastructure displays the Campus/Site View page for the selected campus map.
Related Topics
• Creating Campus Maps
• Adding Image Files to Campus Maps
Changing Default Map Measurement Units The default unit of measurement for all Prime Infrastructure maps is feet. You can change this to meters.
Step 1 Choose Maps > Site Maps.
Step 2 From the Select a command list, choose Properties and click Go.
Step 3 In Units of Measure, select the unit you want to use as the default unit (feet or meters) for all maps.
Step 4 Click OK.
Related Topics
• Creating Campus Maps
34-7Cisco Prime Infrastructure 3.0 Technology Package User Guide
Chapter 34 Using Wireless Maps Adding Buildings to Campus Maps
• Adding Image Files to Campus Maps
Adding Buildings to Campus MapsYou can only add buildings to a campus map. If you do not add them to a campus map you created, Prime Infrastructure adds them to the default System Campus map automatically.
You must specify a unique name for the building. To create a useful building map, you will also want to specify:
• An email or telephone contact for the building.
• The number of floors and basements in the building.
a. The building’s horizontal and vertical position on the campus map. The building’s horizontal position is the distance from the corner of the building rectangle to the left edge of the campus map. The vertical position is the distance from the corner of the building rectangle to the top edge of the campus map. You can enter these dimensions in feet or meters.
b. The building’s approximate span — its horizontal and vertical “footprint”, or width and depth on the map — in feet or meters. The footprint you specify for the building should be equal to or larger than the span of any floors you plan to add to the same building.
• Location information for the building, including its mailing or street address and its geographical longitude and latitude.
Once you have created a building map, you will want to make it more useful by adding floor, basement and outdoor areas. For details on these tasks, see Related Topics.
Step 1 Choose Maps > Site Maps
Step 2 Click the name of the campus to which you want to add the building. The Site Maps > Campus Name page appears.
Step 3 Choose Select a command > New Building > Go.
Step 4 Complete the fields on the Campus Name > New Building page as needed. As you do so, be aware that:
• You must enter a name for the building. The name must be unique among the other building names you plan to add to the same campus map.
• Although you can specify the building’s exact position and span using the input fields, you can also specify its position and span using the mouse and keyboard:
– For Position changes: Click and drag the blue bounding box in the upper left corner of the campus map to the desired position. As you drag, the values in the Horizontal Position and Vertical Position fields change to match your actions.
– For Span changes: Ctrl+click and drag the blue bounding box to change the building’s span. As you drag, the values in the Horizontal Span and Vertical Span fields change to match your actions.
Step 5 When you are satisfied, click Place to put the building on the campus map. Prime Infrastructure creates a building rectangle scaled and positioned as you specified.
Step 6 Click Save to save the building. Prime Infrastructure places the building on the campus map, and the Site Maps Tree View displays a hyperlink for the building.
34-8Cisco Prime Infrastructure 3.0 Technology Package User Guide

Chapter 34 Using Wireless Maps Adding Floor Areas to Buildings
Related Topics
• Adding Floor Plans to a Standalone Building
• Creating Campus Maps
• Default Campus Maps
• Adding Location Information to Campus Maps
• Adding Image Files to Campus Maps
• Adding Floor Areas to Buildings
Moving Buildings and Floors to Another Campus
You can move any building from one campus to another without having to recreate it. Any floor areas you have created for the building will move with it. The destination campus must already exist before you attempt to move a building to it.
Step 1 Choose Maps > Site Maps.
Step 2 Click the selection box next to the name of each building you want to move to another campus.
Step 3 From the Select a command list, choose Move Buildings and click Go.
Step 4 In the Target Campus/Site list, choose the name of the campus map to which you want to move the selected buildings.
Step 5 Click OK.
On the Results page, click the Edit Building link to reposition the moved buildings on the new campus.
Related Topics
• Creating Campus Maps
• Adding Buildings to Campus Maps
• Adding Image Files to Campus Maps
Adding Floor Areas to BuildingsYou can add floor and basement areas to any building you have added to a campus map. When doing so, bear in mind that:
• You can only add floor and basement areas to building maps.
• You can only add floor and basement areas up to the number of floors and basements you specified when you added the building to the campus map. If you made a mistake with these, you will need to edit the building map first.
When creating the floor area, you must specify at least the following:
• The floor area name. The floor name is distinct from the floor number, and must be unique not only to the building, but across all buildings on your campus maps.
• The floor number, which you can pick from a list.
To create a useful floor or basement area, you will also want to specify:
34-9Cisco Prime Infrastructure 3.0 Technology Package User Guide

Chapter 34 Using Wireless Maps Adding Floor Areas to Buildings
• An email or telephone contact for the floor or basement area.
• The RF model for the floor or basement (for example: “Drywall”). The model selected is used to calculate wireless signal strength, heat maps, and other wireless-related features for the floor or basement area.
• The floor-to-floor height, in meters or feet.
• The floor’s approximate span — its horizontal and vertical “footprint”, or width and depth on the map — in feet or meters. The footprint you specify for the floor should be equal to or less than the span of the building containing the floor.
c. The floor’s horizontal and vertical position, or coordinates, within the campus. The floor’s horizontal position is the distance from the top left corner of the floor area rectangle to the left edge of the campus map. The floor’s vertical position is the distance from the top left corner of the floor area rectangle to the top edge of the campus map.
• The total floor area, in square meters or feet.
Step 1 Choose Maps > Site Maps.
Step 2 In the Maps Tree view, click the name of the campus containing the building to which you want to add a floor area.
Step 3 Click the building name to display the building map.
Step 4 Choose Select a command > New Floor Area > Go. The New Floor Area page appears.
Step 5 Complete the New Floor Area fields as needed.
Step 6 In the New Floor Area page, follow these steps to add floors to a building in which to organize related floor plan maps:
d. Select the Image or CAD File check box.
e. Browse to and choose the desired floor or basement image or CAD filename, and click Open.
If you are importing a CAD file, use the Convert CAD File drop-down list to determine the image file for conversion.
We do not recommend a .JPEG (.JPG) format for an auto-cad conversion. Unless a JPEG is specifically required, use .PNG or .GIF format for higher quality images.
f. Click Next. At this point, if a CAD file was specified, a default image preview is generated and loaded.
Prime Infrastructure uses a native image conversion library to convert auto-cad files into raster formats like .PNG. When there are issues loading the native library, Prime Infrastructure displays the following error: “Unable to convert the auto-cad file. Reason: Error while loading the auto-cad image conversion library.” For more information see the Prime Infrastructure online help or Prime Infrastructure documentation.
The names of the CAD file layers are listed with check boxes to the right side of the image indicating which are enabled.
When you choose the floor or basement image filename, Prime Infrastructure displays the image in the building-sized grid.
g. If you have CAD file layers, you can select or deselect as many as you want and click Preview to view an updated image. Click Next when you are ready to proceed with the selected layers.
Enter the remaining parameters for the floor area.
h. Either leave the Maintain Aspect Ratio check box selected to preserve the original image aspect ratio or unselect the check box to change the image aspect ratio.
34-10Cisco Prime Infrastructure 3.0 Technology Package User Guide
Chapter 34 Using Wireless Maps Adding Image Files to Floor Areas
i. If applicable, enter the horizontal position (distance from the corner of the outdoor area rectangle to the left edge of the campus map) and vertical position (distance from the corner of the outdoor area rectangle to the top edge of the campus map) in feet or meters.
Use Ctrl-click to resize the image within the building-sized grid.
j. If desired, select the Launch Map Editor after floor creation check box to rescale the floor and draw walls.
k. Click OK to save this floor plan to the database. The floor is added to the Maps Tree View and the Maps > Site Maps list.
Use different floor names in each building. If you are adding more than one building to the campus map, do not use a floor name that exists in another building. This overlap causes incorrect mapping information between a floor and a building.
Step 7 Click any of the floor or basement images to view the floor plan or basement map.
You can zoom in or out to view the map at different sizes and you can add access points.
Adding Image Files to Floor AreasTo import a floor plan image file into a previously created floor area map, follow the steps below. Note that you can also import map image files when creating a floor area map, by clicking Image File and specifying the floor plan image file you want to import.
Before you begin, be sure you have prepared your floor area image as explained in “Preparing Image Files for User With Prime Infrastructure Maps”.
Step 1 Choose Maps > Site Maps.
Step 2 Click the name of the campus map containing the building in which the floor area exists. The Site Maps > Campus Name page appears.
Step 3 Click the name of the building containing the floor area to which you want to import the image file. The Site Maps > Building page appears.
Step 4 Choose Select a command > Edit Floor > Go.
Step 5 Next to Image File Name, click Choose File.
Step 6 Browse to and choose the file containing the floor area image, then click Open.
Step 7 Click Next.
Step 8 Select the Maintain Aspect Ratio check box.
Selecting this setting prevents distortion when Prime Infrastructure resizes the imported image.
Step 9 Enter the floor area’s horizontal and vertical dimensions, in feet or meters.
Step 10 Click OK. Prime Infrastructure displays the View page for the selected floor area, with the image file in the background.
Related Topics
• Adding Floor Plans to a Standalone Building
• Creating Campus Maps
34-11Cisco Prime Infrastructure 3.0 Technology Package User Guide

Chapter 34 Using Wireless Maps Adding Image Files to Floor Areas
• Adding Location Information to Campus Maps
Adding Floor Plans to a Standalone Building
After you have added a standalone building to the Prime Infrastructure database, you can add individual floor plan maps to the building.
To add floor plans to a standalone building, follow these steps:
Step 1 Save your floor plan maps in .PNG, .JPG, or .GIF format.
The maps can be any size because the Prime Infrastructure automatically resizes the maps to fit the workspace.
Step 2 Browse to and import the floor plan maps from anywhere in your file system. You can import CAD files in DXF or DWG formats or any of the formats you created in Step 1.
If there are problems converting the auto-cad file, an error message is displayed. Prime Infrastructure uses a native image conversion library to convert auto-cad files into raster formats like .PNG. If the native library cannot be loaded, the Prime Infrastructure displays an “unable to convert the auto-cad file” message. If you receive this error, make sure all the required dependencies are met for the native library. To find any dependency problems, use ldd on Linux platforms. The following DLLs must be present under the /webnms/rfdlls Prime Infrastructure installation directory: LIBGFL254.DLL, MFC71.DLL, MSVCR71.DLL, and MSVCP71.DLL. If dependency problems occur, you might need to install the required libraries and restart Prime Infrastructure.
Step 3 Choose Maps > Site Maps.
Step 4 From the Maps Tree View or the Maps > Site Maps left sidebar menu, choose the desired building to display the Building View page.
Step 5 From the Select a command drop-down list, choose New Floor Area.
Step 6 Click Go.
Step 7 In the New Floor Area page, add the following information:
• Enter the floor area and contact names.
• Choose the floor or basement number from the Floor drop-down list.
• Choose the floor or basement type (RF Model).
• Enter the floor-to-floor height in feet.
• Select the Image or CAD File check box.
• Browse to and choose the desired floor or basement Image or CAD file, and click Open.
Note If you are importing a CAD file, use the Convert CAD File drop-down list to determine the image file for conversion.
Tip A .JPEG (.JPG) format is not recommended for an auto-cad conversion. Unless a .JPEG is specifically required, use a .PNG or .GIF format for higher quality images.
Step 8 Click Next. At this point, if a CAD file was specified, a default image preview is generated and loaded.
34-12Cisco Prime Infrastructure 3.0 Technology Package User Guide

Chapter 34 Using Wireless Maps Adding Image Files to Floor Areas
Note Prime Infrastructure uses a native image conversion library to convert auto-cad files into raster formats like .PNG. When there are issues loading the native library, Prime Infrastructure displays the following error: “Unable to convert the auto-cad file. Reason: Error while loading the auto-cad image conversion library. For more information, see the Prime Infrastructure online help or Prime Infrastructure documentation.”
The names of the CAD file layers are listed with check boxes to the right side of the image indicating which are enabled.
When you choose the floor or basement image filename, Prime Infrastructure displays the image in the building-sized grid.
The maps can be any size because Prime Infrastructure automatically resizes the maps to fit the workspace.
Note The map must be saved in .PNG, .JPG, .JPEG, or .GIF format.
If you have CAD file layers, you can select or deselect as many as you want and click Preview to view an updated image. Click Next when you are ready to proceed with the selected layers.
Step 9 Enter the remaining parameters for the floor area.
• Either leave the Maintain Aspect Ratio check box selected to preserve the original image aspect ratio or unselect the check box to change the image aspect ratio.
• Enter an approximate floor or basement horizontal and vertical span (width and depth on the map) in feet.
The horizontal and vertical spans should be smaller than or the same size as the building horizontal and vertical spans in the Prime Infrastructure database.
• If applicable, enter the horizontal position (distance from the corner of the outdoor area rectangle to the left edge of the campus map) and vertical position (distance from the corner of the outdoor area rectangle to the top edge of the campus map) in feet or meters.
Tip Use Ctrl-click to resize the image within the building-sized grid.
• Adjust the floor characteristics with the Prime Infrastructure map editor by selecting the check box next to Launch Map Editor. See the Using the Map Editor for more information regarding the map editor feature.
Step 10 Click OK to save this floor plan to the database. The floor is added to the Maps Tree View and the Maps > Site Maps list.
Step 11 Click any of the floor or basement images to view the floor plan or basement map.
You can zoom in or out to view the map at different sizes and you can add access points.
Configuring Floor Settings
You can modify the appearance of the floor map by selecting or unselecting various floor settings check boxes. The selected floor settings appears in the map image.
34-13Cisco Prime Infrastructure 3.0 Technology Package User Guide

Chapter 34 Using Wireless Maps Adding Image Files to Floor Areas
The Floor Settings options include the following:
• Access Points
• AP Heatmaps
• AP Mesh Info
• Clients
• 802.11 Tags
• Rogue APs
• Rogue Adhocs
• Rogue Clients
• Coverage Areas
• Location Regions
• Rails
• Markers
• Chokepoints
• Wi-Fi TDOA Receivers
• Interferers
Use the blue arrows to access floor setting filters for access points, access point heatmaps, clients, 802.11 tags, rogue access points, rogue adhocs, and rogue clients. When filtering options are selected, click OK.
Use the Show MSE data within last drop-down list to choose the timeframe for mobility services engine data. Choose to view mobility services engine data from a range including the past two minutes up to the past 24 hours. This option only appears if a mobility services engine is present on Prime Infrastructure.
Click Save Settings to make the current view and filter settings your new default for all maps.
Defining Inclusion and Exclusion Regions on a Floor
To further refine location calculations on a floor, you can define the areas that are included (inclusion areas) in the calculations and those areas that are not included (exclusion areas).
For example, you might want to exclude areas such as an atrium or stairwell within a building but include a work area (such as cubicles, labs, or manufacturing floors).
Note If the MSE to which the floor is synchronized is running the Aeroscout tag engine, then inclusion and exclusion regions are not calculated for tags.
34-14Cisco Prime Infrastructure 3.0 Technology Package User Guide
Chapter 34 Using Wireless Maps Adding Image Files to Floor Areas
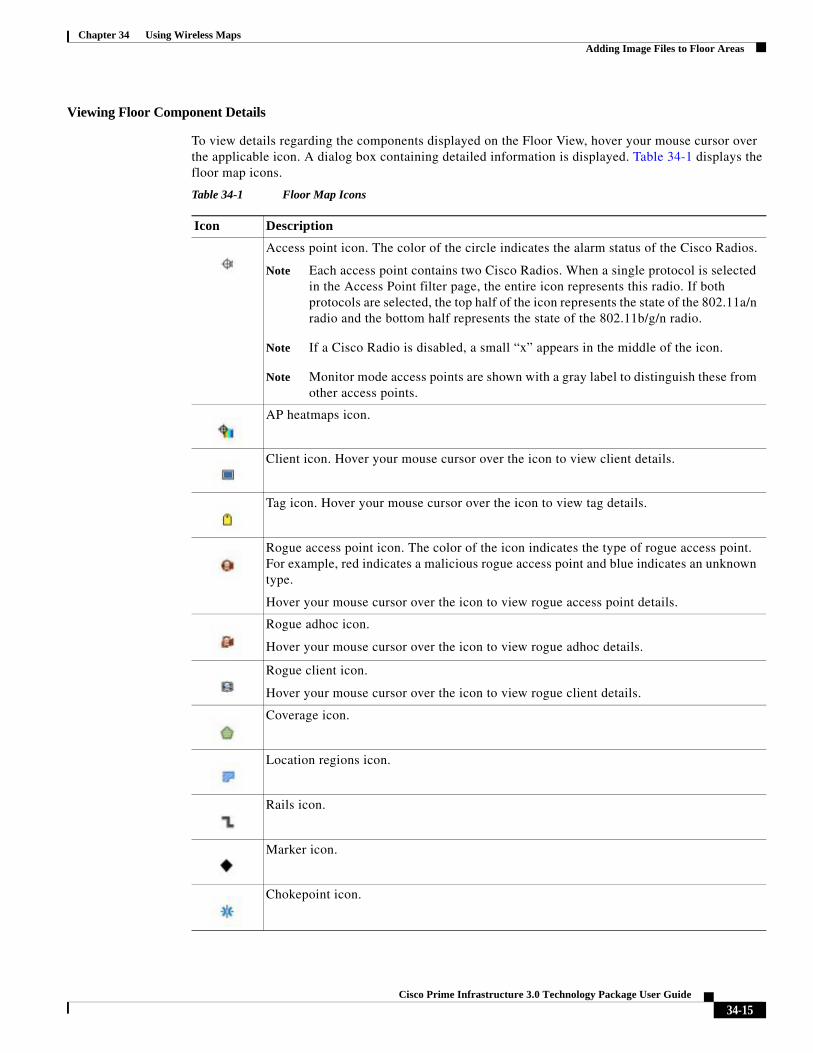
Viewing Floor Component Details
To view details regarding the components displayed on the Floor View, hover your mouse cursor over the applicable icon. A dialog box containing detailed information is displayed. Table 34-1 displays the floor map icons.
Table 34-1 Floor Map Icons
Icon Description
Access point icon. The color of the circle indicates the alarm status of the Cisco Radios.
Note Each access point contains two Cisco Radios. When a single protocol is selected in the Access Point filter page, the entire icon represents this radio. If both protocols are selected, the top half of the icon represents the state of the 802.11a/n radio and the bottom half represents the state of the 802.11b/g/n radio.
Note If a Cisco Radio is disabled, a small “x” appears in the middle of the icon.
Note Monitor mode access points are shown with a gray label to distinguish these from other access points.
AP heatmaps icon.
Client icon. Hover your mouse cursor over the icon to view client details.
Tag icon. Hover your mouse cursor over the icon to view tag details.
Rogue access point icon. The color of the icon indicates the type of rogue access point. For example, red indicates a malicious rogue access point and blue indicates an unknown type.
Hover your mouse cursor over the icon to view rogue access point details.
Rogue adhoc icon.
Hover your mouse cursor over the icon to view rogue adhoc details.
Rogue client icon.
Hover your mouse cursor over the icon to view rogue client details.
Coverage icon.
Location regions icon.
Rails icon.
Marker icon.
Chokepoint icon.
34-15Cisco Prime Infrastructure 3.0 Technology Package User Guide
Chapter 34 Using Wireless Maps Adding Image Files to Floor Areas
Cisco 1000 Series Lightweight Access Point Icons
The icons indicate the present status of an access point. The circular part of the icon can be split in half horizontally. The more severe of the two Cisco Radio colors determines the color of the large triangular pointer.
Note When the icon is representing 802.11a/n and 802.11b/n, the top half displays the 802.11a/n status, and the bottom half displays the 802.11b/g/n status. When the icon is representing only 802.11b/g/n, the whole icon displays the 802.11b/g/n status. The triangle indicates the more severe color.
Table 34-2 shows the icons used in the Prime Infrastructure user interface Map displays.
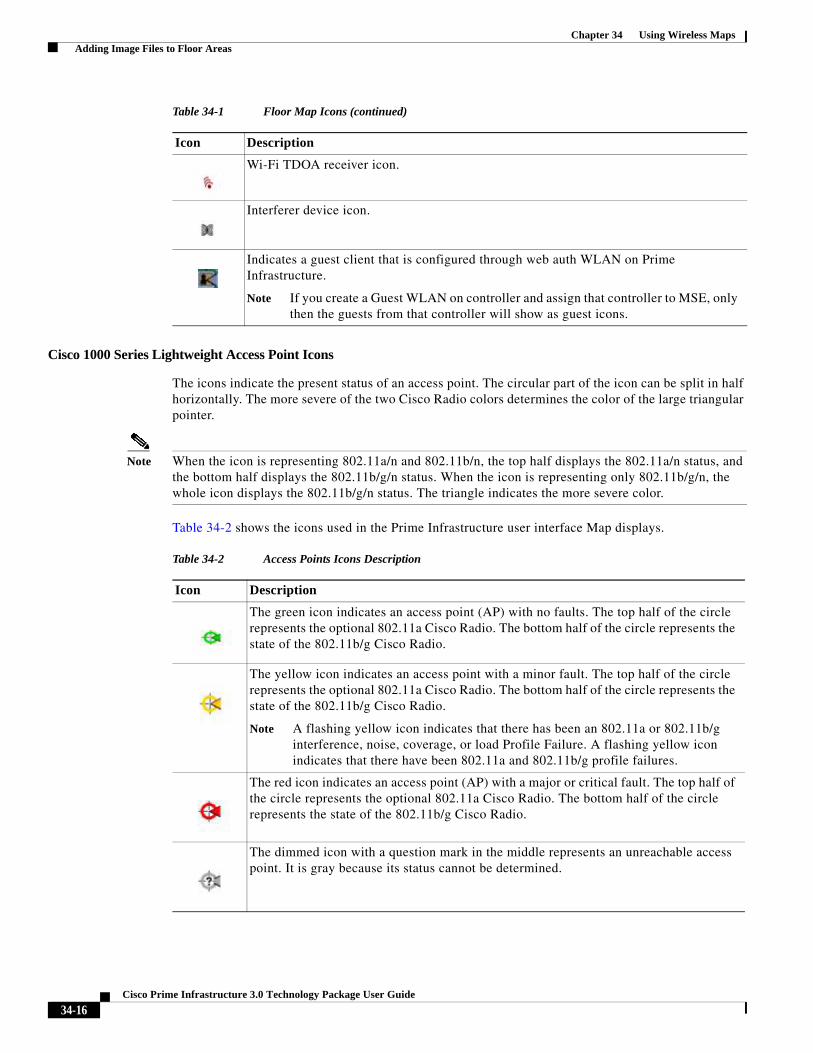
Wi-Fi TDOA receiver icon.
Interferer device icon.
Indicates a guest client that is configured through web auth WLAN on Prime Infrastructure.
Note If you create a Guest WLAN on controller and assign that controller to MSE, only then the guests from that controller will show as guest icons.
Table 34-1 Floor Map Icons (continued)
Icon Description
Table 34-2 Access Points Icons Description
Icon Description
The green icon indicates an access point (AP) with no faults. The top half of the circle represents the optional 802.11a Cisco Radio. The bottom half of the circle represents the state of the 802.11b/g Cisco Radio.
The yellow icon indicates an access point with a minor fault. The top half of the circle represents the optional 802.11a Cisco Radio. The bottom half of the circle represents the state of the 802.11b/g Cisco Radio.
Note A flashing yellow icon indicates that there has been an 802.11a or 802.11b/g interference, noise, coverage, or load Profile Failure. A flashing yellow icon indicates that there have been 802.11a and 802.11b/g profile failures.
The red icon indicates an access point (AP) with a major or critical fault. The top half of the circle represents the optional 802.11a Cisco Radio. The bottom half of the circle represents the state of the 802.11b/g Cisco Radio.
The dimmed icon with a question mark in the middle represents an unreachable access point. It is gray because its status cannot be determined.
34-16Cisco Prime Infrastructure 3.0 Technology Package User Guide
Chapter 34 Using Wireless Maps Adding Image Files to Floor Areas
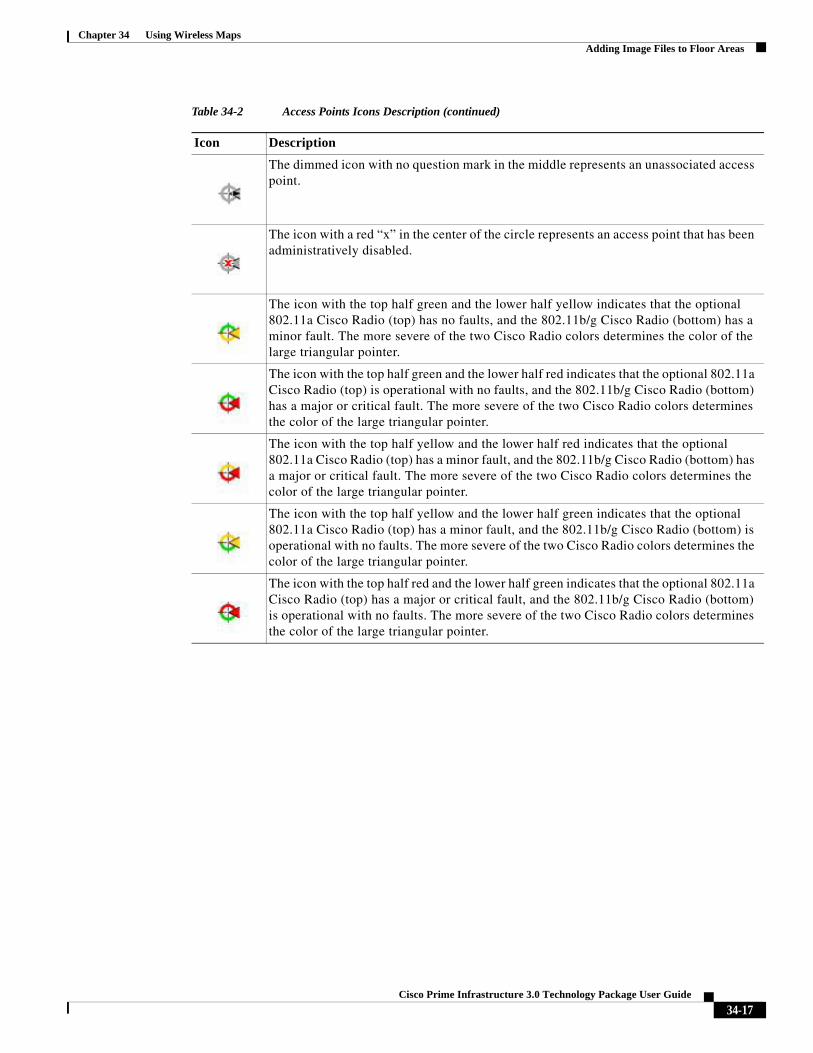
The dimmed icon with no question mark in the middle represents an unassociated access point.
The icon with a red “x” in the center of the circle represents an access point that has been administratively disabled.
The icon with the top half green and the lower half yellow indicates that the optional 802.11a Cisco Radio (top) has no faults, and the 802.11b/g Cisco Radio (bottom) has a minor fault. The more severe of the two Cisco Radio colors determines the color of the large triangular pointer.
The icon with the top half green and the lower half red indicates that the optional 802.11a Cisco Radio (top) is operational with no faults, and the 802.11b/g Cisco Radio (bottom) has a major or critical fault. The more severe of the two Cisco Radio colors determines the color of the large triangular pointer.
The icon with the top half yellow and the lower half red indicates that the optional 802.11a Cisco Radio (top) has a minor fault, and the 802.11b/g Cisco Radio (bottom) has a major or critical fault. The more severe of the two Cisco Radio colors determines the color of the large triangular pointer.
The icon with the top half yellow and the lower half green indicates that the optional 802.11a Cisco Radio (top) has a minor fault, and the 802.11b/g Cisco Radio (bottom) is operational with no faults. The more severe of the two Cisco Radio colors determines the color of the large triangular pointer.
The icon with the top half red and the lower half green indicates that the optional 802.11a Cisco Radio (top) has a major or critical fault, and the 802.11b/g Cisco Radio (bottom) is operational with no faults. The more severe of the two Cisco Radio colors determines the color of the large triangular pointer.
Table 34-2 Access Points Icons Description (continued)
Icon Description
34-17Cisco Prime Infrastructure 3.0 Technology Package User Guide
Chapter 34 Using Wireless Maps Adding Image Files to Floor Areas
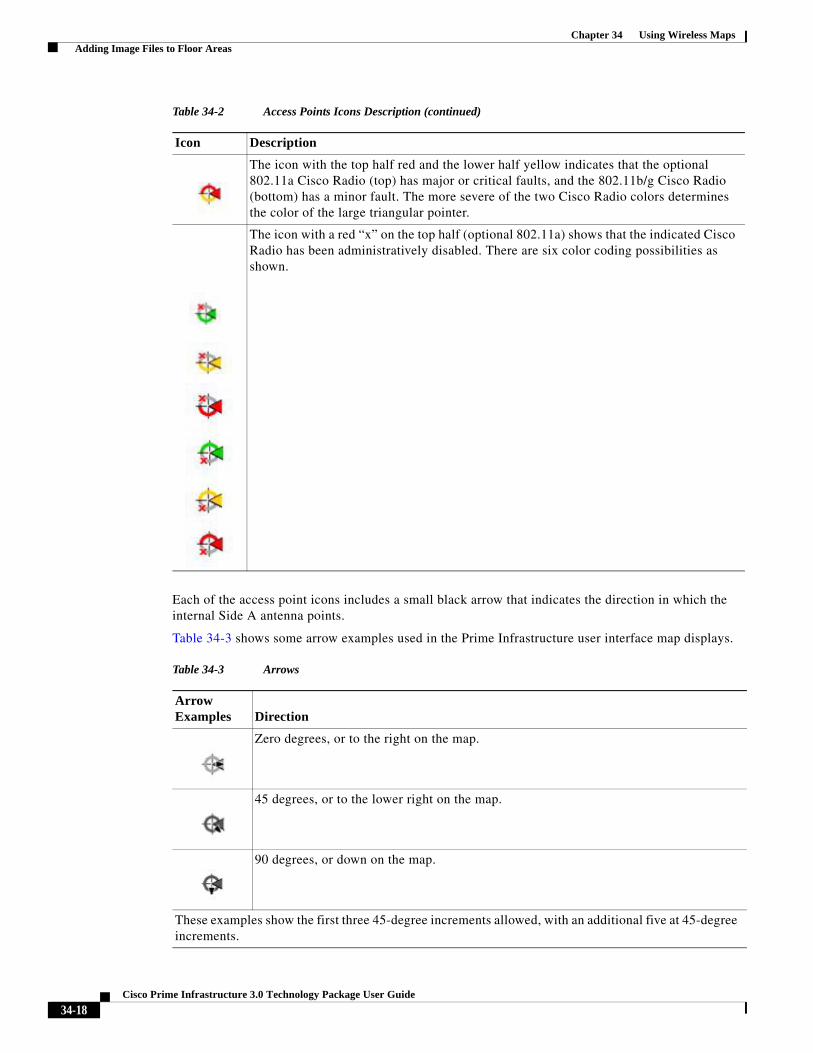
Each of the access point icons includes a small black arrow that indicates the direction in which the internal Side A antenna points.
Table 34-3 shows some arrow examples used in the Prime Infrastructure user interface map displays.
The icon with the top half red and the lower half yellow indicates that the optional 802.11a Cisco Radio (top) has major or critical faults, and the 802.11b/g Cisco Radio (bottom) has a minor fault. The more severe of the two Cisco Radio colors determines the color of the large triangular pointer.
The icon with a red “x” on the top half (optional 802.11a) shows that the indicated Cisco Radio has been administratively disabled. There are six color coding possibilities as shown.
Table 34-2 Access Points Icons Description (continued)
Icon Description
Table 34-3 Arrows
Arrow Examples Direction
Zero degrees, or to the right on the map.
45 degrees, or to the lower right on the map.
90 degrees, or down on the map.
These examples show the first three 45-degree increments allowed, with an additional five at 45-degree increments.
34-18Cisco Prime Infrastructure 3.0 Technology Package User Guide

Chapter 34 Using Wireless Maps Adding Image Files to Floor Areas
Filtering Access Point Floor Settings
If you enable the access point floor setting and then click the blue arrow to the right of the floor settings, the Access Point Filter dialog box appears with filtering options.
Access point filtering options include the following:
• Show—Select this radio button to display the radio status or the access point status.
Note Because the access point icon color is based on the access point status, the icon color might vary depending on the status selected. The default on floor maps is radio status.
• Protocol—From the drop-down list, choose which radio types to display (802.11a/n, 802.11b/g/n, or both).
The displayed heatmaps correspond to the selected radio type(s).
• Display—From the drop-down list, choose what identifying information is displayed for the access points on the map image.
– Channels—Displays the Cisco Radio channel number or Unavailable (if the access point is not connected).
– TX Power Level—Displays the current Cisco Radio transmit power level (with 1 being high) or Unavailable (if the access point is not connected).
The power levels differ depending on the type of access point. The 1000 series access points accept a value between 1 and 5, the 1230 access points accept a value between 1 and 7, and the 1240 and 1100 series access points accept a value between 1 and 8.
Table 34-4 lists the transmit power level numbers and their corresponding power setting.
Note The power levels are defined by the country code setting and are regulated by country. See the following URL for more information:http://www.cisco.com/en/US/prod/collateral/wireless/ps5679/ps5861/product_data_sheet0900aecd80537b6a_ps430_Products_Data_Sheet.html
– Channel and Tx Power—Displays both the channel and transmit power level (or Unavailable if the access point is not connected).
– Coverage Holes—Displays a percentage of clients whose signal has become weaker until the client lost its connection, Unavailable for unconnected access points, or MonitorOnly for access points in monitor-only mode.
Table 34-4 Transmit Power Level Values
Transmit PowerLevel Number Power Setting
1 Maximum power allowed per country code setting
2 50% power
3 25% power
4 12.5 to 6.25% power
5 6.25 to 0.195% power
34-19Cisco Prime Infrastructure 3.0 Technology Package User Guide
Chapter 34 Using Wireless Maps Adding Image Files to Floor Areas
Note Coverage holes are areas in which clients cannot receive a signal from the wireless network. When you deploy a wireless network, you must consider the cost of the initial network deployment and the percentage of coverage hole areas. A reasonable coverage hole criterion for launch is between 2 and 10 percent. This means that between two and ten test locations out of 100 random test locations might receive marginal service. After launch, Cisco Unified Wireless Network Solution Radio Resource Management (RRM) identifies these coverage hole areas and reports them to the IT manager, who can fill holes based on user demand.
– MAC Addresses—Displays the MAC address of the access point, whether or not the access point is associated to a controller.
– Names—Displays the access point name. This is the default value.
– Controller IP—Displays the IP address of the controller to which the access point is associated or Not Associated for disassociated access points.
– Utilization—Displays the percentage of bandwidth used by the associated client devices (including receiving, transmitting, and channel utilization). Displays Unavailable for disassociated access points and MonitorOnly for access points in monitor-only mode.
– Profiles—Displays the load, noise, interference, and coverage components of the corresponding operator-defined thresholds. Displays Okay for thresholds not exceeded, Issue for exceeded thresholds, or Unavailable for unconnected access points.
Use the Profile Type drop-down list to choose Load, Noise, Interference, or Coverage.
– CleanAir Status—Displays the CleanAir status of the access point and whether or not CleanAir is enabled on the access point.
– Average Air Quality—Displays the average air quality on this access point. The details include the band and the average air quality.
– Minimum Air Quality—Displays the minimum air quality on this access point. The details include the band and the minimum air quality.
– Average and Minimum Air Quality—Displays the average and minimum air quality on this access point. The details include the band, average air quality, and minimum air quality.
– Associated Clients—Displays the number of associated clients, Unavailable for unconnected access points or MonitorOnly for access points in monitor-only mode.
– Bridge Group Names
• RSSI Cutoff—From the drop-down list, choose the RSSI cutoff level. The RSSI cutoff ranges from -60 dBm to -90 dBm.
• Show Detected Interferers—Select the check box to display all interferers detected by the access point.
• Max. Interferers/label—Choose the maximum number of interferers to be displayed per label from the drop-down list.
Click OK when all applicable filtering criteria are selected.
Filtering Access Point Heatmap Floor Settings
An RF heatmap is a graphical representation of RF wireless data where the values taken by variables are represented in maps as colors. The current heatmap is computed based on the RSSI prediction model, Antenna Orientation, and AP transmit power.
34-20Cisco Prime Infrastructure 3.0 Technology Package User Guide

Chapter 34 Using Wireless Maps Adding Image Files to Floor Areas
If you enable the Access Point Heatmap floor setting and click the blue arrow to the right of the Floor Settings, the Contributing APs dialog appears with heatmap filtering options.
Prime Infrastructure introduces dynamic heatmaps. When dynamic heatmaps are enabled, the Prime Infrastructure recomputes the heatmaps to represent changed RSSI values.
Access point heatmap filtering options include the following:
• Heatmap Type—Select Coverage, or Air Quality. If you choose Air Quality, you can further filter the heat map type for access points with average air quality or minimum air quality. Select the appropriate radio button.
If you have monitor mode access points on the floor plan, you have a choice between IDS or coverage heatmap types. A coverage heatmap excludes monitor mode access points.
Note Only APs in Local, FlexConnect, or Bridge mode can contribute to the Coverage and Air Quality Heatmap.
• Total APs—Displays the number of access points positioned on the map.
• Select the access point check box(es) to determine which heatmaps are displayed on the image map.
Click OK when all applicable filtering criteria are selected.
Filtering AP Mesh Info Floor Settings
The AP Mesh Info check box only appears when bridging access points are added to the floor.
When this check box is selected, Prime Infrastructure initiates a contact with the controllers and displays information about bridging access points. The following information is displayed:
– Link between the child and the parent access point.
– An arrow that indicates the direction from the child to parent access point.
– A color-coded link that indicates the signal-to-noise ratio (SNR). A green link represents a high SNR (above 25 dB), an amber link represents an acceptable SNR (20-25 dB), and a red link represents a very low SNR (below 20 dB).
If you enable the AP Mesh Info floor setting and click the blue arrow to the right of the floor settings, the Mesh Parent-Child Hierarchical View page appears with mesh filtering options.
You can update the map view by choosing the access points you want to see on the map. From the Quick Selections drop-down list, choose to select only root access point, various hops between the first and the fourth, or select all access points.
Note For a child access point to be visible, its parent must also be selected.
Click OK when all applicable filtering criteria are selected.
Filtering Client Floor Settings
The Clients option only appears if a mobility server is added in Prime Infrastructure.
If you enable the Clients floor setting and click the blue arrow to the right, the Client Filter dialog box appears.
Client filtering options include the following:
• Show All Clients—Select the check box to display all clients on the map.
34-21Cisco Prime Infrastructure 3.0 Technology Package User Guide
Chapter 34 Using Wireless Maps Adding Image Files to Floor Areas
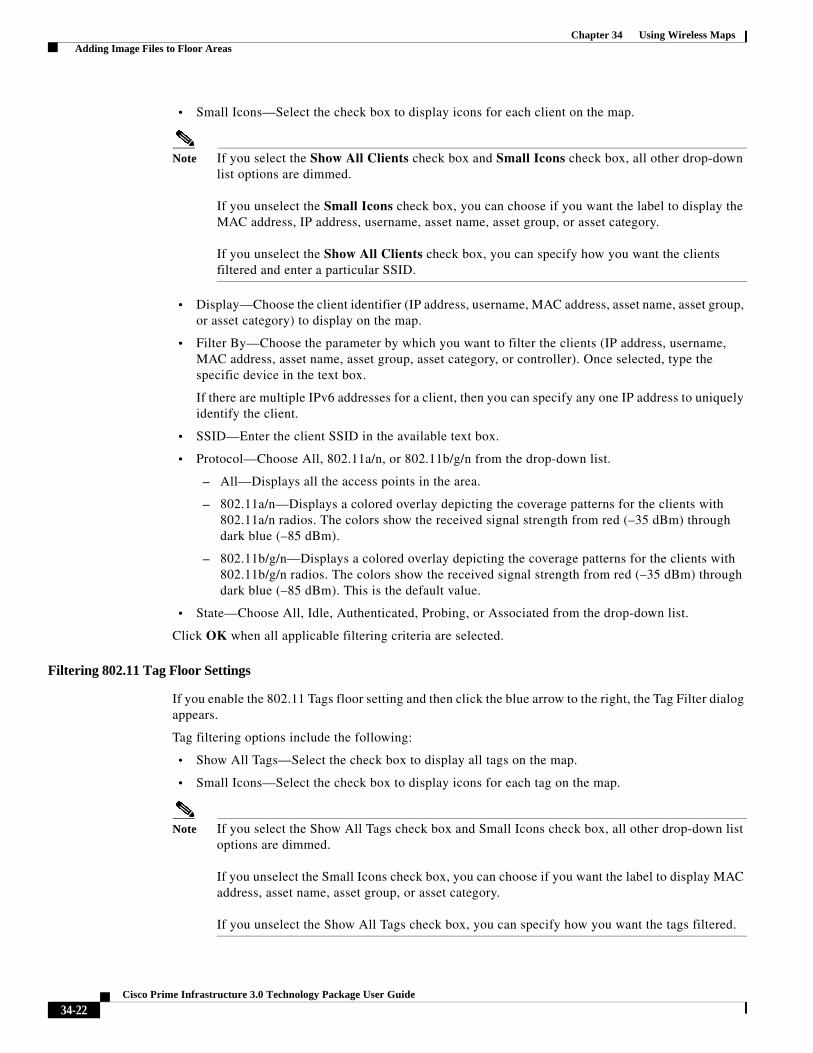
• Small Icons—Select the check box to display icons for each client on the map.
Note If you select the Show All Clients check box and Small Icons check box, all other drop-down list options are dimmed.
If you unselect the Small Icons check box, you can choose if you want the label to display the MAC address, IP address, username, asset name, asset group, or asset category.
If you unselect the Show All Clients check box, you can specify how you want the clients filtered and enter a particular SSID.
• Display—Choose the client identifier (IP address, username, MAC address, asset name, asset group, or asset category) to display on the map.
• Filter By—Choose the parameter by which you want to filter the clients (IP address, username, MAC address, asset name, asset group, asset category, or controller). Once selected, type the specific device in the text box.
If there are multiple IPv6 addresses for a client, then you can specify any one IP address to uniquely identify the client.
• SSID—Enter the client SSID in the available text box.
• Protocol—Choose All, 802.11a/n, or 802.11b/g/n from the drop-down list.
– All—Displays all the access points in the area.
– 802.11a/n—Displays a colored overlay depicting the coverage patterns for the clients with 802.11a/n radios. The colors show the received signal strength from red (–35 dBm) through dark blue (–85 dBm).
– 802.11b/g/n—Displays a colored overlay depicting the coverage patterns for the clients with 802.11b/g/n radios. The colors show the received signal strength from red (–35 dBm) through dark blue (–85 dBm). This is the default value.
• State—Choose All, Idle, Authenticated, Probing, or Associated from the drop-down list.
Click OK when all applicable filtering criteria are selected.
Filtering 802.11 Tag Floor Settings
If you enable the 802.11 Tags floor setting and then click the blue arrow to the right, the Tag Filter dialog appears.
Tag filtering options include the following:
• Show All Tags—Select the check box to display all tags on the map.
• Small Icons—Select the check box to display icons for each tag on the map.
Note If you select the Show All Tags check box and Small Icons check box, all other drop-down list options are dimmed.
If you unselect the Small Icons check box, you can choose if you want the label to display MAC address, asset name, asset group, or asset category.
If you unselect the Show All Tags check box, you can specify how you want the tags filtered.
34-22Cisco Prime Infrastructure 3.0 Technology Package User Guide

Chapter 34 Using Wireless Maps Adding Image Files to Floor Areas
• Display—Choose the tag identifier (MAC address, asset name, asset group, or asset category) to display on the map.
• Filter By—Choose the parameter by which you want to filter the clients (MAC address, asset name, asset group, asset category, or controller). Once selected, type the specific device in the text box.
Click OK when all applicable filtering criteria are selected.
Filtering Rogue AP Floor Settings
If you enable the Rogue APs floor setting and then click the blue arrow to the right, the Rogue AP filter dialog box appears.
Rogue AP filtering options include the following:
• Show All Rogue APs—Select the check box to display all rogue access points on the map.
• Small Icons—Select the check box to display icons for each rogue access point on the map.
Note If you select the Show All Rogue APs check box and Small Icons check box, all other drop-down list options are dimmed.
If you unselect the Show All Rogue APs check box, you can specify how you want the rogue access points filtered.
• MAC Address—If you want to view a particular MAC address, enter it in the MAC Address text box.
• State—Use the drop-down list to choose from Alert, Known, Acknowledged, Contained, Threat, or Unknown contained states.
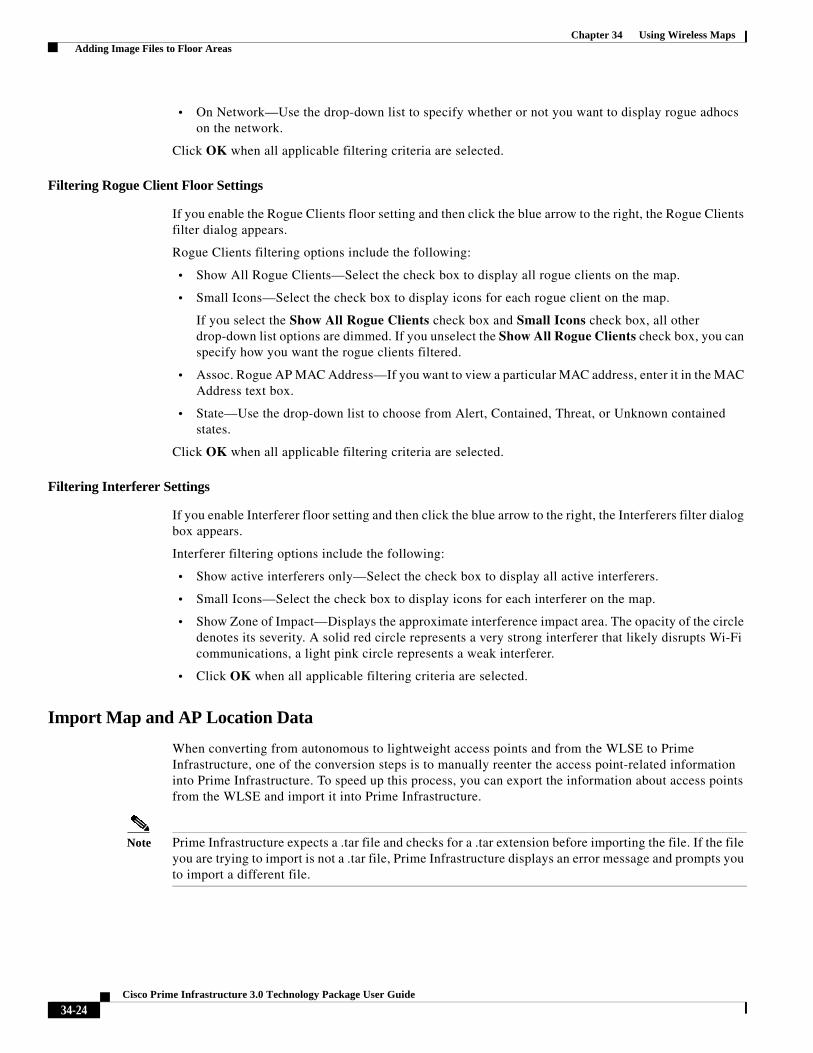
• On Network—Use the drop-down list to specify whether or not you want to display rogue access points on the network.
Click OK when all applicable filtering criteria are selected.
Filtering Rogue Adhoc Floor Settings
If you enable the Rogue Adhocs floor setting and then click the blue arrow to the right, the Rogue Adhoc filter dialog appears.
Rogue Adhoc filtering options include the following:
• Show All Rogue Adhocs—Select the check box to display all rogue adhoc on the map.
• Small Icons—Select the check box to display icons for each rogue adhoc on the map.
Note If you select the Show All Rogue Adhocs check box and Small Icons check box, all other drop-down list options are dimmed.
If you unselect the Show All Rogue Adhocs check box, you can specify how you want the rogue adhocs filtered.
• MAC Address—If you want to view a particular MAC address, enter it in the MAC Address text box.
• State—Use the drop-down list to select from Alert, Known, Acknowledged, Contained, Threat, or Unknown contained states.
34-23Cisco Prime Infrastructure 3.0 Technology Package User Guide
Chapter 34 Using Wireless Maps Adding Image Files to Floor Areas
• On Network—Use the drop-down list to specify whether or not you want to display rogue adhocs on the network.
Click OK when all applicable filtering criteria are selected.
Filtering Rogue Client Floor Settings
If you enable the Rogue Clients floor setting and then click the blue arrow to the right, the Rogue Clients filter dialog appears.
Rogue Clients filtering options include the following:
• Show All Rogue Clients—Select the check box to display all rogue clients on the map.
• Small Icons—Select the check box to display icons for each rogue client on the map.
If you select the Show All Rogue Clients check box and Small Icons check box, all other drop-down list options are dimmed. If you unselect the Show All Rogue Clients check box, you can specify how you want the rogue clients filtered.
• Assoc. Rogue AP MAC Address—If you want to view a particular MAC address, enter it in the MAC Address text box.
• State—Use the drop-down list to choose from Alert, Contained, Threat, or Unknown contained states.
Click OK when all applicable filtering criteria are selected.
Filtering Interferer Settings
If you enable Interferer floor setting and then click the blue arrow to the right, the Interferers filter dialog box appears.
Interferer filtering options include the following:
• Show active interferers only—Select the check box to display all active interferers.
• Small Icons—Select the check box to display icons for each interferer on the map.
• Show Zone of Impact—Displays the approximate interference impact area. The opacity of the circle denotes its severity. A solid red circle represents a very strong interferer that likely disrupts Wi-Fi communications, a light pink circle represents a weak interferer.
• Click OK when all applicable filtering criteria are selected.
Import Map and AP Location Data
When converting from autonomous to lightweight access points and from the WLSE to Prime Infrastructure, one of the conversion steps is to manually reenter the access point-related information into Prime Infrastructure. To speed up this process, you can export the information about access points from the WLSE and import it into Prime Infrastructure.
Note Prime Infrastructure expects a .tar file and checks for a .tar extension before importing the file. If the file you are trying to import is not a .tar file, Prime Infrastructure displays an error message and prompts you to import a different file.
34-24Cisco Prime Infrastructure 3.0 Technology Package User Guide

Chapter 34 Using Wireless Maps Monitoring Floor Areas
Note For more information on the WLSE data export functionality (WLSE Version 2.15), see the following URL:http://<WLSE_IP_ADDRESS>:1741/debug/export/exportSite.jsp.
To map properties and import a tar file containing WLSE data using the Prime Infrastructure web interface, follow these steps:
Step 1 Choose Maps > Site Maps.
Step 2 From the Select a command drop-down list, choose Import Maps, and click Go.
Step 3 Choose the WLSE Map and AP Location Data option, and click Next.
Step 4 In the Import WLSE Map and AP Location Data page, click Browse to select the file to import.
Step 5 Find and select the .tar file to import and click Open.
Prime Infrastructure displays the name of the file in the Import From text box.
Step 6 Click Import.
Prime Infrastructure uploads the file and temporarily saves it into a local directory while it is being processed. If the file contains data that cannot be processed, Prime Infrastructure prompts you to correct the problem and retry. Once the file has been loaded, Prime Infrastructure displays a report of what is added to Prime Infrastructure. The report also specifies what cannot be added and why.
If some of the data to be imported already exists, Prime Infrastructure either uses the existing data in the case of campuses or overwrites the existing data using the imported data in the cases of buildings and floors.
Note If there are duplicate names between a WLSE site and building combination and Prime Infrastructure campus (or top-level building) and building combination, Prime Infrastructure displays a message in the Pre Execute Import Report indicating that it will delete the existing building.
Step 7 Click Import to import the WLSE data.
Prime Infrastructure displays a report indicating what was imported.
Step 8 Choose Monitor > Site Maps to view the imported data.
Monitoring Floor AreasThe floor area is the area of each floor of the building measured to the outer surface of the outer walls including the area of lobbies, cellars, elevator shafts, and in multi-dwelling buildings, all the common spaces.
• Panning and Zooming with Next Generation Maps, page 34-26
• Adding Access Points to a Floor Area, page 34-26
• Placing Access Points, page 34-28
34-25Cisco Prime Infrastructure 3.0 Technology Package User Guide

Chapter 34 Using Wireless Maps Monitoring Floor Areas
Panning and Zooming with Next Generation Maps
Panning
To move the map, click and hold the left mouse button and drag the map to a new place.
You can also move the map North, South, East or West using the pan arrows. These can be found in the top left hand corner of the map (see Figure 34-1).
Figure 34-1 Panning Control
Note You can also perform the panning operations using the arrow keys on a keyboard.
Zooming in and out - changing the scale
The zooming levels depend upon the resolution of an image. A high resolution image may provide more zoom levels. Each zoom level is made of a different style map shown at different scales, each one showing more or less detail. Some maps will be of the same style, but at a smaller or larger scale.
To see a map with more detail you need to zoom in. You can do this using the zoom bar on the left hand side of the map (see Figure 34-2). Click the + sign on the top of the zoom bar. To center and zoom in on a location, double click the location. To see a map with less detail you need to zoom out. To do this, click the - sign on the bottom of the zoom bar.
Figure 34-2 Zooming Control
Note You can perform zooming operations using mouse or keyboard. With keyboard, click the + or - signs to zoom in or zoom out. With mouse, use the mouse scroll wheel to zoom in or zoom out or double click to zoom in.
Adding Access Points to a Floor Area
After you add the .PNG, .JPG, .JPEG, or .GIF format floor plan and outdoor area maps to the Prime Infrastructure database, you can position lightweight access point icons on the maps to show where they are installed in the buildings. To add access points to a floor area and outdoor area, follow these steps:
Step 1 Choose Maps > Site Maps.
Step 2 From the Maps Tree View or the Maps > Site Maps left sidebar menu, select the applicable floor to open the Floor View page.
Step 3 From the Select a command drop-down list, choose Add Access Points, and click Go.
34-26Cisco Prime Infrastructure 3.0 Technology Package User Guide

Chapter 34 Using Wireless Maps Monitoring Floor Areas
Step 4 In the Add Access Points page, select the check boxes of the access points that you want to add to the floor area.
To search for access points, enter AP name or MAC address (Ethernet/Radio)/IP in the Search AP [Name/MacAddress (Ethernet/Radio)/IP] text box, and then click Search. The search is case-insensitive.
Only access points that are not yet assigned to any floor or outdoor area appear in the list.
Select the check box at the top of the list to select all access points.
Step 5 When all of the applicable access points are selected, click OK located at the bottom of the access point list.
The Position Access Points page appears.
Each access point you have chosen to add to the floor map is represented by a gray circle (differentiated by access point name or MAC address) and is lined up in the upper left part of the floor map.
Step 6 Click and drag each access point to the appropriate location. Access points turn blue when selected.
When you drag an access point on the map, its horizontal and vertical position appears in the Horizontal and Vertical text boxes.
The small black arrow at the side of each access point represents Side A of each access point, and each access point arrow must correspond with the direction in which the access points were installed. Side A is clearly noted on each 1000 series access point and has no relevance to the 802.11a/n radio. To adjust the directional arrow, choose the appropriate orientation from the Antenna Angle drop-down list.
When selected, the access point details are displayed on the left side of the page. Access point details include the following:
• AP Model—Indicates the model type of the selected access point.
• Protocol—Choose the protocol for this access point from the drop-down list.
• Antenna—Choose the appropriate antenna type for this access point from the drop-down list.
• Antenna/AP Image—The antenna image reflects the antenna selected from the Antenna drop-down list. Click the arrow at the top right of the antenna image to expand the image size.
• Antenna Orientation—Depending on the antenna type, enter the Azimuth and the Elevation orientations in degrees.
The Azimuth option does not appear for Omnidirectional antennas because their pattern is nondirectional in azimuth.
Note For internal antennas, the same elevation angle applies to both radios.
The antenna angle is relative to the map X axis. Because the origin of the X (horizontal) and Y (vertical) axes is in the upper left corner of the map, 0 degrees points side A of the access point to the right, 90 degrees points side A down, 180 degrees points side A to the left, and so on.
The antenna elevation is used to move the antenna vertically, up or down, to a maximum of 90 degrees.
Note Make sure each access point is in the correct location on the map and has the correct antenna orientation. Accurate access point positioning is critical when you use the maps to find coverage holes and rogue access points.
See the following URL for further information about the antenna elevation and azimuth patterns:http://www.cisco.com/en/US/products/hw/wireless/ps469/tsd_products_support_series_home.html
34-27Cisco Prime Infrastructure 3.0 Technology Package User Guide

Chapter 34 Using Wireless Maps Monitoring Floor Areas
Step 7 When you are finished placing and adjusting each access point, click Save.
Note Clicking Save causes the antenna gain on the access point to correspond to the selected antenna. This might cause the radio to reset.
Prime Infrastructure computes the RF prediction for the entire map. These RF predictions are popularly known as heat maps because they show the relative intensity of the RF signals on the coverage area map.
This display is only an approximation of the actual RF signal intensity because it does not take into account the attenuation of various building materials, such as drywall or metal objects, nor does it display the effects of RF signals bouncing off obstructions.
Note Antenna gain settings have no effect on heatmaps and location calculations. Antenna gain is implicitly associated to the antenna name. Because of this, the following apply:– If an antenna is used and marked as “Other” in Prime Infrastructure, it is ignored for all heatmap and location calculations; – If an antenna is used and marked as a Cisco antenna in Prime Infrastructure, that antenna gain setting (internal value on Prime Infrastructure) is used no matter what gain is set on the controller.
See the “Placing Access Points” section on page 34-28 for more information on placing access points on a map.
You can change the position of access points by importing or exporting a file. See the “Positioning Wi-Fi TDOA Receivers” section on page 34-44 for more information.
Placing Access Points
To determine the best location of all devices in the wireless LAN coverage areas, you need to consider the access point density and location.
Ensure that no fewer than 3 access points, and preferably 4 or 5, provide coverage to every area where device location is required. The more access points that detect a device, the better. This high level guideline translates into the following best practices, ordered by priority:
1. Most importantly, access points should surround the desired location.
2. One access point should be placed roughly every 50 to 70 linear feet (about 17 to 20 meters). This translates into one access point every 2,500 to 5000 square feet (about 230 to 450 square meters).
Note The access point must be mounted so that it is under 20 feet high. For best performance, a mounting at 10 feet would be ideal.
Following these guidelines makes it more likely that access points detect tracked devices. Rarely do two physical environments have the same RF characteristics. Users might need to adjust these parameters to their specific environment and requirements.
34-28Cisco Prime Infrastructure 3.0 Technology Package User Guide
Chapter 34 Using Wireless Maps Using the Automatic Hierarchy to Create Maps
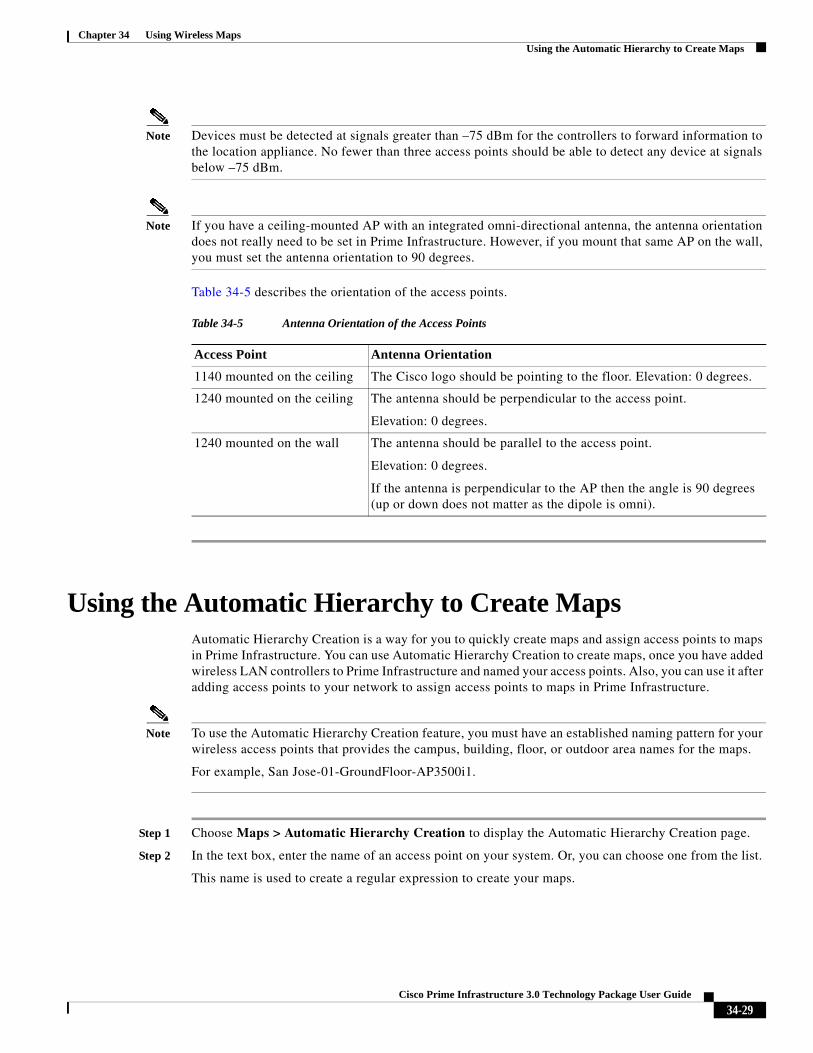
Note Devices must be detected at signals greater than –75 dBm for the controllers to forward information to the location appliance. No fewer than three access points should be able to detect any device at signals below –75 dBm.
Note If you have a ceiling-mounted AP with an integrated omni-directional antenna, the antenna orientation does not really need to be set in Prime Infrastructure. However, if you mount that same AP on the wall, you must set the antenna orientation to 90 degrees.
Table 34-5 describes the orientation of the access points.
Using the Automatic Hierarchy to Create MapsAutomatic Hierarchy Creation is a way for you to quickly create maps and assign access points to maps in Prime Infrastructure. You can use Automatic Hierarchy Creation to create maps, once you have added wireless LAN controllers to Prime Infrastructure and named your access points. Also, you can use it after adding access points to your network to assign access points to maps in Prime Infrastructure.
Note To use the Automatic Hierarchy Creation feature, you must have an established naming pattern for your wireless access points that provides the campus, building, floor, or outdoor area names for the maps.
For example, San Jose-01-GroundFloor-AP3500i1.
Step 1 Choose Maps > Automatic Hierarchy Creation to display the Automatic Hierarchy Creation page.
Step 2 In the text box, enter the name of an access point on your system. Or, you can choose one from the list.
This name is used to create a regular expression to create your maps.
Table 34-5 Antenna Orientation of the Access Points
Access Point Antenna Orientation
1140 mounted on the ceiling The Cisco logo should be pointing to the floor. Elevation: 0 degrees.
1240 mounted on the ceiling The antenna should be perpendicular to the access point.
Elevation: 0 degrees.
1240 mounted on the wall The antenna should be parallel to the access point.
Elevation: 0 degrees.
If the antenna is perpendicular to the AP then the angle is 90 degrees (up or down does not matter as the dipole is omni).
34-29Cisco Prime Infrastructure 3.0 Technology Package User Guide
Chapter 34 Using Wireless Maps Using the Automatic Hierarchy to Create Maps
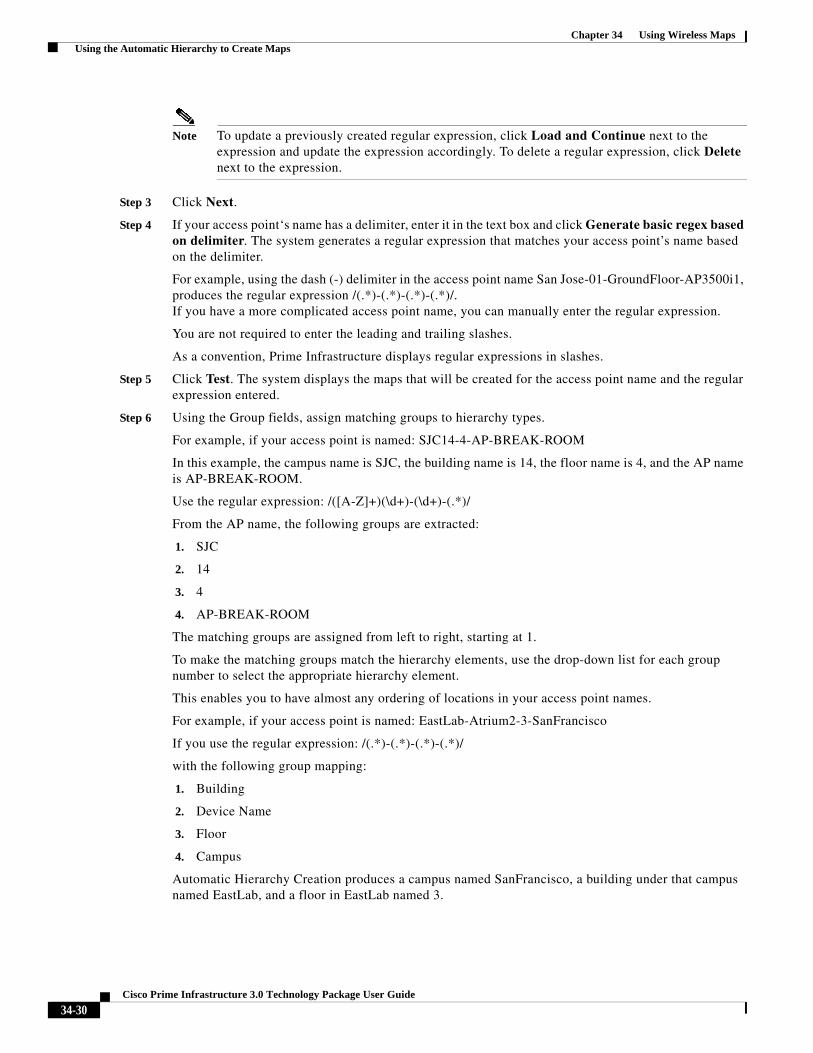
Note To update a previously created regular expression, click Load and Continue next to the expression and update the expression accordingly. To delete a regular expression, click Delete next to the expression.
Step 3 Click Next.
Step 4 If your access point‘s name has a delimiter, enter it in the text box and click Generate basic regex based on delimiter. The system generates a regular expression that matches your access point’s name based on the delimiter.
For example, using the dash (-) delimiter in the access point name San Jose-01-GroundFloor-AP3500i1, produces the regular expression /(.*)-(.*)-(.*)-(.*)/.If you have a more complicated access point name, you can manually enter the regular expression.
You are not required to enter the leading and trailing slashes.
As a convention, Prime Infrastructure displays regular expressions in slashes.
Step 5 Click Test. The system displays the maps that will be created for the access point name and the regular expression entered.
Step 6 Using the Group fields, assign matching groups to hierarchy types.
For example, if your access point is named: SJC14-4-AP-BREAK-ROOM
In this example, the campus name is SJC, the building name is 14, the floor name is 4, and the AP name is AP-BREAK-ROOM.
Use the regular expression: /([A-Z]+)(\d+)-(\d+)-(.*)/
From the AP name, the following groups are extracted:
1. SJC
2. 14
3. 4
4. AP-BREAK-ROOM
The matching groups are assigned from left to right, starting at 1.
To make the matching groups match the hierarchy elements, use the drop-down list for each group number to select the appropriate hierarchy element.
This enables you to have almost any ordering of locations in your access point names.
For example, if your access point is named: EastLab-Atrium2-3-SanFrancisco
If you use the regular expression: /(.*)-(.*)-(.*)-(.*)/
with the following group mapping:
1. Building
2. Device Name
3. Floor
4. Campus
Automatic Hierarchy Creation produces a campus named SanFrancisco, a building under that campus named EastLab, and a floor in EastLab named 3.
34-30Cisco Prime Infrastructure 3.0 Technology Package User Guide

Chapter 34 Using Wireless Maps Using the Automatic Hierarchy to Create Maps
Note The two hierarchy types, Not in device name and Device have no effect, but enable you to skip groups in case you need to use a matching group for some other purpose.
Automatic Hierarchy Creation requires the following groups to be mapped in order to compute a map on which to place the access point:
Automatic Hierarchy Creation attempts to guess the floor index from the floor name. If the floor name is a number, AHC will assign the floor a positive floor index. If the floor name is a negative number or starts with the letter B (for example, b1, -4, or B2), AHC assigns the floor a negative floor index. This indicates that the floor is a basement.
When searching for an existing map on which to place the access point, AHC considers floors in the access point’s building with the same floor index as the access point’s name.
For example, if the map SF > MarketStreet > Sublevel1 exists and has a floor index of -1, then the access point SF-MarketStreet-b1-MON1 will be assigned to that floor.
Step 7 Click Next. You can test against more access points. You may test your regular expression and matching group mapping against more access points by entering the access point names in the Add more device names to test against field, and clicking Add.
You then click Test to test each of the access points names in the table. The result of each test is displayed in the table.
If required, return to the previous step to edit the regular expression or group mapping for the current regular expression.
Step 8 Click Next, then click Save and Apply. This applies the regular expression to the system. The system processes all the access points that are not assigned to a map.
Note You can edit the maps to include floor images, correct dimensions, and so on. When Automatic Hierarchy Creation creates a map, it uses the default dimensions of 20 feet by 20 feet. You will need to edit the created maps to specify the correct dimensions and other attributes.
Campus group present in match?
Building group present in match?
Floor group present in match? Resulting location
Yes Yes Yes Campus > Building > Floor
Yes Yes No Failed match
Yes No Yes Campus > Floor (where Floor is an outdoor area)
Yes No No Failed match
No Yes Yes System Campus > Building > Floor
No Yes No Failed match
No No Yes Failed match
No No No Failed match
34-31Cisco Prime Infrastructure 3.0 Technology Package User Guide
Chapter 34 Using Wireless Maps Using the Map Editor
Maps created using Automatic Hierarchy Creation appear in the maps list with an incomplete icon. Once you have edited a map, the incomplete icon disappears. You may hide the column for incomplete maps by clicking the Edit View link.
Using the Map EditorYou use the Map Editor to define, draw, and enhance floor plan information. The map editor allows you to create obstacles so that they can be taken into consideration while computing RF prediction heatmaps for access points. You can also add coverage areas for location appliances that locate clients and tags in that particular area.
The planning mode opens the map editor in the browser window from which the planning tool is launched. If the original browser window has navigated away from the floor page, you need to navigate back to the floor page to launch the map editor.
• Guidelines for Using the Map Editor
• Guidelines for Placing Access Points
• Guidelines for Inclusion and Exclusion Areas on a Floor
• Opening the Map Editor
• Map Editor Icons
• Using the Map Editor to Draw Coverage Areas
• Using the Map Editor to Draw Obstacles
• Defining an Inclusion Region on a Floor
• Defining an Exclusion Region on a Floor
• Defining a Rail Line on a Floor
Guidelines for Using the Map Editor
Consider the following when modifying a building or floor map using the map editor:
• We recommend that you use the map editor to draw walls and other obstacles rather than importing an .FPE file from the legacy floor plan editor.
– If necessary, you can still import .FPE files. To do so, navigate to the desired floor area, choose Edit Floor Area from the Select a command drop-down list, click Go, select the FPE File check box, and browse to choose the .FPE file.
• You can add any number of walls to a floor plan with the map editor; however, the processing power and memory of a client workstation might limit the refresh and rendering aspects of Prime Infrastructure.
– We recommend a practical limit of 400 walls per floor for machines with 1 GB RAM or less.
• All walls are used by Prime Infrastructure when generating RF coverage heatmaps.
34-32Cisco Prime Infrastructure 3.0 Technology Package User Guide
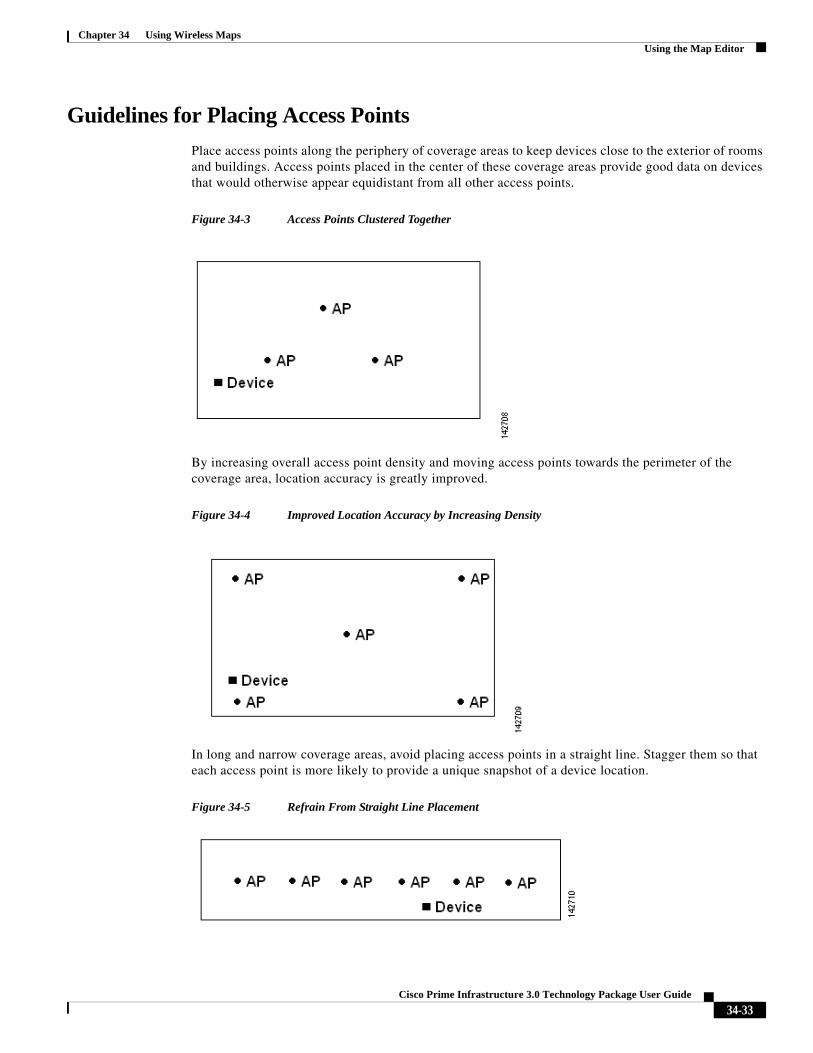
Chapter 34 Using Wireless Maps Using the Map Editor
Guidelines for Placing Access Points
Place access points along the periphery of coverage areas to keep devices close to the exterior of rooms and buildings. Access points placed in the center of these coverage areas provide good data on devices that would otherwise appear equidistant from all other access points.
Figure 34-3 Access Points Clustered Together
By increasing overall access point density and moving access points towards the perimeter of the coverage area, location accuracy is greatly improved.
Figure 34-4 Improved Location Accuracy by Increasing Density
In long and narrow coverage areas, avoid placing access points in a straight line. Stagger them so that each access point is more likely to provide a unique snapshot of a device location.
Figure 34-5 Refrain From Straight Line Placement
34-33Cisco Prime Infrastructure 3.0 Technology Package User Guide
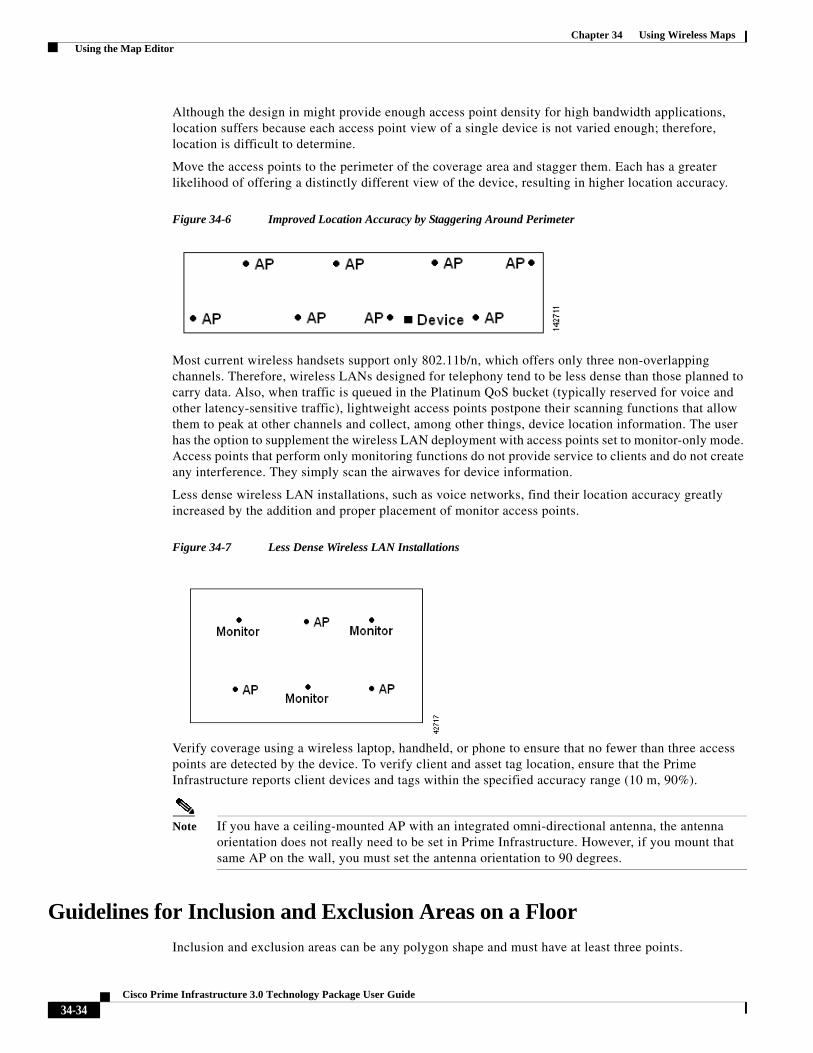
Chapter 34 Using Wireless Maps Using the Map Editor
Although the design in might provide enough access point density for high bandwidth applications, location suffers because each access point view of a single device is not varied enough; therefore, location is difficult to determine.
Move the access points to the perimeter of the coverage area and stagger them. Each has a greater likelihood of offering a distinctly different view of the device, resulting in higher location accuracy.
Figure 34-6 Improved Location Accuracy by Staggering Around Perimeter
Most current wireless handsets support only 802.11b/n, which offers only three non-overlapping channels. Therefore, wireless LANs designed for telephony tend to be less dense than those planned to carry data. Also, when traffic is queued in the Platinum QoS bucket (typically reserved for voice and other latency-sensitive traffic), lightweight access points postpone their scanning functions that allow them to peak at other channels and collect, among other things, device location information. The user has the option to supplement the wireless LAN deployment with access points set to monitor-only mode. Access points that perform only monitoring functions do not provide service to clients and do not create any interference. They simply scan the airwaves for device information.
Less dense wireless LAN installations, such as voice networks, find their location accuracy greatly increased by the addition and proper placement of monitor access points.
Figure 34-7 Less Dense Wireless LAN Installations
Verify coverage using a wireless laptop, handheld, or phone to ensure that no fewer than three access points are detected by the device. To verify client and asset tag location, ensure that the Prime Infrastructure reports client devices and tags within the specified accuracy range (10 m, 90%).
Note If you have a ceiling-mounted AP with an integrated omni-directional antenna, the antenna orientation does not really need to be set in Prime Infrastructure. However, if you mount that same AP on the wall, you must set the antenna orientation to 90 degrees.
Guidelines for Inclusion and Exclusion Areas on a Floor
Inclusion and exclusion areas can be any polygon shape and must have at least three points.
34-34Cisco Prime Infrastructure 3.0 Technology Package User Guide

Chapter 34 Using Wireless Maps Using the Map Editor
You can only define one inclusion region on a floor. By default, an inclusion region is defined for each floor when it is added to Prime Infrastructure. The inclusion region is indicated by a solid aqua line, and generally outlines the region.
You can define multiple exclusion regions on a floor.
Newly defined inclusion and exclusion regions appear on heatmaps only after the mobility services engine recalculates location.
Opening the Map Editor
Follow these steps to use the map editor:
Step 1 Choose Maps > Site Map Design.
Step 2 Click the desired campus. The Site Maps > Campus Name page appears.
Step 3 Click a campus and then click a building.
Step 4 Click the desired floor area. The Site Maps > Campus Name > Building Name > Floor Area Name page appears.
Step 5 From the Select a command drop-down list, choose Map Editor, and click Go. The Map Editor page appears.
Map Editor Icons
Table 34-6 Next Generation Maps Icons
Icon Description
Scale Floor—Click anywhere on the map to start drawing line. Double click to finish the line and enter the new line length in the popup shown. This will modify the floor dimensions to the new dimensions.
Measure Distance—Click anywhere on the map to start drawing line. Double click to finish the line. Measured line length in ft/meters is shown on the top.
Copy/Move Obstacles—Select obstacles either by drawing a box on the map or by clicking the obstacles. To copy obstacles, click Copy. This will create new obstacles just above the selected obstacles. To move the obstacles, drag the selected obstacles to new position. Clicking anywhere on the map will unselect all the elements.
Delete Mode—Select the elements to be deleted either by drawing a box on the map or clicking each element. Use Shift key to select multiple elements. Use the Ctrl key to toggle selection of elements, one at a time. Clicking anywhere on the map will unselect all the elements. Click Delete to delete the selected elements
Modify Mode—Click an element and click the vertices to reshape or drag the element to move to a new position. Clicking anywhere on the map will unselect the selected element.
Draw Coverage Area
34-35Cisco Prime Infrastructure 3.0 Technology Package User Guide

Chapter 34 Using Wireless Maps Using the Map Editor
Using the Map Editor to Draw Coverage Areas
If you have a building that is non-rectangular or you want to mark a non-rectangular area within a floor, you can use the map editor to draw a coverage area.
Step 1 Add the floor plan if it is not already represented in Prime Infrastructure.
Step 2 Choose Maps > Site Maps.
Step 3 Click the Map Name that corresponds to the outdoor area, campus, building, or floor you want to edit.
Step 4 From the Select a command drop-down list, choose Map Editor, and click Go.
Step 5 It the Map Editor page, click the Draw Coverage Area icon on the toolbar.
A pop-up appears.
Step 6 Enter the name of the area that you are defining. Click OK.
A drawing tool appears.
Step 7 Move the drawing tool to the area you want to outline.
• Click the left mouse button to begin and end drawing a line.
• When you have completely outlined the area, double-click the left mouse button and the area is highlighted in the page.
The outlined area must be a closed object to appear highlighted on the map.
Step 8 Click the disk icon on the toolbar to save the newly drawn area.
Draw Location Region
Draw Rail
Draw Obstacle—Click anywhere on the map to start drawing. Double click to finish drawing. Use Ctrl-z to undo, Ctrl-y to redo and 'Esc' key to cancel the current drawing.
Place Marker
Navigation—Remove any selected modes such as drawing or editing and switches to navigation mode where you can view the map and perform zooming or panning.
Table 34-6 Next Generation Maps Icons (continued)
Icon Description
34-36Cisco Prime Infrastructure 3.0 Technology Package User Guide
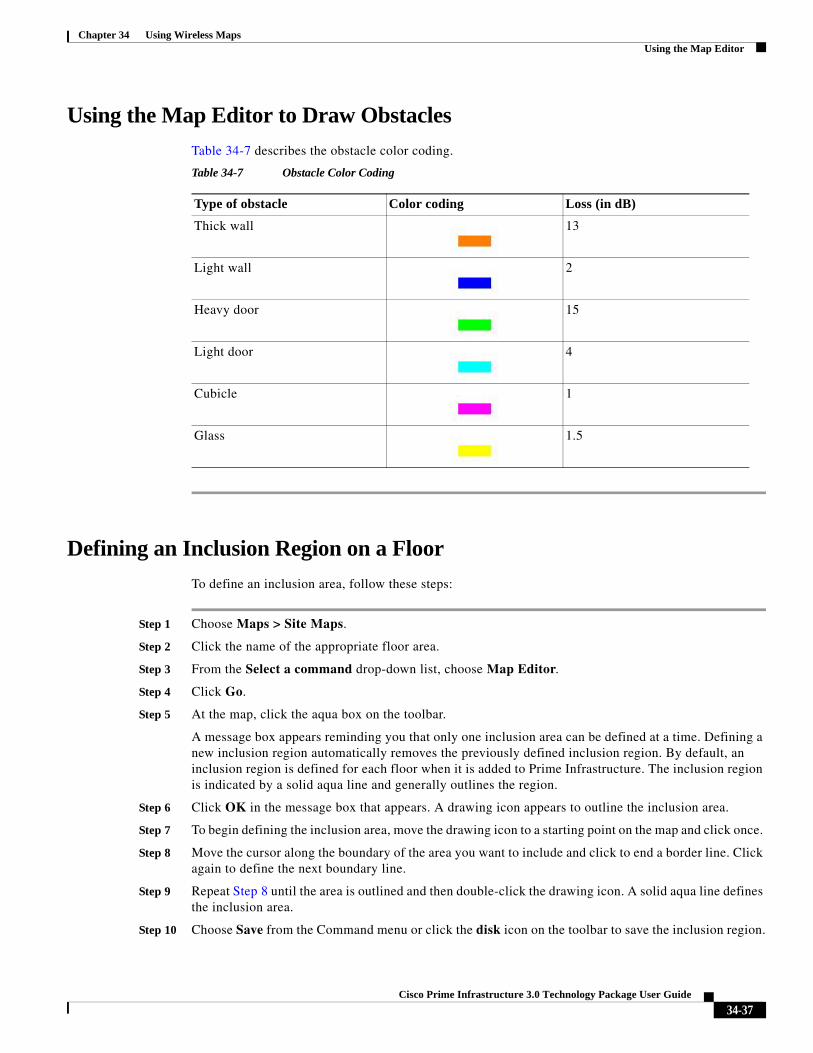
Chapter 34 Using Wireless Maps Using the Map Editor
Using the Map Editor to Draw Obstacles
Table 34-7 describes the obstacle color coding.
Defining an Inclusion Region on a Floor
To define an inclusion area, follow these steps:
Step 1 Choose Maps > Site Maps.
Step 2 Click the name of the appropriate floor area.
Step 3 From the Select a command drop-down list, choose Map Editor.
Step 4 Click Go.
Step 5 At the map, click the aqua box on the toolbar.
A message box appears reminding you that only one inclusion area can be defined at a time. Defining a new inclusion region automatically removes the previously defined inclusion region. By default, an inclusion region is defined for each floor when it is added to Prime Infrastructure. The inclusion region is indicated by a solid aqua line and generally outlines the region.
Step 6 Click OK in the message box that appears. A drawing icon appears to outline the inclusion area.
Step 7 To begin defining the inclusion area, move the drawing icon to a starting point on the map and click once.
Step 8 Move the cursor along the boundary of the area you want to include and click to end a border line. Click again to define the next boundary line.
Step 9 Repeat Step 8 until the area is outlined and then double-click the drawing icon. A solid aqua line defines the inclusion area.
Step 10 Choose Save from the Command menu or click the disk icon on the toolbar to save the inclusion region.
Table 34-7 Obstacle Color Coding
Type of obstacle Color coding Loss (in dB)
Thick wall 13
Light wall 2
Heavy door 15
Light door 4
Cubicle 1
Glass 1.5
34-37Cisco Prime Infrastructure 3.0 Technology Package User Guide
Chapter 34 Using Wireless Maps Using the Map Editor
Note If you made an error in defining the inclusion area, click the area. The selected area is outlined by a dashed aqua line. Next, click the X icon on the toolbar. The area is removed from the floor map.
Step 11 Select the Location Regions check box if it is not already selected. If you want it to apply to all floor maps, click Save settings. Close the Layers configuration page.
Step 12 To resynchronize Prime Infrastructure and MSE databases, choose Services > Synchronize Services.
Note If the two DBs are already synchronized then a resynchronization happens automatically every time there is a change. There is no need for an explicit resynch.
Step 13 In the Synchronize page, choose Network Designs from the Synchronize drop-down list and then click Synchronize.
You can confirm that the synchronization is successful by viewing two green arrows in the Sync. Status column.
Note Newly defined inclusion and exclusion regions appear on heatmaps only after the mobility services engine recalculates location.
Defining an Exclusion Region on a Floor
To further refine location calculations on a floor, you can define areas that are excluded (exclusion areas) in the calculations. For example, you might want to exclude areas such as an atrium or stairwell within a building. As a rule, exclusion areas are generally defined within the borders of an inclusion area.
To define an exclusion area, follow these steps:
Step 1 Choose Maps > Site Maps.
Step 2 Click the name of the appropriate floor area.
Step 3 From the Select a command drop-down list, choose Map Editor.
Step 4 Click Go.
Step 5 At the map, click the purple box on the toolbar.
Step 6 Click OK in the message box that appears. A drawing icon appears to outline the exclusion area.
Step 7 To begin defining the exclusion area, move the drawing icon to the starting point on the map, and click once.
Step 8 Move the drawing icon along the boundary of the area you want to exclude. Click once to start a boundary line, and click again to end the boundary line.
Step 9 Repeat Step 8 until the area is outlined and then double-click the drawing icon. The defined exclusion area is shaded in purple when the area is completely defined. The excluded area is shaded in purple.
Step 10 To define additional exclusion regions, repeat Step 5 to Step 9.
34-38Cisco Prime Infrastructure 3.0 Technology Package User Guide

Chapter 34 Using Wireless Maps Using the Map Editor
Step 11 When all exclusion areas are defined, choose Save from the Command menu or click the disk icon on the toolbar to save the exclusion region.
To delete an exclusion area, click the area to be deleted. The selected area is outlined by a dashed purple line. Next, click the X icon on the toolbar. The area is removed from the floor map.
Step 12 Select the Location Regions check box if it is not already selected, click Save settings, and close the Layers configuration page when complete.
Step 13 To resynchronize Prime Infrastructure and location databases, choose Services > Synchronize Services.
Step 14 In the Synchronize page, choose Network Designs from the Synchronize drop-down list and then click Synchronize.
You can confirm that the synchronization is successful by viewing two green arrows in the Sync. Status column.
Defining a Rail Line on a Floor
You can define a rail line on a floor that represents a conveyor belt. Additionally, you can define an area around the rail area known as the snap-width to further assist location calculations. This represents the area in which you expect clients to appear. Any client located within the snap-width area is plotted on the rail line (majority) or just outside of the snap-width area (minority).
Note Rail line configurations do not apply to tags.
The snap-width area is defined in feet or meters (user-defined) and represents the distance that is monitored on either side (east and west or north and south) of the rail.
To define a rail with a floor, follow these steps:
Step 1 Choose Maps > Site Maps.
Step 2 Click the name of the appropriate floor area.
Step 3 Choose Map Editor from the Select a command drop-down list.
Step 4 Click Go.
Step 5 In the map, click the rail icon (to the right of the purple exclusion icon) on the toolbar.
Step 6 In the message dialog box that appears, enter a snap-width (feet or meters) for the rail and then click OK. A drawing icon appears.
Step 7 Click the drawing icon at the starting point of the rail line. Click again when you want to stop drawing the line or change the direction of the line.
Step 8 Click the drawing icon twice when the rail line is completely drawn on the floor map. The rail line appears on the map and is bordered on either side by the defined snap-width region.
To delete a rail line, click the area to be deleted. The selected area is outlined by a dashed purple line. Next, click the X icon on the toolbar. The area is removed from the floor map.
Step 9 At the floor map, choose the Layers drop-down list.
Step 10 Select the Rails check box for if it is not already selected, click Save settings, and close the Layers configuration pane when complete.
34-39Cisco Prime Infrastructure 3.0 Technology Package User Guide
Chapter 34 Using Wireless Maps Adding an Outdoor Area
Step 11 To resynchronize Prime Infrastructure and mobility services engine, choose Services > Synchronize Services.
Step 12 In the Synchronize page, choose Network Designs from the Synchronize drop-down list and then click Synchronize.
You can confirm that the synchronization is successful by viewing two green arrows in the Sync. Status column.
Adding an Outdoor AreaYou can add an outdoor area to a campus map in the Prime Infrastructure database regardless of whether you have added outdoor area maps to the database.
To add an outdoor area to a campus map, follow these steps:
Step 1 If you want to add a map of the outdoor area to the database, save the map in .PNG, .JPG, .JPEG, or .GIF format. Then browse to and import the map from anywhere in your file system.
Note You do not need a map to add an outdoor area. You can simply define the dimensions of the area to add it to the database. The map can be any size because Prime Infrastructure automatically resizes the map to fit the workspace.
Step 2 Choose Maps > Site Maps.
Step 3 Click the desired campus to display the Monitor > Site Maps > Campus View page.
Step 4 From the Select a command drop-down list, choose New Outdoor Area.
Step 5 Click Go. The Create New Area page appears.
Step 6 In the New Outdoor Area page, enter the following information:
• Name—The user-defined name of the new outdoor area.
• Contact—The user-defined contact name.
• Area Type (RF Model)—Cubes And Walled Offices, Drywall Office Only, Outdoor Open Space (default).
• AP Height (feet)—Enter the height of the access point.
• Image File—Name of the file containing the outdoor area map. Click Browse to find the file.
Step 7 Click Next.
Step 8 Click Place to put the outdoor area on the campus map. Prime Infrastructure creates an outdoor area rectangle scaled to the size of the campus map.
Step 9 Click and drag the outdoor area rectangle to the desired position on the campus map.
Step 10 Click Save to save this outdoor area and its campus location to the database.
A hyperlink associated with the outdoor area takes you to the corresponding Maps page.
Step 11 (Optional) To assign location presence information for the new outdoor area, choose Edit Location Presence Info, and click Go.
34-40Cisco Prime Infrastructure 3.0 Technology Package User Guide

Chapter 34 Using Wireless Maps Using Chokepoints to Enhance Tag Location Reporting
By default, the Override Child Element Presence Info check box is selected. There is no need to alter this setting for outdoor areas.
Using Chokepoints to Enhance Tag Location ReportingInstallation of chokepoints provides enhanced location information for RFID tags. When an active Cisco-compatible Extensions Version 1-compliant RFID tag enters the range of a chokepoint, it is stimulated by the chokepoint. The MAC address of this chokepoint is then included in the next beacon sent by the stimulated tag. All access points that detect this tag beacon then forward the information to the controller and location appliance.
Using chokepoints in conjunction with active compatible extensions compliant tags provides immediate location information on a tag and its asset. When a Cisco-compatible Extension tag moves out of the range of a chokepoint, its subsequent beacon frames do not contain any identifying chokepoint information. Location determination of the tag defaults to the standard calculation methods based on RSSIs reported by the access point associated with the tag.
• Adding a Chokepoint to a Prime Infrastructure Map
• Positioning Chokepoints
• Adding Wi-Fi TDOA Receivers to Prime Infrastructure
• Adding Wi-Fi TDOA Receivers to a Map
• Positioning Wi-Fi TDOA Receivers
• Managing RF Calibration Models
Adding Chokepoints to Prime Infrastructure
Chokepoints are installed and configured as recommended by the Chokepoint vendor. After the chokepoint installation is complete and operational, the chokepoint can be entered into the location database and plotted on an Prime Infrastructure map.
To add a chokepoint to the Prime Infrastructure database, follow these steps:
Step 1 Choose Configure > Chokepoints.
Step 2 From the Select a command drop-down list, choose Add Chokepoints.
Step 3 Click Go.
Step 4 Enter the MAC address and name for the chokepoint.
Step 5 Select the Entry/Exit Chokepoint check box.
Step 6 Enter the coverage range for the chokepoint.
The Chokepoint range is a visual representation only. It is product-specific. The actual range must be configured separately using the applicable chokepoint vendor software.
Step 7 Click OK.
34-41Cisco Prime Infrastructure 3.0 Technology Package User Guide
Chapter 34 Using Wireless Maps Using Chokepoints to Enhance Tag Location Reporting
After the chokepoint is added to the database, it can be placed on the appropriate Prime Infrastructure floor map.
Adding a Chokepoint to a Prime Infrastructure Map
To add the chokepoint to a map, follow these steps:
Step 1 Choose Maps > Site Maps.
Step 2 In the Maps page, choose the link that corresponds to the floor location of the chokepoint.
Step 3 From the Select a command drop-down list, choose Add Chokepoints.
Step 4 Click Go.
The Add Chokepoints summary page lists all recently added chokepoints that are in the database but are not yet mapped.
Step 5 Select the check box next to the chokepoint that you want to place on the map.
Step 6 Click OK.
A map appears with a chokepoint icon located in the top left-hand corner. You are now ready to place the chokepoint on the map.
Step 7 Left-click the chokepoint icon and drag it to the proper location.
The MAC address, name, and coverage range of the chokepoint appear in the dialog box in the left when you click the chokepoint icon for placement.
Step 8 Click Save.
You are returned to the floor map and the added chokepoint appears on the map.
Note The newly created chokepoint icon might or might not appear on the map depending on the display settings for that floor.
Note The rings around the chokepoint icon indicate the coverage area. When a CCX tag and its asset passes within the coverage area, location details are broadcast, and the tag is automatically mapped on the chokepoint coverage circle. When the tag moves out of the chokepoint range, its location is calculated as before and is no longer mapped on the chokepoint rings.
Note The MAC address, name, entry/exit chokepoint, static IP address, and range of the chokepoint appear when you hover your mouse cursor over its map icon.
Step 9 If the chokepoint does not appear on the map, select the Chokepoints check box located in the Floor Settings menu.
Note Do not click Save Settings unless you want to save this display criteria for all maps.
34-42Cisco Prime Infrastructure 3.0 Technology Package User Guide

Chapter 34 Using Wireless Maps Configuring Wi-Fi TDOA Receivers
You must synchronize the network design to the mobility services engine or location server to push chokepoint information.
Positioning Chokepoints
To position chokepoints on the map, follow these steps:
Step 1 Left-click the Chokepoint icon and drag it to the proper location.
The MAC address, name, and coverage range of the chokepoint appear in the dialog box in the left when you click the chokepoint icon for placement.
Step 2 Click Save when the icon is correctly placed on the map.
Step 3 The newly created chokepoint icon might or might not appear on the map depending on the display settings for that floor.
Note The rings around the chokepoint icon indicate the coverage area. When a Cisco-compatible Extensions tag and its asset passes within the coverage area, location details are broadcast, and the tag is automatically mapped on the chokepoint coverage circle. The chokepoint range is provided as a visual only, but chokepoint vendor software is required to actually configure the range. When the tag moves out of the chokepoint range, its location is calculated as before and is no longer mapped on the chokepoint rings.
Note The MAC address, name, and range of a chokepoint are displayed when you hover your mouse cursor over its map icon.
Step 4 If the chokepoint does not appear on the map, choose Layers to view a drop-down list of possible elements to display on the map. Select the Chokepoints check box.
Note Do not click Save Settings unless you want to save this display criteria for all maps.
Note You can change the position of chokepoints by importing or exporting a file.
Configuring Wi-Fi TDOA Receivers• Adding Wi-Fi TDOA Receivers to Prime Infrastructure
• Adding Wi-Fi TDOA Receivers to a Map
• Positioning Wi-Fi TDOA Receivers
• Managing RF Calibration Models
34-43Cisco Prime Infrastructure 3.0 Technology Package User Guide
Chapter 34 Using Wireless Maps Configuring Wi-Fi TDOA Receivers
• Managing Location Presence Information
Adding Wi-Fi TDOA Receivers to Prime Infrastructure
To add Wi-Fi TDOA receivers to the Prime Infrastructure database, follow these steps:
Step 1 Choose Configure > WiFi TDOA Receivers.
Step 2 From the Select a command drop-down list, choose Add WiFi TDOA Receivers.
Step 3 Click Go.
Step 4 Enter the MAC address, name, and static IP address for the Wi-Fi TDOA receiver.
Note Wi-Fi TDOA receivers are configured separately using the Wi-Fi TDOA receiver vendor software.
Step 5 Click OK to save the Wi-Fi TDOA receiver entry to the database.
After the Wi-Fi TDOA receiver is added to the database, place it on the appropriate Prime Infrastructure floor map. See the “Adding Wi-Fi TDOA Receivers to Prime Infrastructure” section on page 34-44 for more information.
Adding Wi-Fi TDOA Receivers to a Map
To add a WiFi TDOA receiver to a map, follow these steps:
Step 1 Choose Maps > Site Maps.
Step 2 Choose the link that corresponds to the floor location of the Wi-Fi TDOA receiver.
Step 3 From the Select a command drop-down list, choose Add WiFi TDOA Receivers.
Step 4 Click Go.
The Add WiFi TDOA Receivers summary page lists all recently added Wi-Fi TDOA receivers that are in the database but are not yet mapped.
Step 5 Select the check box next to the Wi-Fi TDOA receiver to be added to the map.
Step 6 Click OK.
A map appears with a green WiFi TDOA receiver icon located in the top left-hand corner. You are now ready to position the Wi-Fi TDOA receiver on the map.
Positioning Wi-Fi TDOA Receivers
To position Wi-Fi TDOA receivers on the map, follow these steps:
Step 1 Left-click the WiFi TDOA receiver icon and drag it to the proper location.
34-44Cisco Prime Infrastructure 3.0 Technology Package User Guide
Chapter 34 Using Wireless Maps Configuring Wi-Fi TDOA Receivers
The MAC address and name of the Wi-Fi TDOA receiver appear in the left pane when you click the WiFi TDOA receiver icon for placement.
Step 2 Click Save when the icon is correctly placed on the map.
The MAC address of the Wi-Fi TDOA receiver appears when you hover your mouse cursor over its map icon.
Step 3 If the chokepoint does not appear on the map, click Layers to view a drop-down list of possible elements to display on the map. Select the WiFi TDOA Receivers check box.
Note Do not select Save Settings unless you want to save this display criteria for all maps.
Note You can change the position of Wi-Fi TDOA Receivers by importing or exporting a file.
Related Topics
• Adding Wi-Fi TDOA Receivers to Prime Infrastructure
• Adding Wi-Fi TDOA Receivers to a Map
• Positioning Wi-Fi TDOA Receivers
Managing RF Calibration Models
If the provided RF models do not sufficiently characterize the floor layout, you can create a calibration model that is applied to the floor and better represents the attenuation characteristics of that floor. The calibration models are used as RF overlays with measured RF signal characteristics that can be applied to different floor areas. This enables the Cisco WLAN solution installation team to lay out one floor in a multi-floor area, use the RF calibration tool to measure, save the RF characteristics of that floor as a new calibration model, and apply that calibration model to all the other floors with the same physical layout.
You can collect data for a calibration using one of two methods:
• Point mode data collection—Calibration points are selected and their coverage area is calculated one location at a time.
• Linear mode data collection—A series of linear paths are selected and then calculated as you traverse the path. This approach is generally faster than the point mode data collection. You can also employ point mode data collection to augment data collection for locations missed by the linear paths.
Note Calibration models can only be applied to clients, rogue clients, and rogue access points. Calibration for tags is done using the Aeroscout System Manager. See the following URL for details on tag calibration at: http://support.aeroscout.com.
Note We recommend client device that supports both 802.11a/n and 802.11b/g/n radios to expedite the calibration process for both spectrums.
34-45Cisco Prime Infrastructure 3.0 Technology Package User Guide
Chapter 34 Using Wireless Maps Configuring Wi-Fi TDOA Receivers
Use a laptop or other wireless device to open a browser to Prime Infrastructure server and perform the calibration process.
• Accessing Current Calibration Models
• Applying Calibration Models to Maps
• Viewing Calibration Model Properties
• Viewing Calibration Model Details
• Creating New Calibration Models
• Starting Calibration Process
• Calibrating
• Apply the Model to the Floor
• Deleting Calibration Models
Accessing Current Calibration Models
To access current calibration models, follow these steps:
Step 1 Choose Maps > Site Maps.
Step 2 From the Select a command drop-down list, choose RF Calibration Models. The Model Name and Status for each calibration model are listed.
Step 3 Click the model name to access a specific calibration model.
Related Topics
• Accessing Current Calibration Models
• Applying Calibration Models to Maps
• Viewing Calibration Model Properties
• Viewing Calibration Model Details
• Creating New Calibration Models
• Starting Calibration Process
• Apply the Model to the Floor
• Deleting Calibration Models
Applying Calibration Models to Maps
To apply a current calibration model to a map, follow these steps:
Step 1 Choose Maps > Site Maps.
Step 2 From the Select a command drop-down list, choose RF Calibration Models.
Step 3 Click the model name to access the applicable calibration model.
Step 4 From the Select a command drop-down list, choose Apply to Maps.
34-46Cisco Prime Infrastructure 3.0 Technology Package User Guide

Chapter 34 Using Wireless Maps Configuring Wi-Fi TDOA Receivers
Step 5 Click Go.
Related Topics
• Accessing Current Calibration Models
• Viewing Calibration Model Properties
• Viewing Calibration Model Details
• Creating New Calibration Models
• Starting Calibration Process
• Apply the Model to the Floor
• Deleting Calibration Models
Viewing Calibration Model Properties
To view or edit current calibration models, follow these steps:
Step 1 Choose Maps > Site Maps.
Step 2 From the Select a command drop-down list, choose RF Calibration Models.
Step 3 Click the model name to access the applicable calibration model.
Step 4 From the Select a command drop-down list, choose Properties.
Step 5 Click Go to view or edit calibration model details. See the Viewing Calibration Model Properties for more information.
Related Topics
• Accessing Current Calibration Models
• Applying Calibration Models to Maps
• Viewing Calibration Model Details
• Creating New Calibration Models
• Starting Calibration Process
• Apply the Model to the Floor
• Deleting Calibration Models
Viewing Calibration Model Details
To edit calibration model details, follow these steps:
Step 1 Choose Maps > Site Maps.
Step 2 From the Select a command drop-down list, choose RF Calibration Models.
Step 3 Click the model name to access the applicable calibration model.
Step 4 From the Select a command drop-down list, choose Properties.
34-47Cisco Prime Infrastructure 3.0 Technology Package User Guide
Chapter 34 Using Wireless Maps Configuring Wi-Fi TDOA Receivers
Step 5 Click Go.
Step 6 The following parameters might be edited:
• Sweep Client Power for Location—Click to enable. You might want to enable this if a high density of access points exists and transmit power is reduced or unknown. The sweeping range of client transmit power might improve accuracy but scalability is negatively affected.
• HeatMap Binsize—Choose 4, 8, 16, or 32 from the drop-down list.
• HeatMap Cutoff—Determine the heatmap cutoff. We recommend a low heatmap cutoff especially if the access point density is high and RF propagation conditions are favorable. A higher cutoff value increases scalability but might cause difficulty when locating clients.
Step 7 When any necessary changes have been made or to exit the page, click OK.
Related Topics
• Accessing Current Calibration Models
• Applying Calibration Models to Maps
• Viewing Calibration Model Properties
• Creating New Calibration Models
• Starting Calibration Process
• Apply the Model to the Floor
• Deleting Calibration Models
Creating New Calibration Models
To create a new calibration model, follow these steps:
Step 1 Choose Maps > Site Maps.
Step 2 From the Select a command drop-down list, choose RF Calibration Models.
Step 3 Click Go.
Step 4 From the Select a command drop-down list, choose Create New Model.
Step 5 Click Go.
Step 6 Enter a model name, and click OK.
The new model appears along with the other RF calibration models with a status of Not Yet Calibrated.
Related Topics
• Accessing Current Calibration Models
• Applying Calibration Models to Maps
• Viewing Calibration Model Properties
• Viewing Calibration Model Details
• Starting Calibration Process
• Apply the Model to the Floor
34-48Cisco Prime Infrastructure 3.0 Technology Package User Guide

Chapter 34 Using Wireless Maps Configuring Wi-Fi TDOA Receivers
• Deleting Calibration Models
Starting Calibration Process
To start the calibration process, follow these steps:
Step 1 Click the model name to open the Calibration Model > Model Name page.
Step 2 From the Select a command drop-down list, choose Add Data Points.
Step 3 Click Go.
Step 4 Enter the MAC address of the device being used to perform the calibration. Manually-entered MAC addresses must be delimited with colons (such as FF:FF:FF:FF:FF:FF).
Note If this process is being performed from a mobile device connected to Prime Infrastructure through the Cisco Centralized architecture, the MAC address text box is automatically populated with the device address.
Step 5 Choose the appropriate campus, building, floor, or outdoor area where the calibration is performed.
Note The calibration in the outdoor area is supported in Release 1.0.x and later. You can use this option to add the calibration data points to the outdoor area. The data points can be added to the outdoor area using the same procedure for calibration.
Step 6 Click Next.
Step 7 When the chosen floor map and access point locations appear, a grid of plus marks (+) indicates the locations where data collection for calibration is performed.
Using these locations as guidelines, you can perform either a point or linear collection of data by appropriate placement of either the Calibration Point pop-up (point) or the Start and Finish pop-ups (linear) that appear on the map when the respective options are displayed.
If you want to perform a point collection of data for the calibration, do the following:
a. Choose Point from the Collection Method drop-down list and select the Show Data points check box if not already selected. A calibration point pop-up appears on the map.
b. Position the tip of the calibration point pop-up at a data point (+), and click Go. A dialog box appears showing the progress of the data collection.
Note Rotate the calibrating client laptop during data collection so that the client is heard evenly by all access points in the vicinity.
c. When the data collection is complete for a selected data point and the coverage area is plotted on the map, move the calibration point pop-up to another data point, and click Go.
Note The coverage area plotted on the map is color-coded and corresponds with the specific wireless LAN standard used to collect that data. Information on color-coding is provided in legend on the left side of the page. Additionally, the progress of the calibration process is indicated by two status bars above the legend, one for 802.11a/n and one for 802.11b/g/n.
34-49Cisco Prime Infrastructure 3.0 Technology Package User Guide
Chapter 34 Using Wireless Maps Configuring Wi-Fi TDOA Receivers
Note To delete data points for locations selected in error, click Delete and move the black square that appears over the appropriate data points. Resize the square as necessary by pressing Ctrl and moving the mouse.
d. Repeat point collection Steps a. to c. until the calibration status bar of the relevant spectrums (802.11a/n, 802.11b/g/n) display as ‘done.’
Note The calibration status bar indicates data collection for the calibration as done after roughly 50 distinct locations and 150 measurements have been gathered. For every location point saved in the calibration process, more than one data point is gathered. The progress of the calibration process is indicated by two status bars above the legend, one for 802.11b/g/n and one for 802.11a/n.
If you want to perform a linear collection of data for the calibration, do the following:
a. Choose Linear from the Collection Method drop-down list, and select the Show Data points check box if not already selected. A line appears on the map with both Start and Finish pop-ups.
b. Position the tip of the Start pop-up at the starting data point.
c. Position the Finish pop-up at the ending data point.
d. Position yourself with your laptop at the starting data point, and click Go. Walk steadily towards the end point along the defined path. A dialog box appears to show that data collection is in process.
Note Do not stop data collection until you reach the end point even if the data collection bar indicates completion.
Note Only Intel and Cisco adapters have been tested. Make sure Enable Cisco-compatible Extensions and Enable Radio Management Support are enabled in the Cisco-compatible Extension Options.
e. Press the space bar (or Done on the data collection panel) when you reach the end point. The collection pane displays the number of samples taken before it closes to reveal the map. The map displays all the coverage areas where data was collected.
Note To delete data points for locations selected in error, click Delete and move the black square that appears over the appropriate data points. Resize the square as necessary by pressing the Ctrl and moving the mouse.
Note The coverage area is color-coded and corresponds with the specific wireless LAN standard used to collect that data. Information on color-coding is provided in legend on the left-hand side of the page.
f. Repeat linear collection Steps b to e until the status bar for the respective spectrum is filled in (done).
34-50Cisco Prime Infrastructure 3.0 Technology Package User Guide
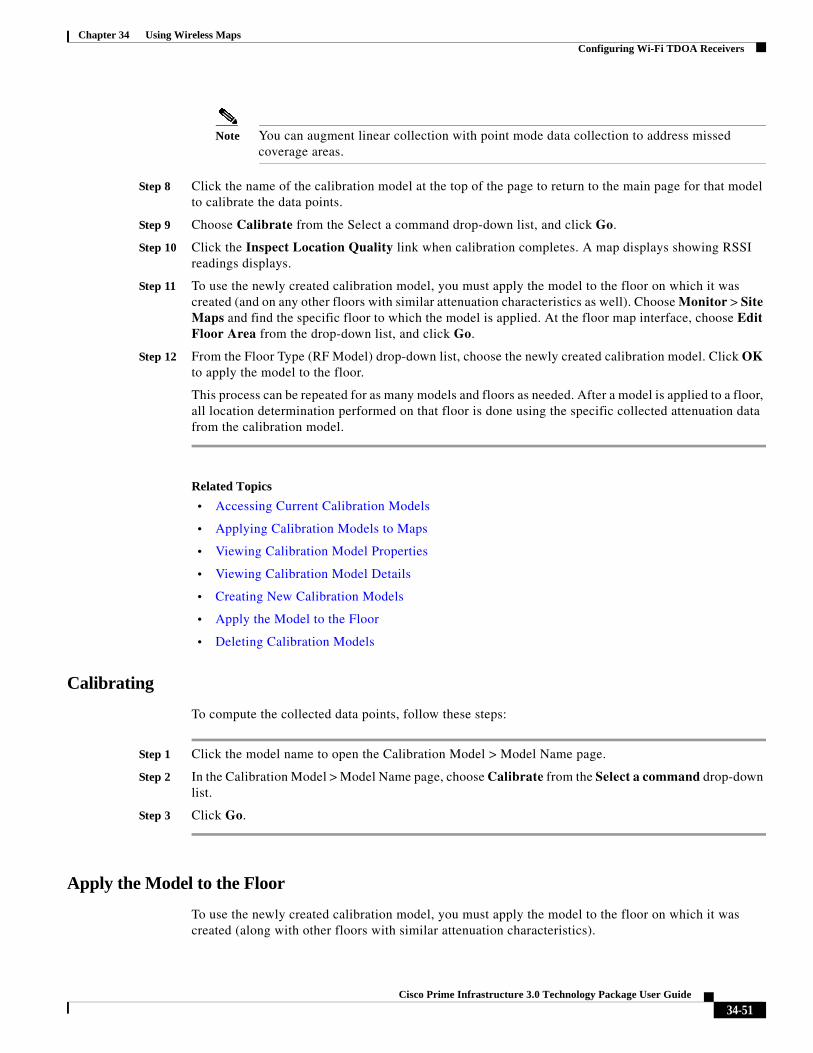
Chapter 34 Using Wireless Maps Configuring Wi-Fi TDOA Receivers
Note You can augment linear collection with point mode data collection to address missed coverage areas.
Step 8 Click the name of the calibration model at the top of the page to return to the main page for that model to calibrate the data points.
Step 9 Choose Calibrate from the Select a command drop-down list, and click Go.
Step 10 Click the Inspect Location Quality link when calibration completes. A map displays showing RSSI readings displays.
Step 11 To use the newly created calibration model, you must apply the model to the floor on which it was created (and on any other floors with similar attenuation characteristics as well). Choose Monitor > Site Maps and find the specific floor to which the model is applied. At the floor map interface, choose Edit Floor Area from the drop-down list, and click Go.
Step 12 From the Floor Type (RF Model) drop-down list, choose the newly created calibration model. Click OK to apply the model to the floor.
This process can be repeated for as many models and floors as needed. After a model is applied to a floor, all location determination performed on that floor is done using the specific collected attenuation data from the calibration model.
Related Topics
• Accessing Current Calibration Models
• Applying Calibration Models to Maps
• Viewing Calibration Model Properties
• Viewing Calibration Model Details
• Creating New Calibration Models
• Apply the Model to the Floor
• Deleting Calibration Models
Calibrating
To compute the collected data points, follow these steps:
Step 1 Click the model name to open the Calibration Model > Model Name page.
Step 2 In the Calibration Model > Model Name page, choose Calibrate from the Select a command drop-down list.
Step 3 Click Go.
Apply the Model to the Floor
To use the newly created calibration model, you must apply the model to the floor on which it was created (along with other floors with similar attenuation characteristics).
34-51Cisco Prime Infrastructure 3.0 Technology Package User Guide

Chapter 34 Using Wireless Maps Configuring Wi-Fi TDOA Receivers
To apply the model to the floor, follow these steps:
Step 1 Choose Maps > Site Maps.
Step 2 Locate the specific floor to which the model is applied.
Step 3 From the Select a command drop-down list, choose Edit Floor Area.
Step 4 Click Go.
Step 5 From the Floor Type (RF Model) drop-down list, choose the newly-created calibration model.
Step 6 Click OK to apply the model to the floor.
This process can be repeated for as many models and floors as needed. After a model is applied to a floor, all location determination performed on that floor is done using the specific collected attenuation data from the calibration model.
Related Topics
• Accessing Current Calibration Models
• Applying Calibration Models to Maps
• Viewing Calibration Model Properties
• Viewing Calibration Model Details
• Creating New Calibration Models
• Starting Calibration Process
• Deleting Calibration Models
Deleting Calibration Models
To delete a calibration model, follow these steps:
Step 1 Click the model name to open the Calibration Model > Model Name page.
Step 2 From the Select a command drop-down list, choose Delete Model.
Step 3 Click Go.
Related Topics
• Accessing Current Calibration Models
• Applying Calibration Models to Maps
• Viewing Calibration Model Properties
• Viewing Calibration Model Details
• Creating New Calibration Models
• Starting Calibration Process
• Apply the Model to the Floor
34-52Cisco Prime Infrastructure 3.0 Technology Package User Guide
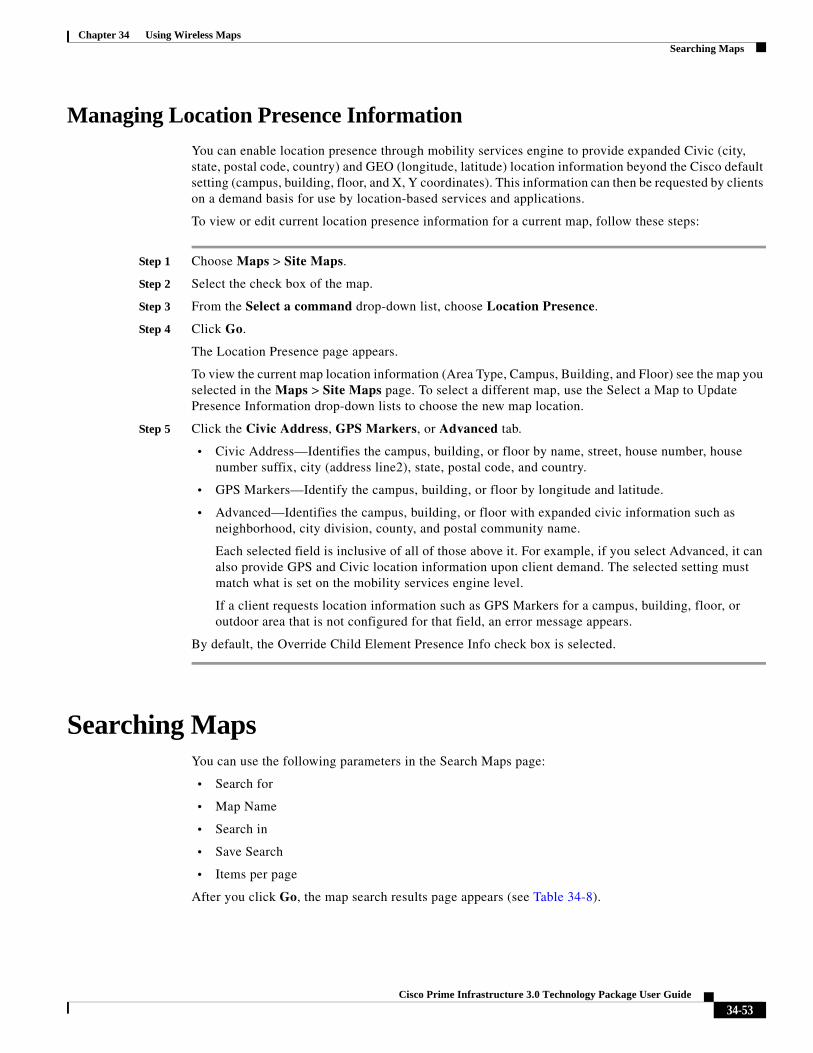
Chapter 34 Using Wireless Maps Searching Maps
Managing Location Presence Information
You can enable location presence through mobility services engine to provide expanded Civic (city, state, postal code, country) and GEO (longitude, latitude) location information beyond the Cisco default setting (campus, building, floor, and X, Y coordinates). This information can then be requested by clients on a demand basis for use by location-based services and applications.
To view or edit current location presence information for a current map, follow these steps:
Step 1 Choose Maps > Site Maps.
Step 2 Select the check box of the map.
Step 3 From the Select a command drop-down list, choose Location Presence.
Step 4 Click Go.
The Location Presence page appears.
To view the current map location information (Area Type, Campus, Building, and Floor) see the map you selected in the Maps > Site Maps page. To select a different map, use the Select a Map to Update Presence Information drop-down lists to choose the new map location.
Step 5 Click the Civic Address, GPS Markers, or Advanced tab.
• Civic Address—Identifies the campus, building, or floor by name, street, house number, house number suffix, city (address line2), state, postal code, and country.
• GPS Markers—Identify the campus, building, or floor by longitude and latitude.
• Advanced—Identifies the campus, building, or floor with expanded civic information such as neighborhood, city division, county, and postal community name.
Each selected field is inclusive of all of those above it. For example, if you select Advanced, it can also provide GPS and Civic location information upon client demand. The selected setting must match what is set on the mobility services engine level.
If a client requests location information such as GPS Markers for a campus, building, floor, or outdoor area that is not configured for that field, an error message appears.
By default, the Override Child Element Presence Info check box is selected.
Searching MapsYou can use the following parameters in the Search Maps page:
• Search for
• Map Name
• Search in
• Save Search
• Items per page
After you click Go, the map search results page appears (see Table 34-8).
34-53Cisco Prime Infrastructure 3.0 Technology Package User Guide
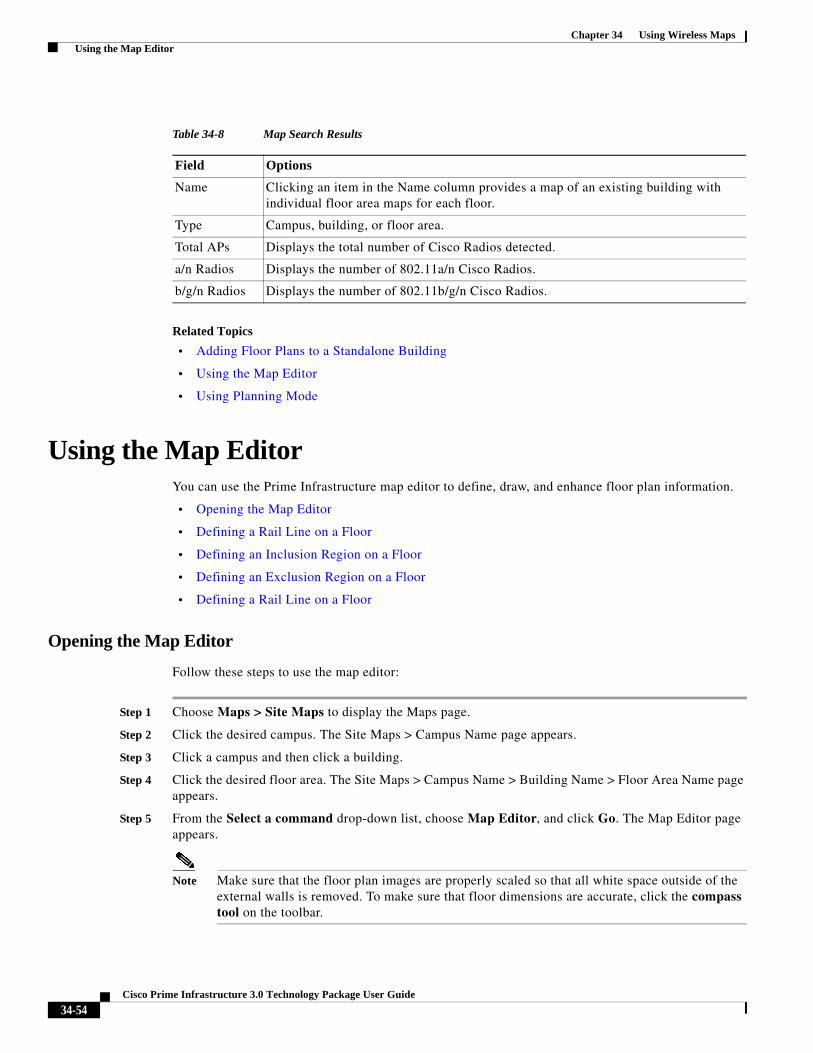
Chapter 34 Using Wireless Maps Using the Map Editor
Related Topics
• Adding Floor Plans to a Standalone Building
• Using the Map Editor
• Using Planning Mode
Using the Map EditorYou can use the Prime Infrastructure map editor to define, draw, and enhance floor plan information.
• Opening the Map Editor
• Defining a Rail Line on a Floor
• Defining an Inclusion Region on a Floor
• Defining an Exclusion Region on a Floor
• Defining a Rail Line on a Floor
Opening the Map Editor
Follow these steps to use the map editor:
Step 1 Choose Maps > Site Maps to display the Maps page.
Step 2 Click the desired campus. The Site Maps > Campus Name page appears.
Step 3 Click a campus and then click a building.
Step 4 Click the desired floor area. The Site Maps > Campus Name > Building Name > Floor Area Name page appears.
Step 5 From the Select a command drop-down list, choose Map Editor, and click Go. The Map Editor page appears.
Note Make sure that the floor plan images are properly scaled so that all white space outside of the external walls is removed. To make sure that floor dimensions are accurate, click the compass tool on the toolbar.
Table 34-8 Map Search Results
Field Options
Name Clicking an item in the Name column provides a map of an existing building with individual floor area maps for each floor.
Type Campus, building, or floor area.
Total APs Displays the total number of Cisco Radios detected.
a/n Radios Displays the number of 802.11a/n Cisco Radios.
b/g/n Radios Displays the number of 802.11b/g/n Cisco Radios.
34-54Cisco Prime Infrastructure 3.0 Technology Package User Guide
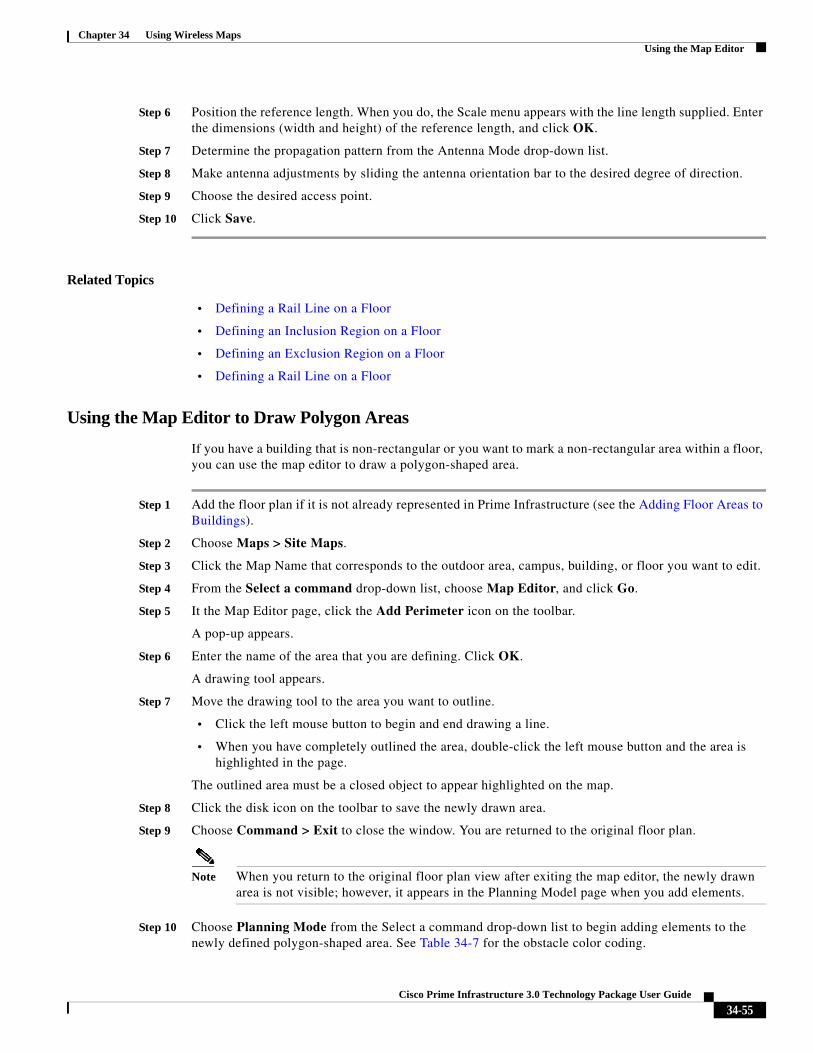
Chapter 34 Using Wireless Maps Using the Map Editor
Step 6 Position the reference length. When you do, the Scale menu appears with the line length supplied. Enter the dimensions (width and height) of the reference length, and click OK.
Step 7 Determine the propagation pattern from the Antenna Mode drop-down list.
Step 8 Make antenna adjustments by sliding the antenna orientation bar to the desired degree of direction.
Step 9 Choose the desired access point.
Step 10 Click Save.
Related Topics
• Defining a Rail Line on a Floor
• Defining an Inclusion Region on a Floor
• Defining an Exclusion Region on a Floor
• Defining a Rail Line on a Floor
Using the Map Editor to Draw Polygon Areas
If you have a building that is non-rectangular or you want to mark a non-rectangular area within a floor, you can use the map editor to draw a polygon-shaped area.
Step 1 Add the floor plan if it is not already represented in Prime Infrastructure (see the Adding Floor Areas to Buildings).
Step 2 Choose Maps > Site Maps.
Step 3 Click the Map Name that corresponds to the outdoor area, campus, building, or floor you want to edit.
Step 4 From the Select a command drop-down list, choose Map Editor, and click Go.
Step 5 It the Map Editor page, click the Add Perimeter icon on the toolbar.
A pop-up appears.
Step 6 Enter the name of the area that you are defining. Click OK.
A drawing tool appears.
Step 7 Move the drawing tool to the area you want to outline.
• Click the left mouse button to begin and end drawing a line.
• When you have completely outlined the area, double-click the left mouse button and the area is highlighted in the page.
The outlined area must be a closed object to appear highlighted on the map.
Step 8 Click the disk icon on the toolbar to save the newly drawn area.
Step 9 Choose Command > Exit to close the window. You are returned to the original floor plan.
Note When you return to the original floor plan view after exiting the map editor, the newly drawn area is not visible; however, it appears in the Planning Model page when you add elements.
Step 10 Choose Planning Mode from the Select a command drop-down list to begin adding elements to the newly defined polygon-shaped area. See Table 34-7 for the obstacle color coding.
34-55Cisco Prime Infrastructure 3.0 Technology Package User Guide
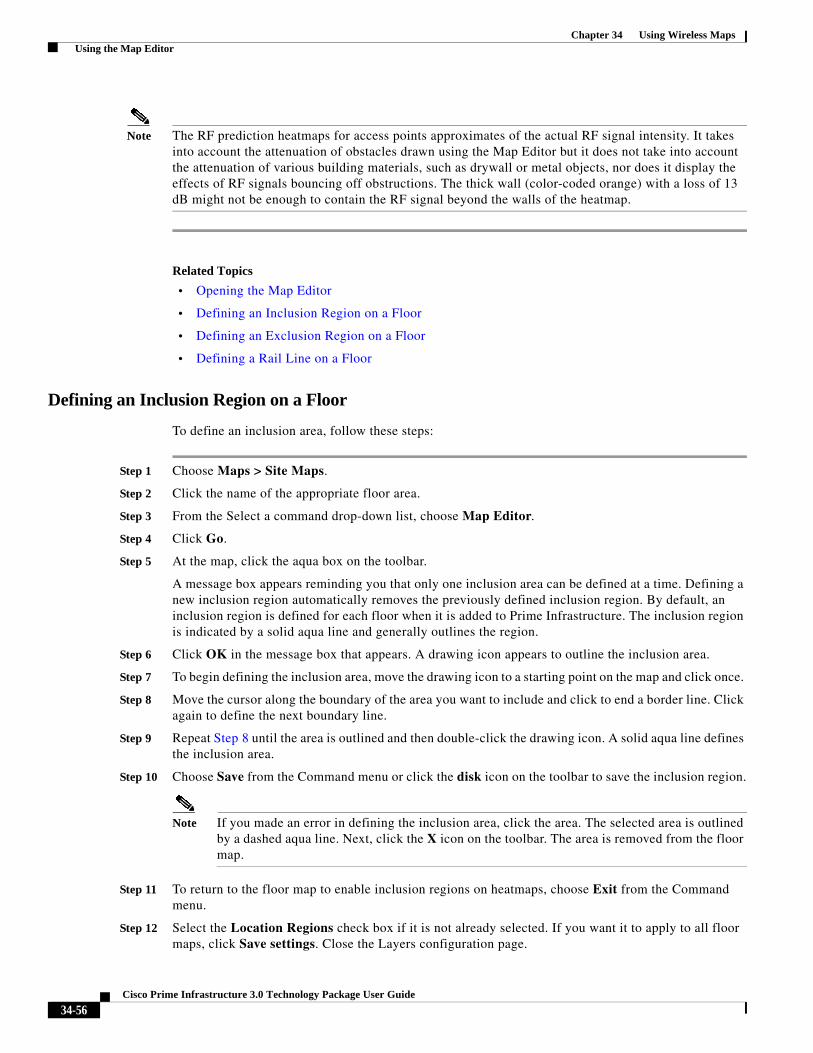
Chapter 34 Using Wireless Maps Using the Map Editor
Note The RF prediction heatmaps for access points approximates of the actual RF signal intensity. It takes into account the attenuation of obstacles drawn using the Map Editor but it does not take into account the attenuation of various building materials, such as drywall or metal objects, nor does it display the effects of RF signals bouncing off obstructions. The thick wall (color-coded orange) with a loss of 13 dB might not be enough to contain the RF signal beyond the walls of the heatmap.
Related Topics
• Opening the Map Editor
• Defining an Inclusion Region on a Floor
• Defining an Exclusion Region on a Floor
• Defining a Rail Line on a Floor
Defining an Inclusion Region on a Floor
To define an inclusion area, follow these steps:
Step 1 Choose Maps > Site Maps.
Step 2 Click the name of the appropriate floor area.
Step 3 From the Select a command drop-down list, choose Map Editor.
Step 4 Click Go.
Step 5 At the map, click the aqua box on the toolbar.
A message box appears reminding you that only one inclusion area can be defined at a time. Defining a new inclusion region automatically removes the previously defined inclusion region. By default, an inclusion region is defined for each floor when it is added to Prime Infrastructure. The inclusion region is indicated by a solid aqua line and generally outlines the region.
Step 6 Click OK in the message box that appears. A drawing icon appears to outline the inclusion area.
Step 7 To begin defining the inclusion area, move the drawing icon to a starting point on the map and click once.
Step 8 Move the cursor along the boundary of the area you want to include and click to end a border line. Click again to define the next boundary line.
Step 9 Repeat Step 8 until the area is outlined and then double-click the drawing icon. A solid aqua line defines the inclusion area.
Step 10 Choose Save from the Command menu or click the disk icon on the toolbar to save the inclusion region.
Note If you made an error in defining the inclusion area, click the area. The selected area is outlined by a dashed aqua line. Next, click the X icon on the toolbar. The area is removed from the floor map.
Step 11 To return to the floor map to enable inclusion regions on heatmaps, choose Exit from the Command menu.
Step 12 Select the Location Regions check box if it is not already selected. If you want it to apply to all floor maps, click Save settings. Close the Layers configuration page.
34-56Cisco Prime Infrastructure 3.0 Technology Package User Guide
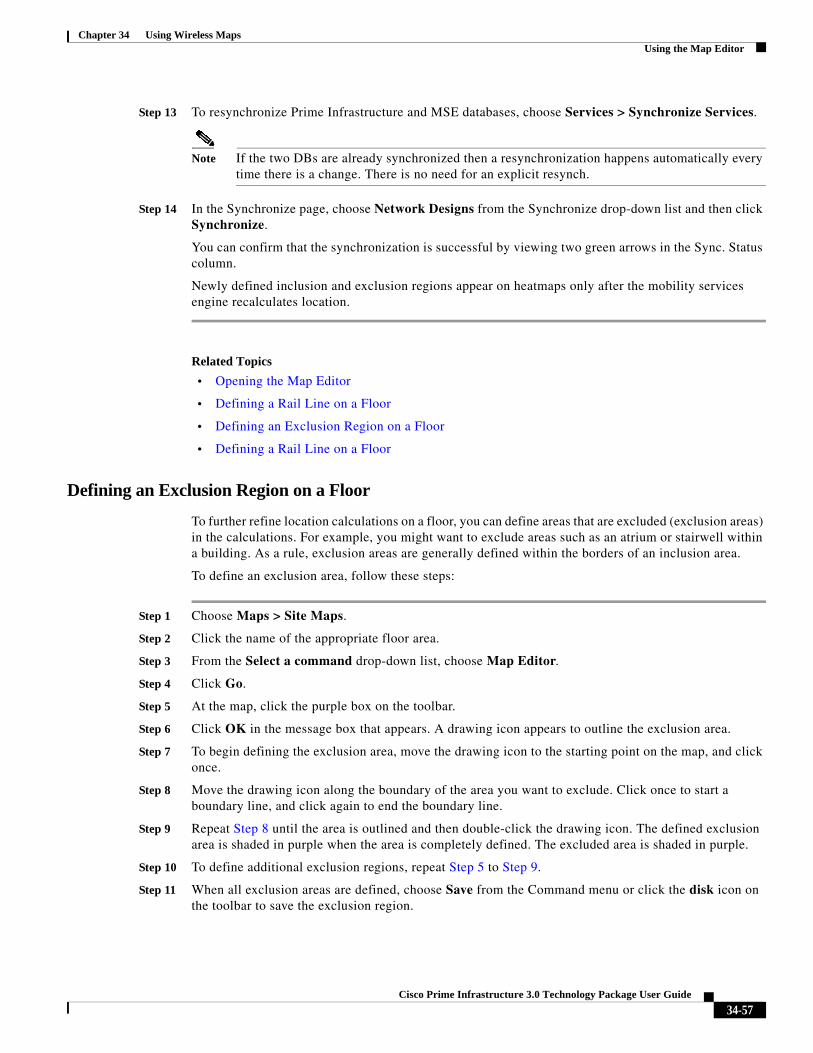
Chapter 34 Using Wireless Maps Using the Map Editor
Step 13 To resynchronize Prime Infrastructure and MSE databases, choose Services > Synchronize Services.
Note If the two DBs are already synchronized then a resynchronization happens automatically every time there is a change. There is no need for an explicit resynch.
Step 14 In the Synchronize page, choose Network Designs from the Synchronize drop-down list and then click Synchronize.
You can confirm that the synchronization is successful by viewing two green arrows in the Sync. Status column.
Newly defined inclusion and exclusion regions appear on heatmaps only after the mobility services engine recalculates location.
Related Topics
• Opening the Map Editor
• Defining a Rail Line on a Floor
• Defining an Exclusion Region on a Floor
• Defining a Rail Line on a Floor
Defining an Exclusion Region on a Floor
To further refine location calculations on a floor, you can define areas that are excluded (exclusion areas) in the calculations. For example, you might want to exclude areas such as an atrium or stairwell within a building. As a rule, exclusion areas are generally defined within the borders of an inclusion area.
To define an exclusion area, follow these steps:
Step 1 Choose Maps > Site Maps.
Step 2 Click the name of the appropriate floor area.
Step 3 From the Select a command drop-down list, choose Map Editor.
Step 4 Click Go.
Step 5 At the map, click the purple box on the toolbar.
Step 6 Click OK in the message box that appears. A drawing icon appears to outline the exclusion area.
Step 7 To begin defining the exclusion area, move the drawing icon to the starting point on the map, and click once.
Step 8 Move the drawing icon along the boundary of the area you want to exclude. Click once to start a boundary line, and click again to end the boundary line.
Step 9 Repeat Step 8 until the area is outlined and then double-click the drawing icon. The defined exclusion area is shaded in purple when the area is completely defined. The excluded area is shaded in purple.
Step 10 To define additional exclusion regions, repeat Step 5 to Step 9.
Step 11 When all exclusion areas are defined, choose Save from the Command menu or click the disk icon on the toolbar to save the exclusion region.
34-57Cisco Prime Infrastructure 3.0 Technology Package User Guide
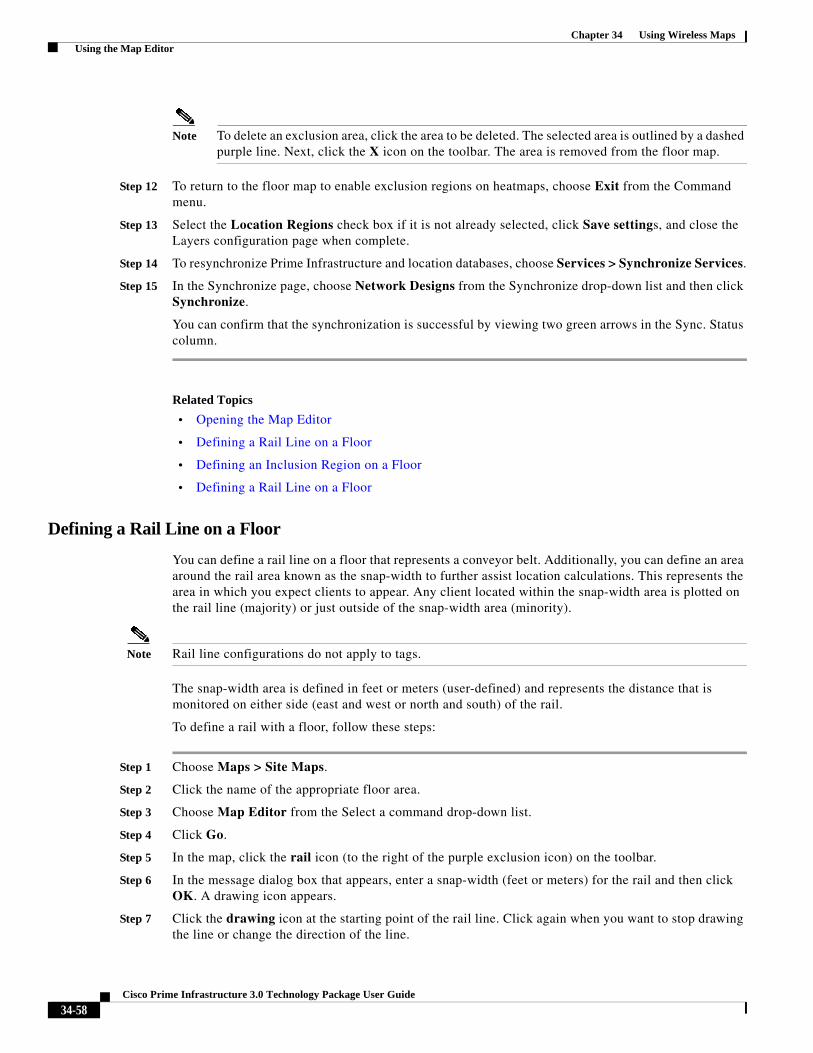
Chapter 34 Using Wireless Maps Using the Map Editor
Note To delete an exclusion area, click the area to be deleted. The selected area is outlined by a dashed purple line. Next, click the X icon on the toolbar. The area is removed from the floor map.
Step 12 To return to the floor map to enable exclusion regions on heatmaps, choose Exit from the Command menu.
Step 13 Select the Location Regions check box if it is not already selected, click Save settings, and close the Layers configuration page when complete.
Step 14 To resynchronize Prime Infrastructure and location databases, choose Services > Synchronize Services.
Step 15 In the Synchronize page, choose Network Designs from the Synchronize drop-down list and then click Synchronize.
You can confirm that the synchronization is successful by viewing two green arrows in the Sync. Status column.
Related Topics
• Opening the Map Editor
• Defining a Rail Line on a Floor
• Defining an Inclusion Region on a Floor
• Defining a Rail Line on a Floor
Defining a Rail Line on a Floor
You can define a rail line on a floor that represents a conveyor belt. Additionally, you can define an area around the rail area known as the snap-width to further assist location calculations. This represents the area in which you expect clients to appear. Any client located within the snap-width area is plotted on the rail line (majority) or just outside of the snap-width area (minority).
Note Rail line configurations do not apply to tags.
The snap-width area is defined in feet or meters (user-defined) and represents the distance that is monitored on either side (east and west or north and south) of the rail.
To define a rail with a floor, follow these steps:
Step 1 Choose Maps > Site Maps.
Step 2 Click the name of the appropriate floor area.
Step 3 Choose Map Editor from the Select a command drop-down list.
Step 4 Click Go.
Step 5 In the map, click the rail icon (to the right of the purple exclusion icon) on the toolbar.
Step 6 In the message dialog box that appears, enter a snap-width (feet or meters) for the rail and then click OK. A drawing icon appears.
Step 7 Click the drawing icon at the starting point of the rail line. Click again when you want to stop drawing the line or change the direction of the line.
34-58Cisco Prime Infrastructure 3.0 Technology Package User Guide

Chapter 34 Using Wireless Maps Inspecting Location Readiness and Quality
Step 8 Click the drawing icon twice when the rail line is completely drawn on the floor map. The rail line appears on the map and is bordered on either side by the defined snap-width region.
Note To delete a rail line, click the area to be deleted. The selected area is outlined by a dashed purple line. Next, click the X icon on the toolbar. The area is removed from the floor map.
Step 9 To return to the floor map to enable rails on heatmaps, choose Exit from the Command menu.
Step 10 At the floor map, choose the Layers drop-down list.
Step 11 Select the Rails check box for if it is not already selected, click Save settings, and close the Layers configuration panel when complete.
Step 12 To resynchronize Prime Infrastructure and mobility services engine, choose Services > Synchronize Services.
Step 13 In the Synchronize page, choose Network Designs from the Synchronize drop-down list and then click Synchronize.
You can confirm that the synchronization is successful by viewing two green arrows in the Sync. Status column.
Related Topics
• Opening the Map Editor
• Defining a Rail Line on a Floor
• Defining an Inclusion Region on a Floor
• Defining an Exclusion Region on a Floor
Inspecting Location Readiness and QualityYou can configure Prime Infrastructure to verify the ability of the existing access point deployment to estimate the true location of a client, rogue client, rogue access point, or tag within 10 meters at least 90% of the time. The location readiness calculation is based on the number and placement of access points.
You can also check the location quality and the ability of a given location to meet the location specification (10 m, 90%) based on data points gathered during a physical inspection and calibration.
Inspecting Location Readiness
The Inspect Location Readiness feature is a distance-based predictive tool that can point out problem areas with access point placement.
To access the Inspect Location Readiness tool, follow these steps:
Step 1 Choose Maps > Site Maps.
Step 2 Click the applicable floor area name to view the map.
34-59Cisco Prime Infrastructure 3.0 Technology Package User Guide

Chapter 34 Using Wireless Maps Inspecting Location Readiness and Quality
Note If RSSI is not displayed, you can enable AP Heatmaps by selecting the AP Heatmaps check box on the left sidebar menu.
Note If clients, tags, and access points are not displayed, verify that their respective check boxes are selected on the left sidebar menu. Licenses for both clients and tags must also be purchased for each to be tracked.
Step 3 From the Select a command drop-down list, choose Inspect Location Readiness.
Step 4 Click Go.
A color-coded map appears showing those areas that meet (indicated by Yes) and do not meet (indicated by No) the ten meter, 90% location specification.
Inspecting Location Quality Using Calibration Data
After completing a calibration model based on data points generated during a physical tour of the area, you can inspect the location quality of the access points.
To inspect location quality based on calibration, follow these steps:
Step 1 Choose Maps > Site Maps.
Step 2 Choose RF Calibration Model from the Select a command list. Click Go.
A list of calibration models appears.
Step 3 Click the appropriate calibration model.
Details on the calibration including date of last calibration, number of data points by signal type (802.11a, 802.11 b/g) used in the calibration, location, and coverage are displayed.
Step 4 In the same page, click the Inspect Location Quality link found under the Calibration Floors heading.
A color-coded map noting percentage of location errors appears.
Note You can modify the distance selected to see the effect on the location errors.
Related Topics
• Using Planning Mode
• Accessing Planning Mode
• Using Planning Mode to Calculate Access Point Requirements
34-60Cisco Prime Infrastructure 3.0 Technology Package User Guide

Chapter 34 Using Wireless Maps Inspecting Location Readiness and Quality
Inspecting VoWLAN Readiness
The VoWLAN Readiness (voice readiness) tool allows you to check the RF coverage to determine if it is sufficient for your voice needs. This tool verifies RSSI levels after access points have been installed.
To access the VoWLAN Readiness Tool (VRT), follow these steps:
Step 1 Choose Maps > Site Maps.
Step 2 Click the applicable floor area name.
Step 3 From the Select a command drop-down list, choose Inspect VoWLAN Readiness.
Step 4 Choose the applicable Band, AP Transmit Power, and Client parameters from the drop-down lists.
Note By default, the region map displays the b/g/n band for Cisco Phone-based RSSI threshold. The new settings cannot be saved.
Step 5 Depending on the selected client, the following RSSI values might not be editable:
• Cisco Phone—RSSI values are not editable.
• Custom—RSSI values are editable with the following ranges:
– Low threshold between -95dBm to -45dBm
– High threshold between -90dBm to -40dBm
Step 6 The following color schemes indicate whether or not the area is voice ready:
• Green—Yes
• Yellow—Marginal
• Red—No
Note The accuracy of the Green/Yellow/Red regions depends on the RF environment and whether or not the floor is calibrated. If the floor is calibrated, the accuracy of the regions is enhanced.
Troubleshooting Voice RF Coverage Issues
• Floors with either calibration or no calibration data are treated as follows:
– Set the AP Transmit field to Max (the maximum downlink power settings). If the map still shows some yellow or red regions, more access points are required to cover the floor.
– If the calibrated model shows red or yellow regions (where voice is expected to be deployed) with the AP Transmit field set to Current, increasing the power level of the access points might help.
34-61Cisco Prime Infrastructure 3.0 Technology Package User Guide

Chapter 34 Using Wireless Maps Monitoring Mesh Networks Using Maps
Monitoring Mesh Networks Using MapsYou can access and view details for the following elements from a mesh network map in Prime Infrastructure:
• Mesh Link Statistics
• Mesh Access Points
• Mesh Access Point Neighbors
Details on how this information is accessed and displayed for each of these items is detailed in this section.
• Monitoring Mesh Link Statistics Using Maps
• Monitoring Mesh Access Points Using Maps
• Monitoring Mesh Access Point Neighbors Using Maps
• Viewing the Mesh Network Hierarchy Using Maps
• Using Mesh Filters to Modify Map Display of Maps and Mesh Links
Monitoring Mesh Link Statistics Using Maps
You can view the SNR for a specific mesh network link, view the number of packets transmitted and received on that link, and initiate a link test in the Maps > Site Maps page.
To view details on a specific mesh link between two mesh access points or a mesh access point and a root access point, follow these steps:
Step 1 Choose Maps > Site Maps.
Step 2 Click the map name that corresponds to the outdoor area, campus, building, or floor you want to monitor.
Step 3 From the left sidebar menu, click the arrow to the right of AP Mesh Info. The Mesh Filter dialog box appears.
Step 4 Move the cursor over the colored dot next to each mesh access point child to view details on the link between it and its parent. Table 34-9 summarizes the parameters that appear.
The color of the dot also provides a quick reference point of the SNR strength as follows:
• A green dot represents a high SNR (above 25 dB).
• An amber dot represents an acceptable SNR (20-25 dB).
• A red dot represents a low SNR (below 20 dB).
• A black dot indicates a root access point.
The Bridging Link information appears.
Table 34-9 Bridging Link Information
Field Description
Information fetched on Date and time that information was compiled.
Link SNR Link signal-to-noise ratio (SNR).
Link Type Hierarchical link relationship.
34-62Cisco Prime Infrastructure 3.0 Technology Package User Guide
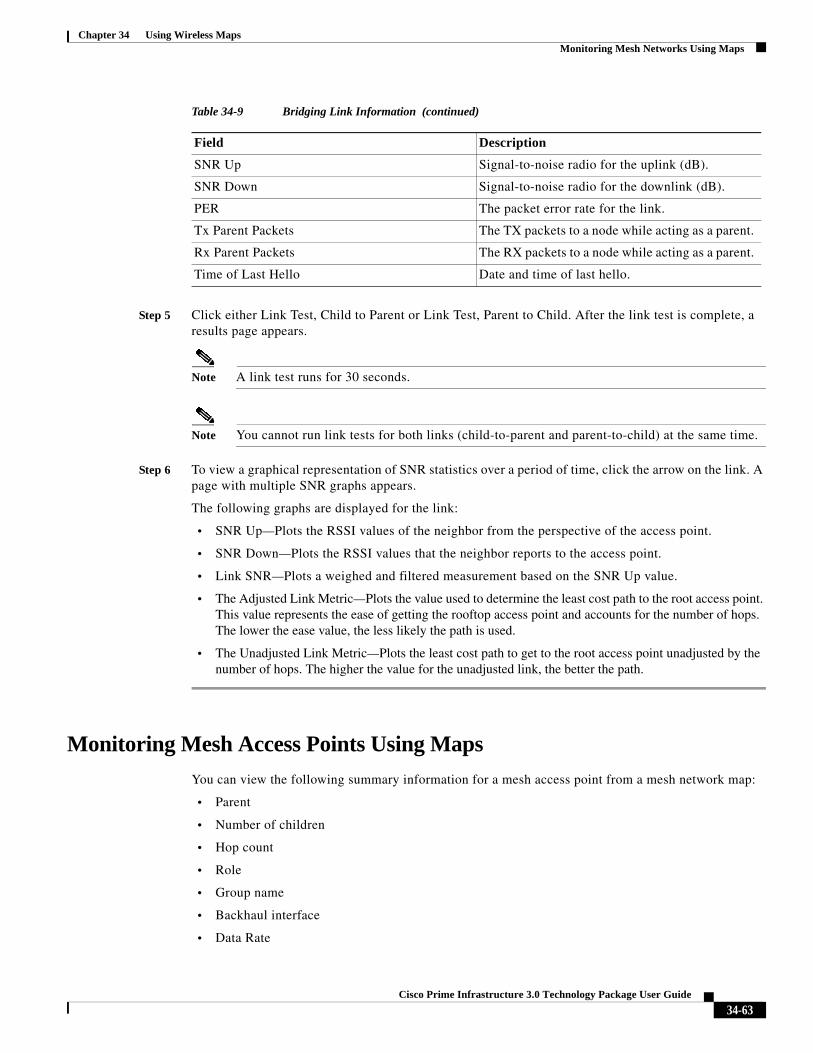
Chapter 34 Using Wireless Maps Monitoring Mesh Networks Using Maps
Step 5 Click either Link Test, Child to Parent or Link Test, Parent to Child. After the link test is complete, a results page appears.
Note A link test runs for 30 seconds.
Note You cannot run link tests for both links (child-to-parent and parent-to-child) at the same time.
Step 6 To view a graphical representation of SNR statistics over a period of time, click the arrow on the link. A page with multiple SNR graphs appears.
The following graphs are displayed for the link:
• SNR Up—Plots the RSSI values of the neighbor from the perspective of the access point.
• SNR Down—Plots the RSSI values that the neighbor reports to the access point.
• Link SNR—Plots a weighed and filtered measurement based on the SNR Up value.
• The Adjusted Link Metric—Plots the value used to determine the least cost path to the root access point. This value represents the ease of getting the rooftop access point and accounts for the number of hops. The lower the ease value, the less likely the path is used.
• The Unadjusted Link Metric—Plots the least cost path to get to the root access point unadjusted by the number of hops. The higher the value for the unadjusted link, the better the path.
Monitoring Mesh Access Points Using Maps
You can view the following summary information for a mesh access point from a mesh network map:
• Parent
• Number of children
• Hop count
• Role
• Group name
• Backhaul interface
• Data Rate
SNR Up Signal-to-noise radio for the uplink (dB).
SNR Down Signal-to-noise radio for the downlink (dB).
PER The packet error rate for the link.
Tx Parent Packets The TX packets to a node while acting as a parent.
Rx Parent Packets The RX packets to a node while acting as a parent.
Time of Last Hello Date and time of last hello.
Table 34-9 Bridging Link Information (continued)
Field Description
34-63Cisco Prime Infrastructure 3.0 Technology Package User Guide

Chapter 34 Using Wireless Maps Monitoring Mesh Networks Using Maps
• Channel
Note This information is in addition to the information shown for all access points (MAC address, access point model, controller IP address, location, height of access point, access point uptime, and LWAPP uptime).
You can also view detailed configuration, and access alarm, and event information from the map.
To view summary and detailed configuration information for a mesh access point from a mesh network map, follow these steps:
Step 1 Choose Maps > Site Maps.
Step 2 Click the map name that corresponds to the outdoor area, campus, building, or floor location of the access point you want to monitor.
Step 3 To view summary configuration information for an access point, hover your mouse cursor over the access point that you want to monitor. A dialog box with configuration information for the selected access point appears.
Step 4 To view detailed configuration information for an access point, double-click the access point appearing on the map. The configuration details for the access point appear.
Note For more details on the View Mesh Neighbors link in the access point dialog box, see the Monitoring Mesh Access Point Neighbors Using Maps. If the access point has an IP address, a Run Ping Test link is also visible at the bottom of the mesh access point dialog box.
Step 5 In the Access Point Details configuration page, follow these steps to view configuration details for the mesh access point:
a. Click the General tab to view the overall configuration of the mesh access point such as the AP name, MAC address, AP Up time, associated controllers (registered and primary) operational status, and software version.
Note The software version for mesh access points is appended with the letter m and the word mesh appears in parentheses.
b. Click the Interface tab to view configuration details for the interfaces supported on the mesh access point. Interface options are radio and Ethernet.
c. Click the Mesh Links tab to view parent and neighbor details (name, MAC address, packet error rate, and link details) for the mesh access point. You can also initiate link tests from this page.
d. Click the Mesh Statistics tab to view details on the bridging, queue, and security statistics for the mesh access point.
Monitoring Mesh Access Point Neighbors Using Maps
To view details on neighbors of a mesh access point from a mesh network map, follow these steps:
34-64Cisco Prime Infrastructure 3.0 Technology Package User Guide

Chapter 34 Using Wireless Maps Monitoring Mesh Networks Using Maps
Step 1 Choose Maps > Site Maps.
Step 2 Click the map name that corresponds to the outdoor area, campus, building, or floor you want to monitor.
Step 3 To view detailed information on mesh links for a mesh access point, click the arrow portion of the access point label. The Access Points page appears.
Step 4 Click the Mesh Links tab.
Note You can also view mesh link details for neighbors of a selected access point by clicking the View Mesh Neighbors link on the Mesh tab of the access point configuration summary dialog box, which appears when you hover your mouse cursor over an access point on a map.
Note Signal-to-noise (SNR) appears in the View Mesh Neighbors dialog box.
Note In addition to listing the current and past neighbors in the dialog box that appears, labels are added to the mesh access points map icons to identify the selected access point, the neighbor access point, and the child access point. Click the clear link of the selected access point to remove the relationship labels from the map.
Note The drop-down lists at the top of the mesh neighbors page indicate the resolution of the map (100%) displayed and how often the information displayed is updated (every 5 mins). You can modify these default values.
Viewing the Mesh Network Hierarchy
You can view the parent-child relationship of mesh access points within a mesh network in an easily navigable display. You can also filter which access points are displayed in the map view by selecting only access points of interest.
To view the mesh network hierarchy for a selected network, follow these steps:
Step 1 Choose Maps > Site Maps.
Step 2 Click the map name you want to display.
Step 3 Select the AP Mesh Info check box in the left sidebar menu if it is not already selected.
Note The AP Mesh Info check box is only selectable if mesh access points are present on the map. It must be selected to view the mesh hierarchy.
Step 4 Click the blue arrow to the right of the AP Mesh Info to display the Mesh Parent-Child Hierarchical View.
Step 5 Click the plus (+) sign next to a mesh access point to display its children.
34-65Cisco Prime Infrastructure 3.0 Technology Package User Guide

Chapter 34 Using Wireless Maps Monitoring Mesh Networks Using Maps
All subordinate mesh access points are displayed when a negative (-) sign appears next to the parent mesh access point entry. For example, the access point, indoor-mesh-45-rap2, has only one child, indoor-mesh-44-map2.
Step 6 Hover your mouse cursor over the colored dot next to each mesh access point child to view details on the link between it and its parent. Table 34-10 summarizes the parameters that appear.
The color of the dot also provides a quick reference point of the SNR strength:
• A green dot represents a high SNR (above 25 dB).
• An amber dot represents an acceptable SNR (20-25 dB).
• A red dot represents a low SNR (below 20 dB).
• A black dot indicates a root access point.
Using Mesh Filters to Modify Map Display of Maps and Mesh Links
In the mesh hierarchical page, you can also define mesh filters to determine which mesh access points display on the map based on hop values as well as what labels display for mesh links.
Mesh access points are filtered by the number of hops between them and their root access point.
To use mesh filtering, follow these steps:
Step 1 To modify what label and color displays for a mesh link, follow these steps:
a. In the Mesh Parent-Child Hierarchical View, choose an option from the Link Label drop-down list. Options are None, Link SNR, and Packet Error Rate.
b. In the Mesh Parent-Child Hierarchical View, choose an option from the Link Color drop-down list to define which parameter (Link SNR or Packet Error Rate) determines the color of the mesh link on the map.
Table 34-10 Bridging Link Information
Field Description
Information fetched on Date and time that information was compiled.
Link SNR Link signal-to-noise ratio (SNR).
Link Type Hierarchical link relationship.
SNR Up Signal-to-noise radio for the uplink (dB).
SNR Down Signal-to-noise radio for the downlink (dB).
PER The packet error rate for the link.
Tx Parent Packets The TX packets to a node while acting as a parent.
Rx Parent Packets The RX packets to a node while acting as a parent.
Time of Last Hello Date and time of last hello.
34-66Cisco Prime Infrastructure 3.0 Technology Package User Guide
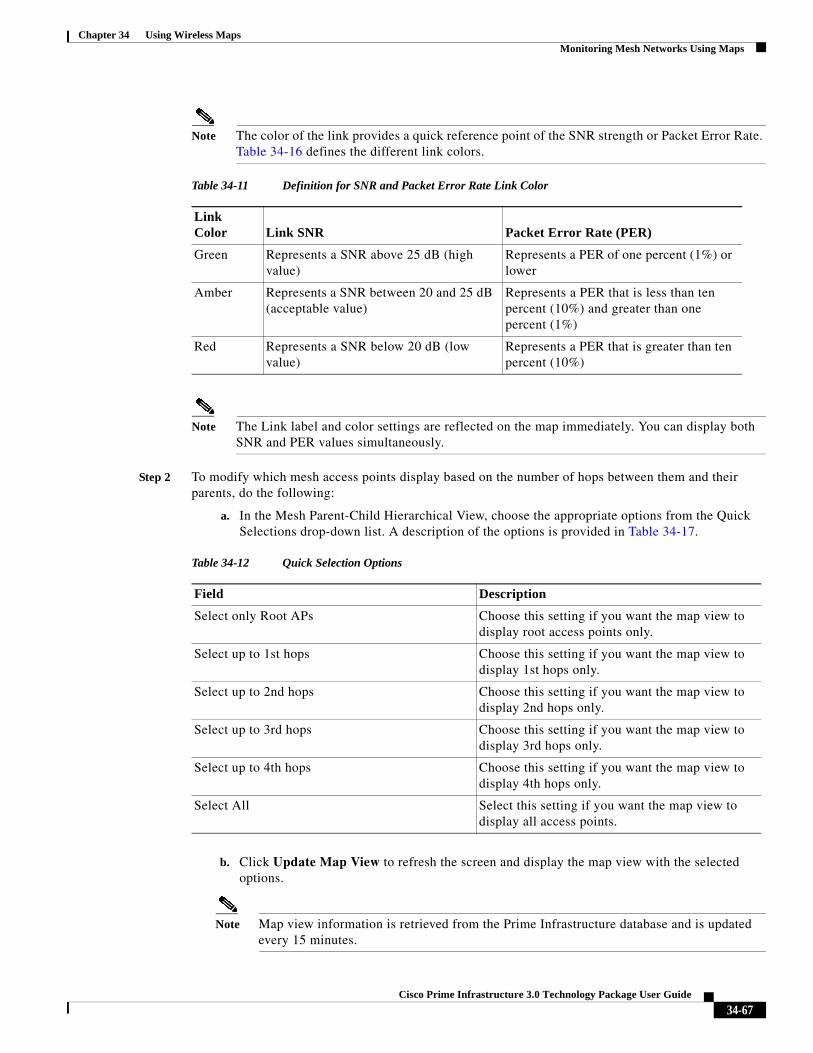
Chapter 34 Using Wireless Maps Monitoring Mesh Networks Using Maps
Note The color of the link provides a quick reference point of the SNR strength or Packet Error Rate. Table 34-16 defines the different link colors.
Note The Link label and color settings are reflected on the map immediately. You can display both SNR and PER values simultaneously.
Step 2 To modify which mesh access points display based on the number of hops between them and their parents, do the following:
a. In the Mesh Parent-Child Hierarchical View, choose the appropriate options from the Quick Selections drop-down list. A description of the options is provided in Table 34-17.
b. Click Update Map View to refresh the screen and display the map view with the selected options.
Note Map view information is retrieved from the Prime Infrastructure database and is updated every 15 minutes.
Table 34-11 Definition for SNR and Packet Error Rate Link Color
Link Color Link SNR Packet Error Rate (PER)
Green Represents a SNR above 25 dB (high value)
Represents a PER of one percent (1%) or lower
Amber Represents a SNR between 20 and 25 dB (acceptable value)
Represents a PER that is less than ten percent (10%) and greater than one percent (1%)
Red Represents a SNR below 20 dB (low value)
Represents a PER that is greater than ten percent (10%)
Table 34-12 Quick Selection Options
Field Description
Select only Root APs Choose this setting if you want the map view to display root access points only.
Select up to 1st hops Choose this setting if you want the map view to display 1st hops only.
Select up to 2nd hops Choose this setting if you want the map view to display 2nd hops only.
Select up to 3rd hops Choose this setting if you want the map view to display 3rd hops only.
Select up to 4th hops Choose this setting if you want the map view to display 4th hops only.
Select All Select this setting if you want the map view to display all access points.
34-67Cisco Prime Infrastructure 3.0 Technology Package User Guide
Chapter 34 Using Wireless Maps Monitoring Tags Using Maps
Note You can also select or unselect the check boxes of access points in the mesh hierarchical view to modify which mesh access points are displayed. For a child access point to be visible, the parent access point to root access point must be selected.
Note If you want to have the MAC address appear with the client logo in the Monitor > Site Maps page, follow these steps:a) Go to the Maps Tree View.b) Click the > beside Clients.c) Unselect the Small Icons check box.
Monitoring Tags Using MapsOn an Prime Infrastructure map, you can review the name of the access point that generated the signal for a tagged asset, its strength of signal and when the location information was last updated for the asset. This information is displayed by simply hovering the mouse cursor over the asset tag icon on the map.
To enable tag location status on a map, follow these steps:
Step 1 Choose Maps > Site Maps.
Step 2 Choose Campus > Building > Floor for the applicable mobility services engine and tag.
Step 3 Select the 802.11 Tags check box in the Floor Settings pane (left), if not already selected.
Note Do not click Save Settings unless you want to save changes made to the Floor Settings across all maps.
Step 4 Hover the mouse cursor over a tag icon (yellow tag) and a summary of its configuration appears in a dialog box.
Step 5 Click the tag icon to see tag details in a new window.
Using Planning ModeYou can calculate the recommended number and location of access points based on whether data and/or voice traffic and/or location are active.
Note Based on the throughput specified for each protocol (802.11a or 802.11 b/g), planning mode calculates the total number of access points required that would provide optimum coverage in your network.
34-68Cisco Prime Infrastructure 3.0 Technology Package User Guide

Chapter 34 Using Wireless Maps Using Planning Mode
Accessing Planning Mode
To access the Planning Mode feature, follow these steps:
Step 1 Choose Maps > Site Maps.
Step 2 Select the desired campus or building from the Name list.
Step 3 Click the desired floor area in the Building.
Step 4 From the Select a command drop-down list, choose Planning Mode.
Step 5 Click Go.
Note Planning mode does not use AP type or Antenna pattern information for calculating the number of access points required. The calculation is based on the access point coverage area or the number of users per access point.
Planning Mode options:
• Add APs—Enables you to add access points on a map. See the Using Planning Mode to Calculate Access Point Requirements for details.
• Delete APs—Deletes the selected access points.
• Map Editor—Opens the Map Editor window. See the Using the Map Editor for more details.
• Synchronize with Deployment—Synchronizes your planning mode access points with the current deployment scenario.
• Generate Proposal—View a planning summary of the current access points deployment.
• Planned AP Association Tool—Allows you to perform add, delete or import an AP Association from an excel or CSV file. Once an access point is defined, it can be associated to a base radio MAC address using the Planned AP Association Tool. If the AP is not discovered they get pushed into a standby bucket and get associated when discovered.
Note AP association is subjected to a limitation that AP should not belong to any floor or outdoor area. If the AP is already assigned to a floor or outdoor area, then the standby bucket holds the AP and when removed from the floor or outdoor, get positioned to the given floor. One Mac address cannot be put into bucket for multiple floor or outdoor areas.
Note The map synchronizations works only if the AP is associated to a base radio MAC address and not to its Ethernet MAC address.
Related Topics
• Using Planning Mode
• Using Planning Mode to Calculate Access Point Requirements
34-69Cisco Prime Infrastructure 3.0 Technology Package User Guide

Chapter 34 Using Wireless Maps Using Planning Mode
Using Planning Mode to Calculate Access Point Requirements
Prime Infrastructure planning mode enables you to calculate the number of access points required to cover an area by placing fictitious access points on a map and allowing you to view the coverage area. Based on the throughput specified for each protocol (802.11a/n or 802.11b/g/n), planning mode calculates the total number of access points required to provide optimum coverage in your network. You can calculate the recommended number and location of access points based on the following criteria:
• traffic type active on the network: data or voice traffic or both
• location accuracy requirements
• number of active users
• number of users per square footage
To calculate the recommended number and placement of access points for a given deployment, follow these steps:
Step 1 Choose Maps > Site Maps.
The Site Map page appears.
Step 2 Select the appropriate location link from the list that appears.
A color-coded map appears showing placement of all installed elements (access points, clients, tags) and their relative signal strength.
Step 3 Choose Planning Mode from the Select a command drop-down list (top-right), and click Go. A blank floor map appears.
Step 4 Click Add APs.
Step 5 In the page that appears, drag the dashed-line rectangle over the map location for which you want to calculate the recommended access points.
Note Adjust the size or placement of the rectangle by selecting the edge of the rectangle and holding down the Ctrl key. Move the mouse as necessary to outline the targeted location. When you use the next-generation maps mode, the rectangle is resizable by dragging on the handles on its edges and corners.
Step 6 Choose Automatic from the Add APs drop-down list.
Step 7 Choose the AP Type and the appropriate antenna and protocol for that access point.
Step 8 Choose the target throughput for the access point.
Step 9 Select the check box(es) next to the service(s) that is used on the floor. Options are Data/Coverage (default), Voice, Location, and Location with Monitor Mode APs. (see Table 34-18).
Note You must select at least one service or an error occurs.
Note If you select the Advanced Options check box, two additional access point planning options appear: Demand and Override Coverage per AP. Additionally, a Safety Margin field appears for the Data/Coverage and Voice safety margin options.
34-70Cisco Prime Infrastructure 3.0 Technology Package User Guide
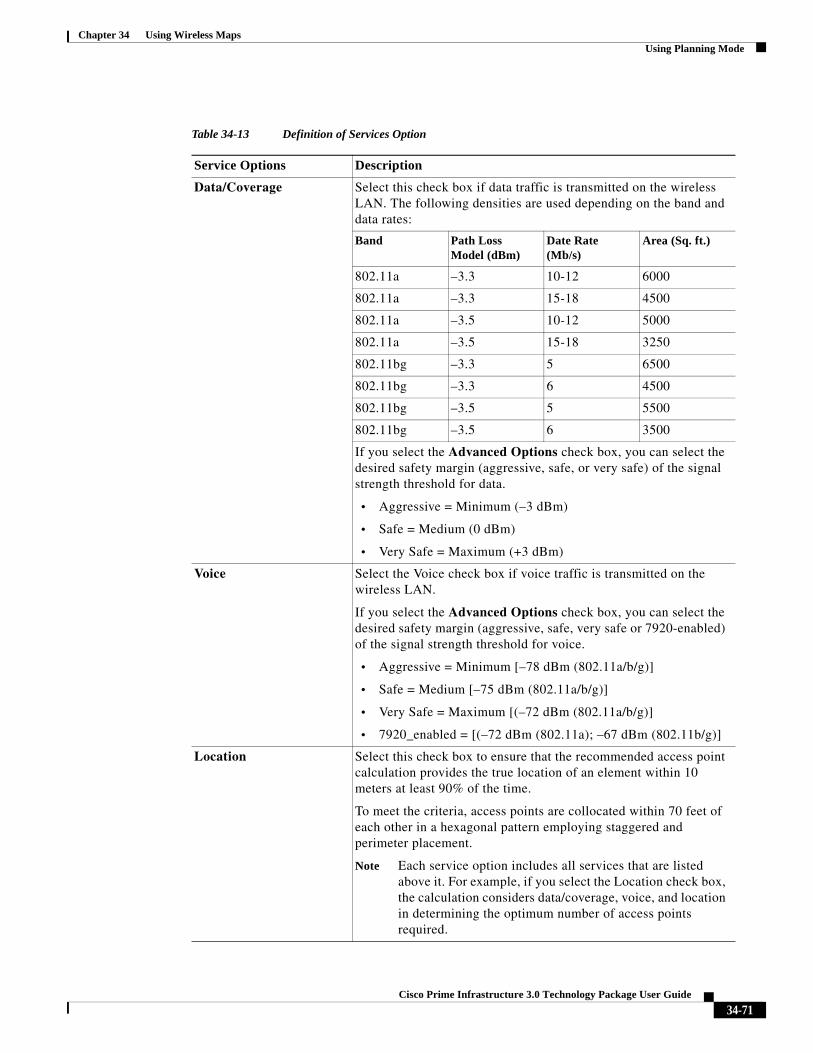
Chapter 34 Using Wireless Maps Using Planning Mode
Table 34-13 Definition of Services Option
Service Options Description
Data/Coverage Select this check box if data traffic is transmitted on the wireless LAN. The following densities are used depending on the band and data rates:
Band Path Loss Model (dBm)
Date Rate (Mb/s)
Area (Sq. ft.)
802.11a –3.3 10-12 6000
802.11a –3.3 15-18 4500
802.11a –3.5 10-12 5000
802.11a –3.5 15-18 3250
802.11bg –3.3 5 6500
802.11bg –3.3 6 4500
802.11bg –3.5 5 5500
802.11bg –3.5 6 3500
If you select the Advanced Options check box, you can select the desired safety margin (aggressive, safe, or very safe) of the signal strength threshold for data.
• Aggressive = Minimum (–3 dBm)
• Safe = Medium (0 dBm)
• Very Safe = Maximum (+3 dBm)
Voice Select the Voice check box if voice traffic is transmitted on the wireless LAN.
If you select the Advanced Options check box, you can select the desired safety margin (aggressive, safe, very safe or 7920-enabled) of the signal strength threshold for voice.
• Aggressive = Minimum [–78 dBm (802.11a/b/g)]
• Safe = Medium [–75 dBm (802.11a/b/g)]
• Very Safe = Maximum [(–72 dBm (802.11a/b/g)]
• 7920_enabled = [(–72 dBm (802.11a); –67 dBm (802.11b/g)]
Location Select this check box to ensure that the recommended access point calculation provides the true location of an element within 10 meters at least 90% of the time.
To meet the criteria, access points are collocated within 70 feet of each other in a hexagonal pattern employing staggered and perimeter placement.
Note Each service option includes all services that are listed above it. For example, if you select the Location check box, the calculation considers data/coverage, voice, and location in determining the optimum number of access points required.
34-71Cisco Prime Infrastructure 3.0 Technology Package User Guide
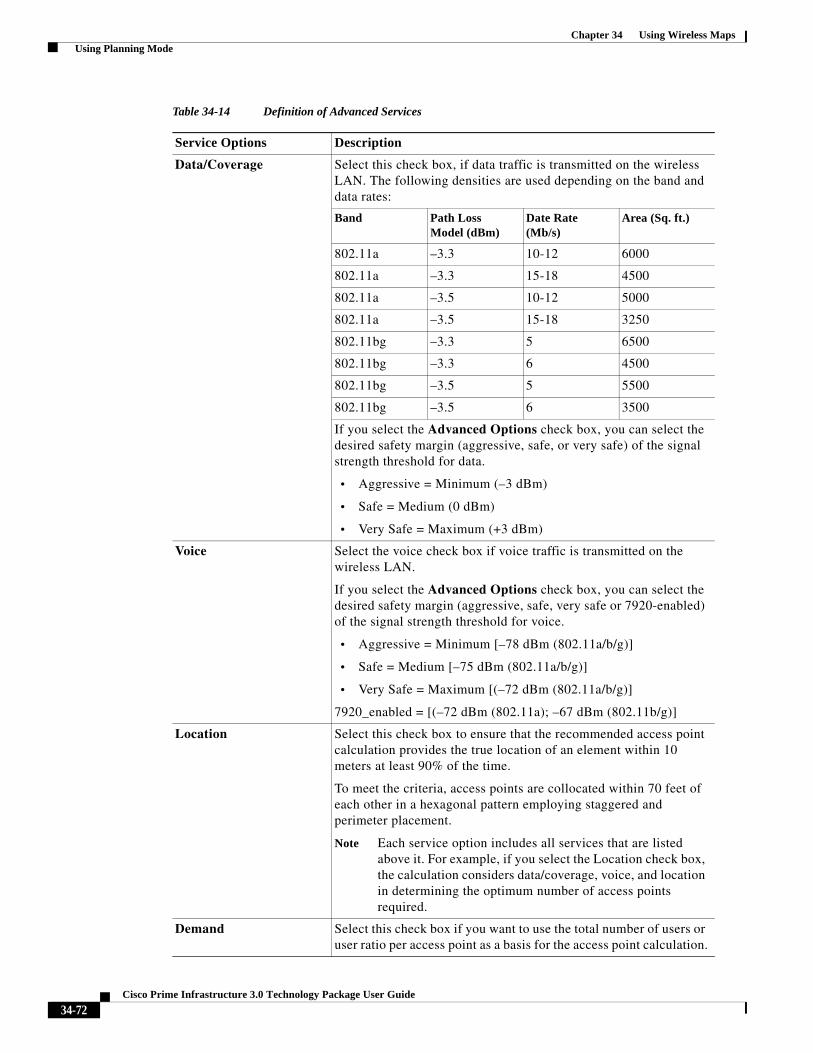
Chapter 34 Using Wireless Maps Using Planning Mode
Table 34-14 Definition of Advanced Services
Service Options Description
Data/Coverage Select this check box, if data traffic is transmitted on the wireless LAN. The following densities are used depending on the band and data rates:
Band Path Loss Model (dBm)
Date Rate (Mb/s)
Area (Sq. ft.)
802.11a –3.3 10-12 6000
802.11a –3.3 15-18 4500
802.11a –3.5 10-12 5000
802.11a –3.5 15-18 3250
802.11bg –3.3 5 6500
802.11bg –3.3 6 4500
802.11bg –3.5 5 5500
802.11bg –3.5 6 3500
If you select the Advanced Options check box, you can select the desired safety margin (aggressive, safe, or very safe) of the signal strength threshold for data.
• Aggressive = Minimum (–3 dBm)
• Safe = Medium (0 dBm)
• Very Safe = Maximum (+3 dBm)
Voice Select the voice check box if voice traffic is transmitted on the wireless LAN.
If you select the Advanced Options check box, you can select the desired safety margin (aggressive, safe, very safe or 7920-enabled) of the signal strength threshold for voice.
• Aggressive = Minimum [–78 dBm (802.11a/b/g)]
• Safe = Medium [–75 dBm (802.11a/b/g)]
• Very Safe = Maximum [(–72 dBm (802.11a/b/g)]
7920_enabled = [(–72 dBm (802.11a); –67 dBm (802.11b/g)]
Location Select this check box to ensure that the recommended access point calculation provides the true location of an element within 10 meters at least 90% of the time.
To meet the criteria, access points are collocated within 70 feet of each other in a hexagonal pattern employing staggered and perimeter placement.
Note Each service option includes all services that are listed above it. For example, if you select the Location check box, the calculation considers data/coverage, voice, and location in determining the optimum number of access points required.
Demand Select this check box if you want to use the total number of users or user ratio per access point as a basis for the access point calculation.
34-72Cisco Prime Infrastructure 3.0 Technology Package User Guide

Chapter 34 Using Wireless Maps Using Planning Mode
Step 10 Click Calculate.
The recommended number of access points given the selected services appears.
Note Recommended calculations assume the need for consistently strong signals unless adjusted downward by the safety margin advanced option. In some cases, the recommended number of access points is higher than what is required.
Note Walls are not used or accounted for in planning mode calculations.
Step 11 Click Apply to generate a map that shows proposed deployment of the recommended access points in the selected area based on the selected services and parameters.
Step 12 Choose Generate Proposal to display a textual and graphical report of the recommended access point number and deployment based on the given input.
Wireless Map Refresh Options
Prime Infrastructure provides various refresh options for wireless maps:
• Load—Refreshes map data from the Prime Infrastructure database on demand.
• Auto Refresh—Provides an interval drop-down list to set how often to refresh the map data from the database.
• Refresh from network—Refreshes the map status and statistics directly from the controller through an SNMP fetch rather than polled data from the Prime Infrastructure database.
If you have monitor mode access points on the floor plan, you have a choice between IDS or coverage heatmap types. A coverage heatmap excludes monitor mode access points, and an IDS heatmap includes them.
• Refresh browser—Refreshes the complete page, or refreshes the map and its status and statistics if you are on a map page.
Override Coverage per AP
Select this check box if you want to specify square foot coverage as the basis for access point coverage.
Safety Margin Select this check box to qualify relative signal strength requirements for data and voice service in the access point calculation. Options are: Aggressive, Safe, Very Safe, and 7920-enabled (voice only). Select Aggressive to require minimal signal strength requirements in the calculation and Very Safe to request the highest signal strength.
Table 34-14 Definition of Advanced Services (continued)
Service Options Description
34-73Cisco Prime Infrastructure 3.0 Technology Package User Guide
Chapter 34 Using Wireless Maps Using Planning Mode
Understanding RF Heatmap Calculation
A radio frequency heat map is a graphical representation of the strength of the RF signals. Because WLANs are very dynamic and nondeterministic in nature, administrators can never be certain of the coverage at a particular moment. To help combat this challenge, Prime Infrastructure provides a map of your floor plan along with visual cues as to the Wi-Fi coverage of the floor. These maps are called heatmaps because they are similar to the colored maps used to show varying levels of heat in oceanography or geographical sciences. Color is used to show the various levels of signal strength. The different shades in the “heatmap” reflect differing signal strengths.
This color visualization provides a quick view of the current state of coverage (without having to walk around measuring it), the signal strength, and any gaps or “holes” in the WLAN. This enhances the speed and ease with which you support your organization and troubleshoot specific problems.
The RF heatmap calculation is based on an internal grid. Depending on the exact positioning of an obstacle in that grid, the RF heatmap, within a few feet or meters of the obstacle, might or might not account for the obstacle attenuation. The RF prediction heatmaps for access points approximates of the actual RF signal intensity. It takes into account the attenuation of obstacles drawn using the Map Editor but it does not take into account the attenuation of various building materials, such as drywall or metal objects, nor does it display the effects of RF signals bouncing off obstructions. The thick wall (color-coded orange) with a loss of 13 dB might not be enough to contain the RF signal beyond the walls of the heatmap.
In detail, grid squares partially affected by an obstacle crossing the grid square might or might not incorporate the obstacle attenuation according to the geometry of the access point, obstacle, and grid.
For example, consider a wall crossing one grid square. The midpoint of the grid square is behind the wall from the AP, so the whole grid square is colored with attenuation, including (unfortunately) the top left corner that is actually in front of the wall.
The midpoint of the grid square is on the same side of the wall as the AP, so the whole grid square is not colored with attenuation, including (unfortunately) the bottom right corner that is actually behind the wall from the AP.
Dynamic Heatmap Calculation
The RF heatmap calculation can be static or dynamic. By default, it is dynamic. The main purpose of the dynamic heatmap feature is to recompute the RF heatmaps due to obstacles. The Prime Infrastructure server maintains a current list of all APs’ RSSI strengths. Prime Infrastructure uses neighboring APs’ RSSI strength to modify the RF heatmaps for all APs.
To configure static heatmap calculation, you must disable the dynamic heatmap option in the map properties page.
Drawing Polygon Areas in Wireless Maps
If you have a building that is non-rectangular or you want to mark a non-rectangular area within a floor, you can use the map editor to draw a polygon-shaped area.
Step 1 Choose Maps > Site Maps.
Step 2 Click the outdoor area, campus, building, or floor you want to edit.
Step 3 From the Select a command drop-down list, choose Map Editor, and click Go.
34-74Cisco Prime Infrastructure 3.0 Technology Package User Guide
Chapter 34 Using Wireless Maps Using Planning Mode
Step 4 On the Map Editor page, click the Add Perimeter icon.
Step 5 Enter the name of the area that you are defining, then click OK.
A drawing tool appears.
Step 6 Move the drawing tool to the area you want to outline.
• Click the left mouse button to begin and end drawing a line.
• When you have completely outlined the area, double-click the left mouse button and the area is highlighted in the page.
The outlined area must be a closed object to appear highlighted on the map.
Step 7 Click the disk icon to save the newly drawn area.
Step 8 Choose Command > Exit to close the window. You return to the original floor plan.
Note When you return to the original floor plan view after exiting the map editor, the newly drawn area is not visible; however, it appears in the Planning Model page when you add elements.
Step 9 Choose Planning Mode from the Select a command drop-down list to begin adding elements to the newly defined polygon-shaped area.
Floor View in Wireless Maps
The main Floor View navigation pane provides access to multiple map functions and includes the following functionality:
• Zoom In/Zoom Out—Click the magnifying glass icon with the plus sign (+) to enlarge the map view. Click the magnifying glass icon with the minus sign (-) to decrease the size of the map view.
• Map Size—See “Panning and Zooming with Next Generation Maps” in Related Topics.
• Show Grid—Click to show or hide the grid that displays distance in feet on the map.
• RSSI Legend—Hover your mouse cursor over the RSSI Legend icon to display the RSSI color scheme (ranging from red/-35 dBm to dark blue/-90 dBm).
• Add Access Points—Click to open the Add Access Points page. For more information, see “Adding Access Points to a Floor Area” in Related Topics.
• Remove Access Points—Click to open the Remove Access Points page. Select the access points that you want to remove and click OK.
• Position Access Points—Click to open the Position Access Points page.
• Add Chokepoints—Click to open the Add Chokepoints page. For more information, see the Cisco Context-Aware Services Configuration Guide.
• Add WiFi TDOA Receivers—Click to open the Add Wi-Fi TDOA Receivers page. For more information, see the Cisco Context-Aware Services Configuration Guide.
• Auto Refresh—From the drop-down list, choose the length of time between each system refresh.
• Refresh from Network—Click to initiate an immediate refresh of the current data.
• Planning Mode—Click to open the Planning Mode window. For more information, see “Using Planning Mode” in Related Topics.
34-75Cisco Prime Infrastructure 3.0 Technology Package User Guide

Chapter 34 Using Wireless Maps Associating Endpoints with a Site
• Map Editor—Click to open the Map Editor.
• Full Screen—Click to increase the size of the map to full screen. Once there, click Exit Full Screen to return to the normal view.
Related Topics
• Panning and Zooming with Next Generation Maps
• Adding Access Points to a Floor Area
• Using Planning Mode
Associating Endpoints with a SiteEndpoint-Site association rules allow you to associate all of the devices on particular subnet to a site, or location, and (optionally) to specify the monitoring data source for the devices on that subnet. This allows you to associate the logical structure of your network with your organizational sites, enabling troubleshooting using Prime Infrastructure’s multi-segment analysis features.
You can specify multiple rules for the same subnet, allowing you to (for example) specify multiple monitoring data sources.
To associate endpoints with a site:
Step 1 Choose Services > Application Visibility & Control > Endpoint Association.
Step 2 Click Add Row to add an Endpoint-Site association rule.
Step 3 Enter the required parameters in the following fields:
• From the Location Group drop-down list, select an existing campus to associate with this subnet. This field can be used to display the filter and search results.
• In the Subnet field, enter the routing prefix (and optional Data Source) of the subnetwork to be associated with this site. The entry must be in Classless Inter-Domain Routing notation.
• From the Data Source drop-down list, select the edge router or NAM monitoring traffic to and from the devices in the specified subnetwork.
Step 4 Click Save.
Viewing Google Earth Maps in Prime InfrastructureYou must have Google Earth installed on your computer and configured to auto-launch when data is sent from the server.
Step 1 Choose Maps > Google Earth. The Google Earth Maps page displays all folders and the number of access points included within each folder.
Step 2 Click Launch for the map you want to view. Google Earth opens in a separate page and displays the location and its access points.
34-76Cisco Prime Infrastructure 3.0 Technology Package User Guide
Chapter 34 Using Wireless Maps Creating Outdoor Locations using Geographical Coordinates
Related Topics
• Viewing Google Earth Map Details
• Creating Outdoor Locations using Geographical Coordinates
• Required Geographical Coordinates
• Creating a KML File with Geographical Coordinates
• Creating a CSV File with Geographical Coordinates
• Importing Geographical Coordinates Files into Prime Infrastructure
• Adding Google Earth Location Launch Points to Access Point Pages
• Configuring Google Earth Settings for Access Points
Viewing Google Earth Map Details
To view details for a Google Earth Map folder, follow these steps:
Step 1 Choose Maps > Google Earth.
Step 2 Click the folder name to open the details page for this folder. The Google Earth Details provide the access point names and MAC or IP addresses.
Step 3 To delete an access point, select the applicable check box and click Delete.
Step 4 To delete a folder, select the check box next to the folder name, then click Delete. Deleting a folder also deletes all subfolders and access points inside the folder.
Step 5 Click Cancel to close the details page.
Creating Outdoor Locations using Geographical Coordinates
To group access points together into outdoor locations, use the Latitude/Longitude geographical coordinates for each access point. You first need to create the required access point geographical coordinates, which you can then import into Prime Infrastructure. You can create either of the following file types to provide the coordinates:
• A KML (Google Keyhole Markup Language) File
• A CSV File (Spreadsheet format with comma-separated values)
Related Topics
• Required Geographical Coordinates
• Creating a KML File with Geographical Coordinates
• Creating a CSV File with Geographical Coordinates
• Importing Geographical Coordinates Files into Prime Infrastructure
34-77Cisco Prime Infrastructure 3.0 Technology Package User Guide
Chapter 34 Using Wireless Maps Creating Outdoor Locations using Geographical Coordinates
Required Geographical Coordinates
You must provide the following geographical information for each access point. You can create the geographical coordinates in Google Earth and then import them into Prime Infrastructure. If you add an AP to a Google Earth map without having the AP associated on a standard map, you will not see a heatmap when you view the AP in Google Earth.
• Longitude (East or West)—Angular distance in degrees relative to Prime Meridian. Values west of Meridian range from –180 to 0 degrees. Values east of Meridian range from 0 to 180 degrees. The default is 0.
Coordinates in degrees, minutes, seconds, direction:
– Degrees (–180 to 180)
– Minutes (0 to 59)
– Seconds (00.00 to 59.99)
– Direction—East or West (E, W)
Decimal format (converted from degrees, minutes, and seconds):
– Longitude can range from –179.59.59.99 W to 179.59.59.99 E
• Latitude (North or South)—Angular distance in degrees relative to the Equator. Values south of the Equator range from –90 to 0 degrees. Values north of the Equator range from 0 to 90 degrees. The default is 0.
Coordinates in degrees, minutes, seconds, direction:
– Degrees (–90 to 90)
– Minutes (0 to 59)
– Seconds (00.00 to 59.99)
– Direction—North or South (N, S)
Decimal format (converted from degrees, minutes, and seconds):
– Latitude can range from –89.59.59.99 S to 89.59.59.99 N
• Altitude—Height or distance of the access point from the surface of the earth in meters. If not provided, value defaults to 0. Values range from 0 to 99999.
• Tilt—Values range from 0 to 90 degrees (cannot be negative). A tilt value of 0 degrees indicates viewing from directly above the access point. A tilt value of 90 degrees indicates viewing along the horizon. Values range from 0 to 90. The default azimuth angle is 0.
• Range—Distance in meters from the point specified by longitude and latitude to the point where the access point is being viewed (the Look At position) (camera range above sea level). Values range from 0 to 999999.
• Heading—Compass direction in degrees. The default is 0 (North). Values range from 0 to ±180 degrees.
• Altitude Mode—Indicates how the <altitude> specified for the Look At point is interpreted.
– Clamped to ground—Ignores the <altitude> specification and places the Look At position on the ground. This is the default.
– Relative to ground—Interprets the <altitude> as a value in meters above the ground.
– Absolute—Interprets the <altitude> as a value in meters above sea level.
• Extend to ground—Indicates whether or not the access point is attached to a mast.
34-78Cisco Prime Infrastructure 3.0 Technology Package User Guide
Chapter 34 Using Wireless Maps Creating Outdoor Locations using Geographical Coordinates
Creating a KML File with Geographical Coordinates
You can create the geographical coordinates in Google Earth and then import them into Prime Infrastructure. You can create either a folder or individual placemarks. Creating a folder helps group all the Placemarks into a single folder and allows you to save the folder as a single KML (a.k.a. XML) file. KML is a file format used to display geographic data in Google Earth. If you create individual Placemarks, you must save each Placemark individually.
Using a KML file, folders can be created hierarchically to any depth. For example, you can create folders and placemarks organized by country, city, state, zip. In CSV files, there is one level of hierarchy only
Step 1 Launch Google Earth.
Step 2 In the Places page on the left sidebar menu, choose My Places or Temporary Places.
Step 3 Right-click Temporary Places and select Add > Folder from the drop-down lists.
Step 4 Enter the required information.
If you specify View coordinates (latitude, longitude, range, heading, and tilt), this information is used to “fly” or advance to the correct location when Google Earth is first loaded. If you do not specify View coordinates, the latitude and longitude information is derived using the minimum and maximum latitude and longitude of all access points within the specified group or folder.
Step 5 Click OK.
After the folder is created, you can select it from the Places page to create Placemarks.
Related Topics
• Creating Placemarks for KML Files
• Required Geographical Coordinates
Creating Placemarks for KML Files
To create Placemarks, follow these steps:
Step 1 Launch Google Earth.
Step 2 In the Places page on the left sidebar, select My Places or Temporary Places.
Step 3 Select the folder that you previously created.
Step 4 Right-click your created folder and select Add > Placemark from the drop-down lists.
Step 5 Complete the required fields. For more information regarding Google Earth, see to the Google Earth online help.
The Placemark name must contain the name, MAC address (the radio MAC not Ethernet MAC), or IP address of the appropriate access point.
Step 6 Click Snapshot current view or click Reset to return the coordinates to the original settings.
Step 7 Click OK.
Step 8 Repeat these steps for all placemarks you want to add.
34-79Cisco Prime Infrastructure 3.0 Technology Package User Guide

Chapter 34 Using Wireless Maps Creating Outdoor Locations using Geographical Coordinates
Step 9 When all placemarks are created, save the folder as a .kmz file (KML Zip file) or as a .kml file. You can import both .kmz and .kml files into Prime Infrastructure.
Related Topic
Required Geographical Coordinates
Creating a CSV File with Geographical Coordinates
You can create a CSV file that contains the required access point geographical coordinates, and then import the CSV file into Prime Infrastructure.
Step 1 Using a text editor, create a new file that provides the necessary fields, separated by commas, as described in Table 34-15.
Step 2 Save the file with a .csv file extension.
Related Topic
Required Geographical Coordinates
Table 34-15 Sample Fields for Geographical Coordinates CSV File
“FolderName” “Value Optional” Max Length: 32
“FolderState” “Value Optional” Permitted Values: true/false
“FolderLongitude” “Value Optional” Range: 0 to ±180
“FolderLatitude” “Value Optional” Range: 0 to ±90
“FolderAltitude” “Value Optional” Range: 0 to 99999
“FolderRange” “Value Optional” Range: 0 to 99999
“FolderTilt” “Value Optional” Range: 0 to 90
“FolderHeading” “Value Optional” Range: 0 to ±180
“FolderGeoAddress” “Value Optional” Max Length: 128
“FolderGeoCity” “Value Optional” Max Length: 64
“FolderGeoState” “Value Optional” Max Length: 40
“FolderGeoZip” “Value Optional” Max Length: 12
“FolderGeoCountry” “Value Optional” Max Length: 64
“AP_Name” “Value Required” Max Length: 32
“AP_Longitude” “Value Required” Range: 0 to ±180
“AP_Latitude” “Value Required” Range: 0 to ±90
34-80Cisco Prime Infrastructure 3.0 Technology Package User Guide

Chapter 34 Using Wireless Maps Creating Outdoor Locations using Geographical Coordinates
Importing Geographical Coordinates Files into Prime Infrastructure
To group access points together into outdoor locations, use the Latitude/Longitude geographical coordinates for each access point. You first need to create the required access point geographical coordinates, which you can then import into Prime Infrastructure. You can import either a Google KML or a CSV file containing access point geographical coordinates into Prime Infrastructure.
Step 1 Choose Maps > Google Earth.
Step 2 From the Select a command drop-down list, choose Import Google KML or Import CSV, then click Go.
Step 3 Navigate to the .kml, .kmz, or .csv file on your computer, then click Next.
The input file is parsed and validated for the following:
• Access points specified in the uploaded file are validated (the specified access points must be available within Prime Infrastructure).
• Range validations are performed for tilt, heading, range, and other geographical coordinates fields.If longitude and latitudeare provided, range validations are performed; if not, the value is defaulted to 0.
Step 4 After the files pass all validation checks, review the file details and click Save.
If the uploaded information was previously saved, the information is overwritten as follows:
• If the folder was uploaded previously, the coordinates are updated for the folder.
• If access points were uploaded previously, the coordinates are updated for the access points.
• Existing access points in the folder are not removed.
• New folders are created as needed and access points are placed accordingly.
Adding Google Earth Location Launch Points to Access Point Pages
You can expand the number of Google Earth Location launch points within Prime Infrastructure by adding launch points to the Access Point summary and detail pages.
Step 1 Choose Monitor > Wireless Technologies > Access Point Radios.
Step 2 In the Access Point summary page, click the Edit View link next to page heading.
Step 3 In the Edit View page, highlight Google Earth Location in the left-hand column, then click Show.
The Google Earth Location column heading moves into the View Information column.
Step 4 To change the display order of the columns, highlight the Google Earth Location entry and click the Up and Down buttons as needed, then click Submit.
You are returned to the Access Points summary page, and a Google Earth launch link appears. The launch link also appears in the general summary page of the Access Points details page (Monitor > Wireless Technologies > Access Point Radios > AP Name).
34-81Cisco Prime Infrastructure 3.0 Technology Package User Guide

Chapter 34 Using Wireless Maps Editing Wireless Maps
Configuring Google Earth Settings for Access Points
You can configure access point settings for the Google Earth Maps feature:
Step 1 Choose Maps > Google Earth.
Step 2 Configure the following parameters:
• Refresh Settings—Select the Refresh from Network check box to enable on-demand refresh. This option is applied only once and then disabled. Based on the number of access points in your network, the refresh can take a long period of time.
• Layers—Layer filters for access points, access point heat maps, and access point mesh information can be selected and saved. Select the check box to activate the applicable layer and click > to open the filter page. These settings apply when Google Earth sends the request for the next refresh.
– Access Points—From the AP Filter drop-down list, choose to display channels, Tx power level, coverage holes, MAC addresses, names, controller IP, utilization, profiles, or clients.
If the access point layer is not checked, no data is returned, and an error message is returned to Google Earth as a Placemark without an icon.
– AP Heatmap—From the Protocol drop-down list, choose 802.11a/n, 802.11b/g/n, 802.11a/n & 802.11b/g/n, or None. Select the cutoff from the RSSI Cutoff drop-down list (- 60 to - 90 dBm).
If you chose both 802.11a/n and 802.11b/g/n, the heat maps are generated for both and overlaid on top of each other. The order cannot be defined. To prevent this overlay, you must turn off individual overlay in Google Earth or change it in the Google Earth Settings in Prime Infrastructure.
– AP Mesh Info—Choose Link SNR, Packet Error Rate, or none. Choose Link SNR or Packet Error Rate from the Link Color drop-down list. When you select AP Mesh Info, Mesh Links are also automatically shown.
Step 3 Click Save Settings to confirm these changes or Cancel to close the page without saving the changes.
Editing Wireless Maps
Editing Floors
Editing Wireless MapsFollow these steps to use the wireless map editor:
34-82Cisco Prime Infrastructure 3.0 Technology Package User Guide

Chapter 34 Using Wireless Maps Location Accuracy
Step 1 Choose Maps > Site Maps.
Step 2 Select the desired campus, building and floor area.
Step 3 Click the desired floor area. The Site Maps > Campus Name > Building Name > Floor Area Name page appears.
Step 4 From the Select a command drop-down list, choose Map Editor, and click Go. The Map Editor page appears.
Make sure that the floor plan images are properly scaled so that all white space outside of the external walls is removed. To make sure that floor dimensions are accurate, click the compass tool.
Step 5 Position the reference length. The Scale menu appears with the line length supplied. Enter the dimensions (width and height) of the reference length, then click OK.
Step 6 Determine the propagation pattern from the Antenna Mode drop-down list.
Step 7 Make antenna adjustments by sliding the antenna orientation bar to the desired degree of direction.
Step 8 Choose the desired access point.
Step 9 Click Save.
Location AccuracyPrime Infrastructure allows you to check the location quality and the ability of a given location to meet the location specification (10 m, 90%) based on data points gathered during a physical inspection and calibration.
Related Topics
• Viewing Location Accuracy and Readiness
• Inspecting Location Quality Using Calibration Data
• Viewing VoWLAN Readiness
Viewing Location Accuracy and Readiness
You can configure Prime Infrastructure to verify the existing access point deployment to estimate the true location of a client, rogue client, rogue access point, or tag within 10 meters at least 90% of the time. The location readiness calculation is based on the number and placement of access points.
The Inspect Location Readiness feature is a distance-based predictive tool that can point out problem areas with access point placement.
To access the Inspect Location Readiness tool, follow these steps:
Step 1 Choose Maps > Site Maps.
Step 2 Click the applicable floor area name to view the map.
If RSSI is not displayed, you can enable AP Heatmaps by selecting the AP Heatmaps check box on the left sidebar menu.
34-83Cisco Prime Infrastructure 3.0 Technology Package User Guide
Chapter 34 Using Wireless Maps Location Accuracy
If clients, tags, and access points are not displayed, verify that their respective check boxes are selected on the left sidebar menu. Licenses for both clients and tags must be purchased for each to be tracked.
Step 3 From the Select a command drop-down list, choose Inspect Location Readiness.
Step 4 Click Go.
A color-coded map appears showing those areas that meet (indicated by Yes) and do not meet (indicated by No) the ten meter, 90% location specification.
Inspecting Location Quality Using Calibration Data
After completing a calibration model based on data points generated during a physical tour of the area, you can inspect the location quality of the access points based on calibration.
Step 1 Choose Maps > Site Maps.
Step 2 Choose RF Calibration Model from the Select a command list, then click Go.
A list of calibration models appears.
Step 3 Click the desired calibration model.
Step 4 Click the Inspect Location Quality link found under the Calibration Floors heading.
Prime Infrastructure displays a color-coded map noting percentage of location errors. You can modify the distance selected to see the effect on the location errors.
Viewing VoWLAN Readiness
The VoWLAN Readiness (voice readiness) Tool allows you to check the RF coverage to determine if it is sufficient for your voice needs. This tool verifies RSSI levels after access points have been installed.
Step 1 Choose Maps > Site Maps.
Step 2 Click the applicable floor area name.
Step 3 From the Select a command drop-down list, choose Inspect VoWLAN Readiness.
Step 4 Choose the applicable Band, AP Transmit Power, and Client parameters from the drop-down lists.
By default, the region map displays the b/g/n band for Cisco Phone-based RSSI threshold. The new settings cannot be saved.
Depending on the selected client, the following RSSI values might not be editable:
• Cisco Phone—RSSI values are not editable.
• Custom—RSSI values are editable with the following ranges:
– Low threshold between -95dBm to -45dBm
– High threshold between -90dBm to -40dBm
The following color schemes indicate whether or not the area is voice ready:
• Green—Yes
34-84Cisco Prime Infrastructure 3.0 Technology Package User Guide
Chapter 34 Using Wireless Maps Location Accuracy
• Yellow—Marginal
• Red—No
The accuracy of the Green/Yellow/Red regions depends on the RF environment and whether or not the floor is calibrated. If the floor is calibrated, the accuracy of the regions is enhanced.
Using Chokepoints to Enhance Tag Location Reporting
Adding Wi-Fi TDOA Receivers
Defining Inclusion Regions on Floors
To further refine locations on a floor, you can define the areas that are included (inclusion areas) and those areas that are not included (exclusion areas). For example, you might want to exclude areas such as an atrium or stairwell within a building, but include a work area (such as cubicles, labs, or manufacturing floors).
By default, Prime Infrastructure defines an inclusion region for each newly added floor. When you define a new inclusion region, any previously defined inclusion region is automatically removed. An inclusion region is indicated by a solid aqua line outlining the region.
To define an inclusion area, follow these steps:
Step 1 Choose Maps > Site Maps.
Step 2 Click the name of the appropriate floor area.
Step 3 From the Select a command drop-down list, choose Map Editor, then click Go.
Step 4 On the map, click the aqua box on the toolbar.
Step 5 Click OK in the message box that appears. A drawing icon appears to outline the inclusion area.
Step 6 To begin defining the inclusion area, move the drawing icon to a starting point on the map and click once.
Step 7 Move the cursor along the boundary of the area you want to include and click to end a border line. Click again to define the next boundary line.
Step 8 Repeat Step 7 until the area is outlined and then double-click the drawing icon. A solid aqua line defines the inclusion area.
Step 9 Choose Save from the Command menu or click the disk icon to save the inclusion region.
If you made an error defining the inclusion area, click the area. The selected area is outlined by a dashed aqua line. Next, click the X icon on the toolbar. The area is removed from the floor map.
Step 10 To return to the floor map to enable inclusion regions on heatmaps, choose Exit from the Command menu.
Step 11 Select the Location Regions check box if it is not already selected. To apply the changes to all floor maps, click Save settings.
34-85Cisco Prime Infrastructure 3.0 Technology Package User Guide

Chapter 34 Using Wireless Maps Location Accuracy
Step 12 To resynchronize Prime Infrastructure and MSE databases, choose Services > Synchronize Services. If the two DBs are already synchronized then a resynchronization happens automatically every time there is a change. There is no need for an explicit resynch.
Step 13 In the Synchronize page, choose Network Designs from the Synchronize drop-down list, then click Synchronize. You can confirm that the synchronization is successful by viewing two green arrows in the Sync Status column.
Newly defined inclusion and exclusion regions appear on heatmaps only after the mobility services engine recalculates location.
Defining Exclusion Regions on Floors
To further refine location calculations on a floor, you can define areas that are excluded (exclusion areas). For example, you might want to exclude areas such as an atrium or stairwell within a building. As a rule, exclusion areas are generally defined within the borders of an inclusion area.
To define an exclusion area, follow these steps:
Step 1 Choose Maps > Site Maps.
Step 2 Click the name of the appropriate floor area.
Step 3 From the Select a command drop-down list, choose Map Editor.
Step 4 Click Go.
Step 5 On the map, click the purple box on the toolbar.
Step 6 Click OK in the message box that appears. A drawing icon appears to outline the exclusion area.
Step 7 To begin defining the exclusion area, move the drawing icon to the starting point on the map, and click once.
Step 8 Move the drawing icon along the boundary of the area you want to exclude. Click once to start a boundary line, and click again to end the boundary line.
Step 9 Repeat Step 8 until the area is outlined and then double-click the drawing icon. The defined exclusion area is shaded in purple when the area is completely defined. The excluded area is shaded in purple.
Step 10 To define additional exclusion regions, repeat Step 5 to Step 9.
Step 11 When all exclusion areas are defined, choose Save from the Command menu or click the disk icon on the toolbar to save the exclusion region.
Step 12 To delete an exclusion area, click the area to be deleted. The selected area is outlined by a dashed purple line. Then click the X icon on the toolbar.
Step 13 To return to the floor map to enable exclusion regions on heatmaps, choose Exit from the Command menu.
Step 14 Select the Location Regions check box if it is not already selected, click Save settings, and close the Layers configuration page when complete.
Step 15 To resynchronize Prime Infrastructure and location databases, choose Services > Synchronize Services.
Step 16 In the Synchronize page, choose Network Designs from the Synchronize drop-down list, then click Synchronize.
34-86Cisco Prime Infrastructure 3.0 Technology Package User Guide
Chapter 34 Using Wireless Maps Using Maps to Monitor Your Network
You can confirm that the synchronization is successful by viewing two green arrows in the Sync. Status column.
Defining a Rail Line on a Floor
You can define a rail line on a floor that represents a conveyor belt. Additionally, you can define an area around the rail area known as the snap-width to further assist location calculations. This represents the area in which you expect clients to appear.
Any client located within the snap-width area is plotted on the rail line (majority) or just outside of the snap-width area (minority). The snap-width area is defined in feet or meters (user-defined) and represents the distance that is monitored on either side (east and west or north and south) of the rail.
Rail line configurations do not apply to tags.
Step 1 Choose Maps > Site Maps.
Step 2 Click the name of the appropriate floor area.
Step 3 Choose Map Editor from the Select a command drop-down list.
Step 4 Click Go.
Step 5 In the map, click the rail icon (to the right of the purple exclusion icon) on the toolbar.
Step 6 Enter a snap-width (feet or meters) for the rail and then click OK. A drawing icon appears.
Step 7 Click the drawing icon at the starting point of the rail line. Click again when you want to stop drawing the line or change the direction of the line.
Step 8 Click the drawing icon twice when the rail line is completely drawn on the floor map. The rail line appears on the map and is bordered on either side by the defined snap-width region.
Step 9 To delete a rail line, click the area to be deleted. The selected area is outlined by a dashed purple line. Then, click the X icon on the toolbar.
Step 10 To return to the floor map to enable rails on heatmaps, choose Exit from the Command menu.
Step 11 On the floor map, choose the Layers drop-down list.
Step 12 Select the Rails check box if it is not already selected, then click Save settings.
Step 13 To resynchronize Prime Infrastructure and mobility services engine, choose Services > Synchronize Services.
Step 14 In the Synchronize page, choose Network Designs from the Synchronize drop-down list and then click Synchronize.
You can confirm that the synchronization is successful by viewing two green arrows in the Sync. Status column.
Using Maps to Monitor Your Network
34-87Cisco Prime Infrastructure 3.0 Technology Package User Guide

Chapter 34 Using Wireless Maps Using Maps to Monitor Your Network
Monitoring Mesh Networks Using Maps
Prime Infrastructure allows you to access and view details for the following elements from a mesh network map:
• Mesh Link Statistics
• Mesh Access Points
• Mesh Access Point Neighbors
Monitoring Mesh Link Statistics Using Maps
You can view the signal-to-noise ratio (SNR) for a specific mesh network link, view the number of packets transmitted and received on that link, and initiate a link test in the Maps > Wireless Maps > Site Maps page.
To view details on a specific mesh link between two mesh access points or a mesh access point and a root access point, follow these steps:
Step 1 Choose Maps > Site Maps.
Step 2 Click the map name that corresponds to the outdoor area, campus, building, or floor you want to monitor.
Step 3 From the left sidebar menu, click the arrow to the right of AP Mesh Info. The Mesh Filter dialog box appears.
Step 4 Move the cursor over the colored dot next to each mesh access point child to view details on the link between it and its parent.
The color of the dot provides a quick-reference indicator of the SNR strength, as follows:
• A green dot represents a high SNR (above 25 dB).
• An amber dot represents an acceptable SNR (20-25 dB).
• A red dot represents a low SNR (below 20 dB).
• A black dot indicates a root access point.
Step 5 Click on a link test. You cannot run link tests for both links (child-to-parent and parent-to-child) at the same time.
The link test takes 30 seconds to complete.
Step 6 To view a graphical representation of SNR statistics over a period of time, click the arrow on the link. The following graphs are displayed for the link:
• SNR Up—Plots the RSSI values of the neighbor from the perspective of the access point.
• SNR Down—Plots the RSSI values that the neighbor reports to the access point.
• Link SNR—Plots a weighed and filtered measurement based on the SNR Up value.
• The Adjusted Link Metric—Plots the value used to determine the least cost path to the root access point. This value represents the ease of getting the rooftop access point and accounts for the number of hops. The lower the ease value, the less likely the path is used.
• The Unadjusted Link Metric—Plots the least cost path to get to the root access point unadjusted by the number of hops. The higher the value for the unadjusted link, the better the path.
34-88Cisco Prime Infrastructure 3.0 Technology Package User Guide
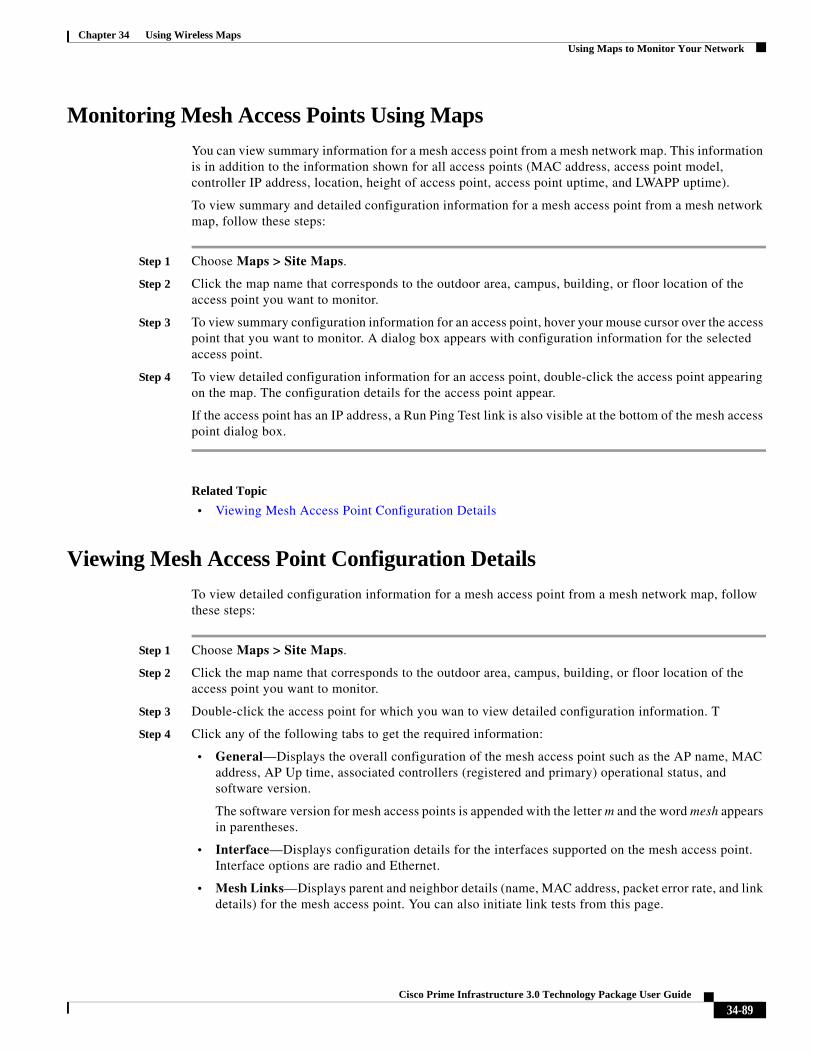
Chapter 34 Using Wireless Maps Using Maps to Monitor Your Network
Monitoring Mesh Access Points Using Maps
You can view summary information for a mesh access point from a mesh network map. This information is in addition to the information shown for all access points (MAC address, access point model, controller IP address, location, height of access point, access point uptime, and LWAPP uptime).
To view summary and detailed configuration information for a mesh access point from a mesh network map, follow these steps:
Step 1 Choose Maps > Site Maps.
Step 2 Click the map name that corresponds to the outdoor area, campus, building, or floor location of the access point you want to monitor.
Step 3 To view summary configuration information for an access point, hover your mouse cursor over the access point that you want to monitor. A dialog box appears with configuration information for the selected access point.
Step 4 To view detailed configuration information for an access point, double-click the access point appearing on the map. The configuration details for the access point appear.
If the access point has an IP address, a Run Ping Test link is also visible at the bottom of the mesh access point dialog box.
Related Topic
• Viewing Mesh Access Point Configuration Details
Viewing Mesh Access Point Configuration Details
To view detailed configuration information for a mesh access point from a mesh network map, follow these steps:
Step 1 Choose Maps > Site Maps.
Step 2 Click the map name that corresponds to the outdoor area, campus, building, or floor location of the access point you want to monitor.
Step 3 Double-click the access point for which you wan to view detailed configuration information. T
Step 4 Click any of the following tabs to get the required information:
• General—Displays the overall configuration of the mesh access point such as the AP name, MAC address, AP Up time, associated controllers (registered and primary) operational status, and software version.
The software version for mesh access points is appended with the letter m and the word mesh appears in parentheses.
• Interface—Displays configuration details for the interfaces supported on the mesh access point. Interface options are radio and Ethernet.
• Mesh Links—Displays parent and neighbor details (name, MAC address, packet error rate, and link details) for the mesh access point. You can also initiate link tests from this page.
34-89Cisco Prime Infrastructure 3.0 Technology Package User Guide

Chapter 34 Using Wireless Maps Using Maps to Monitor Your Network
• Mesh Statistics—Displays details on the bridging, queue, and security statistics for the mesh access point.
Related Topic
• Monitoring Mesh Access Point Neighbors Using Maps
Monitoring Mesh Access Point Neighbors Using Maps
To view details on neighbors of a mesh access point from a mesh network map, follow these steps:
Step 1 Choose Maps > Site Maps.
Step 2 Click the map name that corresponds to the outdoor area, campus, building, or floor you want to monitor.
Step 3 To view detailed information on mesh links for a mesh access point, click the arrow portion of the access point label. The Access Points page appears.
Step 4 Click the Mesh Links tab.
Step 5 To view mesh link details for neighbors of a selected access point, click View Mesh Neighbors on the Mesh tab of the access point configuration summary dialog box, which appears when you hover your mouse cursor over an access point on a map.
Signal-to-noise (SNR) appears in the View Mesh Neighbors dialog box.
Labels identify the selected access point, the neighbor access point, and the child access point.
Step 6 To remove the relationship labels from the map, click the clear link of the selected access point.
The drop-down lists at the top of the mesh neighbors page indicate the resolution of the map (100%) displayed and how often the information displayed is updated (every 5 mins).
Viewing the Mesh Network Hierarchy Using Maps
You can view parent-child relationship of mesh access points within a mesh network. You can also filter which access points are displayed in the map view by selecting only access points of interest.
To view the mesh network hierarchy for a selected network, follow these steps:
Step 1 Choose Maps > Site Maps.
Step 2 Click the map name you want to display.
Step 3 Select the AP Mesh Info check box if it is not already selected.
The AP Mesh Info check box is only selectable if mesh access points are present on the map.
Step 4 Click the blue arrow to the right of the AP Mesh Info to display the Mesh Parent-Child Hierarchical View.
Step 5 Click the plus (+) sign next to a mesh access point to display its children.
All subordinate mesh access points are displayed when a negative (-) sign appears next to the parent mesh access point entry. For example, the access point, indoor-mesh-45-rap2, has only one child, indoor-mesh-44-map2.
34-90Cisco Prime Infrastructure 3.0 Technology Package User Guide

Chapter 34 Using Wireless Maps Using Maps to Monitor Your Network
Step 6 Hover your mouse cursor over the colored dot next to each mesh access point child to view details on the link between it and its parent.
The color of the dot provides a quick reference point of the SNR strength:
• A green dot represents a high SNR (above 25 dB).
• An amber dot represents an acceptable SNR (20-25 dB).
• A red dot represents a low SNR (below 20 dB).
• A black dot indicates a root access point.
Using Mesh Filters to Modify Map Display of Maps and Mesh Links
In the mesh hierarchical page, you can define mesh filters to determine which mesh access points appear on the map. Mesh access points are filtered by the number of hops between them and their root access point.
Prime Infrastructure updates map view information every 15 minutes.
To use mesh filtering, follow these steps in the Mesh Parent-Child Hierarchical View:
Step 1 To modify what label and color displays for a mesh link, select an option from the Link Label drop-down list.
Step 2 To choose which parameter determines the color of the mesh link on the map, choose an option from the Link Color drop-down list.
Step 3 To modify which mesh access points are displayed based on the number of hops between them and their parents, choose the appropriate options from the Quick Selections drop-down list.
Step 4 A description of the options is provided in Table 34-17.
Step 5 Click Update Map View to refresh the screen and display the map view with the selected options.
For a child access point to be visible, the parent access point to root access point must be selected.
Related Topics
• SNR and Packet Error Rate Link Colors
• Quick Selection Options
SNR and Packet Error Rate Link Colors
The color of the SNR and Packet Error Rate link provides a quick reference point of the SNR strength as described in Table 34-16.
34-91Cisco Prime Infrastructure 3.0 Technology Package User Guide
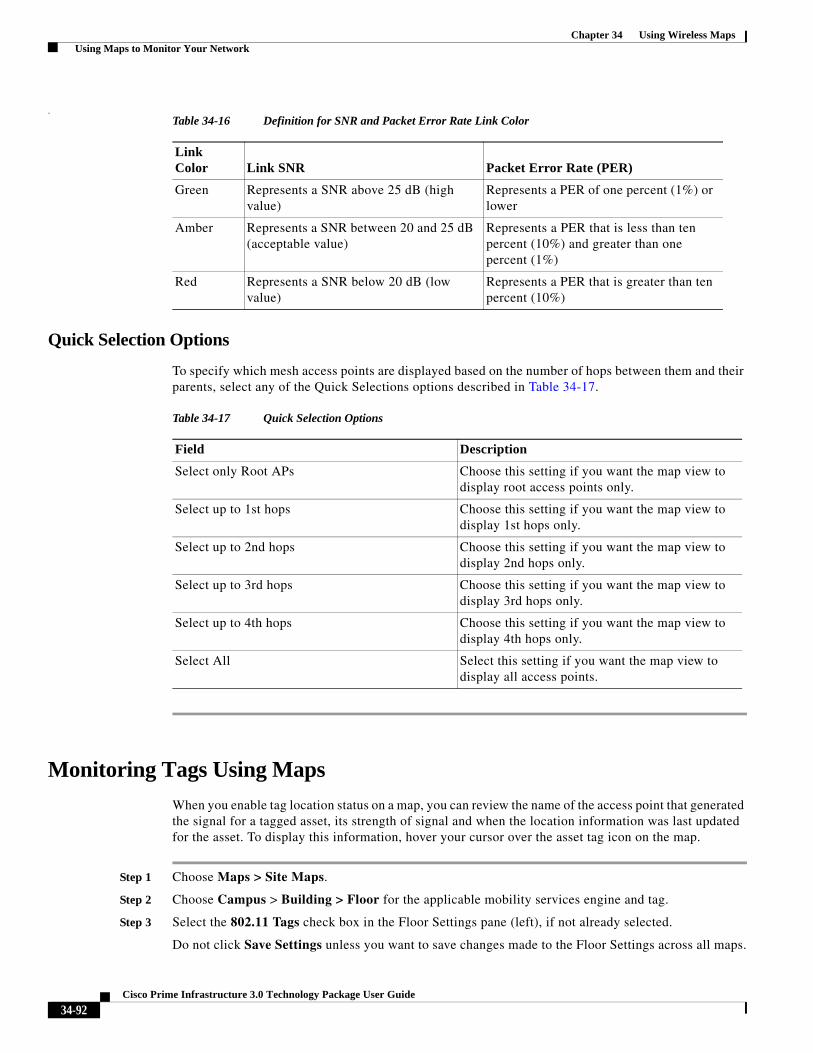
Chapter 34 Using Wireless Maps Using Maps to Monitor Your Network
.
Quick Selection Options
To specify which mesh access points are displayed based on the number of hops between them and their parents, select any of the Quick Selections options described in Table 34-17.
Monitoring Tags Using Maps
When you enable tag location status on a map, you can review the name of the access point that generated the signal for a tagged asset, its strength of signal and when the location information was last updated for the asset. To display this information, hover your cursor over the asset tag icon on the map.
Step 1 Choose Maps > Site Maps.
Step 2 Choose Campus > Building > Floor for the applicable mobility services engine and tag.
Step 3 Select the 802.11 Tags check box in the Floor Settings pane (left), if not already selected.
Do not click Save Settings unless you want to save changes made to the Floor Settings across all maps.
Table 34-16 Definition for SNR and Packet Error Rate Link Color
Link Color Link SNR Packet Error Rate (PER)
Green Represents a SNR above 25 dB (high value)
Represents a PER of one percent (1%) or lower
Amber Represents a SNR between 20 and 25 dB (acceptable value)
Represents a PER that is less than ten percent (10%) and greater than one percent (1%)
Red Represents a SNR below 20 dB (low value)
Represents a PER that is greater than ten percent (10%)
Table 34-17 Quick Selection Options
Field Description
Select only Root APs Choose this setting if you want the map view to display root access points only.
Select up to 1st hops Choose this setting if you want the map view to display 1st hops only.
Select up to 2nd hops Choose this setting if you want the map view to display 2nd hops only.
Select up to 3rd hops Choose this setting if you want the map view to display 3rd hops only.
Select up to 4th hops Choose this setting if you want the map view to display 4th hops only.
Select All Select this setting if you want the map view to display all access points.
34-92Cisco Prime Infrastructure 3.0 Technology Package User Guide
Chapter 34 Using Wireless Maps Using Maps to Plan Your Network Design
Step 4 Hover your cursor over a tag icon (yellow tag) and a summary of its configuration appears in a dialog box.
Step 5 Click the tag icon to see tag details in a new window.
Viewing Device Details Using Maps
Hover your cursor over any device icon in a map to view details about that device.
Monitor mode access points are shown with gray labels to distinguish them from other access points.
Using Maps to Plan Your Network Design
Using Planning Mode
You can calculate the recommended number and location of access points based on whether data and/or voice traffic and/or location are active.
Based on the throughput specified for each protocol (802.11a or 802.11 b/g), planning mode calculates the total number of access points required that would provide optimum coverage in your network.
Planning mode does not use AP type or Antenna pattern information for calculating the number of access points required. The calculation is based on the access point coverage area or the number of users per access point.
Step 1 Choose Maps > Site Maps.
Step 2 Select the desired campus or building.
Step 3 Click the desired floor area in the Building.
Step 4 From the Select a command drop-down list, choose Planning Mode.
Step 5 Click Go.
Step 6 Select a planning mode option
The Planned AP Association Tool allows you to add, delete, or import an AP Association from an excel or CSV file. After an access point is defined, it can be associated to a base radio MAC address using the Planned AP Association Tool. If the AP is not discovered, it is placed in a standby bucket and is associated after it is discovered.
AP association requires than the AP does not belong to any floor or outdoor area. If the AP is already assigned to a floor or outdoor area, then the standby bucket holds the AP and when removed from the floor or outdoor, is positioned on the specified floor. One MAC address cannot be used for multiple floor or outdoor areas.
The map synchronization works only if the AP is associated to a base radio MAC address and not to its Ethernet MAC address.
34-93Cisco Prime Infrastructure 3.0 Technology Package User Guide

Chapter 34 Using Wireless Maps Using Maps to Plan Your Network Design
Using Planning Mode to Calculate Access Point Requirements
Prime Infrastructure planning mode enables you to calculate the number of access points required to cover an area by placing fictitious access points on a map and viewing the coverage area. Based on the throughput specified for each protocol (802.11a/n or 802.11b/g/n), planning mode calculates the total number of access points required to provide optimum coverage in your network. You can calculate the recommended number and location of access points based on the following criteria:
• Traffic type active on the network: data or voice traffic or both
• Location accuracy requirements
• Number of active users
• Number of users per square footage
Step 1 Choose Maps > Site Maps.
Step 2 Select the desired campus or building.
Step 3 Click the desired floor area in the Building.
A color-coded map appears showing all elements (access points, clients, tags) and their relative signal strength.
Step 4 Choose Planning Mode from the Select a command drop-down list (top-right), then click Go. A blank floor map appears.
Step 5 Click Add APs.
Step 6 In the page that appears, drag the dashed-line rectangle over the map in the location for which you want to calculate the recommended access points.
Adjust the size or placement of the rectangle by selecting the edge of the rectangle and holding down the Ctrl key. The rectangle is resizable by dragging on the handles on its edges and corners.
Step 7 From the Add APs drop-down list, choose Automatic.
Step 8 Choose the AP Type and the appropriate antenna and protocol for the selected access point.
Step 9 Choose the target throughput for the access point.
Step 10 Select the check box(es) next to the service(s) used on the floor. You must select at least one service.
Step 11 Select the Advanced Options check box to select the following access point planning options:
• Demand and Override Coverage per AP.
• Safety Margin (for the Data/Coverage and Voice safety margin options)
Step 12 Click Calculate.
The recommended number of access points given the selected services appears. Recommended calculations assume the need for consistently strong signals unless adjusted downward by the safety margin advanced option. In some cases, the recommended number of access points is higher than what is required.
Walls are not used or accounted for in planning mode calculations.
Step 13 Click Apply to generate a map that shows proposed deployment of the recommended access points in the selected area based on the selected services and parameters.
Step 14 Choose Generate Proposal to display a textual and graphical report of the recommended access point number and deployment based on the given input.
34-94Cisco Prime Infrastructure 3.0 Technology Package User Guide

Chapter 34 Using Wireless Maps Using Maps to Plan Your Network Design
Related Topic
Services Options for Planning Mode
Services Options for Planning Mode
Table 34-18 describes the access point planning options.
Table 34-18 Definition of Services Option for Planning Mode
Service Options Description
Data/Coverage Select this check box if data traffic is transmitted on the wireless LAN. The following densities are used depending on the band and data rates:
Band Path Loss Model (dBm) Date Rate (Mb/s) Area (Sq. ft.)
802.11a –3.3 10-12 6000
802.11a –3.3 15-18 4500
802.11a –3.5 10-12 5000
802.11a –3.5 15-18 3250
802.11bg –3.3 5 6500
802.11bg –3.3 6 4500
802.11bg –3.5 5 5500
802.11bg –3.5 6 3500
If you select the Advanced Options check box, you can select the desired safety margin (aggressive, safe, or very safe) of the signal strength threshold for data.
• Aggressive = Minimum (–3 dBm)
• Safe = Medium (0 dBm)
• Very Safe = Maximum (+3 dBm)
Voice Select the Voice check box if voice traffic is transmitted on the wireless LAN.
If you select the Advanced Options check box, you can select the desired safety margin (aggressive, safe, very safe or 7920-enabled) of the signal strength threshold for voice.
• Aggressive = Minimum [–78 dBm (802.11a/b/g)]
• Safe = Medium [–75 dBm (802.11a/b/g)]
• Very Safe = Maximum [(–72 dBm (802.11a/b/g)]
• 7920_enabled = [(–72 dBm (802.11a); –67 dBm (802.11b/g)]
Location Select this check box to ensure that the recommended access point calculation provides the true location of an element within 10 meters at least 90% of the time.
To meet the criteria, access points are collocated within 70 feet of each other in a hexagonal pattern employing staggered and perimeter placement.
Note Each service option includes all services that are listed above it. For example, if you select the Location check box, the calculation considers data/coverage, voice, and location in determining the optimum number of access points required.
34-95Cisco Prime Infrastructure 3.0 Technology Package User Guide
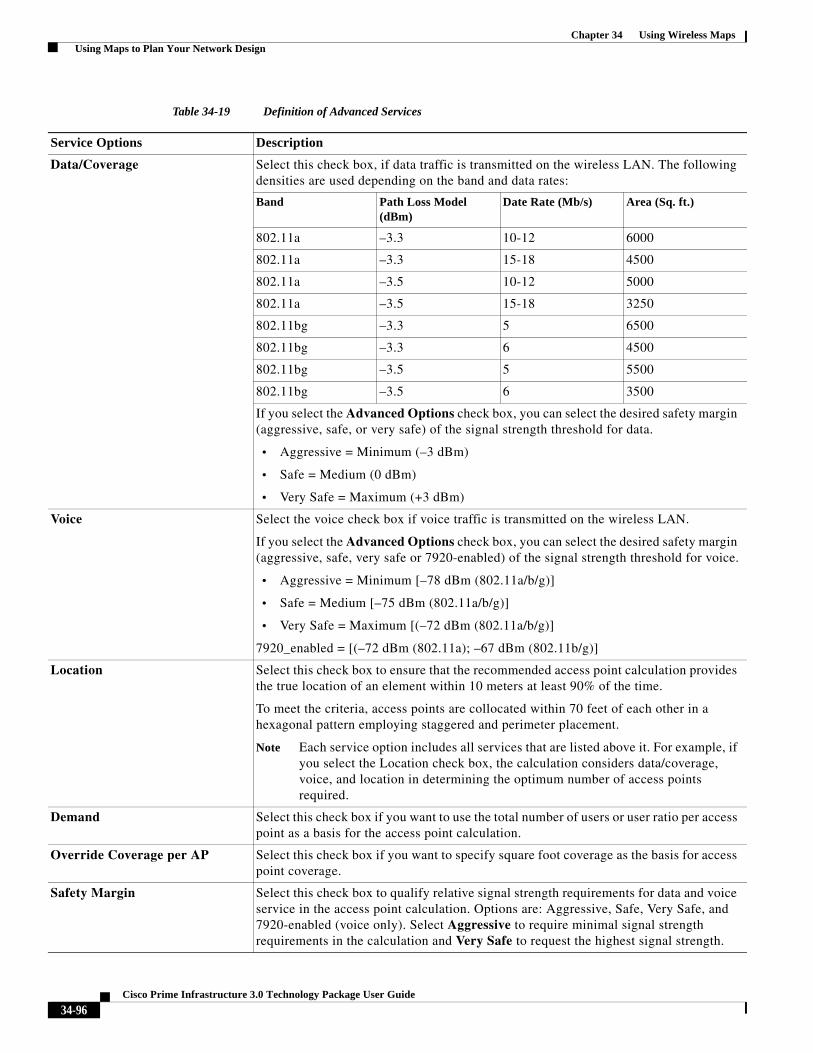
Chapter 34 Using Wireless Maps Using Maps to Plan Your Network Design
Table 34-19 Definition of Advanced Services
Service Options Description
Data/Coverage Select this check box, if data traffic is transmitted on the wireless LAN. The following densities are used depending on the band and data rates:
Band Path Loss Model (dBm)
Date Rate (Mb/s) Area (Sq. ft.)
802.11a –3.3 10-12 6000
802.11a –3.3 15-18 4500
802.11a –3.5 10-12 5000
802.11a –3.5 15-18 3250
802.11bg –3.3 5 6500
802.11bg –3.3 6 4500
802.11bg –3.5 5 5500
802.11bg –3.5 6 3500
If you select the Advanced Options check box, you can select the desired safety margin (aggressive, safe, or very safe) of the signal strength threshold for data.
• Aggressive = Minimum (–3 dBm)
• Safe = Medium (0 dBm)
• Very Safe = Maximum (+3 dBm)
Voice Select the voice check box if voice traffic is transmitted on the wireless LAN.
If you select the Advanced Options check box, you can select the desired safety margin (aggressive, safe, very safe or 7920-enabled) of the signal strength threshold for voice.
• Aggressive = Minimum [–78 dBm (802.11a/b/g)]
• Safe = Medium [–75 dBm (802.11a/b/g)]
• Very Safe = Maximum [(–72 dBm (802.11a/b/g)]
7920_enabled = [(–72 dBm (802.11a); –67 dBm (802.11b/g)]
Location Select this check box to ensure that the recommended access point calculation provides the true location of an element within 10 meters at least 90% of the time.
To meet the criteria, access points are collocated within 70 feet of each other in a hexagonal pattern employing staggered and perimeter placement.
Note Each service option includes all services that are listed above it. For example, if you select the Location check box, the calculation considers data/coverage, voice, and location in determining the optimum number of access points required.
Demand Select this check box if you want to use the total number of users or user ratio per access point as a basis for the access point calculation.
Override Coverage per AP Select this check box if you want to specify square foot coverage as the basis for access point coverage.
Safety Margin Select this check box to qualify relative signal strength requirements for data and voice service in the access point calculation. Options are: Aggressive, Safe, Very Safe, and 7920-enabled (voice only). Select Aggressive to require minimal signal strength requirements in the calculation and Very Safe to request the highest signal strength.
34-96Cisco Prime Infrastructure 3.0 Technology Package User Guide

Chapter 34 Using Wireless Maps Importing or Exporting WLSE Map Data
Network Design
A network design is a representation within Prime Infrastructure of the physical placement of access points throughout your facilities. A hierarchy of a single campus, the buildings that comprise that campus, and the floors of each building constitute a single network design.
Designing a Network
After access points have been installed and have joined a controller, and you’ve configured Prime Infrastructure to manage the controllers, you can create a network design.
The location appliance must be set to poll the controllers in that network, as well as be configured to synchronize with that specific network design, to track devices in that environment. The concept and steps to perform synchronization between Prime Infrastructure and the mobility service engine are explained in the Cisco 3350 Mobility Services Engine Configuration Guide.
Step 1 Log in to Prime Infrastructure with SuperUser, Admin, or ConfigManager access privileges.
Step 2 Choose Maps > Site Maps.
Step 3 Create a new Campus and/ or building as explained in XXX <Add xref.>
Step 4 Create a new floor area.
Step 5 Select the access points to be placed on the specific floor map
Each access point you add to the floor map is represented by a gray circle (differentiated by access point name or MAC address) and is lined up in the upper left part of the floor map.
Step 6 Drag each access point to the appropriate location. (Access points turn blue when you click them to relocate them.) The small black arrow at the side of each access point represents Side A of each access point, and each arrow of the access point must correspond with the direction in which the access points were installed. (Side A is clearly noted on each 1000 series access point and has no relevance to the 802.11a/n radio.)
Step 7 To adjust an access point’s directional arrow, choose the appropriate orientation on the Antenna Angle drop-down list.
Access point placement and direction must directly reflect the actual access point deployment or the system cannot pinpoint the device location.
Step 8 Click Save when you are finished placing and adjusting each direction of the access point.
Step 9 Repeat these steps to create additional campuses, buildings, and floors until each device location is properly detailed in the network design.
Importing or Exporting WLSE Map DataWhen you convert an access point from autonomous to CAPWAP and from the WLSE to Prime Infrastructure, you must manually re-enter the access point information in Prime Infrastructure. This can be a time-consuming step. To convert access point information more quickly, you can export the information about access points from WLSE and import it into Prime Infrastructure.
Prime Infrastructure supports importing access point information from a .tar file only.
34-97Cisco Prime Infrastructure 3.0 Technology Package User Guide

Chapter 34 Using Wireless Maps Troubleshooting Voice RF Coverage Issues
For more information on the WLSE data export functionality (WLSE version 2.15), seehttp://<WLSE_IP_ADDRESS>:1741/debug/export/exportSite.jsp.
Step 1 Choose Maps > Site Maps.
Step 2 Choose Properties from the Select a command drop-down list, then click Go.
Step 3 In the Export/Import AP/LS/SP Placement, click Browse to select the file to import.
Step 4 Find and select the .tar file to import, then click Open.
Step 5 Click Import.
Prime Infrastructure uploads the file and temporarily saves it into a local directory while it is being processed. If the file contains data that cannot be processed, Prime Infrastructure prompts you to correct the problem and retry. After the file has been loaded, Prime Infrastructure displays a report of what was and was not added to Prime Infrastructure.
If some of the data to be imported already exists, Prime Infrastructure either uses the existing data in the case of campuses, or overwrites the existing data in the cases of buildings and floors.
If there are duplicate names between a WLSE site and building combination and a Prime Infrastructure campus (or top-level building) and building combination, Prime Infrastructure displays a message in the Pre Execute Import Report indicating that it will delete the existing building.
Because a WLSE file has no floor number information, the floors are imported in descending order when imported into Prime Infrastructure.
Step 6 Choose Maps > Site Maps to verify the imported data.
Troubleshooting Voice RF Coverage Issues• Floors with either calibration or no calibration data are treated as follows:
– Set the AP Transmit field to Max (the maximum downlink power settings). If the map still shows some yellow or red regions, more access points are required to cover the floor.
– If the calibrated model shows red or yellow regions (where voice is expected to be deployed) with the AP Transmit field set to Current, increasing the power level of the access points might help.
34-98Cisco Prime Infrastructure 3.0 Technology Package User Guide