Embed Size (px)
Citation preview
MIL-HDBK-5H, Change Notice 11 October 2001
3-67Supersedes page 3-67 of MIL-HDBK-5H
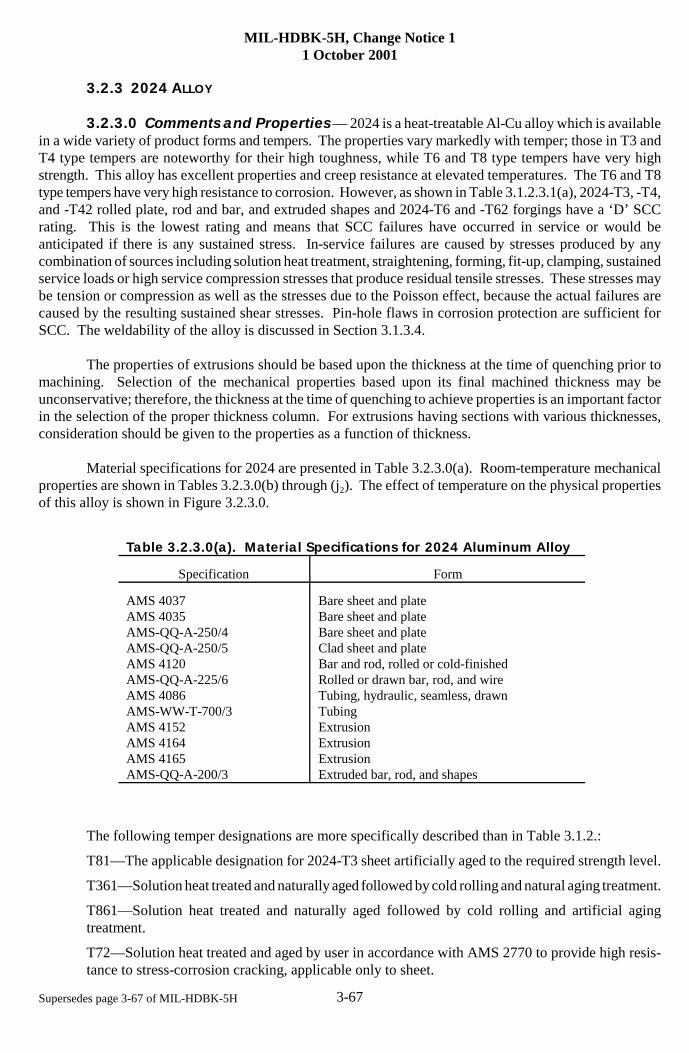
Table 3.2.3.0(a). Material Specifications for 2024 Aluminum Alloy
Specification Form
AMS 4037AMS 4035AMS-QQ-A-250/4AMS-QQ-A-250/5AMS 4120AMS-QQ-A-225/6AMS 4086AMS-WW-T-700/3AMS 4152AMS 4164AMS 4165AMS-QQ-A-200/3
Bare sheet and plateBare sheet and plateBare sheet and plateClad sheet and plateBar and rod, rolled or cold-finishedRolled or drawn bar, rod, and wireTubing, hydraulic, seamless, drawnTubingExtrusionExtrusionExtrusionExtruded bar, rod, and shapes
3.2.3 2024 ALLOY
3.2.3.0 Comments and Properties — 2024 is a heat-treatable Al-Cu alloy which is availablein a wide variety of product forms and tempers. The properties vary markedly with temper; those in T3 andT4 type tempers are noteworthy for their high toughness, while T6 and T8 type tempers have very highstrength. This alloy has excellent properties and creep resistance at elevated temperatures. The T6 and T8type tempers have very high resistance to corrosion. However, as shown in Table 3.1.2.3.1(a), 2024-T3, -T4,and -T42 rolled plate, rod and bar, and extruded shapes and 2024-T6 and -T62 forgings have a ‘D’ SCCrating. This is the lowest rating and means that SCC failures have occurred in service or would beanticipated if there is any sustained stress. In-service failures are caused by stresses produced by anycombination of sources including solution heat treatment, straightening, forming, fit-up, clamping, sustainedservice loads or high service compression stresses that produce residual tensile stresses. These stresses maybe tension or compression as well as the stresses due to the Poisson effect, because the actual failures arecaused by the resulting sustained shear stresses. Pin-hole flaws in corrosion protection are sufficient forSCC. The weldability of the alloy is discussed in Section 3.1.3.4.
The properties of extrusions should be based upon the thickness at the time of quenching prior tomachining. Selection of the mechanical properties based upon its final machined thickness may beunconservative; therefore, the thickness at the time of quenching to achieve properties is an important factorin the selection of the proper thickness column. For extrusions having sections with various thicknesses,consideration should be given to the properties as a function of thickness.
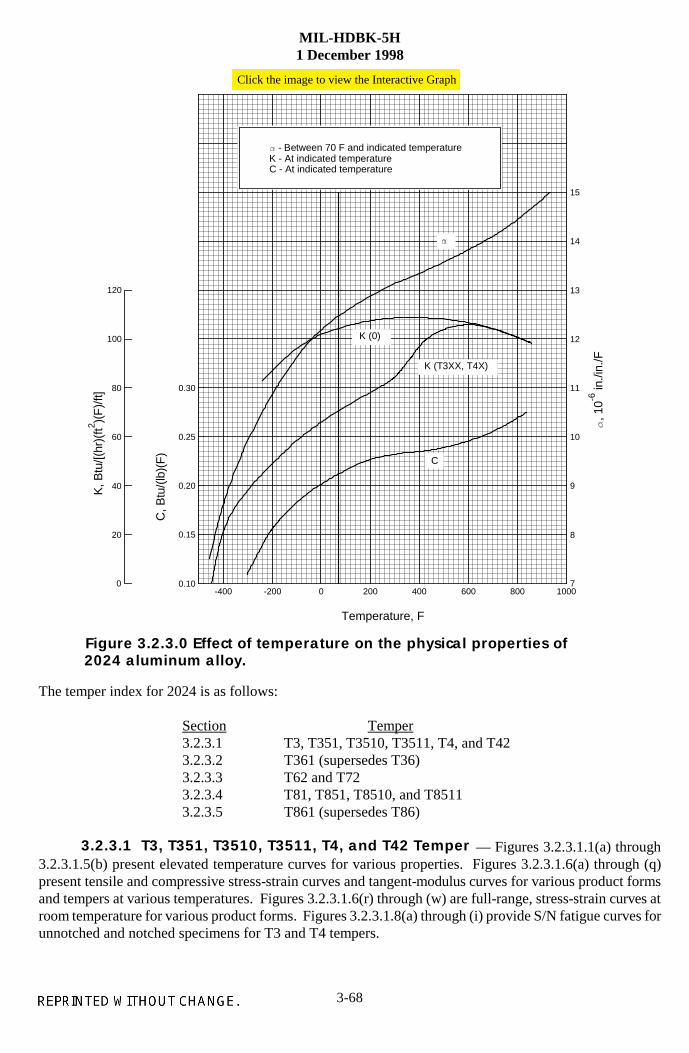
Material specifications for 2024 are presented in Table 3.2.3.0(a). Room-temperature mechanicalproperties are shown in Tables 3.2.3.0(b) through (j2). The effect of temperature on the physical propertiesof this alloy is shown in Figure 3.2.3.0.
The following temper designations are more specifically described than in Table 3.1.2.:
T81—The applicable designation for 2024-T3 sheet artificially aged to the required strength level.
T361—Solution heat treated and naturally aged followed by cold rolling and natural aging treatment.
T861—Solution heat treated and naturally aged followed by cold rolling and artificial agingtreatment.
T72—Solution heat treated and aged by user in accordance with AMS 2770 to provide high resis-tance to stress-corrosion cracking, applicable only to sheet.
MIL-HDBK-5H1 December 1998
3-68
-400 -200 0 200 400 600 800 1000
Temperature, F
.
, 10-6
in./i
n./F
K, B
tu/[(
hr)(
ft2 )(F
)/ft]
C, B
tu/(
lb)(
F)
0
20
40
60
80
100
120
0.10
0.15
0.20
0.25
0.30
7
8
9
10
11
12
13
14
15
- Between 70 F and indicated temperature
C - At indicated temperatureK - At indicated temperature
C
K (T3XX, T4X)
K (0)
The temper index for 2024 is as follows:
Section Temper3.2.3.1 T3, T351, T3510, T3511, T4, and T423.2.3.2 T361 (supersedes T36)3.2.3.3 T62 and T723.2.3.4 T81, T851, T8510, and T85113.2.3.5 T861 (supersedes T86)
— Figures 3.2.3.1.1(a) through3.2.3.1.5(b) present elevated temperature curves for various properties. Figures 3.2.3.1.6(a) through (q)present tensile and compressive stress-strain curves and tangent-modulus curves for various product formsand tempers at various temperatures. Figures 3.2.3.1.6(r) through (w) are full-range, stress-strain curves atroom temperature for various product forms. Figures 3.2.3.1.8(a) through (i) provide S/N fatigue curves forunnotched and notched specimens for T3 and T4 tempers.
Click the image to view the Interactive Graph
Figure 3.2.3.0 Effect of temperature on the physical properties of2024 aluminum alloy.
3.2.3.1 T3, T351, T3510, T3511, T4, and T42 Temper
MIL-HDBK-5H1 December 1998
3-69
—
— Figures 3.2.3.3.1(a) through (d) and 3.2.3.3.5(a) and (b) showthe effect of temperature on the tensile properties of the T62 temper. Figure 3.2.3.1.4 can be used for theelevated temperature curve for elastic moduli for this temper. Tensile and compressive stress-strain andtangent-modulus curves at room temperature are shown in Figure 3.2.3.3.6.
— Figures 3.2.3.4.1(a) through (d),3.2.3.4.2(a) and (b), 3.2.3.4.3(a) and (b), and 3.2.3.4.5(a) and (b) present elevated temperature curves forvarious mechanical properties for the T8XXX temper. Figures 3.2.3.4.1(e) and (f) contain graphs fordetermining tensile properties after complex thermal exposure. See Section 3.7.4.1 for a detailed discussionof their use. Figures 3.2.3.4.6(a) through (g) present tensile and compressive stress-strain and tangent-modulus curves for various products and tempers. Figures 3.2.3.4.6(h) through (j) are full-range stress-straincurves at room temperature for various product forms.
— Figures 3.2.3.5.1(a) through (d), 3.2.3.5.2(a) and (b),3.2.3.5.3(a) through (c), and 3.2.3.5.5(a) and (b) present effect-of-temperature curves for variousmechanical properties. Figures 3.2.3.5.6(a) through (d) present compressive stress-strain and tangent-modulus curves for sheet material at various temperatures. Graphical displays of the residual strengthbehavior of center-cracked tension panels are presented in Figures 3.2.3.5.10(a) and (b).
3.2.3.2 T361 (supersedes T36) Temper
3.2.3.3 T62 and T72 Temper
3.2.3.4 T81, T851, T852, T8510 and T8511 Temper
3.2.3.5 T861 (T86) Temper
MIL-H
DB
K-5H
1 Decem
ber 1998
3-7
0
Specification . . . . . . . . . . AMS 4037 and AMS-QQ-A-250/4 AMS-QQ-A-250/4
Form . . . . . . . . . . . . . . . . Sheet Plate Sheet Plate
Temper . . . . . . . . . . . . . . T3 T351 T361
Thickness, in. . . . . . . . . . 0.008-0.009
0.010-0.128
0.129-0.249
0.250-0.499
0.500-1.000
1.001-1.500
1.501-2.000
2.001-3.000
3.001-4.000
0.020-0.062
0.063-0.249
0.250-0.500
Basis . . . . . . . . . . . . . . . . S A B A B A B A B A B A B A B A B S S S
Mechanical Properties:Ftu, ksi:
L . . . . . . . . . . . . . . . .LT . . . . . . . . . . . . . . .ST . . . . . . . . . . . . . . .
Fty, ksi:L . . . . . . . . . . . . . . . .LT . . . . . . . . . . . . . . .ST . . . . . . . . . . . . . . .
Fcy, ksi:L . . . . . . . . . . . . . . . .LT . . . . . . . . . . . . . . .ST . . . . . . . . . . . . . . .
Fsu, ksi . . . . . . . . . . . . .Fbru
b, ksi:(e/D = 1.5) . . . . . . . . .(e/D = 2.0) . . . . . . . . .
Fbryb, ksi:
(e/D = 1.5) . . . . . . . . .(e/D = 2.0) . . . . . . . . .
e, percent (S-basis):LT . . . . . . . . . . . . . . .
64 63...
47 42...
39 45... 39
104129
73 88
10
64 63...
47 42...
39 45... 39
104129
73 88
c
65 64...
48 43...
40 46... 40
106131
75 90
...
65 64...
47 42...
39 45... 40
106131
73 88
c
66 65...
48 43...
40 46... 41
107133
75 90
...
64 64...
48 42...
39 45... 38
97119
72 86
12
66 66...
50 44...
41 47... 39
100122
76 90
...
63 63...
48 42...
39 45... 37
95117
72 86
8
65 65...
50 44...
41 47... 38
98120
76 90
...
62 62...
47 42...
39 44... 37
94115
72 86
7
64 64...
50 44...
40 46... 38
97119
76 90
...
62 62...
47 42...
38 44... 37
94115
72 86
6
64 64...
49 44...
40 46... 38
97119
76 90
...
60 60 52a
46 42 38a
37 43 46 35
91111
72 86
4
62 62 54a
48 44 40a
39 45 48 37
94115
76 90
...
57 57 49a
43 41 38a
35 41 44 34
86106
70 84
4
59 59 51a
46 43 39a
37 43 47 35
89109
74 88
...
68 67...
56 50...
47 53... 42
111137
82 97
8
69 68...
56 51...
48 54... 42
112139
84 99
9
67
66
...
54
49
...
46
52
... 41
109
135
81
96
9d
E, 103 ksi . . . . . . . . . . .Ec, 103 ksi . . . . . . . . . . .G, 103 ksi . . . . . . . . . . .µ . . . . . . . . . . . . . . . . . .
10.5 10.7 4.0 0.33
10.7 10.9 4.0 0.33
10.5 10.7 4.0 0.33
10.7 10.9 4.0 0.33
Physical Properties:�, lb/in. . . . . . . . . . . . .C, K, and � . . . . . . . . . .
0.100See Figure 3.2.3.0
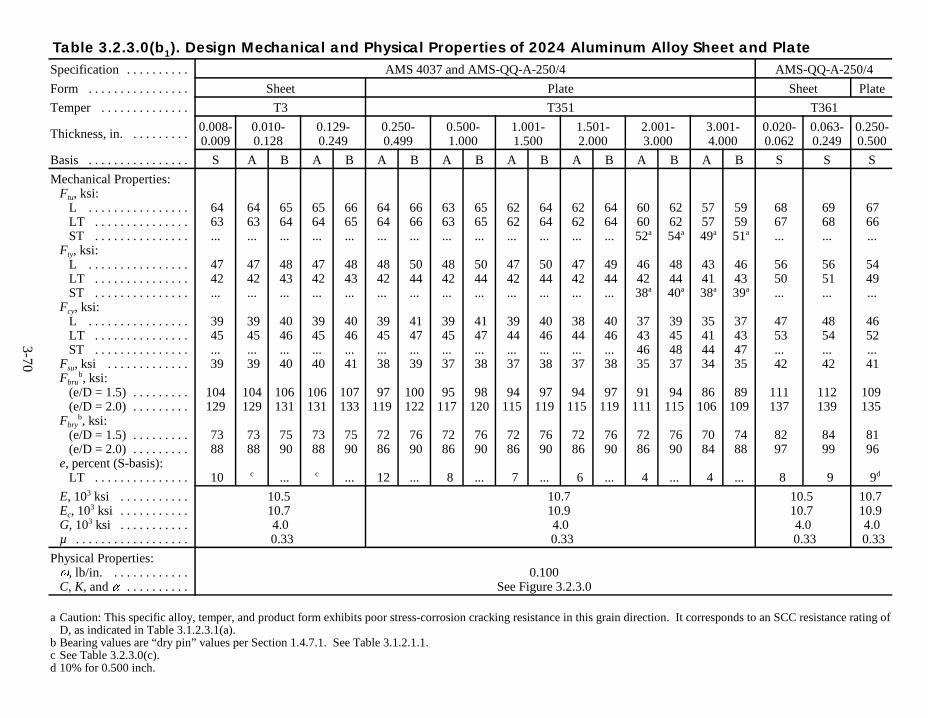
a Caution: This specific alloy, temper, and product form exhibits poor stress-corrosion cracking resistance in this grain direction. It corresponds to an SCC resistance rating ofD, as indicated in Table 3.1.2.3.1(a).
b Bearing values are “dry pin” values per Section 1.4.7.1. See Table 3.1.2.1.1.c See Table 3.2.3.0(c).d 10% for 0.500 inch.
Table 3.2.3.0(b1). Design Mechanical and Physical Properties of 2024 Aluminum Alloy Sheet and Plate
MIL
-HD
BK
-5H, C
hange Notice 1
1 October 2001
3-71Supersedes page 3-71 of M
IL-H
DB
K-5H
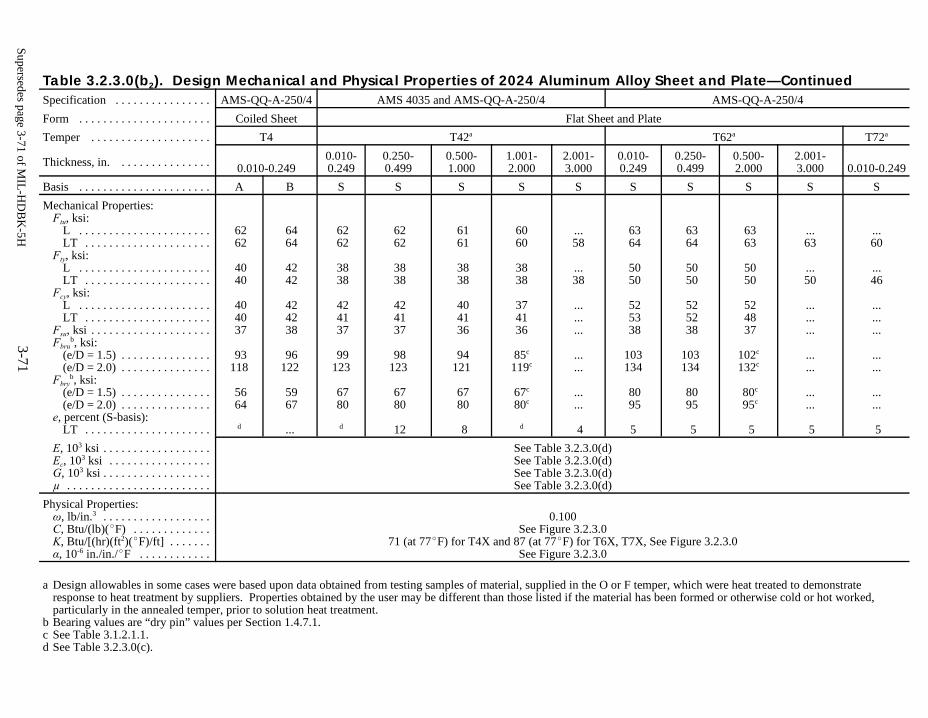
Table 3.2.3.0(b2). Design Mechanical and Physical Properties of 2024 Aluminum Alloy Sheet and Plate—ContinuedSpecification . . . . . . . . . . . . . . . . AMS-QQ-A-250/4 AMS 4035 and AMS-QQ-A-250/4 AMS-QQ-A-250/4
Form . . . . . . . . . . . . . . . . . . . . . . Coiled Sheet Flat Sheet and Plate
Temper . . . . . . . . . . . . . . . . . . . . T4 T42a T62a T72a
Thickness, in. . . . . . . . . . . . . . . . 0.010-0.2490.010-0.249
0.250-0.499
0.500-1.000
1.001-2.000
2.001-3.000
0.010-0.249
0.250-0.499
0.500-2.000
2.001-3.000 0.010-0.249
Basis . . . . . . . . . . . . . . . . . . . . . . A B S S S S S S S S S S
Mechanical Properties:Ftu, ksi:
L . . . . . . . . . . . . . . . . . . . . . .LT . . . . . . . . . . . . . . . . . . . . .
Fty, ksi:L . . . . . . . . . . . . . . . . . . . . . .LT . . . . . . . . . . . . . . . . . . . . .
Fcy, ksi:L . . . . . . . . . . . . . . . . . . . . . .LT . . . . . . . . . . . . . . . . . . . . .
Fsu, ksi . . . . . . . . . . . . . . . . . . . .Fbrub, ksi:
(e/D = 1.5) . . . . . . . . . . . . . . .(e/D = 2.0) . . . . . . . . . . . . . . .
Fbryb, ksi:(e/D = 1.5) . . . . . . . . . . . . . . .(e/D = 2.0) . . . . . . . . . . . . . . .
e, percent (S-basis):LT . . . . . . . . . . . . . . . . . . . . .
62 62
40 40
40 40 37
93118
56 64
d
64 64
42 42
42 42 38
96122
59 67
...
62 62
38 38
42 41 37
99123
67 80
d
62 62
38 38
42 41 37
98123
67 80
12
61 61
38 38
40 41 36
94121
67 80
8
6060
3838
374136
85c
119c
67c
80c
d
...58
...38
...
...
...
...
...
...
...
4
63 64
50 50
52 53 38
103134
80 95
5
63 64
50 50
52 52 38
103134
80 95
5
63 63
50 50
52 48 37
102c
132c
80c
95c
5
...63
...50
...
...
...
...
...
...
...
5
...60
...46
...
...
...
...
...
...
...
5
E, 103 ksi . . . . . . . . . . . . . . . . . .Ec, 103 ksi . . . . . . . . . . . . . . . . .G, 103 ksi . . . . . . . . . . . . . . . . . .µ . . . . . . . . . . . . . . . . . . . . . . . .
See Table 3.2.3.0(d)See Table 3.2.3.0(d)See Table 3.2.3.0(d)See Table 3.2.3.0(d)
Physical Properties:ω, lb/in.3 . . . . . . . . . . . . . . . . . .C, Btu/(lb)(EF) . . . . . . . . . . . . .K, Btu/[(hr)(ft2)(EF)/ft] . . . . . . .α, 10-6 in./in./EF . . . . . . . . . . . .
0.100See Figure 3.2.3.0
71 (at 77EF) for T4X and 87 (at 77EF) for T6X, T7X, See Figure 3.2.3.0See Figure 3.2.3.0
a Design allowables in some cases were based upon data obtained from testing samples of material, supplied in the O or F temper, which were heat treated to demonstrateresponse to heat treatment by suppliers. Properties obtained by the user may be different than those listed if the material has been formed or otherwise cold or hot worked,particularly in the annealed temper, prior to solution heat treatment.
b Bearing values are “dry pin” values per Section 1.4.7.1.c See Table 3.1.2.1.1.d See Table 3.2.3.0(c).
MIL-HDBK-5H, Change Notice 11 October 2001
3-72Supersedes page 3-72 of MIL-HDBK-5H
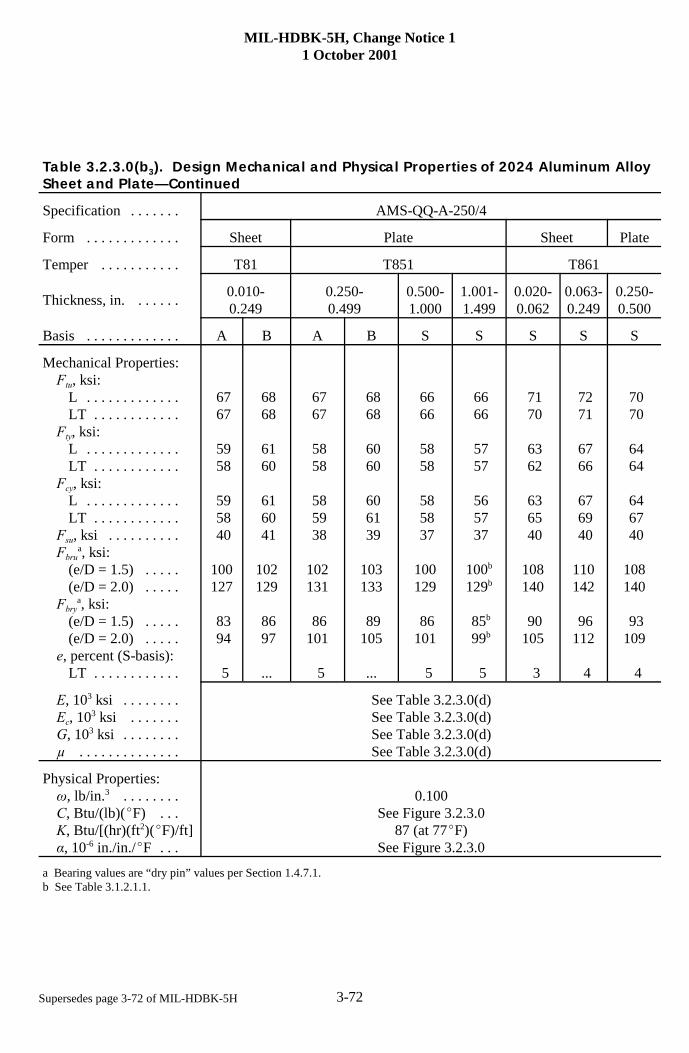
Table 3.2.3.0(b3). Design Mechanical and Physical Properties of 2024 Aluminum AlloySheet and Plate—Continued
Specification . . . . . . . AMS-QQ-A-250/4
Form . . . . . . . . . . . . . Sheet Plate Sheet Plate
Temper . . . . . . . . . . . T81 T851 T861
Thickness, in. . . . . . .0.010-0.249
0.250-0.499
0.500-1.000
1.001-1.499
0.020-0.062
0.063-0.249
0.250-0.500
Basis . . . . . . . . . . . . . A B A B S S S S S
Mechanical Properties:Ftu, ksi:
L . . . . . . . . . . . . .LT . . . . . . . . . . . .
Fty, ksi:L . . . . . . . . . . . . .LT . . . . . . . . . . . .
Fcy, ksi:L . . . . . . . . . . . . .LT . . . . . . . . . . . .
Fsu, ksi . . . . . . . . . .Fbrua, ksi:
(e/D = 1.5) . . . . .(e/D = 2.0) . . . . .
Fbrya, ksi:(e/D = 1.5) . . . . .(e/D = 2.0) . . . . .
e, percent (S-basis):LT . . . . . . . . . . . .
67 67
59 58
59 58 40
100127
83 94
5
68 68
61 60
61 60 41
102129
86 97
...
67 67
58 58
58 59 38
102131
86101
5
68 68
60 60
60 61 39
103133
89105
...
66 66
58 58
58 58 37
100129
86101
5
66 66
57 57
56 57 37
100b
129b
85b
99b
5
71 70
63 62
63 65 40
108140
90105
3
72 71
67 66
67 69 40
110142
96112
4
70 70
64 64
64 67 40
108140
93109
4
E, 103 ksi . . . . . . . .Ec, 103 ksi . . . . . . .G, 103 ksi . . . . . . . .µ . . . . . . . . . . . . . .
See Table 3.2.3.0(d)See Table 3.2.3.0(d)See Table 3.2.3.0(d)See Table 3.2.3.0(d)
Physical Properties:ω, lb/in.3 . . . . . . . .C, Btu/(lb)(EF) . . .K, Btu/[(hr)(ft2)(EF)/ft]α, 10-6 in./in./EF . . .
0.100See Figure 3.2.3.0
87 (at 77EF)See Figure 3.2.3.0
a Bearing values are “dry pin” values per Section 1.4.7.1.b See Table 3.1.2.1.1.
MIL-HDBK-5H1 December 1998
3-73
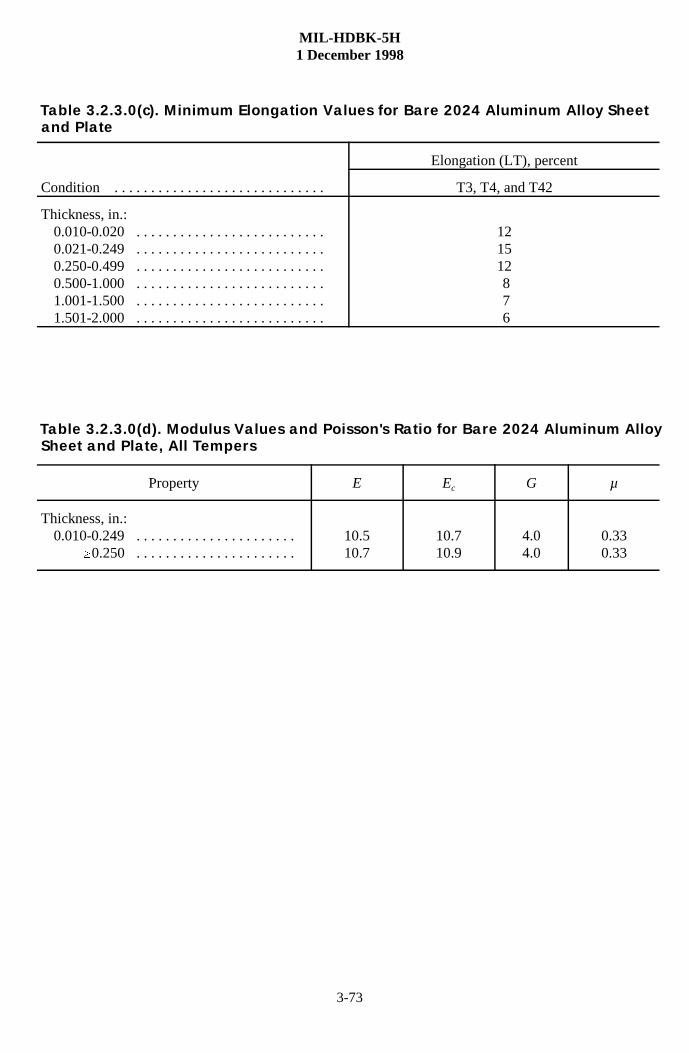
Condition . . . . . . . . . . . . . . . . . . . . . . . . . . . . .
Elongation (LT), percent
T3, T4, and T42
Thickness, in.:0.010-0.020 . . . . . . . . . . . . . . . . . . . . . . . . . .0.021-0.249 . . . . . . . . . . . . . . . . . . . . . . . . . . 0.250-0.499 . . . . . . . . . . . . . . . . . . . . . . . . . .0.500-1.000 . . . . . . . . . . . . . . . . . . . . . . . . . .1.001-1.500 . . . . . . . . . . . . . . . . . . . . . . . . . .1.501-2.000 . . . . . . . . . . . . . . . . . . . . . . . . . .
121512 8 7 6
Property E Ec G µ
Thickness, in.:0.010-0.249 . . . . . . . . . . . . . . . . . . . . . .
�0.250 . . . . . . . . . . . . . . . . . . . . . .10.510.7
10.710.9
4.04.0
0.330.33
Table 3.2.3.0(c). Minimum Elongation Values for Bare 2024 Aluminum Alloy Sheetand Plate
Table 3.2.3.0(d). Modulus Values and Poisson's Ratio for Bare 2024 Aluminum AlloySheet and Plate, All Tempers
MIL-H
DB
K-5H
1 Decem
ber 1998
3-7
4
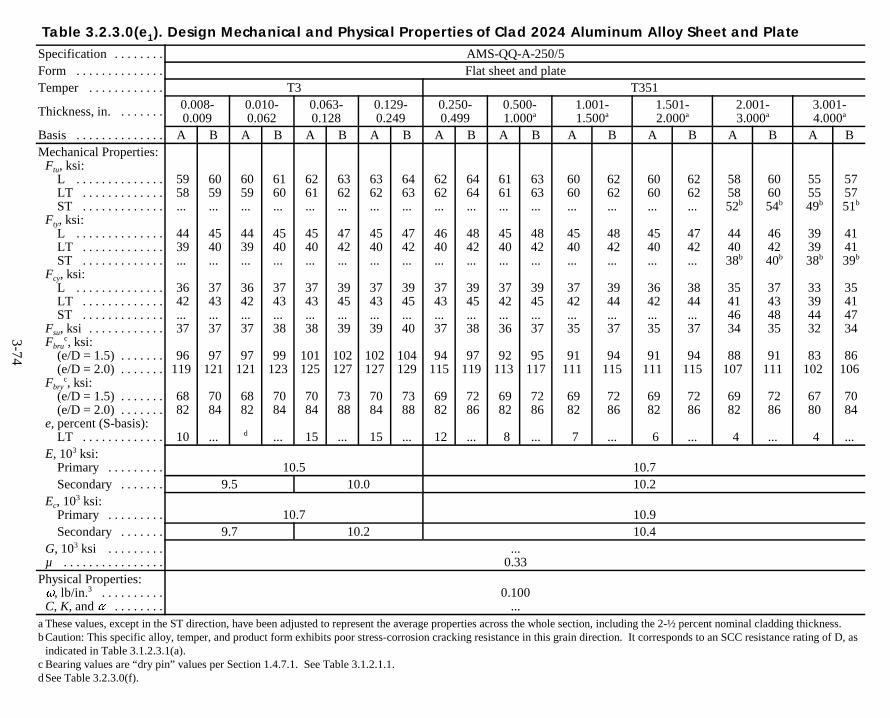
Specification . . . . . . . . AMS-QQ-A-250/5Form . . . . . . . . . . . . . . Flat sheet and plateTemper . . . . . . . . . . . . T3 T351
Thickness, in. . . . . . . . 0.008-0.009
0.010-0.062
0.063-0.128
0.129-0.249
0.250-0.499
0.500-1.000a
1.001-1.500a
1.501-2.000a
2.001-3.000a
3.001-4.000a
Basis . . . . . . . . . . . . . . A B A B A B A B A B A B A B A B A B A BMechanical Properties:Ftu, ksi:
L . . . . . . . . . . . . . .LT . . . . . . . . . . . . .ST . . . . . . . . . . . . .
Fty, ksi:L . . . . . . . . . . . . . .LT . . . . . . . . . . . . .ST . . . . . . . . . . . . .
Fcy, ksi:L . . . . . . . . . . . . . .LT . . . . . . . . . . . . .ST . . . . . . . . . . . . .
Fsu, ksi . . . . . . . . . . . .Fbru
c, ksi:(e/D = 1.5) . . . . . . .(e/D = 2.0) . . . . . . .
Fbryc, ksi:
(e/D = 1.5) . . . . . . .(e/D = 2.0) . . . . . . .
e, percent (S-basis):LT . . . . . . . . . . . . .
59 58...
44 39...
36 42... 37
96119
68 82
10
60 59...
45 40...
37 43... 37
97121
70 84
...
60 59...
44 39...
36 42... 37
97121
68 82
d
61 60...
45 40...
37 43... 38
99123
70 84
...
62 61...
45 40...
37 43... 38
101125
70 84
15
63 62...
47 42...
39 45... 39
102127
73 88
...
63 62...
45 40...
37 43... 39
102127
70 84
15
64 63...
47 42...
39 45... 40
104129
73 88
...
62 62...
46 40...
37 43... 37
94115
69 82
12
64 64...
48 42...
39 45... 38
97119
72 86
...
61 61...
45 40...
37 42... 36
92113
69 82
8
63 63...
48 42...
39 45... 37
95117
72 86
...
60 60...
45 40...
37 42... 35
91111
69 82
7
62 62...
48 42...
39 44... 37
94115
72 86
...
60 60...
45 40...
36 42... 35
91111
69 82
6
62 62...
47 42...
38 44... 37
94115
72 86
...
58 58 52b
44 40 38b
35 41 46 34
88107
69 82
4
60 60 54b
46 42 40b
37 43 48 35
91111
72 86
...
55 55 49b
39 39 38b
33 39 44 32
83102
67 80
4
57 57 51b
41 41 39b
35 41 47 34
86106
70 84
...E, 103 ksi:
Primary . . . . . . . . . 10.5 10.7Secondary . . . . . . . 9.5 10.0 10.2
Ec, 103 ksi:Primary . . . . . . . . . 10.7 10.9Secondary . . . . . . . 9.7 10.2 10.4
G, 103 ksi . . . . . . . . .µ . . . . . . . . . . . . . . . .
...0.33
Physical Properties:�, lb/in.3 . . . . . . . . . .C, K, and � . . . . . . . .
0.100...
a These values, except in the ST direction, have been adjusted to represent the average properties across the whole section, including the 2-½ percent nominal cladding thickness.bCaution: This specific alloy, temper, and product form exhibits poor stress-corrosion cracking resistance in this grain direction. It corresponds to an SCC resistance rating of D, as
indicated in Table 3.1.2.3.1(a).c Bearing values are “dry pin” values per Section 1.4.7.1. See Table 3.1.2.1.1.dSee Table 3.2.3.0(f).
Table 3.2.3.0(e1). Design Mechanical and Physical Properties of Clad 2024 Aluminum Alloy Sheet and Plate
MIL-HDBK-5H1 December 1998
3-75
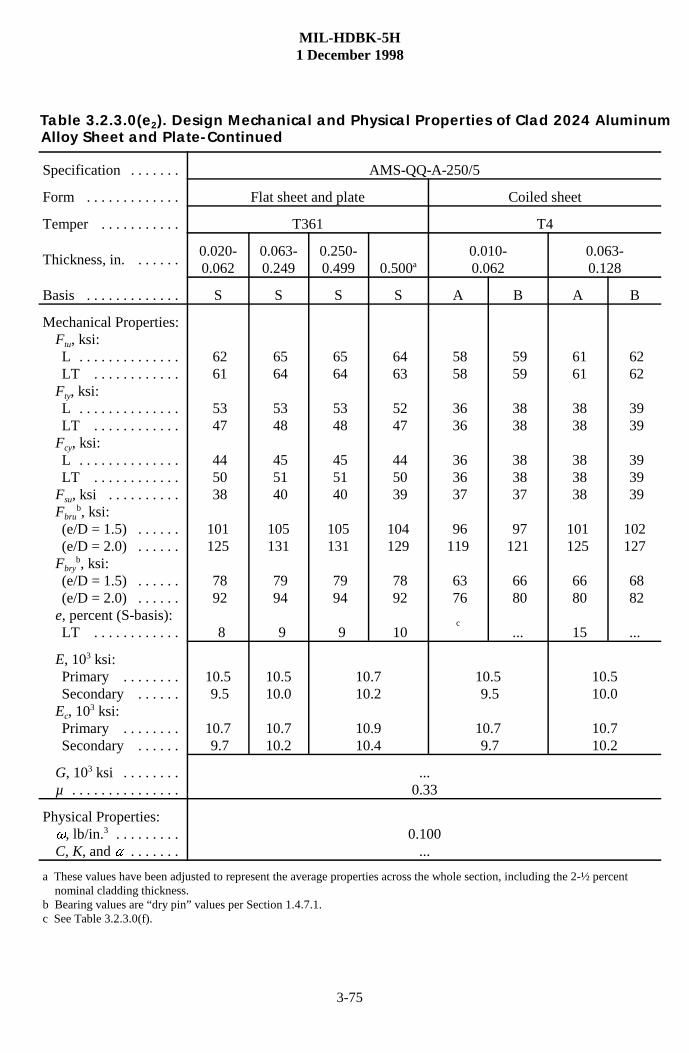
Specification . . . . . . . AMS-QQ-A-250/5
Form . . . . . . . . . . . . . Flat sheet and plate Coiled sheet
Temper . . . . . . . . . . . T361 T4
Thickness, in. . . . . . .0.020-0.062
0.063-0.249
0.250-0.499 0.500a
0.010-0.062
0.063-0.128
Basis . . . . . . . . . . . . . S S S S A B A B
Mechanical Properties:Ftu, ksi:L . . . . . . . . . . . . . .LT . . . . . . . . . . . .
Fty, ksi:L . . . . . . . . . . . . . .LT . . . . . . . . . . . .
Fcy, ksi:L . . . . . . . . . . . . . .LT . . . . . . . . . . . .
Fsu, ksi . . . . . . . . . .Fbru
b, ksi:(e/D = 1.5) . . . . . .(e/D = 2.0) . . . . . .
Fbryb, ksi:
(e/D = 1.5) . . . . . .(e/D = 2.0) . . . . . .
e, percent (S-basis):LT . . . . . . . . . . . .
62 61
53 47
44 50 38
101125
78 92
8
65 64
53 48
45 51 40
105131
79 94
9
65 64
53 48
45 51 40
105131
79 94
9
64 63
52 47
44 50 39
104129
78 92
10
58 58
36 36
36 36 37
96119
63 76
c
59 59
38 38
38 38 37
97121
66 80
...
61 61
38 38
38 38 38
101125
66 80
15
62 62
39 39
39 39 39
102127
68 82
...
E, 103 ksi:Primary . . . . . . . .Secondary . . . . . .
Ec, 103 ksi:Primary . . . . . . . .Secondary . . . . . .
10.5 9.5
10.7 9.7
10.510.0
10.710.2
10.710.2
10.910.4
10.5 9.5
10.7 9.7
10.510.0
10.710.2
G, 103 ksi . . . . . . . .µ . . . . . . . . . . . . . . .
...0.33
Physical Properties:�, lb/in.3 . . . . . . . . .C, K, and � . . . . . . .
0.100...
a These values have been adjusted to represent the average properties across the whole section, including the 2-½ percent nominal cladding thickness.b Bearing values are “dry pin” values per Section 1.4.7.1.c See Table 3.2.3.0(f).
Alloy Sheet and Plate-ContinuedTable 3.2.3.0(e2). Design Mechanical and Physical Properties of Clad 2024 Aluminum
MIL-H
DB
K-5H
1 Decem
ber 1998
3-7
6
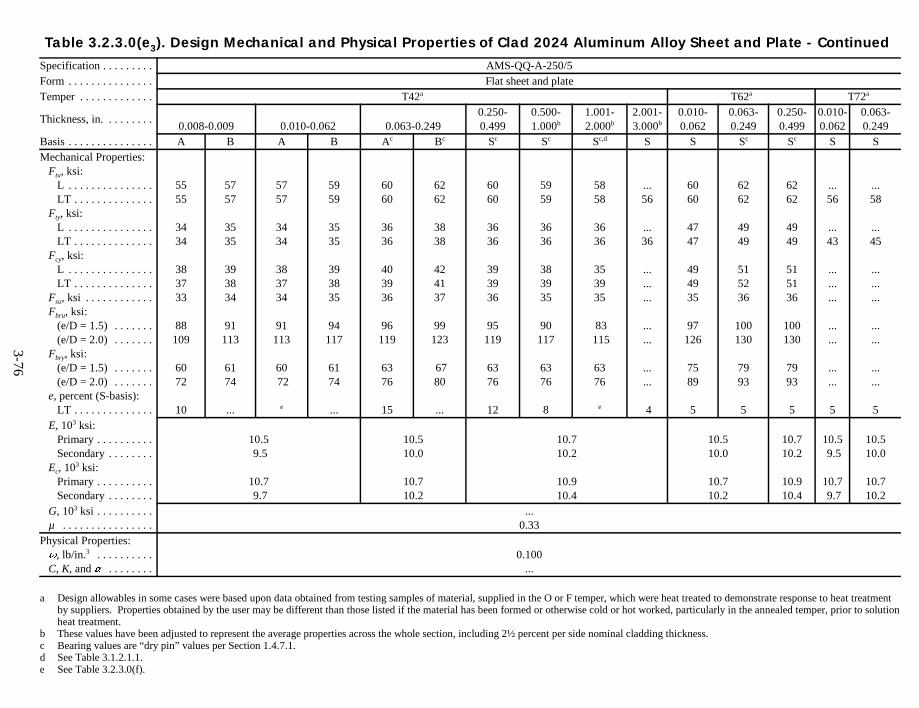
Specification . . . . . . . . . AMS-QQ-A-250/5Form . . . . . . . . . . . . . . . Flat sheet and plateTemper . . . . . . . . . . . . . T42a T62a T72a
Thickness, in. . . . . . . . .0.008-0.009 0.010-0.062 0.063-0.249
0.250-0.499
0.500-1.000b
1.001-2.000b
2.001-3.000b
0.010-0.062
0.063-0.249
0.250-0.499
0.010-0.062
0.063-0.249
Basis . . . . . . . . . . . . . . . A B A B Ac Bc Sc Sc Sc,d S S Sc Sc S SMechanical Properties: Ftu, ksi: L . . . . . . . . . . . . . . . LT . . . . . . . . . . . . . . Fty, ksi: L . . . . . . . . . . . . . . . LT . . . . . . . . . . . . . . Fcy, ksi: L . . . . . . . . . . . . . . . LT . . . . . . . . . . . . . . Fsu, ksi . . . . . . . . . . . . Fbru, ksi: (e/D = 1.5) . . . . . . . (e/D = 2.0) . . . . . . . Fbry, ksi: (e/D = 1.5) . . . . . . . (e/D = 2.0) . . . . . . . e, percent (S-basis): LT . . . . . . . . . . . . . .
5555
3434
383733
88109
6072
10
5757
3535
393834
91113
6174
...
5757
3434
383734
91113
60 72
e
5959
3535
393835
94117
6174
...
6060
3636
403936
96119
6376
15
6262
3838
424137
99123
6780
...
6060
3636
393936
95119
6376
12
5959
3636
383935
90117
6376
8
5858
3636
353935
83 115
6376
e
...56
...36
...
...
...
...
...
...
...
4
6060
4747
494935
97126
7589
5
6262
4949
515236
100130
7993
5
6262
4949
515136
100130
7993
5
...56
...43
...
...
...
...
...
...
...
5
...58
...45
...
...
...
...
...
...
...
5 E, 103 ksi: Primary . . . . . . . . . . Secondary. . . . . . . . Ec, 103 ksi: Primary . . . . . . . . . . Secondary. . . . . . . .
10.5 9.5
10.7 9.7
10.510.0
10.710.2
10.710.2
10.910.4
10.510.0
10.710.2
10.710.2
10.910.4
10.5 9.5
10.7 9.7
10.510.0
10.710.2
G, 103 ksi . . . . . . . . . . µ . . . . . . . . . . . . . . . .
...0.33
Physical Properties: �, lb/in.3 . . . . . . . . . . C, K, and � . . . . . . . .
0.100...
a Design allowables in some cases were based upon data obtained from testing samples of material, supplied in the O or F temper, which were heat treated to demonstrate response to heat treatmentby suppliers. Properties obtained by the user may be different than those listed if the material has been formed or otherwise cold or hot worked, particularly in the annealed temper, prior to solutionheat treatment.
b These values have been adjusted to represent the average properties across the whole section, including 2½ percent per side nominal cladding thickness.c Bearing values are “dry pin” values per Section 1.4.7.1.d See Table 3.1.2.1.1.e See Table 3.2.3.0(f).
Table 3.2.3.0(e3). Design Mechanical and Physical Properties of Clad 2024 Aluminum Alloy Sheet and Plate - Continued
MIL-HDBK-5H1 December 1998
3-77
Specification . . . . . AMS-QQ-A-250/5
Form . . . . . . . . . . . Flat sheet and plate
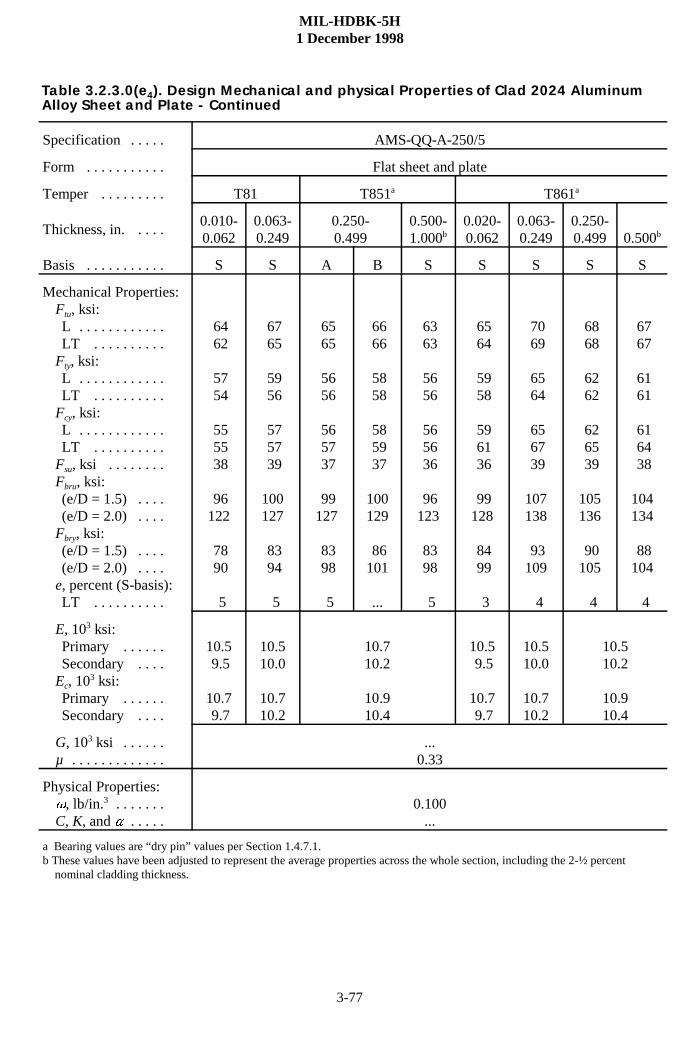
Temper . . . . . . . . . T81 T851a T861a
Thickness, in. . . . .0.010-0.062
0.063-0.249
0.250-0.499
0.500-1.000b
0.020-0.062
0.063-0.249
0.250-0.499 0.500b
Basis . . . . . . . . . . . S S A B S S S S S
Mechanical Properties:Ftu, ksi:L . . . . . . . . . . . .LT . . . . . . . . . .
Fty, ksi:L . . . . . . . . . . . .LT . . . . . . . . . .
Fcy, ksi:L . . . . . . . . . . . .LT . . . . . . . . . .
Fsu, ksi . . . . . . . .Fbru, ksi:(e/D = 1.5) . . . .(e/D = 2.0) . . . .
Fbry, ksi:(e/D = 1.5) . . . .(e/D = 2.0) . . . .
e, percent (S-basis):LT . . . . . . . . . .
64 62
57 54
55 55 38
96122
78 90
5
67 65
59 56
57 57 39
100127
83 94
5
65 65
56 56
56 57 37
99127
83 98
5
66 66
58 58
58 59 37
100129
86101
...
63 63
56 56
56 56 36
96123
83 98
5
65 64
59 58
59 61 36
99128
84 99
3
70 69
65 64
65 67 39
107138
93109
4
68 68
62 62
62 65 39
105136
90105
4
67 67
61 61
61 64 38
104134
88104
4
E, 103 ksi:Primary . . . . . .Secondary . . . .
Ec, 103 ksi:Primary . . . . . .Secondary . . . .
10.5 9.5
10.7 9.7
10.510.0
10.710.2
10.710.2
10.910.4
10.5 9.5
10.7 9.7
10.510.0
10.710.2
10.510.2
10.910.4
G, 103 ksi . . . . . .µ . . . . . . . . . . . . .
...0.33
Physical Properties:�, lb/in.3 . . . . . . .C, K, and � . . . . .
0.100...
a Bearing values are “dry pin” values per Section 1.4.7.1.b These values have been adjusted to represent the average properties across the whole section, including the 2-½ percent nominal cladding thickness.
Alloy Sheet and Plate - ContinuedTable 3.2.3.0(e4). Design Mechanical and physical Properties of Clad 2024 Aluminum
MIL-HDBK-5H1 December 1998
3-78
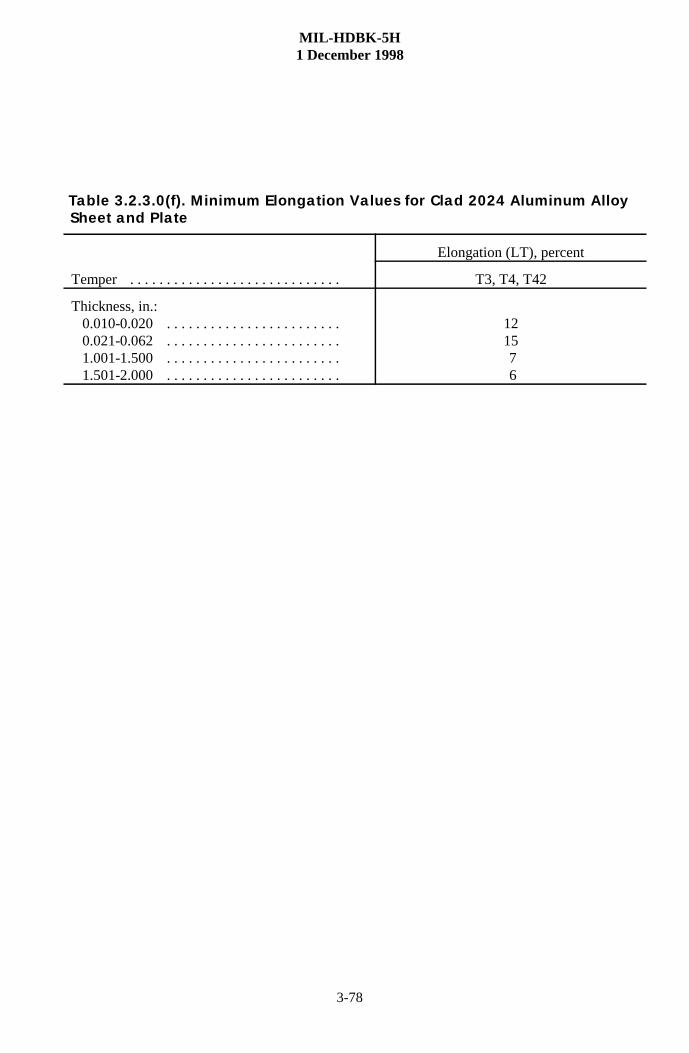
Temper . . . . . . . . . . . . . . . . . . . . . . . . . . . . .
Elongation (LT), percent
T3, T4, T42
Thickness, in.:0.010-0.020 . . . . . . . . . . . . . . . . . . . . . . . .0.021-0.062 . . . . . . . . . . . . . . . . . . . . . . . .1.001-1.500 . . . . . . . . . . . . . . . . . . . . . . . .1.501-2.000 . . . . . . . . . . . . . . . . . . . . . . . .
1215 7 6
Table 3.2.3.0(f). Minimum Elongation Values for Clad 2024 Aluminum Alloy Sheet and Plate
MIL-HDBK-5H1 December 1998
3-79
Specification . . . . . . . . . . . . . . . . . . . .AMS 4086 and WW-T-
700/3 WW-T-700/3
Form . . . . . . . . . . . . . . . . . . . . . . . . . . Drawn tubing
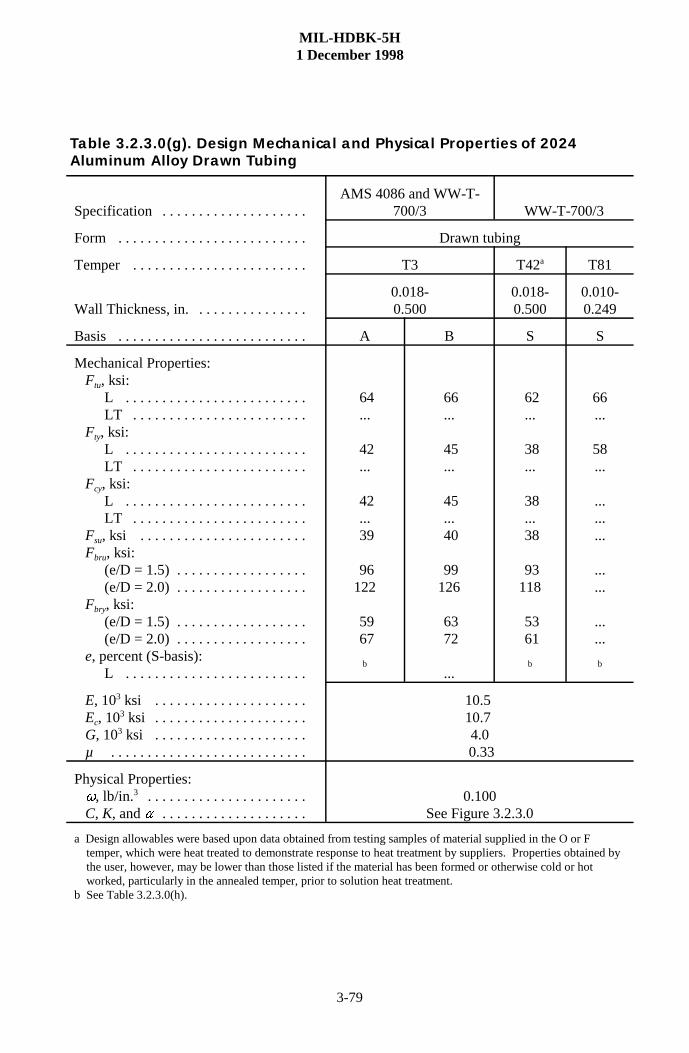
Temper . . . . . . . . . . . . . . . . . . . . . . . . T3 T42a T81
Wall Thickness, in. . . . . . . . . . . . . . . .0.018-0.500
0.018-0.500
0.010-0.249
Basis . . . . . . . . . . . . . . . . . . . . . . . . . . A B S S
Mechanical Properties:Ftu, ksi:
L . . . . . . . . . . . . . . . . . . . . . . . . .LT . . . . . . . . . . . . . . . . . . . . . . . .
Fty, ksi:L . . . . . . . . . . . . . . . . . . . . . . . . .LT . . . . . . . . . . . . . . . . . . . . . . . .
Fcy, ksi:L . . . . . . . . . . . . . . . . . . . . . . . . .LT . . . . . . . . . . . . . . . . . . . . . . . .
Fsu, ksi . . . . . . . . . . . . . . . . . . . . . . .Fbru, ksi:
(e/D = 1.5) . . . . . . . . . . . . . . . . . .(e/D = 2.0) . . . . . . . . . . . . . . . . . .
Fbry, ksi:(e/D = 1.5) . . . . . . . . . . . . . . . . . .(e/D = 2.0) . . . . . . . . . . . . . . . . . .
e, percent (S-basis):L . . . . . . . . . . . . . . . . . . . . . . . . .
64...
42...
42... 39
96122
59 67
b
66...
45...
45... 40
99126
63 72
...
62...
38...
38... 38
93118
53 61
b
66...
58...
...
...
...
...
...
...
...
b
E, 103 ksi . . . . . . . . . . . . . . . . . . . . .Ec, 103 ksi . . . . . . . . . . . . . . . . . . . . .G, 103 ksi . . . . . . . . . . . . . . . . . . . . .µ . . . . . . . . . . . . . . . . . . . . . . . . . . .
10.5 10.7 4.0 0.33
Physical Properties:�, lb/in.3 . . . . . . . . . . . . . . . . . . . . . .C, K, and � . . . . . . . . . . . . . . . . . . . .
0.100See Figure 3.2.3.0
a Design allowables were based upon data obtained from testing samples of material supplied in the O or F temper, which were heat treated to demonstrate response to heat treatment by suppliers. Properties obtained by the user, however, may be lower than those listed if the material has been formed or otherwise cold or hot worked, particularly in the annealed temper, prior to solution heat treatment.b See Table 3.2.3.0(h).
Table 3.2.3.0(g). Design Mechanical and Physical Properties of 2024Aluminum Alloy Drawn Tubing
MIL-HDBK-5H1 December 1998
3-80
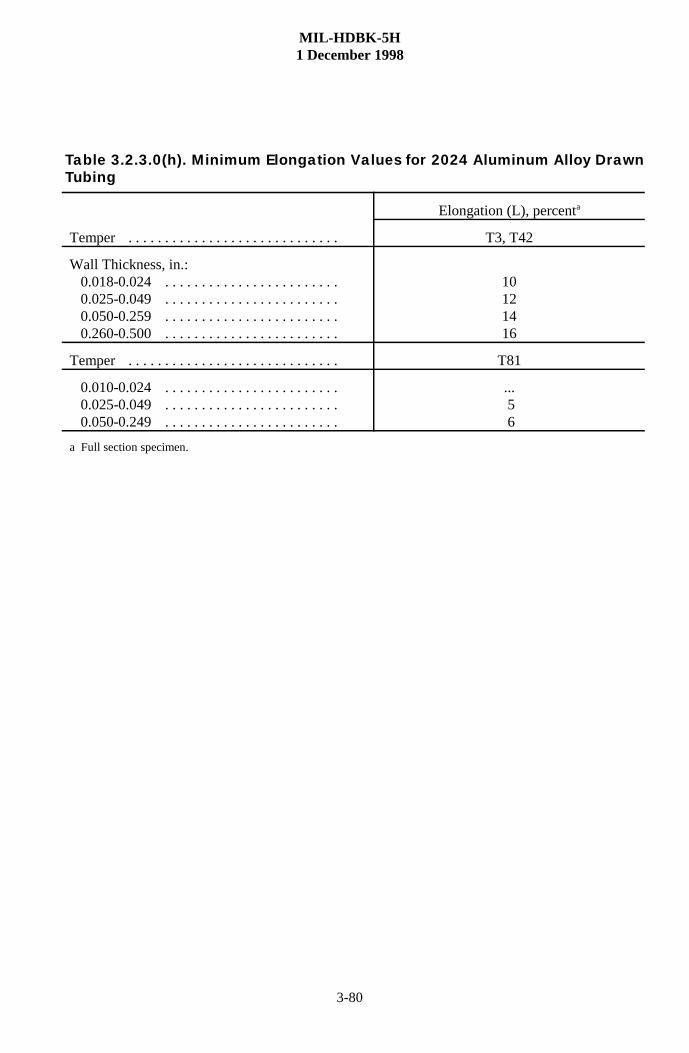
Temper . . . . . . . . . . . . . . . . . . . . . . . . . . . . .
Elongation (L), percenta
T3, T42
Wall Thickness, in.:0.018-0.024 . . . . . . . . . . . . . . . . . . . . . . . .0.025-0.049 . . . . . . . . . . . . . . . . . . . . . . . .0.050-0.259 . . . . . . . . . . . . . . . . . . . . . . . .0.260-0.500 . . . . . . . . . . . . . . . . . . . . . . . .
10121416
Temper . . . . . . . . . . . . . . . . . . . . . . . . . . . . . T81
0.010-0.024 . . . . . . . . . . . . . . . . . . . . . . . .0.025-0.049 . . . . . . . . . . . . . . . . . . . . . . . .0.050-0.249 . . . . . . . . . . . . . . . . . . . . . . . .
... 5 6
a Full section specimen.
Table 3.2.3.0(h). Minimum Elongation Values for 2024 Aluminum Alloy DrawnTubing
MIL-HDBK-5H, Change Notice 11 October 2001
3-81Supersedes page 3-81 of MIL-HDBK-5H
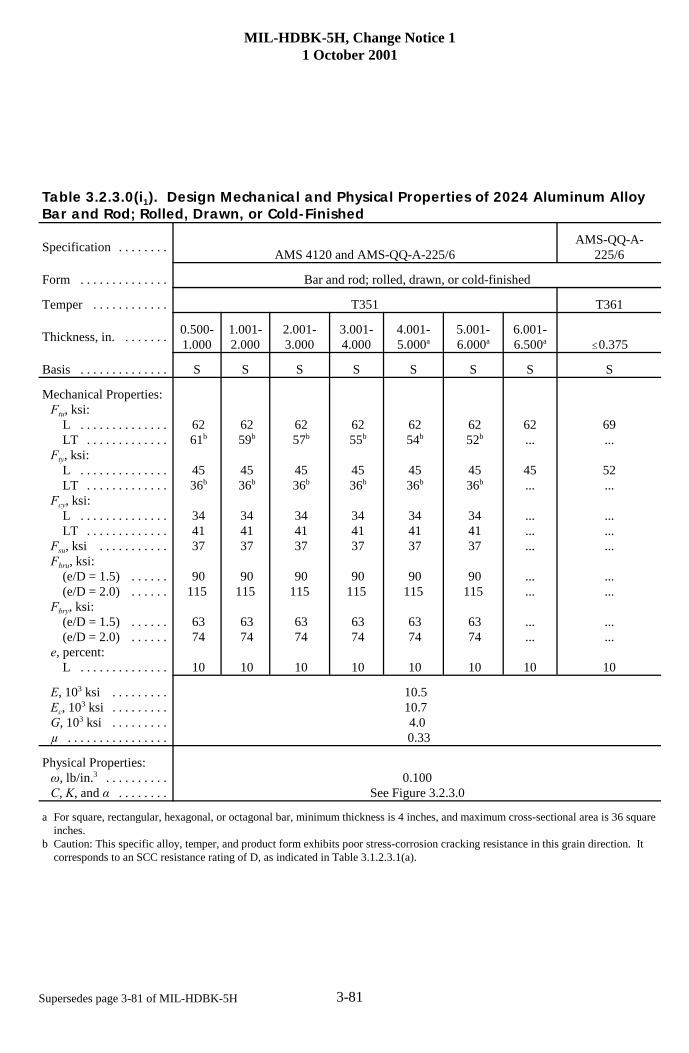
Table 3.2.3.0(i1). Design Mechanical and Physical Properties of 2024 Aluminum AlloyBar and Rod; Rolled, Drawn, or Cold-Finished
Specification . . . . . . . .AMS 4120 and AMS-QQ-A-225/6
AMS-QQ-A-225/6
Form . . . . . . . . . . . . . . Bar and rod; rolled, drawn, or cold-finished
Temper . . . . . . . . . . . . T351 T361
Thickness, in. . . . . . . .0.500-1.000
1.001-2.000
2.001-3.000
3.001-4.000
4.001-5.000a
5.001-6.000a
6.001-6.500a
#0.375
Basis . . . . . . . . . . . . . . S S S S S S S S
Mechanical Properties:Ftu, ksi:
L . . . . . . . . . . . . . .LT . . . . . . . . . . . . .
Fty, ksi:L . . . . . . . . . . . . . .LT . . . . . . . . . . . . .
Fcy, ksi:L . . . . . . . . . . . . . .LT . . . . . . . . . . . . .
Fsu, ksi . . . . . . . . . . .Fbru, ksi:
(e/D = 1.5) . . . . . .(e/D = 2.0) . . . . . .
Fbry, ksi:(e/D = 1.5) . . . . . .(e/D = 2.0) . . . . . .
e, percent:L . . . . . . . . . . . . . .
62 61b
45 36b
34 41 37
90115
63 74
10
62 59b
45 36b
34 41 37
90115
63 74
10
62 57b
45 36b
34 41 37
90115
63 74
10
62 55b
45 36b
34 41 37
90115
63 74
10
62 54b
45 36b
34 41 37
90115
63 74
10
62 52b
45 36b
34 41 37
90115
63 74
10
62...
45...
...
...
...
...
...
...
...
10
69...
52...
...
...
...
...
...
...
...
10
E, 103 ksi . . . . . . . . .Ec, 103 ksi . . . . . . . . .G, 103 ksi . . . . . . . . .µ . . . . . . . . . . . . . . . .
10.5 10.7 4.0 0.33
Physical Properties:ω, lb/in.3 . . . . . . . . . .C, K, and α . . . . . . . .
0.100See Figure 3.2.3.0
a For square, rectangular, hexagonal, or octagonal bar, minimum thickness is 4 inches, and maximum cross-sectional area is 36 squareinches.
b Caution: This specific alloy, temper, and product form exhibits poor stress-corrosion cracking resistance in this grain direction. Itcorresponds to an SCC resistance rating of D, as indicated in Table 3.1.2.3.1(a).
MIL
-HD
BK
-5H, C
hange Notice 1
1 October 2001
3-82Supersedes page 3-82 of M
IL-H
DB
K-5H
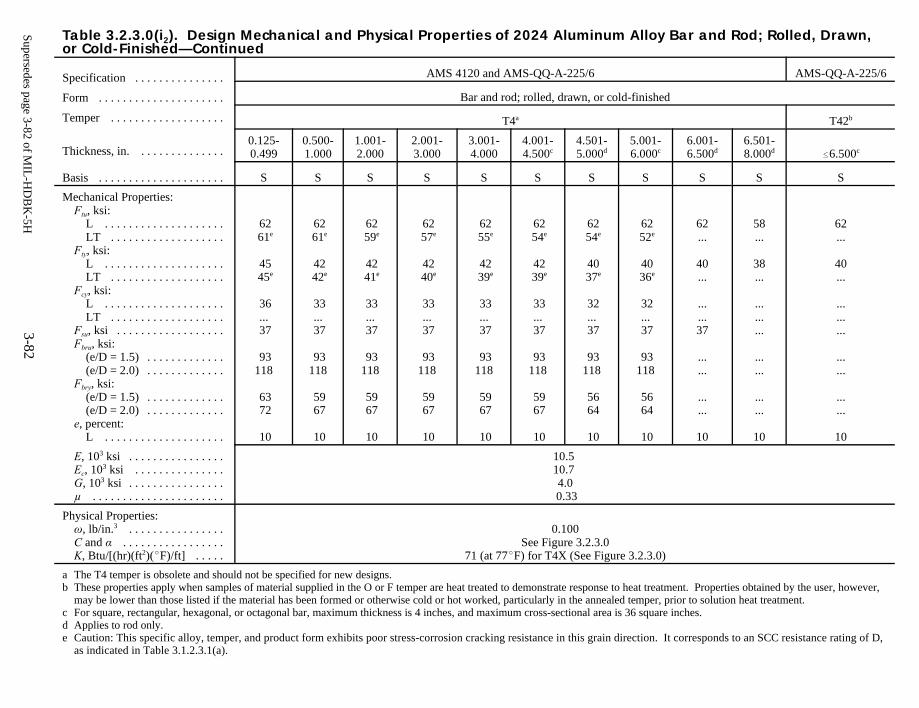
Table 3.2.3.0(i2). Design Mechanical and Physical Properties of 2024 Aluminum Alloy Bar and Rod; Rolled, Drawn,or Cold-Finished—Continued
Specification . . . . . . . . . . . . . . .
Form . . . . . . . . . . . . . . . . . . . . .
Temper . . . . . . . . . . . . . . . . . . .
Thickness, in. . . . . . . . . . . . . . .
Basis . . . . . . . . . . . . . . . . . . . . .
AMS 4120 and AMS-QQ-A-225/6 AMS-QQ-A-225/6
Bar and rod; rolled, drawn, or cold-finished
T4a T42b
0.125-0.499
0.500-1.000
1.001-2.000
2.001-3.000
3.001-4.000
4.001-4.500c
4.501-5.000d
5.001-6.000c
6.001-6.500d
6.501-8.000d
#6.500c
S S S S S S S S S S S
Mechanical Properties:Ftu, ksi:
L . . . . . . . . . . . . . . . . . . . .LT . . . . . . . . . . . . . . . . . . .
Fty, ksi:L . . . . . . . . . . . . . . . . . . . .LT . . . . . . . . . . . . . . . . . . .
Fcy, ksi:L . . . . . . . . . . . . . . . . . . . .LT . . . . . . . . . . . . . . . . . . .
Fsu, ksi . . . . . . . . . . . . . . . . . .Fbru, ksi:
(e/D = 1.5) . . . . . . . . . . . . .(e/D = 2.0) . . . . . . . . . . . . .
Fbry, ksi:(e/D = 1.5) . . . . . . . . . . . . .(e/D = 2.0) . . . . . . . . . . . . .
e, percent:L . . . . . . . . . . . . . . . . . . . .
62 61e
45 45e
36...
37
93118
63 72
10
62 61e
42 42e
33...
37
93118
59 67
10
62 59e
42 41e
33...
37
93118
59 67
10
62 57e
42 40e
33...
37
93118
59 67
10
62 55e
42 39e
33...
37
93118
59 67
10
62 54e
42 39e
33...
37
93118
59 67
10
62 54e
40 37e
32...
37
93118
56 64
10
62 52e
40 36e
32...
37
93118
56 64
10
62...
40...
...
...37
...
...
...
...
10
58...
38...
...
...
...
...
...
...
...
10
62...
40...
...
...
...
...
...
...
...
10
E, 103 ksi . . . . . . . . . . . . . . . .Ec, 103 ksi . . . . . . . . . . . . . . .G, 103 ksi . . . . . . . . . . . . . . . .µ . . . . . . . . . . . . . . . . . . . . . .
10.5 10.7 4.0 0.33
Physical Properties:ω, lb/in.3 . . . . . . . . . . . . . . . .C and α . . . . . . . . . . . . . . . . .K, Btu/[(hr)(ft2)(EF)/ft] . . . . .
0.100See Figure 3.2.3.0
71 (at 77EF) for T4X (See Figure 3.2.3.0)
a The T4 temper is obsolete and should not be specified for new designs.b These properties apply when samples of material supplied in the O or F temper are heat treated to demonstrate response to heat treatment. Properties obtained by the user, however,
may be lower than those listed if the material has been formed or otherwise cold or hot worked, particularly in the annealed temper, prior to solution heat treatment.c For square, rectangular, hexagonal, or octagonal bar, maximum thickness is 4 inches, and maximum cross-sectional area is 36 square inches.d Applies to rod only.e Caution: This specific alloy, temper, and product form exhibits poor stress-corrosion cracking resistance in this grain direction. It corresponds to an SCC resistance rating of D,
as indicated in Table 3.1.2.3.1(a).
MIL-HDBK-5H, Change Notice 11 October 2001
3-83Supersedes page 3-83 of MIL-HDBK-5H
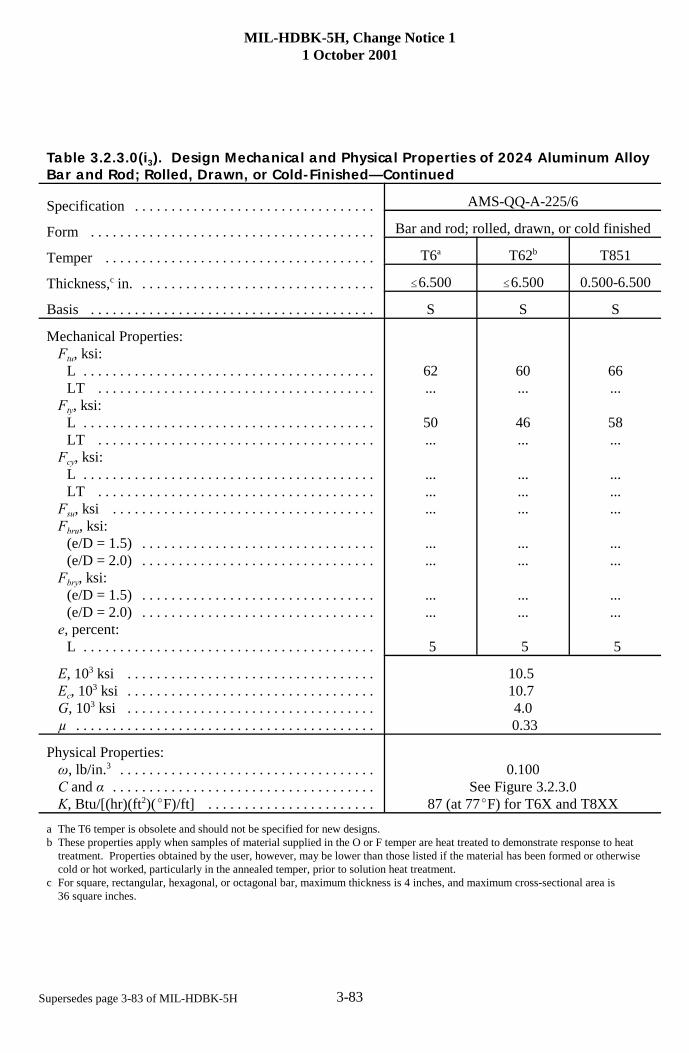
Table 3.2.3.0(i3). Design Mechanical and Physical Properties of 2024 Aluminum AlloyBar and Rod; Rolled, Drawn, or Cold-Finished—Continued
Specification . . . . . . . . . . . . . . . . . . . . . . . . . . . . . . . . .
Form . . . . . . . . . . . . . . . . . . . . . . . . . . . . . . . . . . . . . . .
Temper . . . . . . . . . . . . . . . . . . . . . . . . . . . . . . . . . . . . .
Thickness,c in. . . . . . . . . . . . . . . . . . . . . . . . . . . . . . . . .
Basis . . . . . . . . . . . . . . . . . . . . . . . . . . . . . . . . . . . . . . .
AMS-QQ-A-225/6
Bar and rod; rolled, drawn, or cold finished
T6a T62b T851
#6.500 #6.500 0.500-6.500
S S S
Mechanical Properties:Ftu, ksi:
L . . . . . . . . . . . . . . . . . . . . . . . . . . . . . . . . . . . . . . . .LT . . . . . . . . . . . . . . . . . . . . . . . . . . . . . . . . . . . . . .Fty, ksi:
L . . . . . . . . . . . . . . . . . . . . . . . . . . . . . . . . . . . . . . . .LT . . . . . . . . . . . . . . . . . . . . . . . . . . . . . . . . . . . . . .Fcy, ksi:
L . . . . . . . . . . . . . . . . . . . . . . . . . . . . . . . . . . . . . . . .LT . . . . . . . . . . . . . . . . . . . . . . . . . . . . . . . . . . . . . .Fsu, ksi . . . . . . . . . . . . . . . . . . . . . . . . . . . . . . . . . . . .Fbru, ksi:
(e/D = 1.5) . . . . . . . . . . . . . . . . . . . . . . . . . . . . . . . .(e/D = 2.0) . . . . . . . . . . . . . . . . . . . . . . . . . . . . . . . .Fbry, ksi:
(e/D = 1.5) . . . . . . . . . . . . . . . . . . . . . . . . . . . . . . . .(e/D = 2.0) . . . . . . . . . . . . . . . . . . . . . . . . . . . . . . . .e, percent:
L . . . . . . . . . . . . . . . . . . . . . . . . . . . . . . . . . . . . . . . .
62...
50...
...
...
...
...
...
...
...
5
60...
46...
...
...
...
...
...
...
...
5
66...
58...
...
...
...
...
...
...
...
5
E, 103 ksi . . . . . . . . . . . . . . . . . . . . . . . . . . . . . . . . . .Ec, 103 ksi . . . . . . . . . . . . . . . . . . . . . . . . . . . . . . . . . .G, 103 ksi . . . . . . . . . . . . . . . . . . . . . . . . . . . . . . . . . .µ . . . . . . . . . . . . . . . . . . . . . . . . . . . . . . . . . . . . . . . . .
10.5 10.7 4.0 0.33
Physical Properties:ω, lb/in.3 . . . . . . . . . . . . . . . . . . . . . . . . . . . . . . . . . . .C and α . . . . . . . . . . . . . . . . . . . . . . . . . . . . . . . . . . . .K, Btu/[(hr)(ft2)(EF)/ft] . . . . . . . . . . . . . . . . . . . . . . .
0.100See Figure 3.2.3.0
87 (at 77EF) for T6X and T8XX
a The T6 temper is obsolete and should not be specified for new designs.b These properties apply when samples of material supplied in the O or F temper are heat treated to demonstrate response to heat
treatment. Properties obtained by the user, however, may be lower than those listed if the material has been formed or otherwisecold or hot worked, particularly in the annealed temper, prior to solution heat treatment.
c For square, rectangular, hexagonal, or octagonal bar, maximum thickness is 4 inches, and maximum cross-sectional area is36 square inches.
MIL
-HD
BK
-5H, C
hange Notice 1
1 October 2001
3-84Supersedes page 3-84 of M
IL-H
DB
K-5H
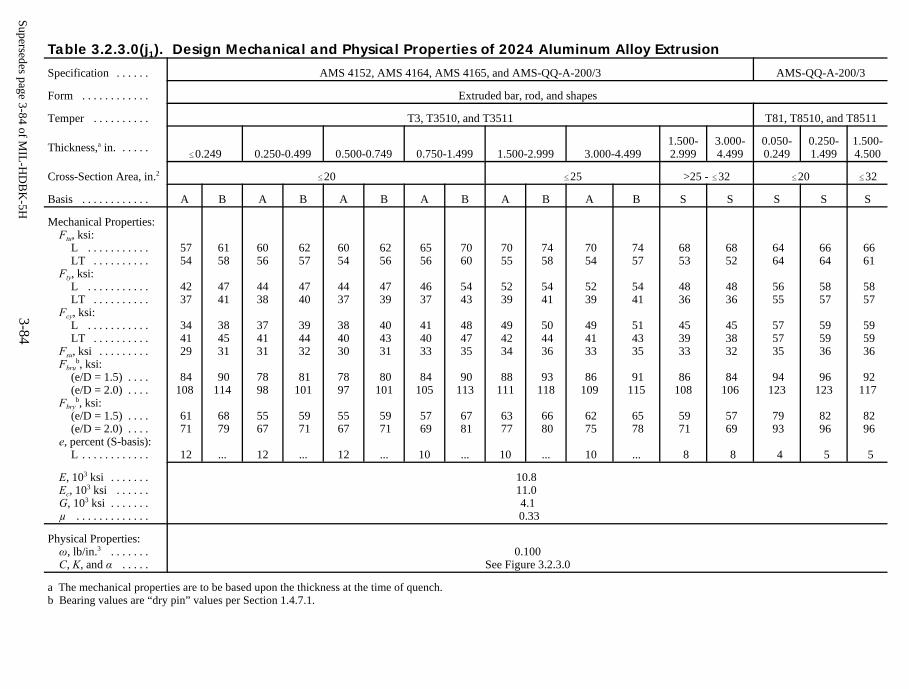
Table 3.2.3.0(j1). Design Mechanical and Physical Properties of 2024 Aluminum Alloy Extrusion
Specification . . . . . . AMS 4152, AMS 4164, AMS 4165, and AMS-QQ-A-200/3 AMS-QQ-A-200/3
Form . . . . . . . . . . . . Extruded bar, rod, and shapes
Temper . . . . . . . . . . T3, T3510, and T3511 T81, T8510, and T8511
Thickness,a in. . . . . .#0.249 0.250-0.499 0.500-0.749 0.750-1.499 1.500-2.999 3.000-4.499
1.500-2.999
3.000-4.499
0.050-0.249
0.250-1.499
1.500-4.500
Cross-Section Area, in.2 #20 #25 >25 - #32 #20 #32
Basis . . . . . . . . . . . . A B A B A B A B A B A B S S S S S
Mechanical Properties:Ftu, ksi:
L . . . . . . . . . . .LT . . . . . . . . . .
Fty, ksi:L . . . . . . . . . . .LT . . . . . . . . . .
Fcy, ksi:L . . . . . . . . . . .LT . . . . . . . . . .
Fsu, ksi . . . . . . . . .Fbrub, ksi:
(e/D = 1.5) . . . .(e/D = 2.0) . . . .
Fbryb, ksi:(e/D = 1.5) . . . .(e/D = 2.0) . . . .
e, percent (S-basis):L . . . . . . . . . . . .
57 54
42 37
34 41 29
84108
61 71
12
61 58
47 41
38 45 31
90114
68 79
...
6056
4438
374131
7898
5567
12
62 57
47 40
39 44 32
81101
59 71
...
6054
4437
384030
7897
5567
12
62 56
47 39
40 43 31
80101
59 71
...
65 56
46 37
41 40 33
84105
57 69
10
70 60
54 43
48 47 35
90113
67 81
...
70 55
52 39
49 42 34
88111
63 77
10
74 58
54 41
50 44 36
93118
66 80
...
70 54
52 39
49 41 33
86109
62 75
10
74 57
54 41
51 43 35
91115
65 78
...
68 53
48 36
45 39 33
86108
59 71
8
68 52
48 36
45 38 32
84106
57 69
8
64 64
56 55
57 57 35
94123
79 93
4
66 64
58 57
59 59 36
96123
82 96
5
66 61
58 57
59 59 36
92117
82 96
5
E, 103 ksi . . . . . . .Ec, 103 ksi . . . . . .G, 103 ksi . . . . . . .µ . . . . . . . . . . . . .
10.8 11.0 4.1 0.33
Physical Properties:ω, lb/in.3 . . . . . . .C, K, and α . . . . .
0.100See Figure 3.2.3.0
a The mechanical properties are to be based upon the thickness at the time of quench.b Bearing values are “dry pin” values per Section 1.4.7.1.
MIL
-HD
BK
-5H, C
hange Notice 1
1 October 2001
3-85Supersedes page 3-85 of M
IL-H
DB
K-5H
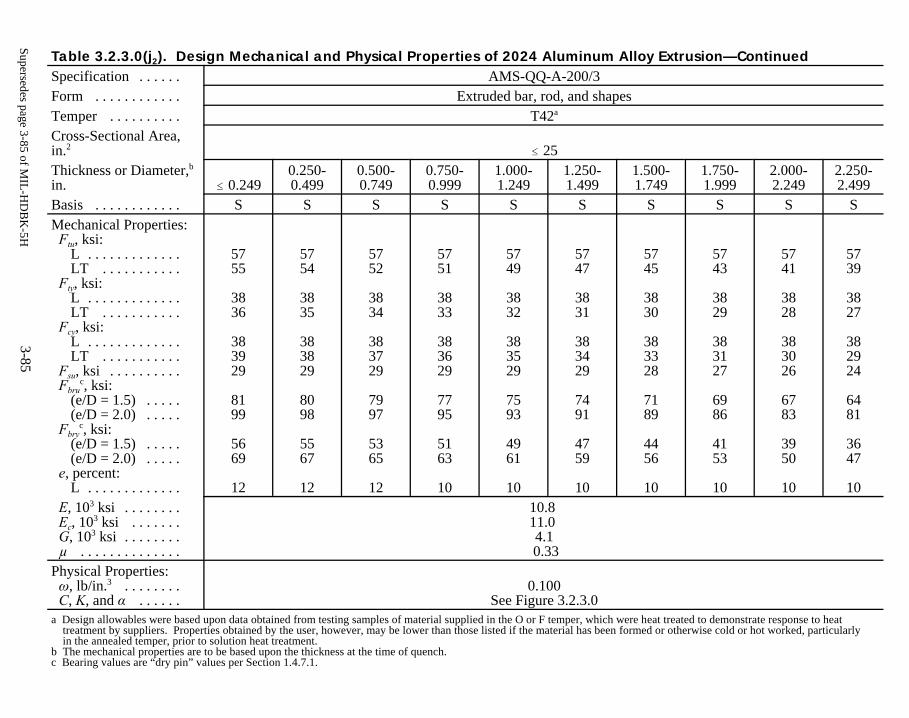
Table 3.2.3.0(j2). Design Mechanical and Physical Properties of 2024 Aluminum Alloy Extrusion—ContinuedSpecification . . . . . . AMS-QQ-A-200/3Form . . . . . . . . . . . . Extruded bar, rod, and shapesTemper . . . . . . . . . . T42a
Cross-Sectional Area,in.2 # 25Thickness or Diameter,b
in. # 0.2490.250-0.499
0.500-0.749
0.750-0.999
1.000-1.249
1.250-1.499
1.500-1.749
1.750-1.999
2.000-2.249
2.250-2.499
Basis . . . . . . . . . . . . S S S S S S S S S SMechanical Properties:Ftu, ksi:
L . . . . . . . . . . . . .LT . . . . . . . . . . .
Fty, ksi:L . . . . . . . . . . . . .LT . . . . . . . . . . .
Fcy, ksi:L . . . . . . . . . . . . .LT . . . . . . . . . . .
Fsu, ksi . . . . . . . . . .Fbruc, ksi:
(e/D = 1.5) . . . . .(e/D = 2.0) . . . . .
Fbryc, ksi:(e/D = 1.5) . . . . .(e/D = 2.0) . . . . .
e, percent:L . . . . . . . . . . . . .
5755
3836
383929
8199
5669
12
5754
3835
383829
8098
5567
12
5752
3834
383729
7997
5365
12
5751
3833
383629
7795
5163
10
5749
3832
383529
7593
4961
10
5747
3831
383429
7491
4759
10
5745
3830
383328
7189
4456
10
5743
3829
383127
6986
4153
10
5741
3828
383026
6783
3950
10
5739
3827
382924
6481
3647
10E, 103 ksi . . . . . . . .Ec, 103 ksi . . . . . . .G, 103 ksi . . . . . . . .µ . . . . . . . . . . . . . .
10.8 11.0 4.1 0.33
Physical Properties:ω, lb/in.3 . . . . . . . .C, K, and α . . . . . .
0.100See Figure 3.2.3.0
a Design allowables were based upon data obtained from testing samples of material supplied in the O or F temper, which were heat treated to demonstrate response to heat treatment by suppliers. Properties obtained by the user, however, may be lower than those listed if the material has been formed or otherwise cold or hot worked, particularly in the annealed temper, prior to solution heat treatment.b The mechanical properties are to be based upon the thickness at the time of quench.c Bearing values are “dry pin” values per Section 1.4.7.1.
MIL-HDBK-5H1 December 1998
3-86
Temperature, F
-400 -200 0 200 400 600 800 1000
Per
cent
Ftu
at R
oom
Tem
pera
ture
0
20
40
60
80
100
120
140
160
180
200
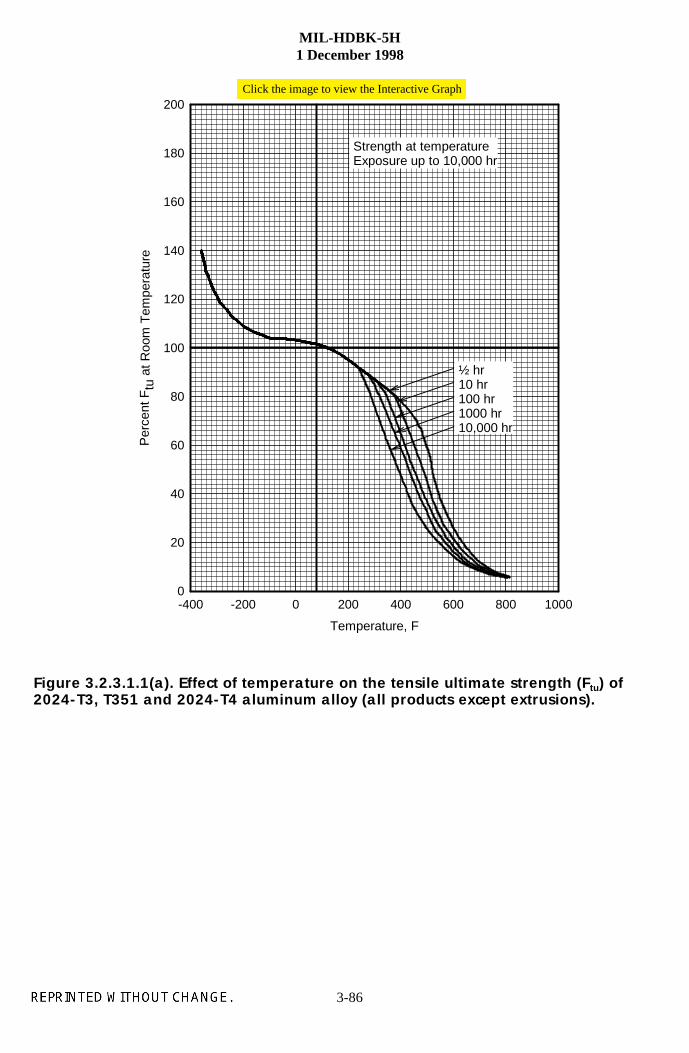
Strength at temperatureExposure up to 10,000 hr
½ hr10 hr100 hr1000 hr10,000 hr
Click the image to view the Interactive Graph
2024-T3, T351 and 2024-T4 aluminum alloy (all products except extrusions).Figure 3.2.3.1.1(a). Effect of temperature on the tensile ultimate strength (Ftu) of
MIL-HDBK-5H1 December 1998
3-87
Temperature, F
-400 -200 0 200 400 600 800 1000
Per
cent
age
Fty
at r
oom
tem
erat
ure
0
20
40
60
80
100
120
140
160
180
200
½ hr10 hr100 hr1000 hr10,000 hr
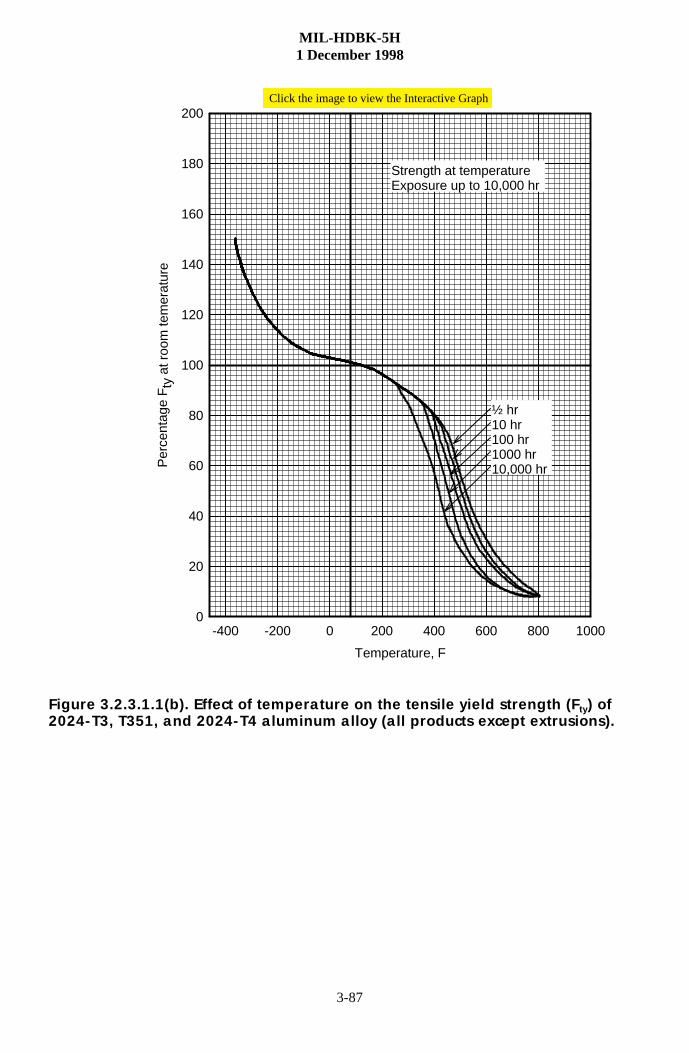
Strength at temperatureExposure up to 10,000 hr
Click the image to view the Interactive Graph
2024-T3, T351, and 2024-T4 aluminum alloy (all products except extrusions).Figure 3.2.3.1.1(b). Effect of temperature on the tensile yield strength (Fty) of
MIL-HDBK-5H1 December 1998
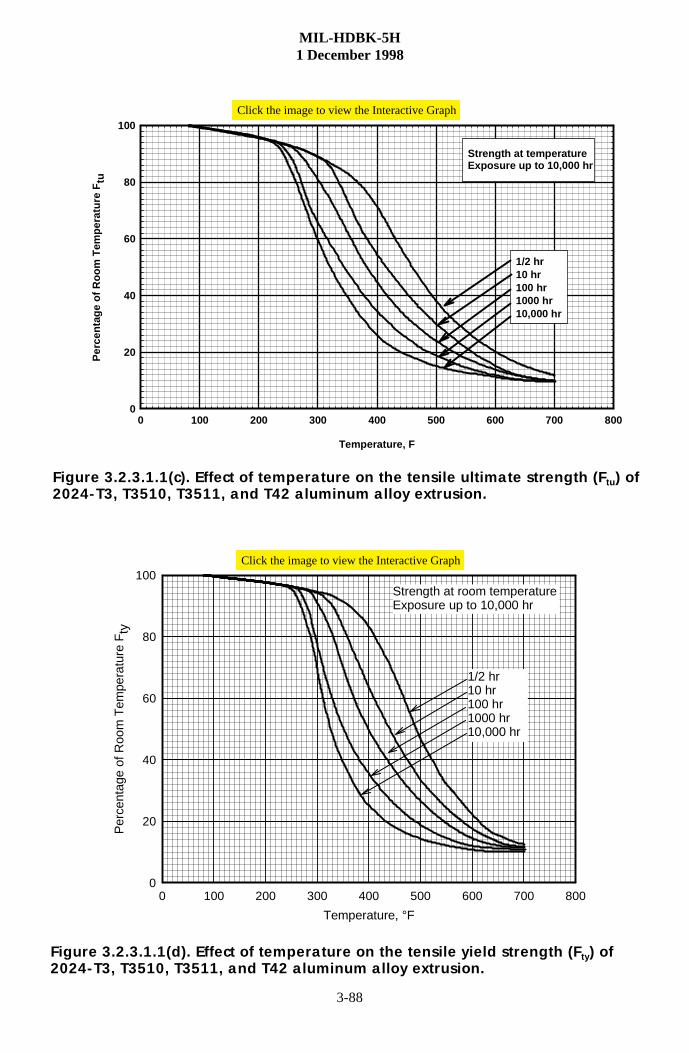
3-88
Temperature, °F
0 100 200 300 400 500 600 700 800
Per
cent
age
of R
oom
Tem
pera
ture
Fty
0
20
40
60
80
100
1/2 hr10 hr100 hr1000 hr10,000 hr
Strength at room temperatureExposure up to 10,000 hr
Temperature, F
0 100 200 300 400 500 600 700 800
Per
cent
age
of R
oom
Tem
pera
ture
Ftu
0
20
40
60
80
100
Strength at temperatureExposure up to 10,000 hr
1/2 hr10 hr100 hr1000 hr10,000 hr
Click the image to view the Interactive Graph
Click the image to view the Interactive Graph
2024-T3, T3510, T3511, and T42 aluminum alloy extrusion. Figure 3.2.3.1.1(c). Effect of temperature on the tensile ultimate strength (Ftu) of
2024-T3, T3510, T3511, and T42 aluminum alloy extrusion. Figure 3.2.3.1.1(d). Effect of temperature on the tensile yield strength (Fty) of
MIL-HDBK-5H1 December 1998
3-89
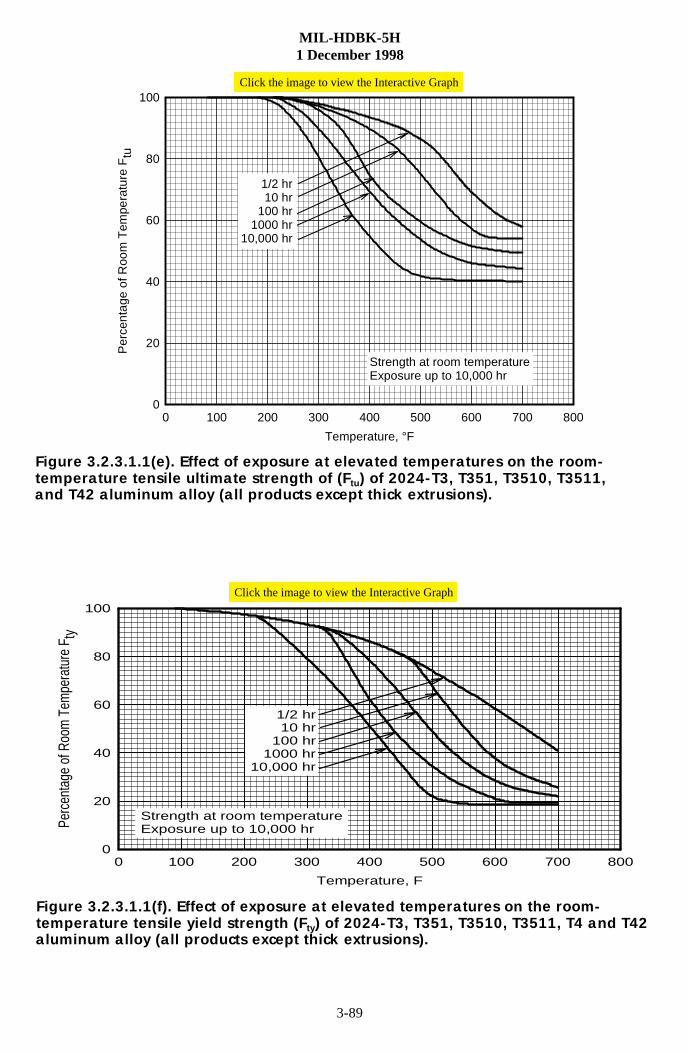
Temperature, °F
0 100 200 300 400 500 600 700 800
Per
cent
age
of R
oom
Tem
pera
ture
Ftu
0
20
40
60
80
100
1/2 hr10 hr
100 hr1000 hr
10,000 hr
Strength at room temperatureExposure up to 10,000 hr
Temperature, F
0 100 200 300 400 500 600 700 800
Perc
enta
ge o
f Roo
m T
empe
ratu
re F
ty
0
20
40
60
80
100
1/2 hr10 hr
100 hr1000 hr
10,000 hr
Strength at room temperatureExposure up to 10,000 hr
Click the image to view the Interactive Graph
Click the image to view the Interactive Graph
Figure 3.2.3.1.1(e). Effect of exposure at elevated temperatures on the room-
and T42 aluminum alloy (all products except thick extrusions).temperature tensile ultimate strength of (Ftu) of 2024-T3, T351, T3510, T3511,
Figure 3.2.3.1.1(f). Effect of exposure at elevated temperatures on the room-
aluminum alloy (all products except thick extrusions).temperature tensile yield strength (Fty) of 2024-T3, T351, T3510, T3511, T4 and T42
MIL-HDBK-5H1 December 1998
3-90
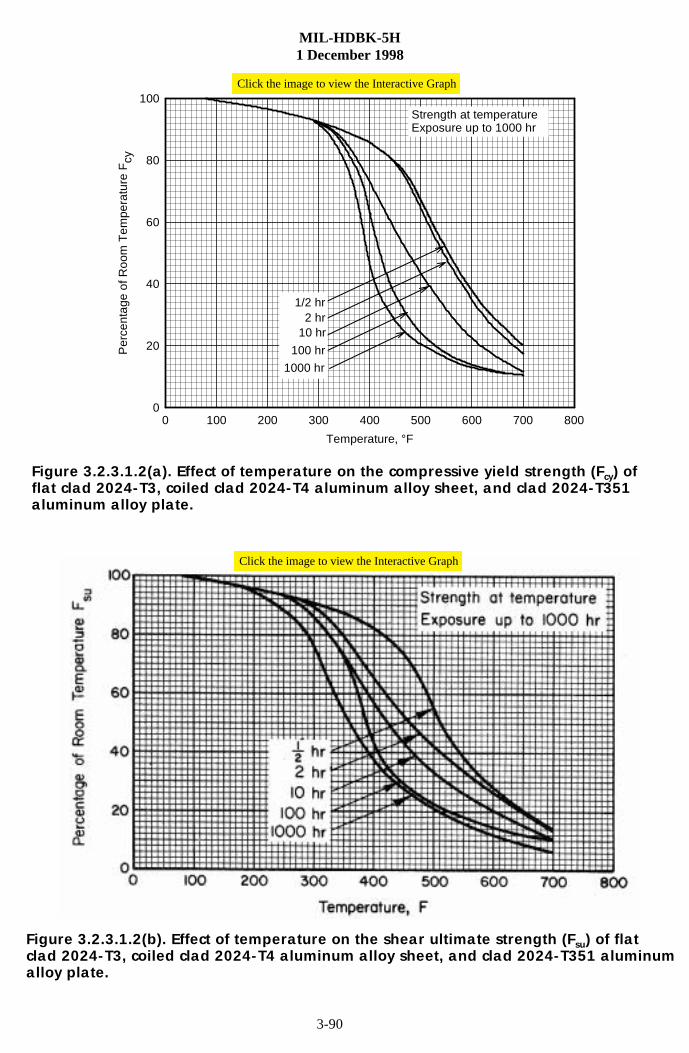
Temperature, °F
0 100 200 300 400 500 600 700 800
Per
cent
age
of R
oom
Tem
pera
ture
Fcy
0
20
40
60
80
100Strength at temperatureExposure up to 1000 hr
1/2 hr2 hr
10 hr
100 hr
1000 hr
Click the image to view the Interactive Graph
flat clad 2024-T3, coiled clad 2024-T4 aluminum alloy sheet, and clad 2024-T351 aluminum alloy plate.
clad 2024-T3, coiled clad 2024-T4 aluminum alloy sheet, and clad 2024-T351 aluminum alloy plate.
Figure 3.2.3.1.2(a). Effect of temperature on the compressive yield strength (Fcy) of
Figure 3.2.3.1.2(b). Effect of temperature on the shear ultimate strength (Fsu) of flat
Click the image to view the Interactive Graph
MIL-HDBK-5H1 December 1998
3-91
7HPSHUDWXUH� �)
� ��� ��� ��� ��� ��� ��� ��� ���
3HUFHQWDJHRI5RRP
7HPSHUDWXUH
)EUX
�
��
��
��
��
���
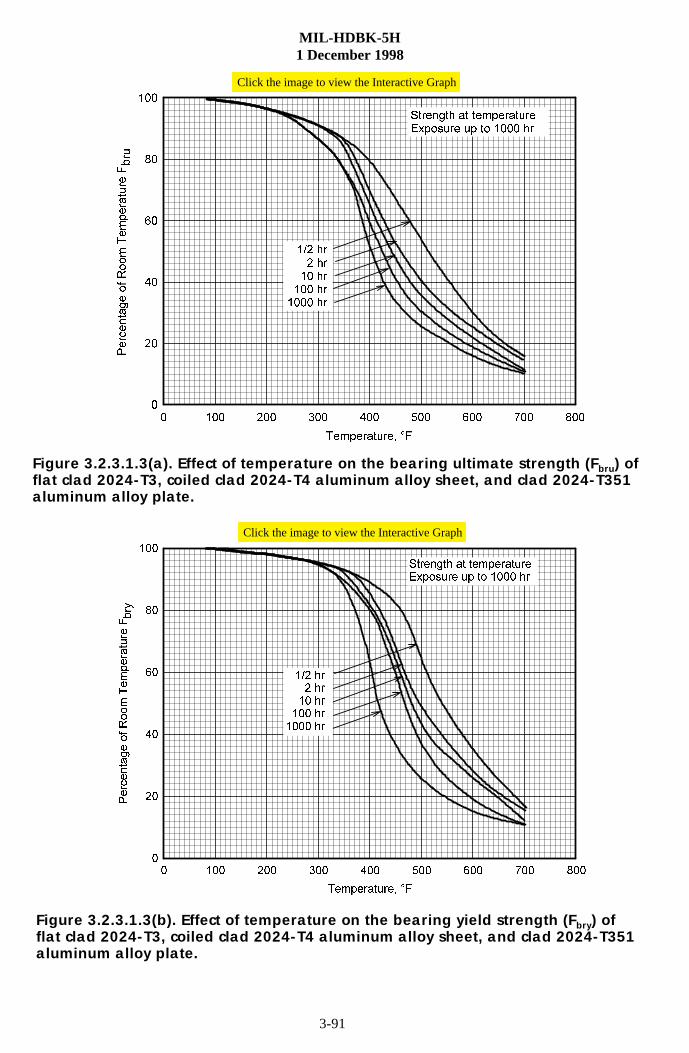
��� KU� KU
�� KU��� KU
���� KU
6WUHQJWK DW WHPSHUDWXUH([SRVXUH XS WR ���� KU
7HPSHUDWXUH� �)
� ��� ��� ��� ��� ��� ��� ��� ���
3HUFHQWDJHRI5RRP
7HPSHUDWXUH
)EU\
�
��
��
��
��
���
��� KU� KU
�� KU��� KU
���� KU
6WUHQJWK DW WHPSHUDWXUH([SRVXUH XS WR ���� KU
Click the image to view the Interactive Graph
Click the image to view the Interactive Graph
flat clad 2024-T3, coiled clad 2024-T4 aluminum alloy sheet, and clad 2024-T351 aluminum alloy plate.
flat clad 2024-T3, coiled clad 2024-T4 aluminum alloy sheet, and clad 2024-T351 aluminum alloy plate.
Figure 3.2.3.1.3(a). Effect of temperature on the bearing ultimate strength (Fbru) of
Figure 3.2.3.1.3(b). Effect of temperature on the bearing yield strength (Fbry) of
MIL-HDBK-5H1 December 1998
3-92
7HPSHUDWXUH� �)
� ��� ��� ��� ��� ��� ��� ��� ���
3HUFHQW(ORQJDWLRQ�H�
�
��
��
��
��
���
������ KU���� KU��� KU�� KU��� KU
(ORQJDWLRQ DW WHPSHUDWXUH([SRVXUH XS WR ������ KU 7<3,&$/
Click the image to view the Interactive Graph
Click the image to view the Interactive Graph
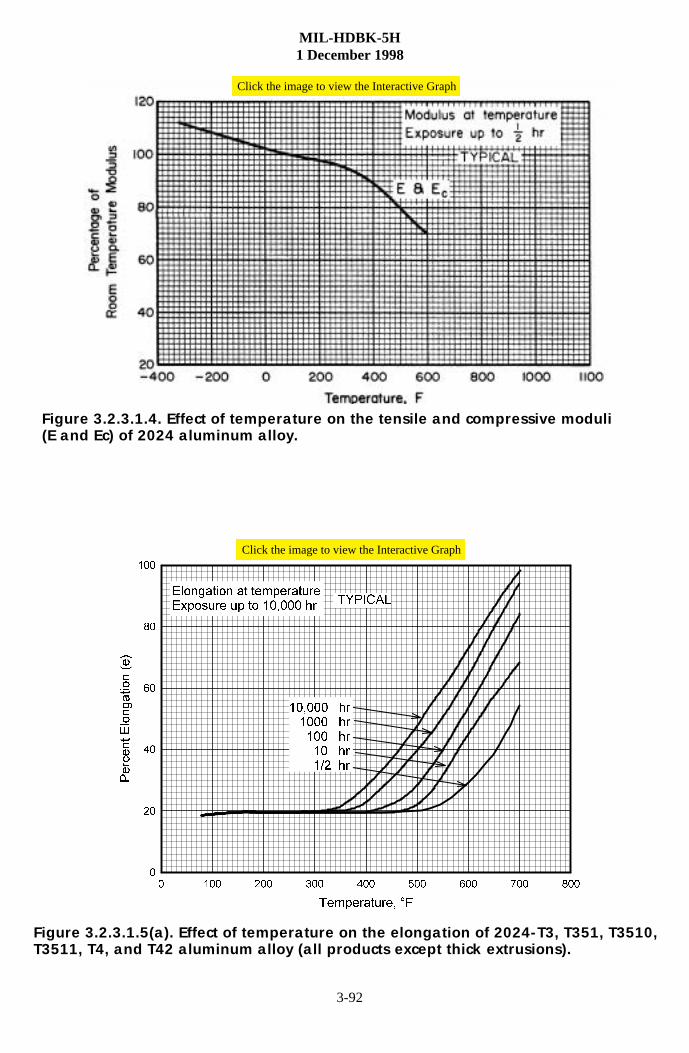
(E and Ec) of 2024 aluminum alloy.Figure 3.2.3.1.4. Effect of temperature on the tensile and compressive moduli
T3511, T4, and T42 aluminum alloy (all products except thick extrusions).Figure 3.2.3.1.5(a). Effect of temperature on the elongation of 2024-T3, T351, T3510,
MIL-HDBK-5H1 December 1998
3-93
7HPSHUDWXUH� �)
� ��� ��� ��� ��� ��� ��� ��� ���
3HUFHQW(ORQJDWLRQ�H�
�
��
��
��
��
���
��� KU�� KU
��� KU���� KU
������ KU
(ORQJDWLRQ DW URRP WHPSHUDWXUH([SRVXUH XS WR ������ KU
7<3,&$/
Click the image to view the Interactive Graph
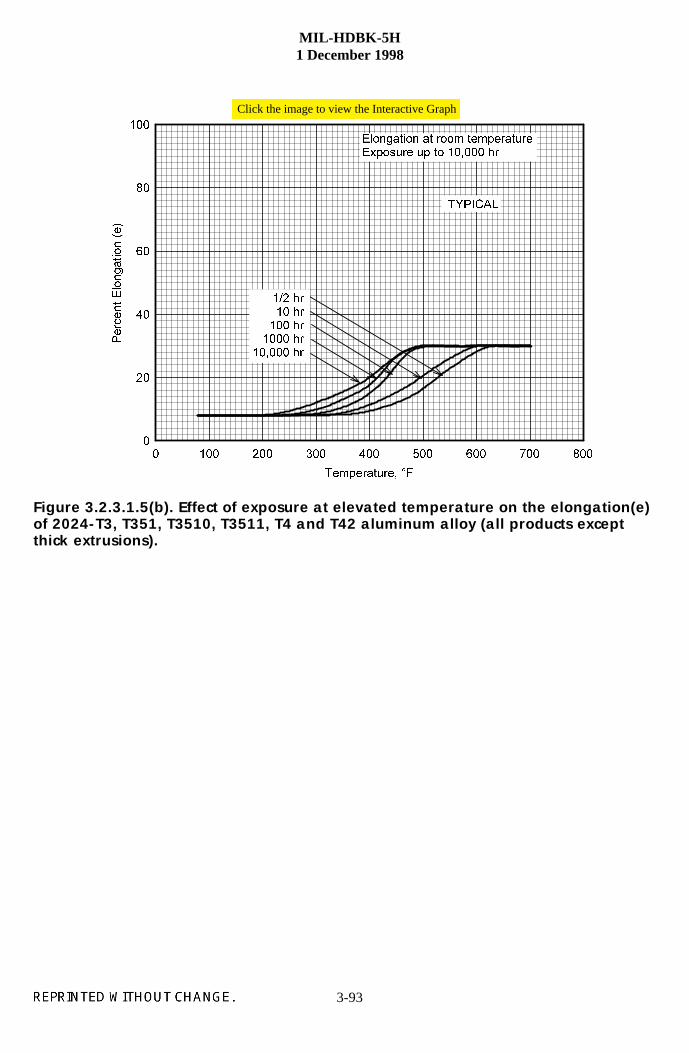
of 2024-T3, T351, T3510, T3511, T4 and T42 aluminum alloy (all products exceptthick extrusions).
Figure 3.2.3.1.5(b). Effect of exposure at elevated temperature on the elongation(e)
MIL-HDBK-5H, Change Notice 11 October 2001
3-94Supersedes page 3-94 of MIL-HDBK-5H
0
20
40
60
80
100
0 2 4 6 8 10 12
Strain, 0.001 in./in.Compressive Tangent Modulus, 103 ksi
Str
ess,
ksi
Ramberg - Osgoodn(L-tension) = 50
n(LT-tension) = 12n (L-comp.) = 15
n (LT-comp.) = 11
Thickness ≤ 0.249 in.
L - compression
TYPICAL
LT - compression
L - compression
LT - compression
LT - tension
L - tension
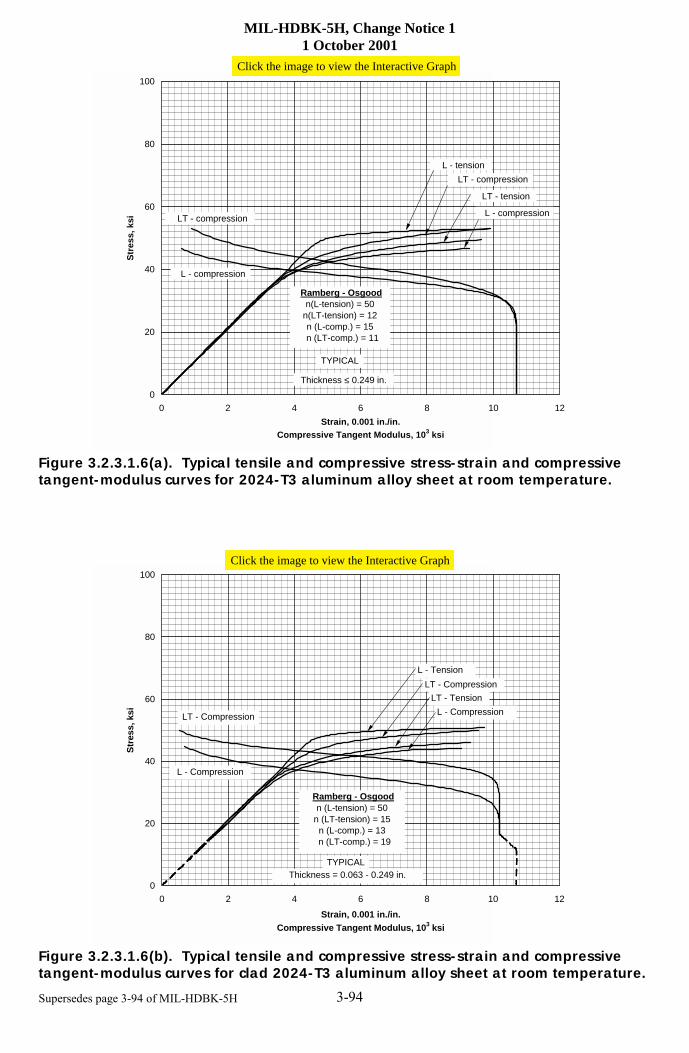
Figure 3.2.3.1.6(a). Typical tensile and compressive stress-strain and compressivetangent-modulus curves for 2024-T3 aluminum alloy sheet at room temperature.
0
20
40
60
80
100
0 2 4 6 8 10 12
Strain, 0.001 in./in. Compressive Tangent Modulus, 103 ksi
Str
ess,
ksi
Ramberg - Osgoodn (L-tension) = 50
n (LT-tension) = 15n (L-comp.) = 13
n (LT-comp.) = 19
Thickness = 0.063 - 0.249 in.TYPICAL
LT - Tension
LT - Compression
LT - Compression
L - Tension
L - Compression
L - Compression
Figure 3.2.3.1.6(b). Typical tensile and compressive stress-strain and compressivetangent-modulus curves for clad 2024-T3 aluminum alloy sheet at room temperature.
Click the image to view the Interactive Graph
Click the image to view the Interactive Graph
MIL-HDBK-5H1 December 1998
3-95
0
20
40
60
80
100
0 2 4 6 8 10 12
Strain, 0.001 in./in.Compressive Tangent Modulus, 10 3 ksi
Str
ess,
ksi
Ramberg - Osgood n (2-hr exp.) = 8.0
Long Transverse
2-hr exposure
TYPICAL
0
20
40
60
80
100
0 2 4 6 8 10 12Strain, 0.001 in./in.
Compressive Tangent Modulus, 10 3 ksi
Str
ess,
ksi
Ramberg - Osgood n (1/2-hr exp.) = 9.6n (10-hr exp.) = 9.3n (100-hr exp.) = 8.0n (1000-hr exp.) = 10
Long Transverse
1000-hr exposure100-hr exposure10-hr exposure1/2-hr exposure
TYPICAL
Click the image to view the Interactive Graph
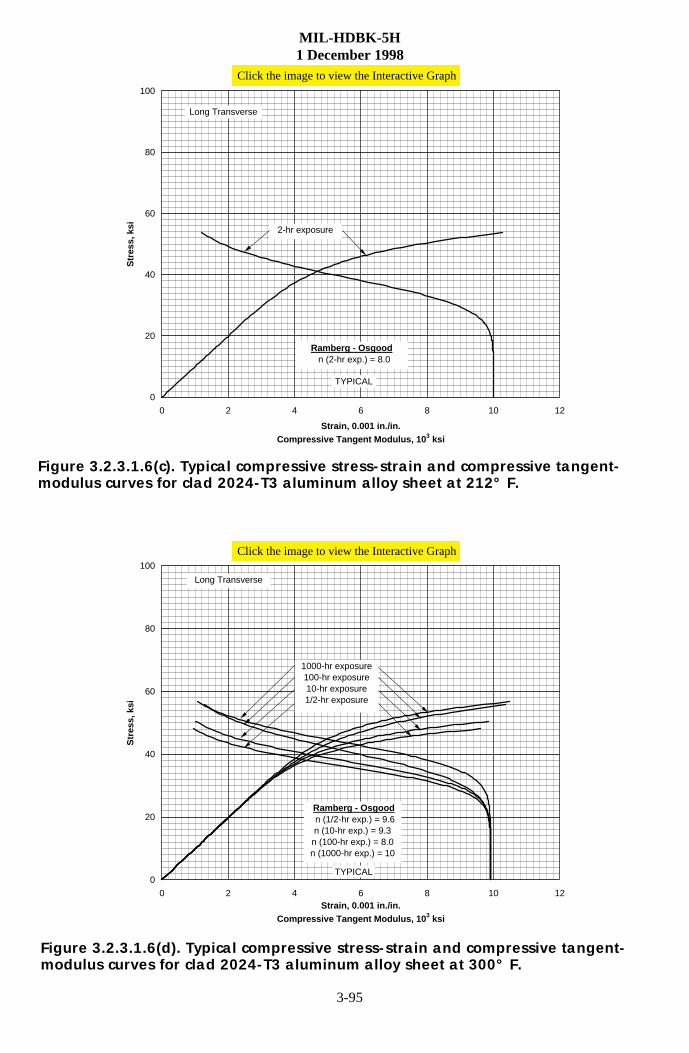
modulus curves for clad 2024-T3 aluminum alloy sheet at 212° F.Figure 3.2.3.1.6(c). Typical compressive stress-strain and compressive tangent-
modulus curves for clad 2024-T3 aluminum alloy sheet at 300° F.Figure 3.2.3.1.6(d). Typical compressive stress-strain and compressive tangent-
Click the image to view the Interactive Graph
MIL-HDBK-5H1 December 1998
3-96
0
20
40
60
80
100
0 2 4 6 8 10 12Strain, 0.001 in./in.
Compressive Tangent Modulus, 10 3 ksi
Str
ess,
ksi
Ramberg - Osgood n (1/2-hr exp.) = 13
n (2-hr exp.) = 16n (100-hr exp.) = 6.7
Long Transverse
2-hr exposure1/2-hr exposure
TYPICAL
2-hr exposure
1/2-hr exposure
100-hr exposure
100-hr exposure
0
10
20
30
40
50
0 2 4 6 8 10 12
Strain, 0.001 in./in.Compressive Tangent Modulus, 10 3 ksi
Str
ess,
ksi
Ramberg - Osgood n (1/2-hr exp.) = 8.6
n (2-hr exp.) = 10n (10-hr exp.) = 8.4
1/2-hr exposure2-hr exposure
Long Transverse
TYPICAL
1/2-hr exposure
10-hr exposure10-hr exposure
2-hr exposure
Click the image to view the Interactive Graph
Click the image to view the Interactive Graph
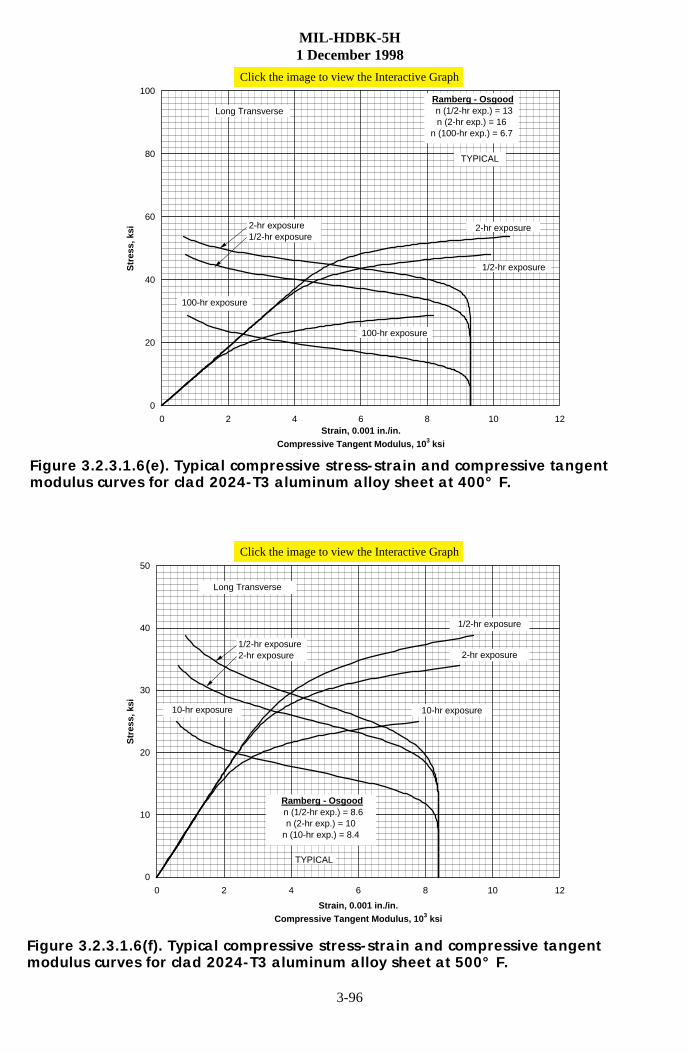
modulus curves for clad 2024-T3 aluminum alloy sheet at 400° F.Figure 3.2.3.1.6(e). Typical compressive stress-strain and compressive tangent
modulus curves for clad 2024-T3 aluminum alloy sheet at 500° F.Figure 3.2.3.1.6(f). Typical compressive stress-strain and compressive tangent
MIL-HDBK-5H1 December 1998
3-97
0
5
10
15
20
25
0 2 4 6 8 10 12
Strain, 0.001 in./in.Compressive Tangent Modulus, 10 3 ksi
Str
ess,
ksi
Ramberg - Osgood n (1/2-hr exp.) = 13 n (2-hr exp.) = 13 n (10-hr exp.) = 19
n (100-hr exp.) = 8.5 n (1000-hr exp.) = 16
Long Transverse1/2-hr exposure2-hr exposure
TYPICAL
10-hr exposure100-hr exposure
1000-hr exposure
0
5
10
15
20
25
0 2 4 6 8 10 12
Strain, 0.001 in./in.Compressive Tangent Modulus, 10 3 ksi
Str
ess,
ksi
Ramberg - Osgoodn (1/2-hr exp.) = 14n (10-hr exp.) = 15n (100-hr exp.) = 11
Long Transverse
1/2-hr exposure
TYPICAL
10-hr exposure100-hr exposure
Click the image to view the Interactive Graph
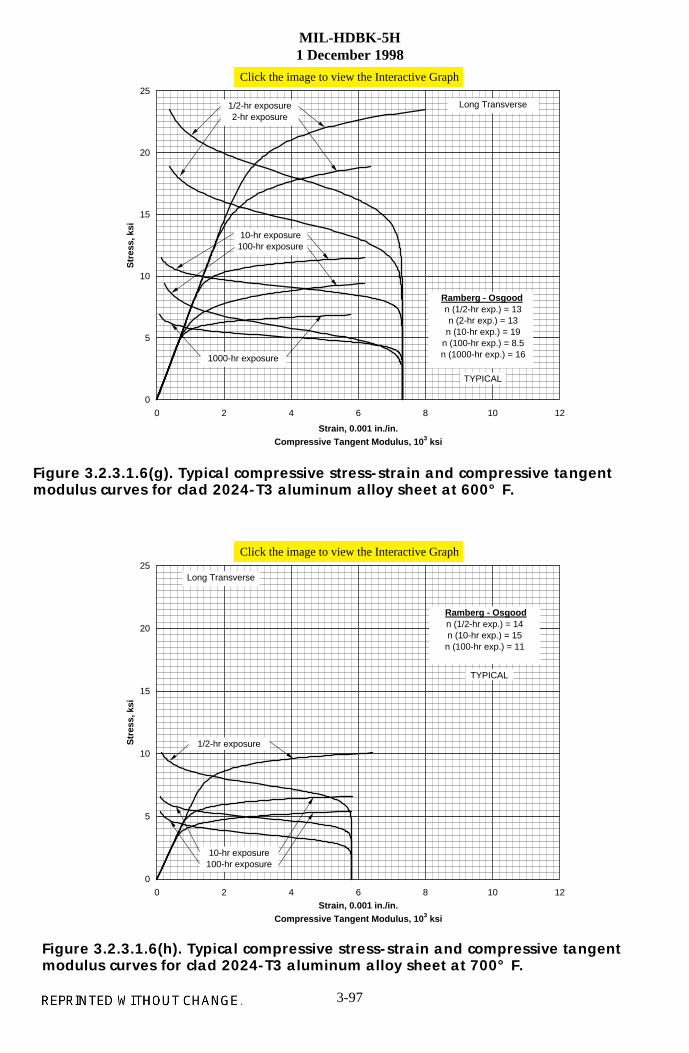
modulus curves for clad 2024-T3 aluminum alloy sheet at 600° F.Figure 3.2.3.1.6(g). Typical compressive stress-strain and compressive tangent
modulus curves for clad 2024-T3 aluminum alloy sheet at 700° F.Figure 3.2.3.1.6(h). Typical compressive stress-strain and compressive tangent
Click the image to view the Interactive Graph
MIL-HDBK-5H, Change Notice 11 October 2001
3-98Supersedes page 3-98 of MIL-HDBK-5H
Compressive Tangent Modulus, 103 ksi.Strain, 0.001 in./in.
0 2 4 6 8 10 12
Str
ess,
ksi
0
10
20
30
40
50
60
TYPICAL
Thickness: 0.500-2.000 in.
n (L-comp.) = 9.0 45n (LT-comp.) = 12 50
Ramberg-Osgood TYS (ksi)
n (L-tension) = 42 53n (LT-tension) = 9.0 47
L-tension
LT-tension
L-compressionL-compression
LT-compression
Compressive Tangent Modulus, 103 ksi.Strain, 0.001 in./in.
0 2 4 6 8 10 12
Str
ess,
ksi
0
10
20
30
40
50
60
TYPICAL
Thickness: 0.500-2.000 in.
L-tension
LT-tension
L and LT - compression
n (L-tension) = 17 43.0n (LT-tension) = 16 42.0
Ramberg-Osgood TYS (ksi)
n (L-comp.) = 19 44.5n (LT-comp.) = 19 44.5
Click the image to view the Interactive Graph
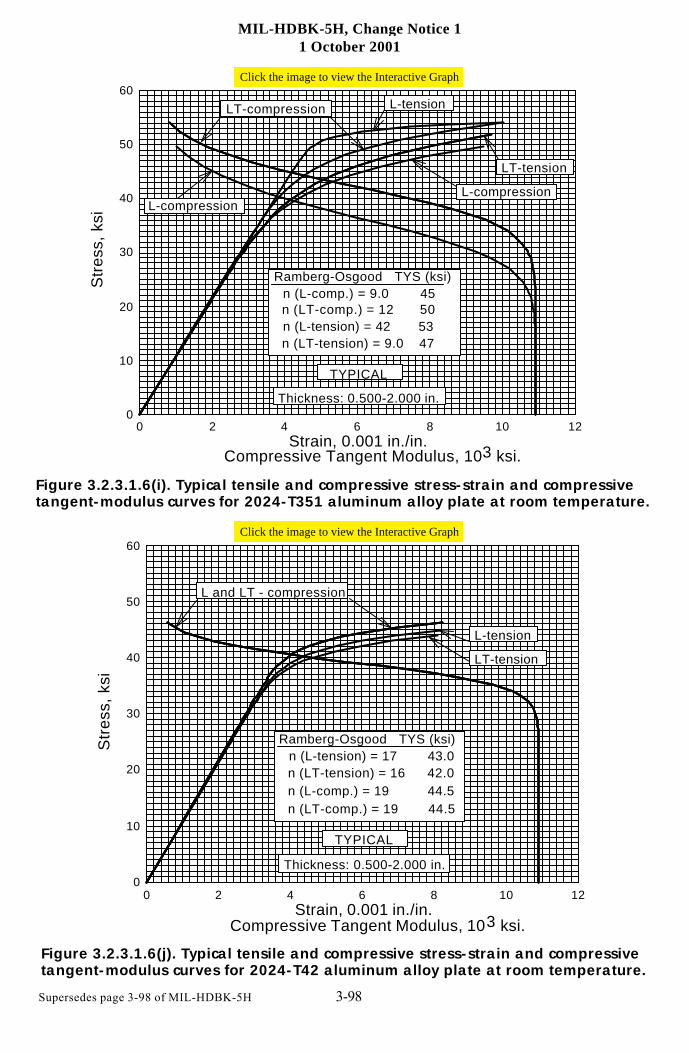
tangent-modulus curves for 2024-T351 aluminum alloy plate at room temperature.Figure 3.2.3.1.6(i). Typical tensile and compressive stress-strain and compressive
tangent-modulus curves for 2024-T42 aluminum alloy plate at room temperature.Figure 3.2.3.1.6(j). Typical tensile and compressive stress-strain and compressive
Click the image to view the Interactive Graph
MIL-HDBK-5H1 December 1998
3-99
0
20
40
60
80
100
0 2 4 6 8 10 12
Strain, 0.001 in./in.Compressive Tangent Modulus, 10 3 ksi
Str
ess,
ksi
Ramberg - Osgood n (tension) = 50 n (comp.) = 10
Thickness ≤ 5.500 in.
L - tension L - compression
TYPICAL
L - compression
0
10
20
30
40
50
60
0 2 4 6 8 10 12Strain, 0.001 in./in.
Compressive Tangent Modulus, 10 3 ksi
Str
ess,
ksi
Ramberg - Osgood TYS CYSn (L - tension) = 18 45 -n (LT - tension) = 16 46 -n (L - comp.) = 12 - 48n (LT - comp.) = 14 - 48
Thickness = 1.000 - 1.750 in.
L - compression
TYPICAL
LT - compression
L - tension
LT - tension
L - compression
LT - compression
Click the image to view the Interactive Graph
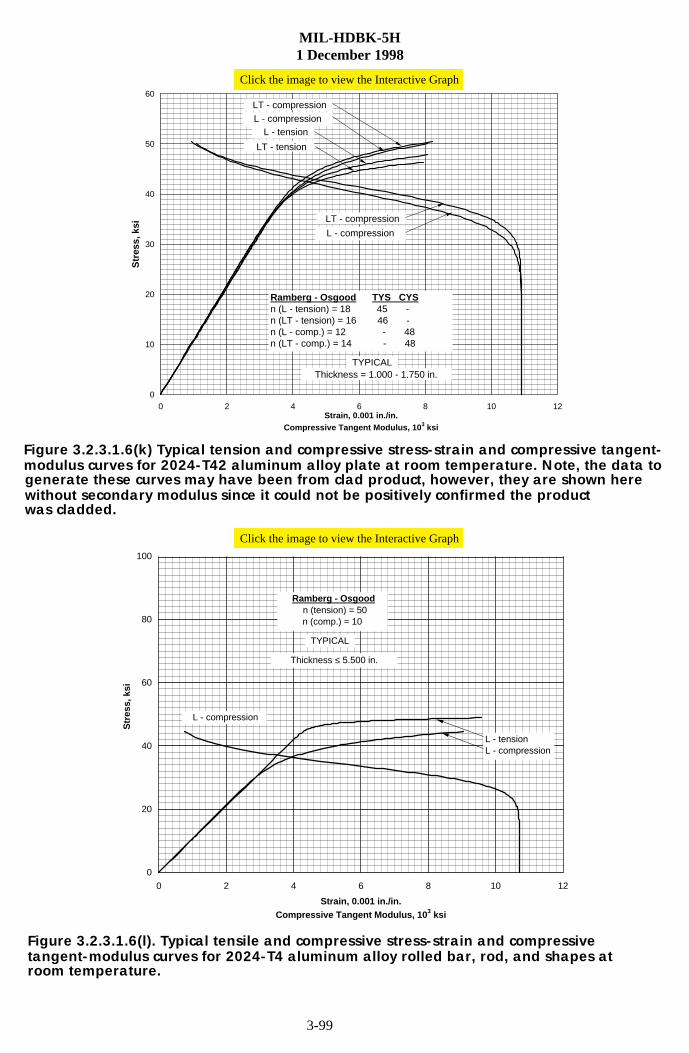
Figure 3.2.3.1.6(k) Typical tension and compressive stress-strain and compressive tangent-modulus curves for 2024-T42 aluminum alloy plate at room temperature. Note, the data togenerate these curves may have been from clad product, however, they are shown herewithout secondary modulus since it could not be positively confirmed the productwas cladded.
Figure 3.2.3.1.6(l). Typical tensile and compressive stress-strain and compressivetangent-modulus curves for 2024-T4 aluminum alloy rolled bar, rod, and shapes atroom temperature.
Click the image to view the Interactive Graph
MIL-HDBK-5H1 December 1998
3-100
0
10
20
30
40
50
60
0 2 4 6 8 10 12
Strain, 0.001 in./in.
Str
ess,
ksi
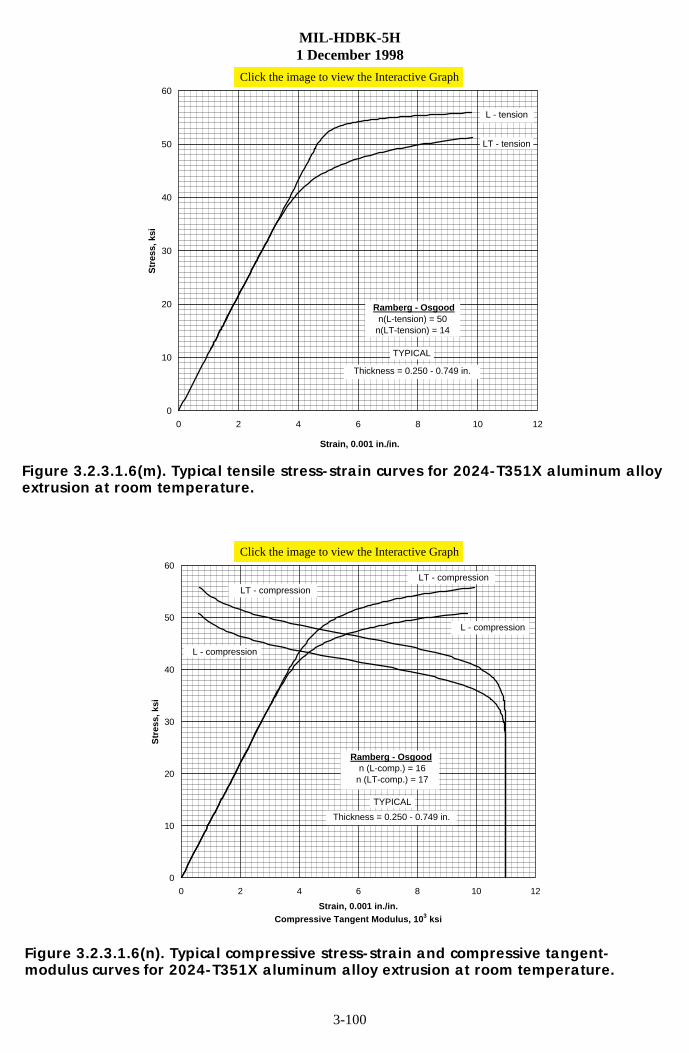
Ramberg - Osgoodn(L-tension) = 50
n(LT-tension) = 14
Thickness = 0.250 - 0.749 in.
L - tension
TYPICAL
LT - tension
0
10
20
30
40
50
60
0 2 4 6 8 10 12
Strain, 0.001 in./in.Compressive Tangent Modulus, 10 3 ksi
Str
ess,
ksi
Ramberg - Osgood n (L-comp.) = 16
n (LT-comp.) = 17
Thickness = 0.250 - 0.749 in.
LT - compression
TYPICAL
L - compression
LT - compression
L - compression
Click the image to view the Interactive Graph
extrusion at room temperature.Figure 3.2.3.1.6(m). Typical tensile stress-strain curves for 2024-T351X aluminum alloy
modulus curves for 2024-T351X aluminum alloy extrusion at room temperature.Figure 3.2.3.1.6(n). Typical compressive stress-strain and compressive tangent-
Click the image to view the Interactive Graph
MIL-HDBK-5H1 December 1998
3-101
0
20
40
60
80
100
Str
ess,
ksi
0 2 4 6 8 10 12
\
.
Compressive Tangent Modulus, 103 ksi
Strain, 0.001 in./in.
TYPICAL
Ramberg-Osgood
L - tension
L - compressionL - compression
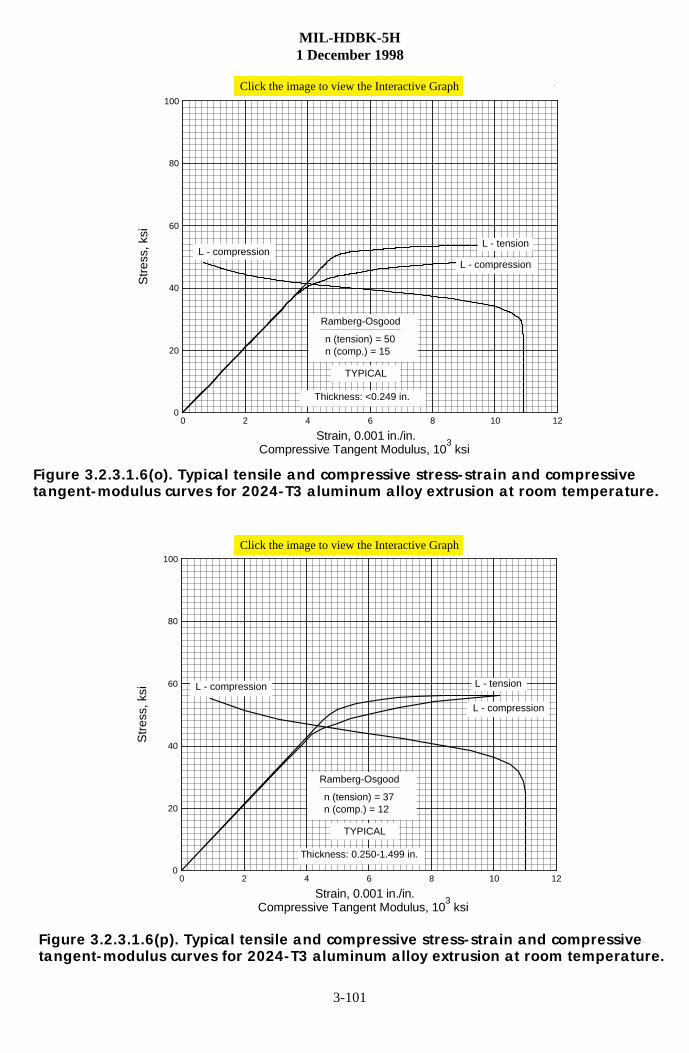
n (tension) = 50n (comp.) = 15
Thickness: <0.249 in.
0
20
40
60
80
100
Str
ess,
ksi
0 2 4 6 8 10 12
\
.
Compressive Tangent Modulus, 103 ksi
Strain, 0.001 in./in.
TYPICAL
Ramberg-Osgood
L - tension
L - compression
L - compression
n (tension) = 37n (comp.) = 12
Thickness: 0.250-1.499 in.
Click the image to view the Interactive Graph
Click the image to view the Interactive Graph
tangent-modulus curves for 2024-T3 aluminum alloy extrusion at room temperature.Figure 3.2.3.1.6(o). Typical tensile and compressive stress-strain and compressive
tangent-modulus curves for 2024-T3 aluminum alloy extrusion at room temperature.Figure 3.2.3.1.6(p). Typical tensile and compressive stress-strain and compressive
MIL-HDBK-5H1 December 1998
3-102
0
10
20
30
40
50
60
0 2 4 6 8 10 12Strain, 0.001 in./in.
Compressive Tangent Modulus, 10 3 ksi
Str
ess,
ksi
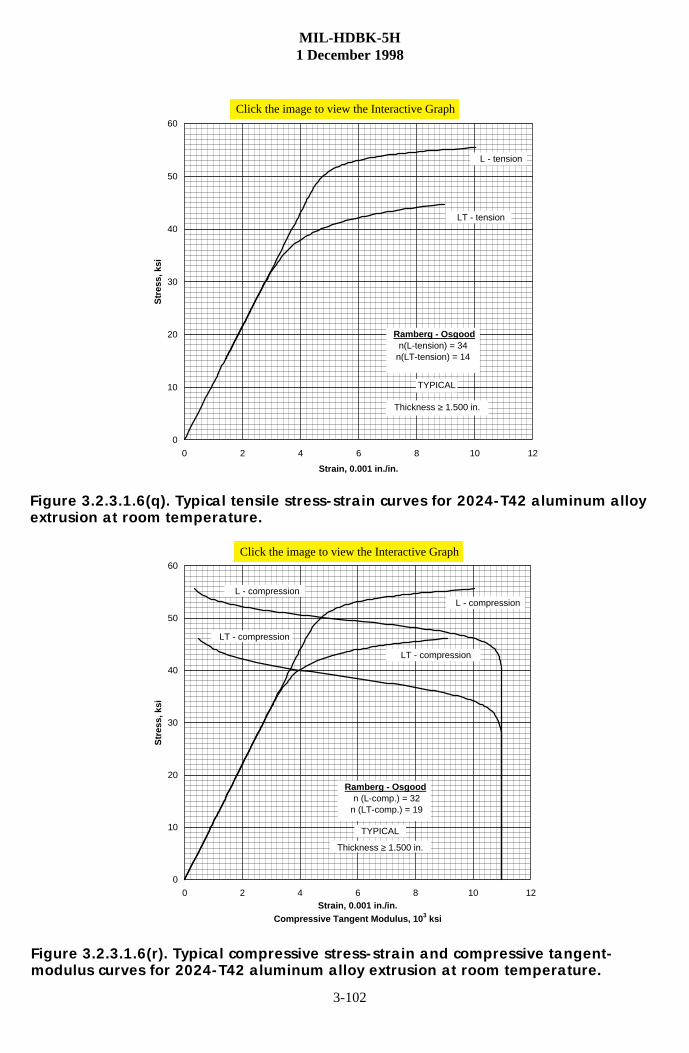
Ramberg - Osgood n (L-comp.) = 32
n (LT-comp.) = 19
Thickness ≥ 1.500 in.
LT - compression
TYPICAL
LT - compression
L - compression L - compression
0
10
20
30
40
50
60
0 2 4 6 8 10 12
Strain, 0.001 in./in.
Str
ess,
ksi
Ramberg - Osgoodn(L-tension) = 34
n(LT-tension) = 14
Thickness ≥ 1.500 in.
LT - tension
TYPICAL
L - tension
Click the image to view the Interactive Graph
Click the image to view the Interactive Graph
extrusion at room temperature.Figure 3.2.3.1.6(q). Typical tensile stress-strain curves for 2024-T42 aluminum alloy
modulus curves for 2024-T42 aluminum alloy extrusion at room temperature.Figure 3.2.3.1.6(r). Typical compressive stress-strain and compressive tangent-
MIL-HDBK-5H1 December 1998
3-103
0
10
20
30
40
50
Str
ess,
ksi
0 2 4 6 8 10 12
Strain, 0.001 in./in.
TYPICAL
Ramberg-Osgood
Longitudinal
Long Transverse
Thickness 0.072 -0.249 in.
TYS (ksi)
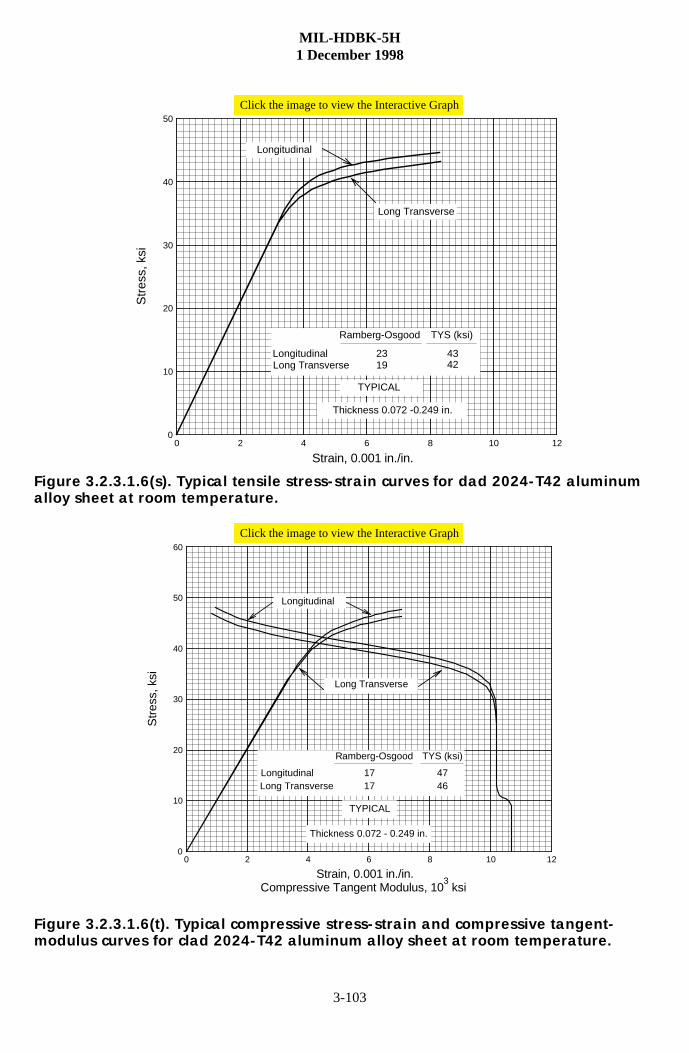
LongitudinalLong Transverse
2319
4342
0
10
20
30
40
50
60
Str
ess,
ksi
0 2 4 6 8 10 12
Compressive Tangent Modulus, 103 ksi
Strain, 0.001 in./in.
TYPICAL
Ramberg-Osgood
Longitudinal
Long Transverse
LongitudinalLong Transverse
TYS (ksi)
Thickness 0.072 - 0.249 in.
1717
4746
Click the image to view the Interactive Graph
Click the image to view the Interactive Graph
alloy sheet at room temperature.Figure 3.2.3.1.6(s). Typical tensile stress-strain curves for dad 2024-T42 aluminum
modulus curves for clad 2024-T42 aluminum alloy sheet at room temperature.Figure 3.2.3.1.6(t). Typical compressive stress-strain and compressive tangent-
MIL-HDBK-5H1 December 1998
3-104
6WUDLQ� LQ��LQ�
���� ���� ���� ���� ���� ���� ���� ���� ���� ���� ����
6WUHVV�NVL
�
��
��
��
��
��
��
��
��
��
[[
7KLFNQHVV� ����� LQ�
%$6(' 21 21( /27
7<3,&$/
/RQJ WUDQVYHUVH
/RQJLWXGLQDO
Click the image to view the Interactive Graph
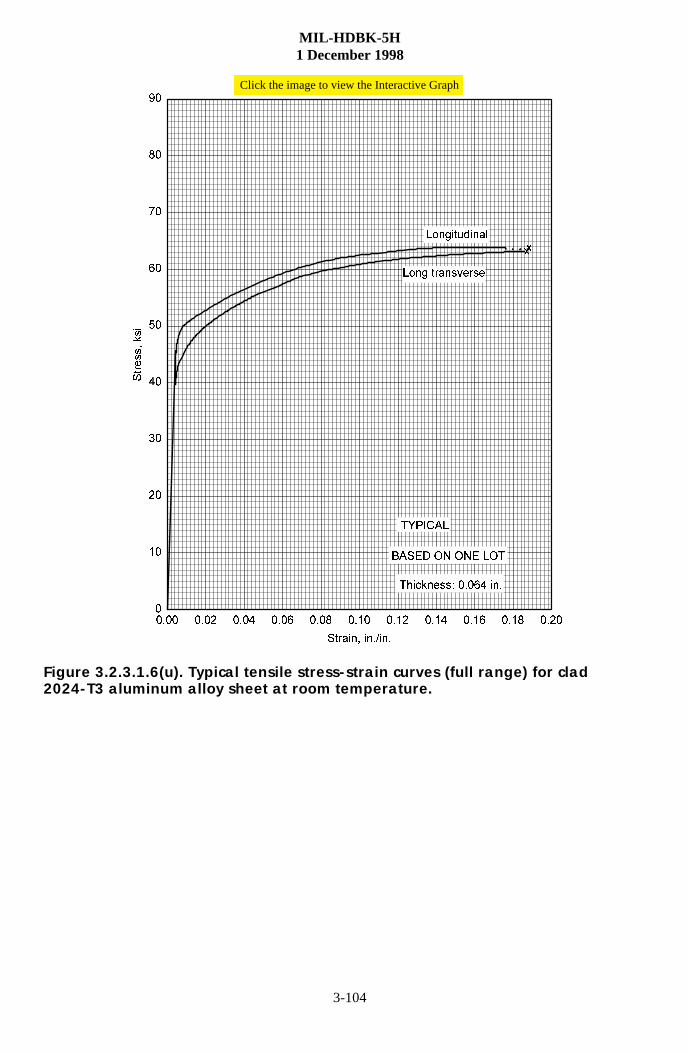
2024-T3 aluminum alloy sheet at room temperature.Figure 3.2.3.1.6(u). Typical tensile stress-strain curves (full range) for clad
MIL-HDBK-5H1 December 1998
3-105
6WUDLQ� LQ��LQ�
���� ���� ���� ���� ���� ���� ���� ����
6WUHVV�NVL
�
��
��
��
��
��
��
��
��
��
;
7<3,&$/
/RQJLWXGLQDO
Click the image to view the Interactive Graph
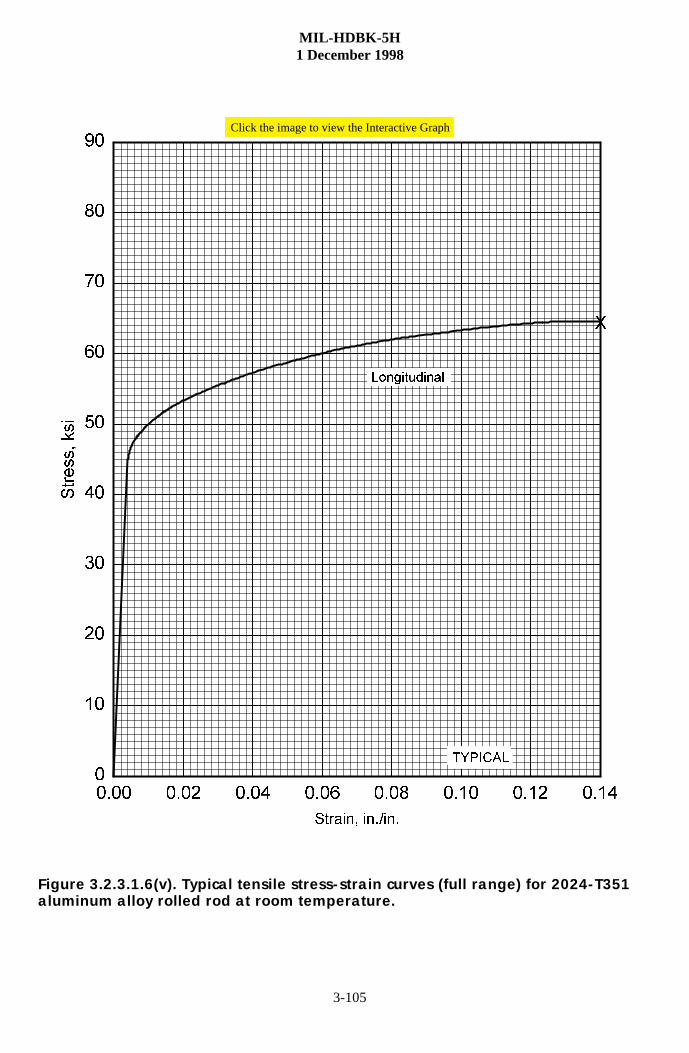
aluminum alloy rolled rod at room temperature.Figure 3.2.3.1.6(v). Typical tensile stress-strain curves (full range) for 2024-T351
MIL-HDBK-5H1 December 1998
3-106
6WUDLQ� LQ��LQ�
���� ���� ���� ���� ���� ���� ���� ���� ���� ����
6WUHVV�NVL
�
��
��
��
��
��
��
��
��
��
[
[
7KLFNQHVV� ����� � ����� LQ�
7<3,&$/
/RQJ WUDQVYHUVH
/RQJLWXGLQDO
Click the image to view the Interactive Graph
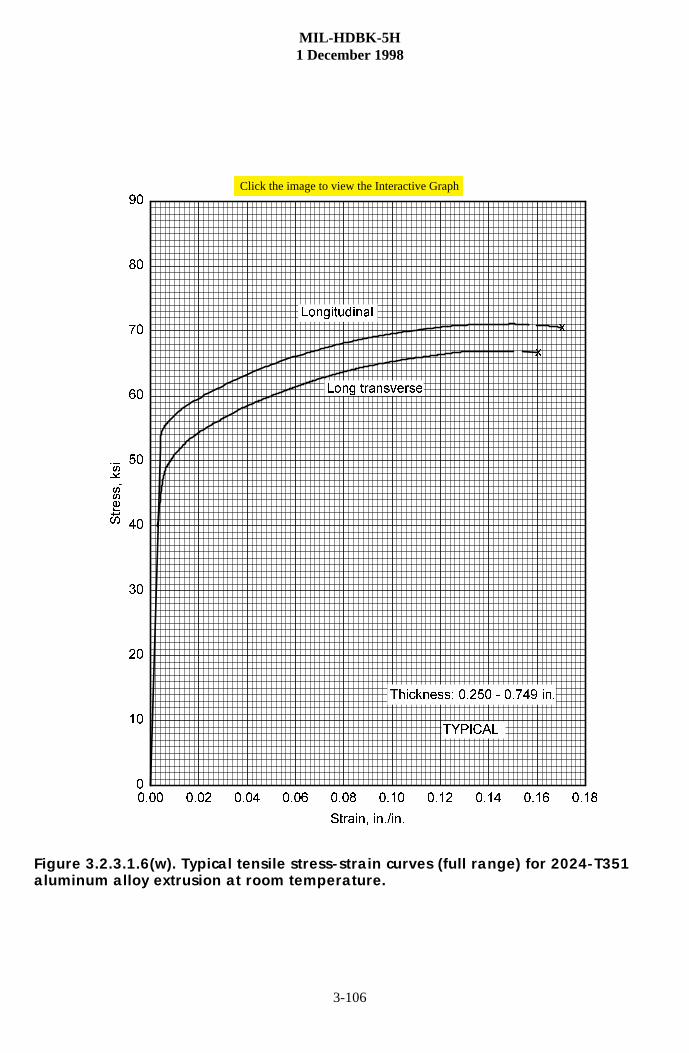
aluminum alloy extrusion at room temperature.Figure 3.2.3.1.6(w). Typical tensile stress-strain curves (full range) for 2024-T351
MIL-HDBK-5H1 December 1998
3-107
Strain, in./in.
0.00 0.02 0.04 0.06 0.08 0.10 0.12 0.14
Str
ess,
ksi
0
10
20
30
40
50
60
70
80
90
X
Thickness: 0.250 in. dia.
TYPICAL
Longitudinal
Click the image to view the Interactive Graph
for 2024-T351
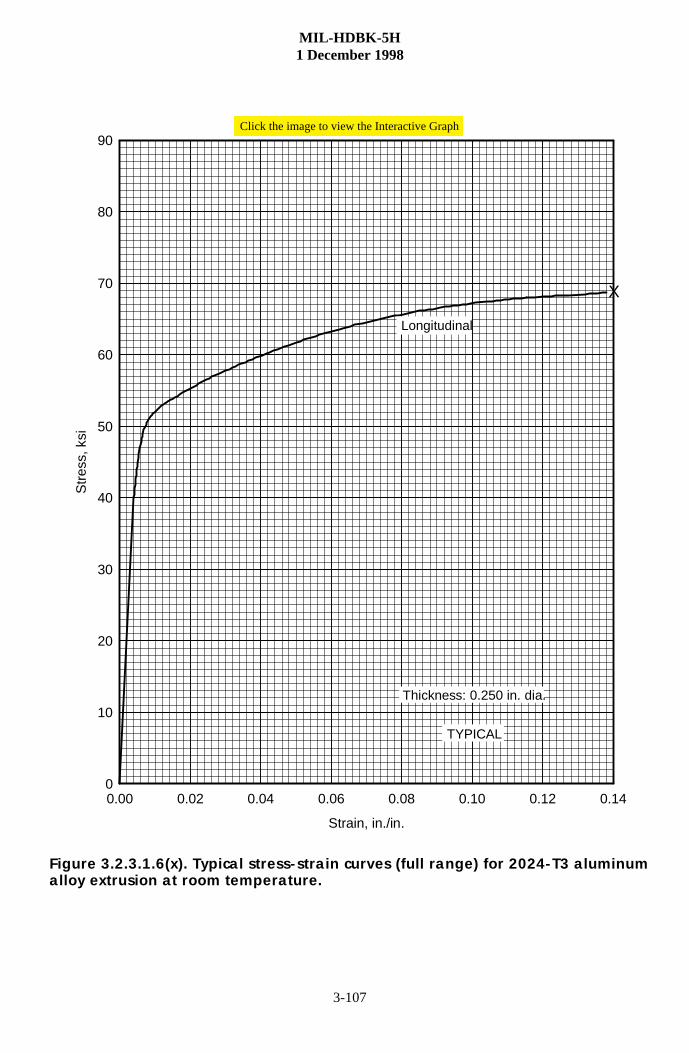
alloy extrusion at room temperature.Figure 3.2.3.1.6(x). Typical stress-strain curves (full range) for 2024-T3 aluminum
MIL-HDBK-5H1 December 1998
3-108
6WUDLQ� LQ��LQ�
���� ���� ���� ���� ���� ���� ���� ����
6WUHVV�NVL
�
��
��
��
��
��
��
��
��
��
[
[
7KLFNQHVV� � LQ� GLD�
7<3,&$/
/RQJ WUDQVYHUVH
/RQJLWXGLQDO
Click the image to view the Interactive Graph
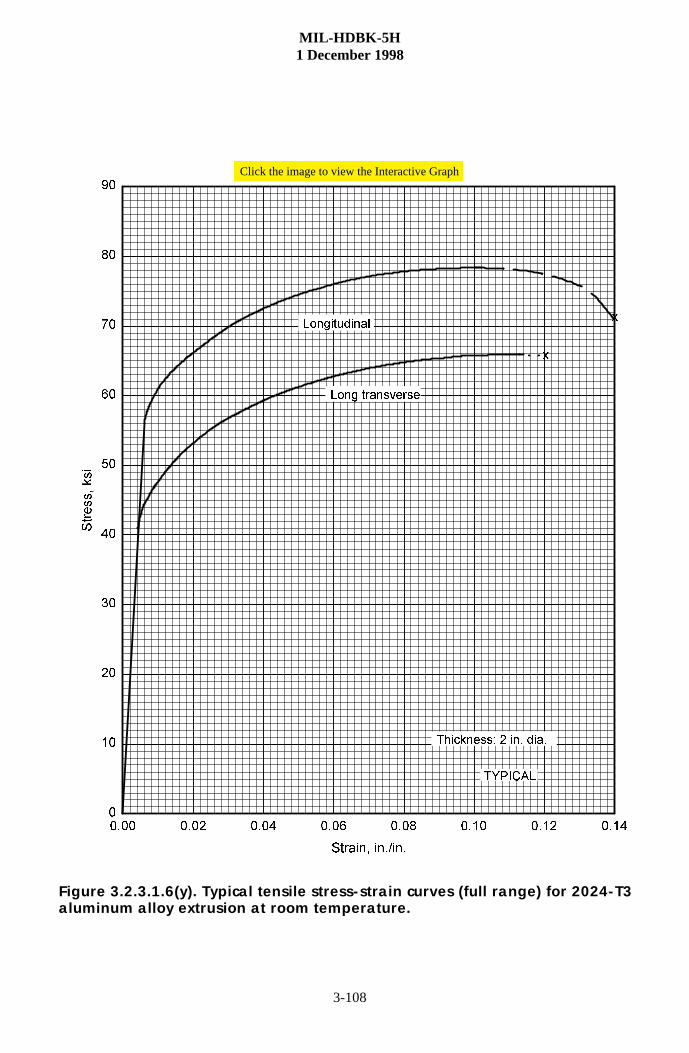
aluminum alloy extrusion at room temperature.Figure 3.2.3.1.6(y). Typical tensile stress-strain curves (full range) for 2024-T3
MIL-HDBK-5H1 December 1998
3-109
6WUDLQ� LQ��LQ�
���� ���� ���� ���� ���� ���� ���� ���� ����
6WUHVV�NVL
�
��
��
��
��
��
��
��
��
��
[
[
7KLFNQHVV� ≥ ����� LQ�
7<3,&$/
/RQJ WUDQVYHUVH
/RQJLWXGLQDO
Click the image to view the Interactive Graph
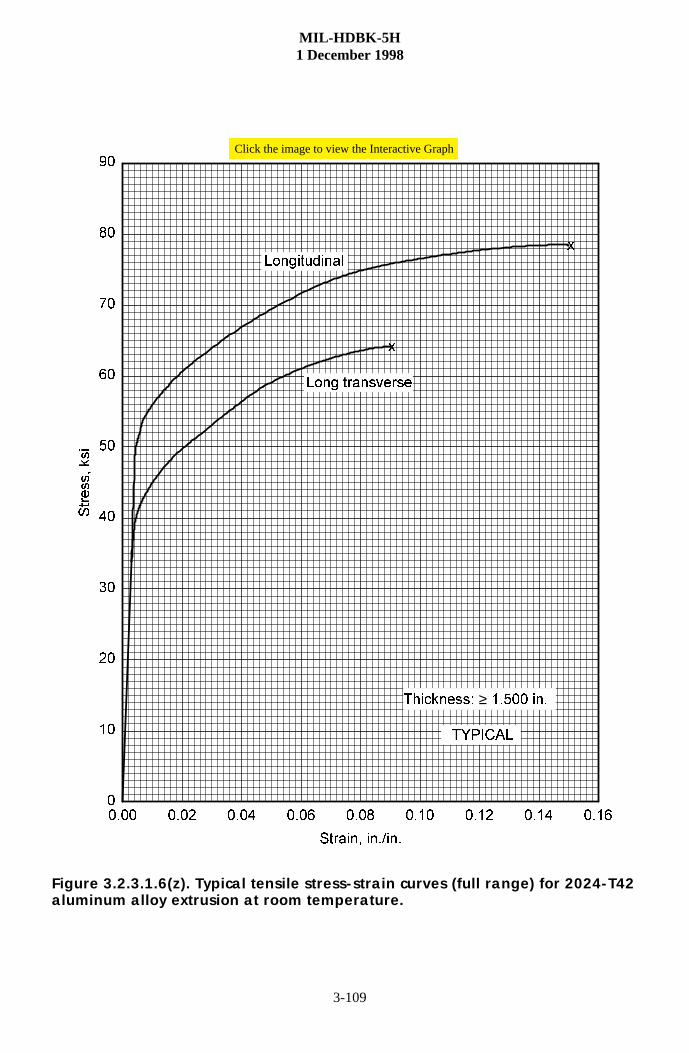
aluminum alloy extrusion at room temperature.Figure 3.2.3.1.6(z). Typical tensile stress-strain curves (full range) for 2024-T42
MIL-HDBK-5H1 December 1998
3-110
6WUDLQ� LQ��LQ�
���� ���� ���� ���� ���� ����
6WUHVV�NVL
�
��
��
��
��
��
��
��
[[
7KLFNQHVV� ����������� LQ�
/RQJ WUDQVYHUVH
7<3,&$/
/RQJLWXGLQDO
Click the image to view the Interactive Graph
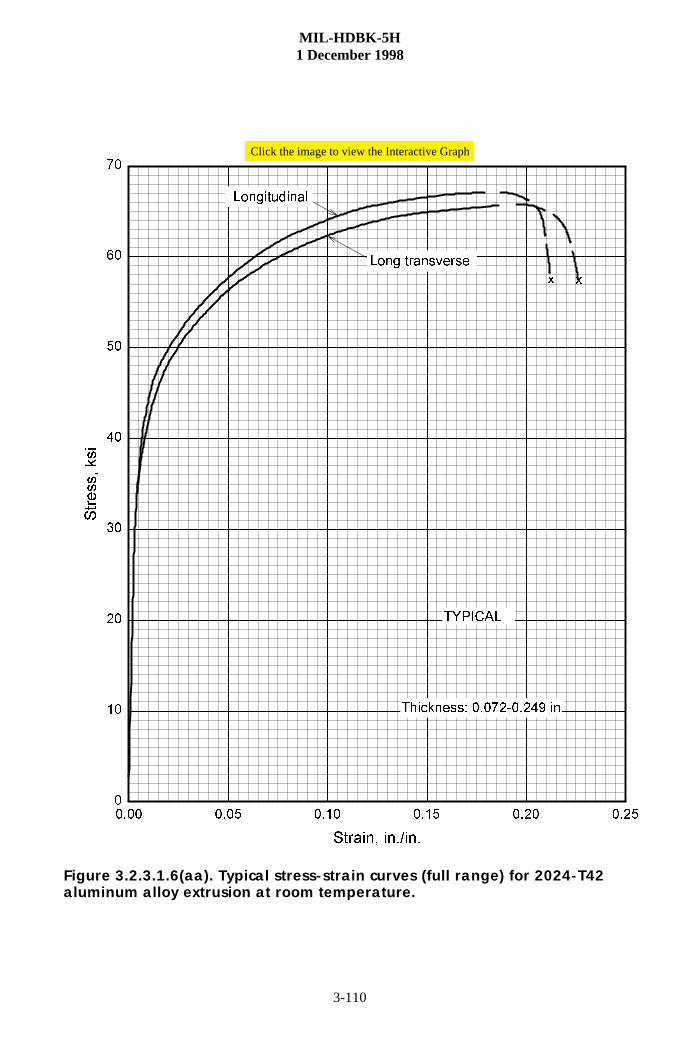
aluminum alloy extrusion at room temperature.Figure 3.2.3.1.6(aa). Typical stress-strain curves (full range) for 2024-T42
MIL-HDBK-5H1 December 1998
3-111
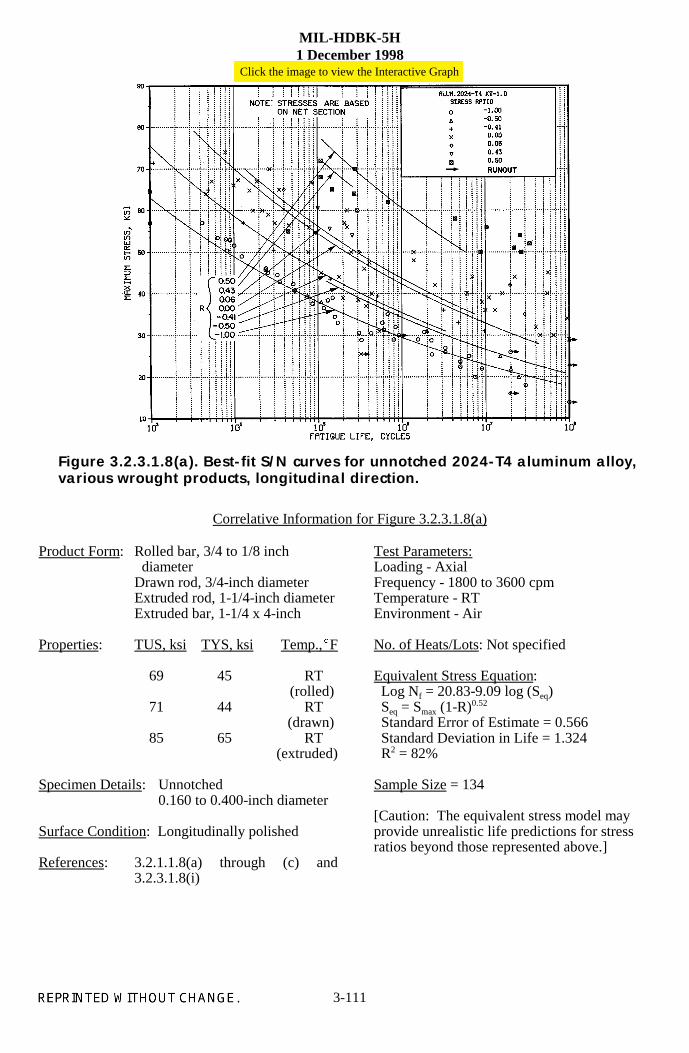
Correlative Information for Figure 3.2.3.1.8(a)
Product Form: Rolled bar, 3/4 to 1/8 inch diameterDrawn rod, 3/4-inch diameterExtruded rod, 1-1/4-inch diameterExtruded bar, 1-1/4 x 4-inch
Properties: TUS, ksi TYS, ksi Temp.,�F
69 45 RT (rolled)
71 44 RT (drawn)
85 65 RT (extruded)
Specimen Details: Unnotched0.160 to 0.400-inch diameter
Surface Condition: Longitudinally polished
References: 3.2.1.1.8(a) through (c) and3.2.3.1.8(i)
Test Parameters:Loading - AxialFrequency - 1800 to 3600 cpmTemperature - RTEnvironment - Air
No. of Heats/Lots: Not specified
Equivalent Stress Equation: Log Nf = 20.83-9.09 log (Seq) Seq = Smax (1-R)0.52
Standard Error of Estimate = 0.566 Standard Deviation in Life = 1.324 R2 = 82%
Sample Size = 134
[Caution: The equivalent stress model may provide unrealistic life predictions for stress ratios beyond those represented above.]
Click the image to view the Interactive Graph
various wrought products, longitudinal direction.Figure 3.2.3.1.8(a). Best-fit S/N curves for unnotched 2024-T4 aluminum alloy,
MIL-HDBK-5H, Change Notice 11 October 2001
3-112Supersedes page 3-112 of MIL-HDBK-5H
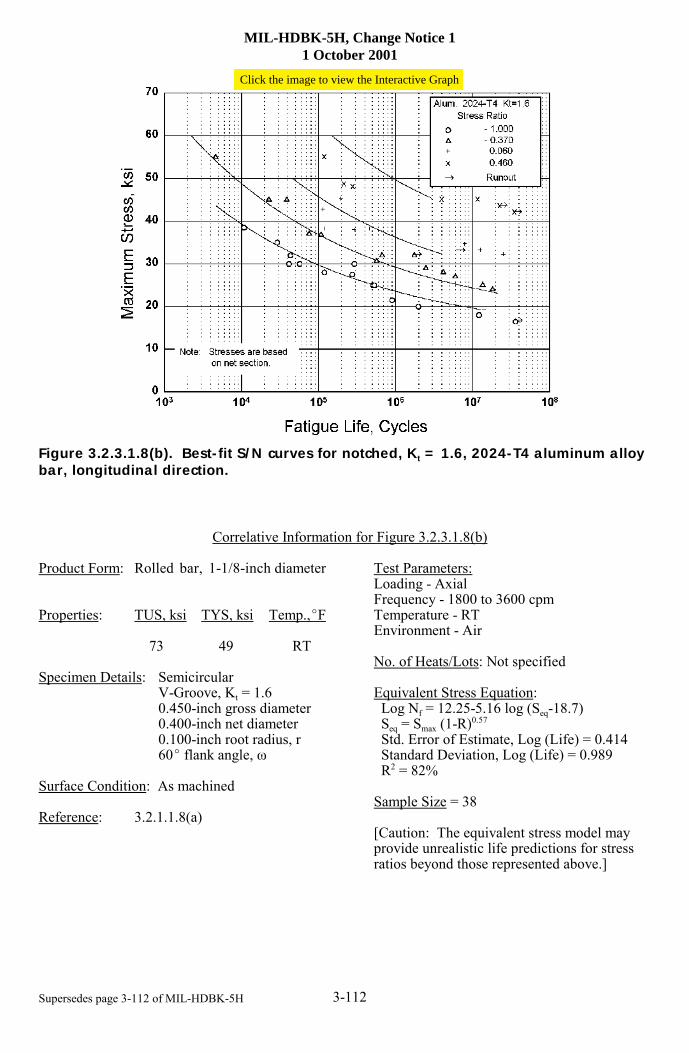
Figure 3.2.3.1.8(b). Best-fit S/N curves for notched, Kt = 1.6, 2024-T4 aluminum alloybar, longitudinal direction.
Correlative Information for Figure 3.2.3.1.8(b)
Product Form: Rolled bar, 1-1/8-inch diameter
Properties: TUS, ksi TYS, ksi Temp.,EF
73 49 RT
Specimen Details: SemicircularV-Groove, Kt = 1.60.450-inch gross diameter0.400-inch net diameter0.100-inch root radius, r60E flank angle, ω
Surface Condition: As machined
Reference: 3.2.1.1.8(a)
Test Parameters:Loading - AxialFrequency - 1800 to 3600 cpmTemperature - RTEnvironment - Air
No. of Heats/Lots: Not specified
Equivalent Stress Equation: Log Nf = 12.25-5.16 log (Seq-18.7) Seq = Smax (1-R)0.57
Std. Error of Estimate, Log (Life) = 0.414 Standard Deviation, Log (Life) = 0.989 R2 = 82%
Sample Size = 38
[Caution: The equivalent stress model may provide unrealistic life predictions for stress ratios beyond those represented above.]
Click the image to view the Interactive Graph

MIL-HDBK-5H, Change Notice 11 October 2001
3-113Supersedes page 3-113 of MIL-HDBK-5H
Figure 3.2.3.1.8(c). Best-fit S/N curves for notched, Kt = 2.4, 2024-T4 aluminum alloybar, longitudinal direction.
Correlative Information for Figure 3.2.3.1.8(c)
Product Form: Rolled bar, 1-1/8-inch diameter
Properties: TUS, ksi TYS, ksi Temp.,EF
73 49 RT
Specimen Details: CircumferentialV-Groove, Kt = 2.40.500-inch gross diameter0.400-inch net diameter0.032-inch root radius, r60E flank angle, ω
Surface Condition: As machined
Reference: 3.2.1.1.8(b)
Test Parameters:Loading - AxialFrequency - 1800 to 3600 cpmTemperature - RTEnvironment - Air
No. of Heats/Lots: Not specified
Equivalent Stress Equation: Log Nf = 14.33-6.35 log (Seq-3.2) Seq = Smax (1-R)0.48
Std. Error of Estimate, Log (Life) = 0.310 Standard Deviation, Log (Life) = 1.084 R2 = 92%
Sample Size = 33
[Caution: The equivalent stress model may provide unrealistic life predictions for stress ratios beyond those represented above.]
Click the image to view the Interactive Graph
MIL-HDBK-5H, Change Notice 11 October 2001
3-114Supersedes page 3-114 of MIL-HDBK-5H
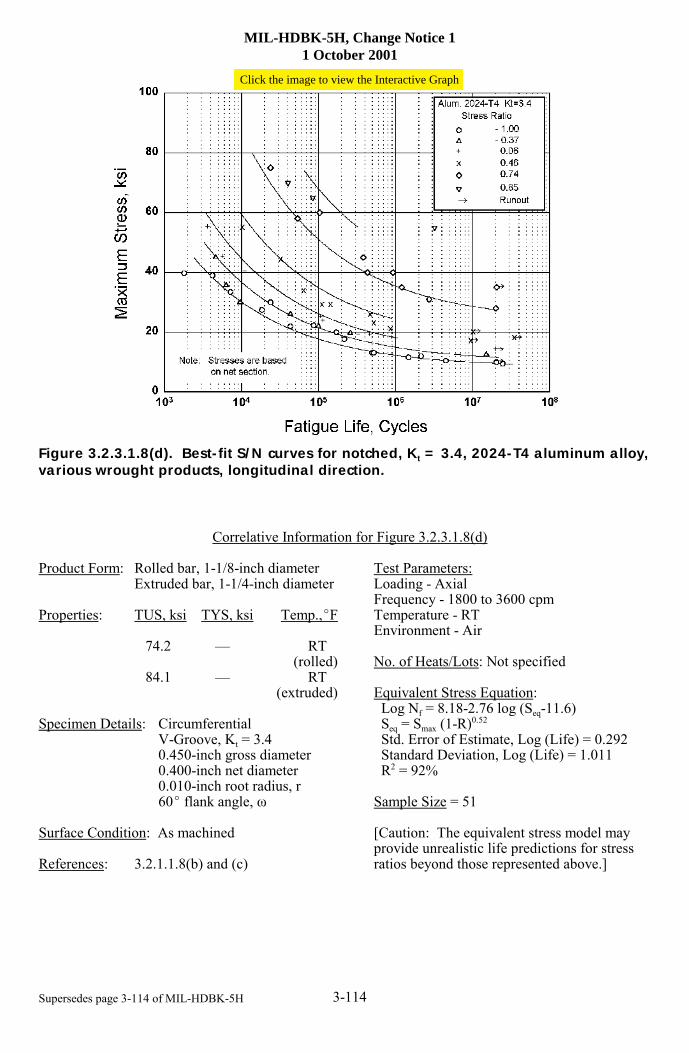
Figure 3.2.3.1.8(d). Best-fit S/N curves for notched, Kt = 3.4, 2024-T4 aluminum alloy,various wrought products, longitudinal direction.
Correlative Information for Figure 3.2.3.1.8(d)
Product Form: Rolled bar, 1-1/8-inch diameterExtruded bar, 1-1/4-inch diameter
Properties: TUS, ksi TYS, ksi Temp.,EF
74.2 — RT (rolled)
84.1 — RT (extruded)
Specimen Details: CircumferentialV-Groove, Kt = 3.40.450-inch gross diameter0.400-inch net diameter0.010-inch root radius, r60E flank angle, ω
Surface Condition: As machined
References: 3.2.1.1.8(b) and (c)
Test Parameters:Loading - AxialFrequency - 1800 to 3600 cpmTemperature - RTEnvironment - Air
No. of Heats/Lots: Not specified
Equivalent Stress Equation: Log Nf = 8.18-2.76 log (Seq-11.6) Seq = Smax (1-R)0.52
Std. Error of Estimate, Log (Life) = 0.292 Standard Deviation, Log (Life) = 1.011 R2 = 92%
Sample Size = 51
[Caution: The equivalent stress model may provide unrealistic life predictions for stress ratios beyond those represented above.]
Click the image to view the Interactive Graph
MIL-HDBK-5H1 December 1998
3-115
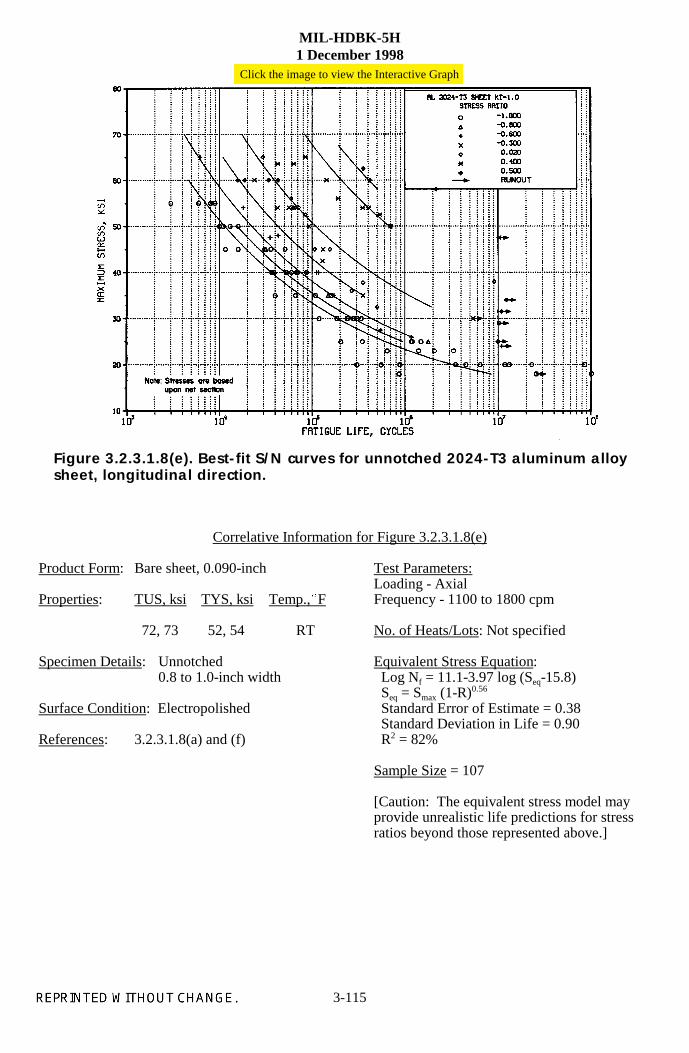
Correlative Information for Figure 3.2.3.1.8(e)
Product Form: Bare sheet, 0.090-inch
Properties: TUS, ksi TYS, ksi Temp.,�F
72, 73 52, 54 RT
Specimen Details: Unnotched0.8 to 1.0-inch width
Surface Condition: Electropolished
References: 3.2.3.1.8(a) and (f)
Test Parameters:Loading - AxialFrequency - 1100 to 1800 cpm
No. of Heats/Lots: Not specified
Equivalent Stress Equation: Log Nf = 11.1-3.97 log (Seq-15.8) Seq = Smax (1-R)0.56
Standard Error of Estimate = 0.38 Standard Deviation in Life = 0.90 R2 = 82%
Sample Size = 107
[Caution: The equivalent stress model may provide unrealistic life predictions for stress ratios beyond those represented above.]
Click the image to view the Interactive Graph
sheet, longitudinal direction.Figure 3.2.3.1.8(e). Best-fit S/N curves for unnotched 2024-T3 aluminum alloy
MIL-HDBK-5H, Change Notice 11 October 2001
3-116Supersedes page 3-116 of MIL-HDBK-5H
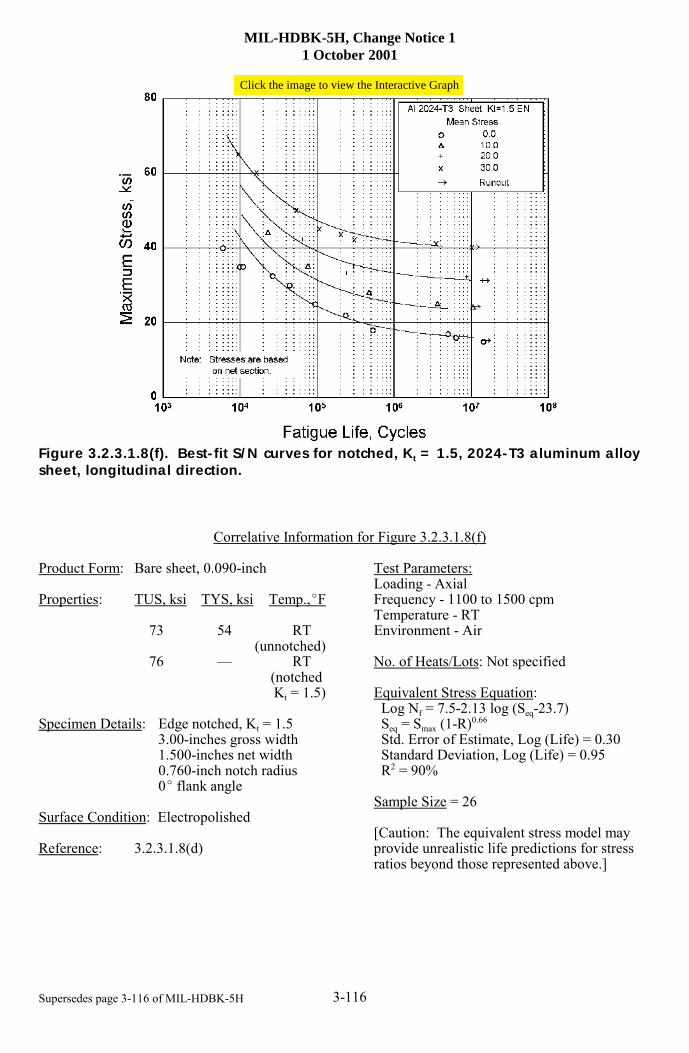
Figure 3.2.3.1.8(f). Best-fit S/N curves for notched, Kt = 1.5, 2024-T3 aluminum alloysheet, longitudinal direction.
Correlative Information for Figure 3.2.3.1.8(f)
Product Form: Bare sheet, 0.090-inch
Properties: TUS, ksi TYS, ksi Temp.,EF
73 54 RT (unnotched)
76 — RT (notched Kt = 1.5)
Specimen Details: Edge notched, Kt = 1.53.00-inches gross width1.500-inches net width0.760-inch notch radius0E flank angle
Surface Condition: Electropolished
Reference: 3.2.3.1.8(d)
Test Parameters:Loading - AxialFrequency - 1100 to 1500 cpmTemperature - RTEnvironment - Air
No. of Heats/Lots: Not specified
Equivalent Stress Equation: Log Nf = 7.5-2.13 log (Seq-23.7) Seq = Smax (1-R)0.66
Std. Error of Estimate, Log (Life) = 0.30 Standard Deviation, Log (Life) = 0.95 R2 = 90%
Sample Size = 26
[Caution: The equivalent stress model may provide unrealistic life predictions for stress ratios beyond those represented above.]
Click the image to view the Interactive Graph
MIL-HDBK-5H, Change Notice 11 October 2001
3-117Supersedes page 3-117 of MIL-HDBK-5H
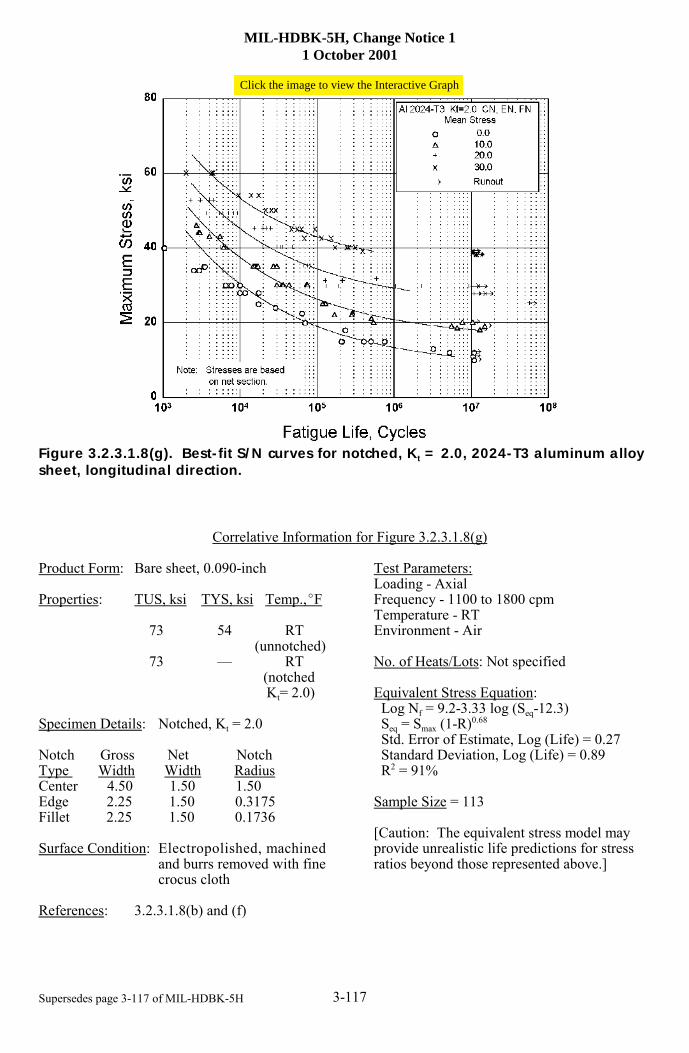
Figure 3.2.3.1.8(g). Best-fit S/N curves for notched, Kt = 2.0, 2024-T3 aluminum alloysheet, longitudinal direction.
Correlative Information for Figure 3.2.3.1.8(g)
Product Form: Bare sheet, 0.090-inch
Properties: TUS, ksi TYS, ksi Temp.,EF
73 54 RT (unnotched)
73 — RT (notched Kt= 2.0)
Specimen Details: Notched, Kt = 2.0
Notch Gross Net NotchType Width Width RadiusCenter 4.50 1.50 1.50Edge 2.25 1.50 0.3175Fillet 2.25 1.50 0.1736
Surface Condition: Electropolished, machinedand burrs removed with finecrocus cloth
References: 3.2.3.1.8(b) and (f)
Test Parameters:Loading - AxialFrequency - 1100 to 1800 cpmTemperature - RTEnvironment - Air
No. of Heats/Lots: Not specified
Equivalent Stress Equation: Log Nf = 9.2-3.33 log (Seq-12.3) Seq = Smax (1-R)0.68
Std. Error of Estimate, Log (Life) = 0.27 Standard Deviation, Log (Life) = 0.89 R2 = 91%
Sample Size = 113
[Caution: The equivalent stress model may provide unrealistic life predictions for stress ratios beyond those represented above.]
Click the image to view the Interactive Graph
MIL-HDBK-5H, Change Notice 11 October 2001
3-118Supersedes page 3-118 of MIL-HDBK-5H
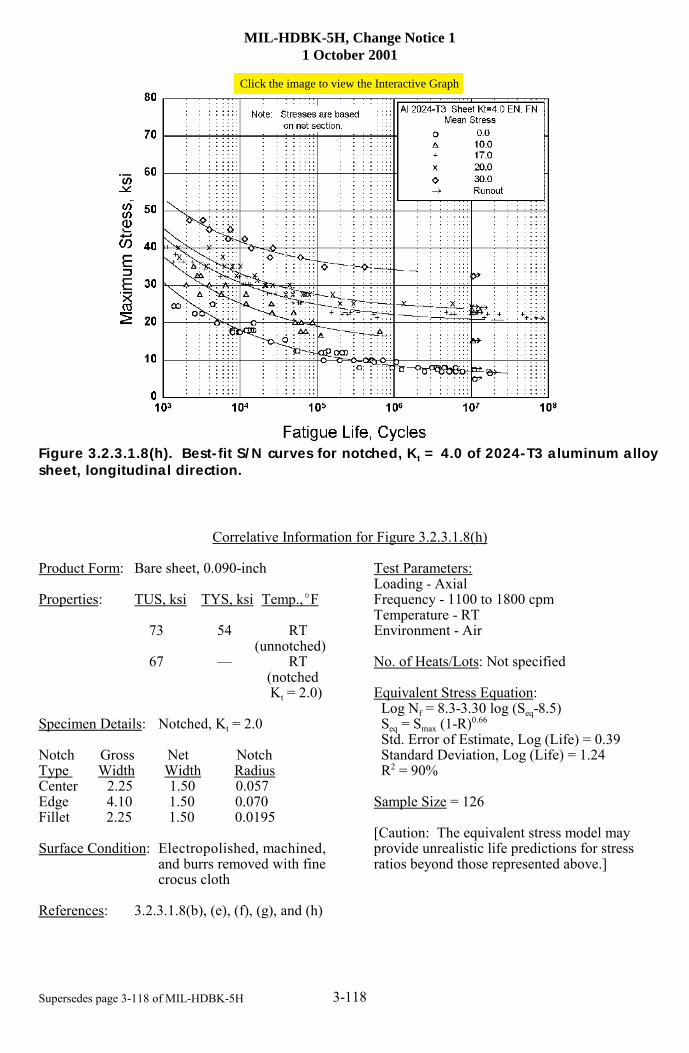
Figure 3.2.3.1.8(h). Best-fit S/N curves for notched, Kt = 4.0 of 2024-T3 aluminum alloysheet, longitudinal direction.
Correlative Information for Figure 3.2.3.1.8(h)
Product Form: Bare sheet, 0.090-inch
Properties: TUS, ksi TYS, ksi Temp.,EF
73 54 RT (unnotched)
67 — RT (notched Kt = 2.0)
Specimen Details: Notched, Kt = 2.0
Notch Gross Net NotchType Width Width RadiusCenter 2.25 1.50 0.057Edge 4.10 1.50 0.070Fillet 2.25 1.50 0.0195
Surface Condition: Electropolished, machined,and burrs removed with finecrocus cloth
References: 3.2.3.1.8(b), (e), (f), (g), and (h)
Test Parameters:Loading - AxialFrequency - 1100 to 1800 cpmTemperature - RTEnvironment - Air
No. of Heats/Lots: Not specified
Equivalent Stress Equation: Log Nf = 8.3-3.30 log (Seq-8.5) Seq = Smax (1-R)0.66
Std. Error of Estimate, Log (Life) = 0.39 Standard Deviation, Log (Life) = 1.24 R2 = 90%
Sample Size = 126
[Caution: The equivalent stress model may provide unrealistic life predictions for stress ratios beyond those represented above.]
Click the image to view the Interactive Graph
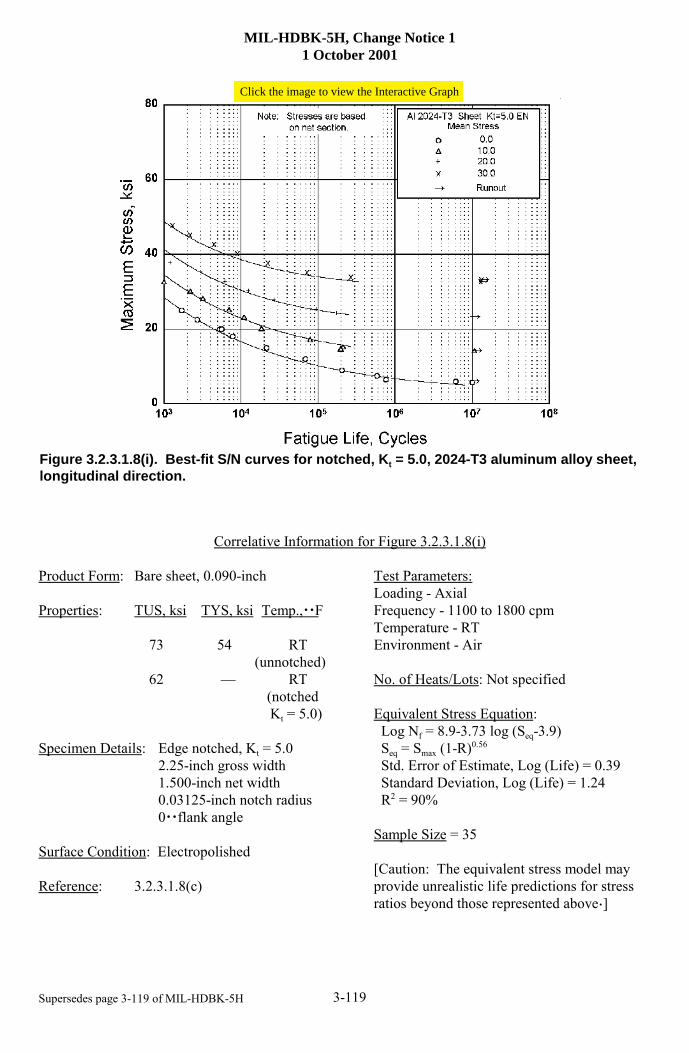
MIL-HDBK-5H, Change Notice 11 October 2001
3-119Supersedes page 3-119 of MIL-HDBK-5H
Figure 3.2.3.1.8(i). Best-fit S/N curves for notched, Kt = 5.0, 2024-T3 aluminum alloy sheet,longitudinal direction.
Correlative Information for Figure 3.2.3.1.8(i)
Product Form: Bare sheet, 0.090-inch
Properties: TUS, ksi TYS, ksi Temp.,··F
73 54 RT (unnotched)
62 — RT (notched Kt = 5.0)
Specimen Details: Edge notched, Kt = 5.02.25-inch gross width1.500-inch net width0.03125-inch notch radius0··flank angle
Surface Condition: Electropolished
Reference: 3.2.3.1.8(c)
Test Parameters:Loading - AxialFrequency - 1100 to 1800 cpmTemperature - RTEnvironment - Air
No. of Heats/Lots: Not specified
Equivalent Stress Equation: Log Nf = 8.9-3.73 log (Seq-3.9) Seq = Smax (1-R)0.56
Std. Error of Estimate, Log (Life) = 0.39 Standard Deviation, Log (Life) = 1.24 R2 = 90%
Sample Size = 35
[Caution: The equivalent stress model may provide unrealistic life predictions for stress ratios beyond those represented above·]
Click the image to view the Interactive Graph
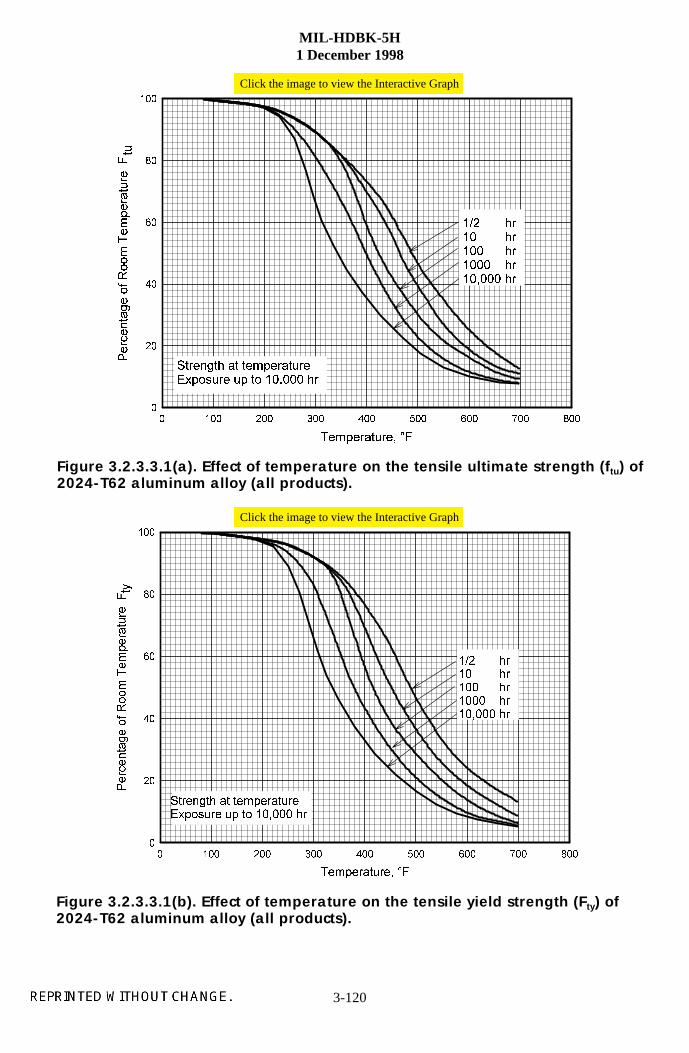
MIL-HDBK-5H1 December 1998
3-120
7HPSHUDWXUH� �)
� ��� ��� ��� ��� ��� ��� ��� ���
3HUFHQWDJHRI5RRP
7HPSHUDWXUH
)W\
�
��
��
��
��
���
6WUHQJWK DW WHPSHUDWXUH([SRVXUH XS WR ������ KU
��� KU�� KU��� KU���� KU������ KU
7HPSHUDWXUH� �)
� ��� ��� ��� ��� ��� ��� ��� ���
3HUFHQWDJHRI5RRP
7HPSHUDWXUH
)WX
�
��
��
��
��
���
6WUHQJWK DW WHPSHUDWXUH([SRVXUH XS WR ������ KU
��� KU�� KU��� KU���� KU������ KU
Click the image to view the Interactive Graph
Click the image to view the Interactive Graph
2024-T62 aluminum alloy (all products).
2024-T62 aluminum alloy (all products).
Figure 3.2.3.3.1(a). Effect of temperature on the tensile ultimate strength (ftu) of
Figure 3.2.3.3.1(b). Effect of temperature on the tensile yield strength (Fty) of
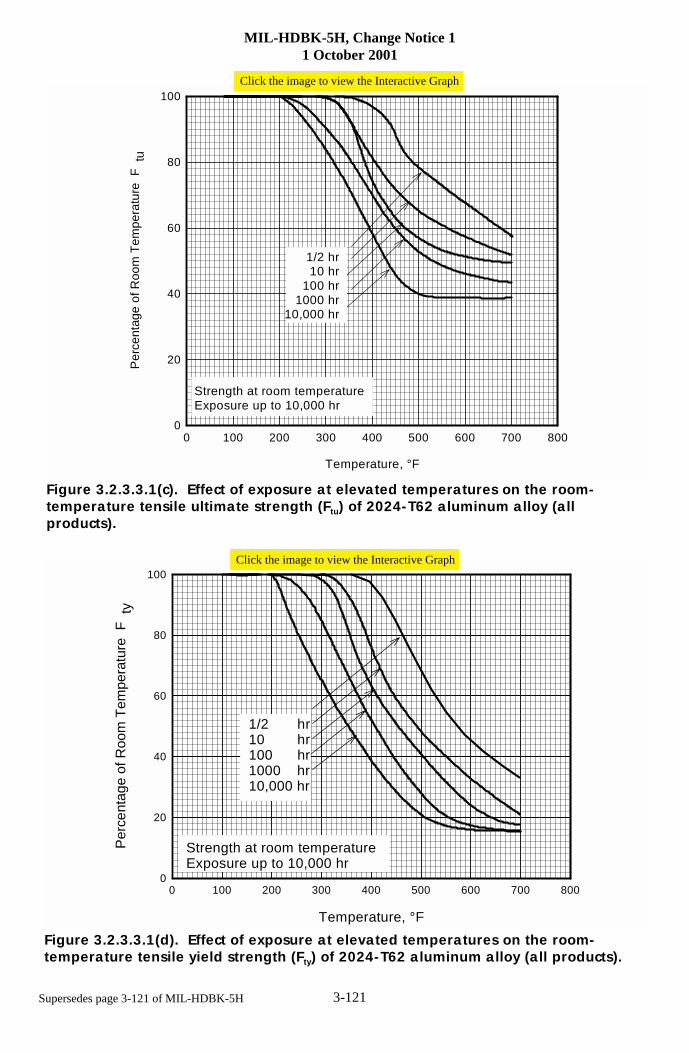
MIL-HDBK-5H, Change Notice 11 October 2001
3-121Supersedes page 3-121 of MIL-HDBK-5H
Temperature, °F
0 100 200 300 400 500 600 700 800
Perc
enta
ge o
f Roo
m T
empe
ratu
re F
ty
0
20
40
60
80
100
Strength at room temperature Exposure up to 10,000 hr
1/2 hr10 hr100 hr1000 hr10,000 hr
Figure 3.2.3.3.1(d). Effect of exposure at elevated temperatures on the room-temperature tensile yield strength (Fty) of 2024-T62 aluminum alloy (all products).
Temperature, °F
0 100 200 300 400 500 600 700 800
Perc
enta
ge o
f Roo
m T
empe
ratu
re F
tu
0
20
40
60
80
100
Strength at room temperature Exposure up to 10,000 hr
1/2 hr10 hr
100 hr1000 hr
10,000 hr
Figure 3.2.3.3.1(c). Effect of exposure at elevated temperatures on the room-temperature tensile ultimate strength (Ftu) of 2024-T62 aluminum alloy (allproducts).
Click the image to view the Interactive Graph
Click the image to view the Interactive Graph
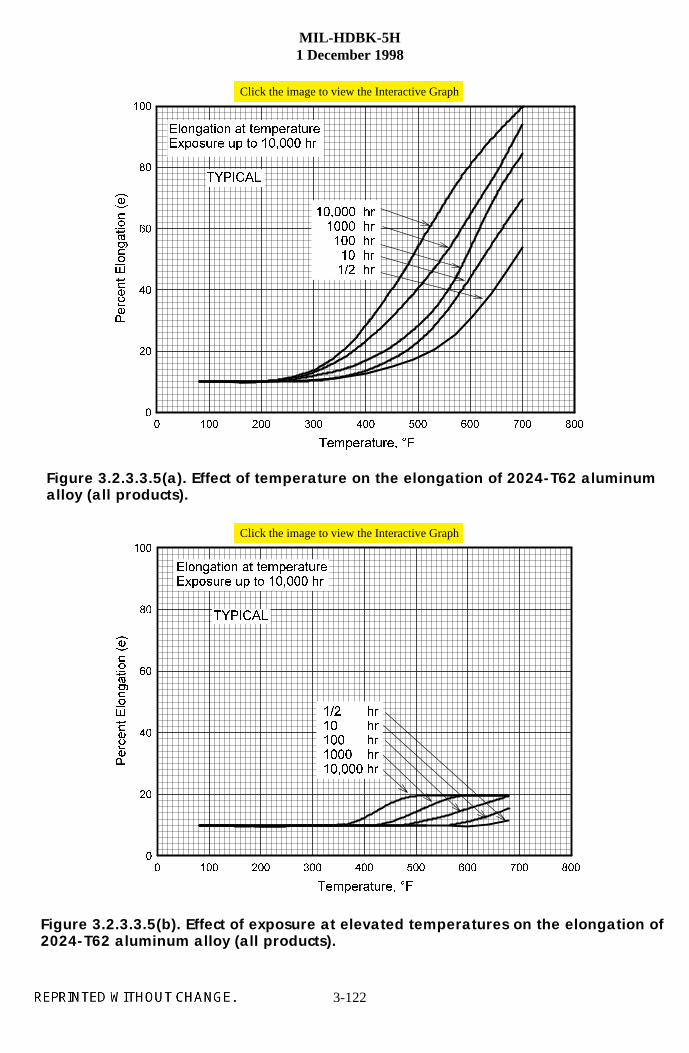
MIL-HDBK-5H1 December 1998
3-122
7HPSHUDWXUH� �)
� ��� ��� ��� ��� ��� ��� ��� ���
3HUFHQW(ORQJDWLRQ�H�
�
��
��
��
��
���
(ORQJDWLRQ DW WHPSHUDWXUH([SRVXUH XS WR ������ KU
��� KU�� KU��� KU���� KU������ KU
7<3,&$/
7HPSHUDWXUH� �)
� ��� ��� ��� ��� ��� ��� ��� ���
3HUFHQW(ORQJDWLRQ�H�
�
��
��
��
��
���
(ORQJDWLRQ DW WHPSHUDWXUH([SRVXUH XS WR ������ KU
������ KU���� KU��� KU�� KU��� KU
7<3,&$/
Click the image to view the Interactive Graph
alloy (all products).Figure 3.2.3.3.5(a). Effect of temperature on the elongation of 2024-T62 aluminum
2024-T62 aluminum alloy (all products).Figure 3.2.3.3.5(b). Effect of exposure at elevated temperatures on the elongation of
Click the image to view the Interactive Graph
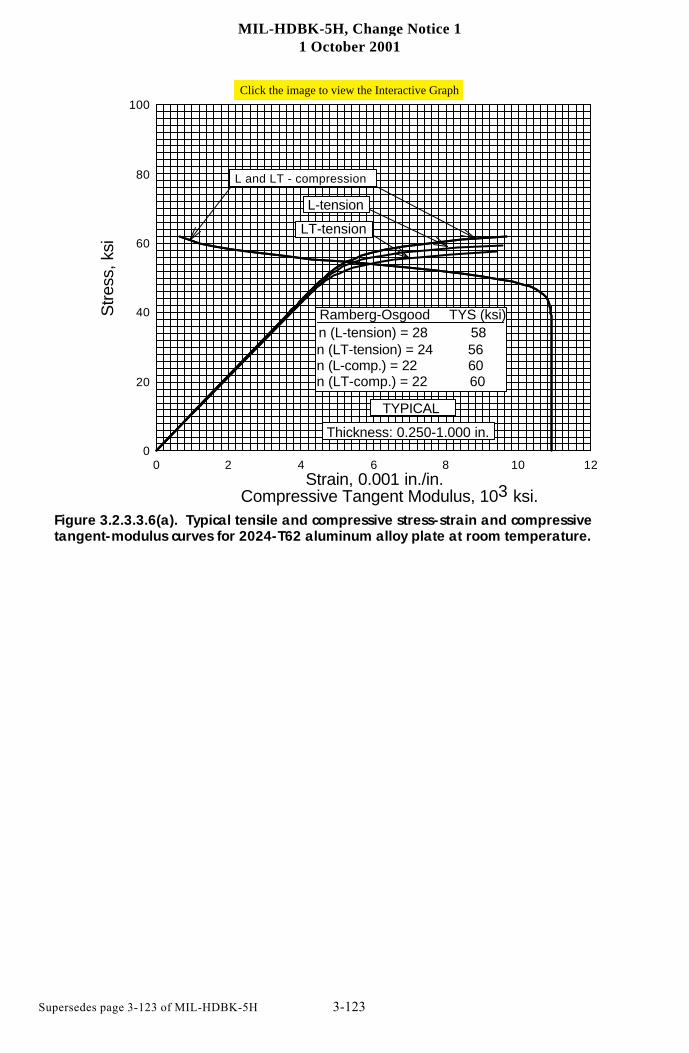
MIL-HDBK-5H, Change Notice 11 October 2001
3-123Supersedes page 3-123 of MIL-HDBK-5H
Compressive Tangent Modulus, 103 ksi.Strain, 0.001 in./in.
0 2 4 6 8 10 12
Stre
ss, k
si
0
20
40
60
80
100
TYPICAL
Thickness: 0.250-1.000 in.
n (L-tension) = 28 58n (LT-tension) = 24 56
Ramberg-Osgood TYS (ksi)
n (L-comp.) = 22 60n (LT-comp.) = 22 60
L and LT - compression
L-tension
LT-tension
Figure 3.2.3.3.6(a). Typical tensile and compressive stress-strain and compressivetangent-modulus curves for 2024-T62 aluminum alloy plate at room temperature.
Click the image to view the Interactive Graph
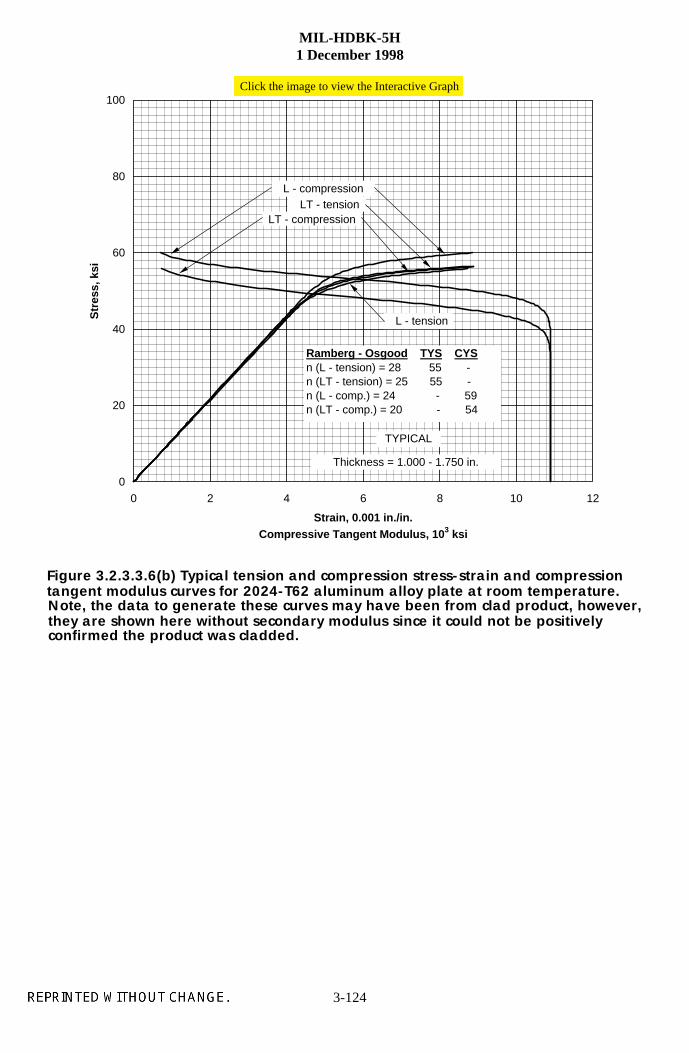
MIL-HDBK-5H1 December 1998
3-124
0
20
40
60
80
100
0 2 4 6 8 10 12
Strain, 0.001 in./in. Compressive Tangent Modulus, 10 3 ksi
Str
ess,
ksi
Ramberg - Osgood TYS CYSn (L - tension) = 28 55 -n (LT - tension) = 25 55 -n (L - comp.) = 24 - 59n (LT - comp.) = 20 - 54
Thickness = 1.000 - 1.750 in.
L - compression
TYPICAL
LT - compression
L - tension
LT - tension
Click the image to view the Interactive Graph
Figure 3.2.3.3.6(b) Typical tension and compression stress-strain and compressiontangent modulus curves for 2024-T62 aluminum alloy plate at room temperature.Note, the data to generate these curves may have been from clad product, however,they are shown here without secondary modulus since it could not be positively confirmed the product was cladded.
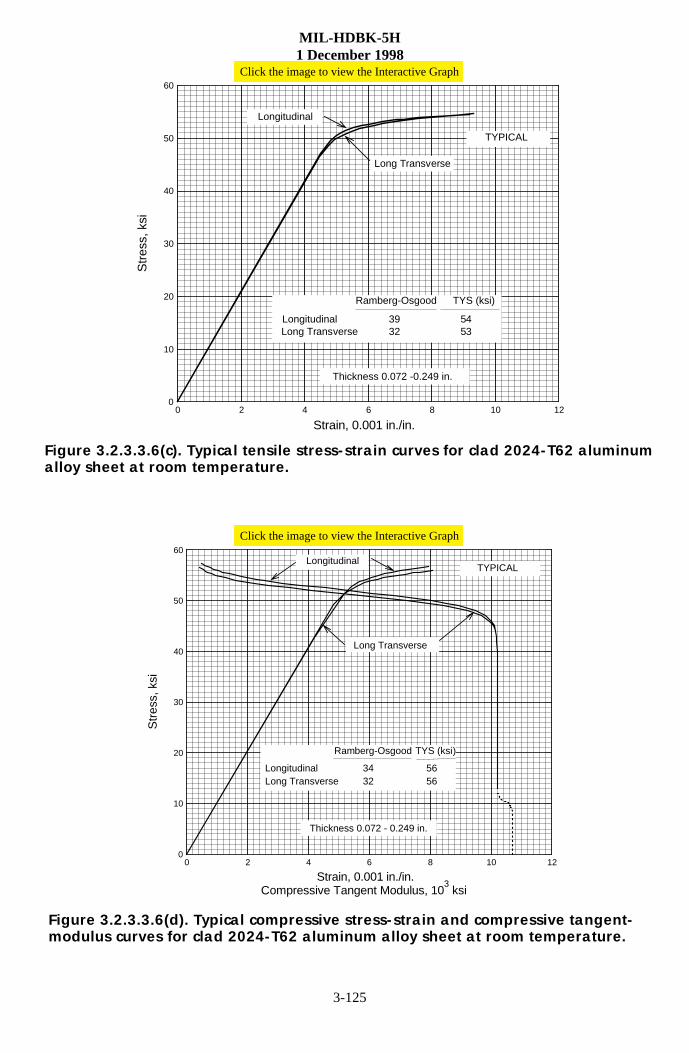
MIL-HDBK-5H1 December 1998
3-125
0
10
20
30
40
50
60
Str
ess,
ksi
0 2 4 6 8 10 12
Strain, 0.001 in./in.
TYPICAL
Ramberg-Osgood
Longitudinal
Long Transverse
Thickness 0.072 -0.249 in.
TYS (ksi)
LongitudinalLong Transverse
39 32
54 53
0
10
20
30
40
50
60
Str
ess,
ksi
0 2 4 6 8 10 12
Compressive Tangent Modulus, 103 ksi
Strain, 0.001 in./in.
TYPICAL
Ramberg-Osgood
Longitudinal
Long Transverse
TYS (ksi)
LongitudinalLong Transverse
Thickness 0.072 - 0.249 in.
34 32
56 56
Click the image to view the Interactive Graph
alloy sheet at room temperature.Figure 3.2.3.3.6(c). Typical tensile stress-strain curves for clad 2024-T62 aluminum
modulus curves for clad 2024-T62 aluminum alloy sheet at room temperature.Figure 3.2.3.3.6(d). Typical compressive stress-strain and compressive tangent-
Click the image to view the Interactive Graph
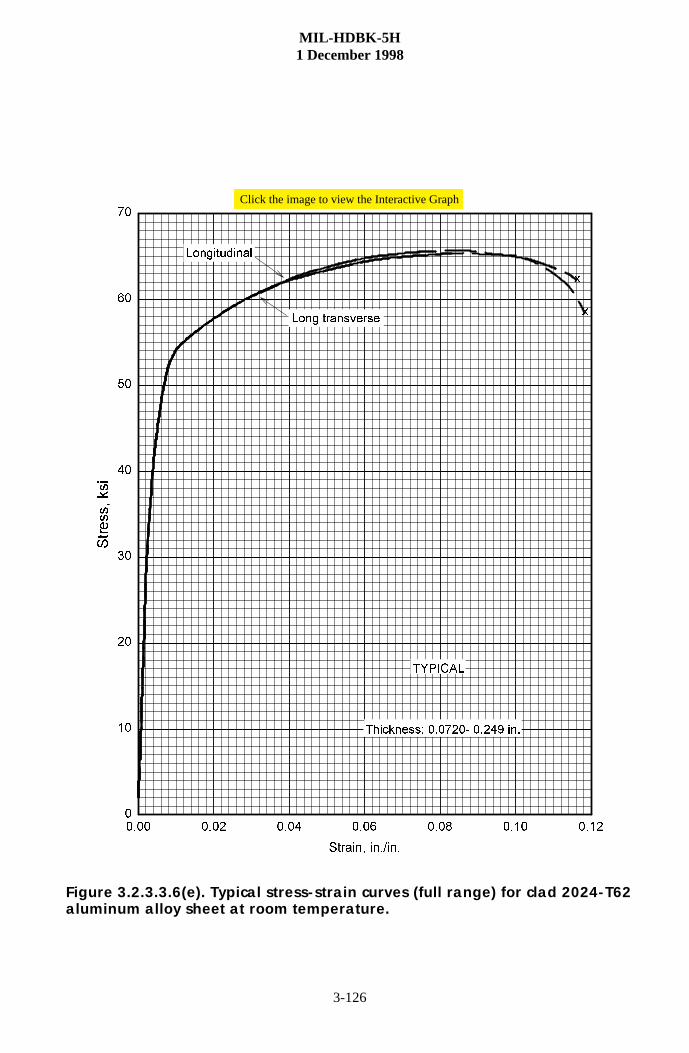
MIL-HDBK-5H1 December 1998
3-126
6WUDLQ� LQ��LQ�
���� ���� ���� ���� ���� ���� ����
6WUHVV�NVL
�
��
��
��
��
��
��
��
[
[
7KLFNQHVV� ������� ����� LQ�
7<3,&$/
/RQJ WUDQVYHUVH
/RQJLWXGLQDO
Click the image to view the Interactive Graph
aluminum alloy sheet at room temperature.Figure 3.2.3.3.6(e). Typical stress-strain curves (full range) for clad 2024-T62
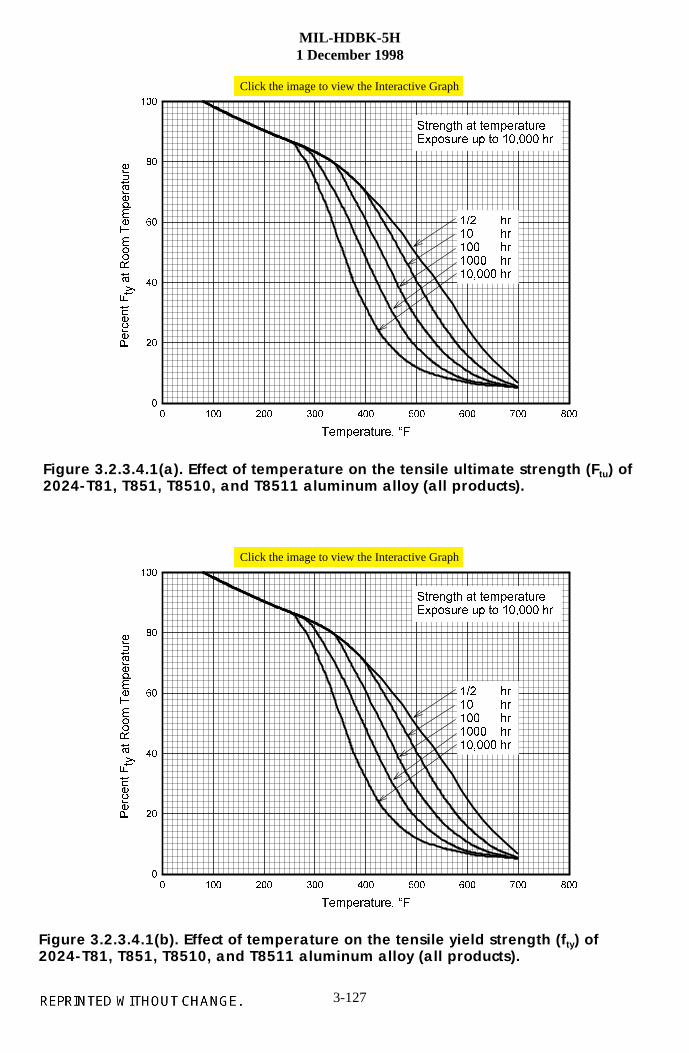
MIL-HDBK-5H1 December 1998
3-127
7HPSHUDWXUH� �)
� ��� ��� ��� ��� ��� ��� ��� ���
3HUFHQW)W\DW5RRP
7HPSHUDWXUH
�
��
��
��
��
���
6WUHQJWK DW WHPSHUDWXUH([SRVXUH XS WR ������ KU
��� KU�� KU��� KU���� KU������ KU
7HPSHUDWXUH� �)
� ��� ��� ��� ��� ��� ��� ��� ���
3HUFHQW)W\DW5RRP
7HPSHUDWXUH
�
��
��
��
��
���
6WUHQJWK DW WHPSHUDWXUH([SRVXUH XS WR ������ KU
��� KU�� KU��� KU���� KU������ KU
Click the image to view the Interactive Graph
2024-T81, T851, T8510, and T8511 aluminum alloy (all products).
2024-T81, T851, T8510, and T8511 aluminum alloy (all products).
Figure 3.2.3.4.1(a). Effect of temperature on the tensile ultimate strength (Ftu) of
Figure 3.2.3.4.1(b). Effect of temperature on the tensile yield strength (fty) of
Click the image to view the Interactive Graph
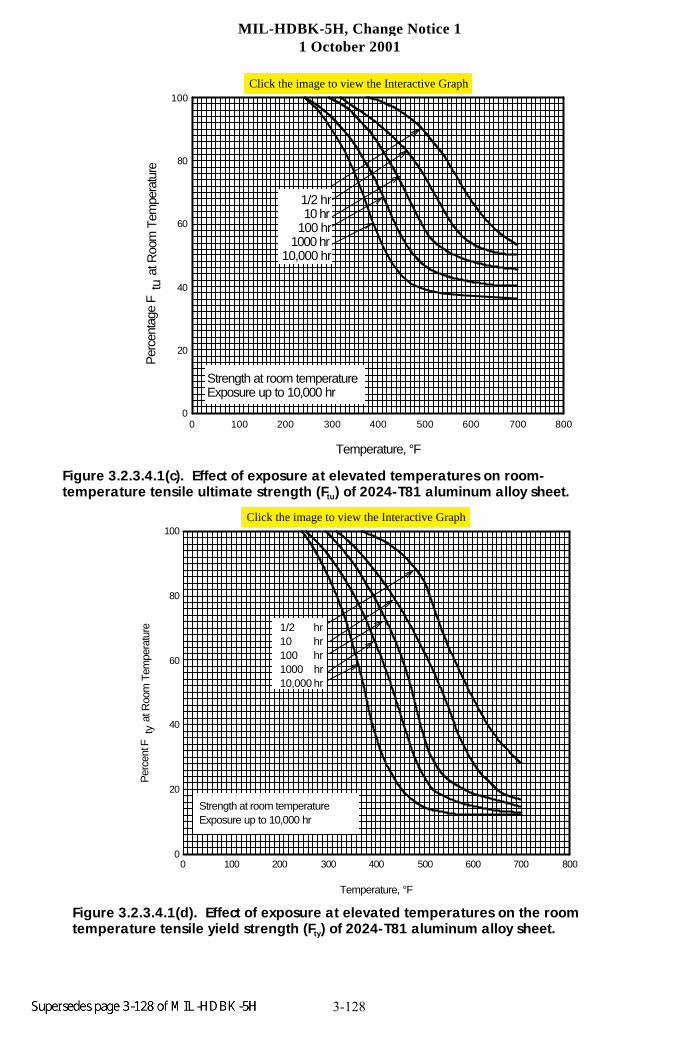
MIL-HDBK-5H, Change Notice 11 October 2001
3-128
Temperature, °F
0 100 200 300 400 500 600 700 800
Per
cent
age
Ftu
at R
oom
Tem
pera
ture
0
20
40
60
80
100
Strength at room temperature Exposure up to 10,000 hr
1/2 hr10 hr
100 hr1000 hr
10,000 hr
Figure 3.2.3.4.1(c). Effect of exposure at elevated temperatures on room-temperature tensile ultimate strength (Ftu) of 2024-T81 aluminum alloy sheet.
Temperature, °F
0 100 200 300 400 500 600 700 800
Per
cent
Fty
at R
oom
Tem
pera
ture
0
20
40
60
80
100
Strength at room temperature Exposure up to 10,000 hr
1/2 hr10 hr100 hr1000 hr10,000 hr
Figure 3.2.3.4.1(d). Effect of exposure at elevated temperatures on the roomtemperature tensile yield strength (Fty) of 2024-T81 aluminum alloy sheet.
Click the image to view the Interactive Graph
Click the image to view the Interactive Graph
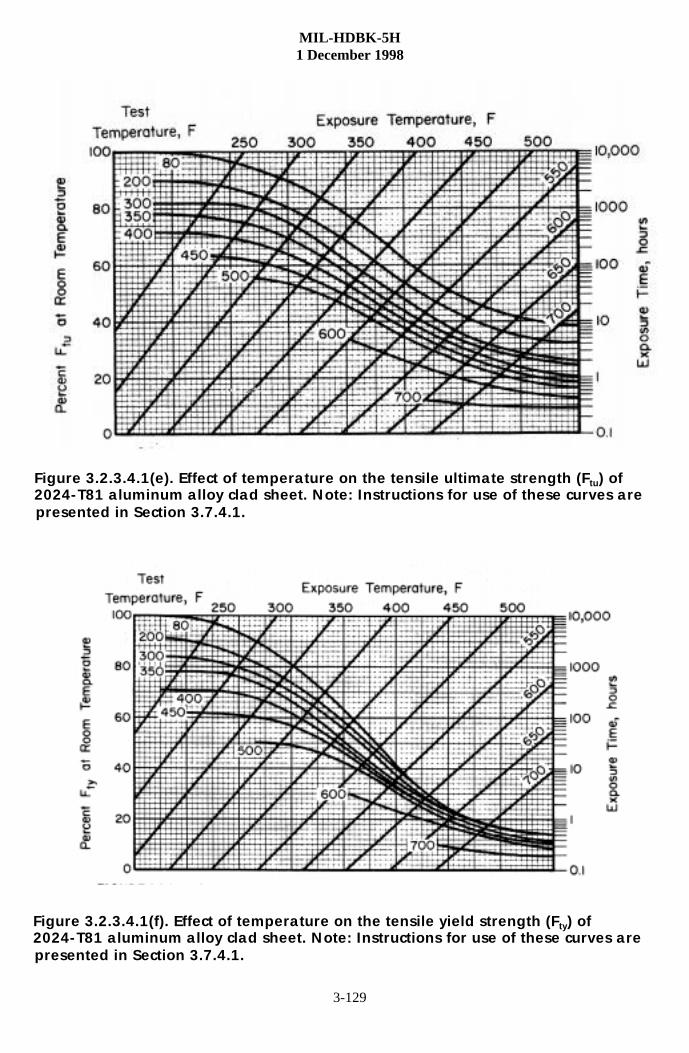
MIL-HDBK-5H1 December 1998
3-129
2024-T81 aluminum alloy clad sheet. Note: Instructions for use of these curves arepresented in Section 3.7.4.1.
2024-T81 aluminum alloy clad sheet. Note: Instructions for use of these curves arepresented in Section 3.7.4.1.
Figure 3.2.3.4.1(e). Effect of temperature on the tensile ultimate strength (Ftu) of
Figure 3.2.3.4.1(f). Effect of temperature on the tensile yield strength (Fty) of
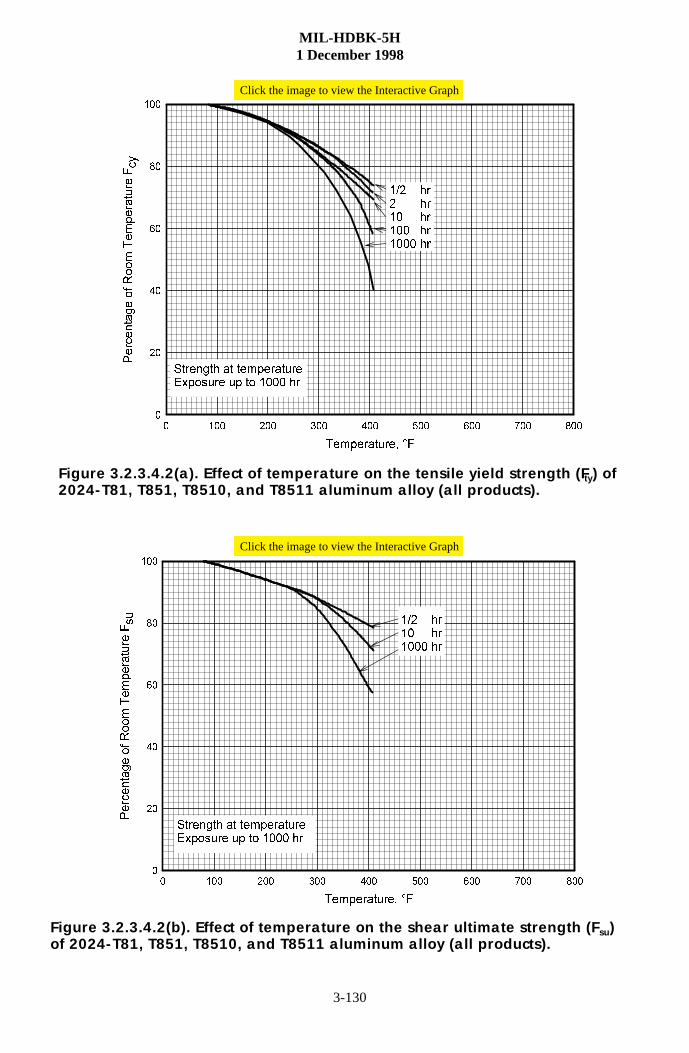
MIL-HDBK-5H1 December 1998
3-130
7HPSHUDWXUH� �)
� ��� ��� ��� ��� ��� ��� ��� ���
3HUFHQWDJHRI5RRP
7HPSHUDWXUH
)F\
�
��
��
��
��
���
��� KU� KU�� KU��� KU���� KU
6WUHQJWK DW WHPSHUDWXUH([SRVXUH XS WR ���� KU
7HPSHUDWXUH� �)
� ��� ��� ��� ��� ��� ��� ��� ���
3HUFHQWDJHRI5RRP
7HPSHUDWXUH
)VX
�
��
��
��
��
���
��� KU�� KU���� KU
6WUHQJWK DW WHPSHUDWXUH([SRVXUH XS WR ���� KU
Click the image to view the Interactive Graph
2024-T81, T851, T8510, and T8511 aluminum alloy (all products).Figure 3.2.3.4.2(a). Effect of temperature on the tensile yield strength (Fty) of
of 2024-T81, T851, T8510, and T8511 aluminum alloy (all products).Figure 3.2.3.4.2(b). Effect of temperature on the shear ultimate strength (Fsu)
Click the image to view the Interactive Graph
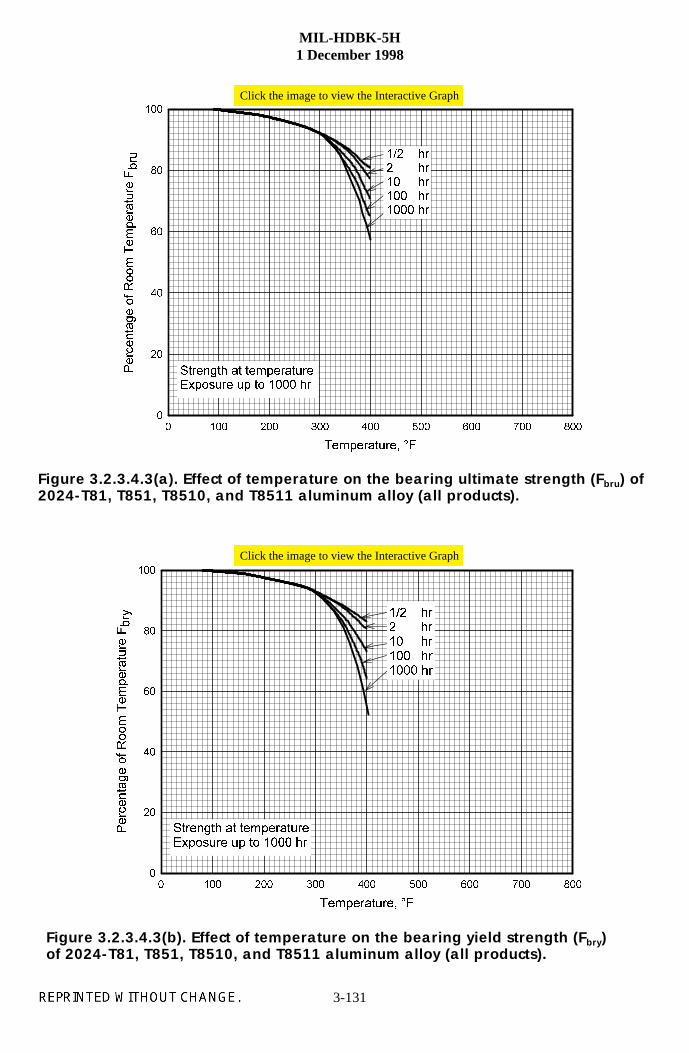
MIL-HDBK-5H1 December 1998
3-131
7HPSHUDWXUH� �)
� ��� ��� ��� ��� ��� ��� ��� ���
3HUFHQWDJHRI5RRP
7HPSHUDWXUH
)EUX
�
��
��
��
��
���
��� KU� KU�� KU��� KU���� KU
6WUHQJWK DW WHPSHUDWXUH([SRVXUH XS WR ���� KU
7HPSHUDWXUH� �)
� ��� ��� ��� ��� ��� ��� ��� ���
3HUFHQWDJHRI5RRP
7HPSHUDWXUH
)EU\
�
��
��
��
��
���
��� KU� KU�� KU��� KU���� KU
6WUHQJWK DW WHPSHUDWXUH([SRVXUH XS WR ���� KU
Click the image to view the Interactive Graph
2024-T81, T851, T8510, and T8511 aluminum alloy (all products).
of 2024-T81, T851, T8510, and T8511 aluminum alloy (all products).
Figure 3.2.3.4.3(a). Effect of temperature on the bearing ultimate strength (Fbru) of
Figure 3.2.3.4.3(b). Effect of temperature on the bearing yield strength (Fbry)
Click the image to view the Interactive Graph
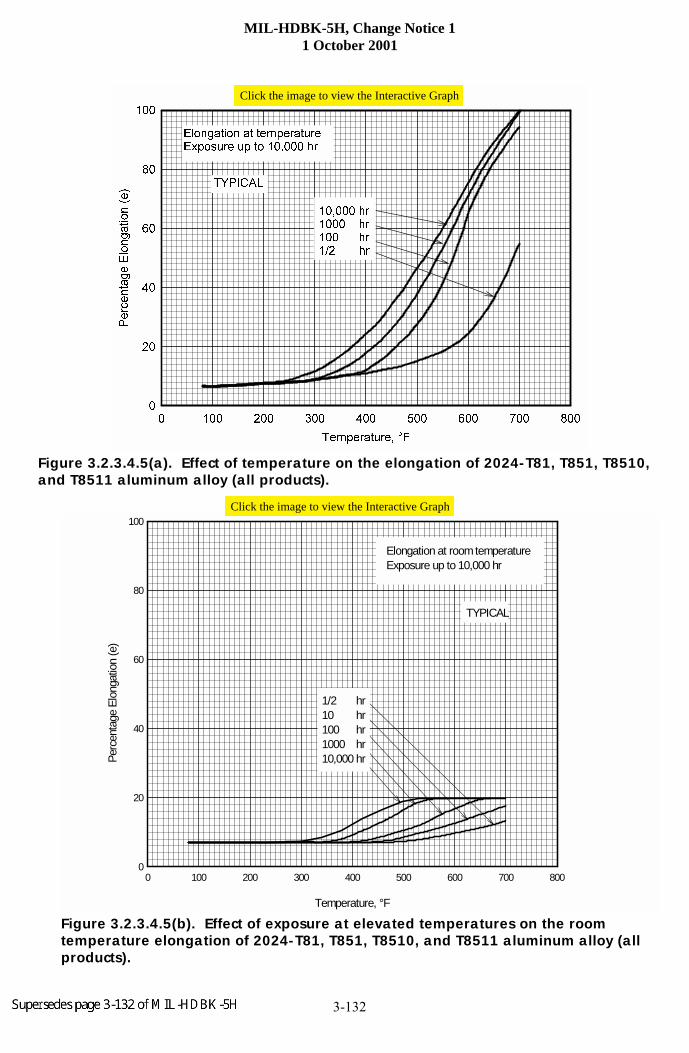
MIL-HDBK-5H, Change Notice 11 October 2001
3-132
7HPSHUDWXUH� �)
� ��� ��� ��� ��� ��� ��� ��� ���
3HUFHQWDJH(ORQJDWLRQ�H�
�
��
��
��
��
���
(ORQJDWLRQ DW WHPSHUDWXUH([SRVXUH XS WR ������ KU
������ KU���� KU��� KU��� KU
7<3,&$/
Figure 3.2.3.4.5(a). Effect of temperature on the elongation of 2024-T81, T851, T8510,and T8511 aluminum alloy (all products).
Temperature, °F
0 100 200 300 400 500 600 700 800
Per
cent
age
Elo
ngat
ion
(e)
0
20
40
60
80
100
Elongation at room temperature Exposure up to 10,000 hr
1/2 hr10 hr100 hr1000 hr10,000 hr
TYPICAL
Figure 3.2.3.4.5(b). Effect of exposure at elevated temperatures on the roomtemperature elongation of 2024-T81, T851, T8510, and T8511 aluminum alloy (allproducts).
Click the image to view the Interactive Graph
Click the image to view the Interactive Graph
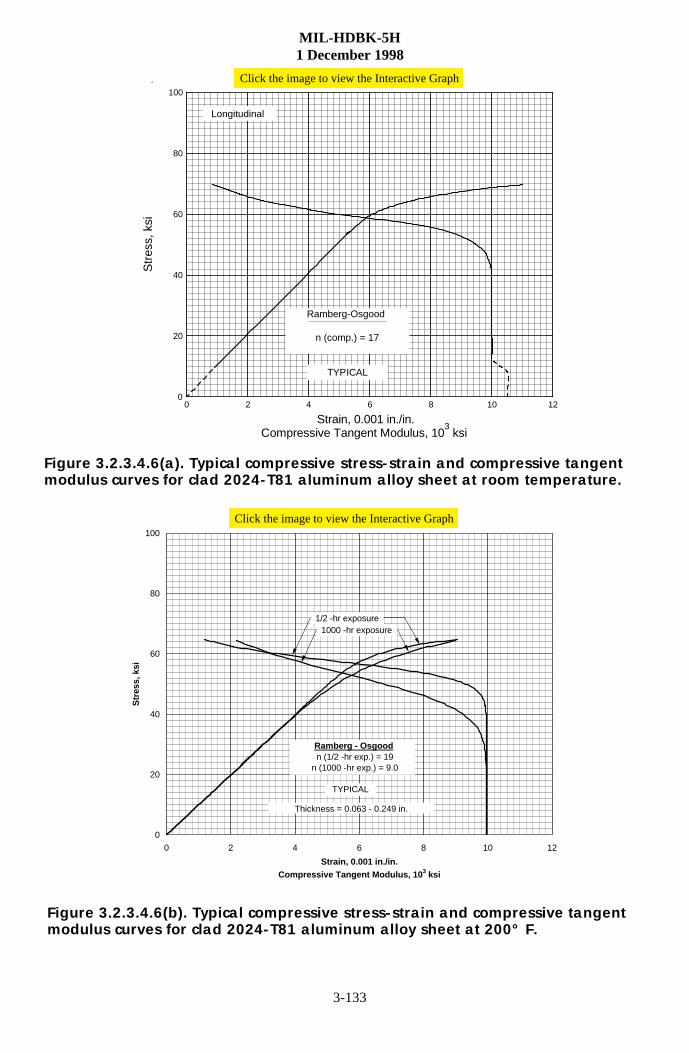
MIL-HDBK-5H1 December 1998
3-133
0
20
40
60
80
100
Str
ess,
ksi
0 2 4 6 8 10 12
Compressive Tangent Modulus, 103 ksi
Strain, 0.001 in./in.
n (comp.) = 17
Longitudinal
TYPICAL
Ramberg-Osgood
0
20
40
60
80
100
0 2 4 6 8 10 12
Strain, 0.001 in./in. Compressive Tangent Modulus, 10 3 ksi
Str
ess,
ksi
Ramberg - Osgood n (1/2 -hr exp.) = 19
n (1000 -hr exp.) = 9.0
Thickness = 0.063 - 0.249 in.
1/2 -hr exposure1000 -hr exposure
TYPICAL
Click the image to view the Interactive Graph
modulus curves for clad 2024-T81 aluminum alloy sheet at room temperature.Figure 3.2.3.4.6(a). Typical compressive stress-strain and compressive tangent
modulus curves for clad 2024-T81 aluminum alloy sheet at 200° F.Figure 3.2.3.4.6(b). Typical compressive stress-strain and compressive tangent
Click the image to view the Interactive Graph
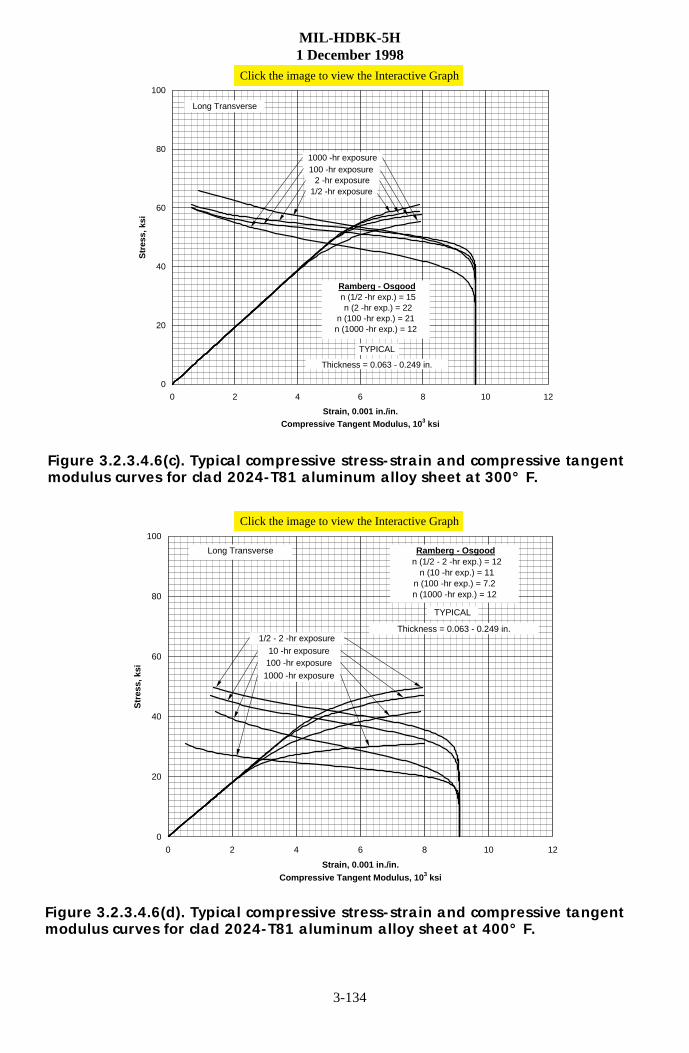
MIL-HDBK-5H1 December 1998
3-134
0
20
40
60
80
100
0 2 4 6 8 10 12
Strain, 0.001 in./in. Compressive Tangent Modulus, 10 3 ksi
Str
ess,
ksi
Ramberg - Osgood n (1/2 - 2 -hr exp.) = 12
n (10 -hr exp.) = 11n (100 -hr exp.) = 7.2n (1000 -hr exp.) = 12
Thickness = 0.063 - 0.249 in.
Long Transverse
TYPICAL
10 -hr exposure1/2 - 2 -hr exposure
100 -hr exposure
1000 -hr exposure
0
20
40
60
80
100
0 2 4 6 8 10 12
Strain, 0.001 in./in. Compressive Tangent Modulus, 10 3 ksi
Str
ess,
ksi
Ramberg - Osgood n (1/2 -hr exp.) = 15 n (2 -hr exp.) = 22n (100 -hr exp.) = 21n (1000 -hr exp.) = 12
Thickness = 0.063 - 0.249 in.
1/2 -hr exposure
100 -hr exposure2 -hr exposure
1000 -hr exposure
TYPICAL
Long Transverse
Click the image to view the Interactive Graph
modulus curves for clad 2024-T81 aluminum alloy sheet at 300° F.Figure 3.2.3.4.6(c). Typical compressive stress-strain and compressive tangent
modulus curves for clad 2024-T81 aluminum alloy sheet at 400° F.Figure 3.2.3.4.6(d). Typical compressive stress-strain and compressive tangent
Click the image to view the Interactive Graph
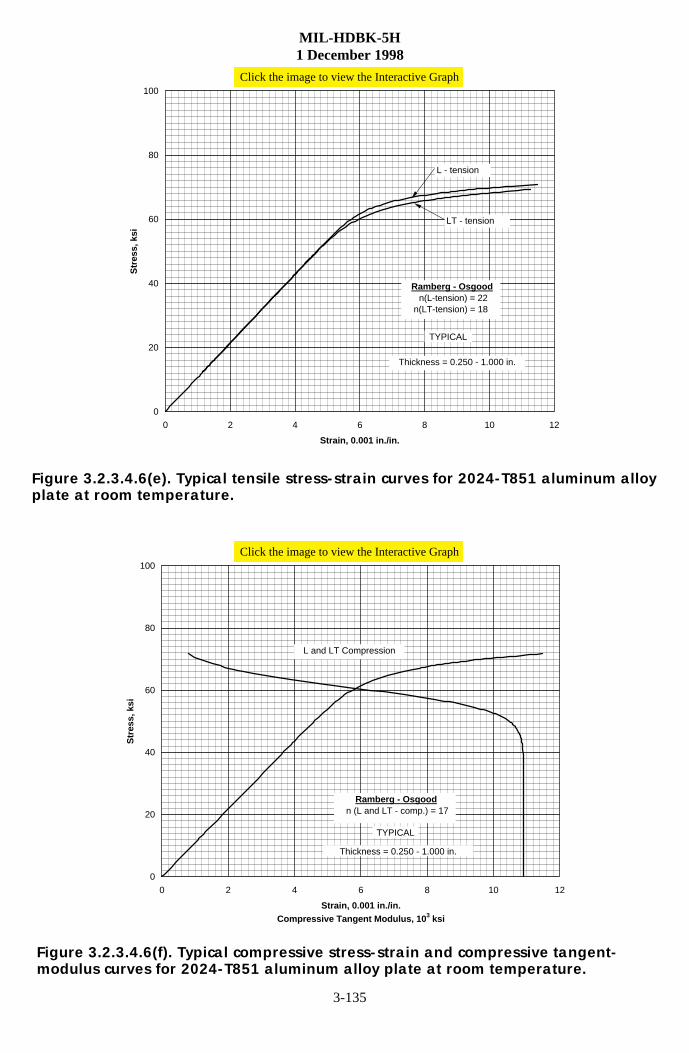
MIL-HDBK-5H1 December 1998
3-135
0
20
40
60
80
100
0 2 4 6 8 10 12
Strain, 0.001 in./in.
Str
ess,
ksi
Ramberg - Osgood n(L-tension) = 22n(LT-tension) = 18
Thickness = 0.250 - 1.000 in.
LT - tension
TYPICAL
L - tension
0
20
40
60
80
100
0 2 4 6 8 10 12
Strain, 0.001 in./in. Compressive Tangent Modulus, 10 3 ksi
Str
ess,
ksi
Ramberg - Osgood n (L and LT - comp.) = 17
Thickness = 0.250 - 1.000 in.
L and LT Compression
TYPICAL
Click the image to view the Interactive Graph
plate at room temperature.Figure 3.2.3.4.6(e). Typical tensile stress-strain curves for 2024-T851 aluminum alloy
modulus curves for 2024-T851 aluminum alloy plate at room temperature.Figure 3.2.3.4.6(f). Typical compressive stress-strain and compressive tangent-
Click the image to view the Interactive Graph
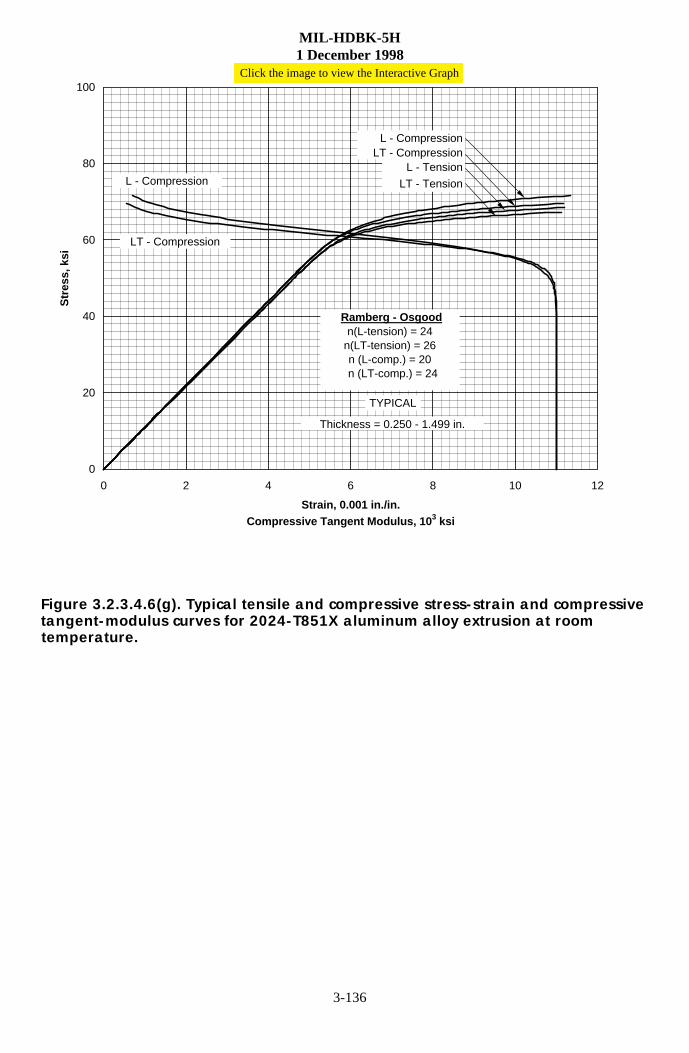
MIL-HDBK-5H1 December 1998
3-136
0
20
40
60
80
100
0 2 4 6 8 10 12
Strain, 0.001 in./in. Compressive Tangent Modulus, 10 3 ksi
Str
ess,
ksi
Ramberg - Osgoodn(L-tension) = 24
n(LT-tension) = 26n (L-comp.) = 20
n (LT-comp.) = 24
Thickness = 0.250 - 1.499 in.
TYPICAL
L - Tension
LT - Tension
L - Compression
L - Compression
LT - Compression
LT - Compression
Click the image to view the Interactive Graph
tangent-modulus curves for 2024-T851X aluminum alloy extrusion at roomFigure 3.2.3.4.6(g). Typical tensile and compressive stress-strain and compressive
temperature.
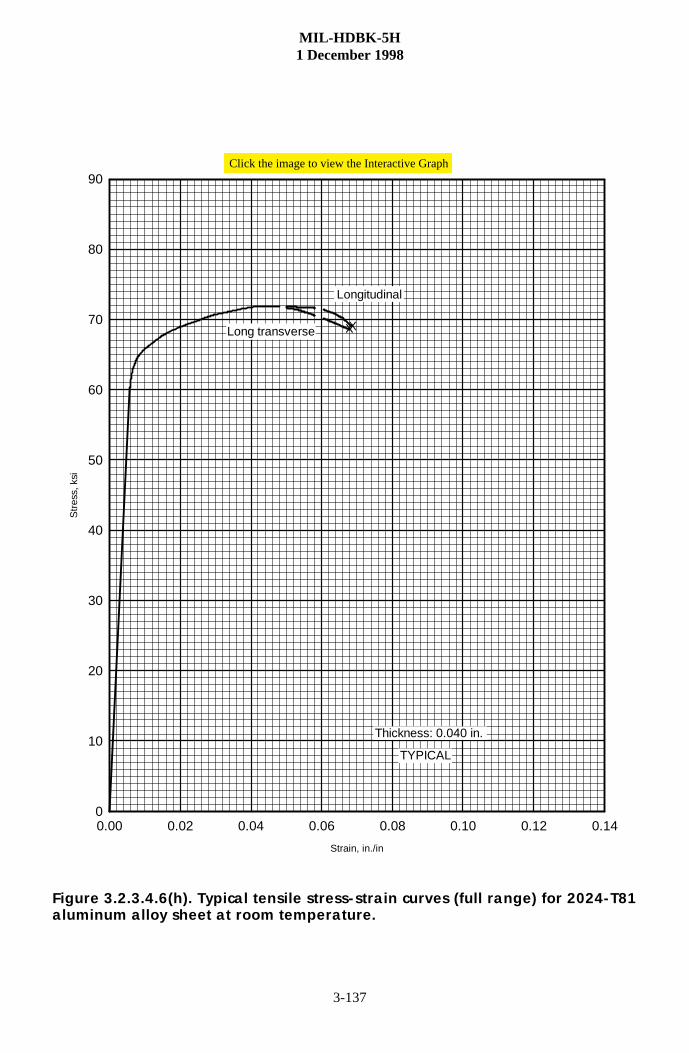
MIL-HDBK-5H1 December 1998
3-137
xx
Strain, in./in
0.00 0.02 0.04 0.06 0.08 0.10 0.12 0.14
Str
ess,
ksi
0
10
20
30
40
50
60
70
80
90
XX
Thickness: 0.040 in.
Long transverse
Longitudinal
TYPICAL
Click the image to view the Interactive Graph
aluminum alloy sheet at room temperature.Figure 3.2.3.4.6(h). Typical tensile stress-strain curves (full range) for 2024-T81
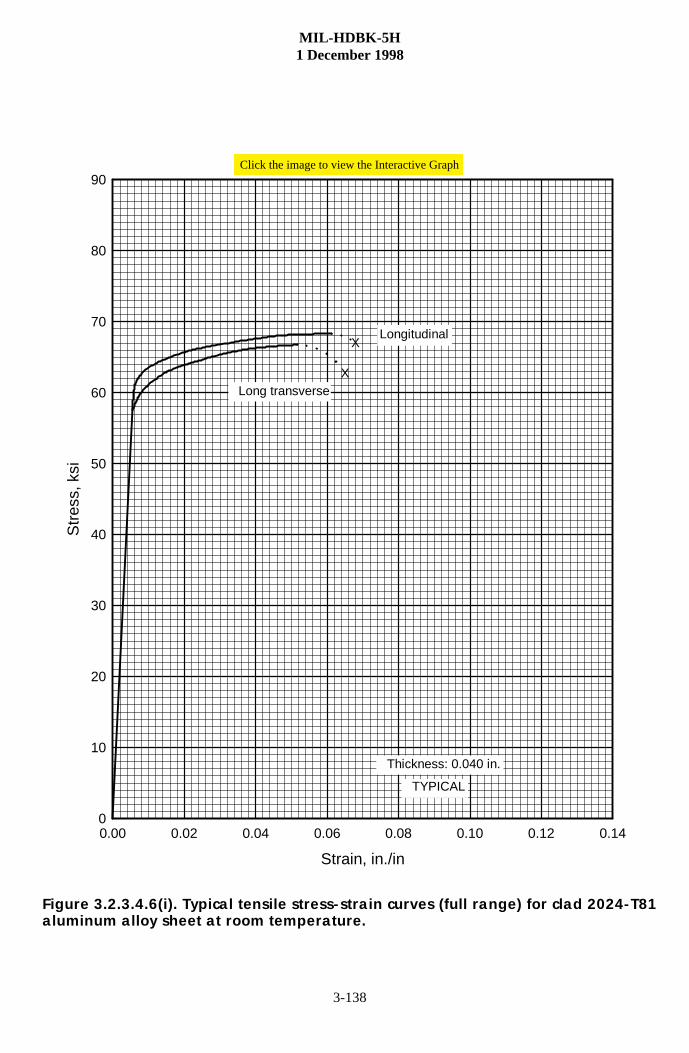
MIL-HDBK-5H1 December 1998
3-138
xx
Strain, in./in
0.00 0.02 0.04 0.06 0.08 0.10 0.12 0.14
Str
ess,
ksi
0
10
20
30
40
50
60
70
80
90
X
X
Thickness: 0.040 in.
Long transverse
Longitudinal
TYPICAL
Click the image to view the Interactive Graph
aluminum alloy sheet at room temperature.Figure 3.2.3.4.6(i). Typical tensile stress-strain curves (full range) for clad 2024-T81
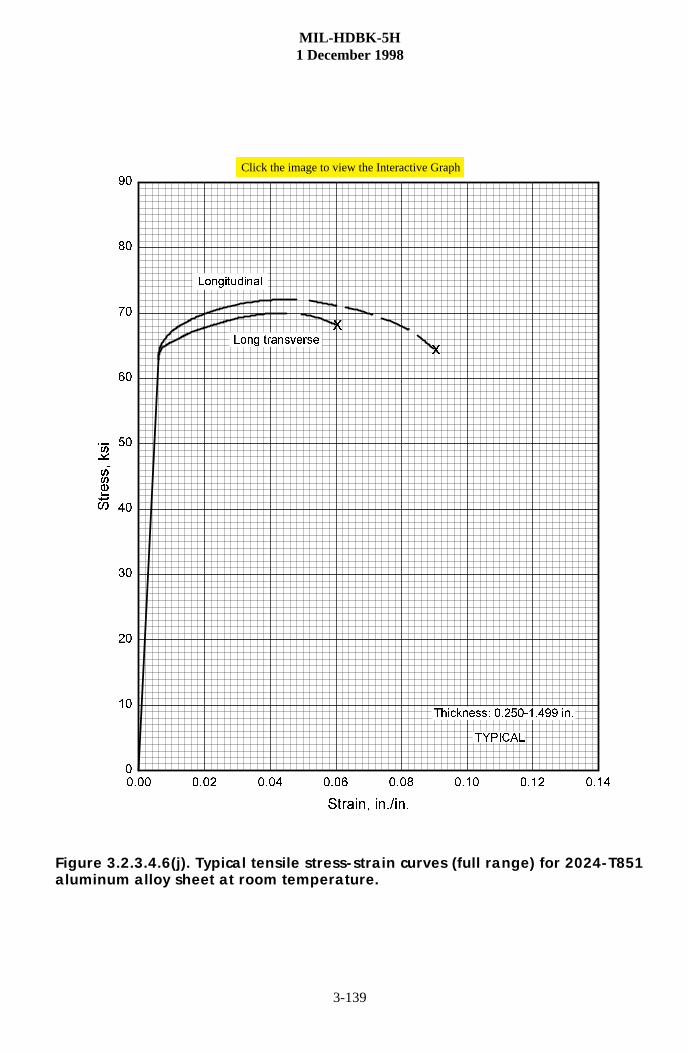
MIL-HDBK-5H1 December 1998
3-139
6WUDLQ� LQ��LQ�
���� ���� ���� ���� ���� ���� ���� ����
6WUHVV�NVL
�
��
��
��
��
��
��
��
��
��
[
[
7KLFNQHVV� ����������� LQ�
7<3,&$/
/RQJ WUDQVYHUVH
/RQJLWXGLQDO
Click the image to view the Interactive Graph
aluminum alloy sheet at room temperature.Figure 3.2.3.4.6(j). Typical tensile stress-strain curves (full range) for 2024-T851
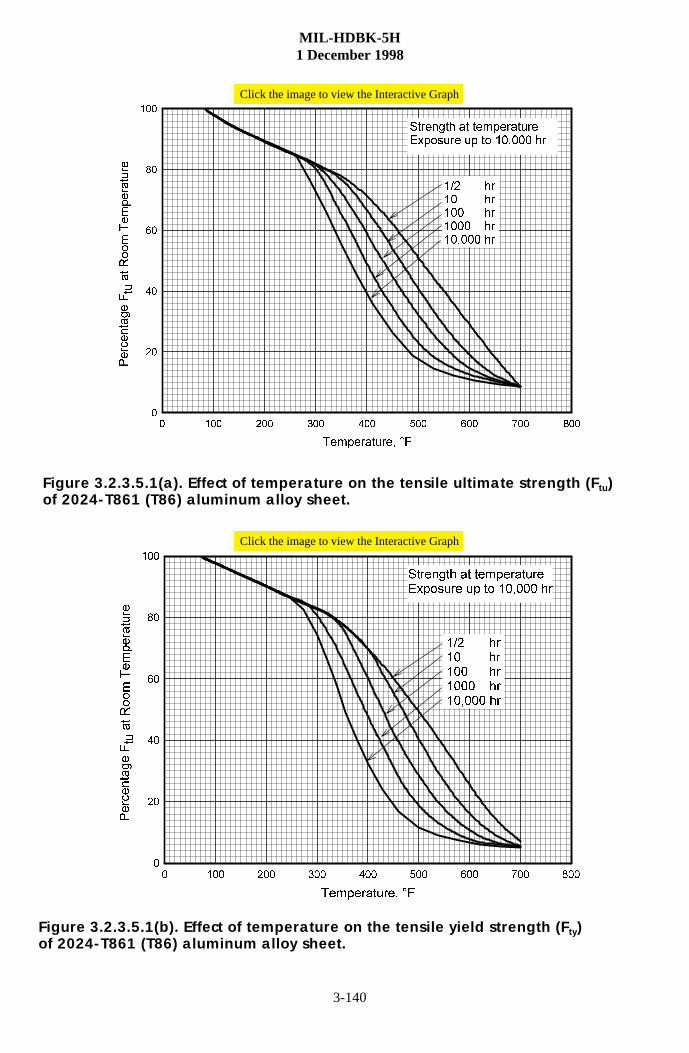
MIL-HDBK-5H1 December 1998
3-140
7HPSHUDWXUH� �)
� ��� ��� ��� ��� ��� ��� ��� ���
3HUFHQWDJH)WXDW5RRP7HPSHUDWXUH
�
��
��
��
��
���
6WUHQJWK DW WHPSHUDWXUH([SRVXUH XS WR ������ KU
��� KU�� KU��� KU���� KU������ KU
7HPSHUDWXUH� �)
� ��� ��� ��� ��� ��� ��� ��� ���
3HUFHQWDJH)WXDW5RRP7HPSHUDWXUH
�
��
��
��
��
���
6WUHQJWK DW WHPSHUDWXUH([SRVXUH XS WR ������ KU
��� KU�� KU��� KU���� KU������ KU
Click the image to view the Interactive Graph
of 2024-T861 (T86) aluminum alloy sheet.
of 2024-T861 (T86) aluminum alloy sheet.
Figure 3.2.3.5.1(a). Effect of temperature on the tensile ultimate strength (Ftu)
Figure 3.2.3.5.1(b). Effect of temperature on the tensile yield strength (Fty)
Click the image to view the Interactive Graph
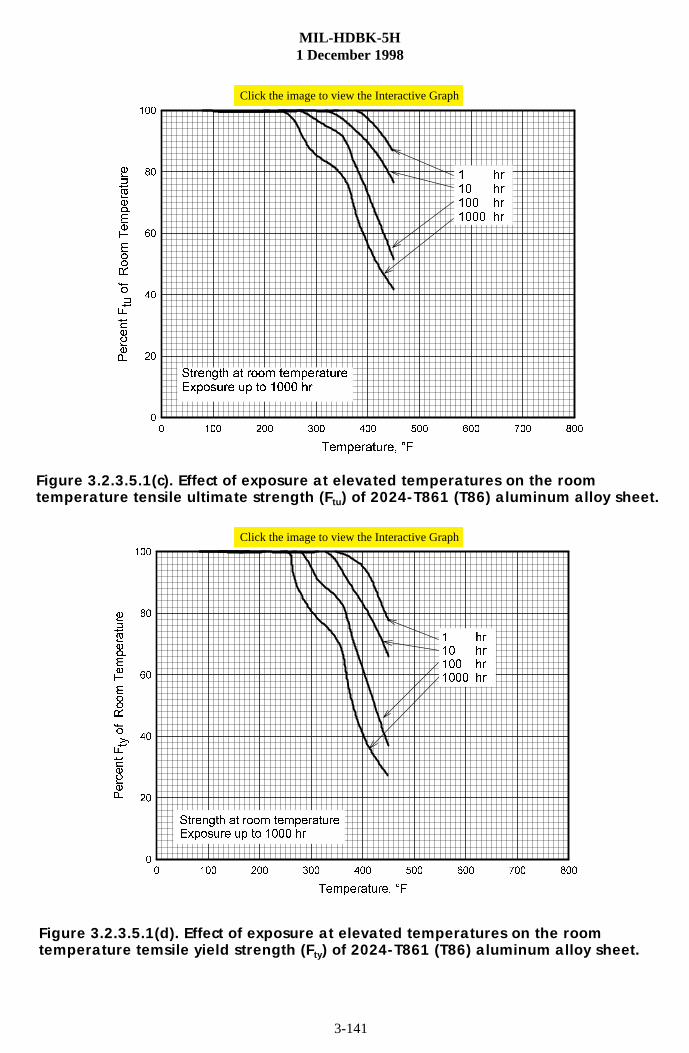
MIL-HDBK-5H1 December 1998
3-141
7HPSHUDWXUH� �)
� ��� ��� ��� ��� ��� ��� ��� ���
3HUFHQW)WX
RI5RRP
7HPSHUDWXUH
�
��
��
��
��
���
� KU�� KU��� KU���� KU
6WUHQJWK DW URRP WHPSHUDWXUH([SRVXUH XS WR ���� KU
7HPSHUDWXUH� �)
� ��� ��� ��� ��� ��� ��� ��� ���
3HUFHQW)W\RI5RRP
7HPSHUDWXUH
�
��
��
��
��
���
� KU�� KU��� KU���� KU
6WUHQJWK DW URRP WHPSHUDWXUH([SRVXUH XS WR ���� KU
Click the image to view the Interactive Graph
Figure 3.2.3.5.1(c). Effect of exposure at elevated temperatures on the room
Figure 3.2.3.5.1(d). Effect of exposure at elevated temperatures on the room
temperature tensile ultimate strength (Ftu) of 2024-T861 (T86) aluminum alloy sheet.
temperature temsile yield strength (Fty) of 2024-T861 (T86) aluminum alloy sheet.
Click the image to view the Interactive Graph
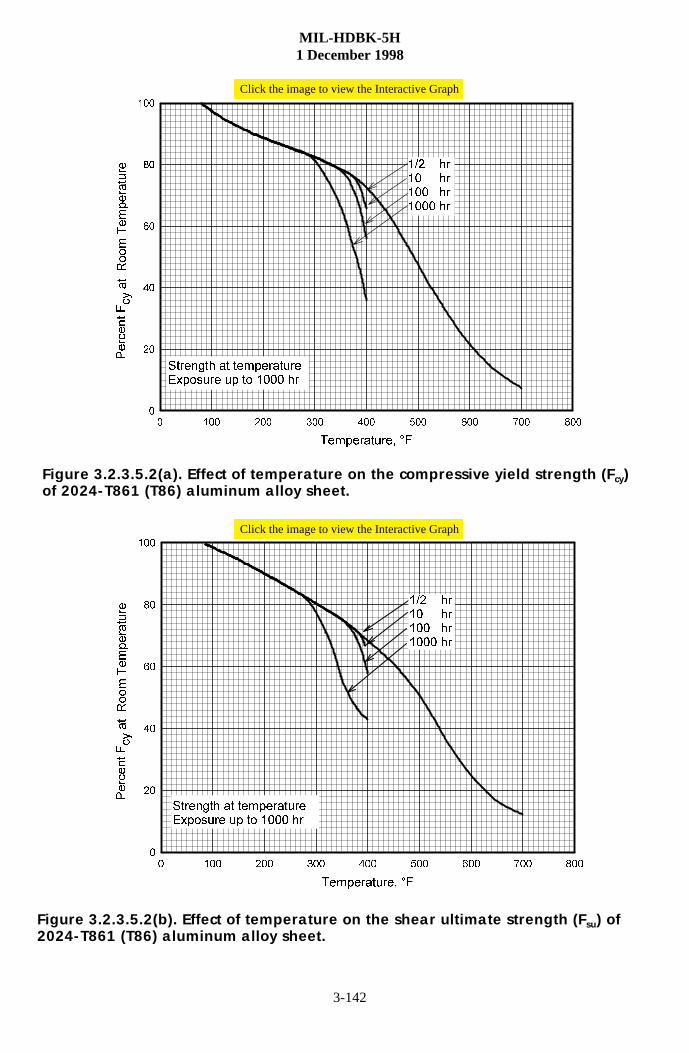
MIL-HDBK-5H1 December 1998
3-142
7HPSHUDWXUH� �)
� ��� ��� ��� ��� ��� ��� ��� ���
3HUFHQW)F\DW5RRP
7HPSHUDWXUH
�
��
��
��
��
���
��� KU�� KU��� KU���� KU
6WUHQJWK DW WHPSHUDWXUH([SRVXUH XS WR ���� KU
7HPSHUDWXUH� �)
� ��� ��� ��� ��� ��� ��� ��� ���
3HUFHQW)F\DW5RRP
7HPSHUDWXUH
�
��
��
��
��
���
��� KU�� KU��� KU���� KU
6WUHQJWK DW WHPSHUDWXUH([SRVXUH XS WR ���� KU
Click the image to view the Interactive Graph
of 2024-T861 (T86) aluminum alloy sheet.
2024-T861 (T86) aluminum alloy sheet.
Figure 3.2.3.5.2(a). Effect of temperature on the compressive yield strength (Fcy)
Figure 3.2.3.5.2(b). Effect of temperature on the shear ultimate strength (Fsu) of
Click the image to view the Interactive Graph
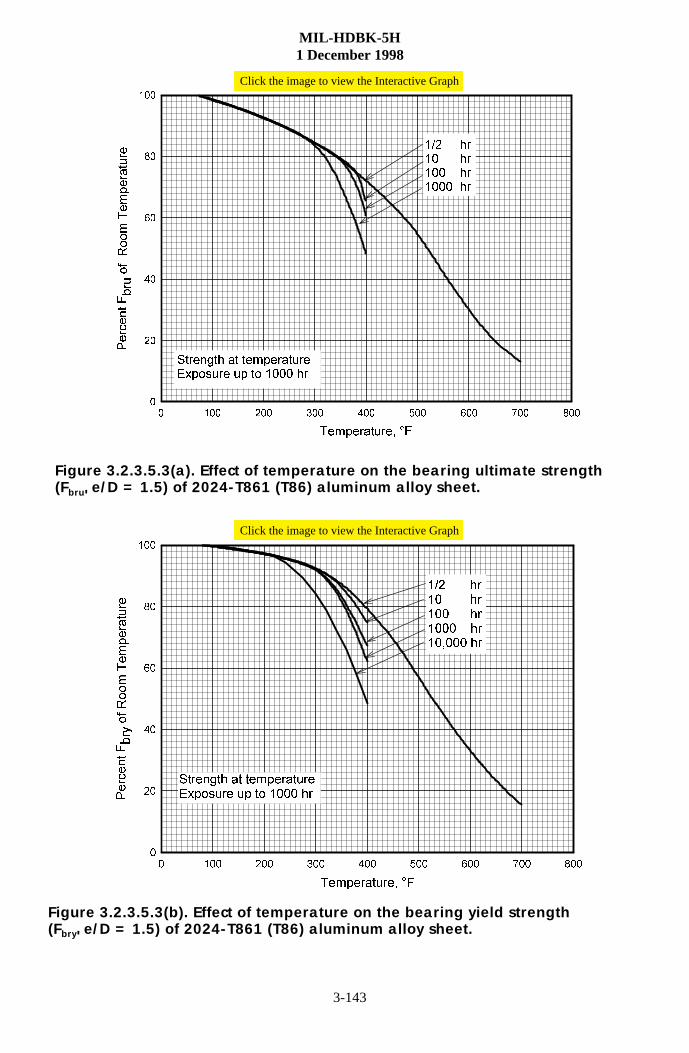
MIL-HDBK-5H1 December 1998
3-143
7HPSHUDWXUH� �)
� ��� ��� ��� ��� ��� ��� ��� ���
3HUFHQW)EUX
RI5RRP
7HPSHUDWXUH
�
��
��
��
��
���
6WUHQJWK DW WHPSHUDWXUH([SRVXUH XS WR ���� KU
��� KU�� KU��� KU���� KU
7HPSHUDWXUH� �)
� ��� ��� ��� ��� ��� ��� ��� ���
3HUFHQW)EU\RI5RRP
7HPSHUDWXUH
�
��
��
��
��
���
��� KU�� KU��� KU���� KU������ KU
6WUHQJWK DW WHPSHUDWXUH([SRVXUH XS WR ���� KU
Click the image to view the Interactive Graph
Figure 3.2.3.5.3(a). Effect of temperature on the bearing ultimate strength (Fbru' e/D = 1.5) of 2024-T861 (T86) aluminum alloy sheet.
Figure 3.2.3.5.3(b). Effect of temperature on the bearing yield strength (Fbry' e/D = 1.5) of 2024-T861 (T86) aluminum alloy sheet.
Click the image to view the Interactive Graph
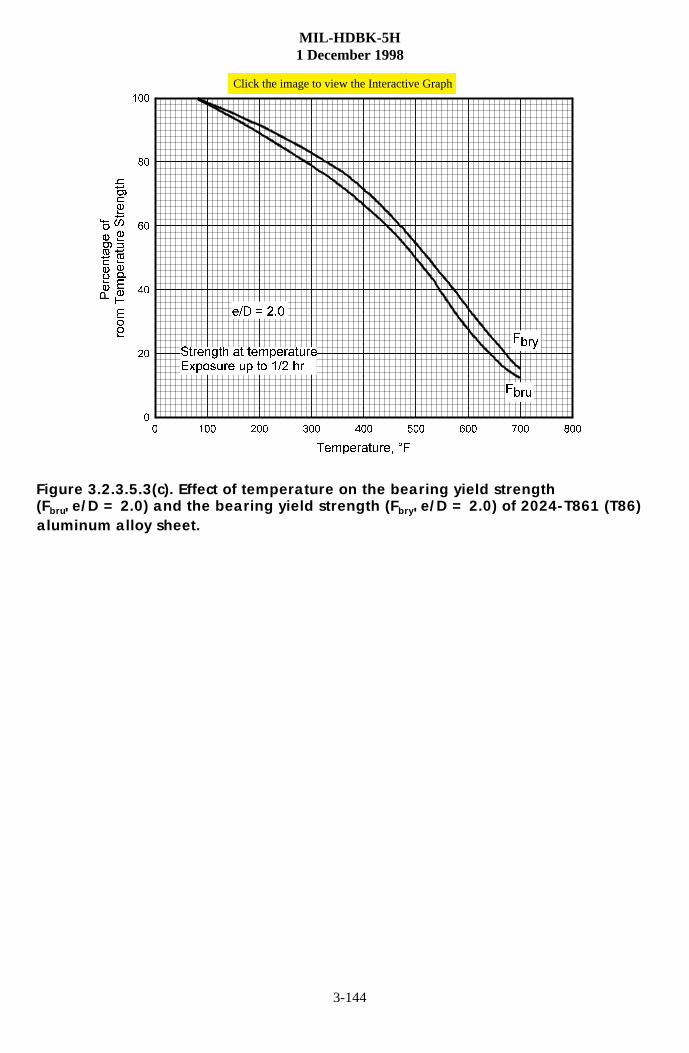
MIL-HDBK-5H1 December 1998
3-144
7HPSHUDWXUH� �)
� ��� ��� ��� ��� ��� ��� ��� ���
3HUFHQWDJHRI
URRP
7HPSHUDWXUH
6WUHQJWK
�
��
��
��
��
���
H�' ���
)EU\
)EUX
6WUHQJWK DW WHPSHUDWXUH([SRVXUH XS WR ��� KU
Click the image to view the Interactive Graph
Figure 3.2.3.5.3(c). Effect of temperature on the bearing yield strength (Fbru'aluminum alloy sheet.
e/D = 2.0) and the bearing yield strength (Fbry' e/D = 2.0) of 2024-T861 (T86)
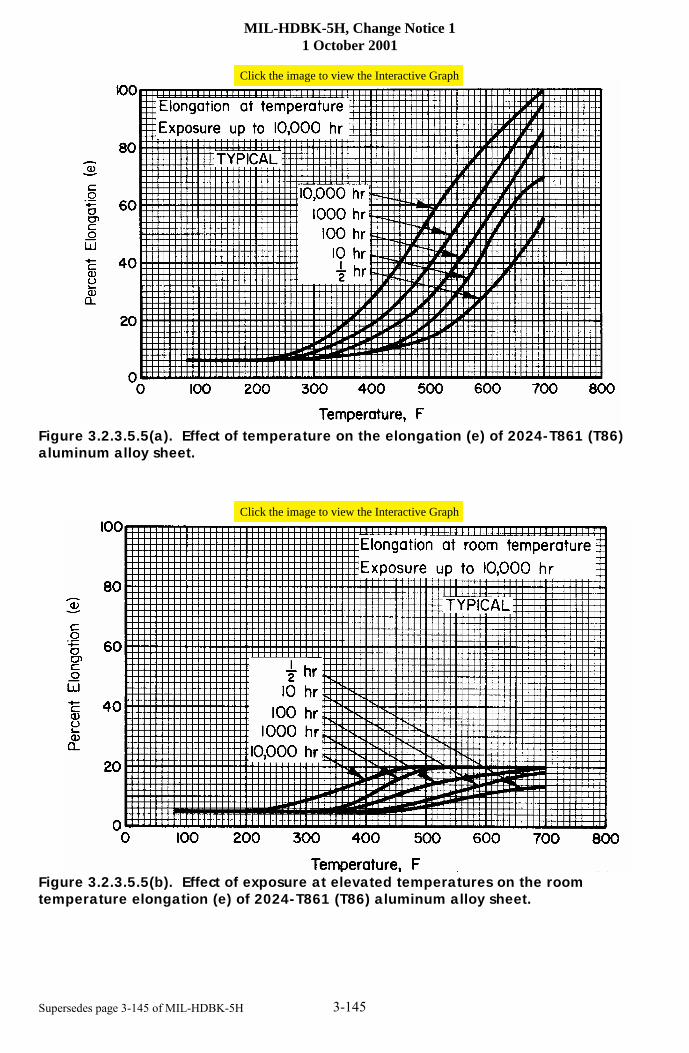
MIL-HDBK-5H, Change Notice 11 October 2001
3-145Supersedes page 3-145 of MIL-HDBK-5H
Figure 3.2.3.5.5(a). Effect of temperature on the elongation (e) of 2024-T861 (T86)aluminum alloy sheet.
Figure 3.2.3.5.5(b). Effect of exposure at elevated temperatures on the roomtemperature elongation (e) of 2024-T861 (T86) aluminum alloy sheet.
Click the image to view the Interactive Graph
Click the image to view the Interactive Graph
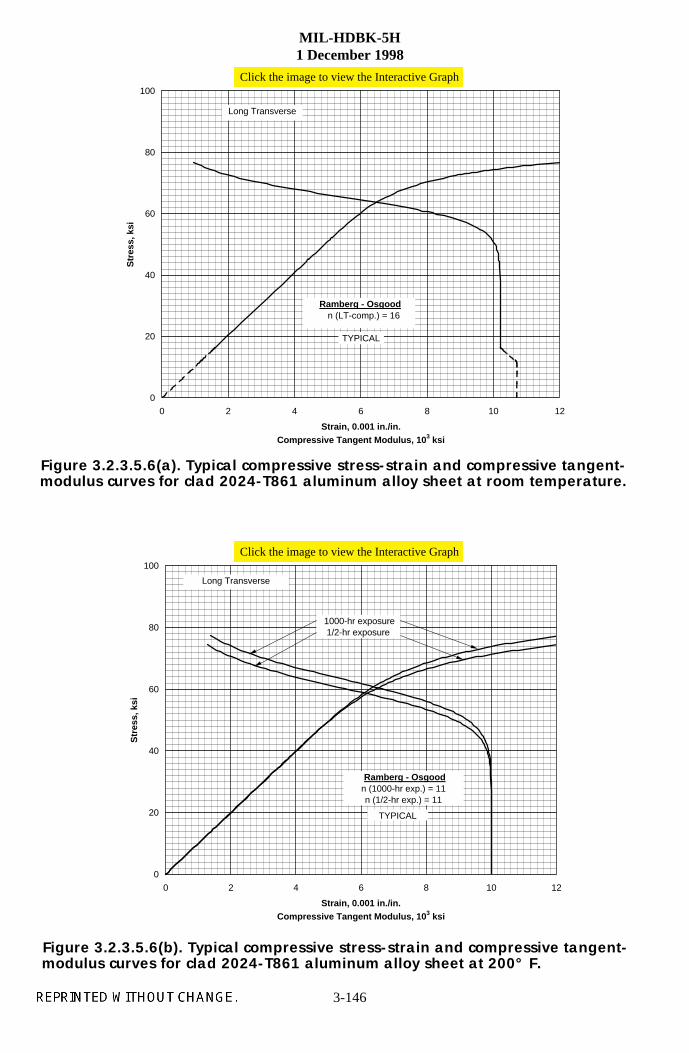
MIL-HDBK-5H1 December 1998
3-146
0
20
40
60
80
100
0 2 4 6 8 10 12
Strain, 0.001 in./in. Compressive Tangent Modulus, 10 3 ksi
Str
ess,
ksi
Ramberg - Osgood n (LT-comp.) = 16
Long Transverse
TYPICAL
0
20
40
60
80
100
0 2 4 6 8 10 12
Strain, 0.001 in./in.Compressive Tangent Modulus, 10 3 ksi
Str
ess,
ksi
Ramberg - Osgoodn (1000-hr exp.) = 11n (1/2-hr exp.) = 11
Long Transverse
1000-hr exposure1/2-hr exposure
TYPICAL
Click the image to view the Interactive Graph
Figure 3.2.3.5.6(a). Typical compressive stress-strain and compressive tangent-modulus curves for clad 2024-T861 aluminum alloy sheet at room temperature.
Figure 3.2.3.5.6(b). Typical compressive stress-strain and compressive tangent-modulus curves for clad 2024-T861 aluminum alloy sheet at 200° F.
Click the image to view the Interactive Graph
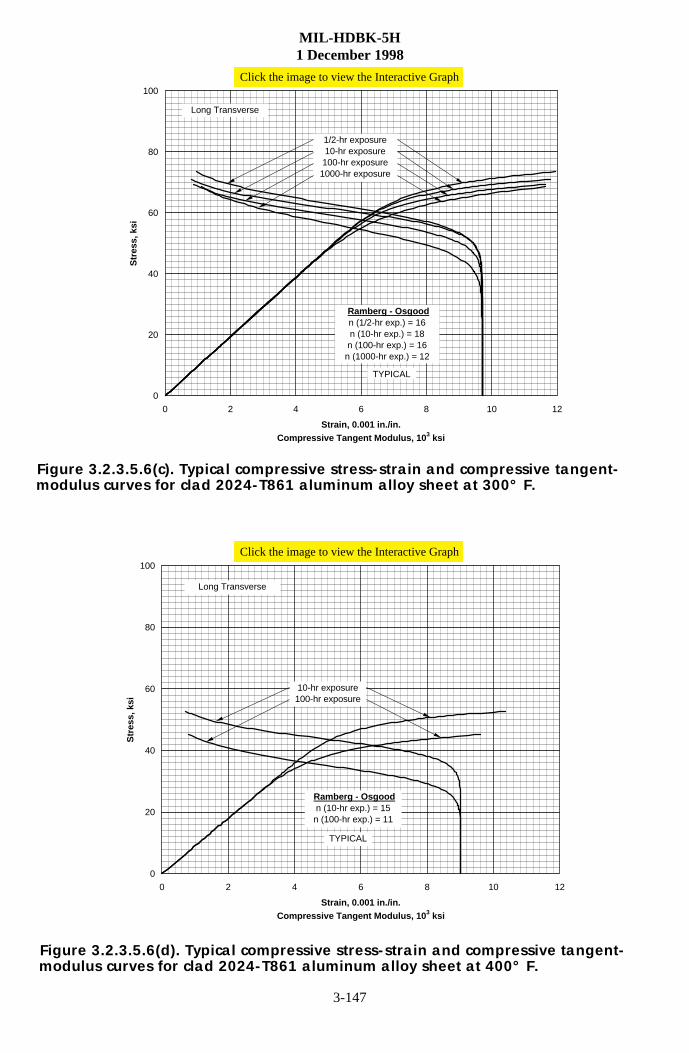
MIL-HDBK-5H1 December 1998
3-147
0
20
40
60
80
100
0 2 4 6 8 10 12
Strain, 0.001 in./in.Compressive Tangent Modulus, 10 3 ksi
Str
ess,
ksi
Ramberg - Osgoodn (1/2-hr exp.) = 16n (10-hr exp.) = 18n (100-hr exp.) = 16n (1000-hr exp.) = 12
Long Transverse
1/2-hr exposure10-hr exposure100-hr exposure1000-hr exposure
TYPICAL
0
20
40
60
80
100
0 2 4 6 8 10 12
Strain, 0.001 in./in.Compressive Tangent Modulus, 10 3 ksi
Str
ess,
ksi
Ramberg - Osgoodn (10-hr exp.) = 15n (100-hr exp.) = 11
Long Transverse
10-hr exposure100-hr exposure
TYPICAL
Click the image to view the Interactive Graph
Figure 3.2.3.5.6(c). Typical compressive stress-strain and compressive tangent-modulus curves for clad 2024-T861 aluminum alloy sheet at 300° F.
Figure 3.2.3.5.6(d). Typical compressive stress-strain and compressive tangent-modulus curves for clad 2024-T861 aluminum alloy sheet at 400° F.
Click the image to view the Interactive Graph
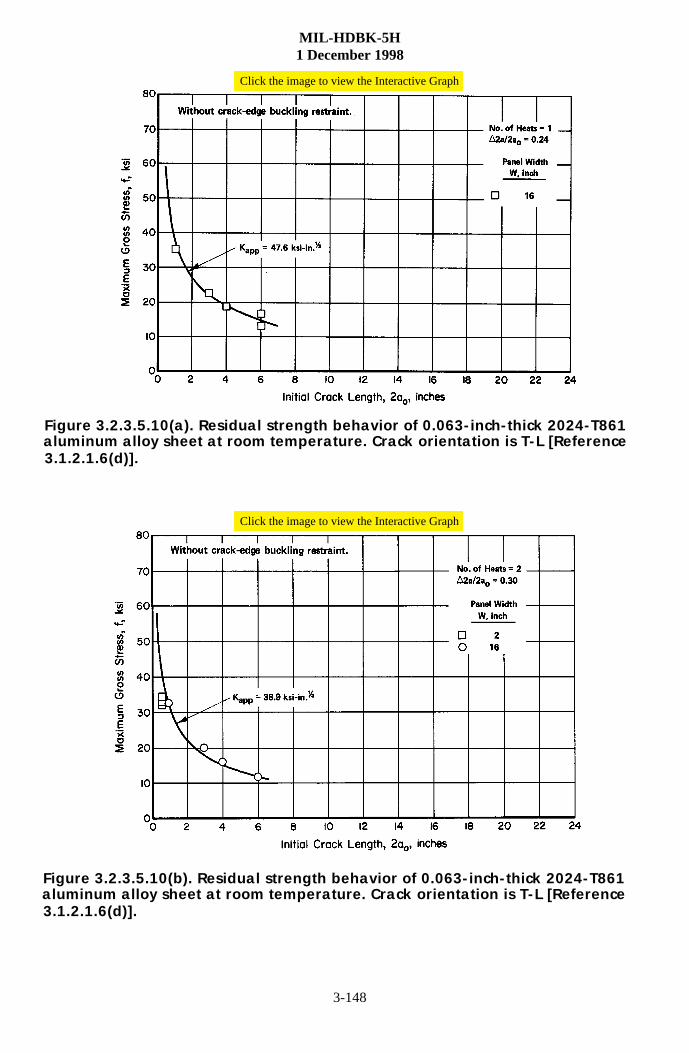
MIL-HDBK-5H1 December 1998
3-148
Click the image to view the Interactive Graph
Figure 3.2.3.5.10(a). Residual strength behavior of 0.063-inch-thick 2024-T861aluminum alloy sheet at room temperature. Crack orientation is T-L [Reference3.1.2.1.6(d)].
Figure 3.2.3.5.10(b). Residual strength behavior of 0.063-inch-thick 2024-T861aluminum alloy sheet at room temperature. Crack orientation is T-L [Reference3.1.2.1.6(d)].
Click the image to view the Interactive Graph