Embed Size (px)
Citation preview
Chapter 3 One Variable Statistics Chapter 3 Prerequisite Skills Chapter 3 Prerequisite Skills Question 1 Page 100 a) 1, 4, 4, 5, 5, 7, 8, 9, 9, 11, 15, 19 b) 1, 1, 2, 2, 3, 3, 3, 4, 5, 5, 6, 6, 7, 9, 11, 12 c) –11, –5, –3, –3, 0, 1, 1, 4, 5, 5, 7, 8, 12
d) 3 1 1 5, , ,
16 4 2 8
(Check this order by converting each fraction to a decimal: 0.1875, 0.25, 0.5, 0.625) Chapter 3 Prerequisite Skills Question 2 Page 100
a) 17.416
247 =& b) 5.108
84 =
c) 71.707
495 =& d) 6.595
298 =
e) 35.48
8.34 =
Chapter 3 Prerequisite Skills Question 3 Page 100 a) 11121 = b) 86.67.4 =& c) 52516943 22 ==+=+ d) 74.314941321 222 ===+=++ & Chapter 3 Prerequisite Skills Question 4 Page 100 a) bar graph b) hockey c) curling d) Answers may vary. For example: No; 2 people like curling, so it is popular among some people.
98 MHR • Foundations for College Mathematics 11 Solutions
Chapter 3 Prerequisite Skills Question 5 Page 100 a) entertainment b) 17% of $1220 = 0.17 × $1220 = $207.40 Chapter 3 Prerequisite Skills Question 6 Page 101 a) broken line graph b) about 18° c) about 30°; the temperature has been increasing at a rate of about 2° per week. d) Answers may vary. For example: whether the temperature continues to increase, decrease, or stay the same Chapter 3 Prerequisite Skills Question 7 Page 101 a) histogram b) The bars have heights of 1, 3, 6, 11, 9, and 4.
The sum of these numbers is 34. There are 34 students in the club.
MHR • Foundations for College Mathematics 11 Solutions 99
Chapter 3 Section 1 Sampling Techniques Chapter 3 Section 1 Question 1 Page 106 convenience sampling Chapter 3 Section 1 Question 2 Page 106 a) a combination of stratified random sampling and systematic sampling b) Answers may vary. For example:
probably yes c) Answers may vary. For example:
Mr. Rush could add a step before numbering the students, by asking the students in each group to place themselves in order of soccer ability.
Chapter 3 Section 1 Question 3 Page 106 a) Answers may vary. For example: voluntary-response sampling b) Answers may vary. For example: stratified random sampling c) Answers may vary. For example: stratified random sampling d) Answers may vary. For example: voluntary response sampling or convenience sampling Chapter 3 Section 1 Question 4 Page 107 a) sample: teenagers at local library; population: all students at Zoe’s school b) sample: Enrica and her friends; population: all “Canadian Idol” viewers c) sample: surveyed stores in a popular drug store chain; population: all toothpaste sellers d) sample: people who pass Tony; population: all voters e) sample: people at the gym on Wednesday night; population: all members of Angelo’s gym f) sample: students in Maya’s science class; population: all students in Maya’s grade
100 MHR • Foundations for College Mathematics 11 Solutions
Chapter 3 Section 1 Question 5 Page 107 a) Answers may vary. For example:
Those who do not respond or those the government does not know about, such as some homeless people.
b) Answers may vary. For example:
No sampling technique is used, since the government includes all Canadians in the survey. The representative sample is the population. Because the representative sample is so large, it costs too much money and takes too much time to be carried out every year
c) Answers may vary. For example:
Yes, since the remaining 3% of the population would probably respond similarly to the 97% that were surveyed.
Chapter 3 Section 1 Question 6 Page 107 Answers may vary. For example: Probably not; it could be a coincidence. Chapter 3 Section 1 Question 7 Page 108 a) all Ontario high school graduates b) Answers may vary. For example:
It would be too expensive and time-consuming to survey them all. c) Telephone high schools to obtain their graduates’ contact information. d) Answers may vary. For example:
cluster sampling; survey every graduate from a few randomly-selected schools. Chapter 3 Section 1 Question 8 Page 108 a) simple random sampling b) Answers may vary. For example:
No; the number of defective bolts might be changing. c) Answers may vary. For example:
He could specify exactly how each bolt is defective or track which machines or operators are responsible for defective bolts.
Chapter 3 Section 1 Question 9 Page 108 a) Answers may vary. For example:
Yes; about 10% of each grade is surveyed. b) Answers may vary. For example:
Yes; each grade gets a fair representation.
MHR • Foundations for College Mathematics 11 Solutions 101
Chapter 3 Section 1 Question 10 Page 109 Solutions for Achievement Checks are in the Teacher Resource. Chapter 3 Section 1 Question 11 Page 109 a) Simple random sampling; the vehicles are chosen randomly. b) Answers may vary. c) Answers may vary. For example:
Very unlikely; there are many possible times between 2 P.M. and midnight, and only a 1 in 20 chance that the same gate would be chosen.
Chapter 3 Section 1 Question 12 Page 109 a) sample: selected students at the two schools; population: all elementary school students in the
school district b) 20 ( ) in grade 4, 25 ( 0.0.20 100× 25 100× ) in grade 5, 30 ( 0.30 100× ) in grade 6, and 25
( ) in grade 7 0.25 100×
c) This school needs 100 students from its 500 students. Choose 15
of the students in each grade:
20 in grade 4, 20 in grade 5, 30 in grade 6, and 30 in grade 7 d) Answers may vary. For example:
Use a random number generator after numbering all the students in each grade.
102 MHR • Foundations for College Mathematics 11 Solutions
Chapter 3 Section 2 Collect and Analyse Data Chapter 3 Section 2 Question 1 Page 114 a) Dharma’s observations are primary data because she collected information for herself. The
cafeteria staff’s observations are secondary data because they collected the information for Dharma.
b) Answers may vary. For example:
Both should be accurate. Chapter 3 Section 2 Question 2 Page 114 a) combined voluntary-response sampling and systematic random sampling b) Answers may vary. For example:
No; those who returned the survey are probably likeminded people. c) Answers may vary. d) Answers may vary. For example:
Maybe; since the 56% of people responded, it is likely that he will be able to gather reliable information from the survey.
Chapter 3 Section 2 Question 3 Page 114 a) Answers may vary. For example:
response bias; only asking football fans and worrying them about relocation; change question to: Should the provincial and federal governments help build a new stadium?
and ask people outside the game. b) Answers may vary. For example:
non-response bias; only the most opinionated people will call in; possible correction: offer an entry in a contest for a calling as an incentive. c) Answers may vary. For example:
non-response bias; only the most opinionated people will return the survey; possible correction: offer some incentive for the less opinionated to return the survey, such as an entry in a contest.
d) Answers may vary. For example:
response bias; the question is clearly biased against the development of the subdivision by referencing the closure of the mall for mall shoppers and the increase in traffic congestion; change question to: Are you for or against the decision made by a developer to close this mall in order to build a subdivision?
Chapter 3 Section 2 Question 4 Page 115 a) measurement bias b) Have the question in only one type size and alphabetize the options.
MHR • Foundations for College Mathematics 11 Solutions 103
Chapter 3 Section 2 Question 5 Page 115 Answers may vary. For example: How do you think the $2000 raised in the last fundraiser should be spent? Randomly select a representative sample from each grade. Chapter 3 Section 2 Question 6 Page 115 Answers may vary. Chapter 3 Section 2 Question 7 Page 115 a) Yes; more people in favour could have called in because they were losing and fewer people
opposed could have called in because they were winning. b) Call in myself and also ask others in favour to vote too. Chapter 3 Section 2 Question 8 Page 115 Answers may vary. For example: Probably; since pilots have nothing to gain or lose by deliberately reporting negatively or positively about air traffic controllers. Chapter 3 Section 2 Question 9 Page 116 a) Answers may vary. For example:
primary: ask students at your school at random; secondary: ask each of your friends to ask 10 people the question and then report their responses to you.
b) Answers may vary. For example:
Primary data is more reliable since it is difficult to know whether your friends asked the question without any bias.
Chapter 3 Section 2 Question 10 Page 116 a) Answers may vary. For example:
They want to get honest data. b) Answers may vary. For example:
No; Spyware reflects the sample accurately unless someone can block it. c) Answers may vary. For example:
telephone-tapping, intercepting e-mails, stealing mail, searching garbage, and inappropriate use of medical or banking records
Chapter 3 Section 2 Question 11 Page 116 Answers may vary. For example: It is very vague and might draw a wide range of answers.
104 MHR • Foundations for College Mathematics 11 Solutions
Chapter 3 Section 2 Question 12 Page 116 a) Terence: primary data; Linda: secondary data b) Answers may vary. For example:
Terence: the list is objective and comes from a very large sample; because radio listeners enjoyed certain songs does not mean that students at his school will enjoy the same playlist. Linda: the list reflects the music preferences of students in the school; responses might be rushed.
c) Answers may vary. For example:
Find a way to combine their data. Chapter 3 Section 2 Question 13 Page 117 a) Yes, all four preferred Proteeth. b) Answers may vary. For example:
They knew that dentists would prefer a toothpaste that fights cavities, gingivitis, and plaque, so they would prefer Proteeth.
c) Answers may vary. For example:
Give the dentists several brands of toothpaste that fight cavities, gingivitis, and plaque. Also survey more than four dentists.
Chapter 3 Section 2 Question 14 Page 117 Solutions for Achievement Checks are in the Teacher Resource. Chapter 3 Section 2 Question 15 Page 117 Answers may vary. Chapter 3 Section 2 Question 16 Page 117 Answers may vary.
MHR • Foundations for College Mathematics 11 Solutions 105
Chapter 3 Section 3 Display Data Chapter 3 Section 3 Question 1 Page 125
a) discrete b) continuous c) continuous d) discrete
Chapter 3 Section 3 Question 2 Page 125 a) Answers may vary. For example:
Bar graph, since the data is discrete and values are wanted for comparison. b) Answers may vary. For example:
Histogram, since the data is continuous. c) Answers may vary. For example:
Circle graph, since the data is discrete and part of a total amount. d) Answers may vary. For example:
Bar graph, since the data is discrete and values are wanted for comparison. e) Answers may vary. For example:
Histogram, since the data is continuous. f) Answers may vary. For example:
Circle graph, since the data is discrete and part of a total amount. Chapter 3 Section 3 Question 3 Page 126 a) Answers may vary. For example:
No, since the data is continuous. b) Yes, though the information about the cities would be gone. Instead, the histogram would
display the frequency of each amount of snow in those five cities. Chapter 3 Section 3 Question 4 Page 126 The line graph shows continuous data since the data points are joined by a continuous line; the circle graph shows discrete data.
106 MHR • Foundations for College Mathematics 11 Solutions
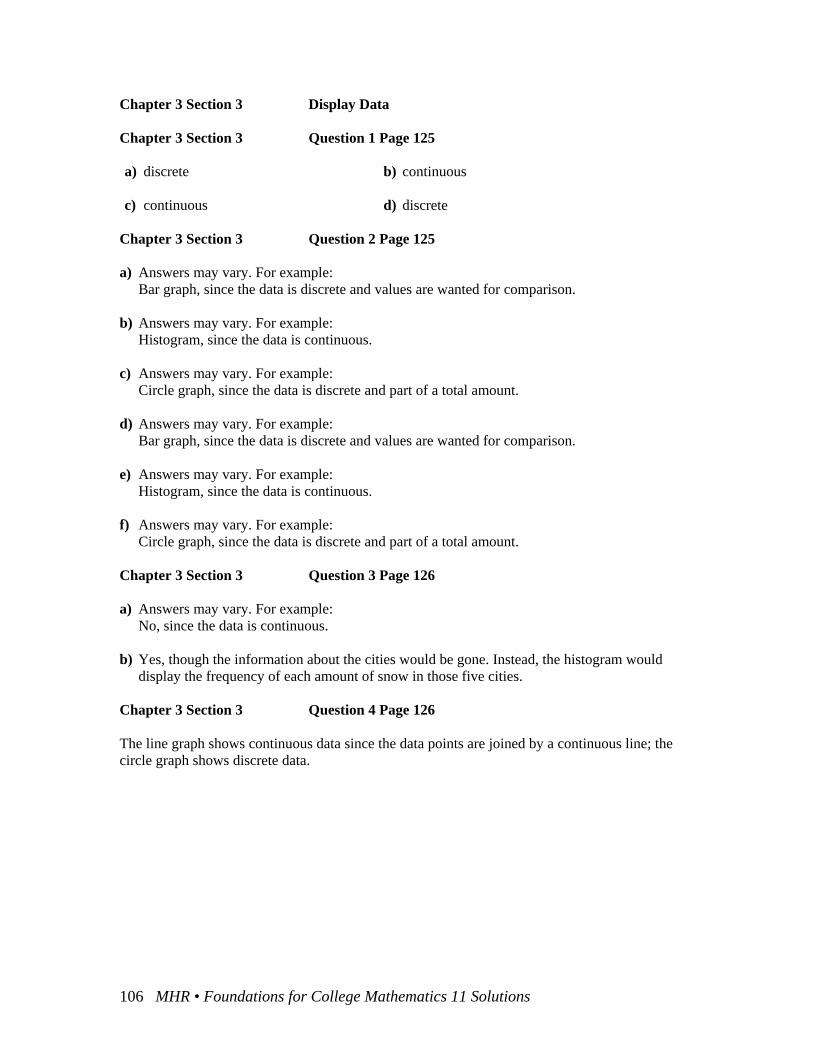
Chapter 3 Section 3 Question 5 Page 127 a)
Score Interval Tally Frequency [30, 40) || 2 [40, 50) | 1 [50, 60) ||| 3 [60, 70) |||| 5 [70, 80) |||| || 7 [80, 90) |||| 5 [90, 100] | 1
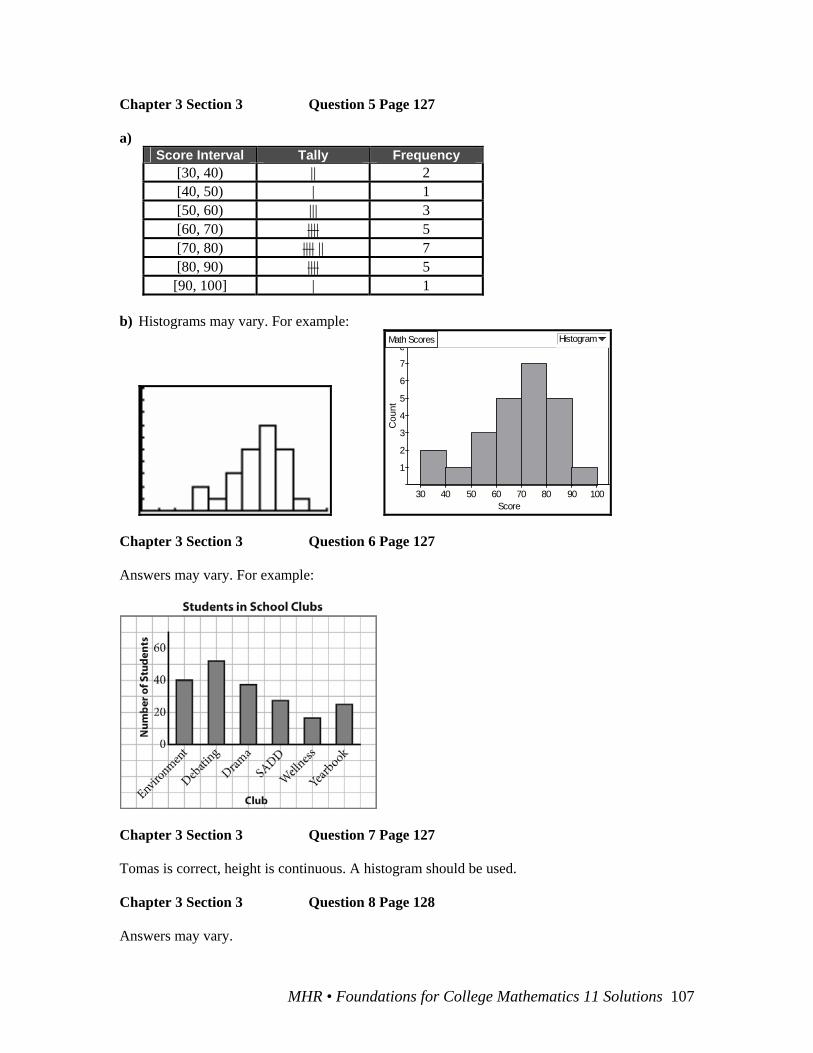
b) Histograms may vary. For example:
Cou
nt
1
2
3
4
5
6
7
8
Score30 40 50 60 70 80 90 100
Math Scores Histogram
Chapter 3 Section 3 Question 6 Page 127 Answers may vary. For example:
Chapter 3 Section 3 Question 7 Page 127 Tomas is correct, height is continuous. A histogram should be used. Chapter 3 Section 3 Question 8 Page 128 Answers may vary.
MHR • Foundations for College Mathematics 11 Solutions 107
Chapter 3 Section 3 Question 9 Page 128 Answers may vary. For example: Good choice for bar graph: favourite ice-cream flavours. Inappropriate choice for bar graph: life-spans of a group of salmon tagged in the wild. Chapter 3 Section 3 Question 10 Page 128 Answers may vary. Chapter 3 Section 3 Question 11 Page 128 a) Answers may vary. For example:
Discrete; bar graph, since the data is discrete. b) Answers may vary. For example:
Discrete; bar graph, since the data is discrete. c) Answers may vary. For example:
Continuous; histogram, since the data is continuous. d) Answers may vary. For example:
Discrete; bar graph, since the data is discrete. e) Answers may vary. For example:
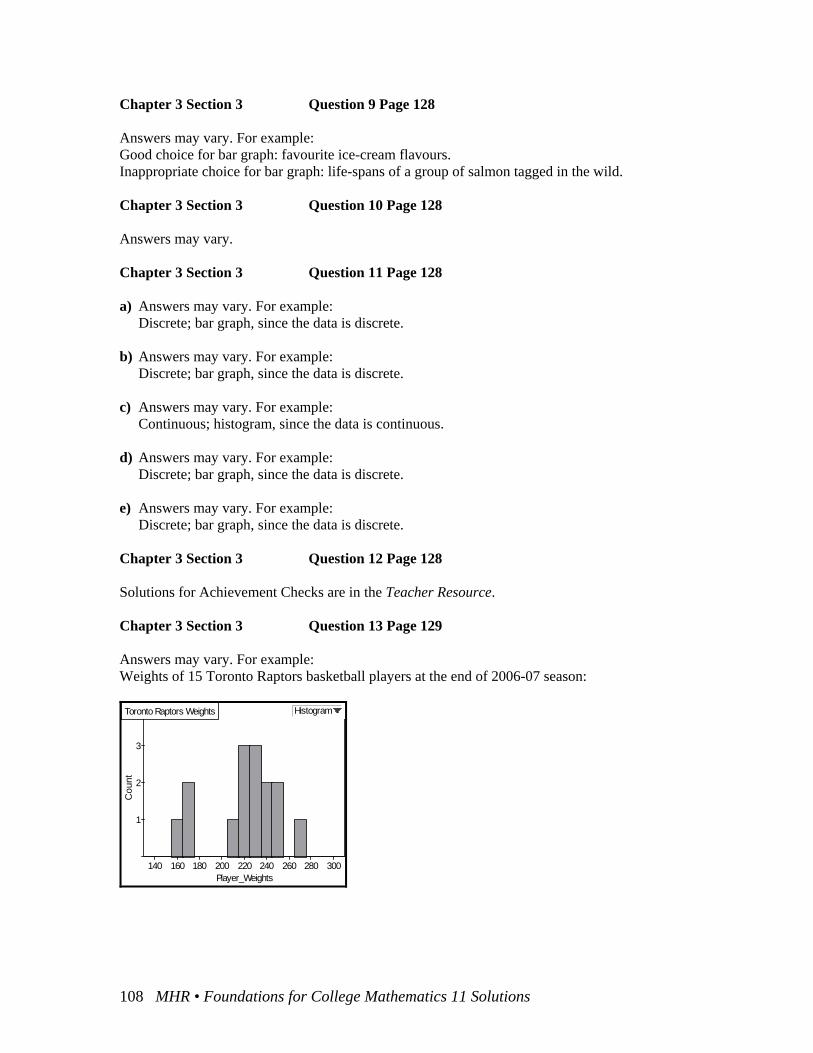
Discrete; bar graph, since the data is discrete. Chapter 3 Section 3 Question 12 Page 128 Solutions for Achievement Checks are in the Teacher Resource. Chapter 3 Section 3 Question 13 Page 129 Answers may vary. For example: Weights of 15 Toronto Raptors basketball players at the end of 2006-07 season:
Cou
nt
1
2
3
Player_Weights140 160 180 200 220 240 260 280 300
Toronto Raptors Weights Histogram
108 MHR • Foundations for College Mathematics 11 Solutions
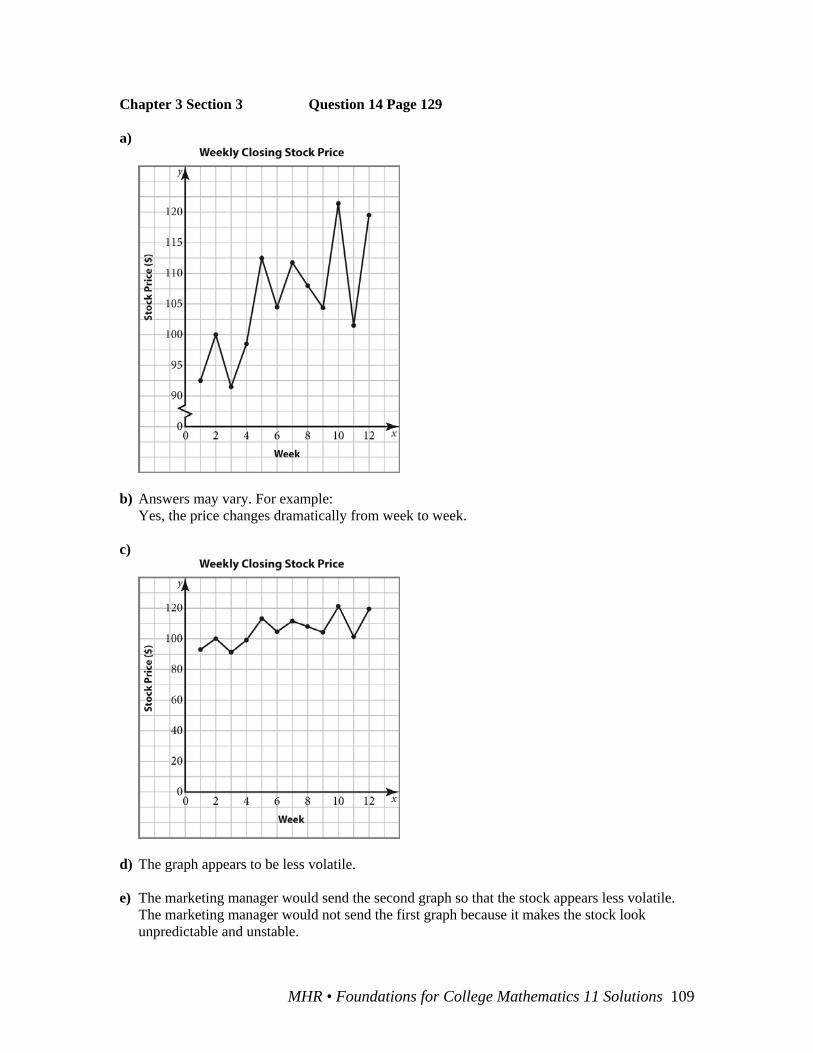
Chapter 3 Section 3 Question 14 Page 129 a)
b) Answers may vary. For example:
Yes, the price changes dramatically from week to week. c)
d) The graph appears to be less volatile. e) The marketing manager would send the second graph so that the stock appears less volatile.
The marketing manager would not send the first graph because it makes the stock look unpredictable and unstable.
MHR • Foundations for College Mathematics 11 Solutions 109
Chapter 3 Section 4 Measures of Central Tendency Chapter 3 Section 4 Question 1 Page 136 a)
3.299
2649
162138443229382125 valuesofnumber valuesall of sum Mean
=
=
++++++++=
=
&
Order numbers from least to greatest: 16, 21, 21, 25, 29, 32, 38, 38, 44
The 5th number is the median. The median is 29. There are two numbers that occur twice: 21 and 38 There are two modes: 21 and 38
b) Mean 44 36 82 53 71 74 38 81 94 58 631 63.110 10
+ + + + + + + + += = =
From least to greatest: 36, 38, 44, 53, 58, 71, 74, 81, 82, 94
There are 2 middle numbers, 58 and 71.
Median 58 712 129 64.52 2+
= = =
Each number occurs only once. There is no mode.
Chapter 3 Section 4 Question 2 Page 136
sum of all valuesMeannumber of values100 100 50 50 50 50 10 10 10 10 10 10 10 10 10 10
1650016
31.25
=
+ + + + + + + + + + + + + + +=
=
=
The mean prize is $31.25. From least to greatest: 10, 10, 10, 10, 10, 10, 10, 10, 10, 10, 50, 50, 50, 50, 100, 100
Median 10 10 20 102 2+
= = =
The median prize is $10. The prize $10 occurs most often (10 times). The mode prize is $10.
110 MHR • Foundations for College Mathematics 11 Solutions
Chapter 3 Section 4 Question 3 Page 136 a)
2.38212
458612
345427383540285520410622310197333214 valuesofnumber valuesall of sum Mean
=
=
+++++++++++=
=
&
The mean wage is 382.2. From least to greatest:
197, 214, 285, 310, 333, 345, 383, 410, 427, 520, 540, 622
The median is the mean of the middle values 345 and 383.
Median 345 383 728 3642 2+
= = =
The median wage is 364. Each wage occurs only once.
There is no mode. Either the mean or the median can best describe the data since they are close in value. b)
sum of all valuesMeannumber of values87 461 611 260 466 581 433 546 348 450 437 540 290 296 251
15605715
403.8
=
+ + + + + + + + + + + + + +=
=
=
The mean number of at-bats is 403.8. From least to greatest:
87, 251, 260, 290, 296, 348, 433, 437, 450, 461, 466, 540, 546, 581, 611
The median number of at-bats is 437. All numbers are different.
There is no mode number of at-bats. The median is a good choice for describing the data since there is an outlier (87) which will
affect the calculation of the mean.
MHR • Foundations for College Mathematics 11 Solutions 111
Chapter 3 Section 4 Question 4 Page 136 a) There are 43 students.
The median will be the 22nd student in the [170–175) category. The mode category is [165–170) since there are 12 students in that category. Range = 190 cm – 155 cm = 35 cm b) The median is the best measure of central tendency; most values are within 10 cm of it. Chapter 3 Section 4 Question 5 Page 137 Answers may vary. For example: shoe size in a shoe store Chapter 3 Section 4 Question 6 Page 137 Answers may vary. For example: The mean can get distorted by outliers, but not the median. Chapter 3 Section 4 Question 7 Page 137 a)
737266
37)11(1)10(3)9(2)8(8)7(11)6(6)5(6 Mean ==++++++= &
The mean shoe size is 7. There are 37 students. The 18th student has shoe size 7. The median shoe size is 7. The shoe size that occurs most often is size 7 (11 times). The mode shoe size is 7. b) The mode is easiest because it is the highest bar. c) The mode describes the most common shoe size.
112 MHR • Foundations for College Mathematics 11 Solutions
Chapter 3 Section 4 Question 8 Page 137
a) valuesofnumber valuesall of sum Mean =
3720
74020
4341423627433736394341374235413227443123
=
=
+++++++++++++++++++
The mean attendance is 37 000. From least to greatest:
23, 27, 27, 31, 32, 35, 36, 36, 37, 37, 39, 41, 41, 41, 42, 42, 43, 43, 43, 44
Median = 37 39 382+
=
The median attendance is 38 000. The numbers 41 and 43 each occurs three times.
There are 2 modes for attendance: 41 000 and 43 000. b) Answers may vary. For example:
The median or the mean can be used; they both describe the ‘middle’ attendance and there are no outliers.
c) Answers may vary. For example:
Weather, attractions, location, or the duration of the fair might vary from year to year.
MHR • Foundations for College Mathematics 11 Solutions 113
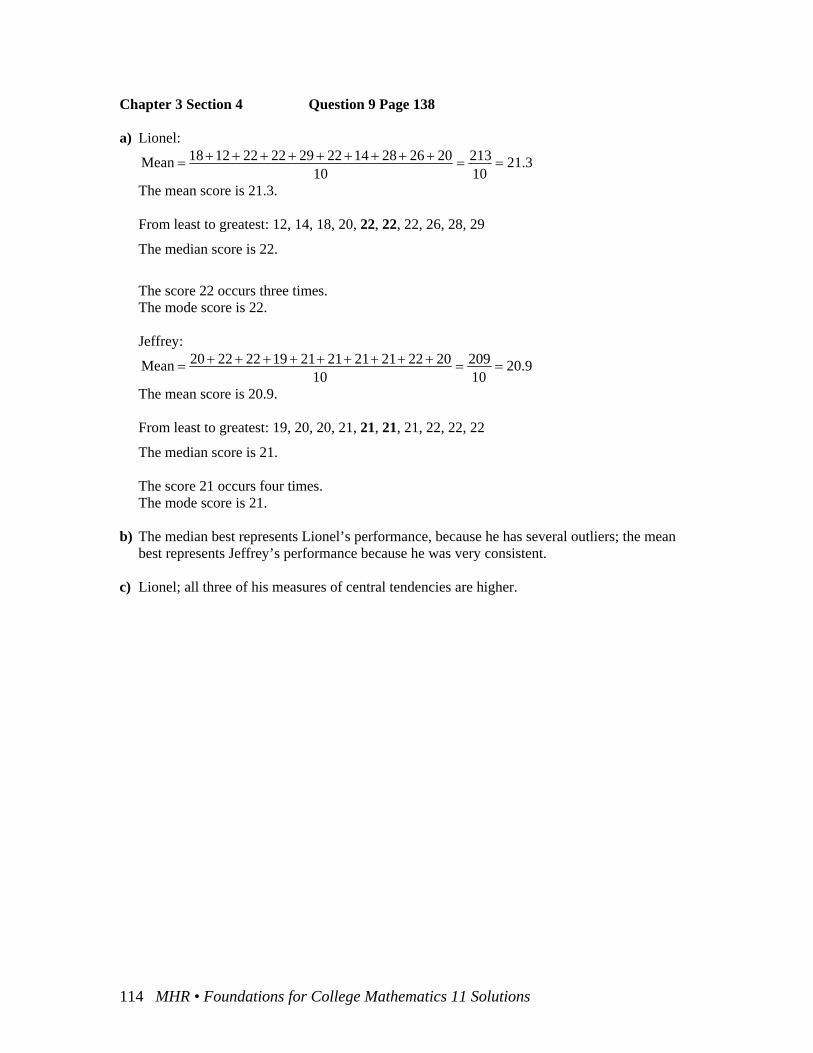
Chapter 3 Section 4 Question 9 Page 138 a) Lionel:
21.310213
1020262814222922221218 Mean ==+++++++++=
The mean score is 21.3. From least to greatest: 12, 14, 18, 20, 22, 22, 22, 26, 28, 29
The median score is 22.
The score 22 occurs three times. The mode score is 22. Jeffrey:
20.910209
1020222121212119222220 Mean ==+++++++++=
The mean score is 20.9. From least to greatest: 19, 20, 20, 21, 21, 21, 21, 22, 22, 22
The median score is 21. The score 21 occurs four times. The mode score is 21. b) The median best represents Lionel’s performance, because he has several outliers; the mean
best represents Jeffrey’s performance because he was very consistent. c) Lionel; all three of his measures of central tendencies are higher.
114 MHR • Foundations for College Mathematics 11 Solutions
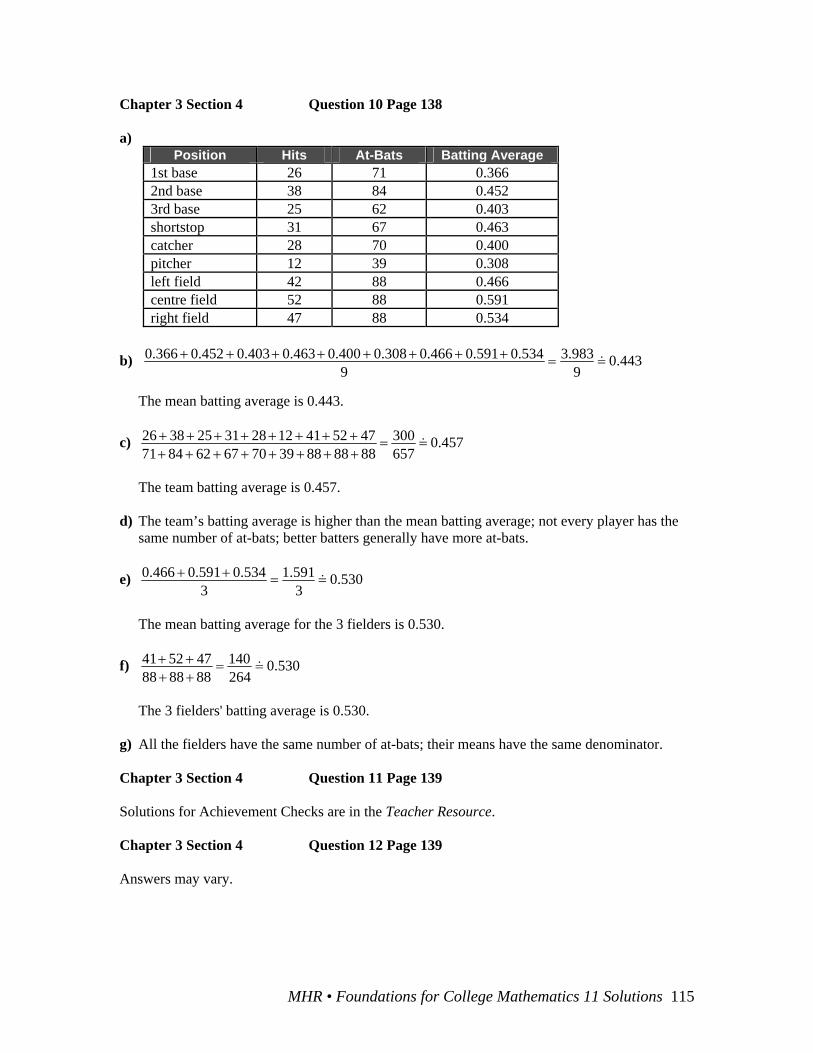
Chapter 3 Section 4 Question 10 Page 138 a)
Position Hits At-Bats Batting Average 1st base 26 71 0.366 2nd base 38 84 0.452 3rd base 25 62 0.403 shortstop 31 67 0.463 catcher 28 70 0.400 pitcher 12 39 0.308 left field 42 88 0.466 centre field 52 88 0.591 right field 47 88 0.534
b) 443.09
3.9839
0.5340.5910.4660.3080.4000.4630.4030.4520.366 ==++++++++ &
The mean batting average is 0.443.
c) 457.0657300
888888397067628471475241122831253826 ==
++++++++++++++++ &
The team batting average is 0.457. d) The team’s batting average is higher than the mean batting average; not every player has the
same number of at-bats; better batters generally have more at-bats.
e) 530.03
1.5913
0.5340.5910.466 ==++ &
The mean batting average for the 3 fielders is 0.530.
f) 530.0264140
888888475241 ==
++++ &
The 3 fielders' batting average is 0.530. g) All the fielders have the same number of at-bats; their means have the same denominator. Chapter 3 Section 4 Question 11 Page 139 Solutions for Achievement Checks are in the Teacher Resource. Chapter 3 Section 4 Question 12 Page 139 Answers may vary.
MHR • Foundations for College Mathematics 11 Solutions 115
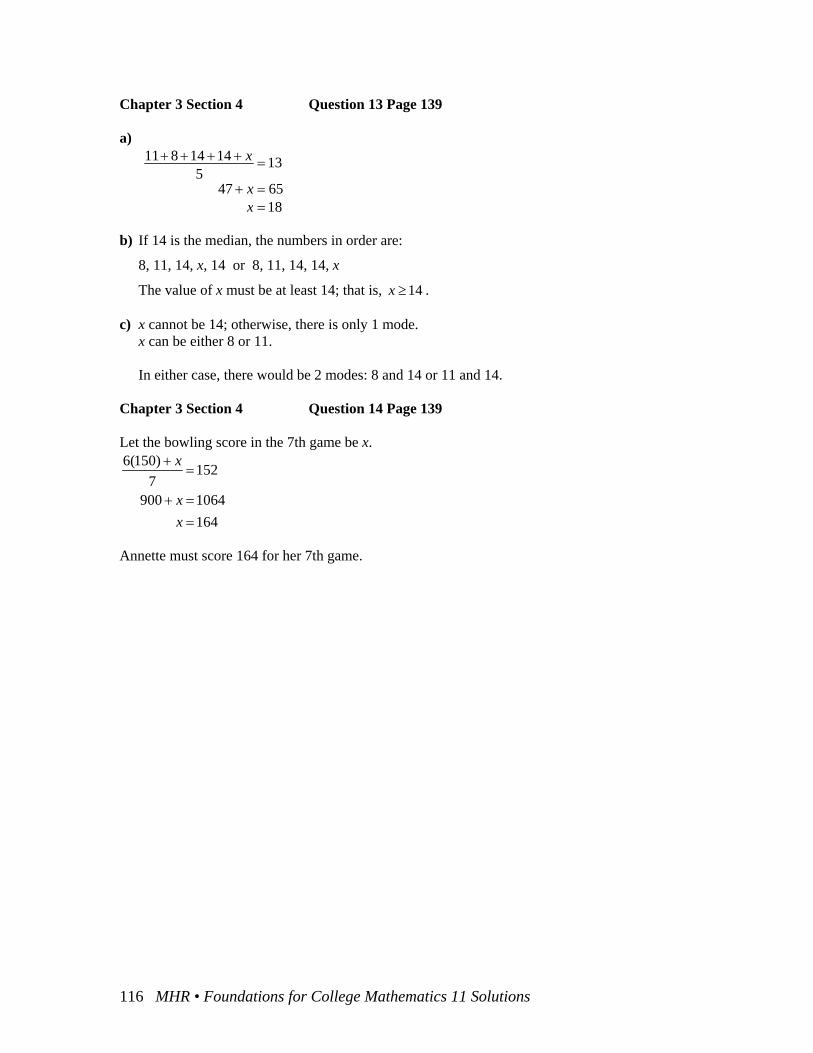
Chapter 3 Section 4 Question 13 Page 139 a)
186547
135
1414811
==+
=++++
xx
x
b) If 14 is the median, the numbers in order are:
8, 11, 14, x, 14 or 8, 11, 14, 14, x
The value of x must be at least 14; that is, . 14x ≥ c) x cannot be 14; otherwise, there is only 1 mode. x can be either 8 or 11. In either case, there would be 2 modes: 8 and 14 or 11 and 14. Chapter 3 Section 4 Question 14 Page 139 Let the bowling score in the 7th game be x. 6(150) 152
7900 1064
164
x
xx
+=
+ ==
Annette must score 164 for her 7th game.
116 MHR • Foundations for College Mathematics 11 Solutions
Chapter 3 Section 5 Measures of Spread Chapter 3 Section 5 Question 1 Page 145 a) Order the data:
59, 79, 80, 84, 88, 99, 104, 107, 109, 111, 112, 113, 114, 119, 122, 122, 127, 128, 131, 131, 133, 135, 139, 140, 142, 142, 144, 149, 152, 155, 158 (31 customers)
The median is the 16th datum, 122. b) The first quartile is the 8th datum, 107. The third quartile is the 24th datum, 140. c) 140 – 107 = 33; the interquartile range is 33. Chapter 3 Section 5 Question 2 Page 145 a) 55 – 4 = 51; the range is 51 hours. b) 125 – 95 = 30; the range is $30. c) 15 – 6 = 9; the range is 9 songs. d) 91 – 37 = 54; the range is 54 kg. Chapter 3 Section 5 Question 3 Page 145 22 + 30 = 52; the greatest value in the set of data is 52. Chapter 3 Section 5 Question 4 Page 145 116 – 14 = 102; the least value in the set of data is 102. Chapter 3 Section 5 Question 5 Page 146 a) 4.12154 = ; the standard deviation is 12.4 g. b) 636 = ; the standard deviation is 6 m. c) 9.880 = ; the standard deviation is 8.9 cm. d) 9.418 = ; the standard deviation is 4.9 L. Chapter 3 Section 5 Question 6 Page 146 a) 14.12 = 198.81; the variance is 198.81 cm. b) 3.52 = 12.25; the variance is 12.25 kg. c) 222 = 484; the variance is $484. d) 6.72 = 44.89; the variance is 44.89 mL.
MHR • Foundations for College Mathematics 11 Solutions 117
Chapter 3 Section 5 Question 7 Page 146
a) Mean 24 35 45 41 22 51 46 40 304 388 8
+ + + + + + += = =
5.948
7568
)3840()3846()3851()3822()3841()3845()3835()3824( 22222222
=
=
−+−+−+−+−+−+−+−
The variance is 94.5. 7.95.94 =& ; the standard deviation is 9.7.
b) Mean 5 4 7 11 1 6 6 7 7 54 69 9
+ + + + + + + += = =
4.6958
9)67()67()66()66()61()611()67()64()65( 222222222
=
=
−+−+−+−+−+−+−+−+−
&
The variance is 6.4.
5.2958 =& ; the standard deviation is 2.5.
c) Mean 100 105 101 103 100 99 102 98 808 1018 8
+ + + + + + += = =
8)10198()101102()10199()101100()101103()101101()101105()101100( 22222222 −+−+−+−+−+−+−+−
5.4836
=
=
The variance is 4.5. 1.25.4 =& ; the standard deviation is 2.1.
d) Mean 56 57 54 51 58 59 51 50 53 51 540 5410 10
+ + + + + + + + += = =
10)5451()5453()5450()5451()5459()5458()5451()5454()5457()5456( 2222222222 −+−+−+−+−+−+−+−+−+−
8.91098
=
=
The variance is 9.8.
118 MHR • Foundations for College Mathematics 11 Solutions
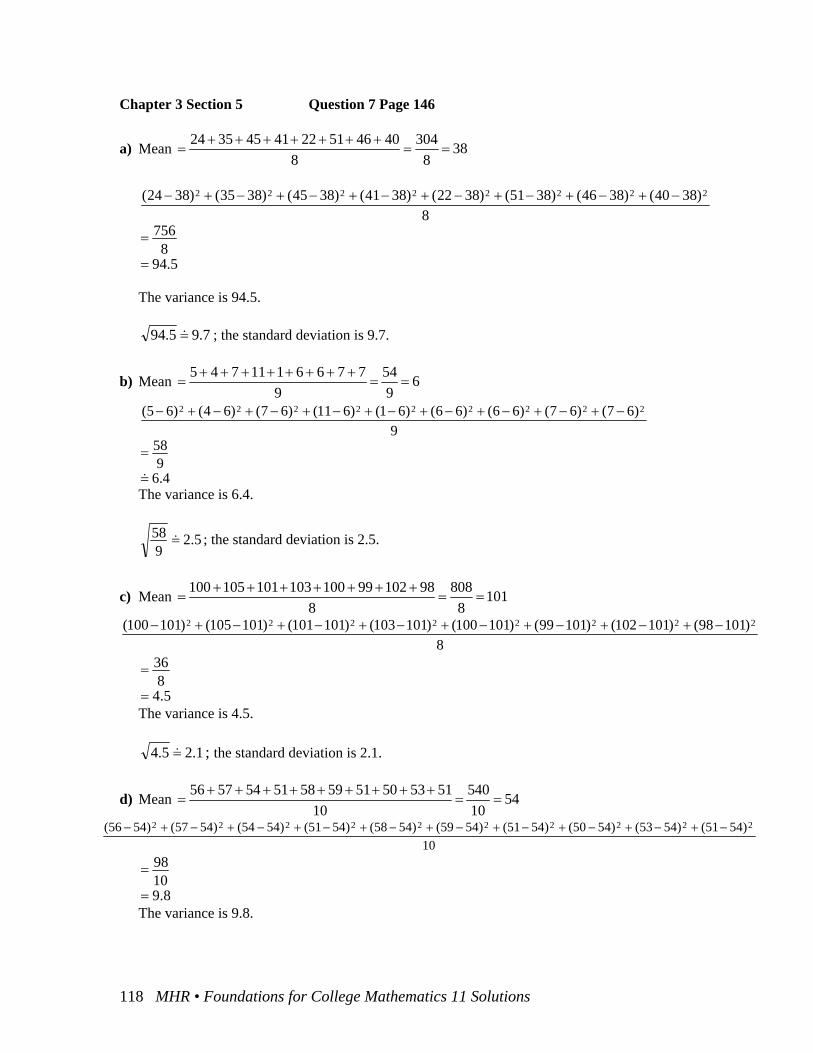
1.38.9 =& ; the standard deviation is 3.1. Chapter 3 Section 5 Question 8 Page 146 There is more variation in the heights of the players on Team Two, even though the average height is the same for the 2 teams. Chapter 3 Section 5 Question 9 Page 146
Chapter 3 Section 5 Question 10 Page 146 Ingrid; she is less likely to have a very low scoring game. Chapter 3 Section 5 Question 11 Page 147 a)
86.1210
6.12810
99.1292.1280.1278.1290.1281.1287.1291.1277.1285.12 Mean
=
=
+++++++++=
10)86.1299.12()86.1292.12()86.1280.12(...)86.1291.12()86.1277.12()86.1285.12( 222222 −+−+−++−+−+−
54004.0
100454.0
=
=
The variance is 0.004 54. 067.054004.0 =& The standard deviation is 0.067 cm. b) Two standard deviations is 0.134 cm. Check for piston diameters outside of the range
(12.726, 12.994). There are no defective pistons. c) 0% d) Answers may vary. For example:
Probably not; the failure rate could be 2% or 3% and it likely would not be measured by testing just 10 pistons.
MHR • Foundations for College Mathematics 11 Solutions 119
Chapter 3 Section 5 Question 12 Page 147 The mean attendance is 37 000, as calculated in Section 3.4, Question 8. Range is 44 000 – 23 000 = 21 000
1.3620
72220
)3743()3741()3742(...)3744()3731()3723( 222222
=
=
−+−+−++−+−+−=
The variance is 36 100 000.
600800010036 =& The standard deviation is 6008. Chapter 3 Section 5 Question 13 Page 147 Solutions for Achievement Checks are in the Teacher Resource. Chapter 3 Section 5 Question 14 Page 147 Answers may vary.
120 MHR • Foundations for College Mathematics 11 Solutions
Chapter 3 Section 6 Common Distributions Chapter 3 Section 6 Question 1 Page 153 a) skewed left b) bimodal c) normal d) skewed right Chapter 3 Section 6 Question 2 Page 153 a) Answers may vary. For example:
the lengths of hairs on a cat; shoe sizes sold by a major chain of shoe stores b) Answers may vary. For example:
the masses of pumpkins in a giant pumpkin contest c) Answers may vary. For example:
the times for male and female Olympic athletes in the 100 m dash Chapter 3 Section 6 Question 3 Page 153 a) bimodal b) Answers may vary. For example:
Girls might be, on the average, better or more focused readers than boys at this age. Chapter 3 Section 6 Question 4 Page 153 a) Answers may vary. For example:
to make sure that the mean dress size is close to the mean dress size of its customers b) Answers may vary. For example:
Yes; the manufacturer would use this information to plan the range and quantity of sizes it manufactures so that it can meet the needs of consumers.
Chapter 3 Section 6 Question 5 Page 154 a) Bimodal, there are many homeowners between 35 and 45 years old, and many between 55 and
65 years old. b) to direct campaigning and advertising toward 35 to 45 and 55 to 65 year olds c) mean: about 50; median: about 50. Both of these are found since the distribution is roughly
symmetric about 50 and appears to have no outliers.
MHR • Foundations for College Mathematics 11 Solutions 121
Chapter 3 Section 6 Question 6 Page 154 a) Answers may vary. For example:
The distribution is skewed to the right. There are many highly paid employees and few employees with very low salaries.
b) Answers may vary. For example:
The mode; because it is the greatest measure of central tendency. c) Answers may vary. For example:
The median, since it is less than the mode and the mean. Chapter 3 Section 6 Question 7 Page 155 Solutions for Achievement Checks are in the Teacher Resource. Chapter 3 Section 6 Question 8 Page 155 The interval between 740 mL and 780 mL represents 1 standard deviation on either side of the mean. 68% of 2000 cans is 0.068 × 2000, or 1360 cans. Chapter 3 Section 6 Question 9 Page 155 Answers may vary.
122 MHR • Foundations for College Mathematics 11 Solutions
Chapter 3 Review Chapter 3 Review Question 1 Page 156 a) convenience sampling; since this location will have a quantity of people who understand the
questions and are interested in answering them. b) voluntary-response sampling; since the booth will attract people who are interested in the
issue. c) stratified random sampling; since the school population has both boys and girls and the
samples represent these subgroups proportionally. Chapter 3 Review Question 2 Page 156 60% of 100 is 60. She should survey 60 females and 40 males. Chapter 3 Review Question 3 Page 156 Number the people from 1 to 200. Then generate 15 random numbers between 1 and 200. (Use the command randInt(1,200) (randInt) and press ENTER 15 times.) Chapter 3 Review Question 4 Page 156 Answers may vary. For example: Do you think a carnival should be held for this year’s Spirit Week? Chapter 3 Review Question 5 Page 156 a) response bias; since the respondents are not representative of the total population. b) non-response bias; since many people ignore Internet/e-mail surveys. c) measurement bias; since one of the choices is more prominent than the others. Chapter 3 Review Question 6 Page 156 a) systematic random sampling b) Not everyone will return the survey.
MHR • Foundations for College Mathematics 11 Solutions 123
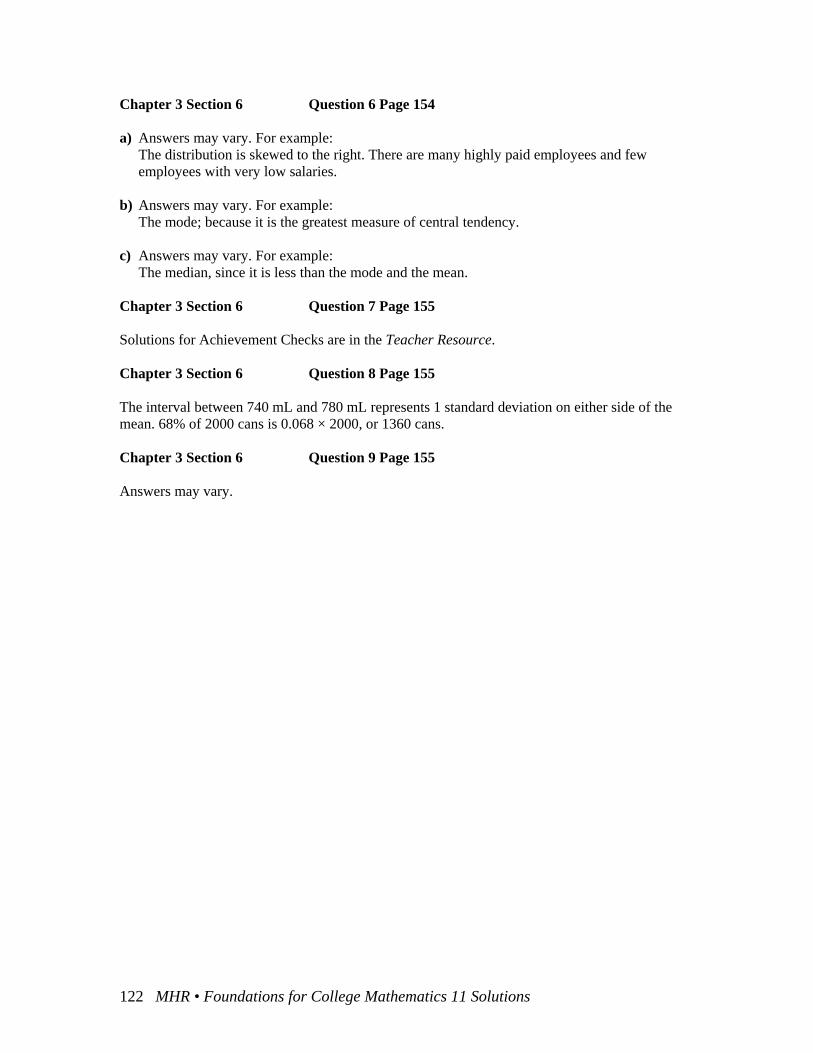
Chapter 3 Review Question 7 Page 156 a) circle graph, bar graph b)
Chapter 3 Review Question 8 Page 157 a) 3 (sum of the frequencies of the last 2 bars) b) The sum of the frequencies of the first 3 bars is 12.
%606.02012 ==
c) Birth mass is a continuous quantity.
124 MHR • Foundations for College Mathematics 11 Solutions
Chapter 3 Review Question 9 Page 157
a) 92.5912719
12729192547764218247534521 Mean ==+++++++++++= &
From least to greatest: 21, 21, 45, 47, 53, 54, 64, 72, 77, 82, 91, 92
Median = 54 64 592+
=
Mode: 21
b) 39.718133
182246181714875356681174 Mean ==+++++++++++++++++= &
From least to greatest: 2, 2, 3, 4, 4, 5, 5, 6, 6, 6, 7, 7, 8, 8, 11, 14, 17, 18
Median = 6
Mode: 6
c) 62.7213944
1379875368647371918254677877 Mean ==++++++++++++= &
From least to greatest: 53, 54, 64, 67, 68, 71, 73, 77, 78, 79, 82, 87, 91
Median = 73
There is no mode. Chapter 3 Review Question 10 Page 157
a) 33.83162
500131005012
)25(100)100(50)500(12 Mean ==++
++= &
The mean price is $83.33. The median is the mean of the 81st and 82nd prices when the prices are listed in order: 25, 25 (79 times), 25, 25, 25 (17 times), 25, 100, 100 (48 times), 100, 500, 500 (10 times), 500 The median price is $25. The mode price is $25. b) Answers may vary. For example:
The mean, since the median and mode only represent one price.
MHR • Foundations for College Mathematics 11 Solutions 125
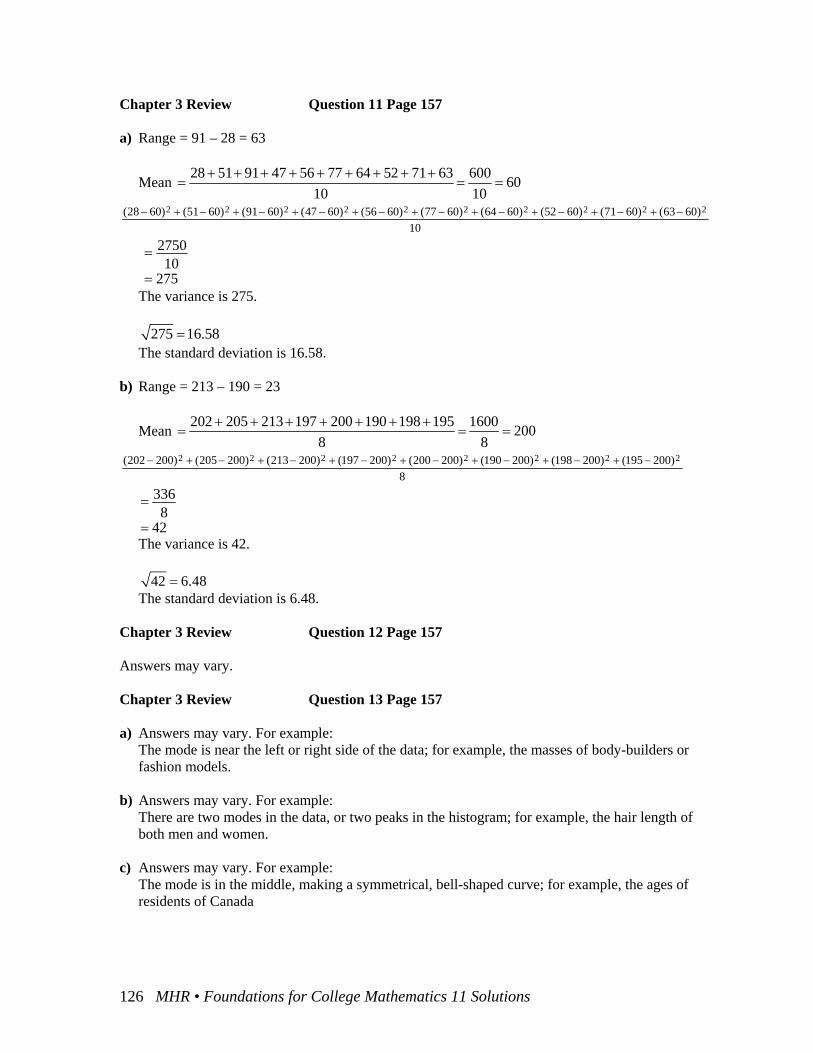
Chapter 3 Review Question 11 Page 157 a) Range = 91 – 28 = 63
Mean 28 51 91 47 56 77 64 52 71 63 600 6010 10
+ + + + + + + + += = =
10)6063()6071()6052()6064()6077()6056()6047()6091()6051()6028( 2222222222 −+−+−+−+−+−+−+−+−+−
275
102750
=
=
The variance is 275. 275 16.58= The standard deviation is 16.58. b) Range = 213 – 190 = 23
Mean 202 205 213 197 200 190 198 195 1600 2008 8
+ + + + + + += = =
8)200195()200198()200190()200200()200197()200213()200205()200202( 22222222 −+−+−+−+−+−+−+−
42
8336
=
=
The variance is 42. 42 6.48= The standard deviation is 6.48. Chapter 3 Review Question 12 Page 157 Answers may vary. Chapter 3 Review Question 13 Page 157 a) Answers may vary. For example:
The mode is near the left or right side of the data; for example, the masses of body-builders or fashion models.
b) Answers may vary. For example:
There are two modes in the data, or two peaks in the histogram; for example, the hair length of both men and women.
c) Answers may vary. For example:
The mode is in the middle, making a symmetrical, bell-shaped curve; for example, the ages of residents of Canada
126 MHR • Foundations for College Mathematics 11 Solutions
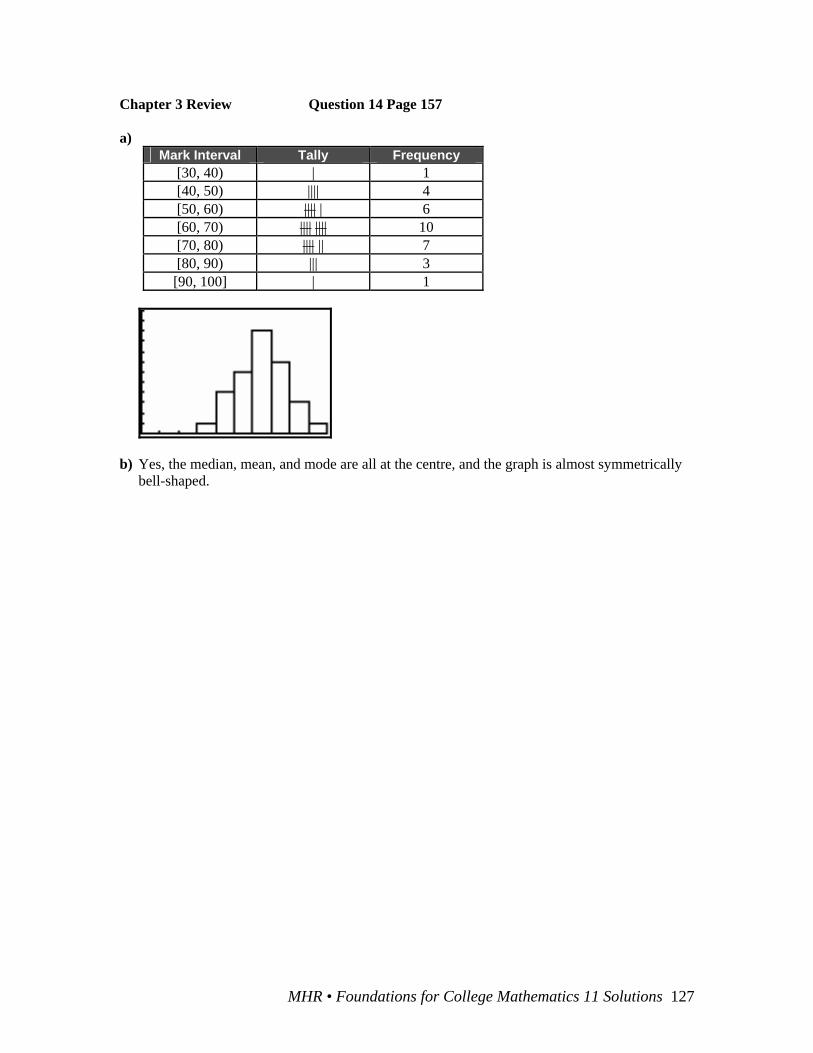
Chapter 3 Review Question 14 Page 157 a)
Mark Interval Tally Frequency [30, 40) | 1 [40, 50) |||| 4 [50, 60) |||| | 6 [60, 70) |||| |||| 10 [70, 80) |||| || 7 [80, 90) ||| 3 [90, 100] | 1
b) Yes, the median, mean, and mode are all at the centre, and the graph is almost symmetrically
bell-shaped.
MHR • Foundations for College Mathematics 11 Solutions 127
Chapter 3 Practice Test Chapter 3 Practice Test Question 1 Page 158 A Chapter 3 Practice Test Question 2 Page 158 B Chapter 3 Practice Test Question 3 Page 158 C Chapter 3 Practice Test Question 4 Page 158 a) primary b) primary or secondary, depending on the information c) primary d) secondary Chapter 3 Practice Test Question 5 Page 158 a) Answers may vary. For example:
response bias, since it is clear that the question is trying to get a positive response. b) Answers may vary. For example:
measurement bias, since only a few types of shows are shown, and people may not take the time to fill in the “Other” box, even if their favourite type of show is not sports, reality, or crime drama.
Chapter 3 Practice Test Question 6 Page 158 a) Should we allow private-sector investment in our transit system? b) What is your favourite type of television show?
128 MHR • Foundations for College Mathematics 11 Solutions
Chapter 3 Practice Test Question 7 Page 158 a) 0.01 = 0.1; the standard deviation is 0.1 cm. b) The mean is 1.5 cm. Two standard deviations is 0.2 cm; the range is 1.3 cm to 1.7 cm. c) The mean is 1.15 cm. Two standard deviations is 0.02 cm; the range is 1.13 cm to 1.17 cm. d) Answers may vary. For example:
The manufacturing process for nuts may be more accurate and less prone to irregularity than that for washers, or it may be more important for nuts to have a lower standard deviation than for washers so that the nut will screw onto the thread of a bolt.
Chapter 3 Practice Test Question 8 Page 159 a) Range = $63 200 – $31 300 = $31 900
150468
36928
0005820063100378004130031000583004250037 Mean
=
=
+++++++=
The mean opening week sales is $46 150. From least to greatest:
$31 300, $37 100, $37 500, $41 800, $42 300, $58 000, $58 000, $63 200
05042$2
30042$80041$=
+
The median is $42 050. The amount $58 000 occurs two times.
The mode is $58 000. b) Answers may vary. For example:
They will likely decrease, since in the first week people go there because it is new. After that, they only go if they really enjoyed it.
MHR • Foundations for College Mathematics 11 Solutions 129
Chapter 3 Practice Test Question 9 Page 159 Range = 225 min – 177 min = 48 min
20110
201010
218197202216225191186177203195 Mean
=
=
+++++++++=
10)201218()201197()201202()201216()201225()201191()201186()201177()201203()201195( 2222222222 −+−+−+−+−+−+−+−+−+−
8.20410
2048
=
=
The variance is 204.8 min.
31.148.204 =& The standard deviation is 14.31 min. Chapter 3 Practice Test Question 10 Page 159 a) bar graph b) normal distribution
130 MHR • Foundations for College Mathematics 11 Solutions
Chapters 1 to 3 Review Chapters 1 to 3 Review Question 1 Page 160
20000040
00040 theorem)an(Pythagore 160120
2
222
===
+=
bb
bb
54
200160 A sin ==
53
200120 A cos ==
34
120160 A tan ==
Chapters 1 to 3 Review Question 2 Page 160 Sketch the triangle.
A
BC 85.05ο
10 m Using the primary trigonometric ratios,
115AB05.85tan10AB
10AB 85.05 tan
=°×=
=°
&
The tree is about 115 m tall.
MHR • Foundations for College Mathematics 11 Solutions 131
Chapters 1 to 3 Review Question 3 Page 160 a) ∠C = 180° − 86° − 8° = 86° Using the sine law,
2.508sin86sin7
8 sin7
86sin
=°°×=
°=
°
&b
b
b
2.508sin86sin7
8 sin7
86sin
=°°×=
°=
°
&c
c
c
b) Using the cosine law,
3.3250cos25202664
50cos2520266450cos)30)(42(23042 222
=°×−=
°×−=°−+=
&ee
e
Side e is approximately 32.3 cm.
Using the sine law,
°=∠
°×=
°=
4.45D3.3250sin30 Dsin
3.3250sin
30 Dsin
&
∠F = 180° − 50° − 45.4° = 84.6° (Answers may vary depending on how you round off numbers in intermediate calculations.) Chapters 1 to 3 Review Question 4 Page 160 First find the measure of side KM. In ΔKLM, ∠KML = 180° − 20° − 85° = 75° Using the sine law,
125.4KM75sin
85sin4KM
75 sin4
85 sinKM
=°°×
=
°=
°
&
In isosceles ΔKMN, ∠KNM = 180° − 72° − 72° = 36° Using the sine law,
7.636sin
72sin125.436 sin
4.12572sin
=°
°×=°
=°
&e
e
e
Side e is approximately 6.7 m.
132 MHR • Foundations for College Mathematics 11 Solutions
Chapters 1 to 3 Review Question 5 Page 160
P(sum greater than 8) =43
4836
rolledaredicethreetimesofnumber total 8 angreater th suma timesofnumber ===
Chapters 1 to 3 Review Question 6 Page 160 When 2 ten-sided dice are rolled, the total number of outcomes is 100.
a) P(sum of 3) 501
1002 == (2 ways: 1,2; 2,1)
b) P(sum of 11) 101
10010 == (10 ways: 1,10; 2,9; 3,8; 4,7; 5,6; 7,4; 8,3; 9,2; 10,1)
c) P(sum of not 11) 109
10010100 =−= (90 ways)
d) P(sum of 18 or less) 10097
1003100 =−= (3 ways with sum more than 18: 9,10; 10,9; 10,10)
Chapters 1 to 3 Review Question 7 Page 160
a) P(green) %60106
3018 ===
P(purple) %40104
3012 ===
b) P(green) %7.363011 == &
P(purple) %603018 ==
P(red) %3.3301 == &
Chapters 1 to 3 Review Question 8 Page 161
a) 60 20%300
=
b) 20% of 60 = 0.2 × 60 = 12 He would be expected to get 12 hits. c) Answers may vary. For example:
The player may get injured, or may get better at getting hits.
MHR • Foundations for College Mathematics 11 Solutions 133
Chapters 1 to 3 Review Question 9 Page 161 a) sample: readers who return the form; population: all readers of the cycling magazine b) Sample: his neighbours who were at home; population: all eligible voters in the town Chapters 1 to 3 Review Question 10 Page 161 Answers may vary. For example: a) Not everyone who uses the cafeteria was surveyed so there is a non-response bias; more
people can be asked for their opinion so the population is better represented. b) Students may not volunteer the information resulting in response bias; ask students privately
or ask students for proof or progress. c) The wording of the question will affect responses so there is response bias; ask a simpler
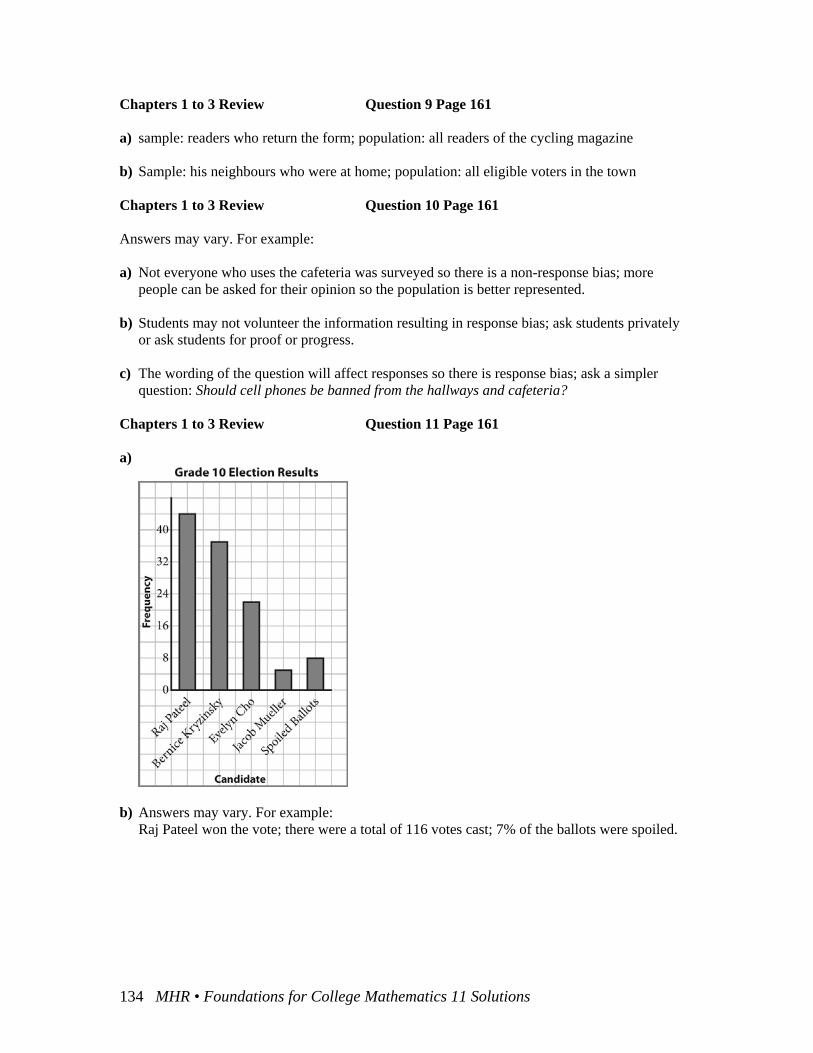
question: Should cell phones be banned from the hallways and cafeteria? Chapters 1 to 3 Review Question 11 Page 161 a)
b) Answers may vary. For example:
Raj Pateel won the vote; there were a total of 116 votes cast; 7% of the ballots were spoiled.
134 MHR • Foundations for College Mathematics 11 Solutions
Chapters 1 to 3 Review Question 12 Page 161
a) 87.245
12945
)6(1)5(4)4(6)3(11)2(23 Mean ==++++= &
The mean is 2.87. The median is the 23rd entry, which is 2. The number of times of 2 flips occurring is 23. The mode is 2. b) Answers may vary. For example:
The mode; because it occurs more than twice as often as any other outcome. Chapters 1 to 3 Review Question 13 Page 161 a) Range = 77 – 2 = 75
3817646
177770685651504945444239171610732 Mean ==++++++++++++++++=
59.55817
949617
)3877()3870()3868(...)387()383()382( 222222==−+−+−++−+−+−&
The variance is 558.59. 63.2359.558 =& The standard deviation is 23.63. b) Range = 16 – 8 = 8
2.1211
13411
121411111013161115138 Mean ==++++++++++= &
88.411
64.5311
)2.1212()2.1214()2.1211(...)2.1215()2.1213()2.128( 222222
=
=
−+−+−++−+−+−
&
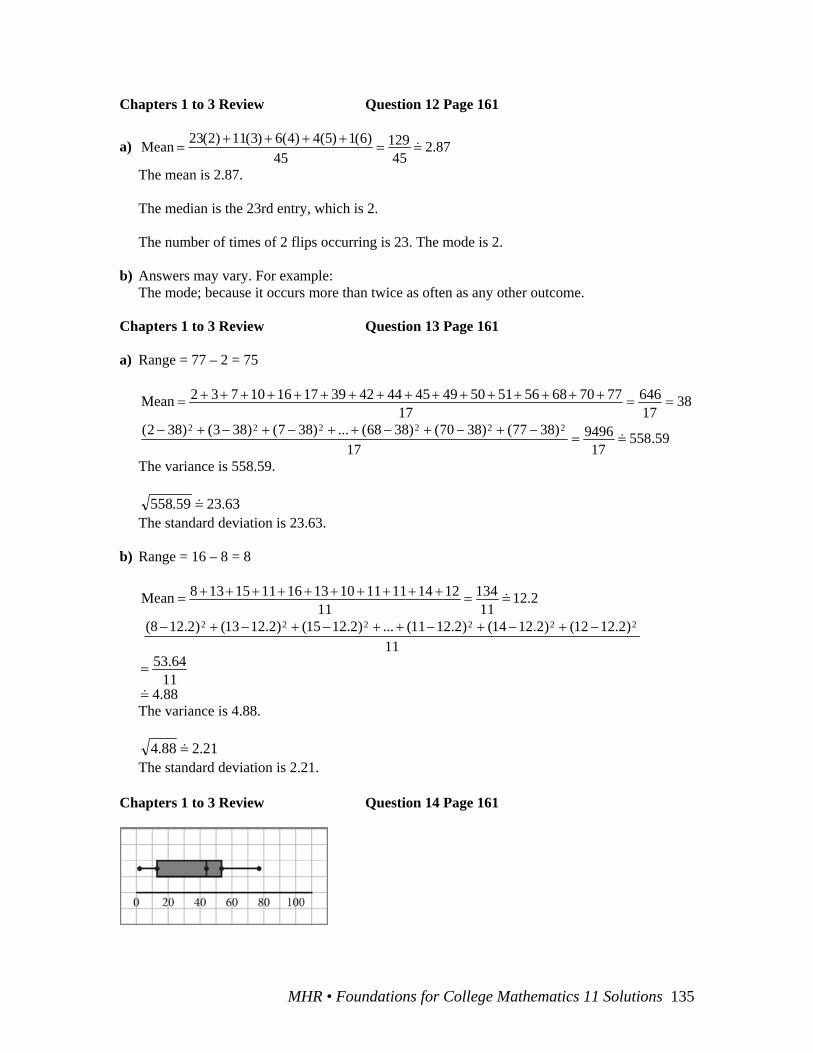
The variance is 4.88. 21.288.4 =& The standard deviation is 2.21. Chapters 1 to 3 Review Question 14 Page 161
MHR • Foundations for College Mathematics 11 Solutions 135


![RW Hydronic Controls 92ST / 92SS / 92SPSize A B D H1 H2 H3 Cv Weight [in] [in] [in] [in] [in] [in] [lb] ½” 5.67 5.89 7.65 2.29 3.74 1.93 4.7 1.42 ¾” 6.10 6.09 7.76 2.40 3.74](https://img.pdfslide.us/doc/110x75/5ffbc01e7d08fa1d461f954e/rw-hydronic-controls-92st-92ss-92sp-size-a-b-d-h1-h2-h3-cv-weight-in-in.jpg)