Embed Size (px)
Citation preview
41
CHAPTER-3
PREPARATION AND STABILITY OF NANOFLUID
Nanofluids are prepared using various equipments such as magnetic stirrer, Ultra
sonic bath sonicator and pH meter. Further, to check the stability of nanofluid
Nephleometer is used. These techniques are discussed briefly in this chapter. The
Response Surface Methodology (RSM) is adopted in identify the process parameters such
as surfactant quantity and pH value for each volume fraction of nanofluids which are
stable for 30 days.
3.1. PREPARATION OF NANOFLUIDS
The preparation of nanofluid must ensure proper dispersion of nanoparticles in the
liquid and proper mechanism is needed to attain the stability of the suspension against
sedimentation. Alumininum oxide (Al2O3) nanoparticles are procured from M/s. United
Nanotech products Ltd., Howrah, India (XRD of Al2O3 nanoparticles is shown in A1).
The size of nanoparticles is 50-100 nm. Under atmospheric temperature condition these
particles form loose agglomerates, which are of the order of micrometers. However they
can be dispersed in the fluid quite successfully which results in breaking of the
agglomerates by sonication.
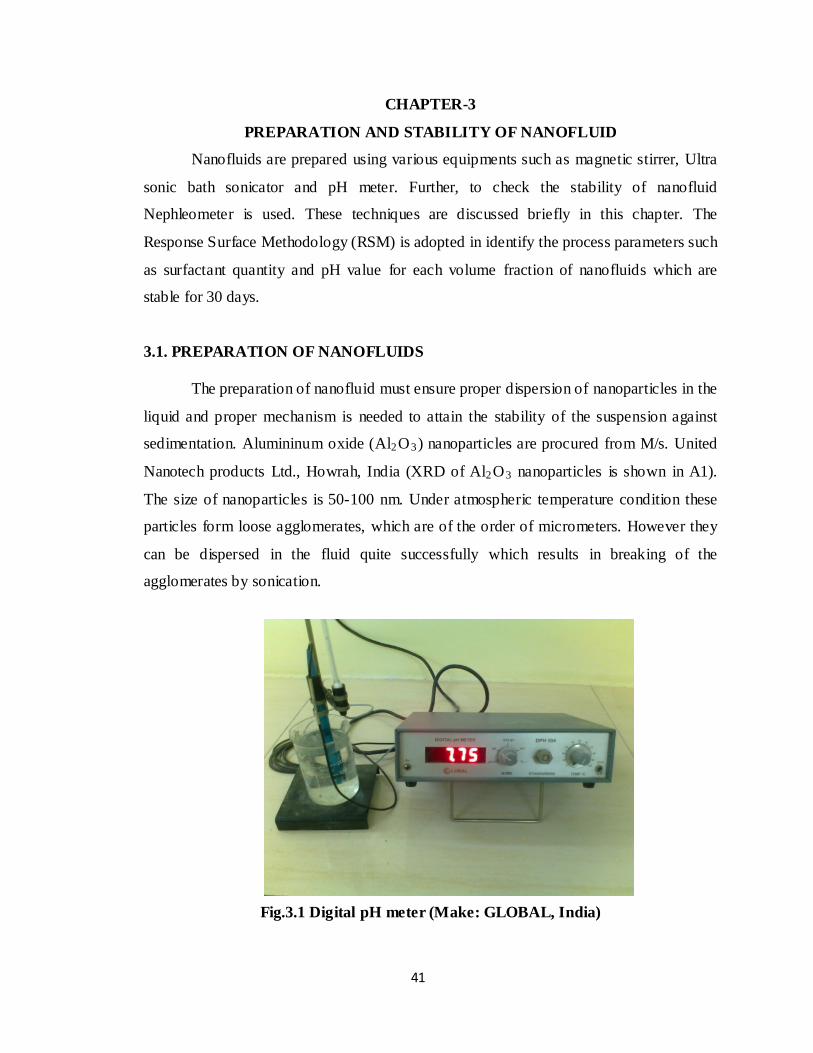
Fig.3.1 Digital pH meter (Make: GLOBAL, India)
42
The clustering of nanoparticles is avoided by inducing surface charge on to the
particles by adjusting the pH value of the base fluid. The pH value of the base fluid is
adjusted with the addition of small amount of hydrochloric acid or sodium hydroxide.
The digital pH meter used in the present study is shown in fig.3.1.
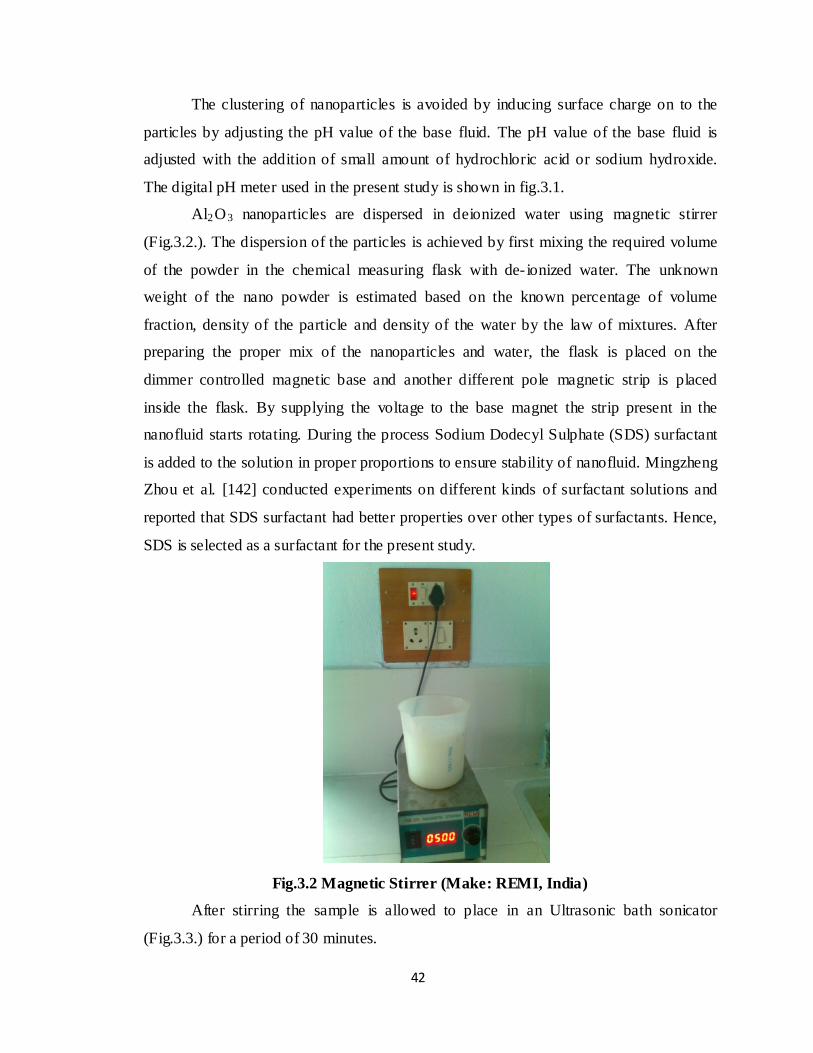
Al2O3 nanoparticles are dispersed in deionized water using magnetic stirrer
(Fig.3.2.). The dispersion of the particles is achieved by first mixing the required volume
of the powder in the chemical measuring flask with de- ionized water. The unknown
weight of the nano powder is estimated based on the known percentage of volume
fraction, density of the particle and density of the water by the law of mixtures. After
preparing the proper mix of the nanoparticles and water, the flask is placed on the
dimmer controlled magnetic base and another different pole magnetic strip is placed
inside the flask. By supplying the voltage to the base magnet the strip present in the
nanofluid starts rotating. During the process Sodium Dodecyl Sulphate (SDS) surfactant
is added to the solution in proper proportions to ensure stability of nanofluid. Mingzheng
Zhou et al. [142] conducted experiments on different kinds of surfactant solutions and
reported that SDS surfactant had better properties over other types of surfactants. Hence,
SDS is selected as a surfactant for the present study.
Fig.3.2 Magnetic Stirrer (Make: REMI, India)
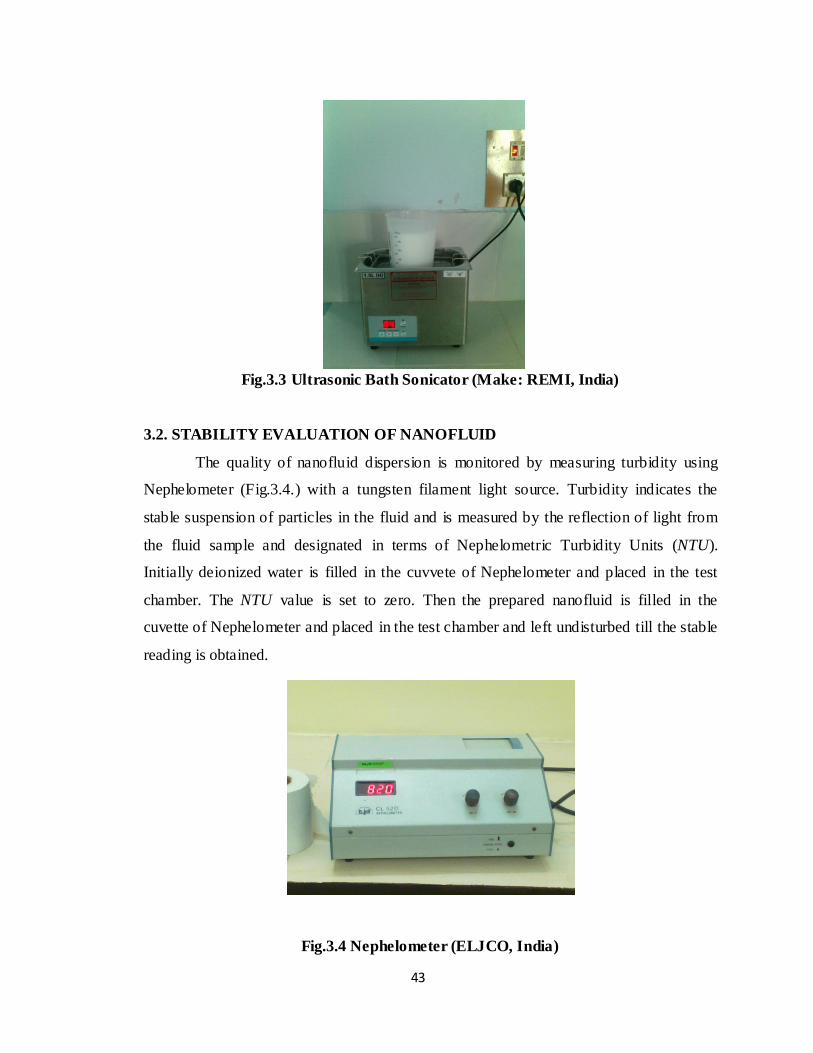
After stirring the sample is allowed to place in an Ultrasonic bath sonicator
(Fig.3.3.) for a period of 30 minutes.
43
Fig.3.3 Ultrasonic Bath Sonicator (Make: REMI, India)
3.2. STABILITY EVALUATION OF NANOFLUID
The quality of nanofluid dispersion is monitored by measuring turbidity using
Nephelometer (Fig.3.4.) with a tungsten filament light source. Turbidity indicates the
stable suspension of particles in the fluid and is measured by the reflection of light from
the fluid sample and designated in terms of Nephelometric Turbidity Units (NTU).
Initially deionized water is filled in the cuvvete of Nephelometer and placed in the test
chamber. The NTU value is set to zero. Then the prepared nanofluid is filled in the
cuvette of Nephelometer and placed in the test chamber and left undisturbed till the stable
reading is obtained.
Fig.3.4 Nephelometer (ELJCO, India)
44
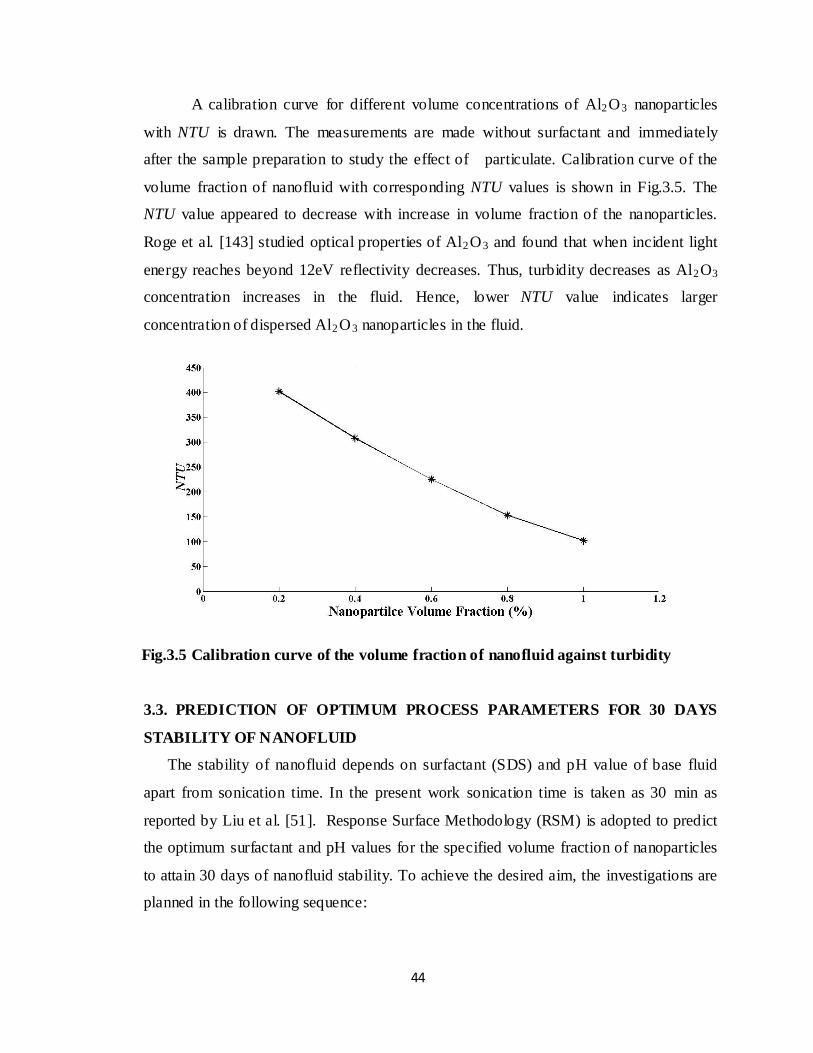
A calibration curve for different volume concentrations of Al2O3 nanoparticles
with NTU is drawn. The measurements are made without surfactant and immediately
after the sample preparation to study the effect of particulate. Calibration curve of the
volume fraction of nanofluid with corresponding NTU values is shown in Fig.3.5. The
NTU value appeared to decrease with increase in volume fraction of the nanoparticles.
Roge et al. [143] studied optical properties of Al2O3 and found that when incident light
energy reaches beyond 12eV reflectivity decreases. Thus, turbidity decreases as Al2O3
concentration increases in the fluid. Hence, lower NTU value indicates larger
concentration of dispersed Al2O3 nanoparticles in the fluid.
Fig.3.5 Calibration curve of the volume fraction of nanofluid against turbidity
3.3. PREDICTION OF OPTIMUM PROCESS PARAMETERS FOR 30 DAYS
STABILITY OF NANOFLUID
The stability of nanofluid depends on surfactant (SDS) and pH value of base fluid
apart from sonication time. In the present work sonication time is taken as 30 min as
reported by Liu et al. [51]. Response Surface Methodology (RSM) is adopted to predict
the optimum surfactant and pH values for the specified volume fraction of nanoparticles
to attain 30 days of nanofluid stability. To achieve the desired aim, the investigations are
planned in the following sequence:
45
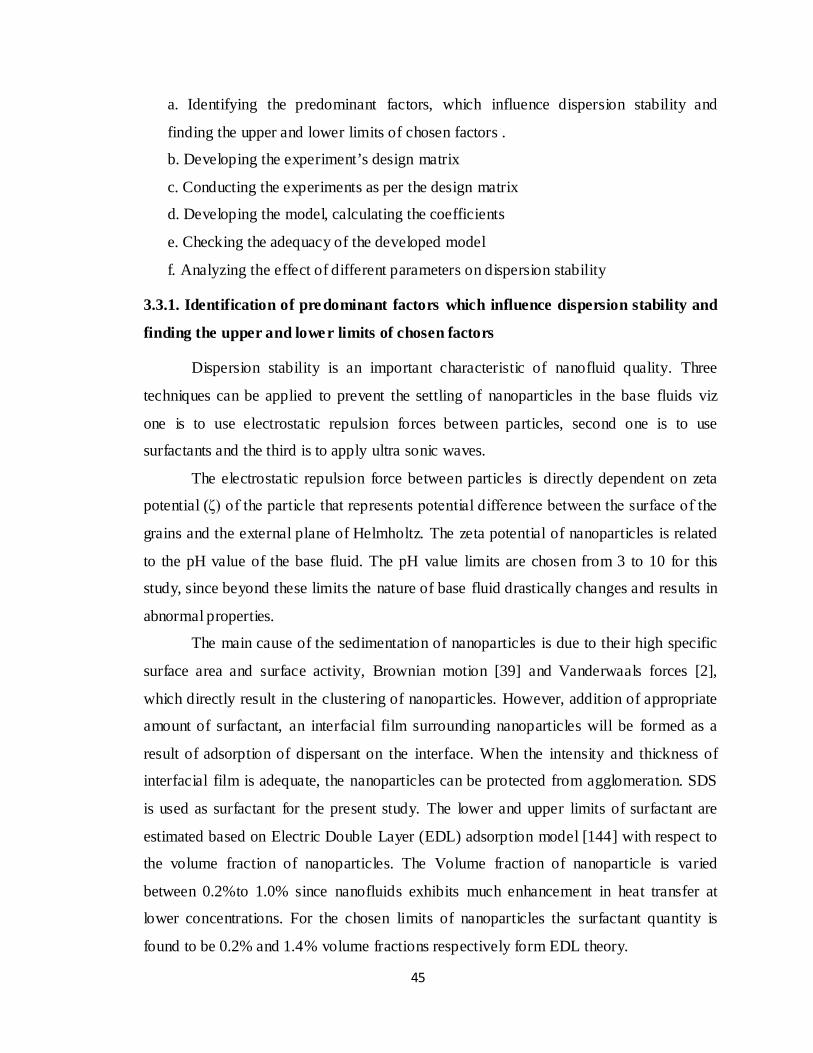
a. Identifying the predominant factors, which influence dispersion stability and
finding the upper and lower limits of chosen factors .
b. Developing the experiment’s design matrix
c. Conducting the experiments as per the design matrix
d. Developing the model, calculating the coefficients
e. Checking the adequacy of the developed model
f. Analyzing the effect of different parameters on dispersion stability
3.3.1. Identification of predominant factors which influence dispersion stability and
finding the upper and lower limits of chosen factors
Dispersion stability is an important characteristic of nanofluid quality. Three
techniques can be applied to prevent the settling of nanoparticles in the base fluids viz
one is to use electrostatic repulsion forces between particles, second one is to use
surfactants and the third is to apply ultra sonic waves.
The electrostatic repulsion force between particles is directly dependent on zeta
potential (ζ) of the particle that represents potential difference between the surface of the
grains and the external plane of Helmholtz. The zeta potential of nanoparticles is related
to the pH value of the base fluid. The pH value limits are chosen from 3 to 10 for this
study, since beyond these limits the nature of base fluid drastically changes and results in
abnormal properties.
The main cause of the sedimentation of nanoparticles is due to their high specific
surface area and surface activity, Brownian motion [39] and Vanderwaals forces [2],
which directly result in the clustering of nanoparticles. However, addition of appropriate
amount of surfactant, an interfacial film surrounding nanoparticles will be formed as a
result of adsorption of dispersant on the interface. When the intensity and thickness of
interfacial film is adequate, the nanoparticles can be protected from agglomeration. SDS
is used as surfactant for the present study. The lower and upper limits of surfactant are
estimated based on Electric Double Layer (EDL) adsorption model [144] with respect to
the volume fraction of nanoparticles. The Volume fraction of nanoparticle is varied
between 0.2%to 1.0% since nanofluids exhibits much enhancement in heat transfer at
lower concentrations. For the chosen limits of nanoparticles the surfactant quantity is
found to be 0.2% and 1.4% volume fractions respectively form EDL theory.
46
3.3.2. Developing the experimental design matrix
An experiment is a series of trials or tests, which produces quantifiable
outcomes due to slightly wide ranges of the factors. In the present study a five level
central composite rotatable design matrix to optimize the experimental conditions is
proposed. Center Composite rotatable Design (CCD) of second order found to be the
most efficient tool in (RSM) to establish mathematical relation of the response surface
using smallest possible number of experiments without losing accuracy [145].
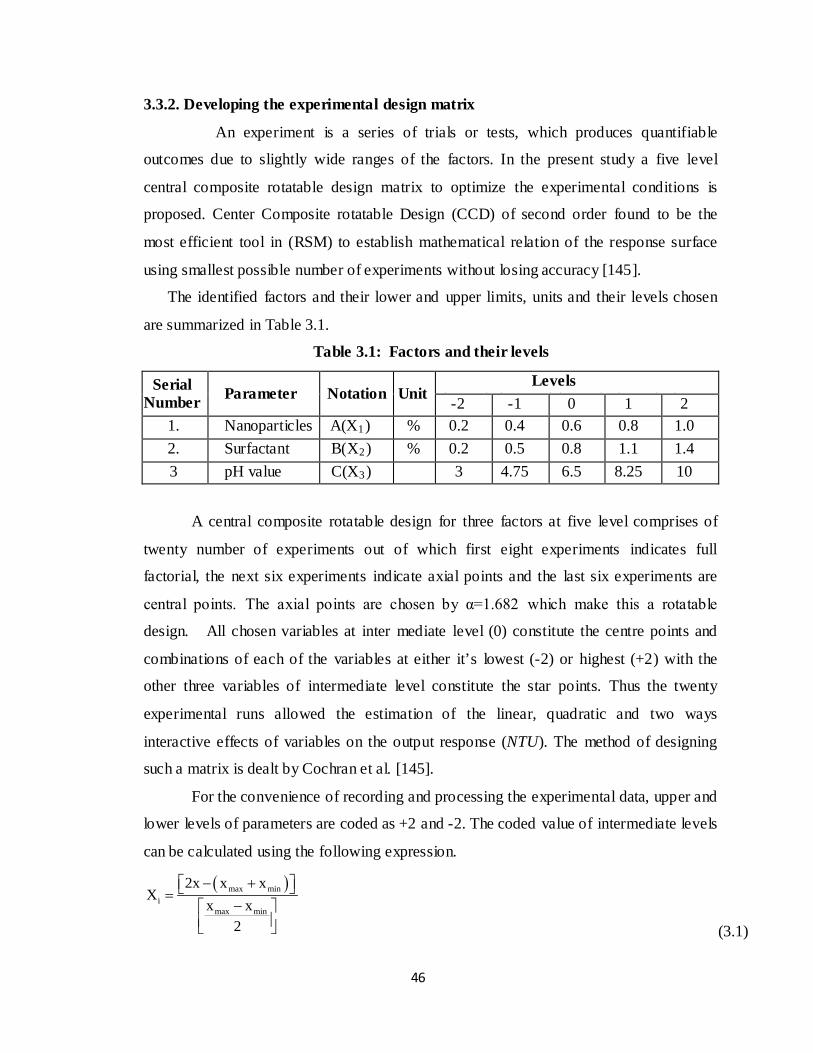
The identified factors and their lower and upper limits, units and their levels chosen
are summarized in Table 3.1.
Table 3.1: Factors and their levels
Serial Number Parameter Notation Unit
Levels 2) ( 1) (0) (+1) (+2) -2 -1 0 1 2
1. Nanoparticles A(X1) % 0.2 0.4 0.6 0.8 1.0 2. Surfactant B(X2) % 0.2 0.5 0.8 1.1 1.4 3 pH value C(X3) 3 4.75 6.5 8.25 10
A central composite rotatable design for three factors at five level comprises of
twenty number of experiments out of which first eight experiments indicates full
factorial, the next six experiments indicate axial points and the last six experiments are
central points. The axial points are chosen by α=1.682 which make this a rotatable
design. All chosen variables at inter mediate level (0) constitute the centre points and
combinations of each of the variables at either it’s lowest (-2) or highest (+2) with the
other three variables of intermediate level constitute the star points. Thus the twenty
experimental runs allowed the estimation of the linear, quadratic and two ways
interactive effects of variables on the output response (NTU). The method of designing
such a matrix is dealt by Cochran et al. [145].
For the convenience of recording and processing the experimental data, upper and
lower levels of parameters are coded as +2 and -2. The coded value of intermediate levels
can be calculated using the following expression.
( )max mini
max min
2x x x X
x x2
− + =−
(3.1)
47
where, Xmax is the upper level of the parameter, Xmin is the lower level of the
parameter and Xi is the required coded values of the parameter of any value of X from
Xmin to Xmax.
3.3.3. Conducting the experiments
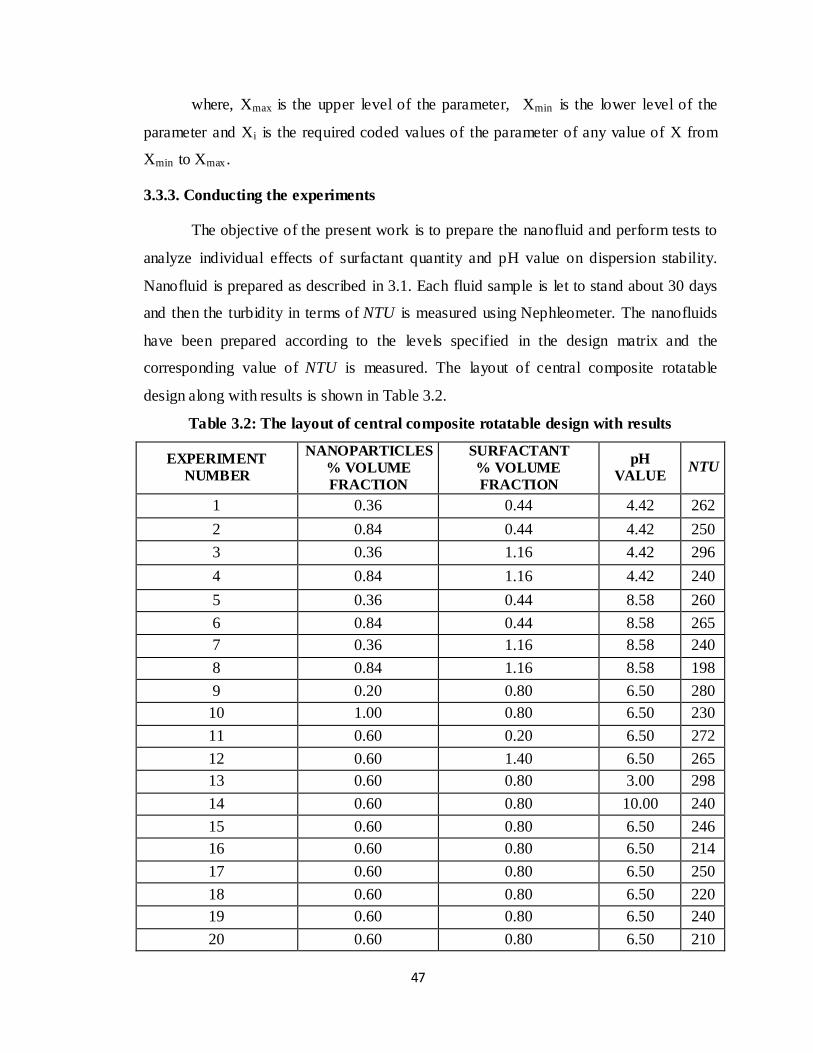
The objective of the present work is to prepare the nanofluid and perform tests to
analyze individual effects of surfactant quantity and pH value on dispersion stability.
Nanofluid is prepared as described in 3.1. Each fluid sample is let to stand about 30 days
and then the turbidity in terms of NTU is measured using Nephleometer. The nanofluids
have been prepared according to the levels specified in the design matrix and the
corresponding value of NTU is measured. The layout of central composite rotatable
design along with results is shown in Table 3.2.
Table 3.2: The layout of central composite rotatable design with results
EXPERIMENT NUMBER
NANOPARTICLES % VOLUME FRACTION
SURFACTANT % VOLUME FRACTION
pH VALUE NTU
1 0.36 0.44 4.42 262 2 0.84 0.44 4.42 250 3 0.36 1.16 4.42 296 4 0.84 1.16 4.42 240 5 0.36 0.44 8.58 260 6 0.84 0.44 8.58 265 7 0.36 1.16 8.58 240 8 0.84 1.16 8.58 198 9 0.20 0.80 6.50 280 10 1.00 0.80 6.50 230 11 0.60 0.20 6.50 272 12 0.60 1.40 6.50 265 13 0.60 0.80 3.00 298 14 0.60 0.80 10.00 240 15 0.60 0.80 6.50 246 16 0.60 0.80 6.50 214 17 0.60 0.80 6.50 250 18 0.60 0.80 6.50 220 19 0.60 0.80 6.50 240 20 0.60 0.80 6.50 210
48
3.3.4. Developing the model, calculating the coefficients
Representing the turbidity of the nanofluid “NTU”, the response function can be
expressed as
NTU=f (A, B, C) (3.2)
The model chosen is a second degree response to check the nonlinearity and is
expressed as:
NTU=β0+ β1 (A) + β2 (B) + β3 (C) +β4 (A2) + β5 (B2) +β6 (C2) + β7 (AB) +β8 (AC) +β9
(BC) (3.3)
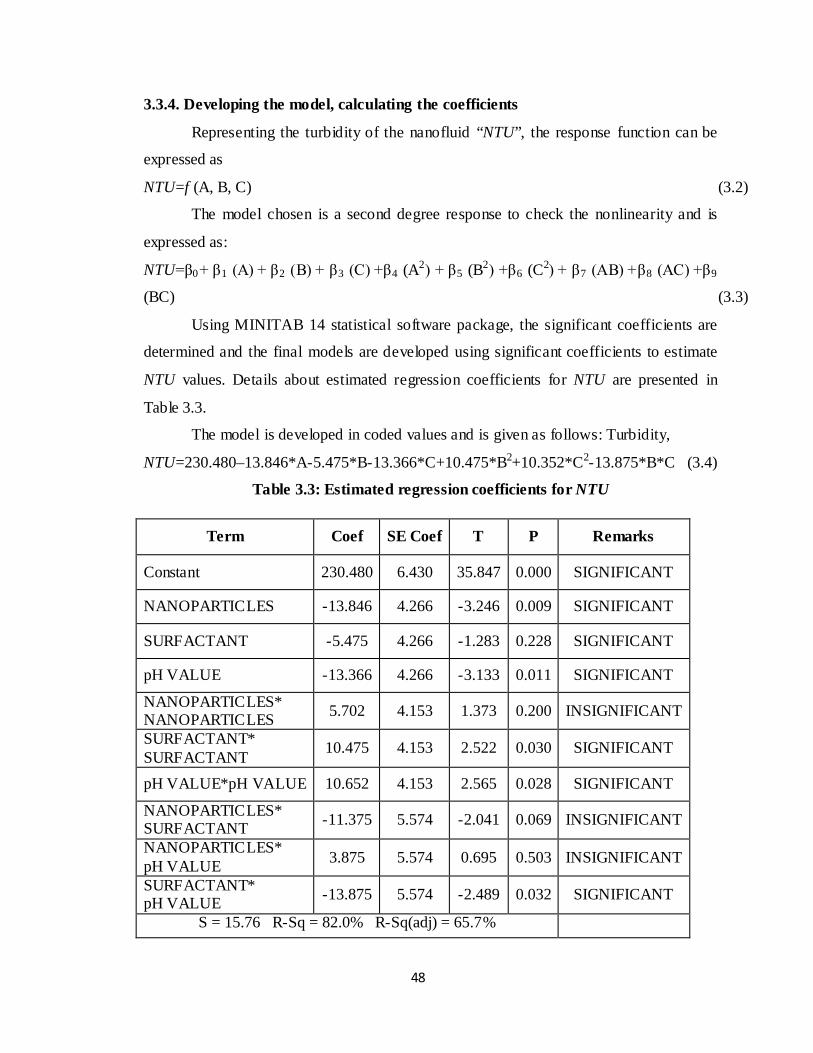
Using MINITAB 14 statistical software package, the significant coefficients are
determined and the final models are developed using significant coefficients to estimate
NTU values. Details about estimated regression coefficients for NTU are presented in
Table 3.3.
The model is developed in coded values and is given as follows: Turbidity,
NTU=230.480–13.846*A-5.475*B-13.366*C+10.475*B2+10.352*C2-13.875*B*C (3.4)
Table 3.3: Estimated regression coefficients for NTU
Term Coef SE Coef T P Remarks
Constant 230.480 6.430 35.847 0.000 SIGNIFICANT
NANOPARTICLES -13.846 4.266 -3.246 0.009 SIGNIFICANT
SURFACTANT -5.475 4.266 -1.283 0.228 SIGNIFICANT
pH VALUE -13.366 4.266 -3.133 0.011 SIGNIFICANT
NANOPARTICLES* NANOPARTICLES 5.702 4.153 1.373 0.200 INSIGNIFICANT
SURFACTANT* SURFACTANT 10.475 4.153 2.522 0.030 SIGNIFICANT
pH VALUE*pH VALUE 10.652 4.153 2.565 0.028 SIGNIFICANT
NANOPARTICLES* SURFACTANT -11.375 5.574 -2.041 0.069 INSIGNIFICANT
NANOPARTICLES* pH VALUE 3.875 5.574 0.695 0.503 INSIGNIFICANT
SURFACTANT* pH VALUE -13.875 5.574 -2.489 0.032 SIGNIFICANT
S = 15.76 R-Sq = 82.0% R-Sq(adj) = 65.7%
49
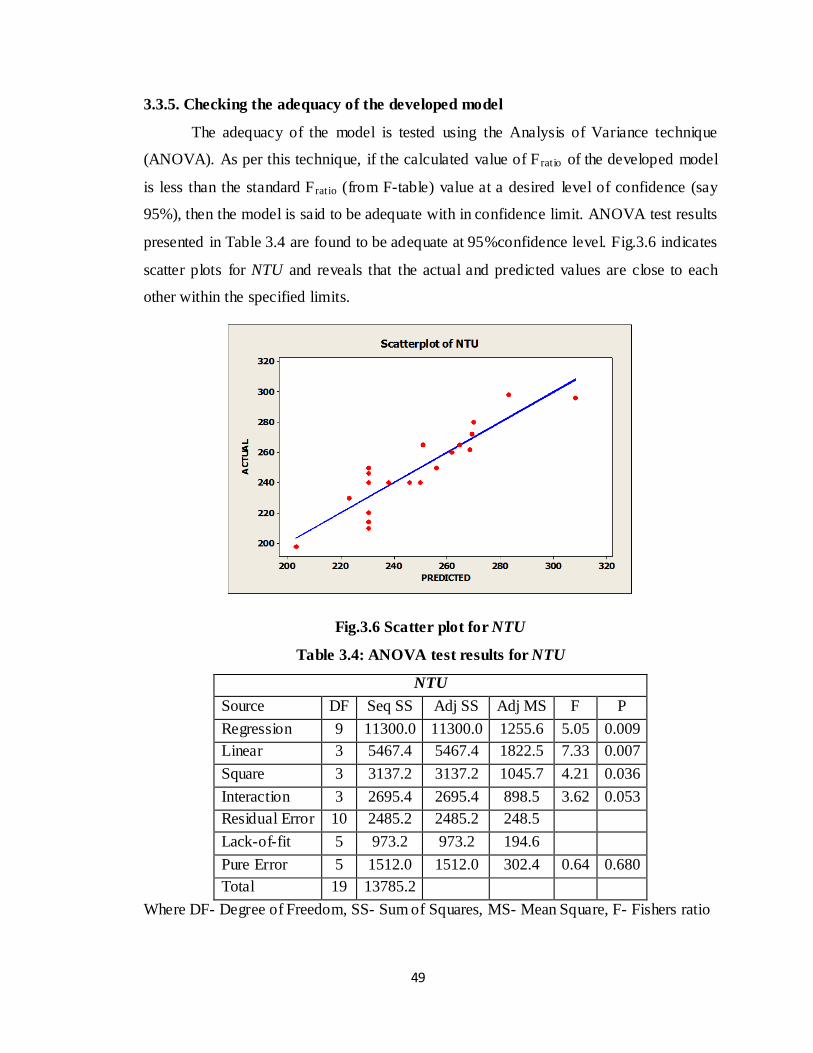
3.3.5. Checking the adequacy of the developed model
The adequacy of the model is tested using the Analysis of Variance technique
(ANOVA). As per this technique, if the calculated value of Fratio of the developed model
is less than the standard Fratio (from F-table) value at a desired level of confidence (say
95%), then the model is said to be adequate with in confidence limit. ANOVA test results
presented in Table 3.4 are found to be adequate at 95%confidence level. Fig.3.6 indicates
scatter plots for NTU and reveals that the actual and predicted values are close to each
other within the specified limits.
Fig.3.6 Scatter plot for NTU
Table 3.4: ANOVA test results for NTU
NTU Source DF Seq SS Adj SS Adj MS F P Regression 9 11300.0 11300.0 1255.6 5.05 0.009 Linear 3 5467.4 5467.4 1822.5 7.33 0.007 Square 3 3137.2 3137.2 1045.7 4.21 0.036 Interaction 3 2695.4 2695.4 898.5 3.62 0.053 Residual Error 10 2485.2 2485.2 248.5 Lack-of-fit 5 973.2 973.2 194.6 Pure Error 5 1512.0 1512.0 302.4 0.64 0.680 Total 19 13785.2
Where DF- Degree of Freedom, SS- Sum of Squares, MS- Mean Square, F- Fishers ratio
50
3.3.6. Effect of different parameters on dispersion stability
Based on the developed model the effects of parameters such as surfactant and pH
value on stability for the specified volume fraction of nanofluids are analyzed. The
optimum quantities of surfactant and pH for each volume fraction of nanofluid are
identified from the surface plots drawn.
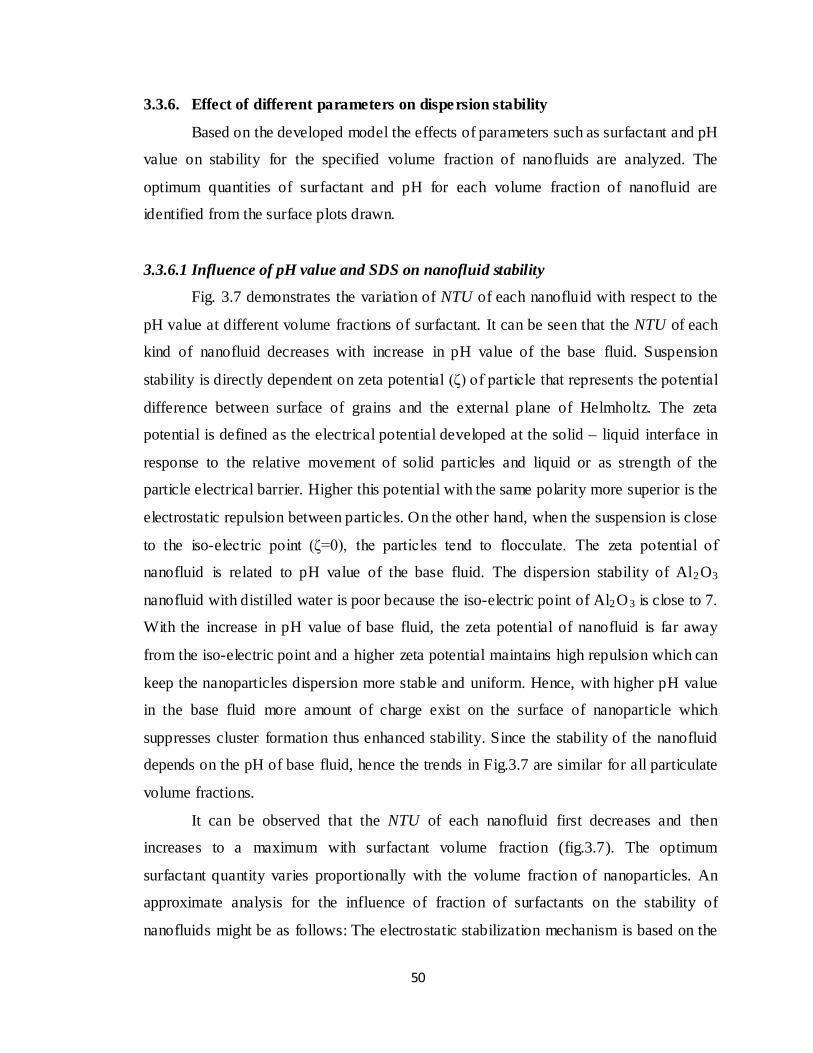
3.3.6.1 Influence of pH value and SDS on nanofluid stability
Fig. 3.7 demonstrates the variation of NTU of each nanofluid with respect to the
pH value at different volume fractions of surfactant. It can be seen that the NTU of each
kind of nanofluid decreases with increase in pH value of the base fluid. Suspension
stability is directly dependent on zeta potential (ζ) of particle that represents the potential
difference between surface of grains and the external plane of Helmholtz. The zeta
potential is defined as the electrical potential developed at the solid – liquid interface in
response to the relative movement of solid particles and liquid or as strength of the
particle electrical barrier. Higher this potential with the same polarity more superior is the
electrostatic repulsion between particles. On the other hand, when the suspension is close
to the iso-electric point (ζ=0), the particles tend to flocculate. The zeta potential of
nanofluid is related to pH value of the base fluid. The dispersion stability of Al2O3
nanofluid with distilled water is poor because the iso-electric point of Al2O3 is close to 7.
With the increase in pH value of base fluid, the zeta potential of nanofluid is far away
from the iso-electric point and a higher zeta potential maintains high repulsion which can
keep the nanoparticles dispersion more stable and uniform. Hence, with higher pH value
in the base fluid more amount of charge exist on the surface of nanoparticle which
suppresses cluster formation thus enhanced stability. Since the stability of the nanofluid
depends on the pH of base fluid, hence the trends in Fig.3.7 are similar for all particulate
volume fractions.
It can be observed that the NTU of each nanofluid first decreases and then
increases to a maximum with surfactant volume fraction (fig.3.7). The optimum
surfactant quantity varies proportionally with the volume fraction of nanoparticles. An
approximate analysis for the influence of fraction of surfactants on the stability of
nanofluids might be as follows: The electrostatic stabilization mechanism is based on the
51
adsorption–desorption of ions onto/from the particles surface. The attractive and
repulsive particle-particle interactions are based on DLVO (Derjaguin- Landau-Verywey-
Overbeek) theory. The electric double layer surrounding nanoparticles will be formed as
a result of the adsorption of dispersant on the interface when appropriate amount of
surfactant was added. The forming of electric double layer (EDL) directly resulted in the
electrostatic repulsion between surfactant coated nanoparticles, which strongly reduces
the particle agglomeration due to vanderwaals forces of attraction [2].
Fig.3.7 Turbidity of Al2O3 nanofluid with different volume fractions of surfactant
and pH values
(a) 0.2% Volume fraction of nanofluid (b) 0.4% Volume fraction of nanofluid (c) 0.6% Volume fraction of nanofluid (d) 0.8% Volume fraction of nanofluid
(e) 1.0% Volume fraction of nanofluid
52
However, when too much surfactant (more than saturated adsorption) was added,
there was oversaturated adsorption on the surface of nanoparticles. Moreover, the
positive ions in high concentration get into the electric double layer, which can eliminate
negative charges of electric double layer (EDL) and lead to the weakness of stability of
nanofluids. Therefore, too much surfactant will favor reunion of nanoparticles. Though
the trends are similar in Fig.3.7 (a) to (e), the optimum values are varying with
nanoparticle volume fraction due to the enhancement of adsorption surface area.
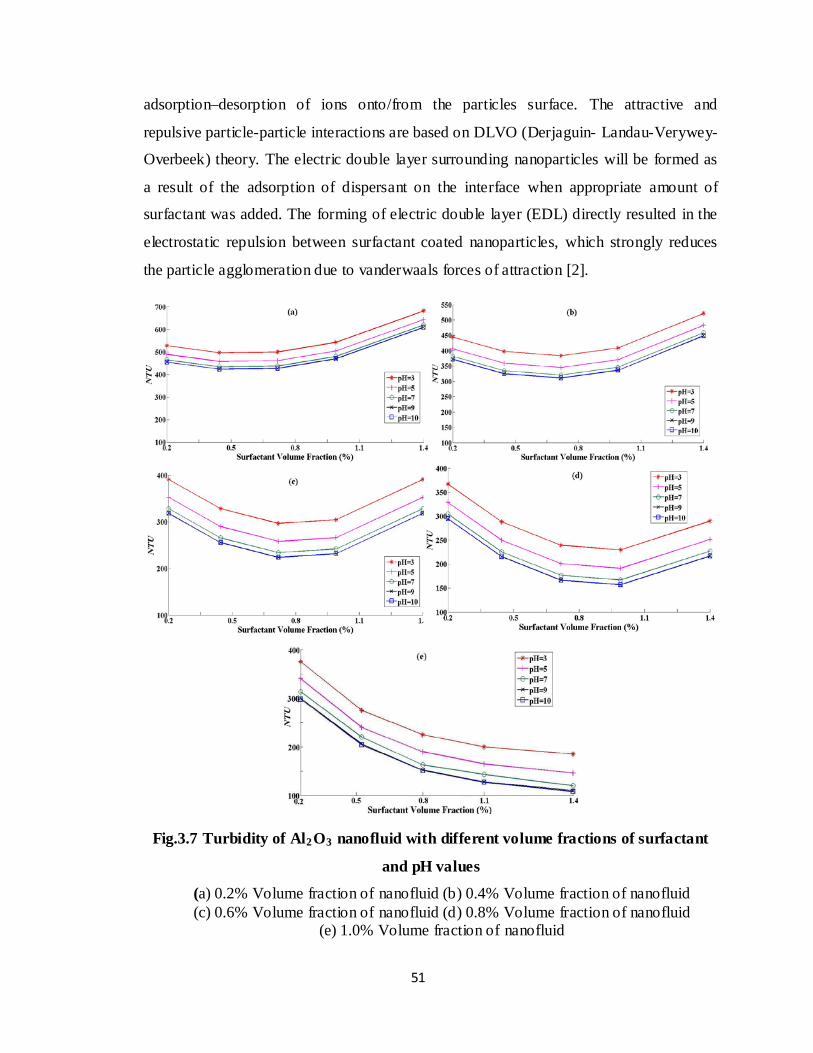
3.3.6.2. Interaction effects of surfactant quantity and pH value on NTU
The interaction effect between the process parameters and response can be clearly
analyzed by the contour plots. By generating contour plots using software (MINITAB
Ver 14) for response surface analysis, the optimum is located by characterizing the shape
of the surface. Fig. 3.8. (a) to (c) represent the contour plots for NTU.
(a) (b)
(c)
Fig.3.8. Contour plot of NTU for different volume fractions nanoparticles
(a) 0.2% Volume fraction of nanofluid (b) 0.6% Volume fraction of nanofluid
(c) 1.0% Volume fraction of nanofluid
From the contour plots of NTU, it is understood that surfactant quantity and pH value
of base fluid plays a major role in the stability of nanofluid. The lower NTU value (i.e.
SURFACTANT(% )
pH V
ALUE
260
240
220
200180
1.351.201.050.900.750.600.450.30
9.0
7.5
6.0
4.5
3.0
Hold ValuesNANOPARTICLES(%) 0.8378
NTU
260
180200220240
Contour Plot of NTU vs pH VALUE, SURFACTANT(%)
SURFACTANT(% )
pH V
ALUE
280
260
240
220
200
180
1.351.201.050.900.750.600.450.30
9.0
7.5
6.0
4.5
3.0
Hold ValuesNANOPARTICLES(%) 0.3622
NTU
260280
180200220240
Contour Plot of NTU vs pH VALUE, SURFACTANT(%)
SURFACTANT(% )
pH V
ALUE
260
240
220
200
180
1.351.201.050.900.750.600.450.30
9.0
7.5
6.0
4.5
3.0
Hold ValuesNANOPARTICLES(%) 0.6
NTU
260
180200220240
Contour Plot of NTU vs pH VALUE, SURFACTANT(%)
53
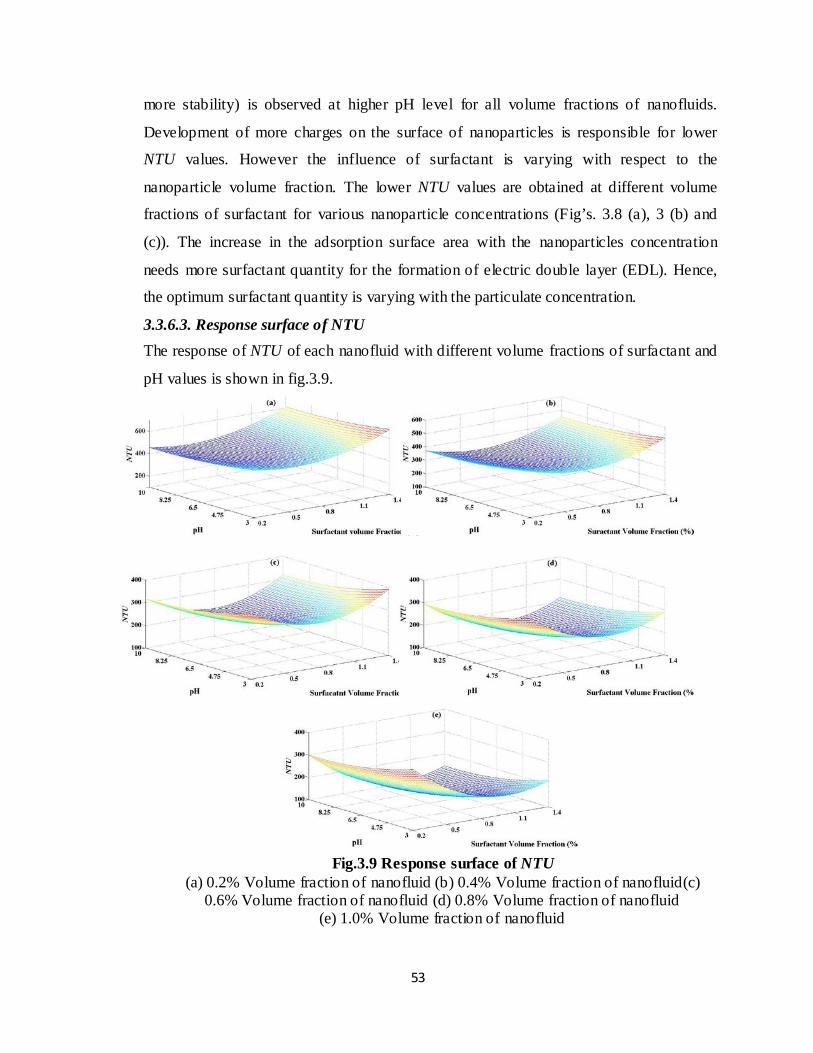
more stability) is observed at higher pH level for all volume fractions of nanofluids.
Development of more charges on the surface of nanoparticles is responsible for lower
NTU values. However the influence of surfactant is varying with respect to the
nanoparticle volume fraction. The lower NTU values are obtained at different volume
fractions of surfactant for various nanoparticle concentrations (Fig’s. 3.8 (a), 3 (b) and
(c)). The increase in the adsorption surface area with the nanoparticles concentration
needs more surfactant quantity for the formation of electric double layer (EDL). Hence,
the optimum surfactant quantity is varying with the particulate concentration.
3.3.6.3. Response surface of NTU The response of NTU of each nanofluid with different volume fractions of surfactant and
pH values is shown in fig.3.9.
Fig.3.9 Response surface of NTU (a) 0.2% Volume fraction of nanofluid (b) 0.4% Volume fraction of nanofluid(c)
0.6% Volume fraction of nanofluid (d) 0.8% Volume fraction of nanofluid (e) 1.0% Volume fraction of nanofluid
54
The optimal quantities of surfactant and pH value for each kind of nanofluid
based on longer stability (the point at which NTU is minimum) are identified from the
response plot drawn between surfactant volume fraction, pH value and NTU. The
optimum surfactant quantity and pH value for each volume fraction of nanofluid is
obtained from the response surface plots and are shown in Table 3.5.
Table 3.5. Optimum surfactant and pH values for various nanoparticle volume fractions
Nanoparticle volume
fraction, %
Surfactant Volume
fraction, %
pH value
0.2 0.28 9.75
0.4 0.51 9.75
0.6 0.73 9.75
0.8 0.95 9.75
1.0 1.55 9.75
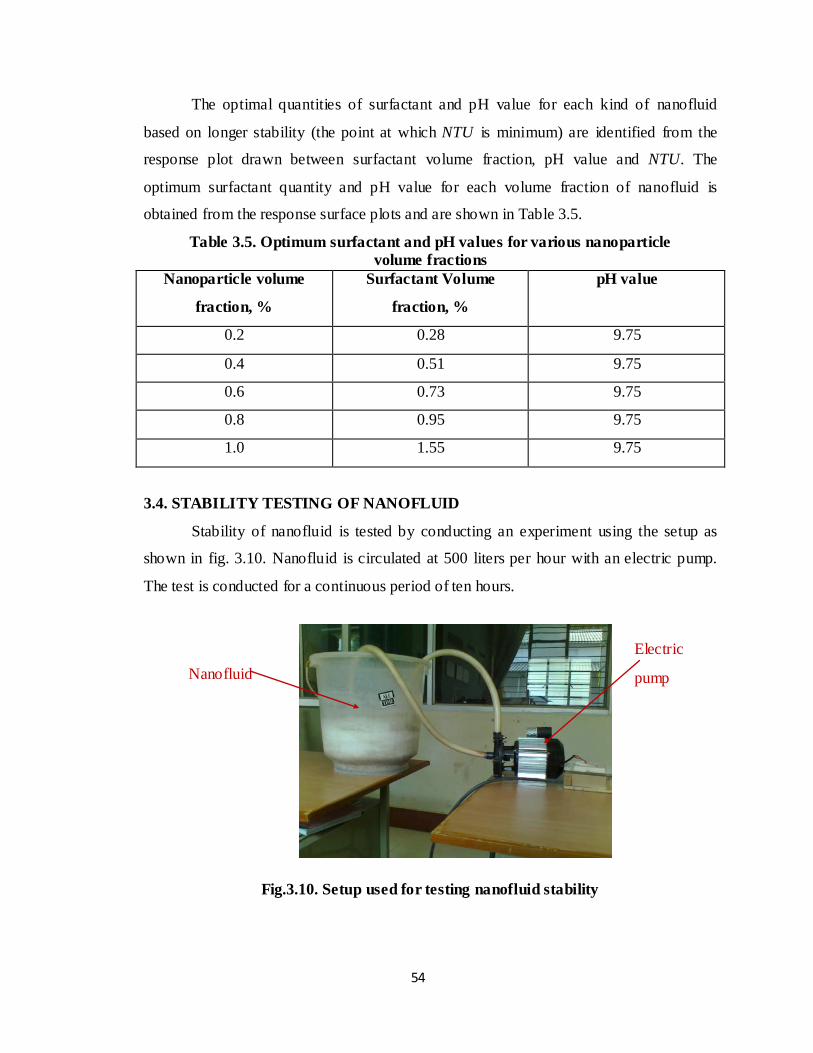
3.4. STABILITY TESTING OF NANOFLUID
Stability of nanofluid is tested by conducting an experiment using the setup as
shown in fig. 3.10. Nanofluid is circulated at 500 liters per hour with an electric pump.
The test is conducted for a continuous period of ten hours.
Fig.3.10. Setup used for testing nanofluid stability
Nanofluid Electric
pump
55
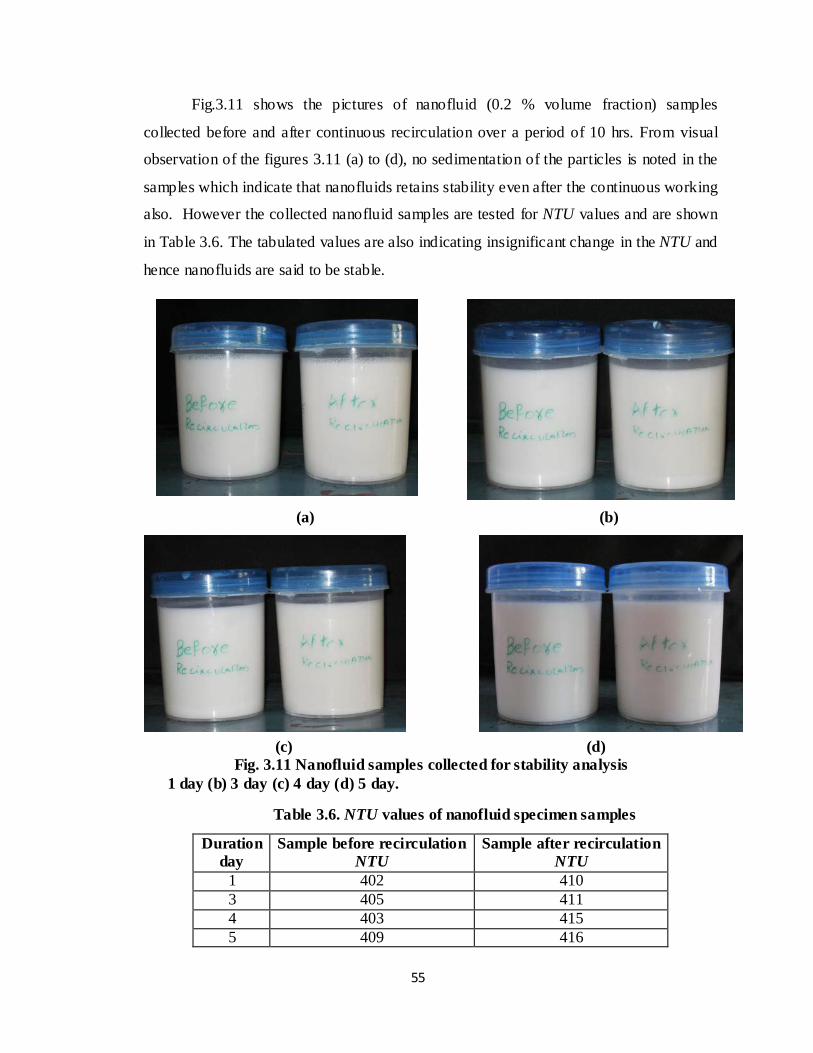
Fig.3.11 shows the pictures of nanofluid (0.2 % volume fraction) samples
collected before and after continuous recirculation over a period of 10 hrs. From visual
observation of the figures 3.11 (a) to (d), no sedimentation of the particles is noted in the
samples which indicate that nanofluids retains stability even after the continuous working
also. However the collected nanofluid samples are tested for NTU values and are shown
in Table 3.6. The tabulated values are also indicating insignificant change in the NTU and
hence nanofluids are said to be stable.
(a) (b)
(c) (d) Fig. 3.11 Nanofluid samples collected for stability analysis
1 day (b) 3 day (c) 4 day (d) 5 day.
Table 3.6. NTU values of nanofluid specimen samples
Duration day
Sample before recirculation NTU
Sample after recirculation NTU
1 402 410 3 405 411 4 403 415 5 409 416
56
3.5. SUMMARY
Nanofluids samples are prepared by dispersing Al2O3 nanoparticles in de- ionized
water with various process parameters as per design of experiments. The samples are
analyzed for optimum process parameters using Response Surface Methodology.
Nanofluid is prepared with the optimum process parameters obtained from surface plots
and testing is carried out for stability. Experimentation is carried out to measure the
properties such as Thermal conductivity, Viscosity, Specific heat and Density for the
prepared nanofluids.


![Ultrasonic preparation, stability and thermal conductivity ... · effect on thermal conductivity at different particle concentrations has been recorded [10–14] . Nanofluids containing](https://img.pdfslide.us/doc/110x75/60b98fecd489ad698b5f3b45/ultrasonic-preparation-stability-and-thermal-conductivity-effect-on-thermal.jpg)