Embed Size (px)
Citation preview
1 | Socioeconomic Report 2017
Chapter 3
Overlay of Economic Growth,
Demographic Trends, and
Physical Characteristics The PDP 2017-2022 recognizes that social and economic development occurs over a
geographic space. If development is unchecked, it can lead to over-capacity which then caps
development itself and worsens the quality of life. The National Spatial Strategy (NSS) defines
the country’s desired spatial structure and sets the direction of future growth based on trends
in population, economic activities, and services. It recognizes the increasing role of cities as
drivers and venues of economic growth and poverty reduction, and recommends sustainable
human settlements coupled with efficient and effective production and service delivery
systems.
The NSS thus seeks to address these challenges with three core strategies: (1) Regional agglomeration,
(2) Connectivity, and (3) Vulnerability reduction.
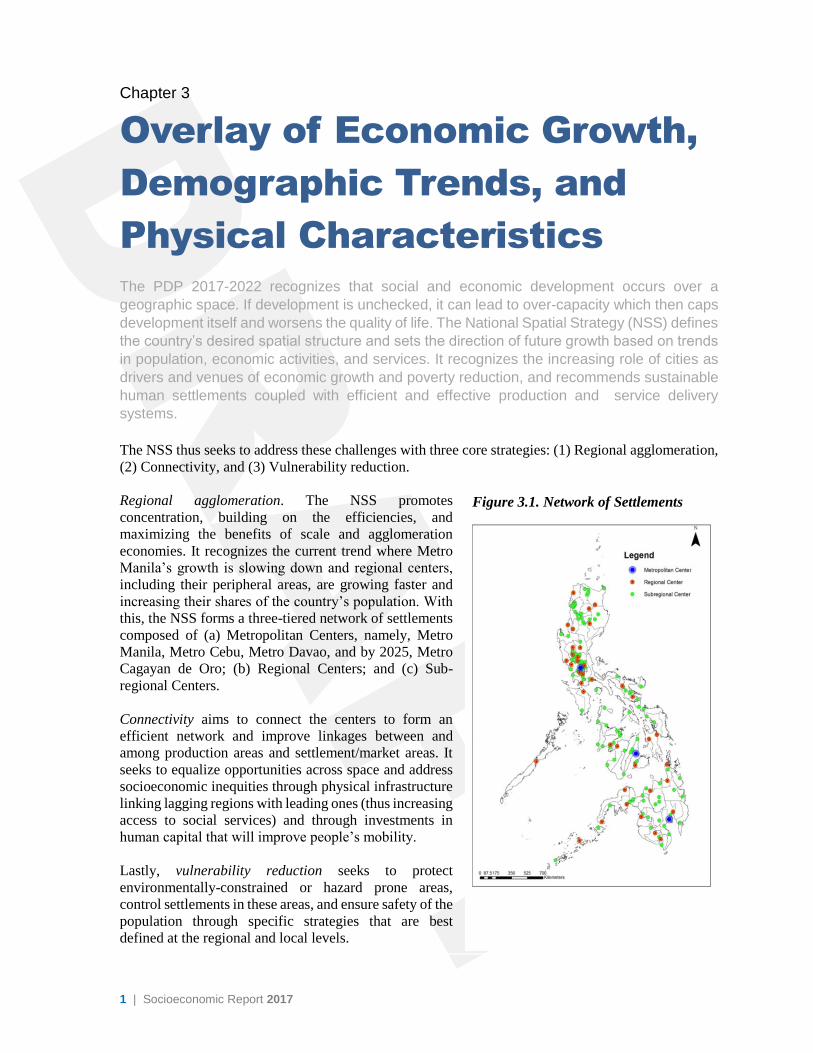
Regional agglomeration. The NSS promotes
concentration, building on the efficiencies, and
maximizing the benefits of scale and agglomeration
economies. It recognizes the current trend where Metro
Manila’s growth is slowing down and regional centers,
including their peripheral areas, are growing faster and
increasing their shares of the country’s population. With
this, the NSS forms a three-tiered network of settlements
composed of (a) Metropolitan Centers, namely, Metro
Manila, Metro Cebu, Metro Davao, and by 2025, Metro
Cagayan de Oro; (b) Regional Centers; and (c) Sub-
regional Centers.
Connectivity aims to connect the centers to form an
efficient network and improve linkages between and
among production areas and settlement/market areas. It
seeks to equalize opportunities across space and address
socioeconomic inequities through physical infrastructure
linking lagging regions with leading ones (thus increasing
access to social services) and through investments in
human capital that will improve people’s mobility.
Lastly, vulnerability reduction seeks to protect
environmentally-constrained or hazard prone areas,
control settlements in these areas, and ensure safety of the
population through specific strategies that are best
defined at the regional and local levels.
Figure SEQ Figure \* ARABIC 1 Location of Metro, Regional and Sub-Regional Centers
Figure 3.1. Network of Settlements
Chapter 3 Overlay of Economic Growth, Demographic Trends, and Physical Characteristics | 2
Accomplishments The NSS has served as guide for the Public Investment Program (PIP) 2017-2022, particularly for
infrastructure projects directed to address challenges in facilitating agglomeration and mobility and
ensuring safety and resilience.
To achieve spatial efficiency and connectivity, the government has embarked on a massive
infrastructure program, the Build, Build, Build (BBB) Program which aims to (a) improve regional
connectivity, (b) ease the cost of doing business thereby increasing the Philippines’ growth potential
and competitiveness, and (c) link production areas to growth centers through an efficient transportation
network.
The NEDA Board’s Infrastructure Committee (InfraCom) and the Investment Coordination Committee
(ICC) identified 75 high-impact infrastructure flagship projects (IFPs) as part of BBB. The NEDA
Board adopted the list on June 27, 2017. The IFP consists of projects on transportation (roads and
bridges, railways, mass transit, airports, and seaports), power, flood control, irrigation, and water
supply. Fifty-three (53) of these 75 IFPs have an estimated budget of ₱1.579 trillion.
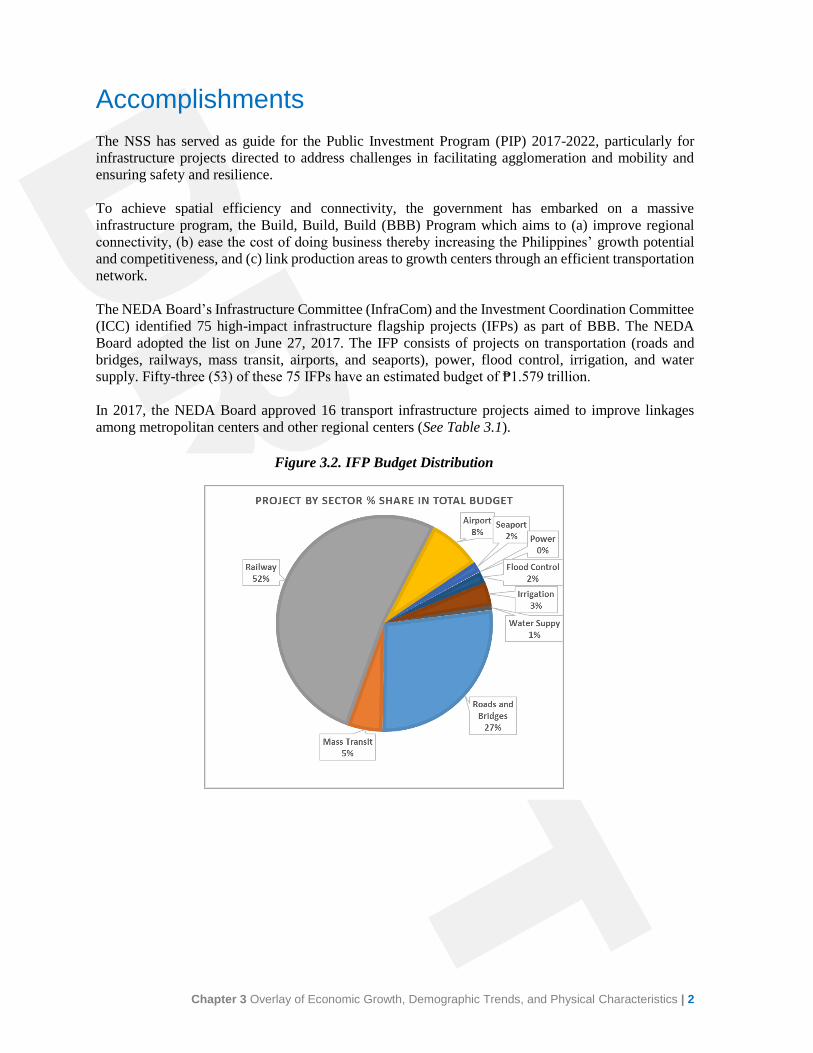
In 2017, the NEDA Board approved 16 transport infrastructure projects aimed to improve linkages
among metropolitan centers and other regional centers (See Table 3.1).
Figure 3.2. IFP Budget Distribution

3 | Socioeconomic Report 2017
Table 3.1. Approved Transport-related IFPs
Project Title Region Timeframe
1 PNR North 2 (Malolos-Clark Airport-Clark Green City Rail) NCR, III 2018-2019 2 Clark International Airport New Terminal Building Project Region III 2018-2020 3 Bonifacio Global City to Ortigas Center Road Link Project , Phase I, IIA & IIB (Sta Monica-Lawton
Bridge) NCR 2017-2020
4 MRT-LRT Common Station Project NCR 2017-TBD 5 Metro Manila BRT – Line 1 (Quezon Avenue) NCR 2018-2021 6 Metro Manila BRT – Line 2 (EDSA/Central) NCR 2018-2021 7 Iloilo Airport Region VI 2017-2025 8 New Cebu International Container Port Region VII 2017-TBD 9 New Bohol Airport Region VII 2017-2025 10 Bacolod Airport Region VI 2017-2025 11 Panguil Bay Bridge Project Region X 2017-2020 12 Laguindingan Airport Region X 2017-2025 13 Davao Airport Region XI 2017-2025 14 Mindanao Rail Project (Phase 1) – Tagum Davao Digos Segment Region XI 2018-2020 15 PNR South Commuter Line (Tutuban-Los Baños) Region IV-A, NCR 2018-2022
16 PNR Long-haul (Calamba-Bicol) Region IV-A, Region V 2018-2024
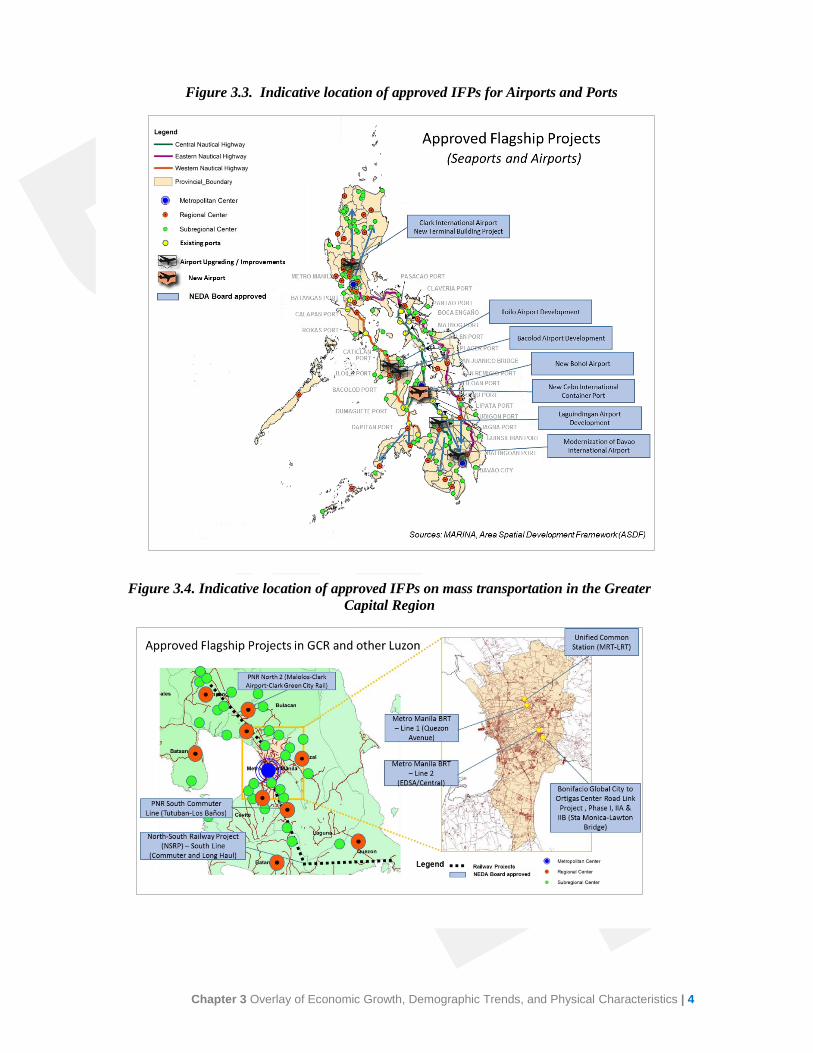
Airports and seaports. Davao International Airport will be improved by expanding the passenger
terminals and modernizing operations and management. The Laguindingan, Bacolod, and Iloilo
Airports will undergo upgrades and improvement of existing facilities to handle increasing passenger
influx. The New Bohol Airport in Panglao Island is in the final stage of construction and is set to open
in the third quarter of 2018. Using advanced Japanese technology and designed to be an “eco airport,”
this airport is situated in a 230-hectare property equipped with facilities compliant with international
standards to serve rapidly increasing passenger flow in Bohol.
The Clark International Airport Expansion Project entails construction of a new passenger terminal
building designed for eight (8) million passengers per year, with a floor area of 82,600 sqm. The
increased capacity of the Clark International Airport will help lessen congestion in the Ninoy Aquino
International Airport in Manila.
The New Cebu International Container Port will be constructed offshore on a reclaimed 25ha island in
Consolacion, Cebu – set to start in 2018 and end in 2021 under a loan package from Korea. The project
will include a 500m berth length, construction and improvement of a 1,450m inland access road, and
the construction of 300-linear meter offshore bridge connecting the port to the shoreline. It is expected
to improve logistics by reducing vessel waiting time and increasing container yard capacity (Figure 3.3
shows the indicative location of airports and sea ports IFPs).
Chapter 3 Overlay of Economic Growth, Demographic Trends, and Physical Characteristics | 4
Figure 3.3. Indicative location of approved IFPs for Airports and Ports
Figure 3.4. Indicative location of approved IFPs on mass transportation in the Greater
Capital Region
5 | Socioeconomic Report 2017
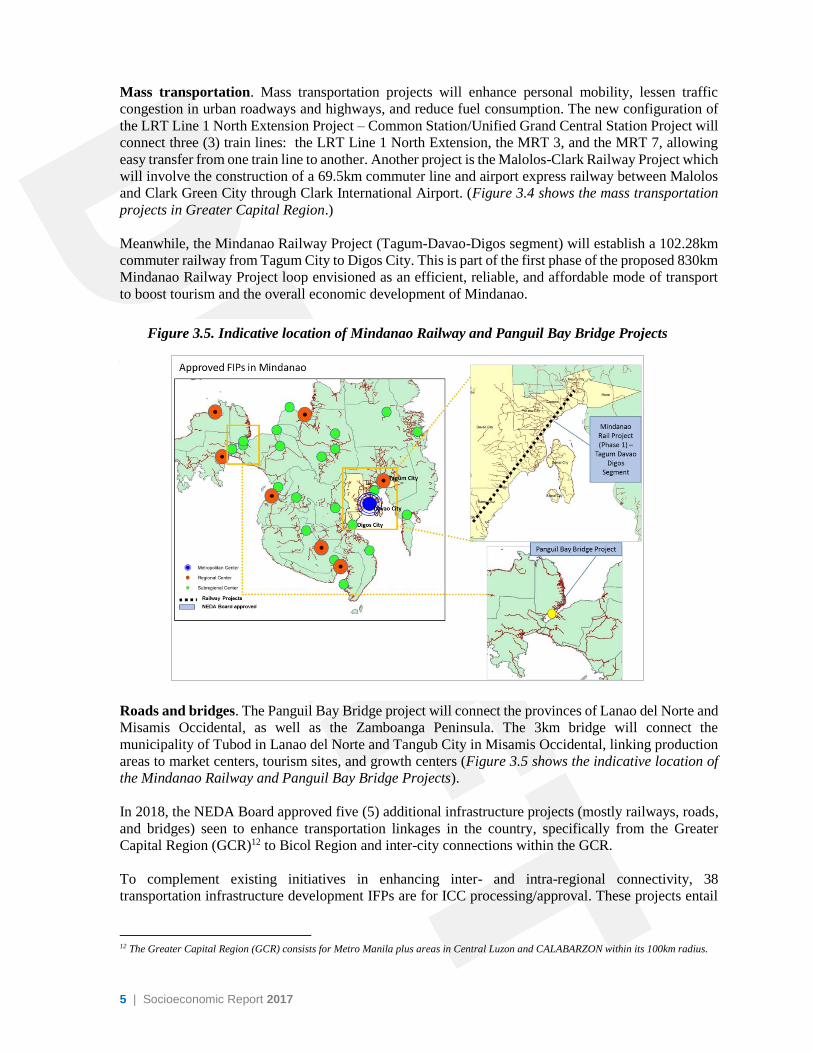
Mass transportation. Mass transportation projects will enhance personal mobility, lessen traffic
congestion in urban roadways and highways, and reduce fuel consumption. The new configuration of
the LRT Line 1 North Extension Project – Common Station/Unified Grand Central Station Project will
connect three (3) train lines: the LRT Line 1 North Extension, the MRT 3, and the MRT 7, allowing
easy transfer from one train line to another. Another project is the Malolos-Clark Railway Project which
will involve the construction of a 69.5km commuter line and airport express railway between Malolos
and Clark Green City through Clark International Airport. (Figure 3.4 shows the mass transportation
projects in Greater Capital Region.)
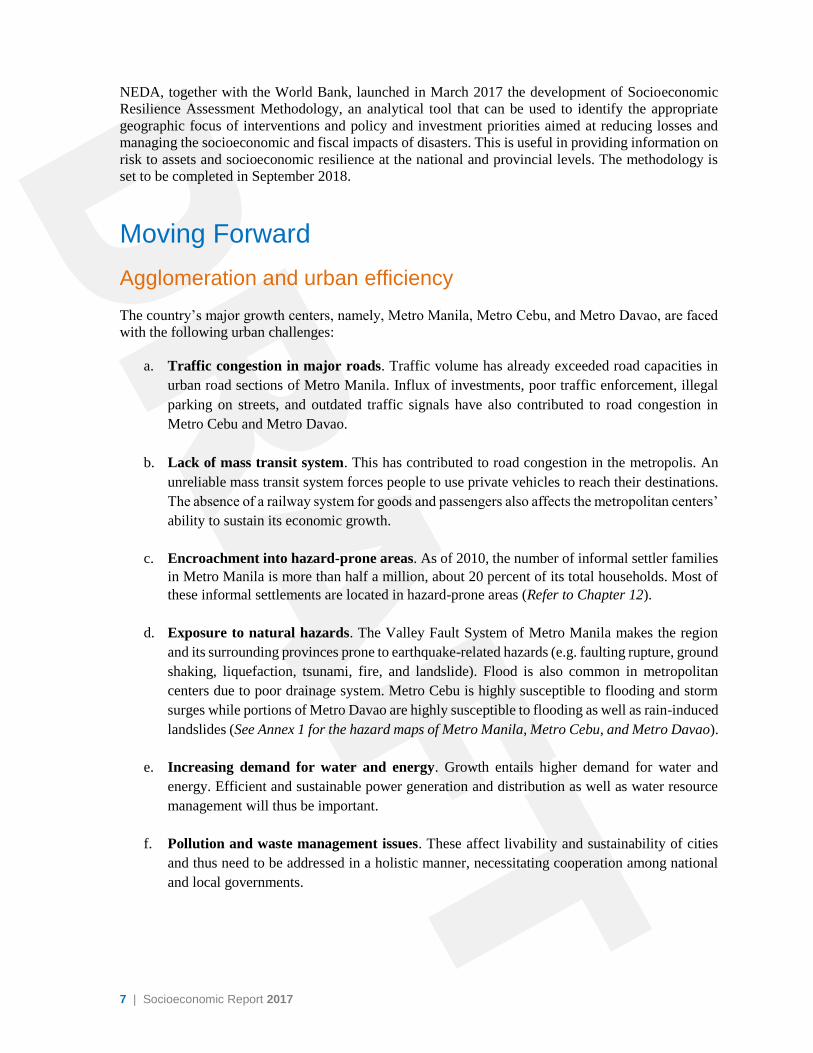
Meanwhile, the Mindanao Railway Project (Tagum-Davao-Digos segment) will establish a 102.28km
commuter railway from Tagum City to Digos City. This is part of the first phase of the proposed 830km
Mindanao Railway Project loop envisioned as an efficient, reliable, and affordable mode of transport
to boost tourism and the overall economic development of Mindanao.
Roads and bridges. The Panguil Bay Bridge project will connect the provinces of Lanao del Norte and
Misamis Occidental, as well as the Zamboanga Peninsula. The 3km bridge will connect the
municipality of Tubod in Lanao del Norte and Tangub City in Misamis Occidental, linking production
areas to market centers, tourism sites, and growth centers (Figure 3.5 shows the indicative location of
the Mindanao Railway and Panguil Bay Bridge Projects).
In 2018, the NEDA Board approved five (5) additional infrastructure projects (mostly railways, roads,
and bridges) seen to enhance transportation linkages in the country, specifically from the Greater
Capital Region (GCR)12 to Bicol Region and inter-city connections within the GCR.
To complement existing initiatives in enhancing inter- and intra-regional connectivity, 38
transportation infrastructure development IFPs are for ICC processing/approval. These projects entail
12 The Greater Capital Region (GCR) consists for Metro Manila plus areas in Central Luzon and CALABARZON within its 100km radius.
Figure 3.5. Indicative location of Mindanao Railway and Panguil Bay Bridge Projects

Chapter 3 Overlay of Economic Growth, Demographic Trends, and Physical Characteristics | 6
the construction of expressways, city and inter-island bridges, railways, mass transit, and port
development/upgrading.
Furthermore, of the 4,985 infrastructure programs and projects listed under the PIP for 2017-2022, 98
are inter-regional projects and 3,911 are region-specific projects outside of NCR. Investment
requirements for the inter-regional projects amount to ₱3.32 trillion, while the region-specific projects
outside NCR total to ₱1.164 trillion. The infrastructure projects under the PIP 2017-2022 contribute to
improving connectivity and promoting economic clusters in regional and sub-regional growth centers,
consistent with the NSS.
Flood control and other vulnerability-reduction projects. The infrastructure development program
includes specific projects for disaster risk reduction (DRR) focusing mainly on flood control. The
Cavite Industrial Area Flood Management Project has already been approved by the NEDA Board.
Other projects on vulnerability reduction are in the pipeline for submission to ICC for processing and
approval. These include the construction of dams and floodway components to address perennial
flooding in these areas while addressing other needs of the provinces in terms of power, irrigation, and
water supply (See Table 3.2).
Table 3.2. Vulnerability Reduction-related IFPs for submission to ICC
Project Title Region Timeframe
1 Aqueduct No. 7 (AQ-7) Region III, NCR TBD
2 Ipo Dam No. 3 Region III, NCR TBD
3 Improvement of remaining sections along Pasig River from Delpan Bridge to Napindan Channel NCR 2018-2020
4 Gregorio del Pilar Impounding Project Region I 2019-2023
5 Ilocos Norte Irrigation Project, Stage 2 Region I 2019-2026
6 Tumauini River Multipurpose Project Region II 2019-2021
7 Panay River Basin Integrated Development Project Region VI 2018-2025
8 Bohol Northeast Basin Multipurpose Project Region VII 2019-2023
9 Balo-i Plains Flood Control Project Region X 2020-2023
10 Asbang Small Reservoir Irrigation Project Region XI 2019-2025
11 Ambal Simuay Sub-Basin of the Mindanao River Basin Flood Control and River Protection Project Region XII 2018-2023
In addition, the Metro Manila Flood Control Project, a joint project of the Department of Public Works
and Highways and Metro Manila Development Authority with assistance from the World Bank, is set
to start in 2018. This will include the rehabilitation of 36 existing pumping stations and construction of
20 new pumping stations in Metro Manila.
Further, the Cabinet Cluster for Climate Change Adaptation and Mitigation and Disaster Risk
Reduction13, with the Presidential Management Staff as lead, started discussions on the formulation of
an implementation plan for “Disaster-Resiliency Measures for Metro Manila and its Surrounding
Areas.” The proposed plan will indicate programs, activities, and projects to be implemented by various
government agencies to reduce the risks and enhance the resilience of Metro Manila and its surrounding
provinces in preparation for an earthquake with a magnitude of at least 7.2 (the “Big One”).
13 Presidential Management Staff, Office of the Executive Secretary, HUDCC, DBM, NEDA, DFA, DICT, DOF, DOST, DILG, DPWH,
DSWD, DA, DAR, DOE, DND, MMDA, Presidential Communications Operations Office, Presidential Legislative Liaison Office, and
National Security Council
7 | Socioeconomic Report 2017
NEDA, together with the World Bank, launched in March 2017 the development of Socioeconomic
Resilience Assessment Methodology, an analytical tool that can be used to identify the appropriate
geographic focus of interventions and policy and investment priorities aimed at reducing losses and
managing the socioeconomic and fiscal impacts of disasters. This is useful in providing information on
risk to assets and socioeconomic resilience at the national and provincial levels. The methodology is
set to be completed in September 2018.
Moving Forward
Agglomeration and urban efficiency
The country’s major growth centers, namely, Metro Manila, Metro Cebu, and Metro Davao, are faced
with the following urban challenges:
a. Traffic congestion in major roads. Traffic volume has already exceeded road capacities in
urban road sections of Metro Manila. Influx of investments, poor traffic enforcement, illegal
parking on streets, and outdated traffic signals have also contributed to road congestion in
Metro Cebu and Metro Davao.
b. Lack of mass transit system. This has contributed to road congestion in the metropolis. An
unreliable mass transit system forces people to use private vehicles to reach their destinations.
The absence of a railway system for goods and passengers also affects the metropolitan centers’
ability to sustain its economic growth.
c. Encroachment into hazard-prone areas. As of 2010, the number of informal settler families
in Metro Manila is more than half a million, about 20 percent of its total households. Most of
these informal settlements are located in hazard-prone areas (Refer to Chapter 12).
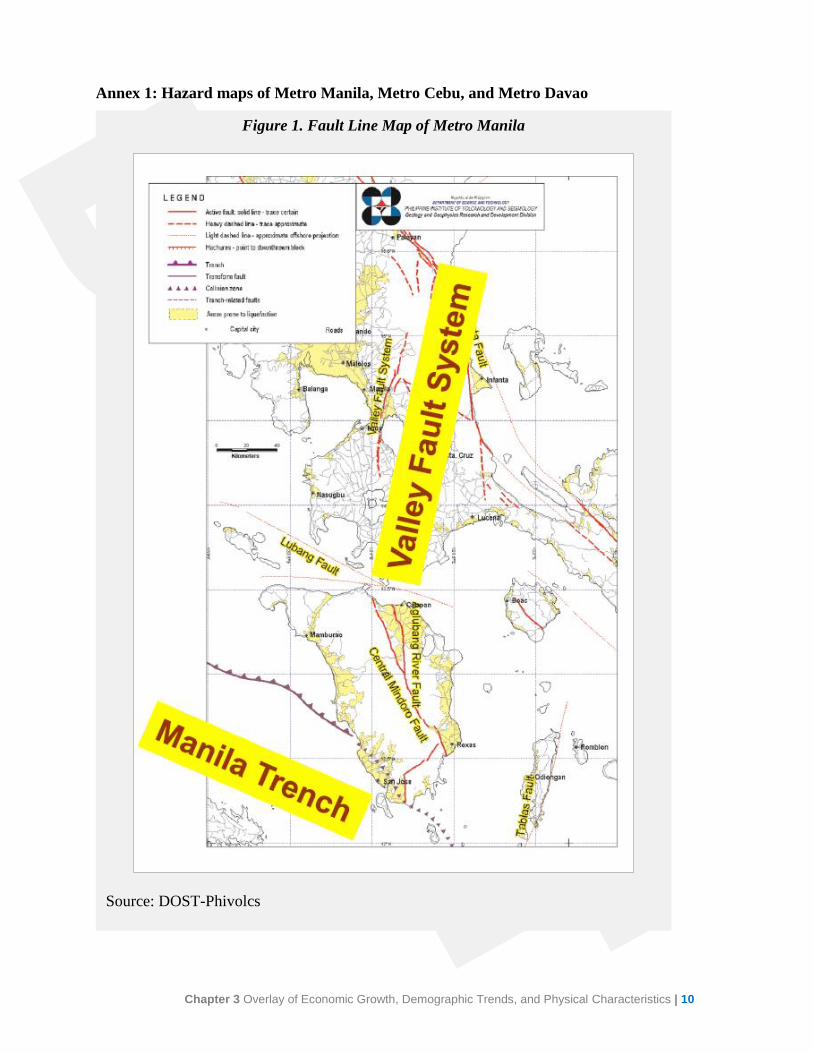
d. Exposure to natural hazards. The Valley Fault System of Metro Manila makes the region
and its surrounding provinces prone to earthquake-related hazards (e.g. faulting rupture, ground
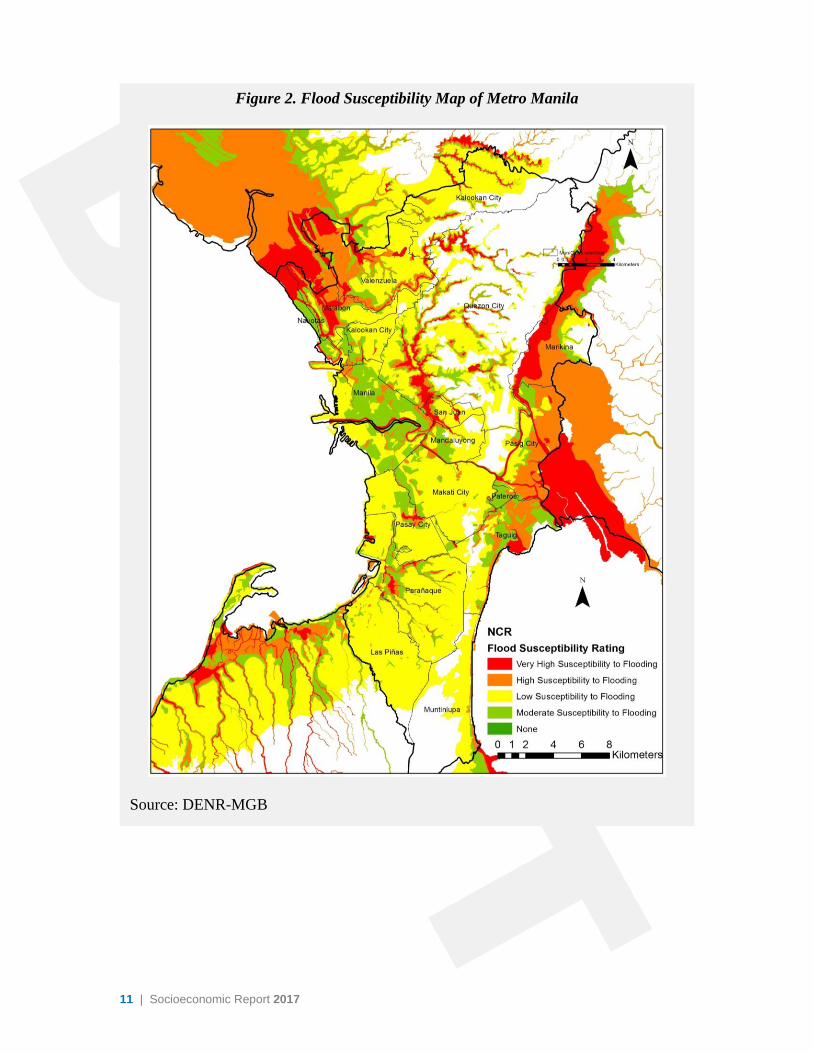
shaking, liquefaction, tsunami, fire, and landslide). Flood is also common in metropolitan
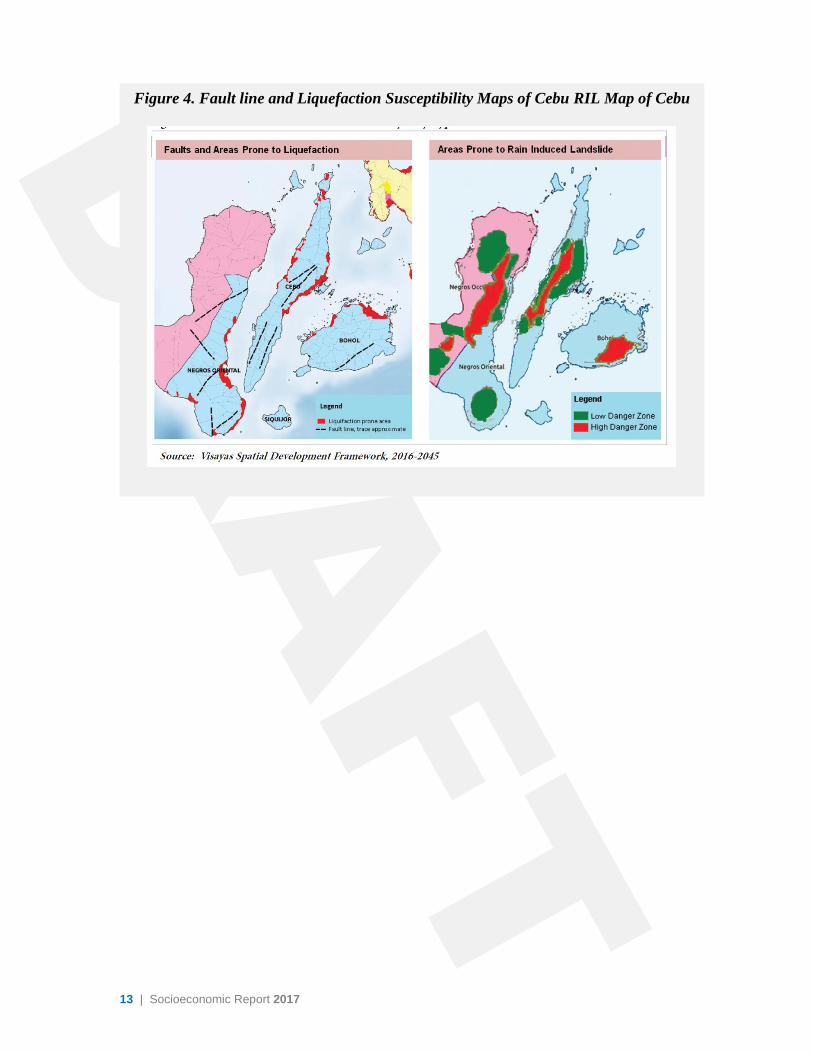
centers due to poor drainage system. Metro Cebu is highly susceptible to flooding and storm
surges while portions of Metro Davao are highly susceptible to flooding as well as rain-induced
landslides (See Annex 1 for the hazard maps of Metro Manila, Metro Cebu, and Metro Davao).
e. Increasing demand for water and energy. Growth entails higher demand for water and
energy. Efficient and sustainable power generation and distribution as well as water resource
management will thus be important.
f. Pollution and waste management issues. These affect livability and sustainability of cities
and thus need to be addressed in a holistic manner, necessitating cooperation among national
and local governments.
Chapter 3 Overlay of Economic Growth, Demographic Trends, and Physical Characteristics | 8
These challenges reduce the efficiency of cities to be engines of growth, and therefore need to be
addressed in a sustainable manner. Considering that these cities are already built-up, the solutions will
require “out-of-the-box” thinking. For instance, the solution to traffic congestion and the lack of
transport may not be more roads, but ample provision for walking; telecommuting may also be
encouraged. Relocating the national government center is another option worth considering. There are
several bills filed in Congress, each one specifying a different location. At the same time, a handful of
government agencies have taken the initiative to relocate outside Metro Manila. If a decision is not
made soon, this may result in redundant expenses, if not, a central government with offices located in
various places, leading to inefficiencies in the delivery of public goods and services.
Regional connectivity The GCR, given its contribution to the country’s gross domestic product (GDP), is seen to continue its
role as the political and financial capital of the Philippines. This does not mean, however, that economic
activities will only be concentrated in the region. While most infrastructure projects in the GCR aim to
ease traffic congestion and enhance access to and from the regions, infrastructure in metropolitan and
regional growth centers outside the GCR will also be developed to boost the economic development in
the regions. This will be achievable with the complementation of the IFPs and infrastructure projects
under the PIP 2017-2022.
To foster the enhancement of inter- and intra-regional connectivity in the country, the following are
recommended:
a. Fast-track implementation of approved infrastructure projects by addressing bottlenecks in the
implementation process which include the contracting of capable consultants/project teams,
procurement issues, and simplification of approval process and requirements.
b. Promote projects that enhance linkages between production areas to market centers.
c. Construct new local roads for road network redundancy which allows the creation of alternative
routes to increase accessibility between localities for trade and tourism and disaster response
and evacuation.
d. Further encourage public-private partnerships in implementation or operation and maintenance
(O&M) of projects.
Vulnerability reduction While other areas are exposed to natural hazards and are prone to disasters, vulnerability reduction
measures are necessarily focused on Metro Manila because of the concentration of establishments and
settlements in the national capital, exacerbated by uncontrolled and inefficient development and
encroachment into hazard-prone areas. Based on the 2004 Metro Manila Earthquake Impact Reduction
Study (MMIERS) and the Greater Metro Manila Area Risk Analysis Project, a 7.2 magnitude
earthquake in Metro Manila could injure 100,000 people, kill 34,000 people, and result in about ₱2.269
trillion in economic losses. Hence, losses in property, income, and fatalities during disasters will have
a substantial effect not just in Metro Manila, but also in the country given the significant share of Metro
Manila to GDP.

9 | Socioeconomic Report 2017
Very few DRR projects are approved at the national level because DRR strategies are best formulated
at the regional and local levels. This ensures that hazards are properly delineated on the ground and
programs and projects are appropriately identified and prioritized. However, big-ticket projects that
address inter-regional concerns such as dams, nationwide early warning system, and hazard and risk
mapping may be implemented at the national level due to high cost and impact of the projects.
To further reduce vulnerability, the following are recommended:
a. Complete the probabilistic hazard mapping and vulnerability and risk assessment for all areas
in the country. Risk assessment will help prioritize areas for intervention. Probabilistic mapping
and assessment should also include delineating on the ground and identification of exposed
elements and their adaptive capacities.
Information and education campaign for local government units on using the maps and
conducting risk assessment for planning and other DRR-related activities are equally important.
This will also be used as a basis for identifying appropriate programs and projects to address
the risks, as well as the appropriate level of governance these projects are best implemented.
b. Conduct Carrying Capacity Study for metropolitan centers to help guide local chief executives
and planners in determining the centers’ population and ecological limits. With this knowledge,
location and design of infrastructure and settlements can be adjusted to ensure ecological
soundness.
c. Improve the vertical integration and enforcement of the physical and land use plans. This will
ensure the harmonized and complementing efforts in all levels of governance. The strategies
on vulnerability reduction may also be incorporated in sectoral plans to ensure the safety and
resiliency of communities. The enforcement of plans should determine the appropriate land use
activities in the identified hazard-prone area and also include penalties and/or incentives.
Chapter 3 Overlay of Economic Growth, Demographic Trends, and Physical Characteristics | 10
Annex 1: Hazard maps of Metro Manila, Metro Cebu, and Metro Davao
Figure 1. Fault Line Map of Metro Manila
Source: DOST-Phivolcs
11 | Socioeconomic Report 2017
Figure 2. Flood Susceptibility Map of Metro Manila
Source: DENR-MGB

Chapter 3 Overlay of Economic Growth, Demographic Trends, and Physical Characteristics | 12
Figure 3. Landslide Susceptibility Map of Metro Manila
Source: DENR-MGB
13 | Socioeconomic Report 2017
Figure 4. Fault line and Liquefaction Susceptibility Maps of Cebu RIL Map of Cebu

Chapter 3 Overlay of Economic Growth, Demographic Trends, and Physical Characteristics | 14
Figure 5: Multi-hazard map of Davao