Embed Size (px)
Citation preview

Chapter 3: Neurons and Perception

Synaptic Transmission of Neural Impulses
• Neurotransmitters are:
– Released by the presynaptic neuron from vesicles
– Received by the postsynaptic neuron on receptor sites
– Matched like a key to a lock into specific receptor sites
– Used as triggers for voltage change in the postsynaptic neuron

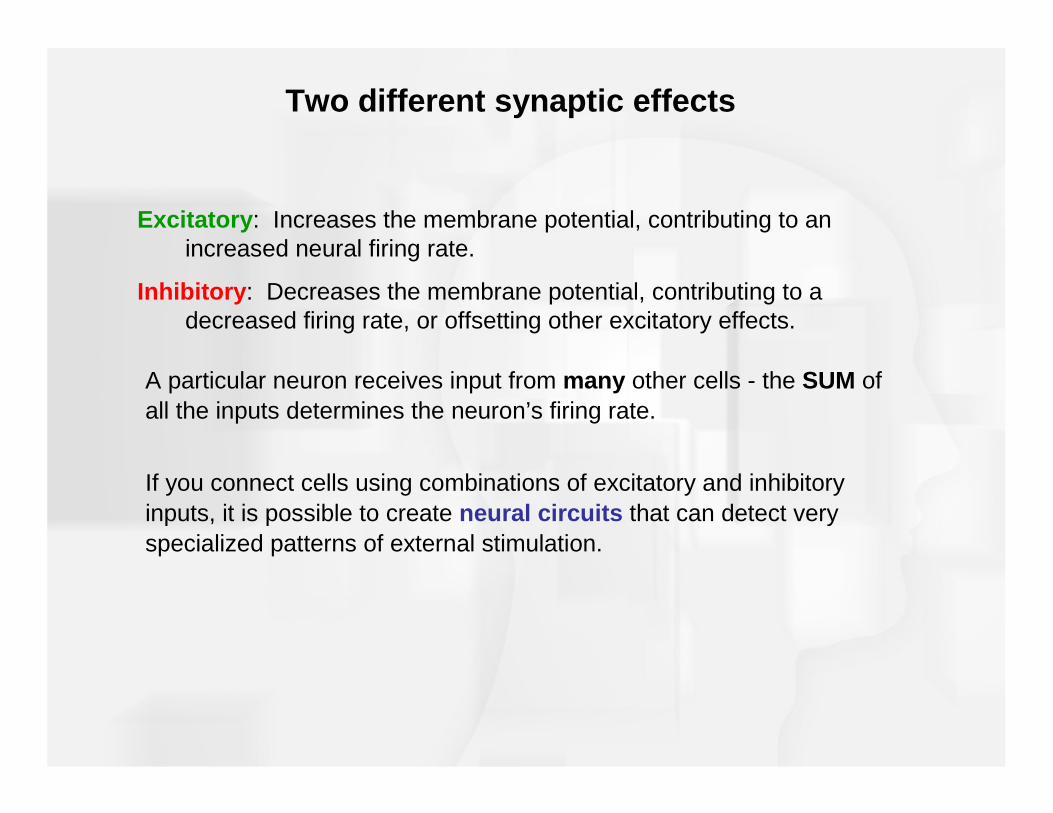
Excitatory: Increases the membrane potential, contributing to an increased neural firing rate.
Inhibitory: Decreases the membrane potential, contributing to a decreased firing rate, or offsetting other excitatory effects.
A particular neuron receives input from many other cells - the SUM of all the inputs determines the neuron’s firing rate.
If you connect cells using combinations of excitatory and inhibitory inputs, it is possible to create neural circuits that can detect very specialized patterns of external stimulation.
Two different synaptic effects

Types of Neurotransmitters
• Excitatory transmitters - cause depolarization– Neuron becomes more positive
– Increases the likelihood of an action potential
• Inhibitory transmitters - cause hyperpolarization– Neuron becomes more negative
– Decreases the likelihood of an action potential

Convergence in the Retina
• Rods and cones send signals vertically through– Bipolar cells– Ganglion cells– Ganglion axons
• Signals are sent horizontally by– Horizontal cells– Amacrine cells
Convergence in the Retina - continued
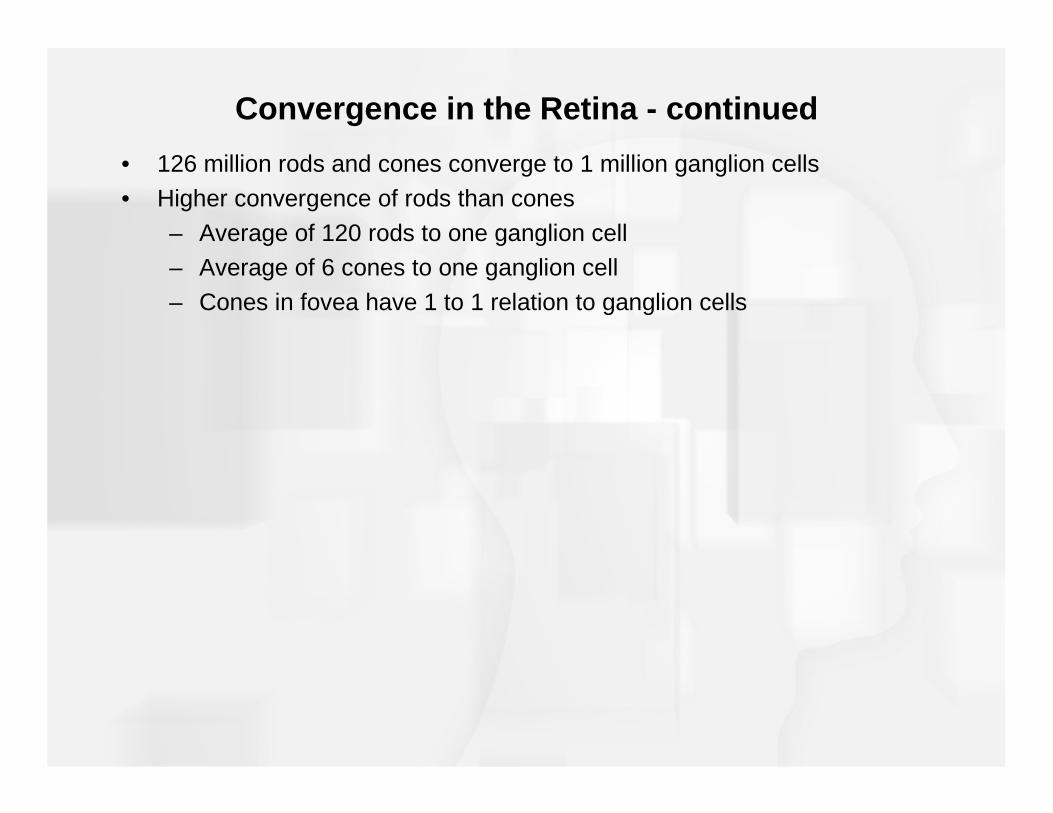
• 126 million rods and cones converge to 1 million ganglion cells
• Higher convergence of rods than cones
– Average of 120 rods to one ganglion cell– Average of 6 cones to one ganglion cell
– Cones in fovea have 1 to 1 relation to ganglion cells
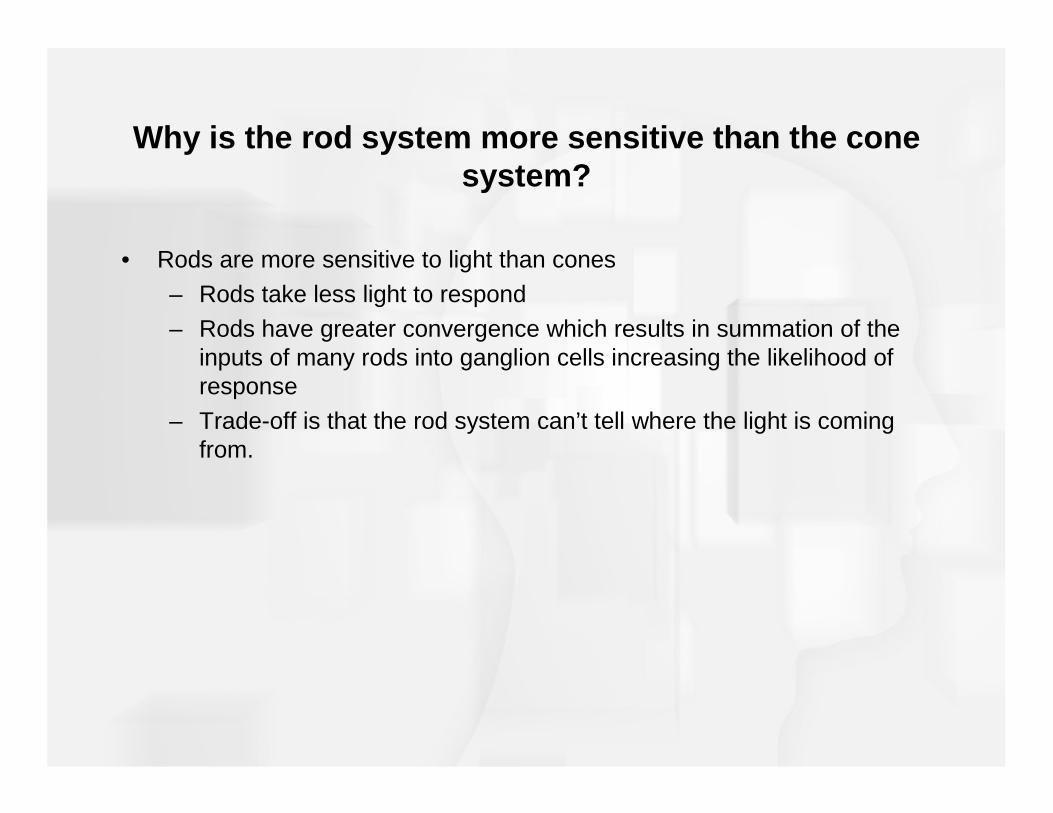
Why is the rod system more sensitive than the cone system?
• Rods are more sensitive to light than cones
– Rods take less light to respond
– Rods have greater convergence which results in summation of the inputs of many rods into ganglion cells increasing the likelihood of response
– Trade-off is that the rod system can’t tell where the light is coming from.

Figure 3.2 The wiring of the rods (left) and the cones (right). The spot and arrow above each receptor represents light that stimulates the receptor. The numbers represent the number of response units generated by the rods and the cones in response to a spot of intensity of 2.0.

Convergence and Detail
• All-cone foveal vision results in high visual acuity– One-to-one wiring leads
to ability to discriminate details
– Trade-off is that cones need more light to respond than rods

Lateral Inhibition of Neurons
• Experiments with eye of Limulus
– Ommatidia allow recordings from a single receptor
– Light shown into a single receptor led to rapid firing rate of nerve fiber– Adding light into neighboring receptors led to reduced firing rate of
initial nerve fiber

1
1.00
0
-1.00
1
Light
Excitation/Inhibition
Response
1x1 + 0x(-1) = 1
Lateral Inhibition

Lateral Inhibition
1
1.00
1
-1.00
0
Light
Excitation/Inhibition
Response
1x1 + 1x(-1) = 0

Lateral Inhibition
0
-0.25
1
1.00
0
-0.25
1
Light
Excitation/Inhibition
Response
0x(-.25) + 1x1 + 0x(-.25) = 1

Lateral Inhibition
Light
Excitation/Inhibition
Response
1x(-.25) + 1x1 + 1x(-.25) = .5
1
-0.25
1
1.00
1
-0.25
0.5

Lateral Inhibition and Lightness Perception
• Three lightness perception phenomena explained by lateral inhibition
– Mach Bands: Seeing borders more sharply
– Simultaneous Contrast: Seeing areas of different brightness due to adjacent areas
– The Hermann Grid: Seeing spots at an intersection
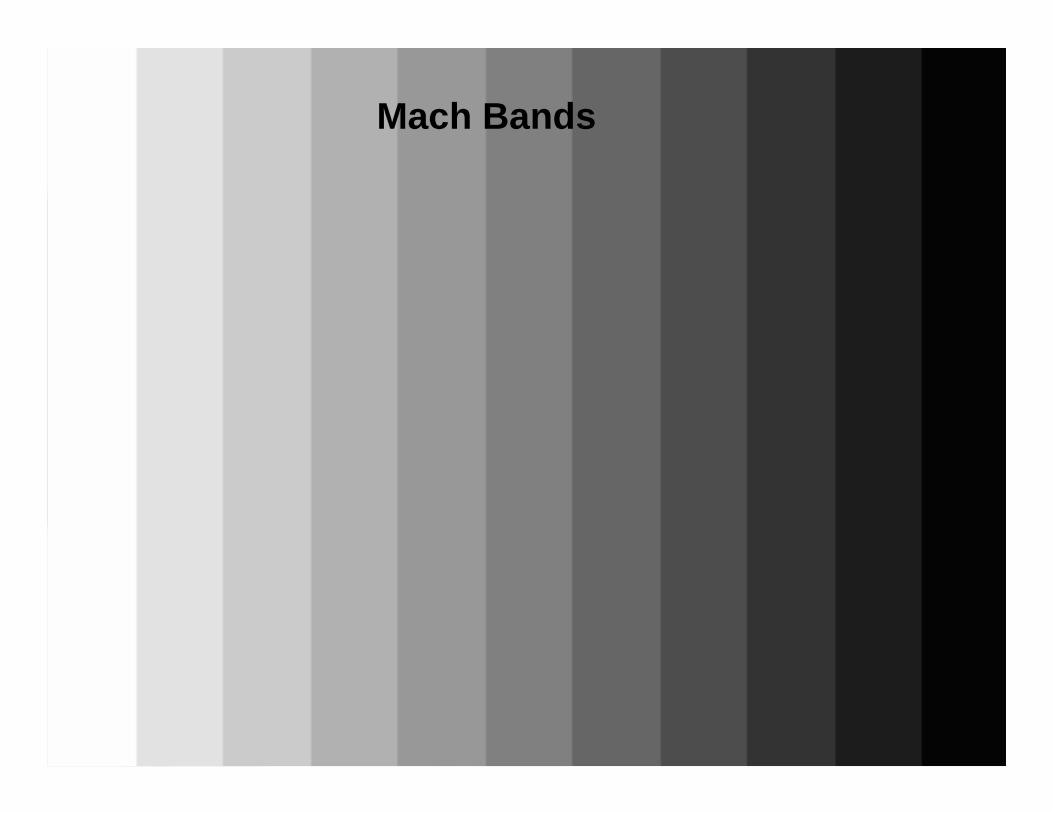
Mach Bands

Mach Bands

1
-0.25
1
1.00
1
-0.25
0.5
0.5 0.5 0.5
0
0.2
0.4
0.6
Mach Bands

1 1 1 0.5 0.5 0.5
-0.25 1.00 -0.25
0.63
0
0.2
0.4
0.6
Mach Bands

-0.25 1.00 -0.25
0.13
1 1 1 0.5 0.5 0.5
0
0.2
0.4
0.6
Mach Bands
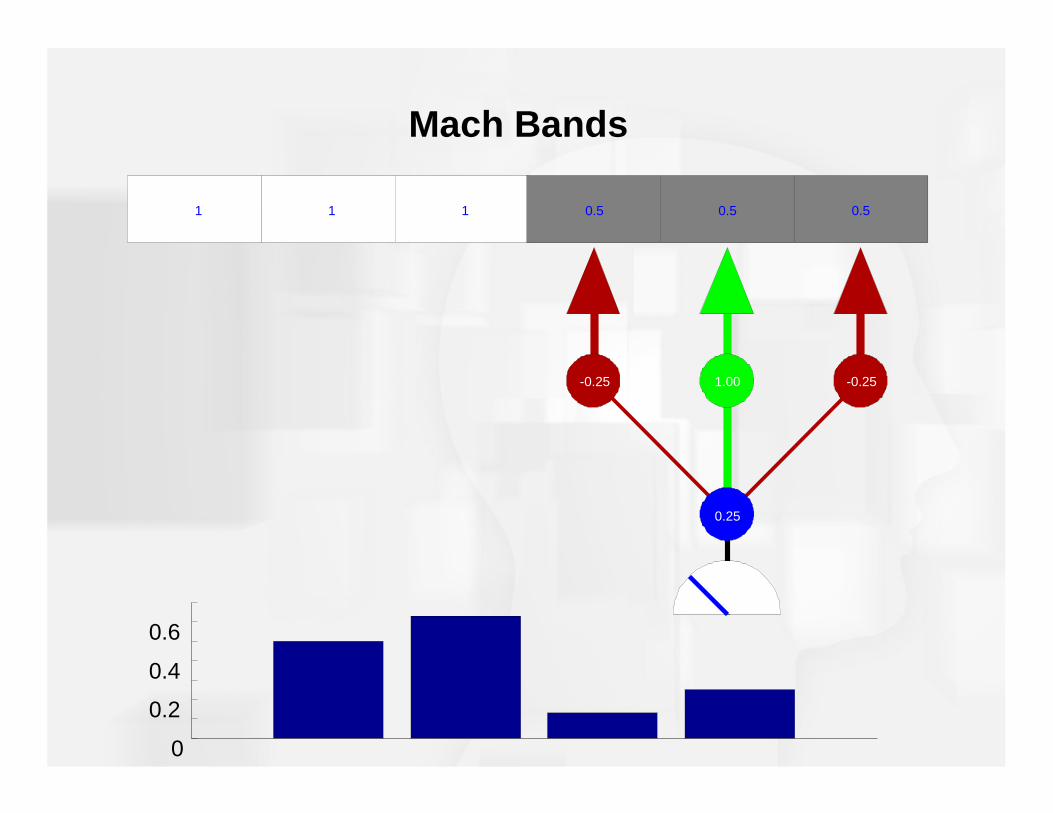
-0.25 1.00 -0.25
0.25
1 1 1 0.5 0.5 0.5
0
0.2
0.4
0.6
Mach Bands

Simultaneous Contrast
• People see an illusion of changed brightness or color due to effect of adjacent area– An area that is of the same physical intensity appears:
• Lighter when surrounded by a dark area
• Darker when surrounded by a light area

Simultaneous Contrast
– Receptors stimulated by bright surrounding area send a large amount of inhibition to cells in center
– Resulting perception is of a darker area than when this stimulus is viewed alone
– Receptors stimulated by dark surrounding area send a small amount of inhibition to cells in center
– Resulting perception is of a lighter area than when this stimulus viewed alone
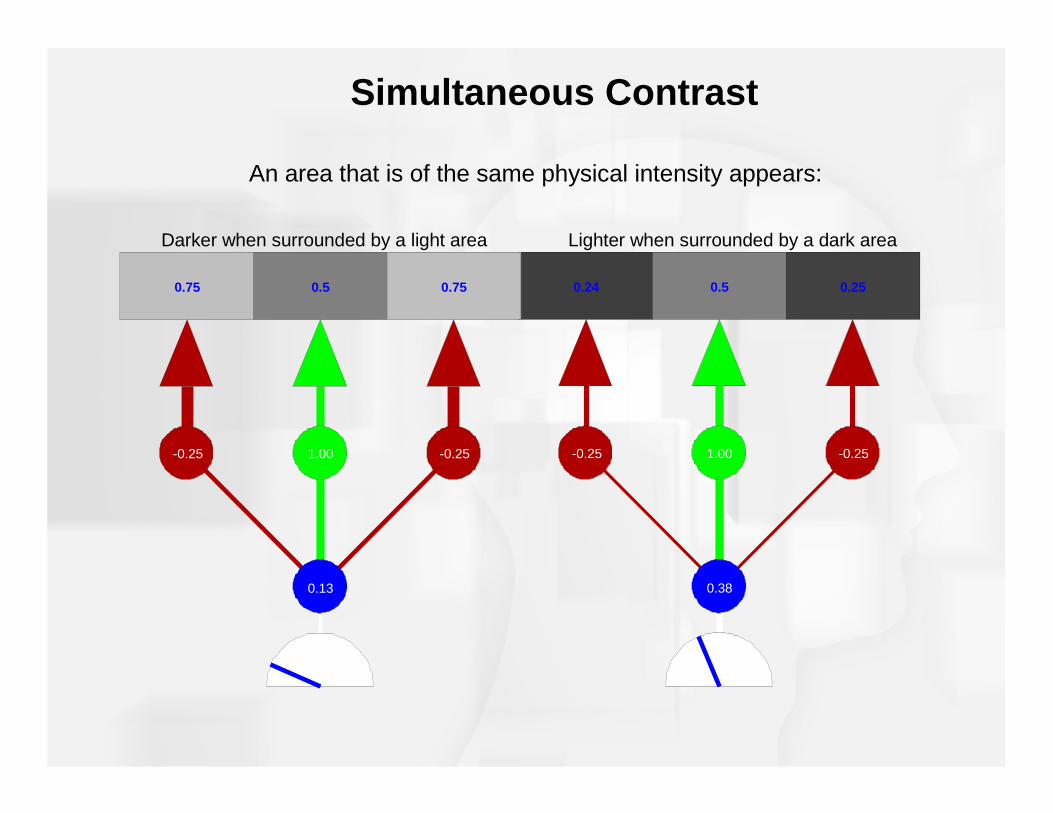
0.24
-0.25
0.5
1.00
0.25
-0.25
0.38
0.75
-0.25
0.5
1.00
0.75
-0.25
0.13
Simultaneous Contrast
An area that is of the same physical intensity appears:
Lighter when surrounded by a dark areaDarker when surrounded by a light area

The Hermann Grid

Hermann Grid
• People see an illusion of gray images in intersections of white areas• Signals from bipolar cells cause effect
– Receptors stimulated by dark areas inhibit the response of neighboring cells receiving input from white area
– The lateral inhibition causes a reduced response which leads to the perception of gray
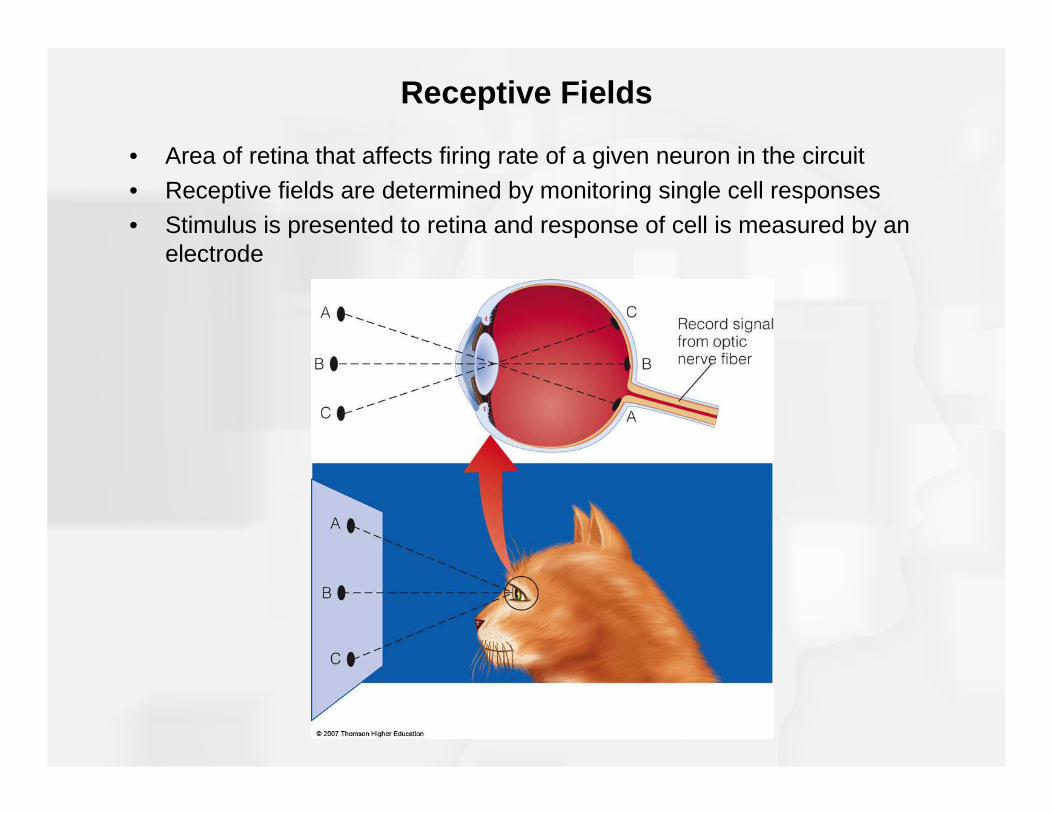
Receptive Fields
• Area of retina that affects firing rate of a given neuron in the circuit
• Receptive fields are determined by monitoring single cell responses
• Stimulus is presented to retina and response of cell is measured by an electrode
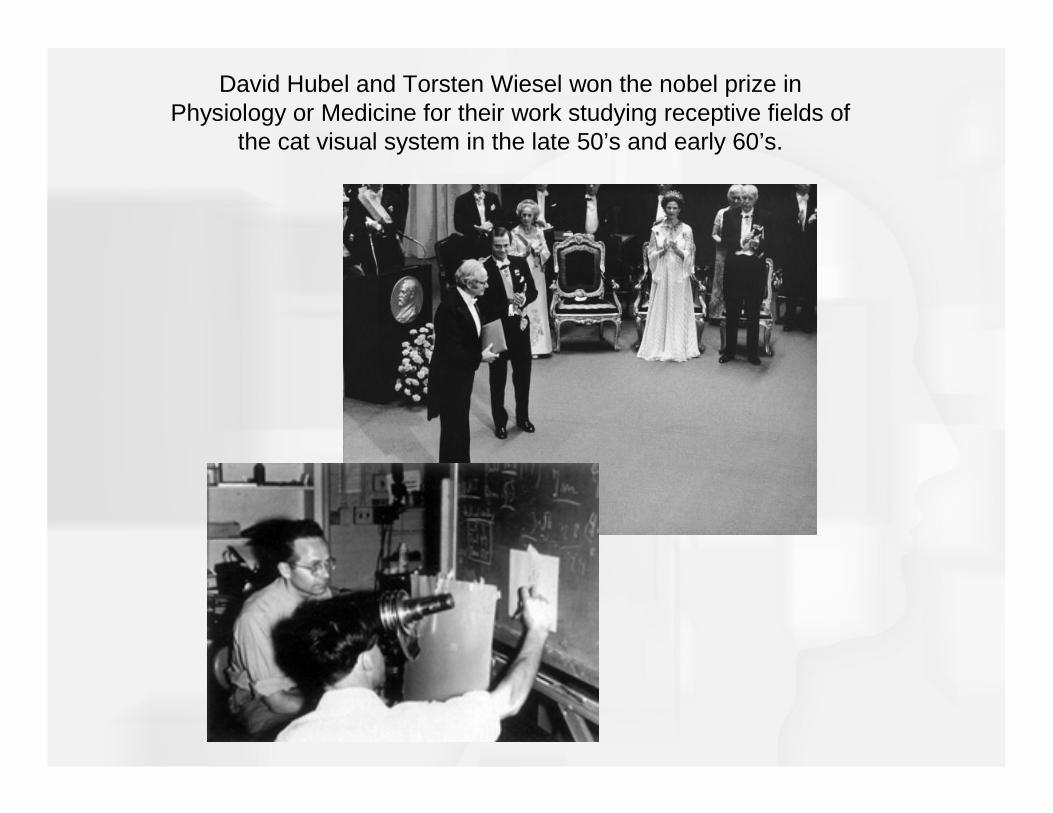
David Hubel and Torsten Wiesel won the nobel prize in Physiology or Medicine for their work studying receptive fields of
the cat visual system in the late 50’s and early 60’s.

Hubel and Wiesel's recording of an ‘on centered’ cat ganglion cell.


![ALLISON HUBEL, PH.D. Education · 2020-03-11 · Allison Hubel 3 [12] Hubel A, Stroncek D, Whitley CB, Pan D, and McCullough J. “Mobilization and transduction of peripheral blood](https://img.pdfslide.us/doc/110x75/5f82edf2a3c93513b0643e56/allison-hubel-phd-education-2020-03-11-allison-hubel-3-12-hubel-a-stroncek.jpg)