Embed Size (px)
Citation preview

Chapter – 3
Mysore District a Profile

36
CHAPTER – III
A PROFILE OF THE STUDY AREA: MYSORE DISTRICT
3.1 Introduction
In the last two chapters, the problem of study, the objectives, the research
questions and the organization of the thesis (Chapter I) and a review and appraisal of
relevant literature for the study, setting down the broadest backgrounds under which
quality of life has been investigated in various countries, including India have been
accomplished. The purpose of this chapter is to provide a profile of the study area, which
is the district of Mysore in Karnataka. Although our concern in the study is that of quality
of life of people in rural Mysore district, this chapter provides for a generic geographical
profile, considering two major aspects, namely, the natural environment and the human
environment of the district. All through, and wherever possible, there will be a contrast of
rural and urban Mysore district in the discussion that follows in the chapter.
Mysore District is located in the southern part of the Deccan Peninsula and it
forms the southernmost district of Karnataka State of the Indian Union. Prior to 1973,
Mysore was the name by which the State of Karnataka was known. Mysore city is
now the headquarters of the district and the revenue division of the same name. It is
known as one of the garden cities of India. It is also known throughout the world for
the pomp and gaiety of its traditional 10-day Dasara festival. In the days of Haider
Ali and Tipu Sultan also, it came to limelight, internationally, as the two fought the
English who ruled the country under the British Raj.
3.2 Location of the Study Area
The district lies between 11o 30’ N and 12o 50’ N Latitudes and 75o 45’ E and
77o 45’ E Longitudes (Figure 3.1). It is bounded on the north by Hassan, Mandya and
Bangalore districts; and on the south by Chamarajanagara district (from 1997) and
Kannur district of Kerala State. On the east also, it is bounded by Chamarajanagara
district and on the west by Kodagu district, besides Wyanad district of Kerala State.
Physiographically, the region in which the district is located may be classified as
partly maidan (plains) and partly semi-maidan of the Mysore plateau.

37
Karnataka State
Map – 3.1 : Location of Mysore district in Karnataka State
Mysore district is described as an undulating tableland, fertile and well
watered by the perennial rivers, whose waters are dammed by anicuts enriching their
banks by means of canals. Here and there, granite rocks rise from the plains, which is
otherwise un-intermittent and wooded.
3.3 Historical and Administrative Setting
The total geographical area of the district is 6,854 km2. It is the sixth in rank
among the districts in the State in size. Some of the places belonging to Mysore
district are of great antiquity. Thirumukudalu Narasipura - T.N. Pura, for short - and
Hemmige, for example, are the prehistorical sites. The district is mainly drained by
the Cauvery River, besides the Kabini and the Lakshmanathirtha, the two prominent
tributaries of the Cauvery. Irrigation by canals is a characteristic feature of the district.
The climate is moderate throughout the year and the district is generally free from
occurrences of earthquakes. The district is the second richest district in forest wealth
in the State, next only to Uttara Kannada. Landholdings in the district are
characterized by the predominance of small holdings. The climatic conditions of the
district are congenial for the development of horticultural crops. The livestock wealth
of the district is considerable and progress has been evidenced in the development of
poultry rearing, dairying and inland pisci-culture. Industrially, it stands fourth in the
number of factories and third in the labour force and the district is not however well-
Mysore District
38
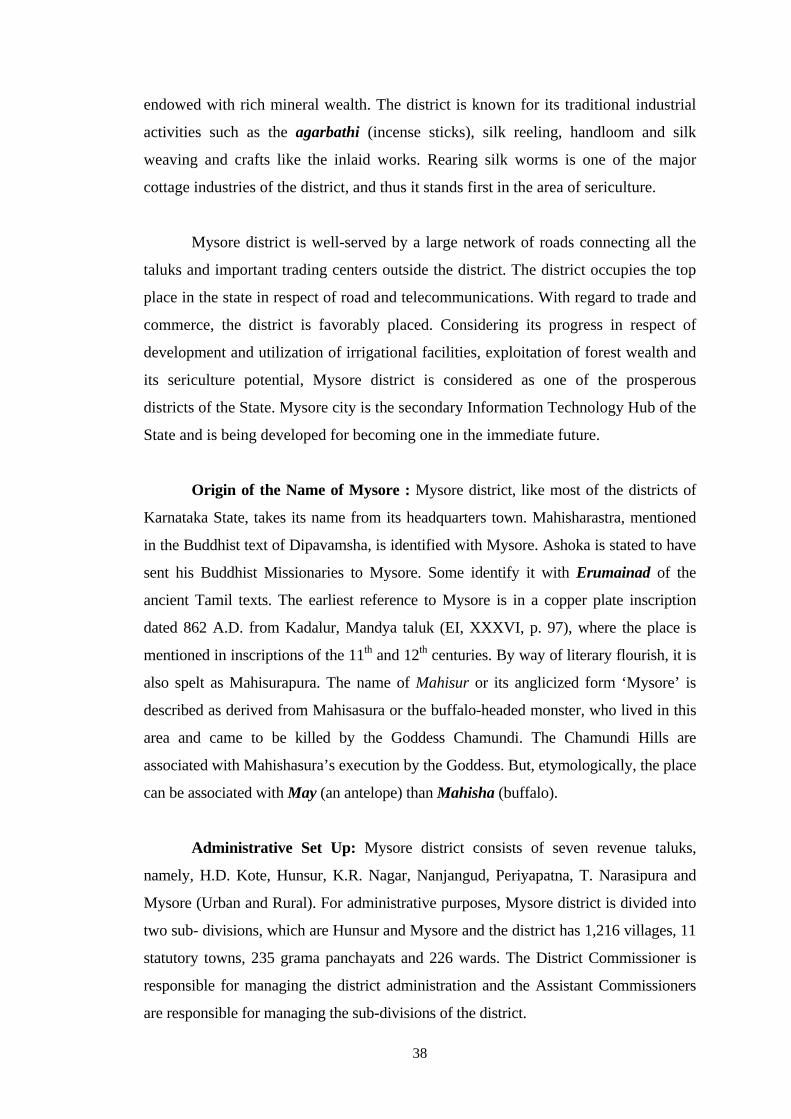
endowed with rich mineral wealth. The district is known for its traditional industrial
activities such as the agarbathi (incense sticks), silk reeling, handloom and silk
weaving and crafts like the inlaid works. Rearing silk worms is one of the major
cottage industries of the district, and thus it stands first in the area of sericulture.
Mysore district is well-served by a large network of roads connecting all the
taluks and important trading centers outside the district. The district occupies the top
place in the state in respect of road and telecommunications. With regard to trade and
commerce, the district is favorably placed. Considering its progress in respect of
development and utilization of irrigational facilities, exploitation of forest wealth and
its sericulture potential, Mysore district is considered as one of the prosperous
districts of the State. Mysore city is the secondary Information Technology Hub of the
State and is being developed for becoming one in the immediate future.
Origin of the Name of Mysore : Mysore district, like most of the districts of
Karnataka State, takes its name from its headquarters town. Mahisharastra, mentioned
in the Buddhist text of Dipavamsha, is identified with Mysore. Ashoka is stated to have
sent his Buddhist Missionaries to Mysore. Some identify it with Erumainad of the
ancient Tamil texts. The earliest reference to Mysore is in a copper plate inscription
dated 862 A.D. from Kadalur, Mandya taluk (EI, XXXVI, p. 97), where the place is
mentioned in inscriptions of the 11th and 12th centuries. By way of literary flourish, it is
also spelt as Mahisurapura. The name of Mahisur or its anglicized form ‘Mysore’ is
described as derived from Mahisasura or the buffalo-headed monster, who lived in this
area and came to be killed by the Goddess Chamundi. The Chamundi Hills are
associated with Mahishasura’s execution by the Goddess. But, etymologically, the place
can be associated with May (an antelope) than Mahisha (buffalo).
Administrative Set Up: Mysore district consists of seven revenue taluks,
namely, H.D. Kote, Hunsur, K.R. Nagar, Nanjangud, Periyapatna, T. Narasipura and
Mysore (Urban and Rural). For administrative purposes, Mysore district is divided into
two sub- divisions, which are Hunsur and Mysore and the district has 1,216 villages, 11
statutory towns, 235 grama panchayats and 226 wards. The District Commissioner is
responsible for managing the district administration and the Assistant Commissioners
are responsible for managing the sub-divisions of the district.

39
There are 7 revenue administrative blocks and 9 educational blocks. Mysore
block is divided into two educational blocks, namely, Mysore Urban and Mysore
Rural. Mysore Urban is further bifurcated into sub-educational blocks, namely,
Mysore North and Mysore South, for administrative purposes. H.D. Kote and
Nanjangud blocks have vast geographical areas because of the forests. Nanjangud
block has a large number of grama panchayats in the district and this is due to larger
populations of the block compared to the remaining blocks of the district (Table 3.1).
Apart from the above, the district has 9 municipalities, 1 City Corporation (Mysore), 7
taluk panchayats, 46 Zilla Panchayat Constituencies, 1 Parliamentary Constituency
and 11 assembly constituencies.
Table – 3.1 : Villages and Panchayats in Mysore District 2009-10
Taluks Inhabited Villages Grama Panchayats Wards
H.D. Kote 243 32 38
Hunsur 192 30 23
K.R. Nagar 156 31 23
Mysore 131 35 69
Nanjangud 176 45 27
Periyapatna 197 26 13
T. Narasipura 121 36 33
Total District 1,216 235 226
Source: District at a Glance 2009-10.
Rural (Village) Governance
As seen from Table 3.2, there are overall 2,527 and 1,773 seats reserved for
men and women, respectively, for the Grama Panchayats of the district of Mysore.
The largest number of seats reserved is for the General category with 828 for men and
527 for women. Backward community category A gets the next largest number of
seats reserved for their members, with 697 for men and 147 for women. While the
Scheduled castes get 522 seats for men and 383 seats for women reserved, the
Scheduled tribes get 306 for men and 314 for women.

40
Table – 3.2 : Reservation of Seats and Office of Adhyaksha and Upadhyaksha in Grama Panchayats of Mysore District
Catergory Seats Adhyaksha Upadhyaksha
SC 522 383 24 16 32 12
ST 306 314 13 04 28 08
BCM (A) 697 147 32 18 33 16
BCM (B) 194 79 28 10 18 06
General 828 527 54 36 52 30
Total 2,527 1,773 151 84 163 72
Source: Zilla Panchayat Mysore 2010.
Backward community category B gets the least representation with 194 seats
reserved for men and 79 seats reserved for women members. There are similar
reservations for the post of Adhyakshas and Upadhyakshas, with 151 for men and 84
for women for Adhyakshas and 163 for men and 72 for women for Upadhyakshas
(Figure 3.1). There are variations in the number of seats reserved for men and women
of the taluks in regard to these positions and they are given in Table 3.2.
Figure – 3.1 : Reservation of seats in Grama Panchayats

41
Every Grama Panchayat shall have a Panchayat Development Officer (PDO)
who shall be an officer of the Government and shall draw his salary and allowances
from the Zilla Panchayat fund. The PDO shall perform all the duties and exercise all
the powers imposed or conferred upon him by or under this Act or any rules or bye
laws made there under (Karnataka Panchayati Raj Act 1993, Sec. 111(1) and (2)).
The Government may, by order, specify the staffing pattern, the scales of pay and
mode of recruitment of staff of Grama Panchayats. The Grama Panchayat, after the
appointment of employees, shall submit the list of such employees for approval to the
CEO with their designation and salaries and allowances payable to them for carrying
out the duties imposed upon the Grama Panchayat by or under this Act (Karnataka
Panchayati Raj Act 1993, Sec. 111 (1) and (2)). In making appointments, the
appointing authority shall reserve posts for the SC, ST and other socially and
educationally backward classes of citizens in the same manner and to the same extent
as is applicable for the recruitment to posts in the State Civil Services (Karnataka
Panchayati Raj Act 1993, Sec. 113(1)).
The PDO may, by order, fine, suspend or withhold the increment of any
employee appointed by the Gram Panchayat (Karnataka Panchayati Raj Act 1993,
Sec. 113(3)). The Grama Panchayat may also reduce in rank, remove or dismiss any
employee appointed by it (Karnataka Panchayati Raj Act 1993, Sec. 113(2)).
However, an appeal shall lie against an order passed by the PDO Section 113(2) to the
Executive Officer and against an order passed by the Grama Panchayat under Section
113(3) to the CEO, and whose decision shall be final (Karnataka Panchayati Raj Act
1993, Sec. 113(3)). Sections 112 and 113 of Karnataks Panchayat Raj Act, 1993 have
been considered as important provisions which require some discussion. Under
section 111 of KPR Act, 1993 every Gram Panchayat shall have a PDO who shall be
an officer of Government. It is for the smooth and effective administration of Grama
Panchayat a provision for PDO has been provided. However in practice all the Grama
Panchayats does not have PDO (Karnataka Panchayati Raj Act 1993, Sec. 112 and
113, (111 of KPR Act 1993)). Based on the information collected from the Grama
Panchayats in 2010, there are only 123 PDOs in position for the sanctioned posts of
235. Those in position now also officiate for the other Grama Panchayats where the
position is vacant. Likewise, there are only 159 of the Full Time Secretaries are in
position in the 235 Grama Panchayats whereas the responsibilities in 76 Grama

42
Panchayats where the full time secretaries are not in position are being looked after by
those in service. Of the Grade I and Grade II secretaries in the 235 Grama Panchayats,
171 are of Grade I and 94 are of Grade II positions. Even here, only 72 of the Grade I
secretaries and 87 of the Grade II secretaries are in position. The rest – 69 of Grade I
and 7 of Grade II – are vacant while the responsibilities for the Grama Panchayats
with vacancies are being shared by those in position.
As per Rule 4 of the Karnataka Panchayati Raj (Application of Grama
Panchayat Fund) Rules 1994, the Grama Panchayat may, within the budget provision,
shall incur the expenditure from the Grama Panchayat Fund and the supply of
clothing for Grama Panchayat employees is analogous to Group ‘D’ officials of the
Government, in accordance with the rules for the time being in force for supply of
uniforms to such officials. However, in practice, no Grama Panchayat is providing
uniforms or allowance to it.
The discussion hereafter is on introducing the study area, the background on
which the study of human development and quality of life are based. The discussion is
general and the settings described provide for an understanding of the district of
Mysore in some of its relevant facets. The chapter discusses the background under the
geographical setting, human resources, cultural and economic setting.
3.4 The Natural Environment
Mysore district lies in the Southern Maidan (Southern Plateau) and it is in the
southernmost part of Karnataka State. Physiographically, the region in which the
district is found may be classified as partly maidan and partly semimalnad (malnad is
hilly land). The district forms the southern part of the Deccan Peninsula with Tamil
Nadu on the southeast, the Kodagu district on the west, Mandya district on the north,
Hassan district on the northwest and Bangalore district on the northeast.
Geology
Geologically, the district is mainly composed of igneous and metamorphic
rocks of Pre-Cambrian Era either exposed at the surface or covered with a thin mantle
of residual and transported soils. The rock formation in the district falls into two
groups, charnockite series and granite gneissic and gneissic granite. A fairly wide

43
area of the district consists of charnockite series of rocks, particularly along the
southeastern borders of Yelandur and Biligirirangana Hills and also at the western
border near Hangod in Hunsur taluk. The intervening ground consists of granitic
gneissic with thin beds, lenses and elongated runs of various hornblendic rocks,
pyroxenites and durities containing chromate and magnesite. Dolorites are in large
number of bands to the west of Hunsur and Gundlupet taluks.
The Sargur schist belt in H. D. Kote taluk extends from Sargur to Mysore city
for about 40 km. This belt is known as Sargur series. The series comprise of a
complex series of metasediments and basic igneous rocks. The garnets illuminite
gneiss and the associated norites occurring as patches within the gneissic of southern
Mysore represent the remnants of the older khondalite - charnockite system.
The region between Bettadabidu and Doddakanya is essentially a flat-lying
gneissic terrain with numerous enclaves of meta-sedimentary units consisting of
quartzites, pelitic schists, crystalliner limestone, cal-silicates and ferruginous
quartzites into which the ultramafic and the basic rocks have been emplaced. The
enclaves of the schistose units vary in size from just maple units to whole hill ranges,
for example, the Konnainabetta ranges.
In H. D. Kote and Gundlupet regions, the bands of highly altered rocks of
Kaonite, staurolite, siliceous schists and also bands of limestone and quartizites are
found. These rocks are of great economic importance because of the presence of
graphite, corundum and garnets in them. They extend from Bilikere region upto the
southern border of the district in the south-southwest direction for nearly 50 km. Fine
textured granite beds are found in Mysore taluk and around Mysore city.
Physiography
Mysore district is an undulating tableland with granitic rocks protruding at odd
intervals. The general elevation of the district ranges between 700 meters and 900
meters above the mean sea level. The mountain ranges in the district originate from
the Nilgiris along its southern borders and runs in a northwest and northeast direction.
There are the Ghats and, in between them, lies the Mysore Plateau, which is peneplain
with an average elevation of 700 metres. Except in the north, the district is almost

44
entirely surrounded by the Western Ghats, which at places are an elevation of more
than 1,200 metres above the mean sea level. Only along the southeast, the mountain
ring is broken, where the river Cauvery takes its course towards the Ghats and
plunges into the famous Gaganachukki and Barachukki falls at Shivanasamudram.
Climate
The climate of Mysore district is equable and agreeable. The district enjoys
cool and equable temperatures. Mysore district shares the wider climatic pattern of
the State as a whole, although there are some distinctive features. The climate of the
district may be described as essentially tropical monsoon type which is a product of
the interplay of the two opposing air-masses of the southwest and northeast
monsoons. Over the greater part of the district, summers are languorously warm and
winters bracingly cool.
Cold Weather Season
There are wide variations in between day and night temperatures. The
temperature is low in the cold weather season but the average temperature does not go
below 16.5° C. January is the typical cold month and records very low temperatures.
The temperatures during the cold weather season (November to February) ranges
from 16.1° C to 31.3° C.
Hot Weather Season
The hot weather season begins in the month of March and increases in its
intensity towards the end of May. In this season, the temperature ranges from 19.7° C to
35.1° C. Land becomes very hot and there is a wide range of variations between day and
night temperatures. However, there is occasional relief from per-monsoon thunderstorms.
Southwest Monsoon
The southwest monsoon sets in about the end of May or early June and it
continues with some intervals till the end of September. It is dominant in the district
and it also brings heavy rains to this region. The district receives a major portion of its
rainfall from the southwest monsoon. The normal annual rainfall is around 760 mm,
spread over a period of seven months, from the later half of April to October. Rainfall
is gradually decreasing from west to east. The annual average rainfall ranges between
600 mm and 1,100 mm.

45
Northeast Monsoon
The northeast monsoon commences in October and ceases by the end of
December. The monsoon winds bring some rains to the eastern parts of the district.
The duration of the monsoon is short and rains are also very low and they are
confined to a small area of the district.
Temperature
Temperature influences considerably the socio-economic activities of the
people in a region. The district in general enjoys cool and equable temperatures. In the
period from March to May, there is a continuous rise in temperature. April is the
hottest month with the mean daily maximum temperature at 34.5° C and the daily
minimum is at 21.1° C. On normal days, the day temperatures during summer may
exceed 39° C. There is welcome relief from the heat when thunder showers occur
during April and May. With the advance of the southwest monsoon about the
beginning of June, the day temperatures drop appreciably and, throughout the
southwest monsoon period, the weather is pleasant. After mid-November, both day
and night temperatures decrease progressively. January is the coldest month with
mean daily maximum at 11° C. On some days, during the period November to
January, the minimum temperature may go below 11° C.
The highest maximum temperature recorded at Mysore was 39.4° C on the 4th
of April 1917. The lowest minimum temperature was 10.6° C on the 13th of
December 1945. The temperature remains nearly the same for several months but
begins to rise in February and touches the peak in either April or May, in both
maximum and minimum. Minimum is near about 20° C and the maximum is near
about 30° C for several months.
Humidity
Relative humidities are generally high during the southwest monsoon season.
Relative humidities are about 70 per cent and over in the mornings throughout the
year, while in the afternoons, humidities are comparatively lower except during the
southwest monsoon. The period January to April is the driest part of the year with
relative humidities of about 30 per cent and still lower in the afternoons.

46
Rainfall
The climate of the district is tropical and is greatly influenced by the two
seasons, namely, the southwest monsoon and northeast monsoon. In regard to
temperatures, there are mild temperatures during the months of December-March, but
starting in April, the temperatures increase gradually to reach a peak in May and
begin to decrease only after the end of the southwest monsoon, in September. The
climate is salubrious for nearly 5 months because of the elevations, but is generally
hot the rest of the year.
Table 3.3 below reveals taluk-wise distribution of rainfall in the district of
Mysore (see Map 3.2). H.D. Kote, Hunsur and Periyapatna taluks are cool and moist
during winter and rainy seasons and these taluks are in the semi-malnad region of the
State. The remaining taluks are comparatively dry (except along the riverine tracts)
during the year. The highest rainfall was recorded in H.D. Kote at 920.1 mm and the
lowest was recorded in Hunsur taluk with only 762.8 mm, in 1960. The distribution of
rainfall in the district has been satisfactory and it is normally more than 762 mm. In
1965, the distribution of rainfall in the district was not satisfactory, however. The
highest rainfall was recorded in H.D. Kote at 817 mm and the lowest was in
Nanjangud at 420.9 mm. In the year 1985, low rainfall was recorded in the district.
The highest recorded for the year was in Yelandur taluk at 1022.9 mm and the lowest
was in T. Narasipura taluk at 367.3 mm.
Table – 3.3 : Rainfall in Mysore District 2009-10
Taluks Normal Rainfall 1941-1990 (in mm)
Actual Rainfal 2009-10 (in mm)
H.D. Kote 832 989
Hunsur 739 1,028
K.R. Nagar 800 890
Mysore 784 827
Nanjangud 670 599
Periyapatna 830 1,046
T. Narasipura 712 832
District 767 883
Source: District at Glance, Mysore 2009-10.

47
Map – 3.2 : Distribution of Rainfall in Mysore District
The highest actual rainfall during 2010 was recorded in Periyapatna taluk with
1,046 mm and the lowest actual rainfall in Nanjangud taluk with 599 mm. Table 3.3
above gives the distribution of rainfall in the district by taluks for the year 2009-10
(Figure 3.2).
Figure – 3.2 : Distribution of Rainfall by Taluks in Mysore District 2009-10
48
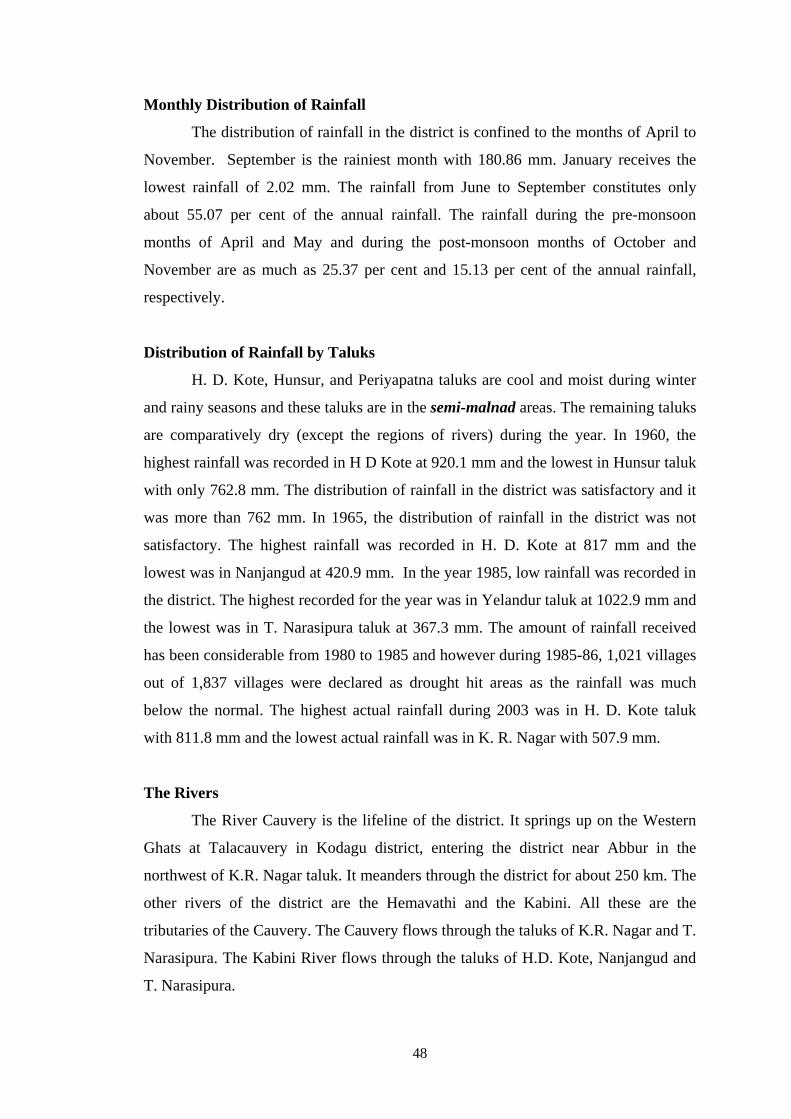
Monthly Distribution of Rainfall
The distribution of rainfall in the district is confined to the months of April to
November. September is the rainiest month with 180.86 mm. January receives the
lowest rainfall of 2.02 mm. The rainfall from June to September constitutes only
about 55.07 per cent of the annual rainfall. The rainfall during the pre-monsoon
months of April and May and during the post-monsoon months of October and
November are as much as 25.37 per cent and 15.13 per cent of the annual rainfall,
respectively.
Distribution of Rainfall by Taluks
H. D. Kote, Hunsur, and Periyapatna taluks are cool and moist during winter
and rainy seasons and these taluks are in the semi-malnad areas. The remaining taluks
are comparatively dry (except the regions of rivers) during the year. In 1960, the
highest rainfall was recorded in H D Kote at 920.1 mm and the lowest in Hunsur taluk
with only 762.8 mm. The distribution of rainfall in the district was satisfactory and it
was more than 762 mm. In 1965, the distribution of rainfall in the district was not
satisfactory. The highest rainfall was recorded in H. D. Kote at 817 mm and the
lowest was in Nanjangud at 420.9 mm. In the year 1985, low rainfall was recorded in
the district. The highest recorded for the year was in Yelandur taluk at 1022.9 mm and
the lowest was in T. Narasipura taluk at 367.3 mm. The amount of rainfall received
has been considerable from 1980 to 1985 and however during 1985-86, 1,021 villages
out of 1,837 villages were declared as drought hit areas as the rainfall was much
below the normal. The highest actual rainfall during 2003 was in H. D. Kote taluk
with 811.8 mm and the lowest actual rainfall was in K. R. Nagar with 507.9 mm.
The Rivers
The River Cauvery is the lifeline of the district. It springs up on the Western
Ghats at Talacauvery in Kodagu district, entering the district near Abbur in the
northwest of K.R. Nagar taluk. It meanders through the district for about 250 km. The
other rivers of the district are the Hemavathi and the Kabini. All these are the
tributaries of the Cauvery. The Cauvery flows through the taluks of K.R. Nagar and T.
Narasipura. The Kabini River flows through the taluks of H.D. Kote, Nanjangud and
T. Narasipura.

49
The Cauvery which is the major system of the district traverses the Mysore
plateau from the northwest to east along with its tributaries Kabini, Suvarnavathi,
Laxmanathirtha and others. The Cauvery rises at Talacauvery in Kodagu district and
flows along the boundary of Periyapatna taluk, enters into the district through K R Nagar
taluk. It further moves into T. Narasipura and Kollegal before reaching Tamil Nadu.
The total catchments area of the river is the second largest in the State and it
covers nearly 18 per cent of the land area of the State. It is the only river which has
been harnessed for irrigation from ancient times and it is estimated that as much as 95
per cent of its surface flow is put to use before it enters into the Bay of Bengal.
River Kabini rises at Wynad in Kerala State, comes into the State at Siddapura
in Kodagu district and enters into the district at H D Kote taluk. The important
tributaries of this river are the Gundluhole, the Nuguhole (hole = river), and small
streams such as the Taraka, the Vodehattihole and the Sarathihole which flow from H
D. Kote reach the Kabini river only in the rainy season.
Map – 3.3 : Drainage & Hydrograph Monitoring Stations Mysore District

50
The Suvarnavathy River has its origin in the Hasanur Ghat range of hills situated on the south of Chamarajanagar taluk and close to the border between Karnataka and Tamil Nadu States. A number of streams have their origin on these Ghats, out of which two streams, namely, the Niredurgi Halla and the Arikadi Halla originate and travel for about 19.3 km and 32.2 km, respectively, before joining together near Budipadaga and are called as the Suvarnavathy river or the Honnuhole (Map 3.3). This river, after flowing for a further distance of 11.3 km, is joined by another tributary, namely, the Chikkahole and finally joins the Cauvery after flowing through Chamarajanagar, Yelandur, and Hampapura near Kollegal town. The river Laxmanathirtha rises in Kodagu district and flows into Hunsur taluk and finally reaches Krishna Raja Sagara Dam. The total catchment is nearly 178.2 sq.km. The Gundluhole originates in Gundlupet taluk at the Gopalaswamy Betta and enters into Nanjangud taluk and reaches the Kabini River. The Nuguhole has also its origin at H D Kote taluk, flows into Nanjangud taluk and reaches the Kabini River. Soils
The soils of the district can be broadly classified as the laterite, red loam, sandy loam, red clay and black cotton soils. Laterite soil occurs mostly in the western parts of the district while the red loam is found in the northwest. The two account for nearly half the area of the district. Black cotton soil is mostly found in the northeastern parts of the district. Red sandy loam soils are derived from granites and gneisses. The western taluks of Periyapatna, H.D. Kote and Hunsur are covered with hilly terrain and contain red, shallow gravelly soils. In the taluks of T. Narasipura and Nanjangud, there is deep red loam, occasionally interspersed with the black soils. The red soils are shallow to deep, well-drained and do not contain lime nodules. The black soils are 1 to 5 metres in bases with good water holding capacity for a longer time. Forests and Forestry
Mysore District has only 10 percent of the total geographical area of the State. Even this is also deteriorating. Hence, the Zilla Panchayat is interested in developing social forestry in the Government and private lands with the co-operation of people instead of just improving the reserved forests. Much importance has been given to involvement of rural people at the Grama Panchayat level. According to a Census report, the total geographical area covered by the forests is 62,851 hectares. However, due to imbalances in the environment of Mysore District, the State has initiated various other programmes through ZP.

51
Map – 3.4 : Soils of Mysore District
3.5 Agro - Climatic Conditions
The climatic conditions of the district are favourable to crops like paddy, jowar, ragi, pulses, sugarcane and tobacco. The district can be divided into two major agro-climatic zones: the Southern Dry Zone comprising of 4 taluks, namely, Nanjangud, T. Narasipura, Mysore and K. R. Nagar and the Southern Transition Zone consisting of H. D. Kote, Hunsur, and Periyapatna taluks. The annual rainfall ranges from 670 mm to 888.6 mm in dry zones and from about 612 mm to 1,054 mm in the transitional zone. The average annual rainfall of the district is 782 mm. The temperature ranges from 110 C to 380 C. Thus, the climate of Mysore district is tropical with moderate variations in temperature in different seasons. 3.6 Irrigation
A total of 159,230 hectares is the net area irrigated in Mysore district. The main rivers of Kabini, Cauvery and Harangi supply water for agriculture in the district. Among them, the Cauvery flows through K.R. Nagar and T. Narasipura taluks, Kabini flows through H.D. Kote, Nanjanagud and T. Narasipura taluks and join the Cauvery. The minor irrigation systems such as the tanks, wells and bore wells have played a crucial role in the development of irrigation facilities to promote and enhance agricultural production in the district. The details of sources of irrigation are presented in the following Table 3.4 (Figures 3.3 and Map 3.5).

52
Table 3.4 reveals that the land under canal irrigation in the district has
increased from 87,685 ha to 108,702 ha in 2005-06 and 2009-10, respectively. The
area under tank irrigation in the district has also increased from 17,377 ha to 20,780
ha in 2005-06 to 2009-10, respectively. On the other, well irrigation in the district has
increased from 10,323 ha to 20,810 ha during the same period, the bore well irrigation
has increased from 5,795 ha to 10,223 ha and other irrigation in the district has
however decreased from 375 ha to 358 ha in 2005-06 and 2009-10, respectively.
Table – 3.4 : Source of Irrigation in Mysore District
Year Canal Tank Well Bore well Others Total 2005-06 87,685
(72.13) 17,377(14.29)
10,323(8.49)
5,795(4.76)
375 (0.30)
121,555
2006-07 115,286 (66.93)
22,480(13.05)
20,810(12.08)
13,309(7.72)
353 (0.20)
172,238
2007-08 115,286 (66.93)
22,480(13.05)
20,810(12.08)
13,309(7.72)
353 (0.20)
172,238
2008-09 108,790 (68.35)
20,710(13.01)
19,900(12.50)
9,385(5.89)
353 (0.22)
159,143
2009-10 108,702 (68.26)
20,780(13.05)
19,167(12.03)
10,223(6.42)
358 (0.22)
159,230
Source : District at Glance, Mysore 2005-06 to 2009-10. The same is shown in the following Figure 3.3.
Figure – 3.3 : Source of Irrigation in Mysore District

53
Map – 3.5 : Patterns of Irrigation in Mysore District 2011
3.7 The Human Environment
Mysore is an educational, commercial and administrative centre and is also an
important tourist and heritage centre. It is well connected to the adjoining States of
Kerala (Wynad, Calicut) and Tamil Nadu (Udhagamandalam, Coimbatore) through
roads.
The Government of Karnataka has been promoting Mysore as an alternative
destination for the Information Technology (IT) industry and developing it as a
counter magnet city to Bangalore. As a result, the city has become a new paradise for
the IT and Information Technology Enabled Services (ITES) industry and is poised to
play a bigger role in the economy of the city. Share of Mysore District in State GDP
at 7.09 per cent (1996-97), has exhibited a marginal increase over the figure of 6.63
per cent (1980- 81). However, with the IT companies establishing their bases in
Mysore in the recent years, the city’s share in the State GDP is expected to improve.

54
3.8 Socio Demographics of Mysore District (Census Profile) Population should be considered as an important factor, while formulating plans
to develop any particular region. The plan document should include the size of the population, age and sex composition, workforce in different occupations, literacy rates, rates of growth and the existing density. This will help while implementng developmental programmes. At the same time, there are certain factors that are dependent very much on the interplay of physical, economic, socio-cultural aspects of the population. Growth of Population
Growth of population in Mysore district during 1991 to 2011 is shown in Table 3.5, which reveals that, as per Census 1991, the total population was 2,281,653, which accounted for 5.07 per cent of the total population of the State. The rural population in 1991 was 1,465,034 while the urban population was 816,619, which accounted for 64.20 per cent and 36.0 per cent, respectively. In Census 2001, it increased to 2,641,027, which accounted for 5.0 per cent. The rural population of 2001 was of the order of 1,658,899 while the urban population was at 982,128, which accounted for 63.0 per cent and 37.18 per cent, respectively. According to 2011, the total population was 2,994,744, which accounted for more or less the same, at 5.00 per cent. The rural population was 1,839,926 and urban population was 1,154,818, accounting for 61.43 per cent and 38.56 per cent, respectively.
It is estimated that between 1991 and 2011, the population growth has shown
an increase of 13.39 per cent. The rural and urban populations have also recorded an increase of 10.91 per cent and 17.58 per cent, respectively.
Table – 3.5 : Growth of Population in Mysore District 1991-2011
Year Rural Population
Urban Population
Total Population (Figures within the brackets are percentages to total population)
1991 1,465,034 (64.20)
816,619(36.00)
2,281,653(5.07)
2001 1,658,899 (63.00)
982,128(37.18)
2,641,027(5.00)
2011 1,839,926 (61.43)
1,154,818(38.56)
2,994,744(5.00)
Source: District Census report, and District at a Glance 2009-10 and 1991-2011
55
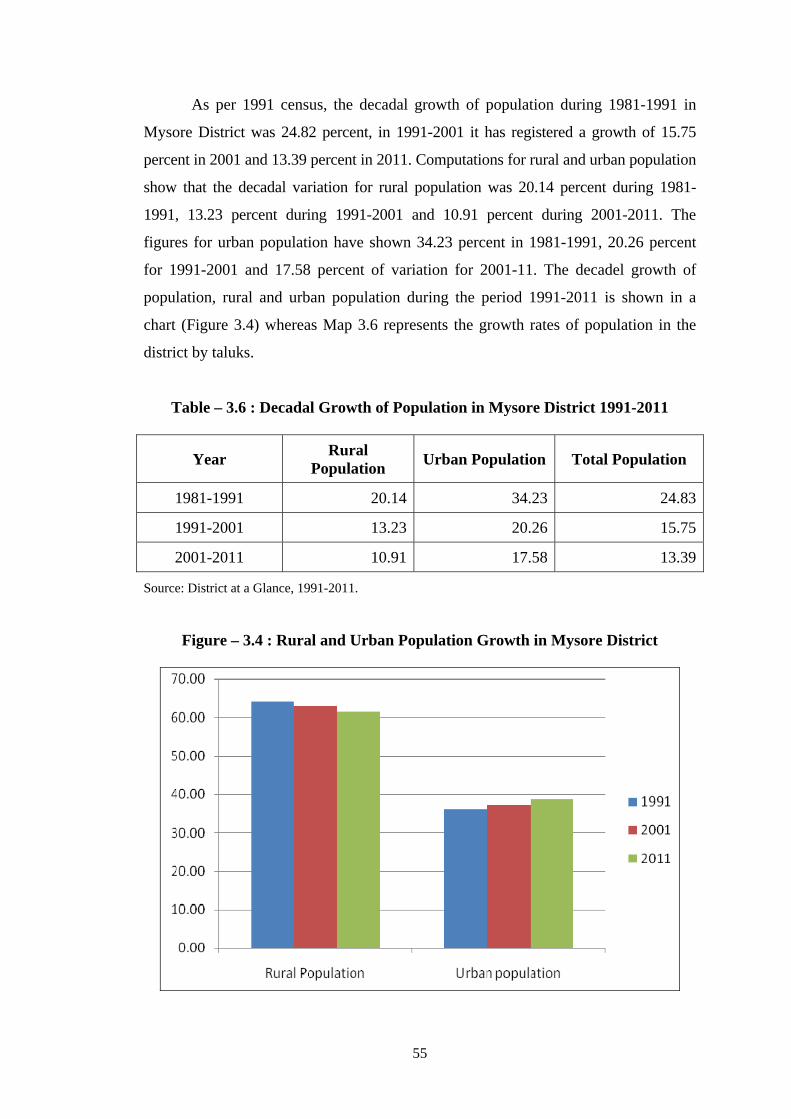
As per 1991 census, the decadal growth of population during 1981-1991 in
Mysore District was 24.82 percent, in 1991-2001 it has registered a growth of 15.75
percent in 2001 and 13.39 percent in 2011. Computations for rural and urban population
show that the decadal variation for rural population was 20.14 percent during 1981-
1991, 13.23 percent during 1991-2001 and 10.91 percent during 2001-2011. The
figures for urban population have shown 34.23 percent in 1981-1991, 20.26 percent
for 1991-2001 and 17.58 percent of variation for 2001-11. The decadel growth of
population, rural and urban population during the period 1991-2011 is shown in a
chart (Figure 3.4) whereas Map 3.6 represents the growth rates of population in the
district by taluks.
Table – 3.6 : Decadal Growth of Population in Mysore District 1991-2011
Year Rural Population Urban Population Total Population
1981-1991 20.14 34.23 24.83
1991-2001 13.23 20.26 15.75
2001-2011 10.91 17.58 13.39
Source: District at a Glance, 1991-2011.
Figure – 3.4 : Rural and Urban Population Growth in Mysore District

56
Map – 3.6 : Population Growth Rates 2011
Sex Ratio
The distribution of sex ratio of population in Mysore district is presented in
Table 3.7. According to Census 1991, the sex ratio of population was 953 females per
1,000 males; while the rural sex ratio was 958, the urban sex ratio was 924. In 2001,
the sex ratio of the total population was somewhat better at 964 females to 1,000
males, with rural sex ratio at 962 and urban sex ratio at 967, both bettering the 1991
record. There is further betterment on the sex ratio during 2001-11, but it is not as
high as during 1991-2001: 964 to 982 for total population, 962 to 968 for rural
population and 967 to 971 for urban population (see Figure 3.5).

57
Table – 3.7 : Distribution of Sex Ratio in Mysore District 1991-2011
Year Rural Urban Total
1991 958 924 953
2001 962 967 964
2011 968 971 982
Source: District at a Glance, 1991-2011.
Figure – 3.5 : Sex Ratio in Mysore District 1991-2011
Density of Population
Table 3.8 shows the distribution of density of population in Mysore District
during 1991-2011. As per Census 1991 census, the population density was 383
persons per km2. For the same year, it was 219 persons per km2 for rural population
and 119 persons per km2 for urban population. According to Census 2001, the
population density for the district as a whole was 419 persons per km2, for rural areas
it was 248 persons per km2 and for urban areas 143 persons per km2. It is thus a clear-
cut increase over the decade for the district as well as rural and urban areas, because
population has increased while the geographical areas have remained more or less the
same. Figure 3.7 shows the spatial variations in population density in the district.

58
Map – 3.7 : Population Density 2011
Table – 3.8 : Density of Population in Mysore District 1991-2011
Year Rural density Urban density Total density
1991 219 119 383
2001 248 143 419
2011 275 168 437
Source: District at a Glance, 1991-2011.
In 2011 Census, the density of population further increased to 437 persons per
km2 for the entire district, to 275 persons per km2 for rural areas and to 168 persons
per km2 for the urban areas. This distribution is shown in Figure 3.6.

59
Figure – 3.6 : Density of Population in Mysore District 1991-2011
Literacy in Mysore District
Table 3.9 shows the distribution of literacy in Mysore district during the
period 1991 to 2011. According to 1991 Census, the literacy was 48.32 per cent, of
which rural literacy accounted for 49.20 percent and urban literacy for 62.43 per cent.
According to 2001 Census, the literacy rate increased from 48.32 per cent to 63.50 per
cent over the period 1991 to 2001, while rural literacy increased from 49.20 per cent
to 51.80 per cent and urban literacy increased from 62.43 per cent to 82.80 per cent,
during the same decade (Figure 3.7). Literacy further increased to 72.56 per cent in
2011, with rural literacy accounting for 62.41 per cent and urban literacy for 89.24 per
cent. Throughout, there were gaps between rural and urban literacy, with urban areas
accounting for higher percentages than the rural areas, primarily because of the
concentration of education as a service in the cities and towns.

60
Table – 3.9 : Literacy in Mysore District 1991-2011
Year Rural Urban Total
1991 49.20 62.43 48.32
2001 51.80 82.80 63.50
2011 62.41 89.24 72.56
Source: District at a Glance 1991-2011.
It has been observed that the literacy rate increased tremendously in the
district because of the fact that the local and regional Governments implemented
many educational development programmes in the district as well.
Figure – 3.7 : Literacy in Mysore District 1991-2011

61
Map – 3.8 : Literacy in Mysore District 2011
Occupational Structure
Table 3.10 shows the distribution of various occupations, in terms of
workforce, particularly the main and marginal workers in Mysore District. Mysore
taluk reported the largest number of main workers (339,926), which accounted for
37.70 per cent, followed by Nanjangud taluk with 127,175 (34.50 per cent), H.D.
Kote taluk with 103,171 (42 per cent), Hunsur taluk with 100,527 (39.60 per cent),
Periyapatna taluk with 88,035 (39.30 per cent), K.R. Nagara taluk with 87,872 (36.7
per cent) and T. Narasipura taluk with the lowest number at 82,423, which accounted
for 29.50 per cent, during 2009-10.

62
Table – 3.10 : Distribution of Main, Marginal and Non-workers by taluks in Mysore District 2009-10
Taluks Main workers
Marginal workers
Total workers
Total Non workers
H.D. Kote 103,171(42.00)
22,242(9.00)
125,413 (51.00)
120,517(49.00)
Hunsur` 100,527(39.60)
36,092(14.20)
136,619 (53.80)
117,307(46.20)
K.R. Nagara 87,872(36.70)
24,467(10.20)
112,339 (47.00)
117,307(53.00)
Mysore 339,926(37.70)
29,644(2.90)
369,570 (35.60)
668,920(64.40)
Nanjangud 124,175(34.50)
32,063(8.90)
156,238 (43.40)
203,985(56.60)
Periyapatna 88,035(39.30)
14,022(6.30)
102,057 (45.50)
122,197(54.50)
T. Narasipura 82,423(29.50)
25,605(9.20)
108,028 (38.70)
170,977(61.30)
Total District 926,129(35.10)
184,135(7.00)
1,110,264 (42.00)
1,530,763(58.00)
Source: District at a Glance 2009-10. (Figures within the brackets are percentages to the total population)
Hunsur taluk on the other hand reported the highest number of marginal
workers (36,092), accounting for 14.20 per cent, followed by Nanjangud taluk with
32,063 (8.90 per cent), Mysore taluk with 29,644 (2.9 per cent), T. Narasipura taluk
with 25,605 (9.2 per cent), K.R. Nagara taluk with 24,467 (10.2 per cent), H.D. Kote
taluk with 22,242 (9 per cent) and Periyapatna taluk with the lowest number of
14,022, accounting for 6.30 per cent, for the same year 2009-10.
As for the non-workers, Mysore taluk housed the highest number of non-
workers (668,920), accounting for 64.40 per cent, followed by Nanjangud taluk with
203,985 (56.60 per cent), T. Narasipura taluk with 170,977 (61.3 per cent),
Periyapatna taluk with 122,197 (54.5 per cent), H.D. Kote taluk with 120,517 (49 per
cent) and Hunsur and K.R. Nagara taluks reported the same number, and the lowest
number at that (117,307), accounting for 46.2 per cent each. The distribution of main,
marginal and non-workers in the study area is shown on Figure 3.8.

63
Map 3.9 shows the work participation rates in the district by taluks. As seen,
H.D. Kote and Hunsur taluks have the highest of the rates, that is, more than 50 per
cent.
Figure – 3.8 : Distribution of Main, Marginal and Non-Workers
in Mysore District by Taluks 2009-10 (in percent)
Cultivators
Table 3.11 shows the distribution of cultivators, agricultural labourers,
household industrial workers and workers engaged in other services. Hunsur taluk has
had the highest number of 77,588 cultivators, accounting for 56.80 per cent, followed
by Periyapatna taluk with 64,719 (63.40 per cent), H.D. Kote taluk with 63,815 (51
per cent), K.R. Nagara taluk with 59,799 (53.20 per cent), Mysore taluk with 42,156
(11.40 per cent), Nanjangud taluk with 53,008 (33.9 per cent) and T. Narasipura taluk
with 36,872 cultivators, which is the lowest among the taluks of Mysore in 2009-10,
accounting for 34.10 per cent of the total workers. Map 3.10 shows the distribution of
cultivators by taluks.

64
Map – 3.09 : Work Participation Rates in Mysore District
Map – 3.10 : Distribution of Cultivators in Mysore District 2011

65
Table – 3.11 : Distribution of Cultivators, Agricultural Labourers, Household Industrial Workers and Other Workers in Mysore District by Taluk 2009-10
Taluks Cultivators Agricultural labourers
Household Industrial workers
Other workers
H.D. Kote 63,815(51.00)
43,709(37.90)
1,450 (1.20)
16,439(13.10)
Hunsur 77,588(56.80)
32,616(23.90)
2,003 (1.50)
24,412(17.90)
K.R. Nagara 59,799(53.20)
29,281(26.10)
1,445 (1.30)
21,814(19.40)
Mysore 42,156(11.40)
20,474(5.50)
11,980 (3.20)
294,960(79.80)
Nanjangud 53,008(33.90)
60,868(39.00)
2,214 (1.40)
40,148(25.70)
Periyapatna 64,719(63.40)
18,597(18.20)
1,136 (1.10)
17,605(17.30)
T. Narasipura 36,872(34.10)
44,817(41.50)
1,374 (1.30)
24,965(23.10)
Total District 397,957(35.80)
250,362(22.50)
21,602 (1.90)
440,343(39.70)
Source: District at a Glance 2009-10. (Figures within brackets are percentages to the total workers)
Agricultural Labourers
Nanjangud taluk has had the highest number of 60,868 agricultural labourers,
which is 39 per cent of the total workers, followed by H.D. Kote taluk with 43,709
(37.9 per cent), T. Narasipura taluk with 44,817 (41.5 per cent), Hunsur taluk with
32,616 (23.9 per cent), K.R. Nagara taluk with 29,281 (26.1 per cent), Mysore taluk
with 20,474 (5.5 per cent), and Periyapatna taluk has had the lowest number of
18,597, accounting for 18.2 per cent in the district in the year 2009-10 (see Map 3.11
for a distribution of labourers by taluks).

66
Map – 3.11 : Distribution of Agricultural Labourers in Mysore District 2011
Household Industrial Workers
Mysore taluk has shown the highest number of household industrial workers
(11,980), accounting for 3.20 per cent, followed by Nanjangud taluk with 2,214 (1.4
per cent), Hunsur taluk with 2,003 (1.5 per cent), H.D. Kote taluk with 1450 (1.2 per
cent), K.R. Nagara taluk with 1,445 (1.3 per cent), T. Narasipura taluk with 1,374 (1.3
per cent) and Periyapatna taluk has shown the lowest number of household industrial
workers (1,136), accounting for 1.1 per cent of the total workers (Figure 3.12).

67
Map – 3.12 : Distribution of Household Industry Workers
Other Workers
As regards the other workers, Mysore taluk has registered the highest number
of them at 294,960, accounting for 79.8 per cent, followed by Nanjangud taluk with
40,148 (25.7 per cent), T. Narasipura taluk with 24,965 (23.1 per cent), Hunsur taluk
with 24,412 (17.9 per cent), K.R. Nagara taluk with 21,814 (19.4 per cent),
Periyapatna taluk with 17,605 (17.3 per cent) and H.D. Kote taluk has recorded the
lowest number (16,439) of other workers, accounting for 13.10 per cent of the total
workers in the district. The distribution of other workers Figure 3.13.

68
Map – 3.13 : Distribution of Other Workers in Mysore District 2011
Landholdings
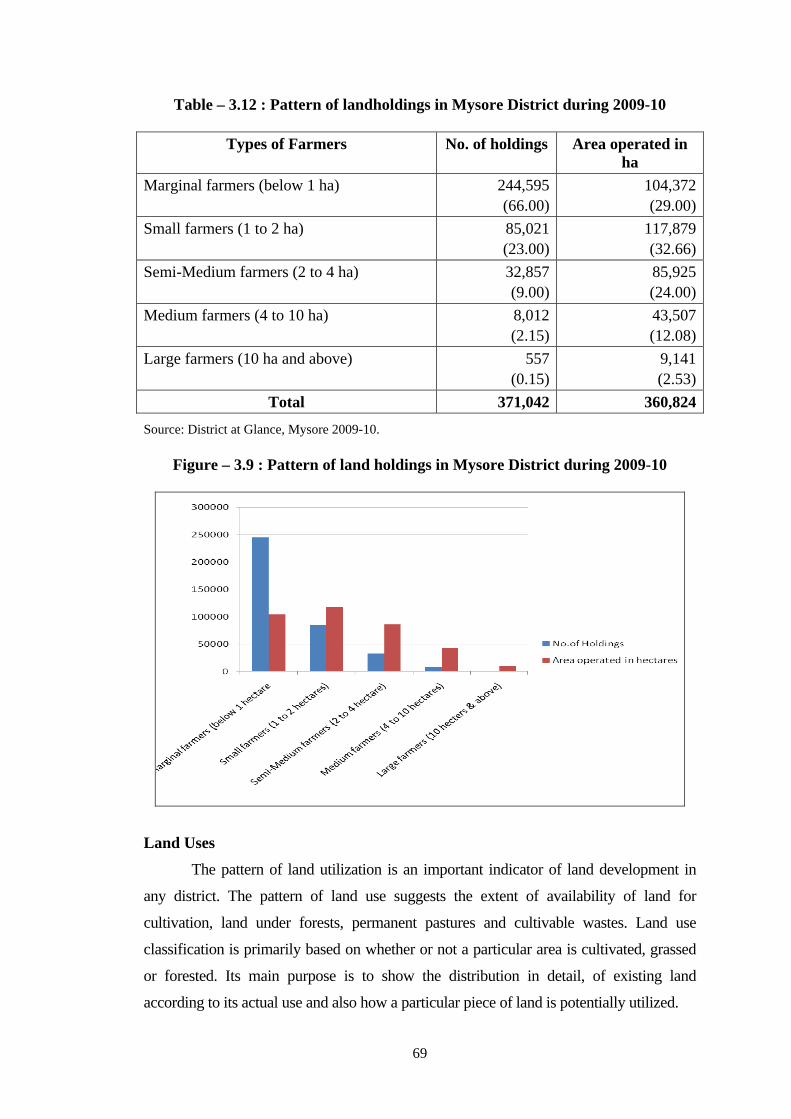
The size of landholdings determines the stage of agricultural development. Large number of small holdings is a sign of economic backwardness. The cost of cultivation per hectare is high when the size of holding is small and marginal due to the non-availability of the advantages of large-scale production. The details of land holdings in the district are presented in Table 3.12.
Table 3.12 shows the distribution landholdings in Mysore District by size. We
understand that the number of marginal formers during the year 2009-10 was large when compared to other categories of farmers in Mysore District. This shows that farming is done with very small sizes of landholdings, which need timely finance and also reveals a greater vision towards an emphasis on agricultural finance to improve the socio-economic conditions of the farmers (see Figure 3.9).
69
Table – 3.12 : Pattern of landholdings in Mysore District during 2009-10
Types of Farmers No. of holdings Area operated in ha
Marginal farmers (below 1 ha) 244,595(66.00)
104,372(29.00)
Small farmers (1 to 2 ha) 85,021(23.00)
117,879(32.66)
Semi-Medium farmers (2 to 4 ha) 32,857(9.00)
85,925(24.00)
Medium farmers (4 to 10 ha) 8,012(2.15)
43,507(12.08)
Large farmers (10 ha and above) 557(0.15)
9,141(2.53)
Total 371,042 360,824
Source: District at Glance, Mysore 2009-10.
Figure – 3.9 : Pattern of land holdings in Mysore District during 2009-10
Land Uses
The pattern of land utilization is an important indicator of land development in
any district. The pattern of land use suggests the extent of availability of land for
cultivation, land under forests, permanent pastures and cultivable wastes. Land use
classification is primarily based on whether or not a particular area is cultivated, grassed
or forested. Its main purpose is to show the distribution in detail, of existing land
according to its actual use and also how a particular piece of land is potentially utilized.

70
Map – 3.14 : Land Uses in Mysore District 2011
The land is classified into a nine-fold classification according to use. They are:
the forests, land put to non-agricultural uses, barren and uncultivable lands, permanent
pastures and other grazing lands, land under miscellaneous tree crops and groves not
included in the net area sown, cultural wastes, fallow lands other than current fallows,
current fallow and net area sown. The land utilization pattern is represented in the
following Table 3.13. Table 3.13 also shows that a large part of the land is devoted to
net area sown. But 1.02 per cent of land is occupied by miscellaneous tree crops and
groves. The same is depicted in the Figure 3.10.

71
Table – 3.13 : Land Utilization Patterns in Mysore District 2009-10
Particulars Area ha % age of Area
Total Geographical Area 676,382 100.00
Forests 62,851 9.29
Land put to non-agricultural uses 67,028 9.91
Barren and uncultivable lands 45,812 6.77
Permanent pastures and other grazing lands 55,256 8.17
Land used for miscellaneous tree crops and groves not included in the net area shown
6,871 1.02
Cultural wastes 21,460 3.17
Fallow lands other than current fallows 78,918 11.67
Current fallows 17,445 2.58
Net area sown 342,852 50.69
Source: District at Glance, Mysore 2009-10.
Figure – 3.10 : Land Use Patterns in Mysore District 2009-10 (Area in per cent)
72
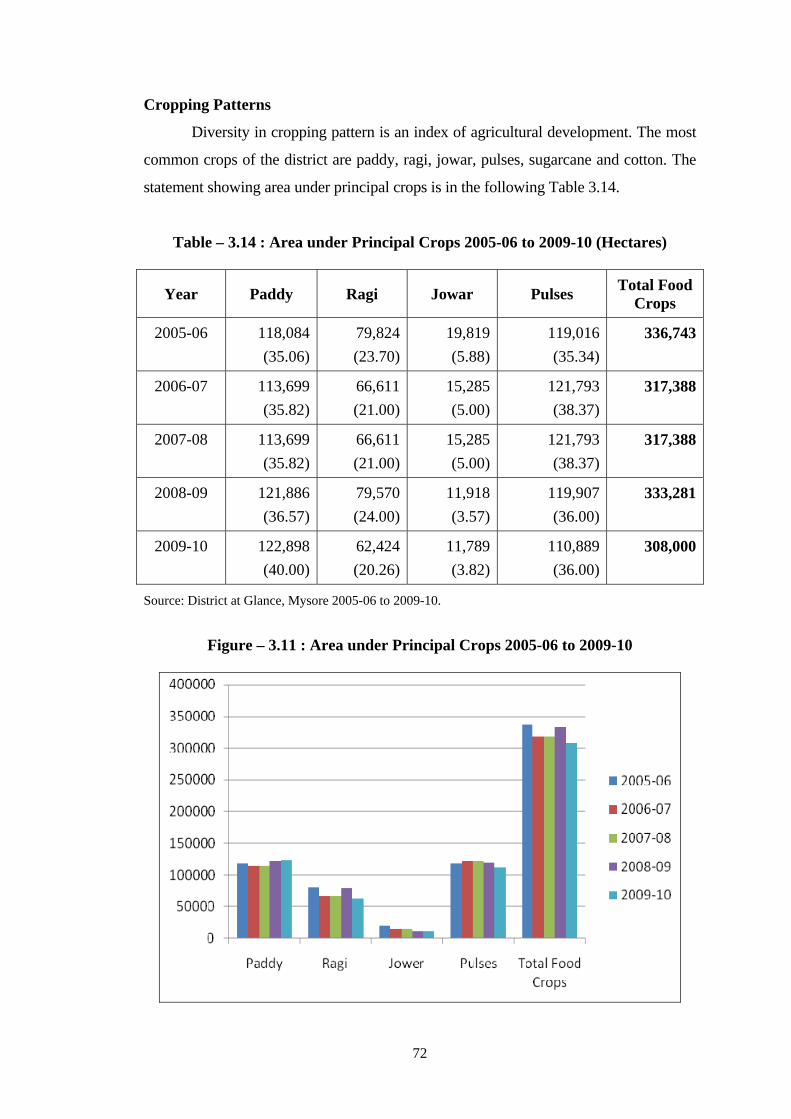
Cropping Patterns
Diversity in cropping pattern is an index of agricultural development. The most
common crops of the district are paddy, ragi, jowar, pulses, sugarcane and cotton. The
statement showing area under principal crops is in the following Table 3.14.
Table – 3.14 : Area under Principal Crops 2005-06 to 2009-10 (Hectares)
Year Paddy Ragi Jowar Pulses Total Food Crops
2005-06 118,084 (35.06)
79,824(23.70)
19,819(5.88)
119,016 (35.34)
336,743
2006-07 113,699 (35.82)
66,611(21.00)
15,285(5.00)
121,793 (38.37)
317,388
2007-08 113,699 (35.82)
66,611(21.00)
15,285(5.00)
121,793 (38.37)
317,388
2008-09 121,886 (36.57)
79,570(24.00)
11,918(3.57)
119,907 (36.00)
333,281
2009-10 122,898 (40.00)
62,424(20.26)
11,789(3.82)
110,889 (36.00)
308,000
Source: District at Glance, Mysore 2005-06 to 2009-10.
Figure – 3.11 : Area under Principal Crops 2005-06 to 2009-10

73
Animal Husbandry
Livestock development plays an important role by providing gainful
employment apart from providing food of high nutritive value for the health and well-
being of the people. Livestock development in the district has been undergoing
revolutionary changes in recent years. Increase in hotels has given a fillip to dairying.
The adoption of modern techniques of breeding, feeding, management and disease
control has contributed to the enhancement of the productivity of livestock.
Especially, there is a tremendous surplus production in milk and its products.
According to Census 2011, the following Table 3.15 presents the number and
strengths of livestock in the district.
Table – 3.15 : Distribution of Livestock in Mysore District 2009-10
Particulars Number
Total number of Cattle’s (Local, Foreign and Hybrid) 616,756
Total number of buffaloes 66,235
Total number of sheep 256,972
Total number of goats 196,993
Total number of pigs 2,920
Total number of dogs 49,706
Total number of rabbits 157
Total number of poultry birds 3,214,284
Others 287
Source: District at Glance, Mysore 2009-10.
Usually the small and marginal farmers are engaged in subsidiary occupations
like dairy farming, poultry farming, and fodder farming to augment their income.
There are 18 veterinary hospitals, 69 veterinary dispensaries, 07 mobile veterinary
hospitals, 04 artificial insemination centres and 74 primary veterinary centres in the
district, for helping the farmers with the animal health and their livestock based
occupations.

74
Horticulture
Mysore district is renowned for special horticultural crops like Nanjangud
Rasabale, Mysore betel leaves, Mysore Mallige (Jasmine) and Erengere brinjal. A
total of 3,030 ha of land are utilized for growing varieties of fruits and 1985 hecaters
of land utilized for growing varieties of vegetables in the district. However it is most
unfortunate that the varieties like the Nanjangud Rasabale (a variety of banana, tastier
and nutritious) and Mysore betel leaves are fast disappearing due to continuous
indifference by the Government.
Sericulture
Sericulture is a combined venture, including the cultivation of mulberry plants,
rearing of cocoons and reeling silk. The Mysore silk is known for its quality and
traditional designs, which attracted the people not only at the national level but also at
the international level. During 2009-10, a total of 2049.7 hectares of land was
cultivated with mulberry and 934.84 metric tonnes of cocoons was produced during
the same year and thus the cropping has given good returns to the growers. The
Central Government has established a Central Sericulture Research Training Centre at
Mysore to help with the farmers. For transacting and getting good prices for cocoons
produced in Mysore district, the cocoon markets have been established at Nanjangud,
T. Narasipura and Hunsur.
Fisheries
Mysore district is endowed with inland fisheries through its rivers and their
tributaries and also the reservoirs, tanks, ponds, irrigation wells and the like. The
district has 465 km of rivers; there are as many as 210 large lakes and 760 small lakes
available for various purposes including irrigation, covering a water territory of
18,472 hectares for fisheries. During the year 2009-10, 1.5 million nursery fishes have
been released into them towards fisheries development. The total fishes caught during
the same year are about 7,866 tonnes. The Zilla Panchayat under the State sector has
helped many beneficiaries to be engaged in self-employment in this profession. At
present, the fisheries provide good income to the Government apart from providing
employment to thousands of people.

75
Industry
There are 11 weaving factories, 70 chemical factories, 104 engineering factories
and 400 other factories in Mysore district. Totally, there were 591 factories in the district
as on 31.03.2010. A majority of these factories is not only the source of income to the
Grama Panchayats but also provide employment to 53,058 people in the district.
Transport and Communications
Mysore district is connected by air, rail and road. Mandakalli Air Port is just 12
km away from the city of Mysore. The total length of railroads in the district is 120 km,
with 16 railway stations. The district is connected by the National Highways (79.60 km),
State Highways (718.48 km), and district main roads (2,581.48 km). Particularly,
communication refers to the availability of a bus stop, and / or a railway station within the
limits of a village concerned. The total length of roads is 6,808.8 km (which includes
village roads, TDB roads, forest roads, Irrigation Department roads, and Municipality and
Panchayat roads. The total length of the pucca roads is 3,690 km (Map 3.15).
Map – 3.15 : Transport and Communications in Mysore District
There were 414 post offices, 315 telegraph offices, 87 telephone exchanges
with 96,721 telephone connections in operation during the year 2009-10.

76
Banking Industry
Mysore District is known for its banking industry. There are 242 branches of
commercial banks, 82 branches of rural banks, 11 urban co-operative banks and other
co-operative banks. They are functioning directly or indirectly boosting the rapid
growth of economy of the district. A total of Rs. 3323.14 millions have been
distributed in the district as loans for various purposes by 7 branches of Primary Land
Development Banks.
3.9 Human Development in Mysore District
Human development indices for the district, according to the Mysore District
Human Development Report 2008, show wide variations among taluks when
computed for education, income and health, and of course human development. In all
the four indices, Mysore taluk tops the list, with 0.853 for education, 0.624 for
income, 0.778 for health and 0.752 for human development (composite) and thus
ranks first among the taluks of the district of Mysore (Table 3.16).
For 2007, using State methodology 2005, educational index ranges from 0.652
(Nanjangud taluk) to 0.853 (Mysore taluk), while income index has a range of 0.540
(H.D.Kote taluk) to 0.624 (Mysore taluk), health index from 0.778 (Mysore taluk) to
0.701 (K.R. Nagar taluk) and human development 0.644 (H.D. Kote taluk) to 0.752
(Mysore taluk). Thus the taluks that have the least index in education, income, health
and human development are different.
The district indices are 0.713 (education), 0.573 (income), 0.723 (health) and
0.670 (human development). In education, all the taluks of the district are well above
the district education index of 2001 (0.669), whereas 4 taluks are below the district
income (0.561; H.D. Kote, K.R. Nagar, Periyapatna and T, Narasipura). On the other
hand, five taluks (H.D. Kote, K.R. Nagar, Nanjangud, Periyapatna and T. Narasipura)
are below the district human development index (0.670). Based on the human
development indices, the rank orders are the following for the taluks: Mysore (1),
Hunsur (2), Nanjangud (3), Periyapatna (4), K.R. Nagar (5), T. Narasipura (6) and
K.D. Kote (7). The rank orders in regard to education, income and health indices are
different. The district has had the following indices in the year 2001: education 0.669;
income 0.561; health 0.663; and human development 0.631. In comparison to the

77
2007 indices, these are relatively lower than the indices for the year 2007. Even the
State indices (0.712 for education; 0.559 for income; and 0.650 for human
development) are relatively smaller than the district indices for 2007, except of course
for health which stands at 0.680 for State in 2001 and district in 2007.
Table – 3.16 : Human Development Index 2007 (State 2005 Methodology)
Taluks Education Index Income Index Health Index HDI Rank
H. D. Kote 0.680 0.540 0.711 0.644 7
Hunsur 0.716 0.598 0.729 0.681 2
K .R. Nagar 0.706 0.547 0.701 0.651 4
Mysore 0.853 0.624 0.778 0.752 1
Nanjangud 0.652 0.602 0.732 0.662 6
Periyapatna 0.703 0.557 0.704 0.655 3
T. Narsipura 0.684 0.542 0.708 0.645 5
District Total 0.713 0.573 0.723 0.670
District 2001 0.669 0.561 0.663 0.631
State 2001 0.712 0.559 0.680 0.650
Source: Computed using State 2005 Methodology for Human Development.
As shown in Table 3.17, human development indices computed using State
2007 methodology are relatively smaller than those computed using State 2005
methodology. It appears that the HDI methodologies have become more robust in the
two years between 2005 and 2007. Mysore taluk ranks first in all indices with 0.746
for education (Map 3.16), 0.624 for income (Map 3.17), 0.778 for health (Map 3.18)
and 0.716 for human development (Map 3.19). Najangud taluk has the least at 0.554
for education, H.D. Kote has the least at 0.540 for income, K.R. Nagar has the least at
0.701 for health and H.D. Kote has also the least at 0.604 for human development
using 2007 methodology. The district indices for the various components stand at
0.607 for education, 0.573 for income, 0.723 for health and 0.634 for human
development in 2007 using State 2007 methodology. In comparison, the district
indices in 2001 were (a) relatively bigger in education with 0.669 against 0.607 and in
health with 0.663 against 0.723 and (b) relatively smaller in human development with
0.631 against 0.634 and in income with 0.561 against 0.573.

78
Table – 3.17 : Human Development Index 2007 (State 2007 Methodology)
Taluks Education Index Income Index Health Index HDI Rank
H. D. Kote 0.561 0.540 0.711 0.604 7
Hunsur 0.601 0.598 0.729 0.643 2
K .R. Nagar 0.606 0.547 0.701 0.618 5
Mysore 0.746 0.624 0.778 0.716 1
Nanjangud 0.554 0.602 0.732 0.629 3
Periyapatna 0.604 0.557 0.704 0.622 4
T. Narsipura 0.580 0.542 0.708 0.610 6
District Total 0.607 0.573 0.723 0.634
District 2001 0.669 0.561 0.663 0.631
State-2001 0.712 0.559 0.680 0.650
Source: Computed using State 2007 Methodology for Human Development.
Map – 3.16 : Mysore District: Educational Index 2007

79
Map – 3.17 : Mysore District: Income Index 2007
Map – 3.18 : Mysore District: Health Index 2007

80
Map – 3.19 : Mysore District: Human Development Index 2007
The State indices for 2001 stand relatively larger only for education, only in
some cases for health and human development and smaller for income. There is a
slight change in the rank orders for the human development index of 2007 for the
district, computed using State 2007 methodology to those indices computed using
State 2005 methodology: Mysore taluk (1), Hunsur taluk (2), Nanjangud taluk (3),
Periyapatna taluk (4), K.R. Nagar taluk (5), T. Narasipura taluk (6) and H.D. Kote
taluk (7). Thus the relative positions of Mysore and H.D. Kote taluks have not
changed with the changed methodology.
3.10 Conclusion
A richly historical and heritage district, Mysore district has a total population
of about 3 million (with 2.99 million in 2011). Mainly a table land (in the southern
Maidan), the district occupies 3.6 per cent (or 6,854 km2) of the total geographical
area of the State of Karnataka. It is one of the prosperous districts of the State with
1,328 revenue villages, 1,984 habitations, 236 gram panchayats and 226 wards. It has
a salubrious climate, pleasant almost throughout the year except in 3 summer months.
The annual average rainfall of the district is between 600 mm and 900 mm. The

81
climatic conditions are favourable for crops such as paddy, jowar, ragi, pulses,
sugarcane and tobacco. The Cauvery is the major river system running across the
district, enriching the adjacent district of Mandya as well. The natural vegetation is
both moist deciduous and dry deciduous and the forests cover 34.5 per cent of the
total geographical area of the district. The urban population is little more than a third
of the total population.
Resources for agriculture are benevolently endowed. The city of Mysore has
become a secondary IT-hub, attracting the Corporates and the infrastructures.
Lethargy in a salubrious climate is unthinkable but it visits everybody in the district.
Vagaries of the climate do affect production in agriculture. Looking at the decadel
growth of the population in the district, there has been a drastic change in growth
rates, from 26.4 per cent during 1961-71 to 24.48 per cent during 1981-91 and to
15.75 per cent during 1991-2001. In the middle of the decade 2001-11, the growth
rate has already reached 8.29 per cent. Mysore taluk is the only taluk that registers a
rate of growth of 10.41 per cent in the middle of the decade 2001-11, having been a
taluk fast growing population primarily due to in-migration into the city owing to
urbanization, industrialization and globalization. All other taluks have very quickly
declined in growth rates with ranges of 19.18 per cent (T.Narasipura) to 47.33 per
cent (H.D. Kote) during 1961-71 to 8.09 per cent (T. Narasipura) to 21.53 per cent
(Mysore) during 1991-2001. In 2006, the growth rates have reached 5.21 per cent in
Hunsur taluk to 10.41 per cent in Mysore taluk.
Human development indices for the Mysore district do show wide variations
among taluks, both in respect of individual components, that is, education, income
and health, and of course human development. In all the four indices, Mysore taluk
tops the list, with 0.853 for education, 0.624 for income, 0.787 for health and 0.752
for human development (composite). For 2007, using State methodology of 2005,
educational index ranges from 0.652 (Nanjangud taluk) to 0.853 (Mysore taluk),
while income index has a range of 0.540 (H.D.Kote taluk) to 0.624 (Mysore taluk),
health index from 0.778 (Mysore taluk) to 0.701 (K.R. Nagar taluk) and human
development 0.644 (H.D. Kote taluk) to 0.716 (Mysore taluk). Thus the taluks that
have the least index in education, income, health and human development are
different.