Embed Size (px)
Citation preview

57
Chapter 3
Modeling and Simulation of Dye-Sensitized Solar Cell
3.1. Introduction
In recent years, dye-sensitized solar cells (DSSCs) based on nanocrystalline mesoporous
TiO2 films have attracted much attention as a potential low-cost alternative to single or
polycrystalline p–n junction silicon solar cells. DSSCs can reach electrical energy conversion
efficiencies ≈12% [154, 284]. The traditional mesoporous TiO2 electrode composed of the TiO2
nanoparticles offer insufficient electron diffusion coefficient due to multiple trapping and de-
trapping events occurring in the porous semiconductor grain boundaries of the TiO2 nanoparticles
and ultimately reduces the efficiency [285]. Electrodes based on aligned nanorods of TiO2 have
emerged as a potential candidate for the improvement of electron diffusion coefficient and the
efficiency of DSSC due to their exceptional charge collection properties [285, 286]. Adachi
group has shown high conversion efficiency of 7.29% using TiO2 nanorods with lengths of 100-
300 nm and diameters of 20-30 nm synthesized by hydrothermal process [286]. There exists wide
literature on the modeling and experimental validation of DSSC [287-328]. But nanostructured
TiO2 electrode based DSSC is not fully explored for their dynamic behavior.
3.2. DC Modeling of TiO2 based DSSC
The band-diagram of DSSC is given in Fig. 1.7 and the detailed working is discussed in
chapter 1, section 1.8. Under a steady-state condition of illuminated DSSC, the electron injection
from excited dye molecules, transport in the mesoporous semiconductor (TiO2) thin film, and
recombination with electrolyte at the TiO2/electrolyte interface can be described by the following
electron diffusion differential equation [322-324]:
() − () + Φα exp(−αx) = 0 (3.1)
where n(x) is the excessive electron concentration at position x inside the mesoporous TiO2 thin
layer; n0 is the electron concentration under a dark condition (n0 = 1016
cm-3
) [287, 288]; τ is the
58
lifetime of conduction band free electrons; Φ is the incident irradiation intensity; α is the light
absorption coefficient of the mesoporous TiO2 thin layer; and D is the electron diffusion
coefficient. The effect due to transport of / redox electrolyte is neglected because the pore
sizes in DSSC are normally greater than or comparable to 14 nm [329]. In a steady state,
trapping-detrapping in the electron transport can be neglected and hence the electron lifetime τ is
assumed to be constant in a DSSC [322-324]. The general solution of Eq. (3.1) in terms of J-V
relationship, with short-circuit current and open-circuit voltage boundary conditions, can be
expressed as below:
= − exp(qV mk!T⁄ ) − 1% (3.2)
where is the photo-generated current density; is the reverse saturation current density; q is
the electron charge; m is the ideality factor; kB is the Boltzmann constant; and T is the absolute
temperature. In the Eq. (3.2), the photo-generated and reverse saturation current densities can be
expressed as below:
= &ΦLα [−L α cosh -./0 + sinh -./0 + L α exp(−dα)] 5(1 − 67α7) cosh -890:
(3.3)
and, = & Φ L α sinh (d/L) 56 cosh (;/6)< (3.4)
where L is the electron diffusion length equal to √>; d is the mesoporous TiO2 layer thickness;
and A is the area of the DSSC.
Further, the light absorption coefficient α and the electron diffusion coefficient D are
related to the porosity P of the mesoporous TiO2 layer by following expressions [322]:
α = 2.97 × 10D P7 for 0 ≤ P < 0.41 (3.5)
D = 1.69 × 10D(−17.48 P + 7.39 P7 − 2.89 P + 2.15) for 0 ≤ P < 0.41
(3.6)

59
α = 2568 (1 − P)(P + 2.89) for 0.41 ≤ P < 0.76 (3.7)
D = a |P − PR|µ for 0.41 ≤ P < 0.76 (3.8)
where a is equal to 4 x 10⁻⁴
cm2
s-1
; µ is equal to 0.82; and critical porosity PC is equal to 0.76.
This model is used to predict current-voltage characteristics of TiO2 nanoparticle based DSSC
(Fig. 3.1).
For the nanorod based electrode (Fig. 3.2), the porosity is dependent on the diameter of
nanorod and inter-rod distance as described by Eq. (3.9).
S = 2TU7 √3V7< (3.9)
where, w represents the diameter of nanorod and l represents center-to-center distance
among nanorods.
Figure 3.1: Schematic diagram of TiO2 nanoparticle-based dye-sensitized solar cell
The developed theoretical model is validated with TiberCAD software for both DSSC
(based TiO2 nanoparticle and nanorod) and experimental data available in the literature.

60
Figure 3.2: Schematic diagram of nanorod based dye-sensitized solar cell
3.2.1. Simulation
The one-dimensional (1-D) DSSC simulation is done using computer aided design
software, called TiberCAD. The TiberCAD uses a theoretical model consisting of a set of drift-
diffusion equations for the propagation of ions and electrons coupled with Poisson’s equation as
fully described by Gagliardi et al. [321]. The simulation was performed using a 1-D model of
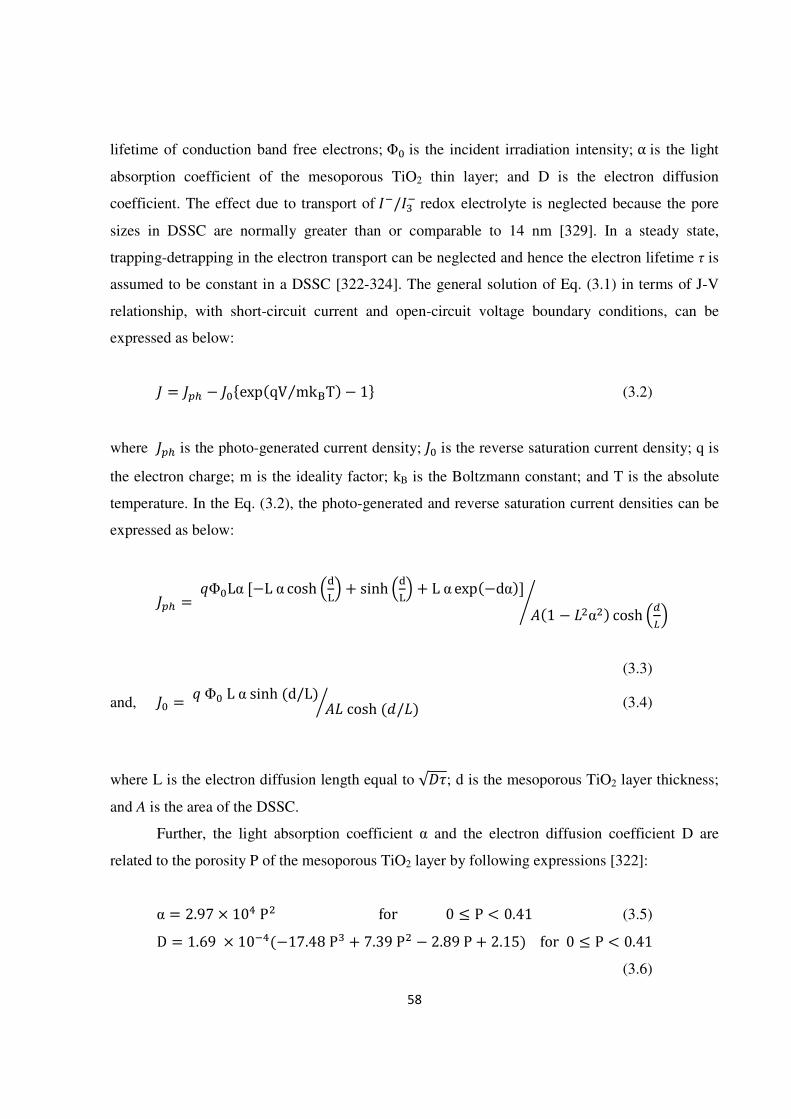
DSSC. It assumes that the DSSC has two physical regions as shown in Fig. 3.3:
Region 1: Mesoporous TiO2 layer, where light absorption, carrier generation and recombination
take place
Region 2: Electrolyte region
Two boundary points represent the photo-anode (left) and the counter-electrode (right).
61
Figure 3.3: 1-D model of DSSC for simulation in TiberCAD
The above mentioned model is used for simulating the nano-particle based TiO2 electrode
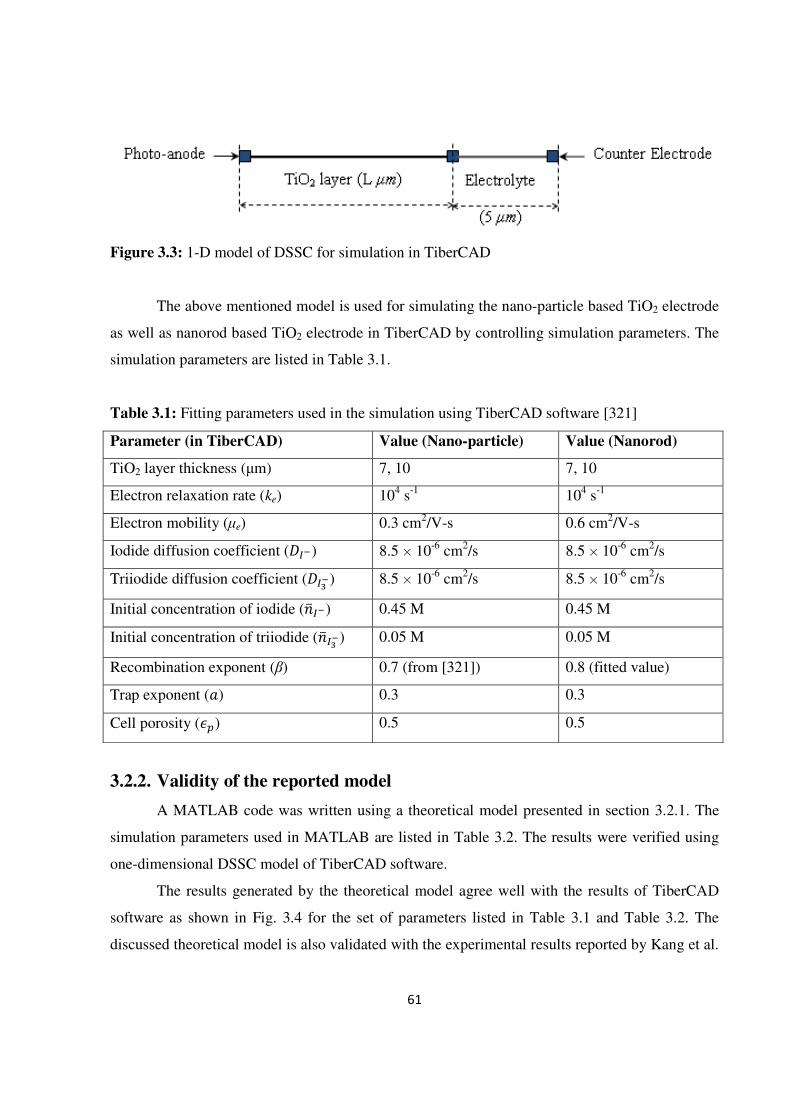
as well as nanorod based TiO2 electrode in TiberCAD by controlling simulation parameters. The
simulation parameters are listed in Table 3.1.
Table 3.1: Fitting parameters used in the simulation using TiberCAD software [321]
Parameter (in TiberCAD) Value (Nano-particle) Value (Nanorod)
TiO2 layer thickness (µm) 7, 10 7, 10
Electron relaxation rate (ke) 104 s
-1 10
4 s
-1
Electron mobility (µe) 0.3 cm2/V-s 0.6 cm2/V-s
Iodide diffusion coefficient (WX) 8.5 × 10⁻⁶
cm2/s 8.5 × 10
-6 cm
2/s
Triiodide diffusion coefficient (WYX) 8.5 × 10⁻⁶
cm2/s 8.5 × 10
-6 cm
2/s
Initial concentration of iodide (Z[WX) 0.45 M 0.45 M
Initial concentration of triiodide (Z[WYX) 0.05 M 0.05 M
Recombination exponent (β) 0.7 (from [321]) 0.8 (fitted value)
Trap exponent (\) 0.3 0.3
Cell porosity (]) 0.5 0.5
3.2.2. Validity of the reported model
A MATLAB code was written using a theoretical model presented in section 3.2.1. The
simulation parameters used in MATLAB are listed in Table 3.2. The results were verified using
one-dimensional DSSC model of TiberCAD software.
The results generated by the theoretical model agree well with the results of TiberCAD
software as shown in Fig. 3.4 for the set of parameters listed in Table 3.1 and Table 3.2. The
discussed theoretical model is also validated with the experimental results reported by Kang et al.

62
[270] and is shown in Fig. 3.5. The simulation parameters for experimental validation are listed
in Table 3.3.
Figure 3.4: Current-voltage characteristics of DSSC; A: for ~7 µm thick TiO2 electrode and B:
for ~10 µm thick TiO2 electrode for nano-particle (NP) and nanorod (NR)

Table 3.2: Simulation parameters used in MATLAB for the reported model
Parameter (in MATLAB)
Layer thickness (µm), d
Proportionality constant for
porosity (cm2/s), a
Power factor for diffusivity to porosity,
Critical Porosity, PC
Carrier Lifetime (ms), τ
Absolute temperature (K), T
Ideality factor, m
Porosity (Calculated value from the model)
Figure 3.5: Current-voltage characteristics of DSSC matched with the experimental
by Kang et al. [285]
63
Simulation parameters used in MATLAB for the reported model
Parameter (in MATLAB) Value (Nano-
particle)
Value
(Nanorod
7, 10 7, 10
Proportionality constant for diffusivity to 4 x 10⁻⁴
4 x 10
Power factor for diffusivity to porosity, µ 0.82 0.82
0.76 0.76
22 46
Absolute temperature (K), T 300 300
2.3 2.2
Porosity (Calculated value from the model) 0.5 0.5
voltage characteristics of DSSC matched with the experimental
Simulation parameters used in MATLAB for the reported model
Value
Nanorod)
Reference
7, 10 --
4 x 10⁻⁴
[322]
0.82 [322]
0.76 [322]
[285, 325]
--
Fitted value
Fitted value
voltage characteristics of DSSC matched with the experimental data reported

64
Table 3.3: Simulation parameters used in MATLAB for experimental validation (rest of the
parameters remain same as given in Table 3.2)
Parameter (in MATLAB) Value (Nano-
particle)
Value
(Nanorod)
Reference
Layer thickness (µm), d 7.5 7.1 [285]
Ideality factor, m 3.7 3.7 Fitted value
Porosity (%) 55.9% 53.4% [285]
The reported theoretical model generated data match well with experimentally reported
current-voltage characteristics of a nano-particle (NP) and nanorod (NR) based dye sensitized
solar cell as shown in Fig. 3.5. This confirms the validity of the theoretical model presented here.
3.2.3. Results and Discussion
The considerable shift in the current-voltage curve of nanorod as compared to the current-
voltage curve of nano-particle may be attributed to reduced intercrystalline contacts between
grain boundaries and stretched grown structure to the specific directionality made a slightly
favorable contribution to the electron transport [285]. There may be several reasons for
improvement of output power from the nanorod based DSSC:
1. Improved carrier lifetime by the degraded charge recombination through experiencing the
less frequent trapping/detrapping events
2. Low recombination rate as demonstrated by the parameters listed in Table 3.1
3. Slightly improved electron transport due to the necking of grain boundaries and increased
average crystallite size
The dependence of short-circuit current density (JSC) on the diameter of the nanorod is shown
in the Fig. 3.6. The short-circuit current density increases with an increase in the nanorod
diameter up to 80 nm and afterwards falls drastically. The observed effect may be attributed to
the variation in the porosity of the TiO2 electrode layer, which decreases with increasing diameter
as shown in the Fig. 3.7. The increase in current density with increasing nanorod diameter may be
attributed to decrease in the grain boundaries and increase in grain size. But the control parameter

65
is the porosity of the TiO2 electrode layer which decreases with increasing diameters of the
nanorod (Fig. 3.7).
Figure 3.6: The dependence of the current-density on the nanorod diameter for inter-rod
separation of 200 nm
From these results it is evident that the nanorod diameter plays a crucial role in the
improvement of JSC of dye-sensitized solar cell. The nanorods of diameter from 65 nm to 90 nm
with porosity range from 0.43 to 0.66 would result in better performing DSSC as observed in Fig.
3.6 and Fig. 3.7.

66
Figure 3.7: Variation in porosity with respect to the nanorod diameter
3.3. AC Modeling of DSSC
3.3.1. Prediction of I-V curve of DSSC
An operating DSSC is principally governed by the relative kinetic rates of several charge
transfer steps. The charge transfer taking place from excited dye to TiO2 nanoparticle, from
electrolyte to the dye and from TiO2 to the load terminal plays very critical role in the
performance of DSSC. Thus, it is very important to understand all the electronic processes taking
place at the TiO2 nanoparticles level, as well as the dynamics of charge separation and charge
transport at the metal/oxide interface.
Since in DSSCs, the function of light absorption is separated from the charge carrier
transport, the dye should have a broad absorption spectrum in order to harvest the maximum
amount of solar radiation. The excited-state of the dye must energetically lie above the
conduction band edge of the TiO2 nanoparticles to assure fast electron injection, before it can fall
back to its ground state [328]. On the other hand, the oxidized dye must have a higher positive
potential than the redox-couple in the electrolyte. Thus, the regeneration of the dye by the redox

67
electrolyte must be extremely fast compared with the recombination of the injected electrons with
the oxidized dye.
The redox electrolyte is responsible for the dye regeneration, becoming oxidized by
electron injection to the TiO2 conduction band. Moreover, the electrolyte conducts the positive
charges (holes) to the counter-electrode, where the redox-couple itself is regenerated. As the
open-circuit voltage of the system corresponds to the difference between the redox potential of
the electrolyte and the TiO2 Fermi level, the redox potential must be as positive as possible in
order to assure high open-circuit voltages and to overcome the problem related to slow charge-
transfer reaction at the counter-electrode, a platinum-based catalyst must be employed. On the
other hand, the voltage at the semiconductor/dye interface should be high, since the dark current
caused by the electron back transfer to the electrolyte decrease the number of electrons available
for photocurrent.
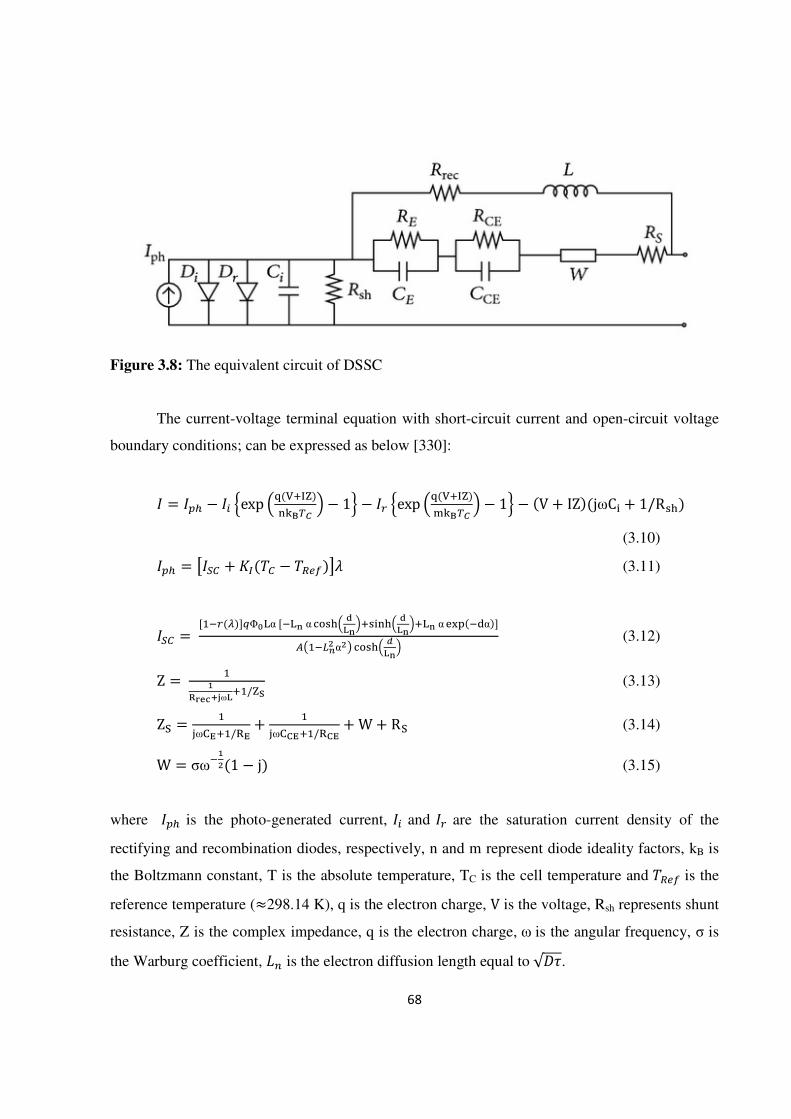
A standard DSSC consists of three interfaces formed by FTO/TiO2, TiO2/dye/electrolyte,
and electrolyte/Pt-FTO represented by an equivalent circuit shown in Fig. 3.8 [330]. The
interfacial charge transfer at the TiO2/dye/electrolyte is characterized by a rectifying diode Di and
a double-layer capacitance Ci. A recombination diode Dr with an ideality factor, m is employed to
denote the interfacial charge recombination losses to both the dye cation and the redox
electrolyte. A shunt resistance Rsh takes into account all parallel resistive losses across the
photovoltaic device including leakage current. The photo generated current Iph is in parallel with
the rectifying diode. An inductive recombination pathway on account of charge-transfer current
[330] is incorporated into the circuit, consisting of a recombination resistance (Rrec) in series with
an inductor (L). The charge-transfer resistance and interfacial capacitance at the FTO electrode
and electrolyte/Pt-FTO interface are characterized by RE and CE, and RCE and CCE, respectively.
The Nernst diffusion of the carrier transport by ions within the electrolyte is denoted by the
Warburg impedance (W). A resistance element RS represents the bulk and contact resistive losses
present in a DSSC, such as the sheet resistance of the FTO glass.
68
Figure 3.8: The equivalent circuit of DSSC
The current-voltage terminal equation with short-circuit current and open-circuit voltage
boundary conditions; can be expressed as below [330]:
= − _exp -`(abcd)efghi 0 − 1j − k _exp -`(abcd)lfghi 0 − 1j − (V + IZ)(jωCq + 1/Rst)
(3.10)
= uvw + xW(yw − yz|)~ (3.11)
vw = [k()]Φ/α [/ α Rst- 0bsqet- 0b/ α(.α)]9 α Rst- 0 (3.12)
Z = ωb/d (3.13)
Z = ωb/ + ωb/ + W + R (3.14)
W = σω(1 − j) (3.15)
where is the photo-generated current, and k are the saturation current density of the
rectifying and recombination diodes, respectively, n and m represent diode ideality factors, kB is
the Boltzmann constant, T is the absolute temperature, TC is the cell temperature and yz| is the
reference temperature (≈298.14 K), q is the electron charge, V is the voltage, Rsh represents shunt
resistance, Z is the complex impedance, q is the electron charge, ω is the angular frequency, σ is
the Warburg coefficient, 6 is the electron diffusion length equal to √>.
69
The photocurrent density ( ) mainly depends on the solar insolation and on the
operating temperature of the cell. The saturation current of a solar cell varies with the cell
temperature, which is described by Eq. (3.20) and Eq. (3.21) [153, 331]:
= zv hih ¡ exp ¢£¤¥ ¦ ¦i§¨© ª (3.20)
k = zv7 hih ¡/7 exp ¢£¤¥ ¦ ¦i§«¨© ª (3.21)
where, ¬ represents the band-gap of the N719 dye molecule (≈ 1.6 eV). The reverse saturation
current of the cell at a reference temperature depends on the open-circuit voltage (VOC) and can
be approximately obtained by following equation as given by Tripathi et al. [331] and Tsai et al.
[332]:
zv = vw/[exp(&® w/°±Zyw) − 1] (3.22)
The value of IRS2 is approximated as:
zv7 = vw/[exp(&® w/°±²yw) − 1] (3.23)
3.3.2. Prediction of dynamic resistance of DSSC
Due to the nonlinear I-V characteristic curve of the DSSCs, it is difficult to analyze and
determine their output impedance, i.e., dynamic resistance. It is necessary to develop an efficient
method to determine the dynamic resistance that corresponds to maximum power point (MPP) of
DSSC. Being the dynamic quantity, the dynamic resistance is determined by the derivative of the
I-V characteristics of the cell and is defined as the change in voltage divide by change in current
(;®«/;«) at MPP. In addition to this, the dynamic resistance is composed of series resistance
and shunt resistance. A DSSC mainly consists of three types of resistances: series resistance (RS),
shunt resistance (Rsh) and dynamic resistance (Rd) as shown in Fig. 3.9. The series resistance RS,
can be determined by various illumination conditions such as dark, constant illumination and
varying illumination and they yield different results [333]. Practically, RS is determined by using
two different illumination levels, the so-called two-curve method. Shunts resistance, Rsh, can be
obtained from only one illuminated I-V curve, or single curve method. The output impedance of

70
solar PV module, i.e., dynamic resistance is usually composed of the series resistance and shunt
resistance.
Using this method the dynamic resistance of the DSSC can be determined from single I-V
characteristic curve under illumination. The model of the dynamic resistance with the
combination of the finite series resistance and shunt resistance is also taken into consideration.
Through the developed model, the effect of light intensity and temperature on the I-V
characteristics and dynamic resistance of the DSSC is studied.
Figure 3.9: The components of resistance offered by DSSC
The terminal equation for current and voltage of the DSSC based on two-diode model
(Eq. (3.11)) can be modified under the static condition (ω ≈ 0) as given below [153, 330]:
= − _exp -`(abcd)efg³ 0 − 1j − k _exp -`(abcd)lfg³ 0 − 1j − ((V + IZ)/Rst) (3.24)
Eq. (3.24) is rearranged and the modified equation given by,
71
+ + k − − -abcd´µ 0 = exp -`(abcd)efg³ 0 + k exp -`(abcd)lfg³ 0 (3.25)
In order to estimate the dynamic resistance Eq. (3.24) is subjected to following boundary
conditions:
(i) 0 < V < Vm and Im < I < ISC
(ii) Vm < V < VOC and 0 < I < Im
For first boundary condition, Ir>> Ii, so the Eq. (3.25) can be rearranged as:
`(abcd)lfg³ = ln ´µuc·µbW¸bW¹ccd´µW¹ (3.26)
From Eq. (3.26), the voltage across a load at one illumination level is given as:
V = lfg³` × ln ´µuc·µbW¸bW¹ccd´µW¹ − IZ (3.27)
At any two operating points (V1, I1) and (Vm, Im) on a single I-V curve, the relationship
between V and I are:
V = lfg³` × ln ´µuc·µbW¸bW¹ccd´µW¹ − IZ (3.28)
Vl = lfg³` × ln ´µuc·µbW¸bW¹cºcºd´µW¹ − IlZ (3.29)
For second boundary condition, Ir<< Ii, so the Eq. (3.25) can be rearranged as:
`(abcd)lfg³ = ln ´µuc·µbW¸bW¹ccd´µW¸ (3.30)
From Eq. (3.30), the voltage across a load at one illumination level is given as:
V = efg³` × ln ´µuc·µbW¸bW¹ccd´µW¸ − IZ (3.31)
At any two operating points (Vm, Im) and (V2, I2) on a single I-V curve, the relationship
between V and I are:
Vl = efg³` × ln ´µuc·µbW¸bW¹cºcºd´µW¹ − IlZ (3.32)

72
V7 = efg³` × ln ´µuc·µbW¸bW¹ccd´µW¹ − I7Z (3.33)
From Eq. (3.28) to Eq. (3.33), the Z can be rewritten as:
» = ¼¼WW − (le)fg³` × ln ´µuc·µbW¸bW¹ccd´µuc·µbW¸bW¹ccd (3.34)
Eq. (3.34) can be simplified as a shunt resistance is normally much greater than series
impedance Z. Thus RstuIt + + k − I>>IZ and RstuIt + ^ + k − I7>>I7Z. Therefore,
» = ¼¼WW − (le)fg³` × ln uc·µbW¸bW¹cuc·µbW¸bW¹c (3.35)
The first term of Eq. (3.35) is essentially a slope at any operating point or the external
dynamic resistance, RD. The second term is the internal dynamic resistance, Rd of the DSSC.
For the open circuit condition and short-circuit conditions DSSC, following two
expressions are given using the slope of one I-V characteristics at the points (VOC, 0) and (0, ISC)
by
½¾ = − ¿8W8¼À¼Á¼Âi¡ (3.36)
and ½¾ = − ¿8W8¼ÀWÁWÃi¡ (3.37)
respectively. The dynamic resistance increases with the increase in temperature because of
marginal increase in short-circuit current [334-336]. Based on the theoretical model described
above, the DSSC is simulated using MATLAB/Simulink.
3.3.3. Validation and analysis of developed model
3.3.3.1. Current-voltage characterization
Current-voltage (I-V) characterization is very significant technique to study the non-linear
response of the DSSC under dark and illuminated conditions. The simulated I-V characteristic of
DSSC was experimentally validated by comparison with data from Grätzel [337] as shown in Fig.
3.10.

.
Figure 3.10: Simulated I-V curve matching well with the reported experimental data [
The input data used for simulation purposes are compiled in Table
Table 3.4: Values of model parameters used in simulated
Iph
(mA/cm2)
Ii
(mA/cm2)
Ir
(mA/cm2)
16.9 0.4×10⁻¹⁶ 1.4×10⁻¹⁰
It is evident from Fig.
experimental data. The reported cell’s efficiency of 11.04% (
PMAX = 11.04 mW; RS = 12.6
the DSSC having efficiency of 10.85% (
RS = 10.85 Ω). The experimental and simulated I
parameters RS, Rsh, Di and D
73
V curve matching well with the reported experimental data [
The input data used for simulation purposes are compiled in Table
Values of model parameters used in simulated I-V curves and Nyquist plots [
)
Ci
(F)
Rsh
(F)
Rrec
(Ω)
RE
(Ω)
CE
(mF)
R
(Ω
10 3000 4.2 21.7 0.8 9.8
It is evident from Fig. 3.10 that the outlined model agrees quite well with the
experimental data. The reported cell’s efficiency of 11.04% (JSC = 16.9 mA/cm
= 12.6 Ω) [337] is in straight agreement with the simulated
ciency of 10.85% (JSC = 16.9 mA/cm2; VOC = 862 mV; P
). The experimental and simulated I-V curves were fitted by means of the
and Dr.
V curve matching well with the reported experimental data [337]
The input data used for simulation purposes are compiled in Table 3.4.
curves and Nyquist plots [330]
RCE
(Ω)
CCE
(μF)
σ
(Ω s-1/2
)
RS
(Ω)
9.8 19 4.2 12.6
that the outlined model agrees quite well with the
= 16.9 mA/cm2; VOC = 862 mV;
] is in straight agreement with the simulated parameters of
= 862 mV; PMAX = 10.85 mW;
V curves were fitted by means of the
74
The curve at 0.65 sun and 0.1 sun were subsequently calculated using the same parameter
as at 1 sun, by only changing the light intensity in the simulation (i.e., the recombination constant
and the quantum injection yield are taken to be independent of light intensity). It can be seen that
short-circuit current, maximum power point and the open circuit voltage are in general agreement
with the experimental results.
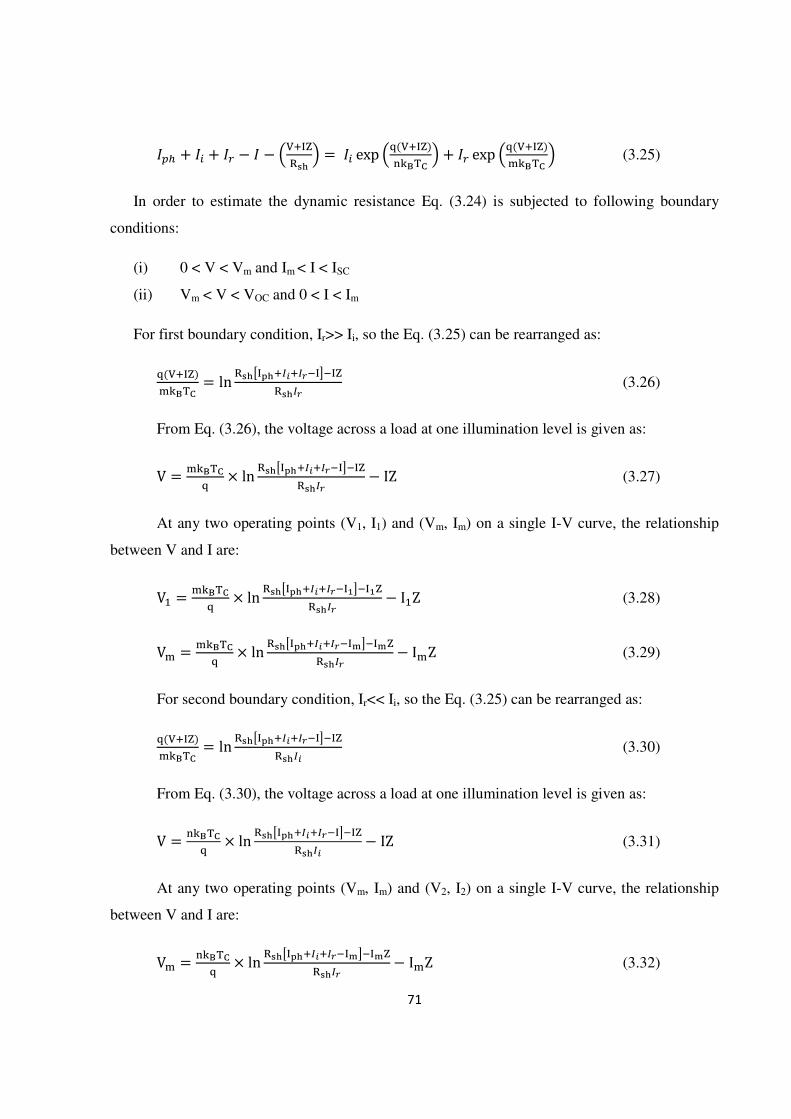
3.3.3.2. Electrochemical impedance spectroscopy
In the Nyquist plots, the respective electrochemical steps with different time constants are
represented by the semicircles as shown in Fig. 3.11. Three semicircles correspond to three
interfaces formed by FTO/TiO2, TiO2/dye/electrolyte and electrolyte/Pt-FTO [337-339]. The
triiodide diffusivity was obtained by fitting the experimental EIS spectra under illumination to an
appropriate electrical analogue [282, 340]. The diffusion of in the electrolyte is usually well
described by Nernst diffusion impedance, characterized by Warburg parameter and a
characteristic diffusion time constant [341, 342]. Due to excess of ions compared to , the
former does not contribute to the diffusion impedance [343].
Figure 3.11: The EIS of simulated DSSC matches well with reported data [344]
75
The low-frequency semi arc of the Nyquist plot represents the electrolyte–platinum
interface and may be expressed as a charge-transfer resistance and a double layer capacitance
[330]. Impedance spectra are simulated over a frequency range of 0.01–106 Hz with AC
amplitude of 10 mV. The values of model parameters used in the simulation are summarized in
Table 3.4. The values of Ii and Ir are found to be of the orders of 10−15
and 10−10
A/cm2,
respectively. The inductor L is 10–100 H [344]. The double-layer capacitance Ci is determined to
be of the order of 10 F. The large capacitance value at the TiO2/dye/electrolyte interface (Ci) is
likely to result from the large surface area of the nanocrystalline TiO2 structure [330]. The length
between the intercepts at the real axis corresponds to the charge-transfer resistance (Rct) of the
component. The double-layer capacitance (Å^) is determined from the characteristic frequency, Å^ = (½ÆÇÈ«É) [345]. The resistance elements Rrec, RE, RCE, and RS are typically several
ohms for a highly efficient solar cell. The interfacial capacitances CE and CCE are of the orders of
1 mF and 1 µF, respectively.
3.3.4. Results and discussion
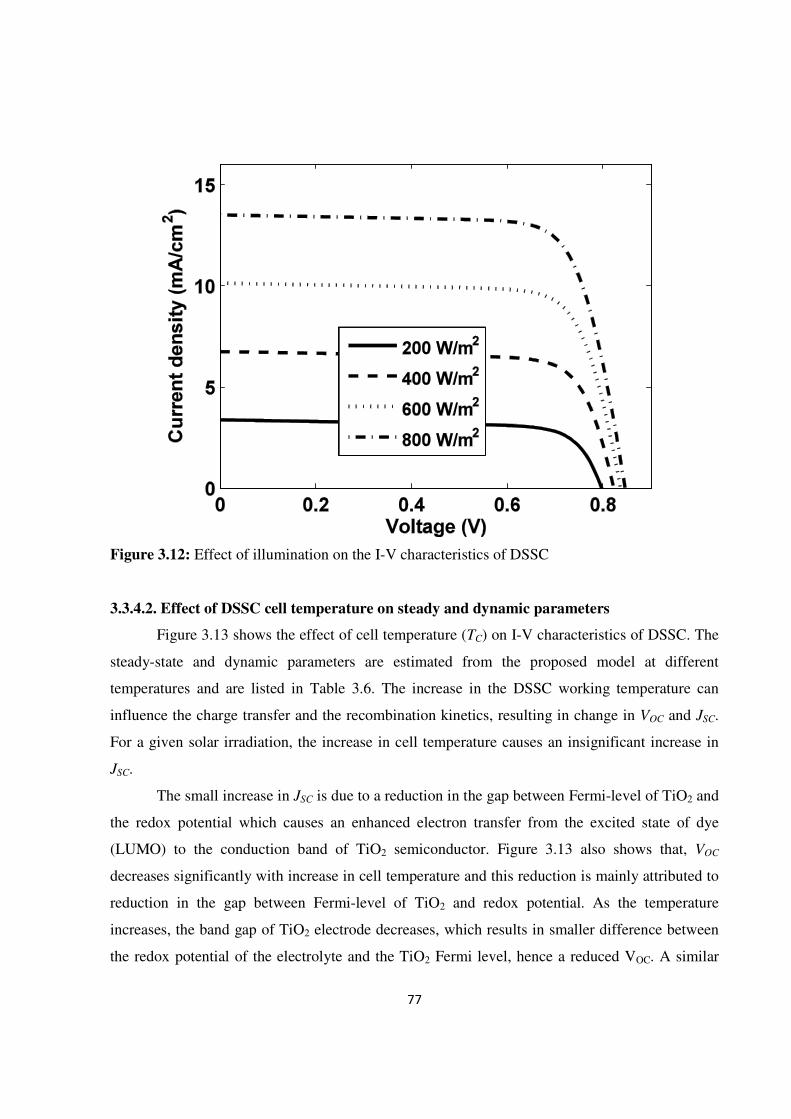
3.3.4.1. Effect of illumination on steady and dynamic parameters
The model proposed in section 3.3 is used to estimate the I-V characteristics of the DSSC.
The static parameters (ISC, VOC, PMAX and RS) of the DSSC are estimated under STC conditions.
The simulated current-voltage characteristics of the DSSC are shown in Fig. 3.12 as a function of
incident illumination at constant cell temperature. The increase in radiation intensity increases the
number of photons striking the DSSC, resulting in enhanced dye excitation and electron transfer
in the TiO2 conduction band, and consequently in a larger photocurrent.
The values of the dynamic resistance at MPP are computed using the values of Iph, ISC and
RS. The dynamic resistance of DSSC cell is calculated in an effective manner using a
mathematical model given in section 3.3, and reported in Table 3.5. From the data given in Table
3.5, the series resistance, RS shows a decreasing trend continuously with increase in the intensity
of illumination.

76
Table 3.5: Effect of illumination on steady state and dynamic parameters of DSSC at 298.14 K
Illumination
(W/m2)
ISC
(mA/cm2)
VOC
(mV)
PMAX
(mW)
RS
(Ω)
Rd
(Ω)
Efficiency,
η (%)
200 3.4 804.7 2.0 38.28 619.21 10.00
400 6.8 829.5 4.3 18.52 306.55 10.75
600 10.1 843.7 6.6 12.4 148.94 11.00
800 13.5 853.6 8.8 9.66 90.34 11.00
The calculated DSSC dynamic resistance values show a strong dependence on solar
irradiation, which is similar to the trend observed in silicon solar cells [346]. The decrease in
dynamic resistance with increase in solar radiation is attributed to a decreased RS value. This is
primarily caused by the logarithmic increase in VOC and a linear increase in DSSC photocurrent
with increasing illumination. The linear boost in ISC is attributed to the increased dye-photon
interaction and to the enhanced number of carriers injected from the excited dye molecules to the
conduction band of TiO2 electrode. A logarithmic dependence of VOC on the illumination is
observed in the DSSC and shown in Fig. 3.12. The dependence of VOC on the illumination (~) is
given by [347]:
® wα ¨©hi ln (~) (3.38)
The open-circuit voltage, VOC is dependent on the saturation current density of the
recombination diode (as described in section 3.3). From this study it is evident that the saturation
current density of the recombination diode (Ir) is independent of the illumination intensity. This is
mainly due to the insignificant change in magnitude of transport recombination, which governs
the electron transport process occurring either in TiO2 nanoparticle interfaces or at the electrode-
electrolyte interface [348].
77
Figure 3.12: Effect of illumination on the I-V characteristics of DSSC
3.3.4.2. Effect of DSSC cell temperature on steady and dynamic parameters
Figure 3.13 shows the effect of cell temperature (TC) on I-V characteristics of DSSC. The
steady-state and dynamic parameters are estimated from the proposed model at different
temperatures and are listed in Table 3.6. The increase in the DSSC working temperature can
influence the charge transfer and the recombination kinetics, resulting in change in VOC and JSC.
For a given solar irradiation, the increase in cell temperature causes an insignificant increase in
JSC.
The small increase in JSC is due to a reduction in the gap between Fermi-level of TiO2 and
the redox potential which causes an enhanced electron transfer from the excited state of dye
(LUMO) to the conduction band of TiO2 semiconductor. Figure 3.13 also shows that, VOC
decreases significantly with increase in cell temperature and this reduction is mainly attributed to
reduction in the gap between Fermi-level of TiO2 and redox potential. As the temperature
increases, the band gap of TiO2 electrode decreases, which results in smaller difference between
the redox potential of the electrolyte and the TiO2 Fermi level, hence a reduced VOC. A similar

78
decrease in VOC with increase in temperature of DSSC’s has been reported elsewhere [348].
Another significant factor which governs the decrease in VOC is the charge transfer and
recombination which occurs at the dye-electrode interface, electrolyte-dye interface and
electrolyte-counterelectrode interface.
Figure 3.13: The effect of cell temperature on the I-V curve of DSSC
Table 3.6: Effect of temperature on steady state and dynamic parameters of DSSC at 800 W/m2
Temperature
(K)
ISC
(mA/cm2)
VOC
(mV)
PMAX
(mW)
RS
(Ω)
Rd
(Ω)
Efficiency,
η (%)
Ir
(A/cm2)
Ii
(A/cm2)
298 13.5 853.6 8.8 9.66 90.34 11.00 3.22×10⁻⁷
1.04×10⁻¹³
303 13.5 827.4 8.5 10.05 96.77 10.62 5.84×10⁻⁷
3.41×10⁻¹³
308 13.6 801.2 8.1 10.45 102.95 10.12 1.04×10⁻⁶ 1.08×10⁻¹²
313 13.6 774.9 7.8 10.88 108.64 9.75 1.82×10⁻⁶
3.31×10⁻¹²
79
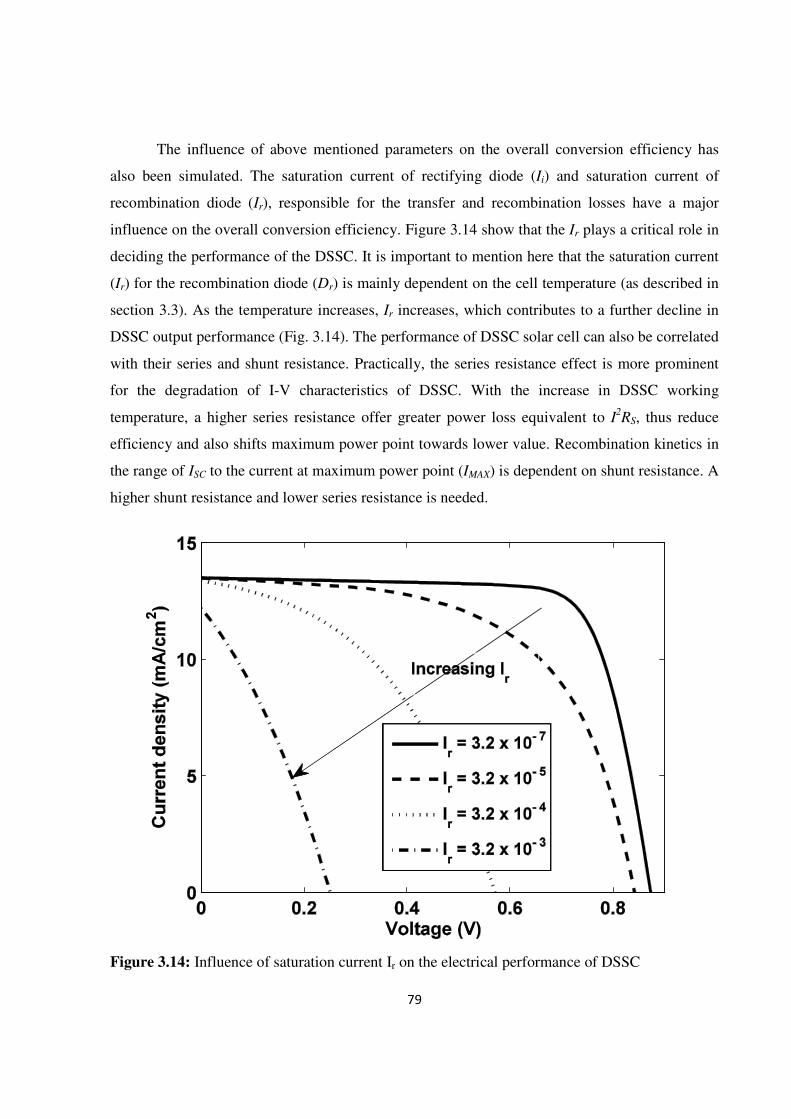
The influence of above mentioned parameters on the overall conversion efficiency has
also been simulated. The saturation current of rectifying diode (Ii) and saturation current of
recombination diode (Ir), responsible for the transfer and recombination losses have a major
influence on the overall conversion efficiency. Figure 3.14 show that the Ir plays a critical role in
deciding the performance of the DSSC. It is important to mention here that the saturation current
(Ir) for the recombination diode (Dr) is mainly dependent on the cell temperature (as described in
section 3.3). As the temperature increases, Ir increases, which contributes to a further decline in
DSSC output performance (Fig. 3.14). The performance of DSSC solar cell can also be correlated
with their series and shunt resistance. Practically, the series resistance effect is more prominent
for the degradation of I-V characteristics of DSSC. With the increase in DSSC working
temperature, a higher series resistance offer greater power loss equivalent to I2RS, thus reduce
efficiency and also shifts maximum power point towards lower value. Recombination kinetics in
the range of ISC to the current at maximum power point (IMAX) is dependent on shunt resistance. A
higher shunt resistance and lower series resistance is needed.
Figure 3.14: Influence of saturation current Ir on the electrical performance of DSSC

80
It should be mentioned here that the saturation current (Ir) for the recombination diode
(Dr) in a two-diode model is mainly dependent on the cell temperature (as described in section
3.3). As temperature increases, Ir increases, which contributes to a further decline in DSSC
output performance (Fig. 3.14).
3.4. Conclusions
In this chapter modeling and simulation is done to explore the effect of various
parameters on the electrical performance of TiO2 nanoparticle/nanorod based dye-sensitized solar
cells. The model could be validated by simulation software TiberCAD and the experimental
results available in the literature. The results show that the porosity decreases with increasing
diameter of nanorod for a fixed value of inter-rod separation. The short-circuit current density can
be improved by optimizing the nanorod diameter. From this study it is observed that the nanorods
of diameter from 65 nm to 90 nm with porosity range from 0.43 to 0.66 would result in best
performing DSSC. Further, The steady-state current–voltage curve and dynamic response of a
DSSC is mathematically modeled based on the electrical equivalent circuit. The effect of
temperature and illumination on the steady state and dynamic parameters of dye-sensitized solar
cells are studied. It is found that the dynamic resistance of DSSC decreases from 619.21 Ω to
90.34 Ω with an increase in illumination level from 200 W/m2 to 800 W/m
2. A positive
temperature coefficient of dynamic resistance is observed. The interfacial charge transfer and
recombination losses at the oxide/dye/electrolyte interface are found to be the most influential
factor in the overall conversion efficiency and included in the mathematical model. The
saturation current of rectifying diode and saturation current of recombination diode are
responsible for the transfer recombination losses and have major influence on the overall
conversion efficiency.