Embed Size (px)
Citation preview


Chapter 3: Materials and Methods
26
3.1. Plant material
For present investigation seeds of different varieties of rice were collected. The
certified and disease free seeds of O. sativa L. (var. Pusa Basmati-1 cv. Indica) were
procured from Indian Agricultural Research Institute (IARI), New Delhi, India. For a
part of experiment, seeds of rice variety IR-64 were obtained from Punjab Agriculture
University (PAU), Ludhiana, Punjab, India and Luna Suvarna (CR Dhan 403) and Luna
Sankhi (CR Dhan 405) were collected from Central Rice Research Institute (CRRI),
Cuttack, India.
Salient features of different varieties
Pusa Basmati-1: Pusa Basmati-1 is a salt sensitive, dwarf, photoinsensitive,
input responsive high yielding variety and enjoys distinctive status in global rice
economy due to its special taste, aroma and flavour. The average yield was
recorded to be 2.77 t ha-1 (George et al., 2005).
IR-64: IR-64 a salt-sensitive, semi-dwarf, high yielding rice variety with
premium grain quality. It is the most widely grown indica rice cultivar in
Southeast Asia. The average yield was recorded to be 6.40 t ha-1 (Makarim and
Ikhwani, 2010).
Luna suvarna: Luna Suvarna (CR Dhan 403) was developed at Central Rice
Research Institute, Cuttack, India from a cross between Mahsuri/ Ormundakan.
It was found promising through All India Coordinated Rice Improvement
Programme, participatory varietal selection (PVS) and on-farm trials. The
average yield was recorded to be 4.59 t ha-1. This variety can be grown in
coastal belts with salinity stress tolerance in the range of 6-8 dSm-1.
Luna Sankhi: Luna Sankhi (CR Dhan 405) was a breeding line of IR72046-B-R-
3-3-3-1, cross between IR31142-14-1-1-3-2 / IR71350 from International Rice
Research Institute. It was found promising through All India Coordinated Rice
Improvement Programme, participatory varietal selection (PVS) and on-farm
trials. The average yield was recorded to be 4.5 t/ha. This variety can be grown
in coastal belts with salinity stress tolerance in the range of 6-8 dSm-1.

Chapter 3: Materials and Methods
27
3.2. Chemicals, glassware/ plasticware and washing procedure
The chemicals used during the study were procured from Sigma-Aldrich, Bio-
Rad, New England Biolabs, Hi-Media, SRL, Merck, S.D. Fine or Qualigens brand (AR
grade) unless otherwise specified. All glassware and plasticware were obtained from
Borosil works Ltd., Mumbai and Tarson Ltd. India, respectively unless otherwise
specified. In the present experiments, 28-Homobrassinolide (HBL; 22R, 23R, 24S)-2a,
3a, 22,23-tetrahydroxy-24ethyl-ß-homo-7-oxo-5a-cholestane-6-one] and 24-
Epibrassinolide (EBL; 22R, 23R, 24R)-2a, 3a, 22,23-tetrahydroxy-24methyl-ß-homo-7-
oxo-5a-cholestane-6-one) were procured from Sigma-Aldrich, USA. Two pesticides;
Chlorpyrifos (CPF; O,O-diethyl-0-(3,5,6-trichlor-2-pyridyl) phosphorothioate; 20%
active ingredient,) and Imidacloprid (IMI; 1-(6-chloro-3-pyridylmethyl)-N-
nitroimidazolidin-2-ylideneamine; Imidacloprid 20% active ingredient) were procured
from Bayer Cropscience Ltd., India. Sodium Chloride (NaCl) (AR Grade, Hi Media
Laboratories Pvt Ltd., India) was used as a source of salinity stress.
Laboratory glasswares were cleaned with neutral liquid detergent (Labolene)
using bottle brushes. Subsequently, these were rinsed thoroughly with tap water and
then rinsed twice with distilled water. Glassware washing was also sometimes
performed by immersing them in chromic acid solution followed by vigorous tap water
rinse as well as a final rinse with distilled water. Cleaned glassware was dried in oven at
150ºC before use.
3.3. Seed sterilisation, treatments and inoculation
Healthy rice seeds were dehusked and surface sterilized with 70% ethanol (v/v)
for 1 min, followed by 30 min in 0.4% sodium hypochlorite containing a drop of tween-
20 with shaking at 180 rpm. Seeds were then washed 8-10 times with sterile distilled
water and dried on autoclaved Whatman paper (3 mm) for 5 min. After surface
sterilisation, seeds were soaked for 8h in distilled water (control) and in different
concentrations of HBL/EBL (10-11, 10-9 and 10-7 M). The stock solution (10-3 M) of
HBL/EBL was prepared by dissolving BRs in ethanol (HPLC grade) and was stored at -
20�C. The working concentrations of HBL/EBL (10-11 M, 10-9 and 10-7 M) were
prepared by serially diluting the stock solution of BRs (10-3 M) with double distilled

Chapter 3: Materials and Methods
28
water. Different concentrations for treatment of pesticides and salt were chosen based
on their IC50 values (the concentration of pesticide or salt at which growth of the rice
seedlings is inhibited to 50%). It was determined on the basis of rate of germination and
seedling growth under a range of concentrations of pesticides or salt (Liu et al., 2013).
The IC50 value for CPF, IMI, and salt was determined to be 0.04%, 0.015%, and 100
mM NaCl, respectively (Fig.3.1). In the present experiment, for treatments, three
concentrations (IC50 value, one concentration below and one above IC50 value) were
selected for each stress. After sterilization, seeds were sown in autoclaved sand
moistened with different concentrations of IMI (0.01%, 0.015% and 0.02%), CPF (02%,
0.04% and 0.06%) and NaCl (75 mM, 100 mM and 125 mM). The above mentioned
concentrations of pesticides and salt were applied alone as well as in binary
combinations with BRs to rice seeds. In each box plastic box (dimensions 26 cm x 17.5
cm) 100 seeds were inoculated in and kept under controlled conditions; 25°C
(day/night), 70-80% RH (day/night) and 14 h photoperiod for 12 days. The boxes were
closed with the lid and hence the moisture content was maintained throughout the 12
days period of growth.
Fig. 3.1. Determination of IC50 value for CPF, IMI and NaCl for rice var. Pusa
Basmati-1.

Chapter 3: Materials and Methods
29
3.4. Harvesting of samples
Seedlings were harvested after 12 days (Fig. 3.2). They were removed from the
boxes and were dipped in water to remove adhering sand particles. Representative lot of
15 seedlings were chosen for study of morphological parameters while remaining
seedlings were flash frozen in liquid nitrogen and then stored at -80oC for further
analysis.
Fig. 3.2. 12-day old rice seedlings treated with HBL and growing in increasing
concentration of CPF.
3.5. Study of morphological parameters
For morphological parameter analysis, root and shoot length were measured
using meter scale and observations for fresh weight of seedlings were made. Root
number for each of the seedlings was recorded. The seedlings were then placed in an
oven at 70°C till a constant weight is achieved and then observations for dry weight
were recorded. Experiment was repeated thrice with three biological replicates.

Chapter 3: Materials and Methods
30
3.6. Study of biochemical parameters
Study of various biochemical parameters like chlorophyll contents (Chl a and
Chl b and total Chl), total soluble proteins, free proline, malondialdehyde (MDA)
content was performed on 12 day old seedlings. The activity of various antioxidant
enzymes was also analyzed.
3.6.1. Chlorophyll content
Chlorophyll content was estimated following Arnon (1949) method with some
modifications. 100 mg of fresh leaves from each of the sample were homogenized in
liquid nitrogen. 1.5 ml of 80% acetone was added to it and the reaction was incubated in
dark for 1 h at 25⁰C. The mixture was centrifuged at 14000g for 3 min and absorbance
was recorded at 645 and 663 nm against 80% acetone which served as blank. The
chlorophyll content was determined as follows
Total Chl (m g g FW-1) = 20.2 (A645) + 8.02 (A663)×(volume/1000)×weight of tissue
Chl a (mg g FW-1) = 12.7 (A663) – 2.29 (A645)×(volume/1000)×weight of tissue
Chl b (mg g FW-1) = 22.9 (A645) – 4.68 (A645)×(volume/1000)×weight of tissue
3.6.2. Protein content
12-day old seedlings were harvested, frozen in liquid nitrogen and stored at -
80°C. They were homogenized in ice chilled 50 mM phosphate buffer (pH-7.8)
containing 2 mM EDTA, 1 mM dithiothreitol (DTT), 1 mM phenylmethane
sulfonylfluoride (PMSF), 0.5% (v/v) triton X-100 and 10% (w/v) PVP-40. The mixture
was centrifuged at 12000g for 20 min at 4⁰C, supernatant was collected and used for
enzymes assay and protein content estimation. The extraction procedure was carried out
at 0-4°C. Protein concentrations of samples were determined by bradford assay
(Bradford, 1976) using protein estimation kit (Bradford macro method, Genei,
Bangalore, India) and bovine serum albumin (BSA) as a standard. Standard curve was
plotted between different known concentrations of BSA and their respective
absorbance. The amount of protein in the samples was calculated from the standard
linear equation and was expressed as mg g -1FW.

Chapter 3: Materials and Methods
31
3.6.3. Proline content
Proline content in the seedlings was determined by following the method of
Bates et al. (1973). Sample (0.5 g) homogenized in liquid nitrogen was extracted with
10 ml of 3% sulphosalicylic acid and centrifuged at 12000g for 15 min. In the extract,
an equal volume of glacial acetic acid and acid ninhydrin solutions were added. Mixture
was heated at boiling water bath for 1h and reaction was terminated on ice. Followed by
addition of 4 ml of toluene and the absorbance of the toluene layer, when separated
from the aqueous layer, was measured spectrophotometrically at 520 nm. Amount of
proline was calculated from the standard curve and expressed as µmoles g-1FW.
3.6.4. Lipid peroxidation
The thiobarbituric acid reactive substances (TBARS) assay, which determines
MDA as an end-product of lipid peroxidation, was used to measure MDA content
(Hodges et al., 1999). Seedlings (1g) were homogenized in 3 ml of 0.1% TCA kept at
4°C and then 3 ml of solution containing 0.5% Thiobarbituric acid (TBA) and 20%
Trichloroacetic acid (TCA) was added. The mixture was incubated at 95°C for 30 min
and then placed in ice to stop the reaction. The samples were centrifuged at 10000g for
15 min and the absorbance of the supernatant was measured at 532 nm, with a reading
at 600 nm subtracted from it to account for nonspecific absorption. The MDA-TBA
complex was quantified using the extinction coefficient as 155 mM–1 cm–1.
3.7. Histological determination of reactive oxygen species (ROS)
Superoxide radicals (O2•-) were visually detected in rice leaves according to
method suggested by Wu et al. (2010). Plants were excised at the base of stems with a
razor blade and supplied with 10 mM Na-citrate buffer (pH 6.0) containing 6 mM NBT
for 8 h under light at 25oC. As the solution entered through the cut stem, pale yellow
NBT reacted with superoxide radicals and formed a dark blue insoluble formazan
compound. Superoxide radicals are thought to be the major oxidant species responsible
for reducing NBT to formazan. The leaves were then decolorized by immersing them in
boiling ethanol (95%) for 10 min to remove the green background of leaves except for
the dark blue insoluble formazan deposits produced by the reaction of NBT with O2•-.
After cooling, leaves were observed using stereomicroscope and photographed

Chapter 3: Materials and Methods
32
Hydrogen peroxide (H2O2) production in rice leaves was visualized
histochemically using 3, 3-diaminobenzidine (DAB) as a substrate (Wu et al., 2010).
Plants were excised at the base of stems with a razor blade and through the cut stems
were supplied with 1 mg ml-1 solution of DAB (pH 3.8) under light at 25oC for 6 h. The
leaves were eventually immersed in boiling ethanol (95%) for 10 min to remove the
green background. The deep brown polymerization product formed after reaction of
DAB with H2O2 was clearly visualized under a stereomicroscope and photographed.
3.8. Antioxidant enzyme assay
3.8.1. Preparation of plant extracts for antioxidant enzyme analysis
Plant extract for enzymes assay was prepared in the same manner as explained
above for the protein extraction. It was used for the estimation of enzyme activity for all
the enzymes except monodehydroascorbate reductase (MDHAR). For MDHAR, 1 g
seedlings were homogenized in 3 ml of 50 mM Tris-HCl buffer (pH-7.6) containing 2.5
mM ascorbic acid. The homogenates were centrifuged at 12000g for 20 min at 4°C. The
supernatant was used for analysis of specific activity of MDHAR.
3.8.2. Superoxide dismutase, SOD (EC 1.15.1.1)
SOD activity was determined by measuring the ability of enzyme extract to
inhibit the photochemical reduction of nitroblue tetrazolium (NBT), as described by
Beauchamp and Fridovich (1971). The reaction mixture (1 ml) contained 50 mM
potassium phosphate buffer (pH 7.8), 2 μM riboflavin, 75 μM NBT, 13 mM DL
methionine, 100 µM EDTA and enzyme extract (50 μl). The reaction was initiated by
illuminating the reaction mixture for 20 min at 25°C and absorbance was read at 560
nm. Identical tubes which were not illuminated served as blank. The positive control
contained 50 μl of 50 mM phosphate buffer (pH 7.8) in place of the enzyme extract.
One unit of activity was determined as amount of enzyme required to inhibit the
photoreduction of NBT to blue formazan by 50% and was expressed as SOD unit
activity mg protein-1.
3.8.3. Ascorbate peroxidase, APX (EC 1.11.1.11)
Ascorbate peroxidase activity was determined by following the rate of oxidation
of ascorbate (ε of ascorbate = 2.8 mM–1 cm–1) leading to decrease in absorbance at 290

Chapter 3: Materials and Methods
33
nm which is observed spectrophotometrically at 25°C (Nakano and Asada, 1981). The
reaction mixture (1 ml) comprised of 50 mM potassium phosphate buffer (pH 7.0)
containing 0.1 mM EDTA, 0.5 mM ascorbate and 0.1 mM H2O2. The reaction was
started by addition of 10 μl of the enzyme extract in a quartz cuvette. One unit of
enzyme activity was calculated as the amount of enzymes required to oxidise 1 µmole
of ascorbate min-1mg protein-1.
3.8.4. Catalase, CAT (EC 1.11.1.6)
Catalase activity was measured at 25°C by following the method of Aebi (1984).
The reaction mixture contained 20 µl of enzyme extract, 10 mM H2O2 in 50 mM
phosphate buffer (pH-7). CAT activity was estimated by following the decrease in
absorbance of H2O2 at 240 nm and was expressed as µmole of H2O2 decomposed min-1
mg protein-1 using the extinction coefficient 39.4 mM-1cm-1.
3.8.5. Glutathione reductase, GR (EC 1.6.4.2)
Activity of glutathione reductase at 25°C was assayed as per the method of
Jahnke et al. (1991) by following the decrease in absorbance at 340 nm due to the
oxidation of NADPH. The 1 ml reaction mixture contained 50 mM phosphate buffer
(pH 7.8), 1 mM EDTA, 1mM oxidised glutathione (GSSG) and 25 l of enzyme sample
with 0.1 mM NADPH (ε of NADPH= 6.22 mM-1cm-1) which was added in the last to
initiate the reaction. Enzyme activity was expressed as µmol of NADPH oxidized min -
1mg protein-1.
3.8.6. Guaiacol peroxidase, GPX (EC 1.11.1.7)
Activity of Guaiacol peroxidase was determined spectrophtometrically at 25°C
by following the increase in absorbance due to oxidation of guaiacol (Fernaâ Ndez-
Garciâa et al., 2004). The reaction mixture comprised of 50 mM phosphate buffer (pH-
7), 9 mM guaiacol, 10 mM H2O2 and 33 l of enzyme extract in a total reaction volume
of 1 ml. Enzyme activity was expressed as the amount of enzyme required to produce 1
µmol of guaiacol dehydrogenation product (GDHP) min-1mg protein-1 (ε= 26.6
mM-1cm-1).

Chapter 3: Materials and Methods
34
3.8.7. Dehydroascorbate reductase, DHAR (EC1.8.5.1)
Activity of DHAR was determined at 25°C according to the method of Nakano
and Asada (1981) by measuring the increase in absorbance at 265 nm (ε=14m-1cm-1)
due to formation of ascorbate from dehydroascorbate using the reducing power
provided by GSH. Reaction mixture (1 ml) contained 50 mM phosphate buffer (pH=7),
0.1 mM EDTA, 0.5 mM dehydroascorbate, 2.5 mM GSH and 25 µl enzyme extract in a
total reaction volume of 1 ml. One unit of enzyme activity was calculated as the amount
of enzymes required to produce 1 µmol of ascorbate min-1mg protein-1.
3.8.8. Monodehydroascorbate reductase, MDHAR (EC 1.6.5.4)
Enzyme activity was determined at 25°C according to Hossain and Asada
(1985) by measuring the decrease in absorbance due to consumption of NADPH at
340nm (ε= 6.2 mM-1cm-1). The reaction mixture contained 50 mM Tris-HCl Buffer
(pH-7.6), 0.15 units ascorbate oxidase enzymes, 2.5 mM ascorbic acid and 0.2 mM
NADPH/NADH making a total volume of 1 ml. One unit of enzyme activity is
described as the amount of enzyme required to oxidise 1 µmol of NADPH min-1mg
protein-1.
3.9. Statistical analysis
All data obtained were subjected to two-way analysis of variance (ANOVA) for
studying the interaction of stress (CPF, IMI and NaCl) with EBL/HBL and expressed as
mean±SE of three independent replicates. The Fisher’s LSD test was applied for
multiple comparisons using Sigmastat version 3.5 and significance of difference
between stress and BRs treatment was set at p≤0.05.
3.10. Expression analysis of genes
Semi-quantitative Reverse Transcriptase-Polymerase Chain Reaction (semi-
qRT-PCR) was performed to study the expression profile of selected genes in response
to various treatments. For the expression analysis of genes, the details of RNA isolation
and cDNA preparation and amplification are described below.
3.10.1. RNA Isolation
Before RNA isolation, for inactivation of contaminating RNAases, all
glasswares and plasticware were dipped in autoclaved DEPC-treated water for

Chapter 3: Materials and Methods
35
overnight at 37⁰C, followed by autoclaving at 15 psi for 30 min. Gel running apparatus
was cleaned with 0.5% SDS (Sodium dodecyl sulfate) solution, washed with DEPC-
treated autoclaved water, treated with 3% H2O2 for 1 h and finally rinsed thoroughly
with autoclaved DEPC treated water. All solutions are prepared in autoclaved DEPC-
treated water. The total RNA was isolated from whole seedlings as well as from
different parts of the plants using Trizol® reagents (Invitrogen, USA) as described
below.
Protocol for RNA isolation
Homogenization
1. 100 mg of rice seedlings were homogenized in liquid nitrogen.
2. 1 ml of Trizol reagent was added to it followed by vortex for 30 sec.
3. The reaction was incubated in slow agitation at room temperature (25oC) for
10min.
Phase separation
4. The mixture was centrifuged at 4°C for 10 min at 12000g.
5. Supernatant was collected and 200 µl of chloroform was added to it.
6. Tubes were vortexed vigorously for 15 sec followed by incubation for 7 min at
room temperature.
7. The mixture was again centrifuged at 4°C for 15 min at 12000g.
RNA Precipitation
8. After centrifugation, aqueous phase containing RNA was transferred to a new
tube.
9. 0.5 vol of isopropanol and 0.5 vol of sodium citrate + NaCl solution were added
to the aqueous phase containing RNA.
10. Reaction mixture was gently vortexed and incubated at 4°C for 15min.
11. The mixture was then centrifuged at 4°C for 10 min at 12000g.
RNA Wash
12. The supernatant was discarded and pellet was washed with 1 ml of chilled 70%
ethanol, centrifuged for 5 min at 8000g at 4°C.

Chapter 3: Materials and Methods
36
13. The supernatant was discarded and the pellet was dried in the laminar air flow
for 10 min.
14. Pellet was dissolved in 20 µl of RNAase free H2O was added and incubated for
15 min on ice.
15. Residual DNA was removed with DNase I treatment and subsequent
purification. RNA quality and quantity were assessed by RNA agarose gel
electrophoresis and spectrophotometric detection at 260nm, respectively.
3.10.2. RNA quantification and electrophoresis analysis
Total RNA was quantified spectrophotometrically according to Sambrook et al.
(1989). Absorbance ratios OD260/280 and OD260/230 were used to evaluate protein and
phenolic compounds residual contamination, respectively. The quality of the extracted
RNA was determined by running the samples on 1.2 % (w/v) agarose gel prepared in
1X TAE buffer (Appendix). Agarose was heated in microwave oven for 2 min to
dissolve agarose and cooled to 60°C. 0.5 µg ethidium bromide per ml of agarose
solution was added to it. Agarose is then poured onto gel tray and allowed to cool for
20-30 min. Once the gel is solidified, it is placed carefully in an electrophoresis tank
filled with 1X TAE. 2 µg of RNA was mixed with 6× loading RNAase free loading dye
(Thermo scientific, R0611) and the volume was adjusted to 12 µl by adding RNAase-
free ultra pure water (Life technology, AM9932). The sample was then loaded on to the
wells of the gel. The gel was run at 50 V (constant) till the dye front moved about 2/3rd
from the loading point. The gel was viewed under trans-illuminator and photographed
on Gel Documentation Unit (Alpha Innotech Corporations, USA.).
3.10.3. Removal of genomic DNA contamination from RNA
To remove the genomic DNA contamination, RNA was treated with DNase I
(RNase-free), procured from New England BioLabs® (NEB; Cat No. M0303S0). The
reaction was set up as per the manufactures instruction.
DNase reaction
1. 10 µg RNA was resuspended in 1X DNase I reaction buffer.
2. 2 units of DNase I was added and it was mixed thoroughly.

Chapter 3: Materials and Methods
37
3. The final volume was made to 100 µl.
4. It incubated at 37°C for 10 min.
5. 1 µl of 0.5 M EDTA was added (to a final concentration of 5 mM).
6. Heat inactivate at 75°C for 10 min.
After heat inactivation, the sample was kept in ice for 5 min and then diluted in
the ratio of 1:1 with Phenol-Chloroform-Isoamylalcohol (PCI) (25:24:1). The tubes
were thoroughly mixed and centrifuged for 5 min at 14000g at RT (25°C). The upper
aqueous phase was collected and precipitated with 0.5 volumes 7.5 M ammonium
acetate and 2 volumes 100 % ethanol for 1 h at -20⁰C. After 20 min centrifugation at
14000g at 4⁰C, the resulting pellet was washed with 70 % (v/v) ethanol, air-dried and
resuspended in 20µl autoclaved DEPC treated water. The RNA was then used for
synthesis of cDNA.
3.10.4. cDNA Preparation – Reverse Transcription
cDNA preparation was done using SuperScript III First-strand synthesis kit (Life
Technologies, India).
1. Volume corresponding to 3-5 µg of total RNA was taken in a 0.2 ml centrifuge
tube.
2. 1µl of dithiothreitol (DTT) was added to it and the mixture was incubated for 5
min at 65°C, then placed on ice for 5 min.
3. It was followed by addition of
0.5µl of RNase inhibitors
2µl of dNTPs
4µl of buffer (5X)
1µl of enzyme RT.
4µl of RNase free water was added
4. The mixture was spinned at 4°C for 30 sec.
5. The reaction mixture was incubated at 42°C for 1 hr and the reaction was
terminated by incubating it at 70°C for 5 min. Chilled the tube on ice.
6. The cDNA was stored at -20°C for further use.

Chapter 3: Materials and Methods
38
3.10.5. Semiquantitative RT-PCR amplification
The cDNA synthesised from mRNA of different samples were used as a
template for PCR (Polymerase Chain Reaction). The PCR was carried out in PTC100
thermocycler (MJ Research Inc., USA). The gene specific primers presented in table 3.1
were designed using the PrimerQuest software of Integrated DNA Technologies
(http://www.idtdna.com/Primerquest/Home/Index) under default parameters. The
primers were further validated for unique amplicon using Primer-BLAST
(http://www.ncbi.nlm.nih.gov/tools/primer-blast/). All the primers were procured from
Genei, Bangalore. Mother stocks of primers were prepared with concentration of 100
µM and they were further diluted to obtain a final working concentration of 10 µM.
A PCR reaction mixture (50 µl) included:
1. 5µl Taq Polymerase Buffer E (10X)
2. 1µl dNTPs
3. 1µl Forward Primer
4. 1µl Reverse Primer
5. 0.5µl TaqPolymerase
6. 1µl template
7. 40.5 µl autoclaved distilled water
The PCR program was as follows;
a. Step I: Initial Denaturation at 94°C for 4 min
b. Step II: Denaturation at 94°C for 2 min
c. Step III: Annealing at X°C for 1 min (for X refer Table 3.1)
d. Step IV: Extension at 72°C for 2 min
e. Step V: Repeat Step –II to Step IV 35 times (35 cycles)
f. Step VI: Final Extension at 72°C for 7 min
g. Step VII: Hold at 4°C for 8 min

Chapter 3: Materials and Methods
39
Table 3.1. Base-Sequence of Specific Primers and respective amplified product size
(bp)
S.
No.
Name of
the Gene
Accession
Number
Primer sequence Annealing
temperature
Size of
amplified
product
(bp)
1. Cu/Zn SOD
L19435.1 F: 5’-CCTCAAGCCTGGTCTCCAT-3’
R:5’- CAGCCTTGAAGTCCGATGAT-3’ 55°C 351
2. Fe-SOD AY770495.1 F: 5’-CTTGATGCCCTGGAACCTTA-3’
R : 5’-GCCAGACCCCAAAAGTGATA-3’ 52°C 348
3. Mn-SOD L19436.1 F: 5’-GCCATTGATGAGGATTTTGG-3’
R: 5’-CAAGCAGTCGCATTTTCGTA-3’ 53°C 314
4. CAT D26484.1 F: 5’- GTTCGGTTCTCCACAGTCGT-3’
R: 5’-CCCTCCATGTGCCTGTAGTT-3’ 52°C 311
5. APX D45423.1 F: 5’-CCAAGGGTTCTGACCACCTA-3’
R: 5’-CAGTTCGGAGAGCTTGAGGT-3’
55°C 332
6. GR AB009592.1
F: 5’-AACAGCCGATGGCATAAAAG-3’
R:5’-CAACCACCAGTTTCATGACG-3’ 52°C 470
7. OsBRI1 NM_001050612.1 F: 5'-CTTTCTCGGCACTTTCCTTG-3'
R: 5'-ACTCGCCTCCTCATTCTTCA-3' 55°C 311
8. OsDWARF AB084385.1
F: 5'- TGGGCTGCTGAGGAAAACTA-3'
R:5'-CTTCAACTCGGGGGAACTT-3' 55°C 323
9. SalT Z25811.1
F: 5'-GAGGGTCAGCTCAGGACATC-3'
R:5'-GTCTTGCAGTGGAATGCTGA-3' 55°C 438
10. EF1-α D63580.1 F : 5’-GTACAAGATCGGTGGTATT-3’
R: 5’-GGGTACTCAGAGAAGGTCT-3’ 50°C 560
3.10.6. Agarose gel electrophoresis of the amplified DNA
Amplified products were resolved on 1.5% (w/v) agarose gel prepared in TAE
buffer containing 0.5 µg/ml ethidium bromide. The DNA sample was mixed with 6X
loading dye (Thermo scientific, R0611) to make a final concentration of 1X. It was
mixed properly then loaded on the agarose gel. 100 bp DNA ladder was loaded as a
molecular weight marker (Genei, Bangalore). The gel was run at 100 V for 1 h. Gel was

Chapter 3: Materials and Methods
40
viewed in trans-illuminator and later photographed on gel documentation system (Alpha
Innotech Corporations, USA).
3.11. Growth conditions and treatment of Arabidospis plants for phosporylation
site analysis
Seeds of Arabidopsis thaliana (ecotype Col-0 and Ws-2) and two transgenic
lines expressing BRI1-Flag and BAK1–green fluorescent protein (GFP) were sterilized
in absolute ethanol for 10 min followed by a 20 min treatment with a 30% commercial
bleach solution containing 0.1% Triton X-100 as a surfactant. The seeds were
thoroughly rinsed at least five times in a large volume of sterile distilled water and kept
at 4oC for 2 days for vernalisation. After 2 days, seeds were then resuspended in
sterilized 0.2% agarose (w/v) and inoculated in Petri plates containing 1/2 strength
Murashige and Skoog salt and vitamins solid medium (Phyto Technology Laboratories),
with 3% sucrose, pH 5.7 (referred to as ½ MS media). The petriplates were kept in
growth chamber for three weeks at 22oC (Fig. 3.3). After three weeks, seedlings were
ready for shifting to a controlled environment room in the North Carolina State
University Phytotron for further growth. Seedlings were transferred to flats laid with
Fig. 3.3. Germination of seeds of A. thaliana (ecotype Columbia-0, Ws-2) and two
transgenic lines (expressing BRI1-Flag and BAK1–GFP) in MS media.

Chapter 3: Materials and Methods
41
‘Farfard 4P’ potting media containing 1:1:1 ratio of perlite, vermiculite and sphagnum
moss. Plants were grown in the growth chamber at a constant temperature of 22°C at
100 µEm-2 S-1 constant light on a 14 h light /10 h dark cycle. Plants were watered
regularly. After a month, peduncles emerged to about 4 cm and plants were supported
with a collar. After about three months, mature seeds were harvested and stored at 4°C
till further use (Fig. 3.4).
For producing plants for further biochemical and proteomic studies, 100 mg
seeds each of Arabidopsis thaliana ecotype Ws-2, BRI1-Flag and BAK1–GFP were
sterilized as mentioned above. Seeds were then resuspended in sterilised 0.2% agarose
and inoculated in 1 L flask containing 100 ml of Gamborg's B-5 basal medium (Phyto
Technology Laboratories, USA), pH 5.7. Flasks were kept under continuous light at 80
rpm rotation for 11 days.
a) Flats containing solid media and
arabidopsis seedlings b) Flats were kept in growth chamber
c) Arabidopsis plants after 2 months d) Arabidopsis plants bearing mature seeds
after 3 months
Fig. 3.4. Growth of A. thaliana seedlings for three months to harvest mature seeds.
Chapter 3: Materials and Methods
42
At the end of 11 days of growth, flasks were divided into two groups and the old media
was drained and was replaced with fresh media with or without 150 mM NaCl. The
flasks were allowed to rotate at 80 rpm for 4 h. For each group of plants treated with or
without salt, half of them were treated with 100 nM brassinolide (BL) and the other half
by solvent control for 90 min (Fig. 3.5). After 90 min, plants were blotted dry, weighed,
frozen in liquid nitrogen and stored at -80°C prior to membrane protein isolation. Three
sets of biological replicates were prepared for each treatment.
3.11.1. Extraction of membrane protein
Total membrane protein was isolated from both the transgenic (BRI1-Flag and
BAK1-GFP) as well as control lines according to the method suggested by Wang et al.,
(2005). Tissue (100 g) was homogenized in a blender in 200 ml of cold extraction
buffer [20 mM Tris-HCl (pH 8.8), 150 mM NaCl, 1 mM EDTA (pH 8.0), 20% glycerol]
containing 1% (v/v) polyvinylpolypyrrolidone (PVPP), 1 mM PMSF, 20 mM NaF, 50
nM microcystin and protease inhibitor cocktail tablets (Roche Diagnostics,
Indianapolis, IN). The mixture was centrifuged at 6000g for 15 min at 4°C and
supernatant was filtered through a mira cloth (Calbiochem® EMD Millipore). The
filtrate was further ultra-centrifuged at 100,000g for 2 h at 4°C. After centrifugation, the
microsomal fraction containing total membrane protein was pelleted down while the
supernatant contained the cytosolic fraction. The pellet was resuspended in 2 ml of
solubilization buffer [10 mM Tris-HCl, pH 7.3, 150 mM NaCl, 1.0 mM EDTA, 500 nM
microcystin, 10% glycerol, 1.0% Triton X-100, 1.0 mM PMSF, 20 mM NaF, and
protease inhibitor cocktail (Roche)] and sonicated for 2 min. The sample was then
centrifuged again at 21,000×g for 10 min and the total membrane protein in the clear
supernatant was collected in a fresh tube. The protein in microsomal fraction was
quantified by Bradford assay kit (www.bio-rad.com) using bovine serum albumin as the
standard. Before immunoprecipitaion of membrane protein, the protein concentration
was adjusted to 1.0 mg/ml while concentration of triton X-100 was reduced to 0.2%.

Chapter 3: Materials and Methods
43
Fig. 3.5. Scheme of treatment of Arabidopsis plants with NaCl and BL.
3.11.2. Western blot analysis
Proteins were separated by SDS-PAGE (Sodium dodecyl sulfate-polyacrylamide
gel electrophoresis) using precast gels (Precise Protein Gels, 4-20%, Thermo Scientific)
at a constant rate of 100 volt. Proteins were electro-transferred to a polyvinylidene
difluoride (PVDF) membrane by iBlot® dry Blotting System (Life technologies, USA).
After protein transfer, the membrane was blocked with 5% non-fat dry milk in 50 mM
Tris, pH 7.5, 150 mM NaCl and 0.1% Tween-20 (TBS-T) for 1 h. The membrane was
then incubated in an anti-Flag M2 primary antibody (Sigma-Aldrich) at 1:5000 dilution,
anti-GFP antibody (Molecular Probes) at 1:2000, or antiphosphothreonine antibody
(Cell Signaling Biotechnology, Beverly, MA) at 1:1000 for 1 h. It was followed by
washing of the PVDF membrane with TBST buffer for 15 min with intermittent
changing of the buffer after every 5 min. The membrane was then incubated in
horseradish peroxidase–linked secondary antibodies at 1:2000 dilutions for 1 h. It was
followed by 5 washes of the PVDF membrane with TBST for 5 min each. The
secondary antibody was visualized by the ECL chemiluminescence detection system
(ECL Plus Kit; GE healthcare, Piscataway, NJ). To ensure equal sample loading, after
protein transfer, the membrane was incubated with Ponceau S stain (Sigma-aldrich,
USA) and photographed. It was then rinsed with water for several times for complete
removal of Ponceau S stain and was then blocked with milk. The experiment was done
in duplicate to ensure consistent results.
Chapter 3: Materials and Methods
44
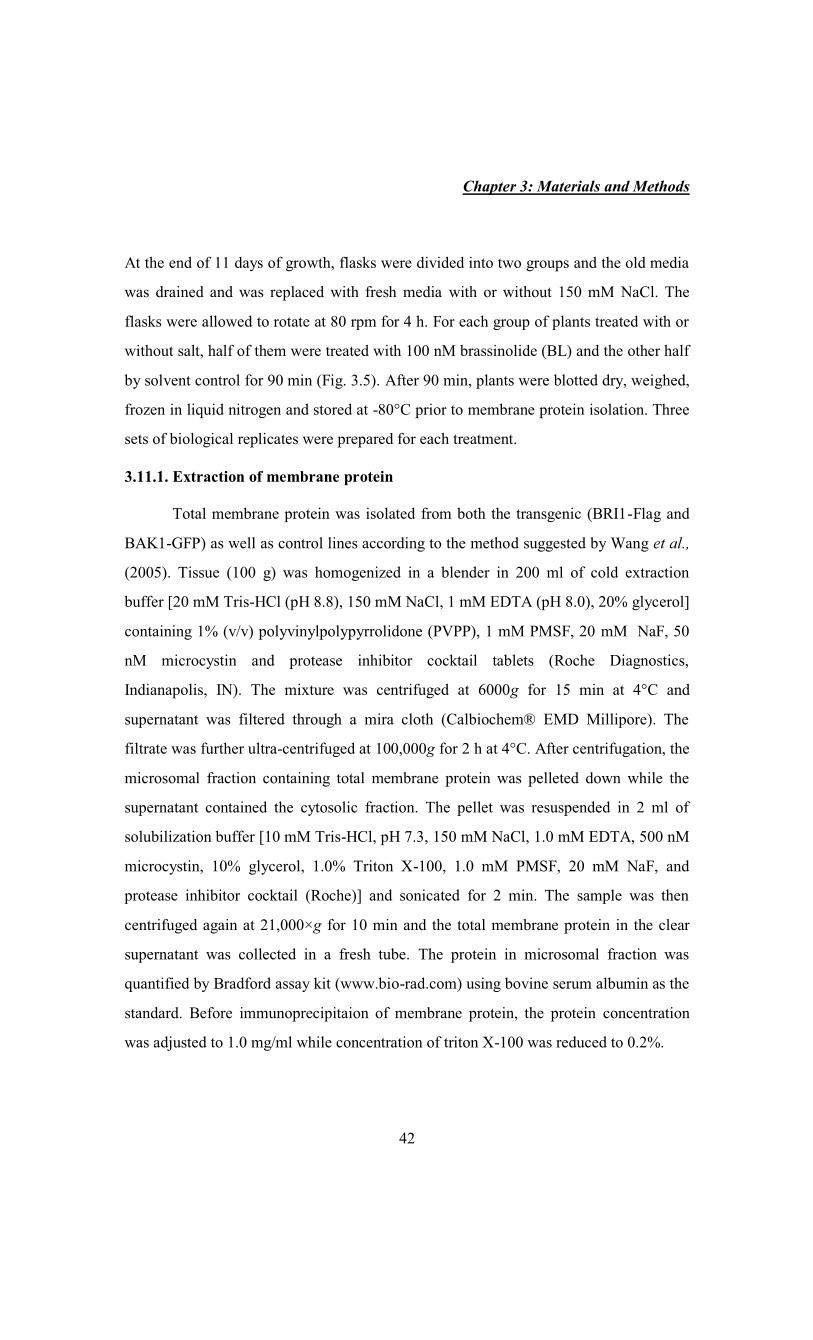
Fig. 3.6. Schematic work-flow of the method for identification of phosphorylation
sites in A. thaliana.
3.11.3. Immunoprecipitaion
BRI1-Flag and BAK1-GFP were immunoprecipitated from the solubilised total
membrane protein fraction according to the method suggested by Wang et al. (2005)
and further refined by Mitra et al. (2012). For BRI1-flag immunoprecipitation,
microsomal protein diluted to 1.0 mg/ml was incubated with prewashed anti-Flag M2
agarose beads (Sigma-Aldrich) at 4°C overnight on a shaker. Beads were collected by
centrifugation at 1,000g for 5 min while the supernatant was discarded. Beads were then
washed extensively with TBS buffer (50 mM Tris-HCl, 150 mM NaCl, pH 7.4) and
centrifuged at 1,000g for 5 min. BRI1-flag was eluted with 100 µl of 2X SDS sample
loading buffer (3% SDS, 94 mM Tris-HCl, pH 6.8, 15% glycerol, and 7.5% b-
mercaptoethanol). After boiling for 5 min, 5 µl of supernatant was separated by SDS-

Chapter 3: Materials and Methods
45
PAGE using gradient precast gels (Precise Protein Gels, 4-20%, Thermo Scientific).
Similarly, BAK1-GFP was immunoprecipitated from solubilized total membrane
protein by first incubating the protein in anti-GFP mouse antibody (Molecular Probes,
USA) for 10 h followed by another overnight incubation with protein A beads (Pierce,
Rockford, IL). Immunoprecipitated proteins were detected by immunoblot analysis on
PVDF membranes using anti-Flag and anti-GFP antibodies. For analysis of the samples
on by mass spectrometry, the samples were loaded in 4-12% Bis-Tris NU-PAGE gel
(Invitrogen) and stained with SYPRO Ruby.
3.11.4. Separation of membrane proteins using SDS-PAGE and in-gel trypsin
digestion
Immunoprecipitated protein sample (20 µl) from treated as well as control
samples was separated by one dimensional (1-D) SDS PAGE using pre-cast NuPAGE
Novex 4-12% Bis-Tris gel, 1.0 mm, and NuPAGE MES (2-(N-morpholino)
ethanesulfonic acid) buffer (Invitrogen, Carlsbad, CA) at a constant rate of 150 V. The
gel was stained with SYPRO Ruby (Molecular Probes) and the bands corresponding to
the molecular weight of BRI1-FLAG (~135 kDa) and BAK1-GFP (~98 kDa) were
visualized. The bands corresponding to the protein of interest were excised in parallel
from the lanes containing samples from transgenic and control lines. The excised gel
bands were further cut into 1-5 mm small pieces and washed thrice for 15 min each with
500 µl of acetonitrile/100 mM NH4HCO3, pH 8.0 (1:1) to completely remove the stain.
Gel slices were then dehydrated in 75% acetonitrile for 30 min and dried in a vacuum
centrifuge. In-gel reduction, alkylation and trypsin digestion was performed on the
excised bands according to a published protocol (Rowley et al., 2000). Protein in the gel
slices was reduced with 15 mM dithiothrietol (DTT) for 30 min at 37°C, alkylated with
55 mM iodoacetamide for 30 min at room temperature. The gel pieces were then
washed at least three times with neat acetonitrile and and 50 mM NH4HCO3 (pH 8.0).
The slices were then incubated with 100 µl of 50 mM NH4HCO3, pH 8.0, containing 1
ng/µl trypsin overnight at 37°C. After tryptic digestion, peptides were extracted from
the gel pieces with 200 µl of 2% acetonitrile /1% formic acid (v/v). The tubes were spun
down at 6000g for 10 min. Supernatant was collected carrying tryptic peptides and was

Chapter 3: Materials and Methods
46
dried via vacuum centrifugation (Savant, Thermo Fisher Scientific) and stored at -80°C
until further analysis.
3.11.5. Phosphopeptide enrichment by immobilized metal ion chromatography
(IMAC)
Tryptic peptides were enriched for phosphopeptides by immobilized metal
affinity chromatography (IMAC) using Phos-select Iron affinity gel (Sigma, St. Louis,
MO). The dried peptides were resuspended in 50 µl of buffer containing 250 mM
glacial acetic acid and 30% (v/v) acetonitrile. 10 µl of Phos-select resin was equilibrated
in the same buffer and was added to the resuspended peptide. The sample and beads
were then incubated at room temperature for 1h on a shaker. Following the incubation,
sample was spun down at 3000g for 1 min and beads were collected. Beads were then
washed with resuspension buffer and the enriched phosphopeptides were eluted with
two 50 µl aliquots of 100 mM NH4HCO3, pH 8.5. The aliquots were pooled, lyophilized
and stored at -80⁰C.
3.11.6. Phosphopeptide identification
The dried peptides were resuspended in 20 µl of 0.1% formic acid of which 10
µl was used for MS analysis. Samples were analysed in the Mass Spectrometry
Laboratory, North Carolina State University, Raleigh, NC, USA using one of two
instruments, a Q-TOF Premier quadrupole time-of-flight system (Waters Corporation)
or the Orbitrap Elite (Thermo Scientific). All samples were analyzed in triplicate (3
technical replicates per sample). For Q-TOF analyses, peptides were separated using a
Symmetry C18 trapping column (180 µm id x 2 cm, 5 µm particles) coupled to a 25 cm
BEH column (75 µm id, 1.7 µm particles). A nanoACQUITY ultra-high pressure liquid
chromatography was used to deliver the 7-40% B gradient at a flow rate of 300 nl/min
(A = 0.1% formic acid in water, B = 0.1% formic acid in acetonitrile) over 30 min. The
Q-TOF was operated in either LC/MSE data-independent analysis mode or LC/MS/MS
data dependent mode as previously described (Wang et al., 2008). For Orbitrap
analyses, peptides were separated using an easy-nLC 1000 system
(www.thermoscientific.com) coupled on-line to the Orbitrap Elite mass spectrometer
(www.thermoscientific.com). Peptides were subjected to a reversed-phase separation

Chapter 3: Materials and Methods
47
using a 75 µm i.d. x 25 cm column packed in-house with 3 µm 200 Å Magic C18AQ
stationary phase (www.michrom.com) coupled to an Acclaim PepMap 100 µm i.d. x 2
cm trapping column (www.thermoscientific.com). The mobile phases consisted of (A)
0.1% formic acid in 2% acetonitrile and (B) 0.1% formic acid in acetonitrile. Ten µg of
total peptide digest was injected onto the reversed-phase column for each analysis and a
linear gradient of 1% B/min from 5% B to 40% B was used for separation at a flow rate
of 300 nl/min. A top 10 data-dependent acquisition method was used to acquire
LC/MS/MS data. All the steps for analyzing in vivo phosphorylation sites have been
summarized in Fig. 3.4.
3.11.7. LC/MS data analysis for phosphopeptide identification
Raw data files acquired on the Q-TOF were processed using Protein Lynx
Global Server 2.4 software (Waters). For the data-dependent analyses, the raw data files
were processed to generate pkl files which were subsequently searched against the
TAIR10 database (www.arabidopis.org) using Mascot 2.4 search algorithm (Matrix
Science, London, UK) running on an in-house server. Data was searched against the
TAIR10 protein database (www.arabidopis.org) to which the rabbit phosphorylase B
protein sequence was appended. Trypsin was set as the primary digest reagent and no
more than one missed cleavage site was allowed and search tolerances of 50 ppm and
0.05 Da for precursor and product ions respectively, were used. Cys-carbamidomethyl
modification was fixed (+57.0215 Da) while dynamic mass modifications of
phosphorylation of Ser, Thr and Tyr residues (+79.9663 Da) and oxidation of Met
(+15.9949 Da) were used for database searches. For LC/MSE raw files, data processing
and database searching were accomplished completely within PLGS2.4. LC/MSE data
were searched against the modified TAIR10 database as described above, using
automatic settings for mass accuracy. For Orbitrap analyses, raw LC/MS/MS data files
were processed and searched using Proteome Discoverer 1.4. Searching was
accomplished using Mascot with precursor and product mass accuracies of 10 ppm and
0.8 Da, respectively, with the same number of missed cleavage sites and variable
modifications described above for Q-TOF analysis. All putative phosphopeptide
assignments were manually curated.

Chapter 3: Materials and Methods
48
3.12. Plant materials, growth conditions and mode of treatment for total
proteomics study
For total proteomics studies, 20 mg of A. thaliana ecotype Col-0 seeds were
surface sterilized and grown in 100 ml of Gamborg's media for 11 days (as mentioned
in section 3.11). On the 11th day, flasks were divided into two groups and the old media
was drained and was replaced with fresh media with or without 100 nM BL for 90 min.
The flasks were allowed to rotate at 80 rpm for 90 min. The old media was again
drained and replaced with the fresh media with or without 150 mM NaCl for 4 h. After
4 h, plants were blotted dry, weighed, frozen in liquid nitrogen and stored at -80oC prior
to membrane protein isolation. Three sets of biological replicates were prepared for
each treatment.
3.12.1. Extraction of membrane and cytosolic protein
Sample (10 g) treated each with or without 150 mM of NaCl and/or treated with
or without 10-7 M of BL was further processed for membrane and cytosolic protein
extraction by following the method given in section 3.11.1. The protein in the
microsomal as well as cytosolic fraction was quantified by Bradford assay kit
(www.bio-rad.com) using bovine serum albumin as the standard.
3.12.2. Precipitation and in-solution digestion of microsomal proteins
To each of the samples, from both the cytosolic and membrane fraction, 10
volumes of chilled acetone was added and kept at 4°C overnight for protein
precipitation. The samples were centrifuged at 15,000g at 4°C for 20 min. The pellet
containing the protein was washed with 80% acetone thrice and then air dried. Protein
was then resolubilised in 8 M urea. Protein concentration was measured using Bradford
assay kit (www.bio-rad.com).
Prior to in-solution digestion, samples were diluted with 50 mM NH4HCO3, pH
8.0 to reduce the urea concentration to 2 M. In solution reduction, alkylation and
digestion was performed according to a published protocol (Rowley et al., 2000).
Protein in the solution was reduced with 15 mM dithiothrietol (DTT) for 30 min at
37°C, alkylated with 55 mM iodoacetamide for 30 min at room temperature. Digestion
was carried out with Lyc-C dissolved in 50 mM NH4HCO3, pH 8.0. For 50 µg protein
Chapter 3: Materials and Methods
49
concentration, 1 µg of Lyc-C was added and the solution was incubated overnight at
37°C. The solution containing the peptides was dried via vacuum centrifugation
(Savant, Thermo Scientific, USA) and stored at -80°C until further analysis.
3.12.3. LC/MS/MS analysis
The dried peptides were resuspended in 200 µl of 0.1% formic acid of which 10
µl was used for LC/MS/MS analysis. Peptides were spiked with a predigested rabbit
phosphorylase B internal standard (Waters, Milford, MA) at a level of 50 fmol per 10 µl
injection. All samples were analyzed in triplicate (3 technical replicates per sample) by
an easy-nLC 1000 system (www.thermoscientific.com) coupled on-line to an Orbitrap
Elite mass spectrometer (www.thermoscientific.com). Peptides were subjected to a
reversed-phase separation using a 75 µm i.d. x 25 cm column packed in-house with 3
µm 200 Å Magic C18AQ stationary phase (www.michrom.com) coupled to an Acclaim
PepMap 100 µm i.d. x 2 cm trapping column (www.thermoscientific.com). The mobile
phases consisted of (A) 0.1% formic acid in 2% acetonitrile and (B) 0.1% formic acid in
acetonitrile. 10 µg of total peptide digest was injected onto the reversed-phase column
for each analysis and a linear gradient of 1% B/min from 5% B to 40% B was used for
separation at a flow rate of 300 nl/min. For LC/MS/MS analysis, the mass spectrometer
was operated in the data-dependent mode where the top ten most intense ions were
selected for CID.
3.12.4. Data processing for differential protein expression analysis
Raw Orbitrap LC/MS/MS data files were imported into the Progenesis
(Nonlinear Dynamics) differential expression analysis software package for
determination of protein abundance differences between treatments using a label-free
approach. Mascot peptide assignments were imported into Progenesis for annotation of
peptide level features, and protein level abundance changes summarized within
Progenesis.
3.13. Two-dimensional gel electrophoresis analysis for rice seedlings
Rice seedlings treated with salt and EBL were analyzed by 2-DE. Four samples
were chosen for the present study i.e. control, 10-7 M EBL, 100 mM NaCl and 10-7 M
EBL+100 mM NaCl. Phenol based method was used for protein extraction.

Chapter 3: Materials and Methods
50
3.13.1. Phenol based extraction of proteins
Rice seedlings (1 g) were crushed in liquid nitrogen and homogenized in 3 ml of
extraction buffer containing 500 mM Tris-HCl, 50 mM EDTA, 700 mM sucrose, 100
mM KCl and pH was set 8.0 with HCl. Just before use, 2% β-mercaptoethanol and 1
mM PMF were added to the extraction buffer. The mixture was vortexed and incubated
by agitating for 10 min on ice. After incubation, 3 ml of tris-buffered phenol was added
to it and the mixture was vortexed. It was incubated on a shaker for 10 min on ice and
was followed by centrifugation for 10 min at 10000g at 4°C. A clear phase separation
was seen after centrifugation. The upper phenolic phase was carefully collected in a
separate tube without touching the lower phase. Again, 3 ml of the extraction buffer was
added to the tris-buffered phenol and the extraction process was repeated as mentioned
above. The mixture was again centrifuged, and the upper phenolic phase was collected
in a new tube. 5 vol of 0.1 M ammonium acetate in cold methanol was added to the
phenolic phase. The tube was shaken gently and the mixture was incubated overnight at
–20°C. Protein was recovered by centrifugation at 12000g at 4°C for 10 min. The pellet
so obtained was washed three times with cold 0.1 M ammonium acetate in cold
methanol and then finally with cold acetone. The pellet was air-dried and stored at -
80°C for 2-DE.
3.13.2. Protein solubilisation and quantification
The protein pellet was thoroughly resuspended in IEF (rehydration) buffer
comprising of 7 M urea, 2 M thiourea, 4% CHAPS, 0.5% Triton X-100, 15mg/ml
Destreak reagent (Amersham Biosciences) and 0.2% Ampholytes. Protein was
quantified using the Bradford protein assay as mentioned before.
3.13.3. Two-dimensional Electrophoresis (2-DE).
Protein (150 µg) dissolved in rehydration buffer was used to passively rehydrate
IPG strips (7 cm, 3–10, 5-8, Readystrip, Cat.No. 163-200,163-2004, Bio-Rad)
overnight. Isoelectric focusing (IEF) was carried out in Protean IEF Cell (Bio-Rad) at
20°C. The strips were focused at 250V for 40 min, 4000 V for 2 h with linear voltage
amplification, and finally to 10,000 V h with rapid amplification. After isoelectric
Chapter 3: Materials and Methods
51
focusing, the strips were incubated with equilibration buffer (6M urea, 0.05M Tris-HCl
pH 8.8, 20% glycerol, 2% SDS) containing 2% DTT for 15min for reduction. For
alkylation of the proteins, the strip was further incubated with 2.5% iodoacetamide
dissolved in equilibration buffer for 15 min. The second dimensional electrophoresis
was performed using 12% polyacrylamide gel. After mounting the strip on the gel, it
was sealed with 0.5% agarose containing 0.1% bromophenol blue (tracking dye). The
protein molecular weight marker was loaded along with the strip in a small well made
in agarose. Electrophoresis was performed at constant volt (100 V) for 2 h in tris
glycine-SDS running buffer until the dye (bromophenol blue) reached the front end of
the plate.
3.13.4. Gel staining, imaging and analysis
2-DE for 4 samples was performed in triplicates. The gels were stained with
silver staining plus kit (Bio-Rad, USA) and stored in 5% acetic acid for further analysis.
Gel imaging was done using Molecular Imager Gel Doc XR System (Bio-Rad, USA)
and the images were analyzed using Imagev Master 2D Platinum version 7.0 software
(Amersham, UK).
3.14. Analysis of salT gene
The behaviour of salT gene was studied by analysing its expression in various
tissues and under various stress conditions. Rice seedlings var. Pusa Basmati-1, IR-64,
Luna sankhi and Luna suvarna were grown in sand as mention in section (3.3) for 12
days in distilled water. On 12th day, the seedlings were harvested. Some seedlings of
var. Pusa Basmati-1 were segregated into root, shoot and leaf from the seedling and the
tissue was stored at -80°C for RNA isolation. Rests of the seedlings of Pusa Basmati-1
were transferred into test tubes containing solutions of 200 mM NaCl and 0.04% CPF.
Heat and cold stress was inflicted on seedlings by keeping seedlings at 42°C and 4°C
while drought stress was induced by keeping the seedlings for air-drying. After 8 h
seedlings were processed further for expression study of salT gene.
Chapter 3: Materials and Methods
52
3.14.1. In silico analysis of salT gene
Structure organization of salT gene of O. sativa was predicted using gene
structure display server (http://gsds.cbi.pku.edu.cn/). The full length nucleotide
sequence obtained was translated using translate tool (http://www.expasy.ch/tools/
dna.html) and the properties of deduced amino acid sequence were estimated using
ProtParam (http://www.expasy.ch/tools/protparam.html) (Gasteiger et al., 2005)
programs. Secondary structure was determined by SOPMA program (http://npsa-
pbil.ibcp.fr) (Geourjon and Deleage, 1995). The promoter sequence was analyzed using
PlantCARE, a database of plant cis-acting regulatory elements (http://bioinformatics.
psb.ugent.be/webtools/plantcare/html/). 1.5 kb region upstream of the start codon was
analyzed for promoter sequence.
3.14.2. Constructing recombinant plasmid containing salT gene
3.14.2.1. cDNA amplification with the designed primers
Total RNA was isolated from rice seedlings with Trizol® reagent and the cDNA
was synthesized following the protocol described in section 3.10.1 to 3.10.3. Two sets
of primers, one pair with stop codon, salT+SP1 (5′-ctgagctcTCAAGGGTG
GACGTAGATGC-3′) and salT+SP2 (5′-atgggatccATGACGCTGGTGAAGATTGG-
3′) and the other pair without stop codon salT-SP1 (5′-acgagctcAGGGTGGAC
GTAGATGCCAA-3′) and salT-SP2 (5′- atgggatccATGACGCTGGTGAAGATTGG-
3′) were designed to amplify the salT gene (NCBI accession no. Z25811). During the
design of primers, specific restriction sites (BamHI and SacI) were introduced into the
tails of the primers for cloning into different expression vectors. Choice of restriction
sites were purely based on the enzymes that do not cut the gene (salT) and were selected
using NEB cutter software (http://tools.neb.com/NEBcutter2/). Designed primers were
procured from IDT (Integrated DNA Technologies, http://eu.idtdna.com/site). Mother
stocks of primers were prepared with concentration of 100 µM and they were further
diluted to obtain a final working concentration of 10 µM. To amplify the gene, PCR
was performed as follows:

Chapter 3: Materials and Methods
53
A PCR reaction mixture (50 µl) included:
1. 5µl Taq polymerase buffer E (10X)
2. 1µl dNTPs
3. 1µl Forward primer
4. 1µl Reverse primer
5. 0.5µl Taq polymerase
6. 1µl template
7. 40.5 µl autoclaved distilled water
The PCR program was as follows;
a. Step I: Initial denaturation at 94°C for 4 min
b. Step II: Denaturation at 94°C for 1 min
c. Step III: Annealing at 55°C for 1 min
d. Step IV: Extension at 72°C for 2 min
e. Step V: Repeat step –II to Step IV 35 times (35 cycles)
f. Step VI: Final extension at 72°C for 7 min
g. Step VII: Hold at 4°C for 8 min
The bands corresponding to the salT gene was extracted from gel using gel
extraction kit (SIGMA, USA; Cat No. NA1111). The gel purified amplification
products with stop codon and without codon were cloned separately into pGEM-T-
Easy vector.
3.14.2.2. Cloning in pGEM-T easy vector
For cloning the amplified salT gene, ligation is done using the PCR product and
the cloning vector pGEM-T. The T-overhangs at the insertion site in pGEM-T vector
provides a compatible overhang for PCR products generated by certain thermostable
polymerases. It also contains ampicillin as a bacterial selection gene. For cloning in
pGEM-T vector, the ligation reaction was set having the final concentration of 1X
Rapid ligation buffer, pGEM-T vector (50ng), purified PCR product (150-200 ng), and
1 μl DNA ligase (3 Weiss units/μl) making the final volume 10µl using autoclaved

Chapter 3: Materials and Methods
54
distilled water. The reaction mixture was incubated overnight at 4°C. The ligated
product was transformed to E. coli competent cell.
3.14.2.3. Competent cell preparation and bacterial transformation
E. coli competent cell preparation protocol
E. coli host cells were streaked on LB agar plate containing ampicillin (50
µg/ml) and incubated at 37oC to obtain single colony. 5 ml of LB media was inoculated
with a single colony and incubated at 37oC overnight in incubator shaker and later the
following protocol was followed for preparation of competent cell.
1. Inoculate 100 ml LB medium with 1ml of saturated overnight culture.
2. Shake at 37oC until OD600=0.4 (usually 2-3 h).
3. Place in an ice bath for 10 min.
4. Transfer the culture into two pre-chilled 50 ml centrifuge tubes.
5. Centrifuge at 3000g for 10 min at 4⁰C.
6. Remove the medium, resuspend the cell pellet with 1.6 ml ice cold 100 mM
CaCl2 by swirling on ice gently.
7. Incubate on ice for 30 min.
8. Centrifuge at 3000g for 10 min at 4⁰C.
9. Remove the medium, resuspend the cell pellet with 1.6 ml ice-cold 100 mM
CaCl2 by swiriling on ice gently.
10. Incubate on ice for 20 min.
11. Combine cells to one tube and add 0.5 ml ice-cold 80% glycerol and swirl to
mix.
12. Freeze 100 µl aliquots in liquid nitrogen.
13. Store in -80⁰C.
E. coli transformation protocol
1. Thaw DH5α cells on ice (~ 5 min).

Chapter 3: Materials and Methods
55
2. Ligation reaction (2-5 µl) containing usually 20 ng- 100 ng was added to the
cells.
3. The tubes were gently flicked and incubated on ice for 30-45 min.
4. Cells are incubated for 60 seconds at 42⁰C.
5. Place the cells back on ice for 5 min.
6. 900 µl of LB was added and incubated at 37°C for 2 h with moderate shaking
(~150 rpm).
7. Cells (100-200 µl) were plated on LB plates containing appropriate antibiotic,
IPTG and X-gal.
8. Incubate overnight at 37°C. White colonies were selected and restreaked on LB
plates with appropriate antibiotic.
3.14.2.4. Cloning of salT gene into expression vectors
Plasmids isolated from transformed colonies using plasmid isolation kit (Sigma-
Aldrich, USA, Cat No. PLN350) following manufacturer's instructions. For cloning into
different expression vectors, double digestion of the isolated pure plasmid of different
expression vectors were carried out using BamHI and SacI restriction enzymes to
generate sticky ends compatible for ligation with the double digested PCR product
(salT). The pGEM-T- Easy vector harboring a salT cDNA was also digested with
BamHI and SacI to yield ~ 450 bp fragment. The digested reaction mixtures were
loaded on separate 1% agarose gels in TAE buffer and gel electrophoresis was carried
out. After electrophoresis, each gel was visualized in a UV-transilluminator and the
DNA fragments of expected size (~450 bp for salT ) were excised from the agarose gel
using a clean, sharp scalpel. PCR product gel extraction was carried out using gel
extraction kit (SIGMA, USA; Cat No. NA1111). A ligation reaction was set up with
insert (50 µg) and vector (150 µg) in 20µl reaction volume using 1 U of T4 DNA ligase
(NEB, USA). The ligation reaction was incubated for 18 h at 16⁰C. The recombinant
vector containing salT gene was introduced into E. coli and integrity was confirmed
using colony PCR as well as restriction digestions (appendix). The salT gene was
ligated to modified pCAMBIA 2301 vector between a CaMV 35S promoter and an rbcS

Chapter 3: Materials and Methods
56
(ribulose-1,5-bisphosphate carboxylase small-subunit gene) terminator (Fig 3.7 a).
Similarly, full-length cDNAs of salT (without stop codon) were cloned into a modified
pCAMBIA1300 vector containing the CaMV 35S promoter and rbcS terminator (Fig
3.7 b). Three tandem repeats encoding the FLAG epitope were fused in-frame to the C-
terminal end of salT cDNA. The resulting constructs, p35Spro:salT-rbcS and
p35Spro:salT-FLAG was introduced into A. tumefaciens strain EHA105. To facilitate
subcellular localization studies, further the ORF (open reading frame) of salT (without
stop codon) was also cloned into the pBI221-GFP vector to create a CaMV 35S:salT-
GFP fusion construct (Fig.3.7 c).
Fig. 3.7. salT gene of O. sativa ligated to a) modified pCAMBIA 2301 b) modified
pCAMBIA1300 containing 3X FLAG c) a pBI221-GFP vector.
3.14.2.5. Expression of salT in E. coli
In order to express salT in E. coli, the entire coding region of the salT cDNA
was cloned into pET 28a Vector (http://richsingiser.com/4402/pET28.pdf). The
recombinant vector containing salT gene (pET28a-salT) was introduced into E. coli
strain DH5α and integrity was confirmed using colony PCR as well as restriction
digestions. The recombinant plasmid was later purified from E. coli strain DH5α and
b
c
a

Chapter 3: Materials and Methods
57
mobilized into BL21 competent cells. The transformed bacteria were grown at 37⁰C
with shaking (200 rpm) in 20 ml LB broth containing 50 μg/ml kanamycin until the
optical density at 600 nm (OD600) of the culture reached 1.0. Then, the 10 ml of the
culture was inoculated into 1000 ml LB broth containing 50 μg/ml kanamycin and
incubated at 37⁰C with shaking (250 rpm) until OD600 reached 0.5. The culture was then
incubated at 20⁰C with shaking (200 rpm) for 30 min followed by the addition of 1 mM
IPTG (isopropylthiogalactopyranoside). After the incubation for 2 h, the bacteria were
harvested by centrifugation at 7000g for 10 min. The bacteria pellet was resuspended in
40 ml of buffer (50 mM sodium phosphate buffer, pH 8.0, containing 0.5 mM NaCl),
and sonicated on ice (240× 2 s pulses with 4 s intervals). The homogenate was then
centrifuged at 14000g for 10 min at 4⁰C, and the protein present in the supernatant was
purified using the Ni-NTA affinity chromatography kit (Thermo scientific, USA)
following manufactures instructions. Purified SALT protein was observed on 10 %
sodium SDS-PAGE gel.
3.15. In vitro regeneration of rice
3.15.1. Preparation of stock solutions for culture medium
The constituents of culture medium were divided into four different stock
solutions: (I) Major salts, (II) Iron salts, (III) Organic nutrients except sucrose, (IV)
Minor salts. The recipe for stock solutions is given in appendix. MS basal medium
(Murashige and Skoog, 1962) stocks were also prepared as mentioned in appendix
3.15.2. Preparation of PGRs stocks
The phytohormone 2,4-D used for callus induction was prepared by dissolving the
required amount of PGR in a few drops of 70% ethanol and then raising the final volume
with distilled water so as give a final concentration of 5 mM. Other phytohormones like
BAP, NAA and ABA were prepared by dissolving the PGR powder initially in 1 N
NaOH and raising the final volume with distilled H2O to reach the stock concentration to
5 mM. Stock solutions were stored at 4oC.

Chapter 3: Materials and Methods
58
3.15.3. Preparation of culture medium
To prepare 1L of medium, 50 ml of stock solution I and 10 ml each of the
remaining three stock solutions (II, III and IV) were added to the flask. Additional
compounds like myo-inositol (100 mg/l), L-proline (500 mg/l), L-glutamine (500 mg/l),
and casein enzyme hydrolysate (300 mg/l) were also added along with stocks to the
medium. Different media used for callus induction, maturation and regeneration
(Appendix) differ from one another in the type of PGR added to it. For callus induction
media only 2,4-D was used, for the maturation media PGRs like ABA, BAP and NAA
were used and finally for the regeneration medium, only BAP and NAA were used. 30 g
of sucrose was used as a carbon source. The final volume was raised to 1 L by adding the
required amount of double-distilled water. After thorough mixing, the pH of the medium
was adjusted to 5.8 using 0.1 N NaOH and/or 0.1 N HCl. To solidify the media, 2.8 g of
clarigel was added to the solution. MS medium with 3% sucrose was prepared in tubes
for rooting and shoot development. The medium was autoclaved for 20 min at 1.1 Kg/cm²
pressure and 121oC temperature. After autoclaving, the media was cooled to around 60oC.
For embryogenic calus induction, maturation and regeneration, sterilized media were
aseptically poured into the petri plates in the laminar air-flow.
3.15.4. Surface sterilization and inoculation of seeds
Rice seeds were dehusked and washed with double distilled water containing 1-
2 drops of tween-20 detergent. Seeds were then rinsed with 0.4% (v/v) solution of
sodium hypochlorite containing a drop of tween-20 for 25 min followed by two washes
with double distilled water. Seeds were subsequently treated with 0.01% (w/v) mercuric
chloride solution containing a drop of tween-20 for 3-4 min and thereafter, rinsed many
times with sterile distilled water to remove all the traces of sterilizing agents. 6-8
mature sterilized seeds were then inoculated into medium contained in Petri plates.
3.15.5. Embryogenic callus induction and regeneration
Seeds were inoculated in rice embryogenic callus induction medium (R-ECIM;
Appendix) containing 2,4-D for 3 weeks in dark under controlled temperature (25±2oC)
of culture room. The cultures were regularly screened for contamination and necrosis on
the daily-basis. After 3 weeks, the scutellar embryogenic calli obtained from each single

Chapter 3: Materials and Methods
59
explant were again subcultured to fresh R-ECIM medium. Later on, non-embryogenic
calli (compact, non-friable calli that develop root like structures) were discarded and
only embryogenic calli (organized, nodular) were selected and allowed to proliferate in
the fresh R-ECIM medium for another 10 days in dark to attain a convenient size. After
10 days, the embryogenic calli were transferred to rice somatic embryo maturation
medium (R-SEMM; Appendix). The cultures were kept at 25±2oC in dark for 2 weeks
before they are transferred to regeneration medium. If any contamination is observed,
the healthy calli were transferred to the fresh maturation media. After 2 weeks, the
fully matured calli were transferred to the regeneration medium supplemented with
PGRs (R-SERM; Appendix). These cultures were kept under light (2000 lux) of 40 W
white cool fluorescence tubes. The temperature was maintained at 25±2oC with 14 h
photoperiod. After regeneration, for proper development of roots and shoots, the shoots
were transferred to, basal MS medium supplemented with 3% sucrose which was
prepared from desired concentrations of stocks as mentioned in appendix.
3.16. Histological study
The histological analysis of the somatic embryos was carried out using the
following protocol.
i) Killing, fixing and dehydration of material: The material was fixed in FAA
(Formalin : Acetic Acid : Ethanol 50% :: 5 : 5 : 90 v/v) for 1 week. The material
was preserved in 70% ethanol until use after which the tissue was dehydrated in the
following TBA (t-butyl alcohol) series:
Rect. alcohol (ml) : TBA (ml)
a) 30 : 20
b) 50 : 20
c) 50 : 35
d) 45 : 55
e) 25 (Ethanol) : 75
f) - : 100

Chapter 3: Materials and Methods
60
Water was added to each grade (a-c) to make total volume up to 100 ml. The material
was kept in each grade for 3-4 h except for 'c' where it was kept overnight.
ii) Waxing: The material was kept in an oven at 60ºC and paraffin wax flakes were
added after every 15-20 min. The whole process was carried out for a minimum of 4
h. Finally, it was kept in an oven overnight.
iii) Block making and section cutting: Blocks were made and sections (12 µm) thick
were cut with the help of a rotary microtome.
iv) Mounting and stretching: A drop of egg albumen was applied on a clean slide after
which 2-3 drops of distilled water were put on the slide and sections placed on it.
These were stretched on a hot plate at 60oC and kept overnight at room temperature.
v) Dewaxing: Slides were put in pure xylol for 1-2 h and passed through each of the
following grades for 2-3 min unless otherwise specified:
Xylol (ml) : Ethanol (ml)
a) 75 : 25
b) 50 : 50
c) 25 : 75
d) Rectified alcohol
e) 25 water : 75 ethanol
f) 50 water : 50 ethanol
g) 75 water : 25 ethanol
h) Safranin (6-24 h)
i) 75 water : 25 ethanol
j) 50 water : 50 ethanol
k) 25 water : 75 ethanol
l) Rectified alcohol
m) Ethanol

Chapter 3: Materials and Methods
61
n) Ethanol
o) Clove oil 25% in ethanol
p) Clove oil 50% in ethanol
o) Fast green (prepared in 50% clove oil)
q) Clove oil 50% in Xylol
r) Clove oil 25% in Xylol
s) Xylol (30 min)
t) Xylol (30 min)
vi) Mounted the slides in DPX
3.17. Agrobacterium strains and construct used for transformation
The transgene used in this study is the salT gene from rice (GenBank accession
no LOC_Os01g24710.1). This was cloned in pCAMBIA2301 with Bam H1 and Sac1
restriction sites and the gene construct (Fig. 3.7) was finally transformed to EHA105
strain of A. tumefaciens. This vector has nptII (neomycin phosphotransferase) gene as
the selectable marker, uidA (for GUS) as the reporter gene and a rbcS terminator. The
salT gene was under the control of Cauliflower mosaic virus (CaMV 35S) promoter.
3.17.1. Preparation of Agrobacterium culture
Primary culture of Agrobacterium was prepared by inoculating single colony
from a freshly streaked plate, in 5 ml of autoclaved liquid YEP medium (Appendix)
supplemented with 10 mg/l rifampicin and 50 mg/l kanamycin. The culture was
incubated for 16-18 h on a rotatory incubator shaker (ORBITEK, India) at 200 rpm in
dark at 28°C. Secondary culture was prepared in a 500 ml baffled flask containing 100
ml YEP medium (supplemented with same antibiotics as used for primary culture) by
adding 0.4% of the primary culture and grown under similar conditions. Once the OD600
(optical density at 600 nm) reached ~1.0, Agrobacterium cells were pelleted by
centrifugation at 8000g for 15 min at 4°C. The cells were resuspended in R-ECIM
resuspension medium containing 100 μM acetosyringone to adjust the OD600 of the
bacterial suspension to 0.6.

Chapter 3: Materials and Methods
62
3.17.2. Co-cultivation and selection of transformed calli
The 10 day subcultured embryogenic calli in R-ECIM medium were collected
and Agro-infected by immersing them in the Agrobacterium (EHA105) culture for 15
min with intermittent gentle shaking at 40-50 rpm. The Agroinfected calli were blotted
dry on sterile Whatman No. 3 filter paper for 5 min. Calli were then transferred to the
co-cultivation medium (R2C; Appendix.) and incubated at 27±1°C in the dark for
around 48 h. After the initial growth of Agrobacterium observed around most of the
calli, the calli were rinsed 8-10 times with 250 mg/l cefotaxime in sterile distilled water,
blotted dry on sterile Whatman No. 3 filter paper and transferred onto first selection
medium- R2S (200 µg/l cefotaxime, vancomycin 50 µg/l and 50 µg/l kanamycin) and
incubated for 7 days at 27±1°C in dark. After the first selection, brown or black calli
were removed and only creamish healthy calli were shifted to the fresh R2CS Medium
(Appendix) media for second selection and maintained at 27±1°C in dark. After second
selection for about 20 days, microcalli could be observed which were finally transferred
to fresh maturation media for third selection and allowed to proliferate for 5-7 days at
27±1°C in dark.
3.17.3. Regeneration of transformed calli
After third selection, black or brown microcalli were discarded and the putative
transformed mature somatic embryos (with new growth) were transferred to
regeneration medium (R-SERM; Appendix). These microcalli were incubated at
27±1°C in light for regeneration.