Embed Size (px)
Citation preview
Chapter 3 Chapter 3 Human PopulationsHuman Populations
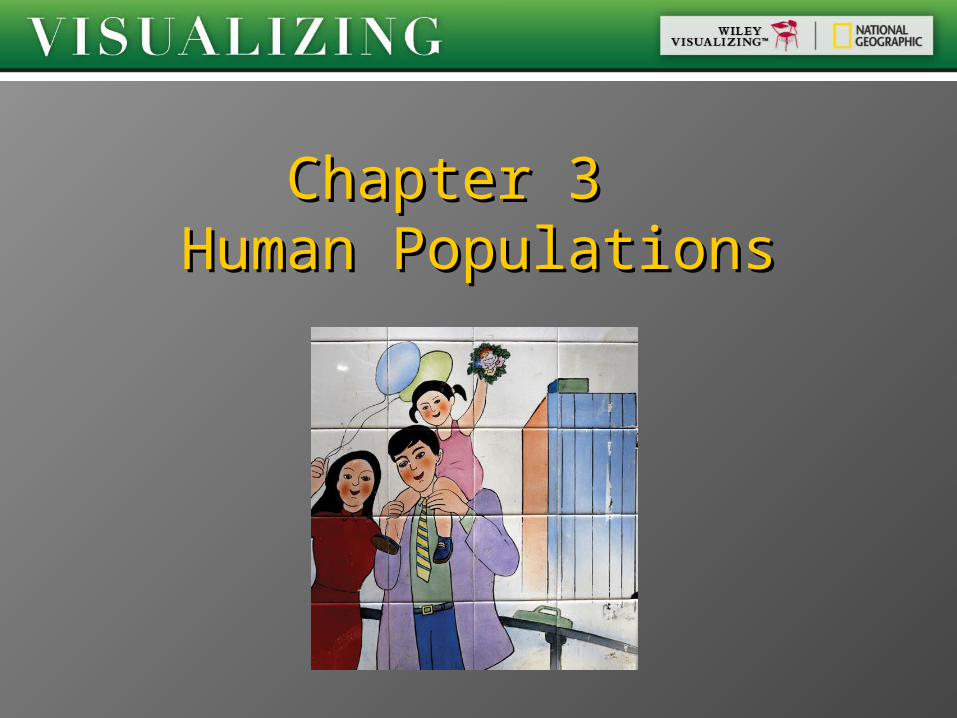
Largest population in the worldLargest population in the world 1971: government involved1971: government involved 19791979
More aggressive planMore aggressive plan One-child policyOne-child policy Why do it?Why do it?
Population Growth In ChinaPopulation Growth In China
Population Growth In ChinaPopulation Growth In China 1984: program relaxed; why?1984: program relaxed; why? 1970: 5.8 children/woman1970: 5.8 children/woman 2006: 1.7 children/woman2006: 1.7 children/woman Ethical issuesEthical issues
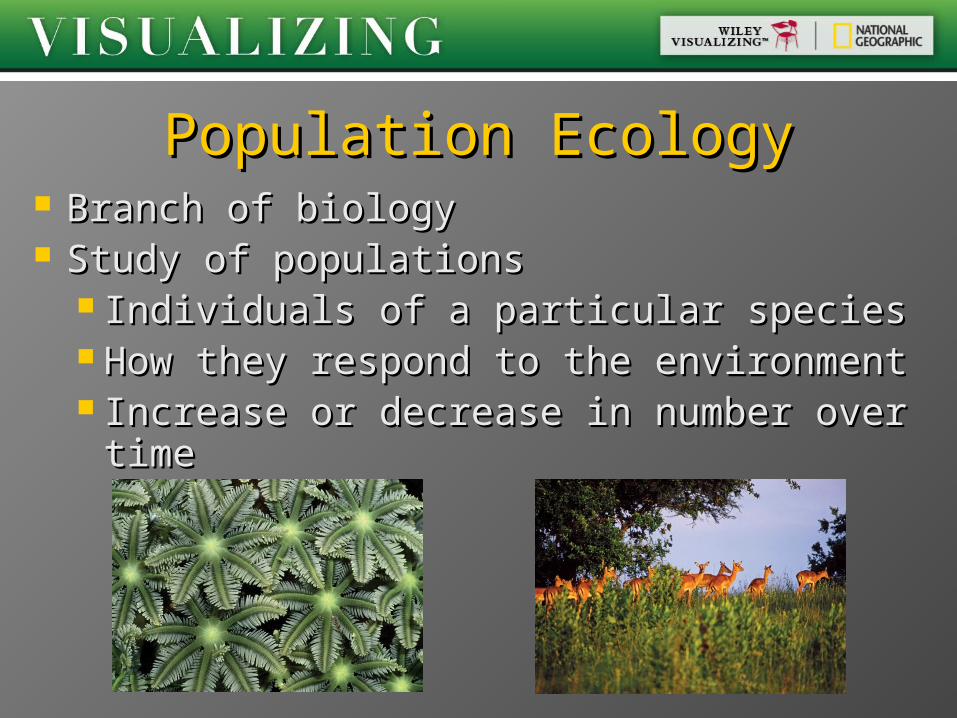
Population EcologyPopulation Ecology Branch of biologyBranch of biology Study of populationsStudy of populations
Individuals of a particular speciesIndividuals of a particular species How they respond to the environmentHow they respond to the environment Increase or decrease in number over Increase or decrease in number over
timetime
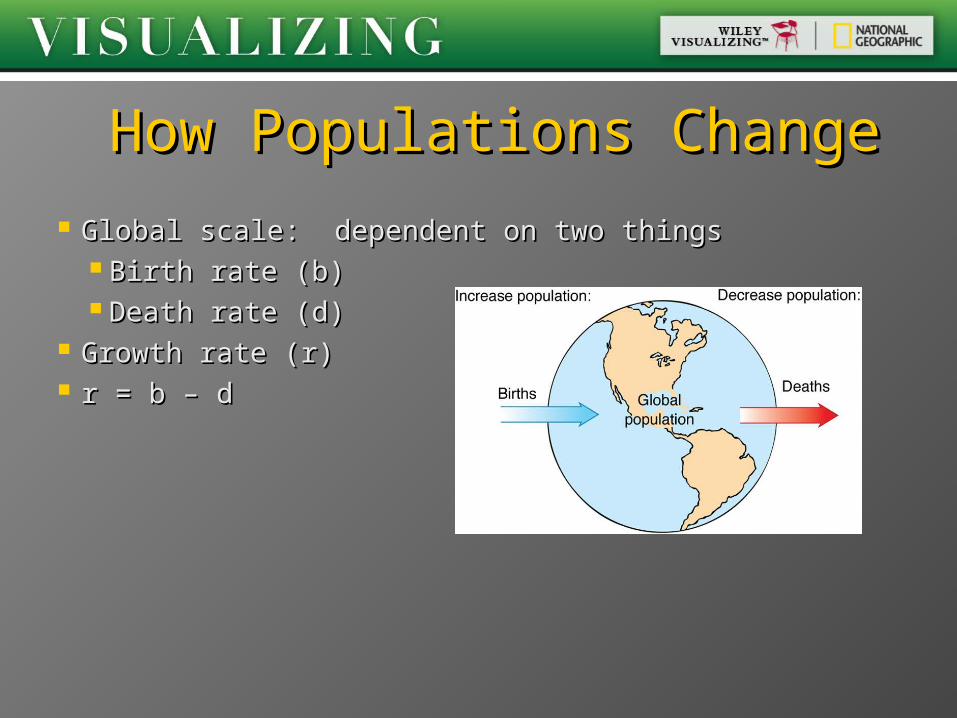
How Populations ChangeHow Populations Change Global scale: dependent on two thingsGlobal scale: dependent on two things
Birth rate (b)Birth rate (b) Death rate (d)Death rate (d)
Growth rate (r)Growth rate (r) r = b – dr = b – d
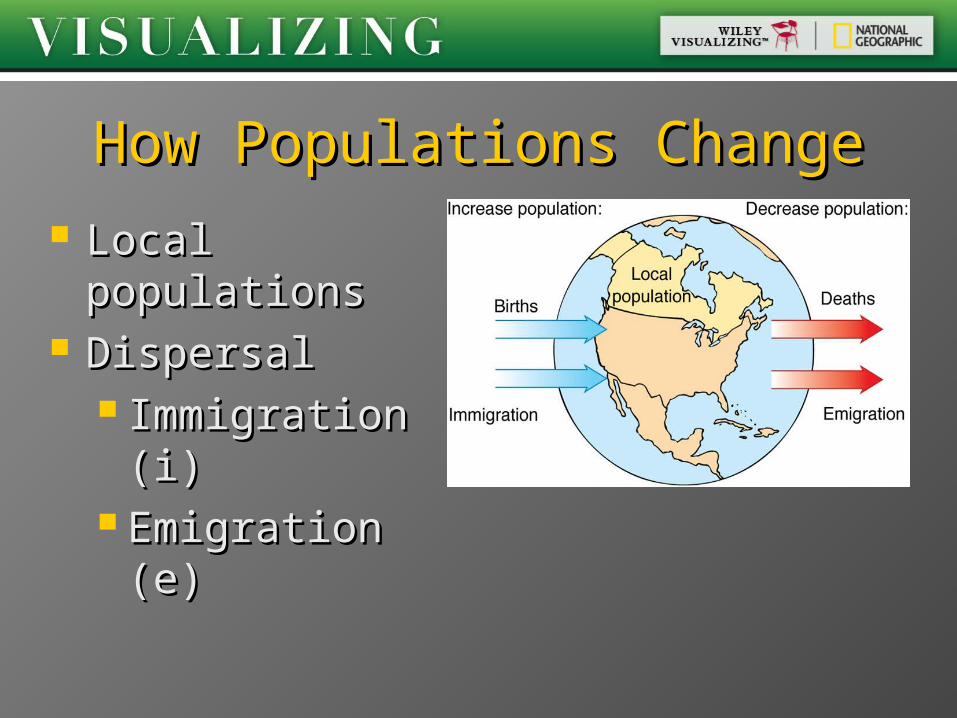
Local populationsLocal populations DispersalDispersal
Immigration (i)Immigration (i) Emigration (e)Emigration (e)
How Populations ChangeHow Populations Change
Maximum Population Maximum Population GrowthGrowth
Biotic potentialBiotic potential Maximum rate at which population Maximum rate at which population
can increasecan increase Determined by life history Determined by life history
characteristicscharacteristics Large organisms Large organisms smallest biotic smallest biotic
potentialspotentials Microorganisms Microorganisms largest biotic largest biotic
potentialspotentials
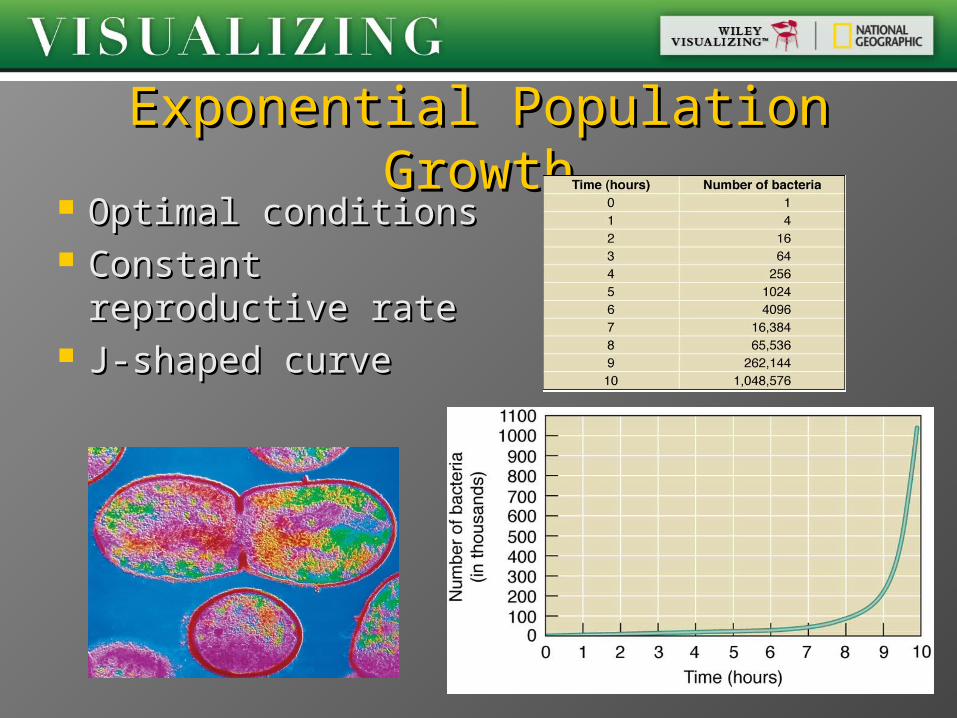
Exponential Population GrowthExponential Population Growth Optimal conditionsOptimal conditions Constant Constant
reproductive ratereproductive rate J-shaped curveJ-shaped curve
Environmental ResistanceEnvironmental Resistance
Unfavorable environmental Unfavorable environmental conditionsconditions
Prevent reproduction at biotic Prevent reproduction at biotic potentialpotential
Examples?Examples? Environment controls population size: Environment controls population size:
how? how?
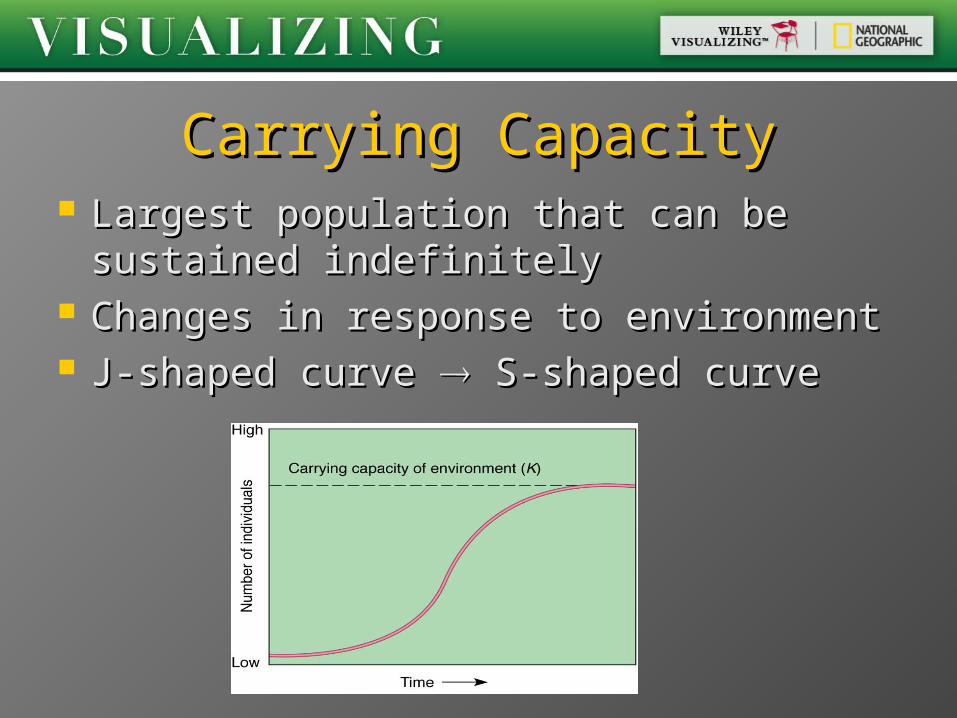
Carrying CapacityCarrying Capacity Largest population that can be Largest population that can be
sustained indefinitelysustained indefinitely Changes in response to environmentChanges in response to environment J-shaped curve J-shaped curve S-shaped curve S-shaped curve
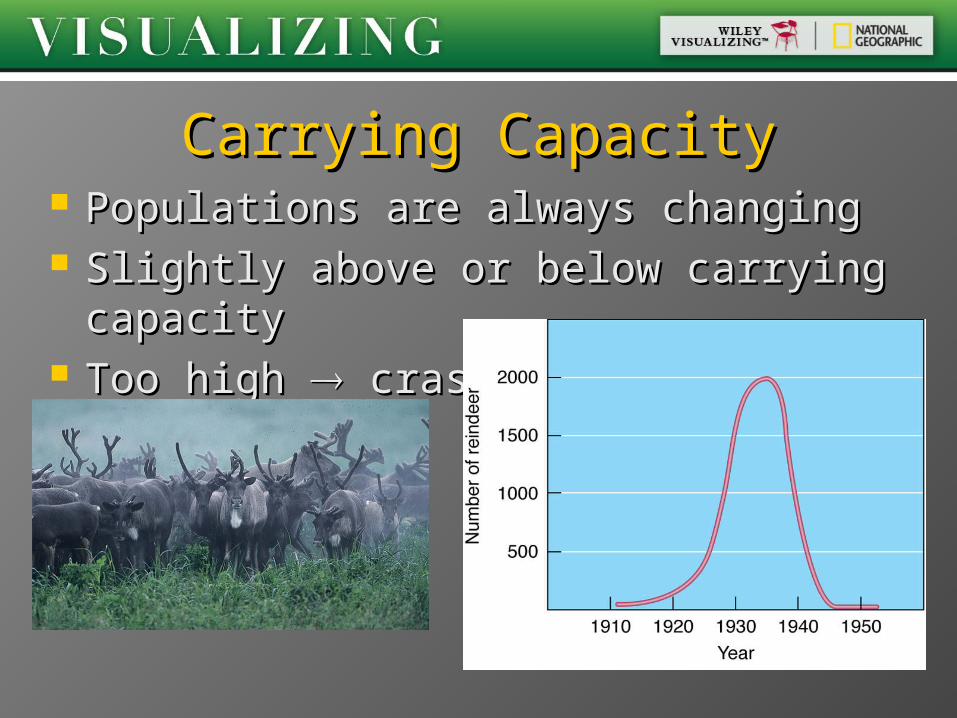
Populations are always changingPopulations are always changing Slightly above or below carrying Slightly above or below carrying
capacitycapacity Too high Too high crash crash
Carrying CapacityCarrying Capacity
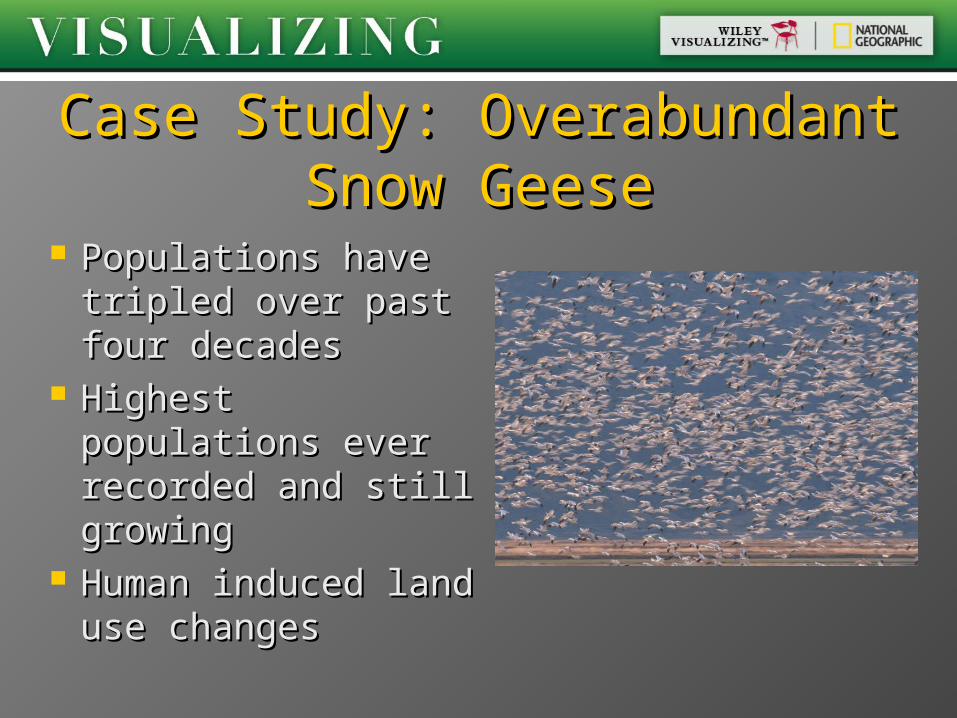
Populations have Populations have tripled over past tripled over past four decadesfour decades
Highest populations Highest populations ever recorded and ever recorded and still growingstill growing
Human induced Human induced land use changesland use changes
Case Study: Overabundant Case Study: Overabundant Snow GeeseSnow Geese
Each spring, millions of birds arrive in Each spring, millions of birds arrive in the Arctic to breedthe Arctic to breed
Habitat is being destroyedHabitat is being destroyed Long timeframe for habitat recoveryLong timeframe for habitat recovery What can be done? What can be done?
Case Study: Overabundant Case Study: Overabundant Snow GeeseSnow Geese
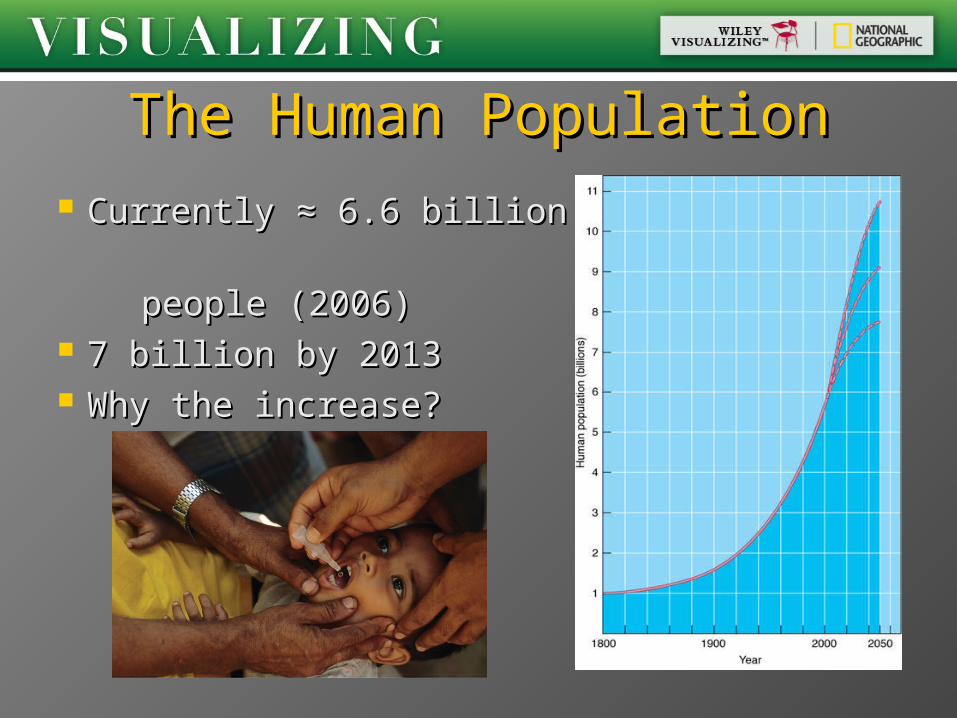
The Human PopulationThe Human Population
Currently ≈ 6.6 billion Currently ≈ 6.6 billion
people (2006)people (2006) 7 billion by 20137 billion by 2013 Why the increase?Why the increase?
Thomas MalthusThomas Malthus British economist (1766–1834)British economist (1766–1834) Hypothesized that human population Hypothesized that human population
would be kept in check: how?would be kept in check: how? Thinking shaped by rapid Thinking shaped by rapid
urbanization & industrializationurbanization & industrialization Was he correct?Was he correct?
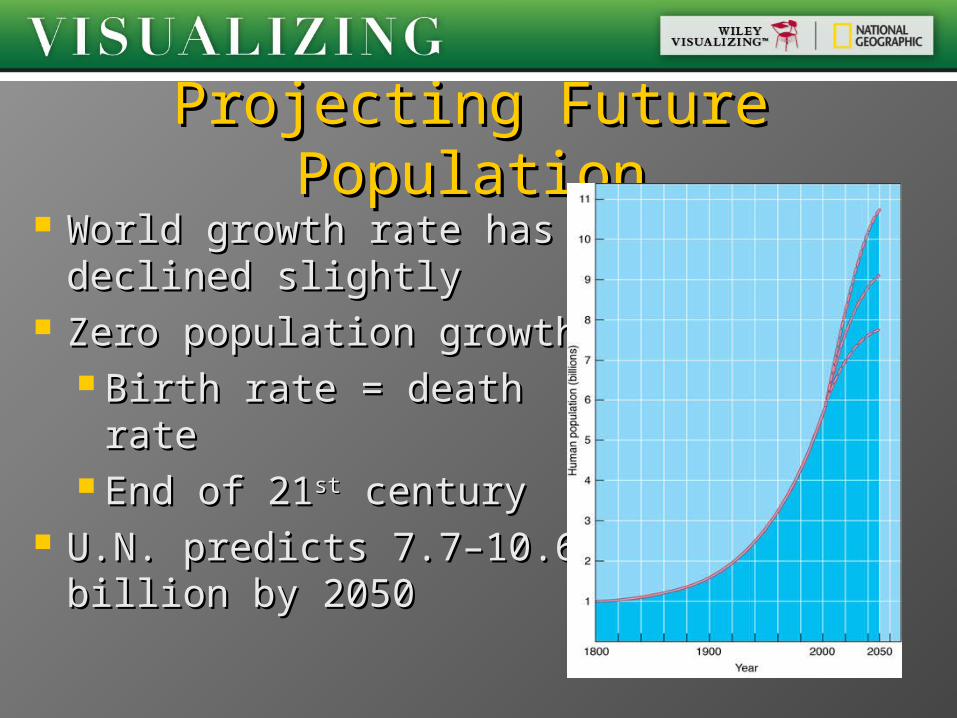
Projecting Future PopulationProjecting Future Population World growth rate has World growth rate has
declined slightlydeclined slightly Zero population growthZero population growth
Birth rate = death rateBirth rate = death rate End of 21End of 21stst century century
U.N. predicts 7.7–10.6 U.N. predicts 7.7–10.6 billion by 2050billion by 2050
Earth’s Carrying CapacityEarth’s Carrying Capacity
4 billion – 16 billion people4 billion – 16 billion people Why such a large range?Why such a large range? What could happen to the What could happen to the
environment?environment? Have we already exceeded our Have we already exceeded our
carrying capacity?carrying capacity?
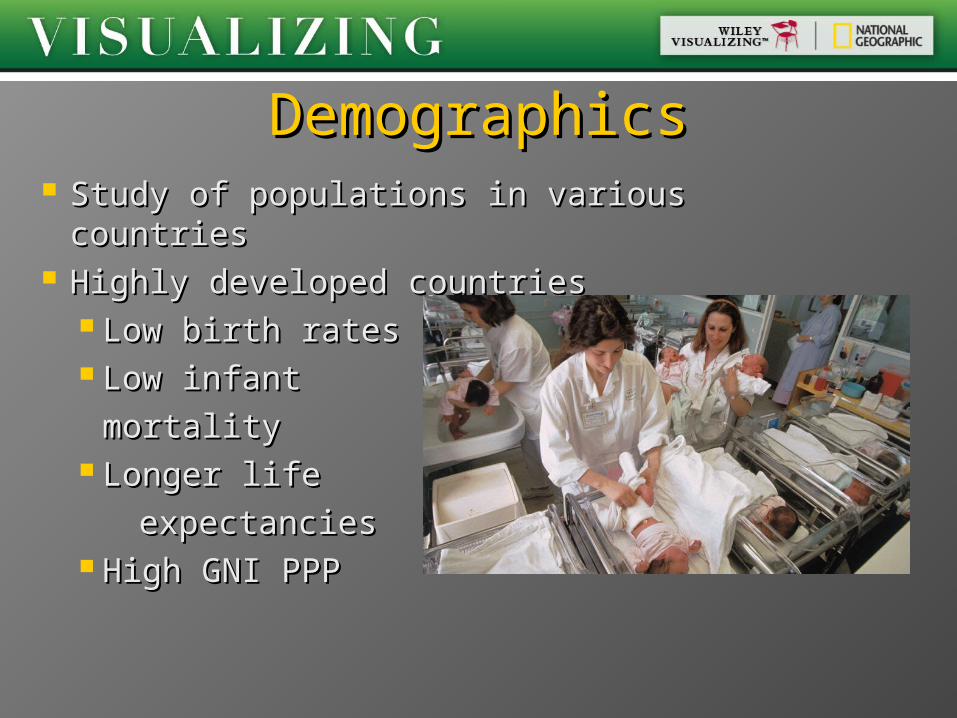
DemographicsDemographics Study of populations in various countriesStudy of populations in various countries Highly developed countriesHighly developed countries
Low birth ratesLow birth rates Low infantLow infant
mortalitymortality Longer life Longer life
expectanciesexpectancies High GNI PPPHigh GNI PPP
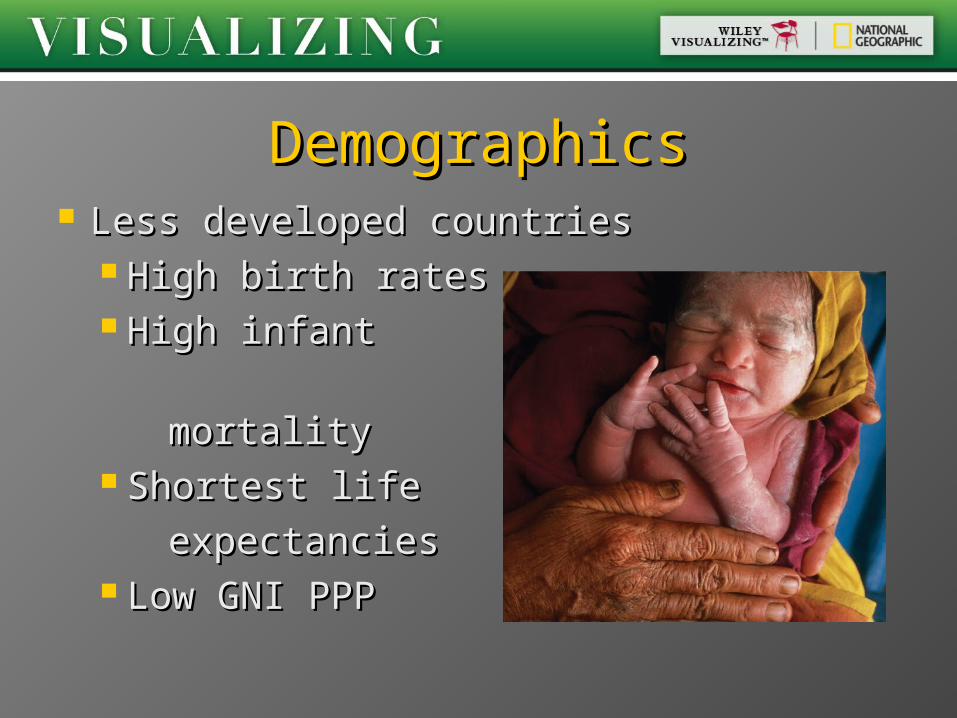
Less developed countriesLess developed countries High birth ratesHigh birth rates High infant High infant
mortalitymortality Shortest life Shortest life
expectanciesexpectancies Low GNI PPPLow GNI PPP
DemographicsDemographics
Demographic TransitionDemographic Transition
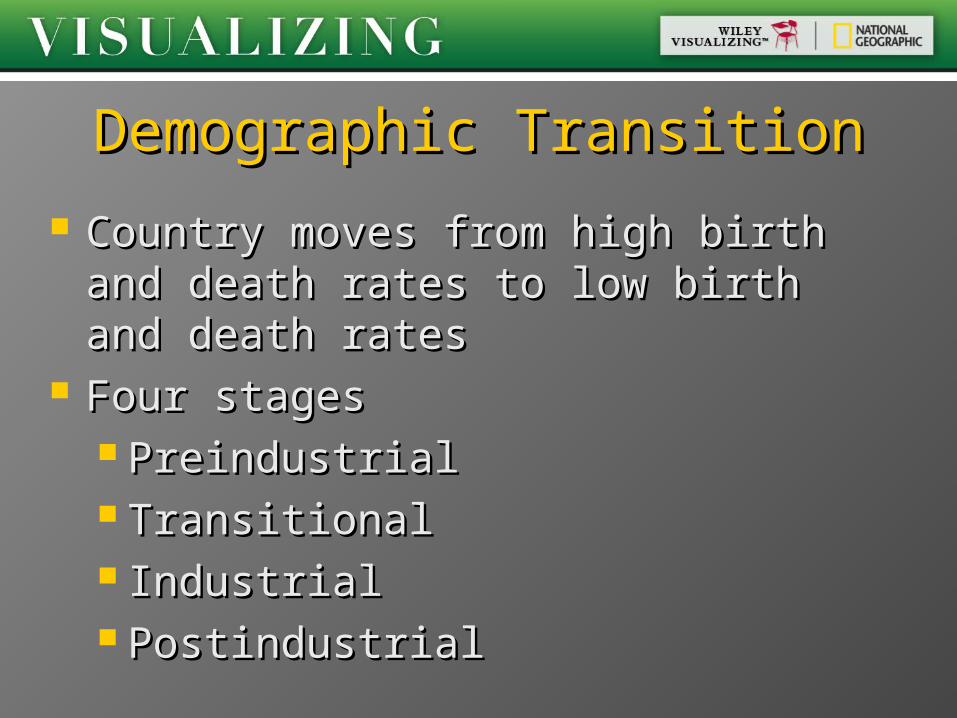
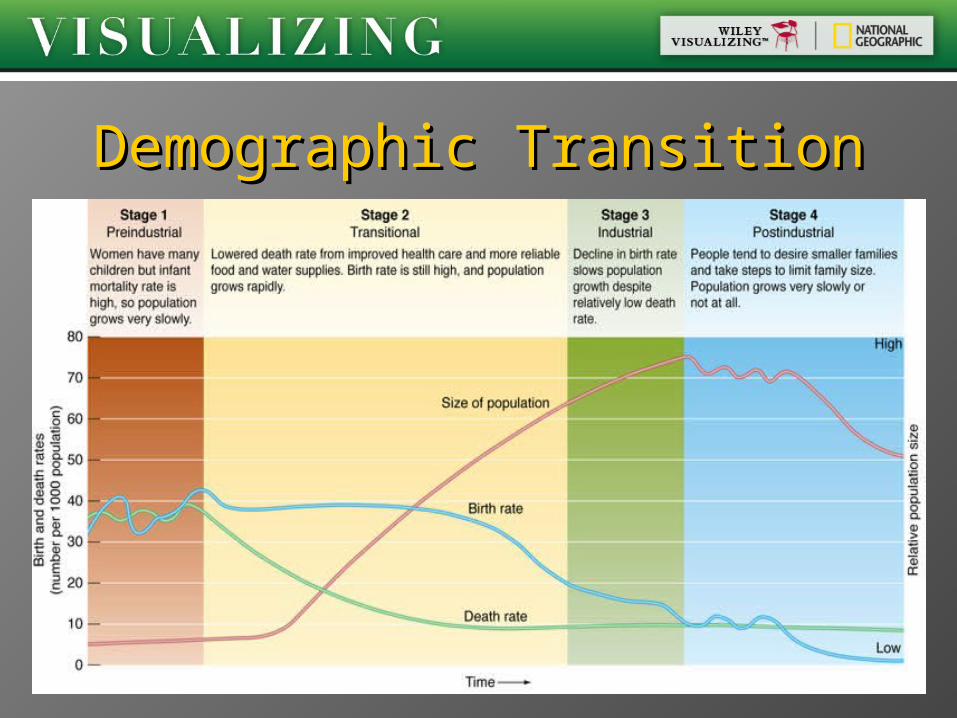
Country moves from high birth and Country moves from high birth and death rates to low birth and death death rates to low birth and death ratesrates
Four stagesFour stages PreindustrialPreindustrial TransitionalTransitional IndustrialIndustrial PostindustrialPostindustrial
Demographic TransitionDemographic Transition
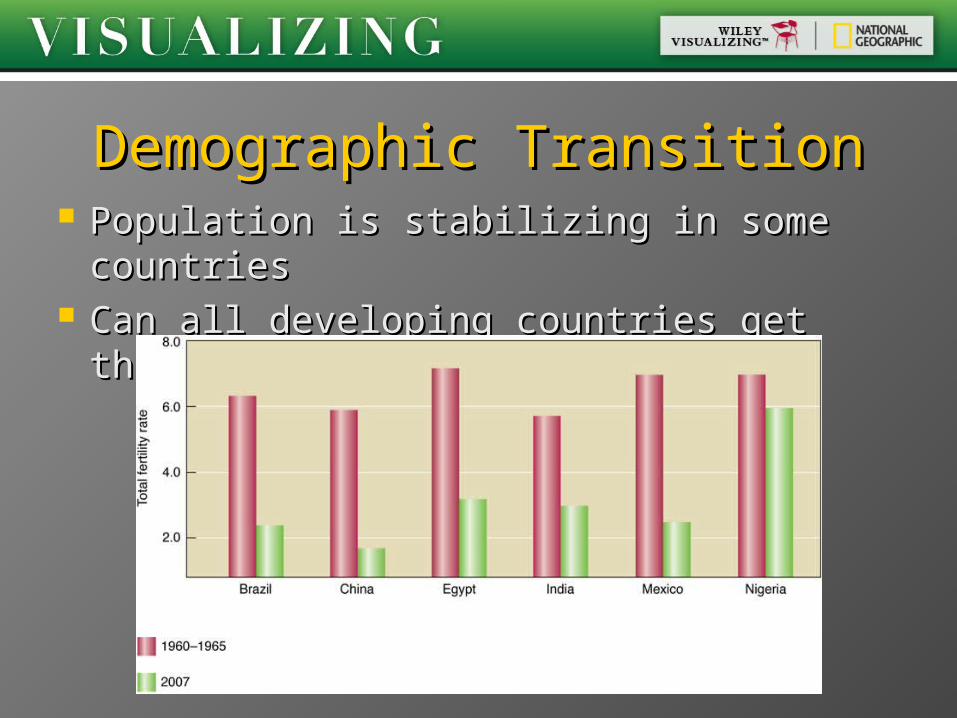
Population is stabilizing in some Population is stabilizing in some countriescountries
Can all developing countries get there?Can all developing countries get there?
Demographic TransitionDemographic Transition
Age StructureAge Structure Number and proportion of people in Number and proportion of people in
each age group in a populationeach age group in a population Helps predict future population growthHelps predict future population growth Shape is importantShape is important
Pyramid = fast growthPyramid = fast growth Tapered bases = slow or negative Tapered bases = slow or negative
growthgrowth
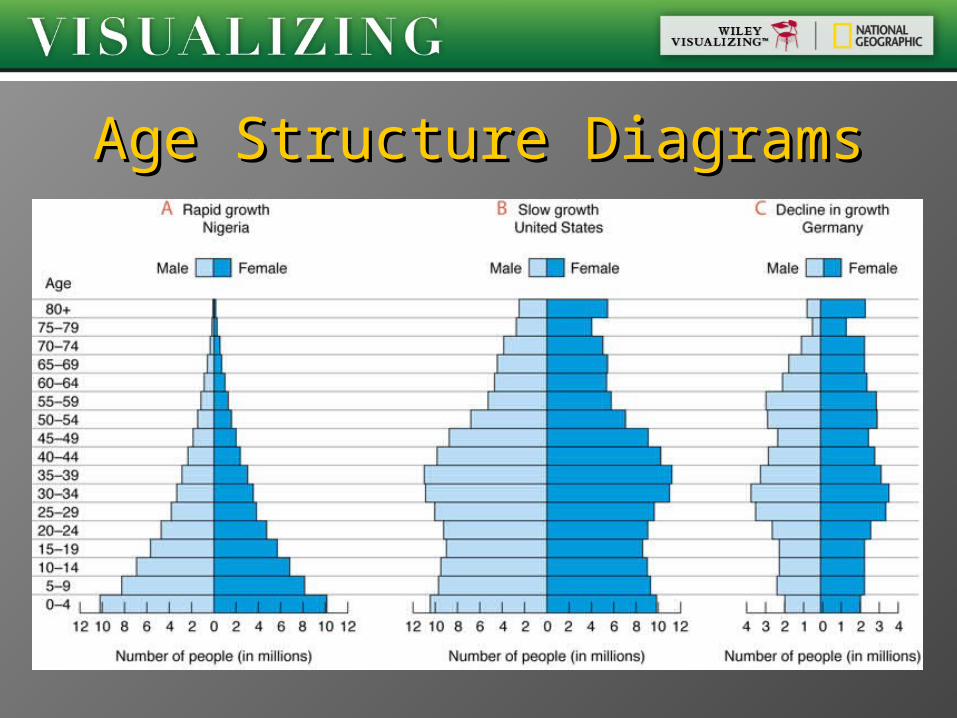
Age Structure DiagramsAge Structure Diagrams
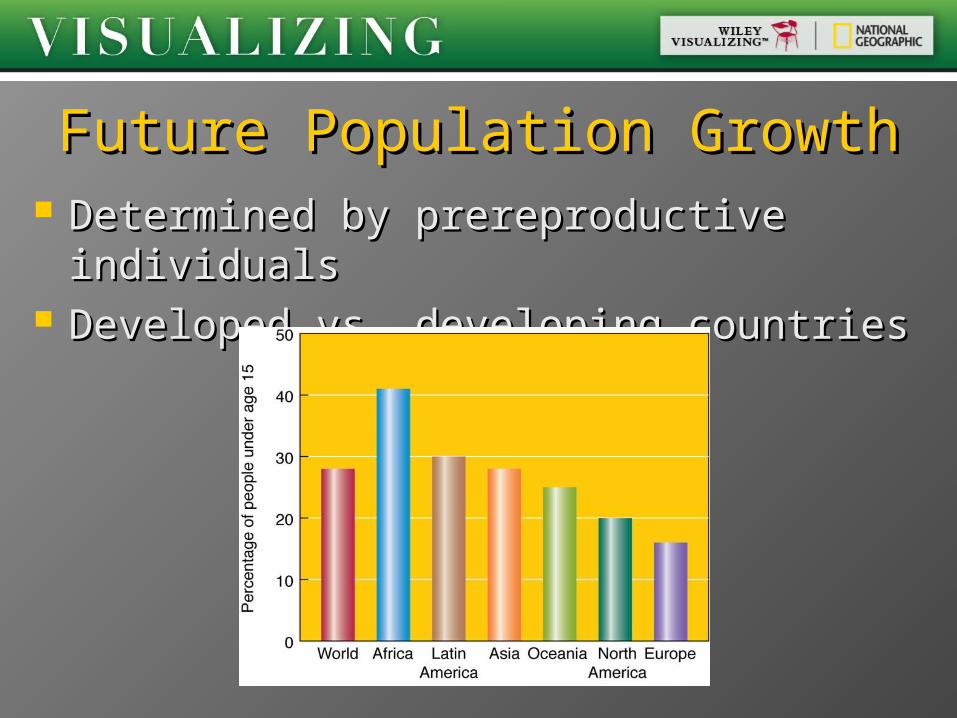
Future Population GrowthFuture Population Growth Determined by prereproductive Determined by prereproductive
individualsindividuals Developed vs. developing countriesDeveloped vs. developing countries
Population Dynamics in Population Dynamics in CanadaCanada
Great Depression of 1930’s meant fewer Great Depression of 1930’s meant fewer childrenchildren
End of World War II, birth rate increasedEnd of World War II, birth rate increased Baby boomer generation moving toward Baby boomer generation moving toward
their sixtiestheir sixties Not all of Canada exhibits the same age Not all of Canada exhibits the same age
structurestructure What is meant by that?What is meant by that?
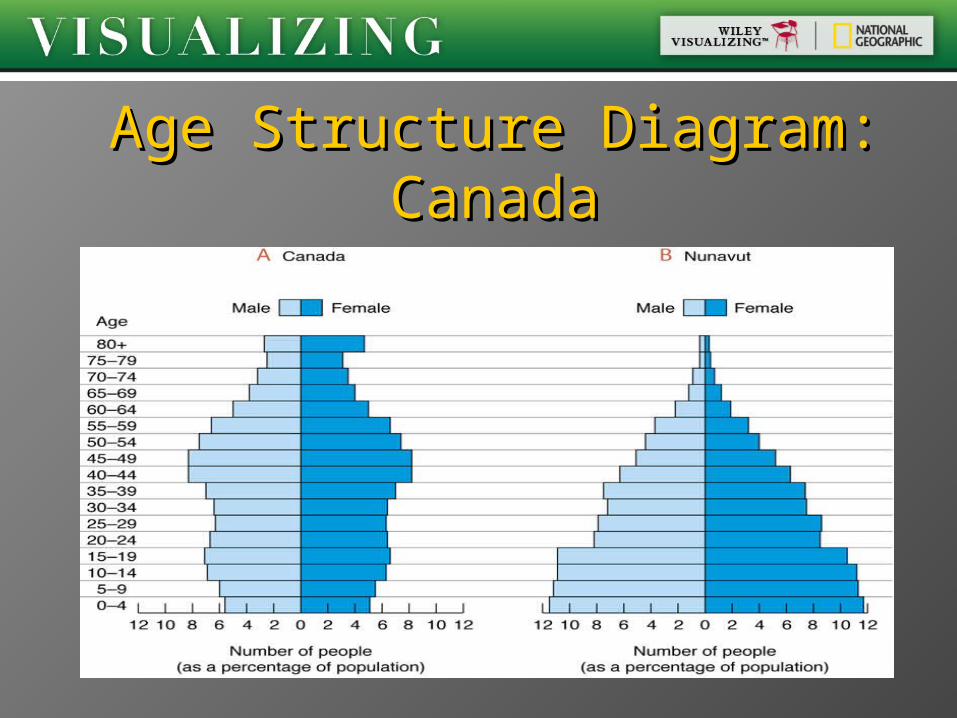
Age Structure Diagram: Age Structure Diagram: CanadaCanada
Stabilizing World PopulationStabilizing World Population
Dispersal is not a solutionDispersal is not a solution Increase the death rate?Increase the death rate? Reduce the birth rate!Reduce the birth rate!
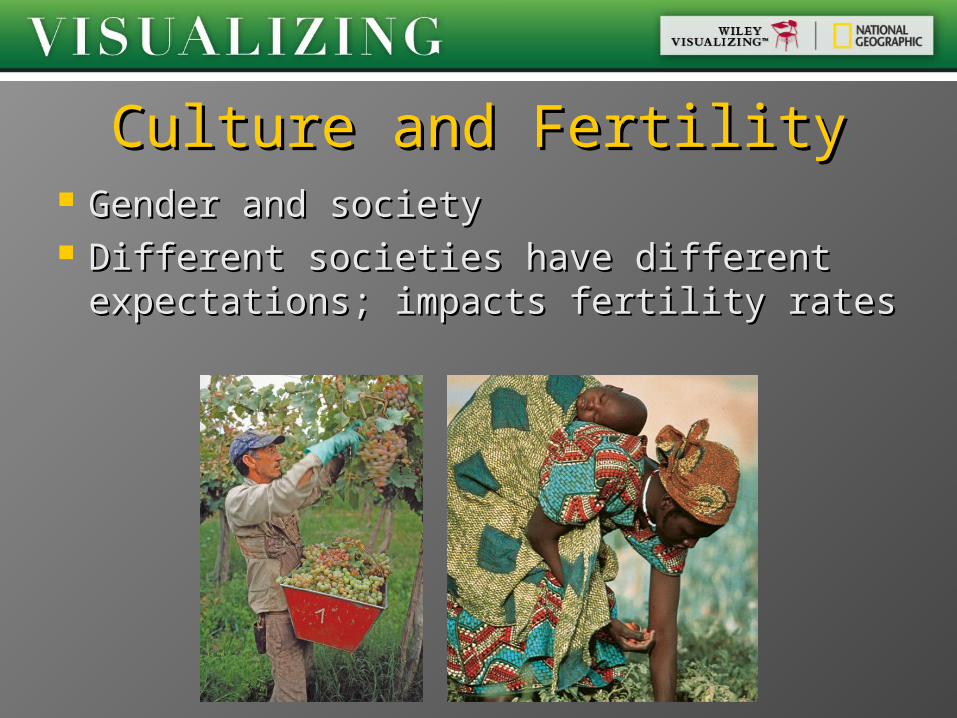
Culture and FertilityCulture and Fertility Gender and societyGender and society Different societies have different Different societies have different
expectations; impacts fertility ratesexpectations; impacts fertility rates
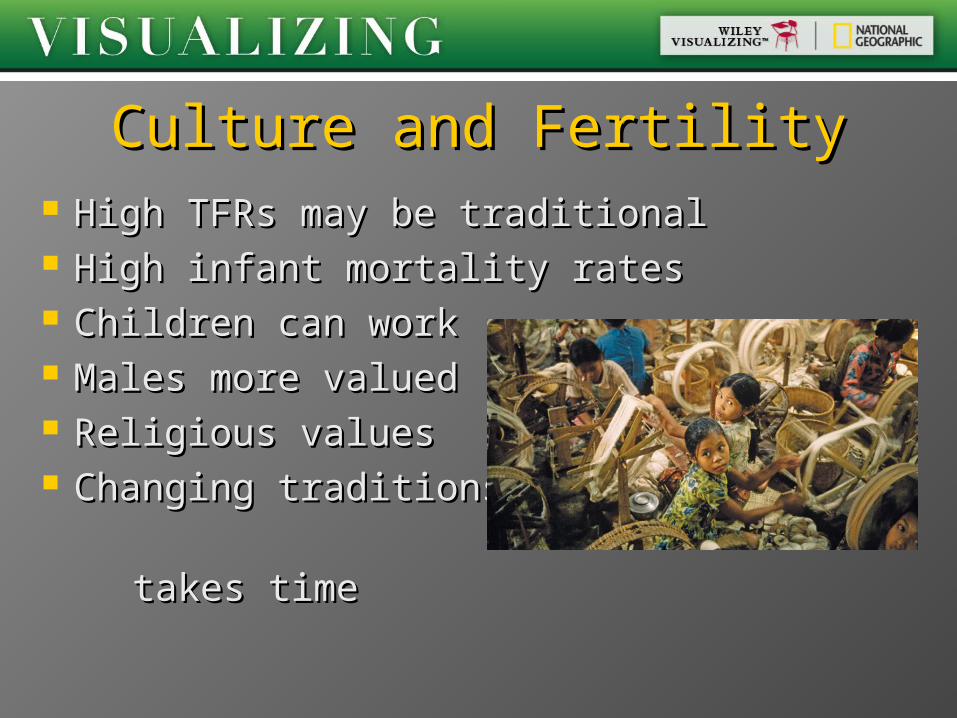
High TFRs may be traditionalHigh TFRs may be traditional High infant mortality ratesHigh infant mortality rates Children can workChildren can work Males more valuedMales more valued Religious valuesReligious values Changing traditions Changing traditions
takes timetakes time
Culture and FertilityCulture and Fertility
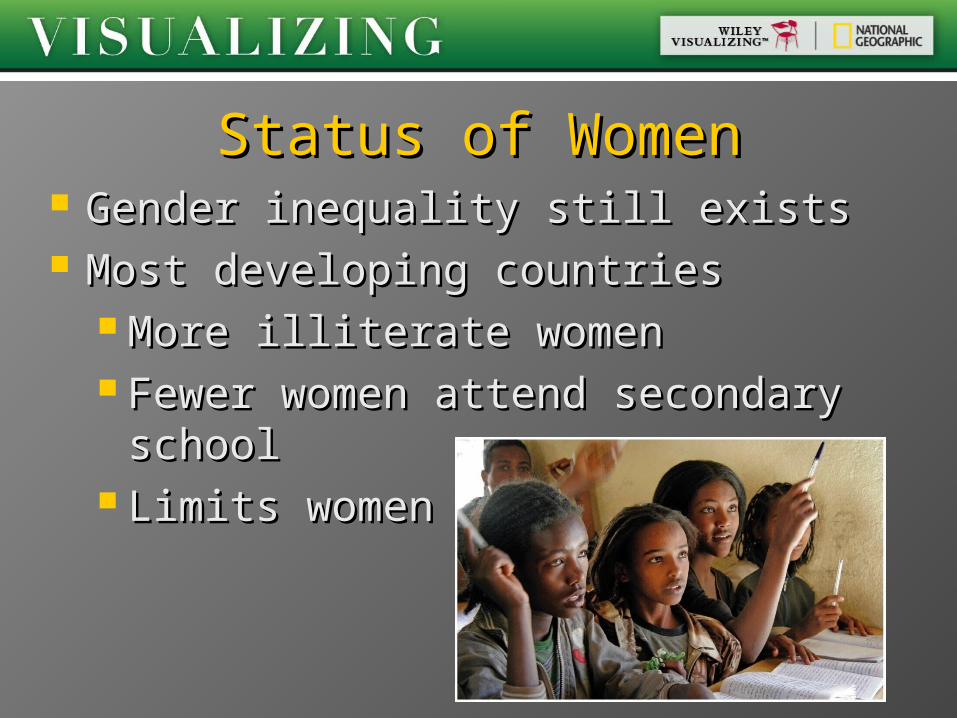
Status of WomenStatus of Women Gender inequality still existsGender inequality still exists Most developing countriesMost developing countries
More illiterate womenMore illiterate women Fewer women attend secondary Fewer women attend secondary
schoolschool Limits womenLimits women
Low status of women is single most Low status of women is single most important factor influencing TFRimportant factor influencing TFR
Average age at marriage impacts TFRAverage age at marriage impacts TFR Sri Lanka: 25; TFR = 2.0Sri Lanka: 25; TFR = 2.0 Bangladesh: 17; TFR = 3.0Bangladesh: 17; TFR = 3.0
More education = More education =
less children; why?less children; why?
Status of WomenStatus of Women
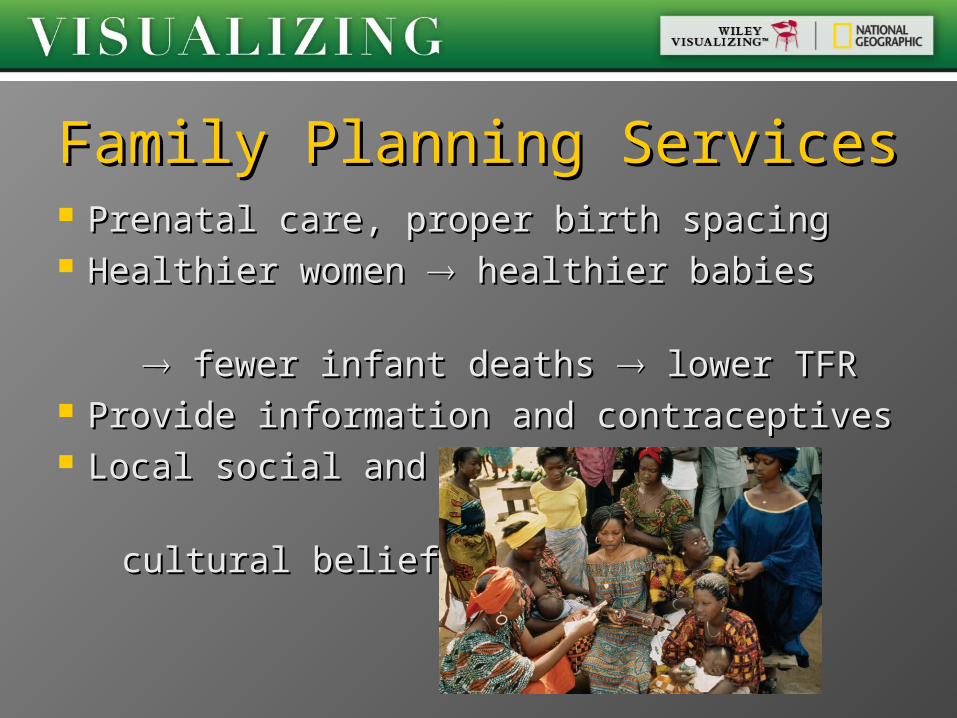
Family Planning ServicesFamily Planning Services Prenatal care, proper birth spacingPrenatal care, proper birth spacing Healthier women Healthier women healthier babies healthier babies
fewer infant deaths fewer infant deaths lower TFR lower TFR Provide information and contraceptivesProvide information and contraceptives Local social and Local social and
cultural beliefscultural beliefs
Government Policies & Government Policies & FertilityFertility
Laws determining minimum marriage Laws determining minimum marriage ageage
Budget for family planning, education, Budget for family planning, education, health care, old-age securityhealth care, old-age security
Economic rewards and penaltiesEconomic rewards and penalties Many countries recognize the problemMany countries recognize the problem
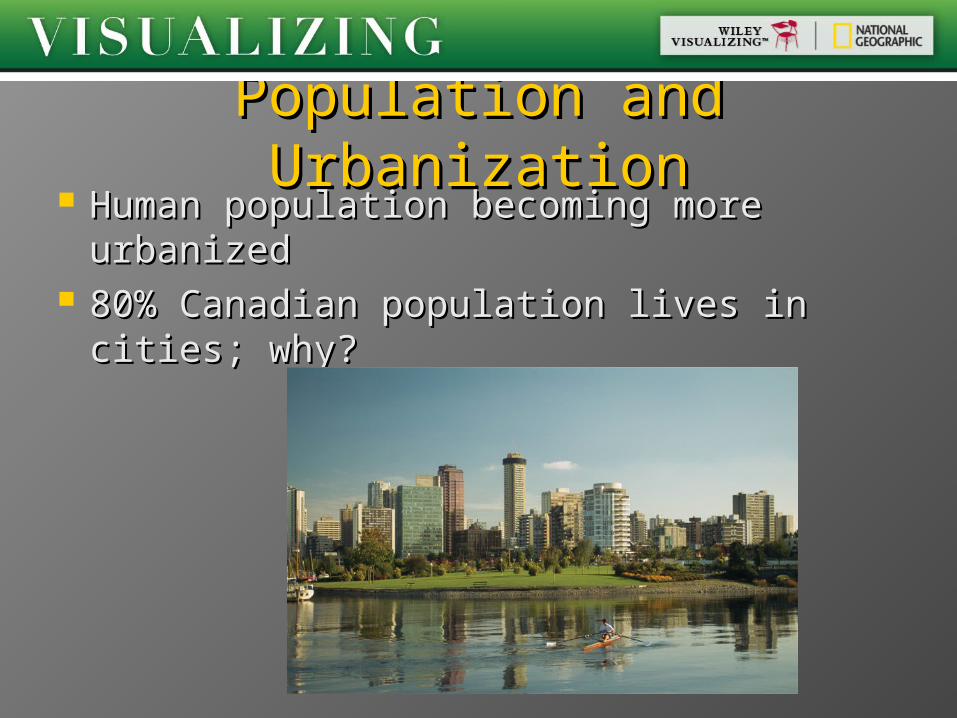
Population and UrbanizationPopulation and Urbanization Human population becoming more Human population becoming more
urbanizedurbanized 80% Canadian population lives in cities; 80% Canadian population lives in cities;
why?why?
Cities more heterogeneousCities more heterogeneous More young people in citiesMore young people in cities Developing countries: more males in Developing countries: more males in
cities; why?cities; why? Developed countries: more females in Developed countries: more females in
cities; why? cities; why?
Population and UrbanizationPopulation and Urbanization
Environmental Problems of Environmental Problems of Urban AreasUrban Areas
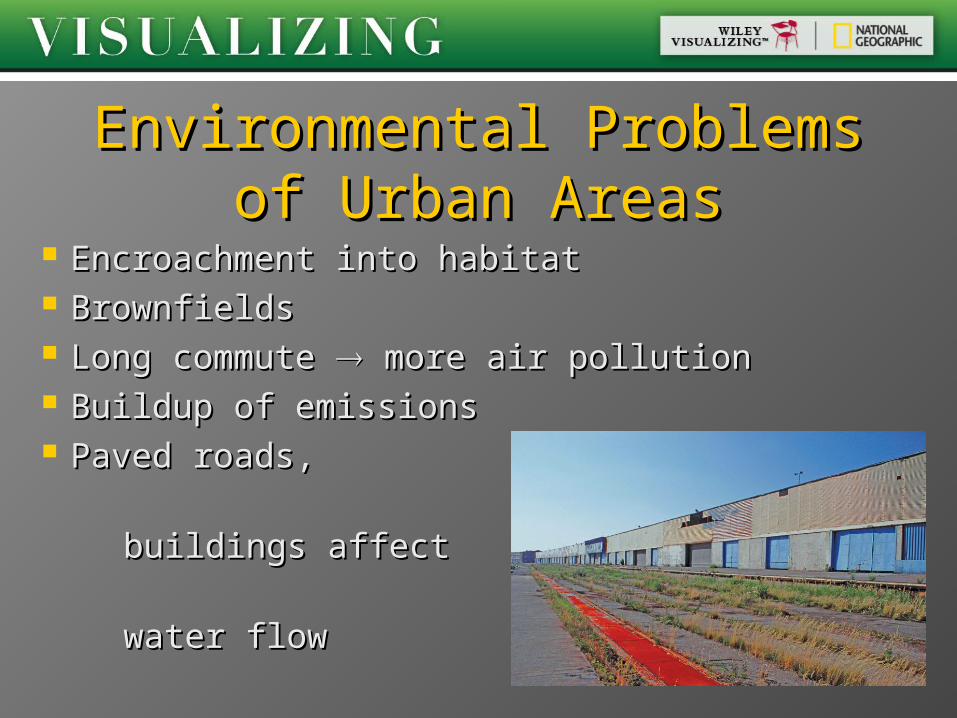
Encroachment into habitatEncroachment into habitat BrownfieldsBrownfields Long commute Long commute more air pollution more air pollution Buildup of emissionsBuildup of emissions Paved roads, Paved roads,
buildings affect buildings affect
water flowwater flow
Environmental Benefits of Environmental Benefits of UrbanizationUrbanization
Compact developmentCompact development Tall, multiple-unit residential buildings Tall, multiple-unit residential buildings
close to jobs and shopping districtsclose to jobs and shopping districts Connected by public transportationConnected by public transportation Reduces pollutionReduces pollution Preserves rural areasPreserves rural areas
Requires smart planning!Requires smart planning!
Urbanization TrendsUrbanization Trends
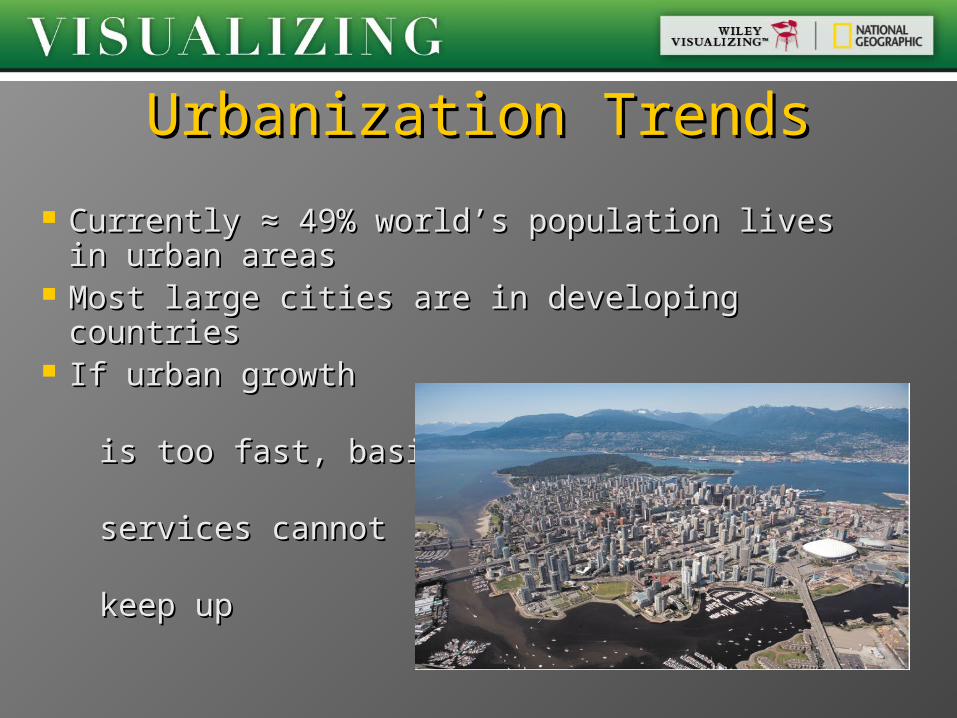
Currently ≈ 49% world’s population Currently ≈ 49% world’s population lives in urban areaslives in urban areas
Most large cities are in developing Most large cities are in developing countriescountries
If urban growth If urban growth is too fast, basic is too fast, basic services cannot services cannot keep upkeep up
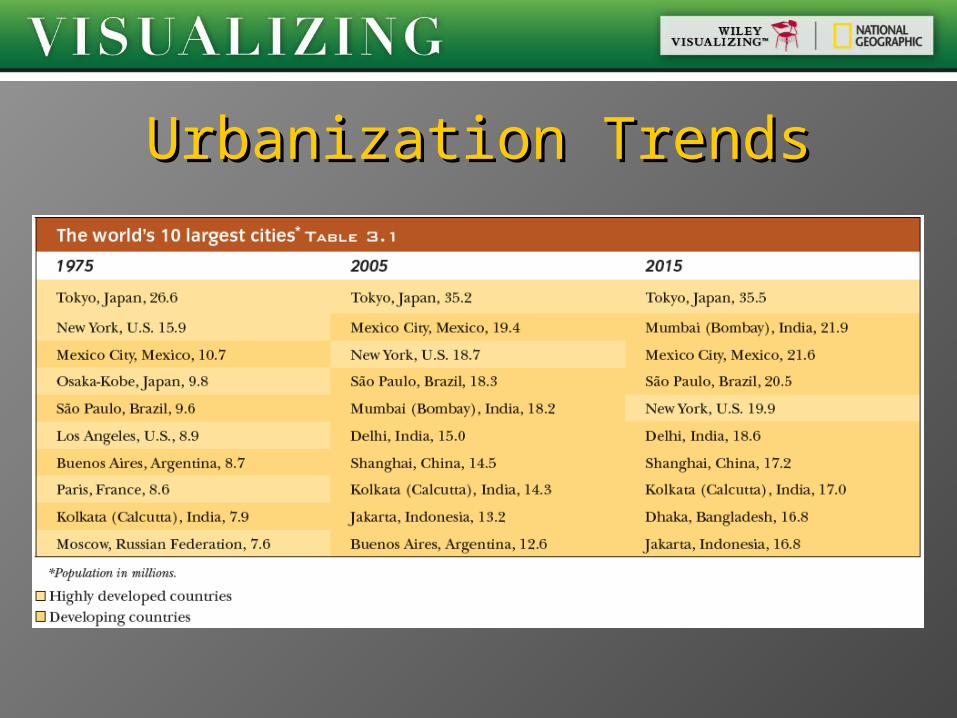
Urbanization TrendsUrbanization Trends

Eco Canada Career FocusEco Canada Career Focus Consider a career as Consider a career as
an Environmental an Environmental PlannerPlanner
Responsible for Responsible for balancing the needs balancing the needs of urban living with of urban living with a sustainable a sustainable environmentenvironment
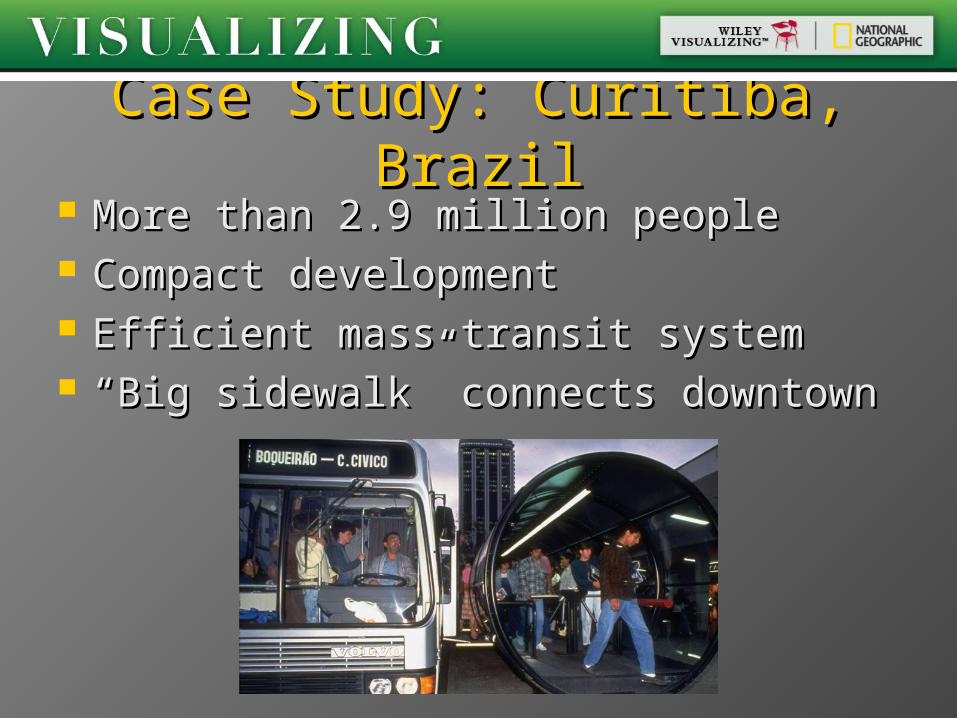
Case Study: Curitiba, BrazilCase Study: Curitiba, Brazil More than 2.9 million peopleMore than 2.9 million people Compact developmentCompact development Efficient mass transit systemEfficient mass transit system ““Big sidewalk” connects downtownBig sidewalk” connects downtown
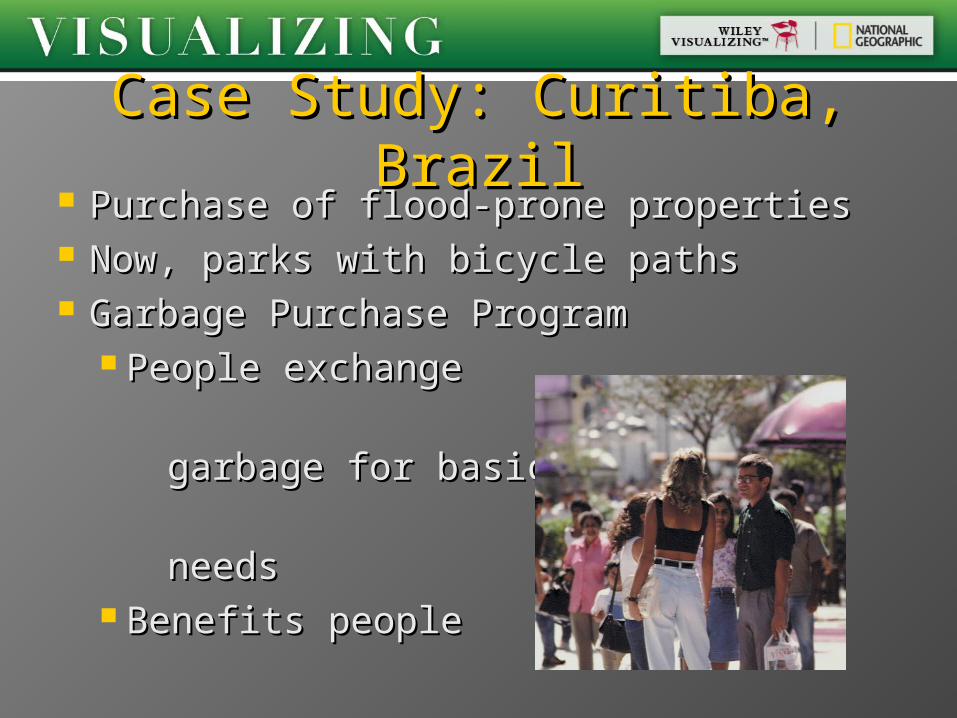
Purchase of flood-prone propertiesPurchase of flood-prone properties Now, parks with bicycle pathsNow, parks with bicycle paths Garbage Purchase ProgramGarbage Purchase Program
People exchange People exchange
garbage for basic garbage for basic
needsneeds Benefits peopleBenefits people
Case Study: Curitiba, BrazilCase Study: Curitiba, Brazil


![41st NCAA Wrestling Tournament 1971 3/25/1971 to …nwhof.org/NCAA-Brackets/PDF/NCAA 1971.pdf · 41st NCAA Wrestling Tournament 1971 3/25/1971 to 3/27/1971 at ... Ken Donaldson [6]](https://img.pdfslide.us/doc/110x75/5a787bc27f8b9aa2448c9e86/41st-ncaa-wrestling-tournament-1971-3251971-to-nwhoforgncaa-bracketspdfncaa.jpg)


![[XLS] · Web view394 1971 528 376 242 420 1971 650 468 300 532 1971 641 440 275 494 1971 485 338 221 361 1971 395 253 150 259 1971 580 362 195 397 1972 642 487 334 549 1972 650 496](https://img.pdfslide.us/doc/110x75/5ab1f4297f8b9ac66c8d1606/xls-view394-1971-528-376-242-420-1971-650-468-300-532-1971-641-440-275-494-1971.jpg)