Embed Size (px)
Citation preview

Chapter 3 ACCIDENTS OCCURRENCE
"If given enough time, anything that can go wrong, will go wrong" Murphy’s Law
“As far as the laws of mathematics refer to reality, they are not certain;
and as far as they are certain, they do not refer to reality.” Albert Einstein
© M. Ragheb 3/1/2020 3.1 INTRODUCTION
Systems Theory, encompassing Chaos Theory and Complexity Theory, tries to address the reasons for the occurrence of disasters, earthquakes, social upheavals as well as the movements of the financial markets. According to Niall Ferguson from Harvard University in “Complexity and Collapse”:
“Complex systems are made up of a very large number of interacting components that are asymmetrically organized. This means that their construction more resembles a termite hill than an Egyptian pyramid. They operate on the boundary between order and disorder. They can appear to operate quite stably for some time and seem to be in equilibrium. However, they are continuously adapting to their environment. When a perturbation occurs, complex systems go critical and undergo a phase transition. This could move them from an equilibrium state into a crisis situation. The dislodging of a single grain in a sand pile can cause an avalanche and the whole structure to collapse.”
Richard Feynman pointed out that: “Physics is simple.” In fact, classical physics
deals with inanimate objects performing simple behaviors that can be adequately described with deterministic equations. Examples are the motion of heavenly bodies, atoms in molecules, radioactive decay, and relativistic and quantum behavior.
With a raised level of complexity, such as in accidents analysis, weather forecasting and biology, mathematics needs new tools for analysis. Existing conventional statistical models assume that “rare events” or the “statistical outliers” have a substantially lower probability of occurrence than reality would indicate to the casual observer. This problem arises from the way that statistical methods using the Gaussian, Normal or the Bell Curve and its standard deviation were conceived to measure and evaluate data and measurements.
Methods that use the standard deviation and the statistical correlation concepts do not reflect randomness in complex and chaotic systems because they were created to measure and evaluate the dispersion of data in gravity-dependent physical domains such as human height and weight, the movement of subatomic particles such as electrons in atoms

around nuclei and in applications in psychology. When it comes to accidents, the bell curve seems to ignore its “fat tails” or the portion that describes low probability, yet possible rather than probable, extreme events that could have major consequences [1].
In the last decades, the field of mathematics began dealing with the complex areas of science. The analysis of non-linear systems was studied by James Gleick in his 1988 book: “Chaos,” introducing Chaos Theory. This was followed by Roger Lewin in a book: “Complexity,” which introduced “Complexity Theory.”
Figure 1. Collapsed 40 years old Minneapolis I-35W highway on the Mississippi River Bridge, August 1st, 2007, killed 13 commuters and injured 145 motorists. A new bridge
was built on the same spot at a cost of $250 million and reopened on September 18, 2008. The Federal Highway Administration (FHA) suggests that one in four of the more than
600,000 bridges in the USA are either "inadequate" or outdated.
The “Three-Body Problem” is an example of a chaotic system which has no derivative pattern with any predictive power, no applicable algorithm that a human could discover to adapt successfully and turn basis uncertainty into basis risk. In essence, there is no “general closed-form solution” to the Three-Body Problem. Imagine three massive objects in space such as stars, planets or a collection of power producing devices. They are in the same system, meaning that they cannot entirely escape each other’s gravitational pull. You know the position, mass, speed, and direction of travel for each of the objects. You know how gravity works, so you know precisely how each object is acting on the other two objects. To predict, using a formula, where the objects will be at some point in the future is simply not possible.

In 1887, Henri Poincaré proved that the motion of the three objects, with the exception of a few special starting cases, is non-repeating. This is a chaotic system, meaning that the historical pattern of object positions has zero predictive power in figuring out where these objects will be in the future. There is no algorithm that a human can possibly discover to solve this problem. It does not exist.
Mark Buchanan [2] extended the concept of “Complexity” by introducing the concept of “Ubiquity” explaining the behavior of systems in the critical state. He related the behavior of systems and their associated circumstances to their critical state. The degree of criticality and the associated states become the main issues under consideration.
The basic principle is that: certain systems, under specific circumstances, behave in curious yet mathematically similar ways. As an illustration, one can consider experiments with sand piles leading eventually to the generation of avalanches. Keeping a tally of the magnitudes of the avalanches leads to a characteristic pattern of behavior. The pattern can be described mathematically using a power function. The power function description defines our ability to predict the behavior of the sand pile [3]. The addition of a single grain of sand to the pile may have several possible consequences: 1. No substantial effect; 2. It may precipitate a small avalanche, 3. A big avalanche may ensue, 4. Or a series of avalanches leading to the catastrophic collapse of the whole structure.
Anticipating or predicting which of these consequences will result, is a daunting and challenging task. One however could identify and measure the precursor states and the imminent occurrence of the critical state which precludes the avalanche, anticipate the possibility of a collapse and act in time to steer the system away from its occurrence. This could be attempted using information granules within a framework of Coupled Probability-Possibility Theory as described by Ragheb and Tsoukalas [4-7]. 3.2 COMPLEXITY THEORY, SELF ORGANIZED CRITICALITY, NON EQUILIBRIUM SYSTEMS
Complexity is chaos in critical states. A critical state exists in a system that is not in equilibrium. According to Niall Ferguson from Harvard University:
“To understand complexity, it is helpful to examine how natural scientists use the concept. Think of the spontaneous organization of termites, which allows them to construct complex hills and nests, or the fractal geometry of water molecules as they form intricate snowflakes. Human intelligence itself is a complex system, a product of the interaction of billions of neurons in the central nervous system. All these complex systems share certain characteristics. A small input to such a system can produce huge, often unanticipated changes -- what scientists call "the amplifier effect." Causal relationships are often nonlinear, which means that traditional methods of generalizing through observation are of little use. Thus, when things go wrong in a complex system, the scale of disruption is nearly impossible to anticipate.
There is no such thing as a typical or average forest fire, for example. To use the jargon of modern physics, a forest before a fire is in a state of "self-organized criticality": It is teetering on the verge of a breakdown, but the size of the breakdown is unknown. Will there be a small fire or a huge one? It is nearly impossible to predict. The key point is that in such systems, a relatively minor shock can cause a disproportionate disruption.”
In “Complexity and Collapse,” Niall Ferguson states:
“Great powers and empires are, I would suggest, complex systems,
made up of a very large number of interacting components that are asymmetrically organized, which means their construction more resembles a termite hill than an Egyptian pyramid. They operate somewhere between order and disorder – on “the edge of chaos,” in the phrase of the computer scientist Christopher Langton. Such systems can appear to operate quite stably for some time; they seem to be in equilibrium but are, in fact, constantly adapting. But there comes a moment when complex systems “go critical.” A very small trigger can set off a “phase transition” from a benign equilibrium to a crisis – a single grain of sand causes a whole pile to collapse, or a butterfly flaps its wings in the Amazon and brings about a hurricane in southeastern England.
“Not long after such crises happen, historians arrive on the scene. They are the scholars who specialize in the study of “fat tail” events – the low-frequency, high-impact moments that inhabit the tails of probability distributions, such as wars, revolutions, financial crashes, and imperial collapses. But historians often misunderstand complexity in decoding these events. They are trained to explain calamity in terms of long-term causes, often dating back decades. This is what Nassim Taleb rightly condemned in The Black Swan as “the narrative fallacy”: the construction of psychologically satisfying stories on the principle of post hoc, ergo propter hoc.”
Defeat in the mountains of the Hindu Kush or on the plains of Mesopotamia has long been a harbinger of imperial fall. It is no coincidence that the Soviet Union withdrew from Afghanistan in the annus mirabilis (wonderful year) of 1989. What happened 20 years ago, like the events of the distant fifth century, is a reminder that empires do not in fact appear, rise, reign, decline, and fall according to some recurrent and predictable life cycle. It is historians who retrospectively portray the process of imperial dissolution as slow-acting, with multiple over-determining causes. Rather, empires behave like all complex adaptive systems. They function in apparent equilibrium for some unknowable period. And then, quite abruptly, they collapse.”

Figure 2. Collapse sequence of stand at the Indianapolis State Fair as a result of a storm
wind gust, August 13, 2011 resulted in 5 casualties. A characteristic of complex adaptive systems is including the tendency to move from stability to instability quite suddenly. Complex adaptive systems function in apparent equilibrium for some unknowable period, and then, quite abruptly, collapse.
Mark Buchanan [2] examines interesting yet tentative ideas of Chaos, Complexity and Critical States in a thought provoking book: “Ubiquity, Why Catastrophes Happen.” He tries to explain the concept from theoretical physics designated as: “Self organized criticality” in multi components systems. He introduces the idea that the concept can be extended to human history, which he tries hard to support. However, the concept seems to apply to the occurrence of natural and man-made disasters, and is worthy of serious consideration within that context.
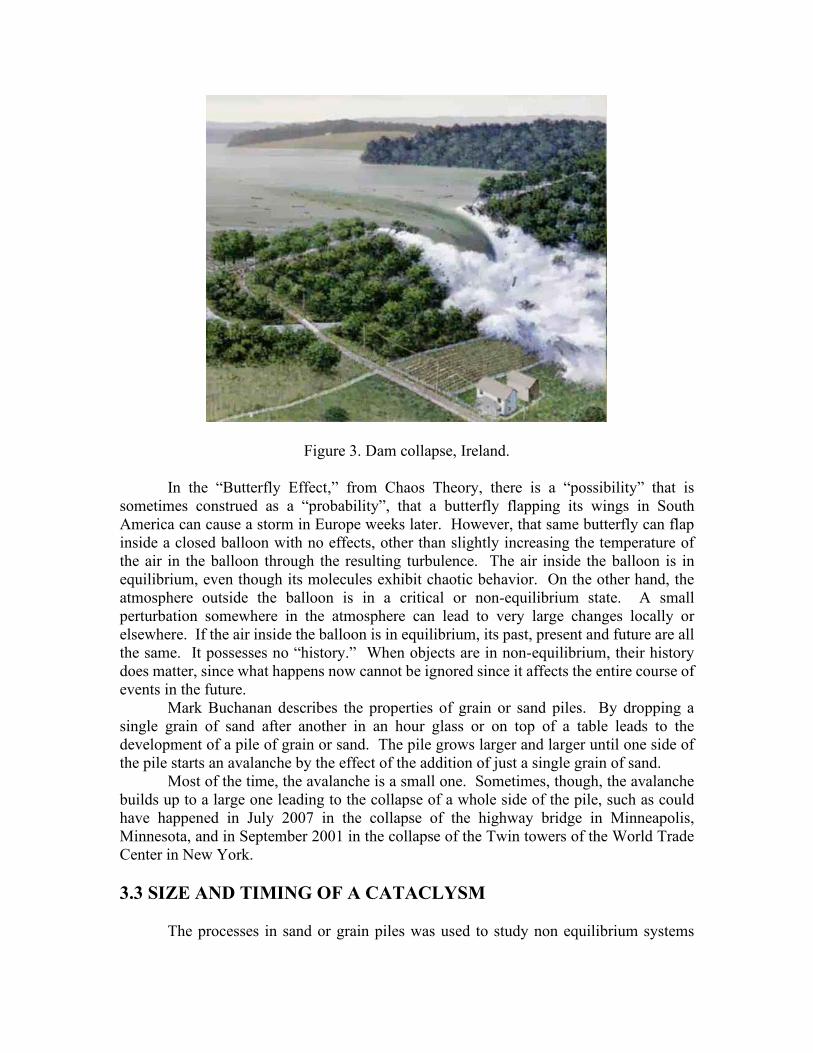
Figure 3. Dam collapse, Ireland.
In the “Butterfly Effect,” from Chaos Theory, there is a “possibility” that is sometimes construed as a “probability”, that a butterfly flapping its wings in South America can cause a storm in Europe weeks later. However, that same butterfly can flap inside a closed balloon with no effects, other than slightly increasing the temperature of the air in the balloon through the resulting turbulence. The air inside the balloon is in equilibrium, even though its molecules exhibit chaotic behavior. On the other hand, the atmosphere outside the balloon is in a critical or non-equilibrium state. A small perturbation somewhere in the atmosphere can lead to very large changes locally or elsewhere. If the air inside the balloon is in equilibrium, its past, present and future are all the same. It possesses no “history.” When objects are in non-equilibrium, their history does matter, since what happens now cannot be ignored since it affects the entire course of events in the future.
Mark Buchanan describes the properties of grain or sand piles. By dropping a single grain of sand after another in an hour glass or on top of a table leads to the development of a pile of grain or sand. The pile grows larger and larger until one side of the pile starts an avalanche by the effect of the addition of just a single grain of sand.
Most of the time, the avalanche is a small one. Sometimes, though, the avalanche builds up to a large one leading to the collapse of a whole side of the pile, such as could have happened in July 2007 in the collapse of the highway bridge in Minneapolis, Minnesota, and in September 2001 in the collapse of the Twin towers of the World Trade Center in New York. 3.3 SIZE AND TIMING OF A CATACLYSM
The processes in sand or grain piles was used to study non equilibrium systems

using computer simulations in 1987, by three scientists at the Brookhaven National Laboratory (BNL) at Upton on Long Island, New York. Per Bak, Chao Tang, and Kurt Wiesenfeld [1], showed that certain extended dissipative dynamical systems naturally evolve into a critical state, with no characteristic time or length scales. They also showed that the temporal ‘‘fingerprint’’ of the self-organized or self-slaved critical state is the presence of flicker noise where the power spectrum S(f) scales as:
1: ( ) , 1.0Power Spectrum S ff βα β− ≈
(1)
with ß close to unity. At low frequencies; its spatial signature is the emergence of a scale-invariant (fractal) structure. Flicker noise has been observed in the light from quasars, the intensity of sun-spots, the current through resistors, the sand flow in an hour glass, the flow of rivers such the Nile and the stock exchanges price indexes such as the Dow-Jones Industrials index. They argue that flicker noise is not in fact noise but a reflection of the intrinsic or ubiquitous of self-organizing critical systems.
Formally, they studied the behavior of spatially extended complex dynamical systems, common in physics, biology and the social sciences such as economics. These are systems with both temporal and spatial degrees of freedom. Related to these spatiotemporal evolving systems are: the temporal effect designated as flicker noise or 1/f noise, and the evolution of a spatial structure with scale invariant, self-similar or fractal properties. They discovered a general organizing principle governing a class of dissipative coupled systems: that such systems evolve naturally toward a critical state with no intrinsic time or length scale.
Self-organized states are states to which the systems evolve without specification of the initial conditions. The critical state is an attractor of the dynamics. The critical state is robust with respect to variations of the parameters and the presence of quenched randomness. The situation is similar to equilibrium statistical physics where the results are based on Ising and Heisenberg models.
Ising models are models of systems evolution that possess a memory of their previous states, in contrast to Markov Chain models that possess a memory of only their last state. The Ising models are discrete cellular automata which are simpler to study than those described with continuous differential equations.

Figure 4. Domain structures resulted from several local perturbations in a 100x100 simulation array, with each cluster triggered by a single perturbation. From Bak, Tang
and Wiesenfeld [1]. 3.4 SAND PILE SIMULATIONS
As an illustration of self-organized criticality in a transport system, a pile of sand experiment can be considered. The model of a sand pile is analogous to an array of coupled damped pendulums in a gravitational field coupled by torsion springs.
The pile can be started from scratch and built by randomly adding one grain of sand at a time. The pile grows and its slope also increases. The slope eventually breaches a critical value or an angle of repose at which if more sand is added, it will slide down.
If one starts from an already steep pile, it will collapse until it reaches the critical state at which it becomes barely stable with respect to further perturbations. The critical state becomes an attractor for the dynamics, and the quantity which exhibits the ubiquitous 1/f noise is the flow of the sand falling off the pile, as happens in an hour glass.
The model is a “cellular automaton” that evolves into a critical state as the pile is built up, with the characteristic size of the largest avalanches growing in magnitude. It is described by a nonlinear discrete diffusion equation, with the nonlinearity introduced by a threshold condition allowing the sand to tumble to a lower value. The model possesses closed and open boundary conditions. At the critical point the avalanches occur in all sizes, including the size of the whole pile, or a total collapse of the pile. This is analogous to the domain distribution of a magnetic system at a phase transition.
The stored energy is dissipated at all length scales, and once the critical state is reached, the system remains there. At the self-organized critical point, the system is characterized by a number of connecting scaling relations connected and the system obeys

some finite-size scaling rules much like equilibrium statistical systems at the critical point. With a large number of computer simulations, they found out that there is no typical
number of grains involved in an avalanche. Some avalanches involved a single grain; others tens, hundreds or thousands. Others involved a pile-wide cataclysm involving millions or grains that brought nearly the whole pile down.
As the size of the pile grows, its sides become steeper, until it reaches a critical state, at which point dropping just one more grain triggers an avalanche. Bak, Tang and Wiesenfeld [1] found that the size of these avalanches is distributed according to a power law. They coined the phrase “self-organized criticality” to describe the pile's natural growth to a critical state.
In addition there was no particular time at which the avalanches would occur. At any time anything might be just about likely to occur. The avalanches were completely chaotic in their unpredictability.
According to Mark Buchanan:
“To find out why (such unpredictability) should show up in their sand pile game, Bak and colleagues next played a trick with their computer. Imagine peering down on the pile from above, and coloring it in according to its steepness. Where it is relatively flat and stable, color it green; where steep and, in avalanche terms, 'ready to go,' color it red. What do you see? They found that at the outset the pile looked mostly green, but that, as the pile grew, the green became infiltrated with ever more red. With more grains, the scattering of red danger spots grew until a dense skeleton of instability ran through the pile. Here then was a clue to its peculiar behavior: a grain falling on a red spot can, by domino like action, cause sliding at other nearby red spots. If the red network was sparse, and all trouble spots were well isolated one from the other, then a single grain could have only limited repercussions. But when the red spots come to riddle the pile, the consequences of the next grain become fiendishly unpredictable. It might trigger only a few tumblings, or it might instead set off a cataclysmic chain reaction involving millions. The sand pile seemed to have configured itself into a hypersensitive and peculiarly unstable condition in which the next falling grain could trigger a response of any size whatsoever.”
A mountainous landscape is built from a long wave length tectonic plate motion.
Once the landscape reaches a critical state, it becomes self-similar and avalanches will occur on all time scales. The geological time scales building the mountains separate from the avalanche lifetimes.
The models with closed rather than open boundaries can be the basis of turbulence models where the energy is fed to the system in a long wave-length mode. Energy dissipation occurs at all length and time scales with the spatial correlations described by a generalized Kolmogorov exponent. This is different from the Navier-Stokes equation where the meta-stability is due to the storage of kinetic energy in the vortices and not in the potential energy in the sand piles.
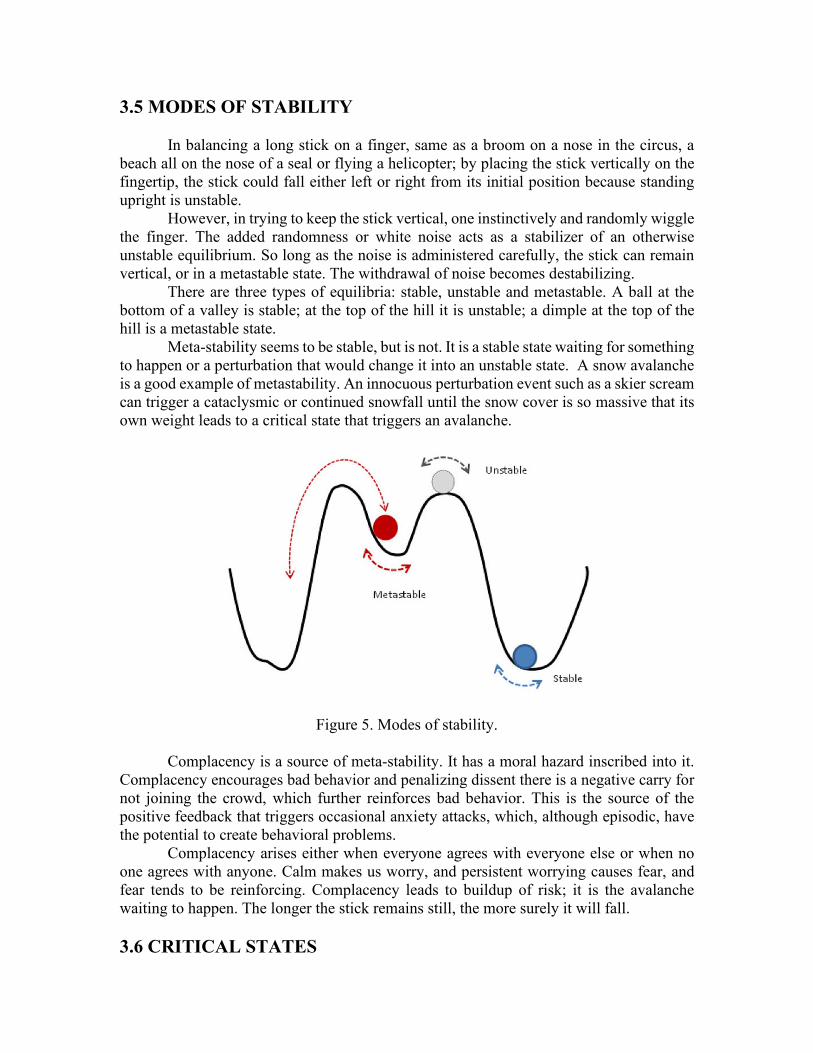
3.5 MODES OF STABILITY
In balancing a long stick on a finger, same as a broom on a nose in the circus, a beach all on the nose of a seal or flying a helicopter; by placing the stick vertically on the fingertip, the stick could fall either left or right from its initial position because standing upright is unstable.
However, in trying to keep the stick vertical, one instinctively and randomly wiggle the finger. The added randomness or white noise acts as a stabilizer of an otherwise unstable equilibrium. So long as the noise is administered carefully, the stick can remain vertical, or in a metastable state. The withdrawal of noise becomes destabilizing.
There are three types of equilibria: stable, unstable and metastable. A ball at the bottom of a valley is stable; at the top of the hill it is unstable; a dimple at the top of the hill is a metastable state.
Meta-stability seems to be stable, but is not. It is a stable state waiting for something to happen or a perturbation that would change it into an unstable state. A snow avalanche is a good example of metastability. An innocuous perturbation event such as a skier scream can trigger a cataclysmic or continued snowfall until the snow cover is so massive that its own weight leads to a critical state that triggers an avalanche.
Figure 5. Modes of stability.
Complacency is a source of meta-stability. It has a moral hazard inscribed into it. Complacency encourages bad behavior and penalizing dissent there is a negative carry for not joining the crowd, which further reinforces bad behavior. This is the source of the positive feedback that triggers occasional anxiety attacks, which, although episodic, have the potential to create behavioral problems.
Complacency arises either when everyone agrees with everyone else or when no one agrees with anyone. Calm makes us worry, and persistent worrying causes fear, and fear tends to be reinforcing. Complacency leads to buildup of risk; it is the avalanche waiting to happen. The longer the stick remains still, the more surely it will fall. 3.6 CRITICAL STATES
The described situation is referred to as a “critical state.” The term critical state
can mean the point at which water would be converted to ice or steam, or the moment that a critical mass induces a nuclear chain reaction, or an accident would occur at the Tacoma Narrows Bridge, the Bhopal chemical plant, the Three Mile Island power plant, the Chernobyl nuclear reactor or the Fukushima earthquake and tsunami event.
It is the point at which some initiating event triggers a change in the basic nature or character of the object or group of objects. Thus an object is considered to be in a critical state, or reached a critical mass, when it has reached a state where there exists the possibility of significant change.
Mark Buchanan comments about the critical state:
“But to physicists, (the critical state) has always been seen as a kind of theoretical freak and sideshow, a devilishly unstable and unusual condition that arises only under the most exceptional circumstances (in highly controlled experiments). In the sand pile game, however, a critical state seemed to arise naturally through the mindless sprinkling of grains.”
Critical states are phenomena that are common in nature causing both natural and
man-made disasters. In the Earth's crust they trigger earthquakes. They can cause large scale changes in ecosystems causing mass extinctions or climate change. In economic systems they could cause bubble bursts, stock market crashes and economic recessions and depressions. In social systems they could explain why the world at large is susceptible to unpredictable social upheavals, revolutions and wars.
Mark Buchanan concludes:
“There are many subtleties and twists in the story ... but the basic message, roughly speaking, is simple: The peculiar and exceptionally unstable organization of the critical state does indeed seem to be ubiquitous in our world. Researchers in the past few years have found its mathematical fingerprints in the workings of all the upheavals I have mentioned so far (earthquakes, eco-disasters, market crashes), as well as in the spreading of epidemics, the flaring of traffic jams, the patterns by which instructions trickle down from managers to workers in the office, and in many other things. At the heart of our story, then, lies the discovery that networks of things of all kinds - atoms, molecules, species, people, and even ideas - have a marked tendency to organize themselves along similar lines. On the basis of this insight, scientists are finally beginning to fathom what lies behind tumultuous events of all sorts, and to see patterns at work where they have never seen them before.”

Figure 6. A just-critical system of mouse traps loaded with Ping Pong balls can turn supercritical with a single input perturbation. Source: Walt Disney.

Figure 7. Domino effect: seeing the forest or the tree. The seven-domino alone appears
stable in an overall system in a critical state on the verge of collapse. 3.7 POWER LAWS AND INITIATING EVENTS
Scientists who study diverse phenomena as earthquakes, stock market crashes and forest fires have noticed that their distributions follow a power law. This means, for instance, that there occur lots of small earthquakes, but a few big ones. If we consider earthquakes of a particular magnitude, there are 4 times as many with 1/2 that magnitude, and a 1/4 as many with twice the magnitude. Earthquakes that are n times as large as smaller ones are also rarer by a factor of 1/n
2, as was shown by the seismologists Beno
Gutenberg and Charles Richter, originator of the Richter scale in the 1950s. The exponent varies from one phenomenon to another, but in all cases the power
law means that the events have no typical size, and it suggests that all events, large and small, have the same cause. This kind of scaling appears in natural systems that are poised on the edge of change or in a critical state, and such critical states seem to arise naturally in many complex systems.
The distribution function D(s) of slide sizes s in two dimensions was found to follow on a log-log plot a straight line:
1( ) , 1.0, 2D s for Dsα
α≈ ≈ = (2)
The distribution function D(s) of slide sizes s in three dimensions was found to
follow a power law:
1( ) , 1.37, 3D s for Dsα
α≈ ≈ = (3)
A local perturbation in the pile will spread to a nearest neighbor site then to the next
nearest neighbor in a domino effect. Eventually, it will die off after a total time τ after inducing a number of s slidings.
The distribution of lifetimes D(τ) weighed by the average response s/τ also displays a power function:
1( ) , 0.43, 2,
0.92, 3
D for D
for D
ατ ατ
α
≈ ≈ =
≈ = (4)
The sliding can be considered as a point of energy dissipation. The power-law
distribution leads to the 1/f spectrum:

1( ) , 1.57, 2,
1.08, 3
S f for Df
for D
α α
α
≈ ≈ =
≈ = (5)
The 1/f noise is the temporal signature of the self-similar properties of the critical
state. The detection of the 1/f noise, one can also detect the presence of the self-organized critical state.
Earthquakes become 4 times less likely when their energy release E is doubled, following the probability density function (pdf):
002( ) ,EP E dE dE E E
E= ≥ (6)
Mathematically this is referred to as a “power law” or a mathematical pattern that
stands out in contrast to the overall complexity of the earthquake process. Another experimental study determined the power law distribution for the sizes of
the shards produced when a frozen potato is shattered. The study was carried out by three Danish physicists in 1993. They counted the shards ranging in size from one hundred grams down to one thousandth of a gram and found that doubling the size of a shard makes it six times as rare.
A second observation is that the power-law distributions seem to be a general consequence of simulation models of these systems, in which the “microscopic” constituents or agents such as grains of sand, rocks, trees and investors interact through a simple set of rules. The system organizes itself naturally into a “critical state” in which a single small occurrence such as a microscopic slippage at a point along a fault, a single tree catching fire after a lightning strike or a single investor deciding to sell his stocks, can trigger events of all possible sizes.
The size of the cataclysm, once it occurs, does not depend on the severity of the triggering event:
“In this simplified setting of the sand pile, the power law also points to something else: the surprising conclusion that even the greatest of events have no special or exceptional causes. After all, every avalanche large or small starts out the same way, when a single grain falls and makes the pile just slightly too steep at one point. What makes one avalanche much larger than another has nothing to do with its original cause, and nothing to do with some special situation in the pile just before it starts. Rather, it has to do with the perpetually unstable organization of the critical state, which makes it always possible for the next grain to trigger an avalanche of any size.”
If fault systems in the Earth's crust are in a critical state, and if the magnitude and
timing of slippages along the faults follow a power law, then predicting when earthquakes will occur, and how destructive they will be, should prove virtually impossible. The historical records of the timing and magnitudes of earthquakes do seem to follow a power law.

A third observation is that the size of an event depends critically on the history of the system. The critical state is dominated by “frozen accidents” of history, which determine whether an event becomes large or small. 3.8 FINGERS OF INSTABILITY
In the avalanche formation process:
“After the pile evolves into a critical state, many grains rest just on the verge of tumbling, and these grains link up into 'fingers of instability' of all possible lengths. While many are short, others slice through the pile from one end to the other. So the chain reaction triggered by a single grain might lead to an avalanche of any size whatsoever, depending on whether that grain fell on a short, intermediate or long finger of instability.”
Nobel Prize laureate Hyman Minsky suggests that stability paradoxically leads to
instability. The more comfortable we get with a given condition or trend in economics, the longer it will persist; and then when the trend fails, the more dramatic is the correction.
The problem with long term macroeconomic stability is that it tends to produce unstable financial arrangements. If we believe that tomorrow and next year will be the same as last week and last year, we are more willing to add debt or postpone savings for current consumption. Hyman Minsky argues that the longer the period of stability, the higher the potential risk for even greater instability when market participants must change their behavior.
In analogy to the sand pile problem, the longer that a critical state builds up in an economy, or in other words, the more “fingers of instability” that are allowed to develop a connection to other fingers of instability, the greater the potential for a serious “avalanche.”
Engineers must remember that he more complacent we are about the safe operation of an engineering system, the more fingers of instability are allowed to build up and the more serious the accident will be when it is initiated by a minor initiating event. 3.9 NASH EQUILIBRIUM AND McCULLEY’S DISEQUILIBRIUM
A related concept comes from Game Theory as the Nash equilibrium named after John Nash. It is an optimal strategy for games involving two or more players, whereby the players reach an outcome to their mutual advantage. If there exists a set of strategies for a game with the property that no player can benefit by changing his strategy while (if) the other players keep their strategies unchanged, then that set of strategies and the corresponding payoffs constitute a Nash Equilibrium.
In the sand pile problem we end up with a critical state called by Paul McCulley as a “stable disequilibrium.” Each player works hard to maximize his own personal outcome and to reduce his exposure to the “fingers of instability.”
The longer the game is played as asserted by Hyman Minsky, the more likely and violent an “avalanche” will be. The more the fingers of instability can build, the more the state of stable disequilibrium can go critical.

3.10 BLACK SWAN CONCEPT, EXTREME EVENTS The term “rogue waves,” has been used by surfers and mariners, is now used to refer to deadly forces that “come out of nowhere.” Just because the available data says that there are only white swans does not prove that black swans cannot possibly exist. All we can confidently assert is that no one has seen one up till that moment in time. To prove that a black swan does not exist would take an infinite number of measurements or observations, and yet only one observation is sufficient to prove that it exists.
Figure 8. Black swans do occur.
Philosophers in Europe debated the black swan issue and showed that by mathematical induction you could reason they did not exist. This remained the case until the European explorers discovered the then unsuspected existence of black swans when they first moved to Australia..
The term “black swan” has come to mean an event or discovery whose existence was not predictable from the available data, and whose effect yields surprising and unexpected results.
Nassim Nicholas Taleb, in his 2007 book, “The Black Swan – The Impact of the Highly Improbable,” suggests that: “The gap between what you know and what you think you know is always dangerously wide.” European settlers discovered the then unsuspected existence of black swans when they first moved to Australia. It is a continuation of a dialogue he started in a 2001 book: “Fooled by Randomness.” He discusses the inability to predict unusual events as: “The inability to predict outliers implies the inability to predict the course of history, given the share of these events in the dynamics of events.” A Black Swan is defined as an event that has the three required attributes of: 1. It is an outlier, as it lies outside the realm of regular expectations, because nothing in the past can convincingly point to its possibility, 2. It carries an extreme impact, 3. In spite of its outlier status, human nature makes us concoct explanations for its occurrence after the fact. He sums up that “the triplet” is, at the core of “rarity, extreme impact, and retrospective, though not prospective, predictability.” A reciprocity principle here applies. Black Swans arise because some event occurs, usually something bad. The opposite is also true, in that: “The highly expected not happening is also a Black Swan.” This shows that, by symmetry, the nonoccurrence of a

highly probable event is the adjoint of the occurrence of a highly improbable event. Nassim Taleb argues that:
“But we act as though we are able to predict historical events, or,
even worse, as if we are able to change the course of history. We produce thirty-year projections of social security deficits and oil prices without realizing that we cannot even predict these for next summer - our cumulative prediction errors for political and economic events are so monstrous that every time I look at the empirical record I have to pinch myself to verify that I am not dreaming. What is surprising is not the magnitude of our forecasts errors, but our absence of awareness of it. This is all the more worrisome when we engage in deadly conflicts: wars are fundamentally unpredictable (and we do not know it). Owing to this misunderstanding of the casual chains between policy and actions, we can easily trigger Black Swans thanks to aggressive ignorance-like a child playing with a chemistry kit.”
Nassim Nicholas Taleb criticizes the social sciences, in particular economics,
which uses standard Normal Gaussian bell curves to “prove” their points. Everything has to fit within the Normal Distribution. There is little room in the ideal world of the Normal Distribution for events that are far from its own center.
He creates a fictitious virtual world that he calls Mediocristan. This is the world of white swans, bell curves and predictability. He contrasts it with another virtual world that he calls Extremistan. This is now the world of chaos, fractal geometry, power laws, black swans and where the unpredictable does indeed happens.
He argues that there are parts of our lives which inhabit Mediocristan and parts which dwell in Extremistan. Not knowing the difference can be problematic, if not fatal. And it is difficult to know where one country starts and the other ends. If you are in Mediocristan, then you can use your bell curve assumptions without fear. But if you happen to drift into the murky border areas, you are no longer safe in your assumptions. The longer and deeper you go into Extremistan without a problem, thinking you are safe in Mediocristan, the larger the disruption is likely to be.
He summarizes his thesis as:
“To summarize: in this (personal) essay, I stick my neck out and make a claim, against many of our habits of thought, that our world is dominated by the extreme, the unknown, and the very improbable (improbable according to our current knowledge) - and all the while we spend our time engaged in small talk, focusing on the known, and the repeated. This implies the need to use the extreme event as a starting point and not treat it as an exception to be pushed under the rug. I also make the bolder (and more annoying) claim that in spite of our progress and growth, the future will be increasingly less predictable, while both human nature and social ‘science’ seem to conspire to hide the idea from us.”
He expands:
“When I ask people to name three recently implemented
technologies that most impact our world today, they usually propose the computer, the Internet, and the laser. All three were unplanned, unpredicted, and unappreciated upon their discovery, and remained unappreciated well after their initial use. They were consequential. They were Black Swans. Of course, we have this retrospective illusion of their partaking in some master plan. You can create your own lists with similar results, whether you use political events, wars, or intellectual epidemics.”
“You would expect our record of prediction to be horrible: the world is far, far more complicated than we think; which is not a problem, except when most of us don't know it. We tend to ‘tunnel’ while looking into the future, making it business as usual, Black Swan-free, when in fact there is nothing usual about the future. It is not a Platonic category!”
He warns: “Beware of precise plans by governments,” and specifically: “For instance, regulators in the banking business are prone to a severe expert problem, and then tend to condone reckless but (hidden) risk taking.”
By definition, we cannot know the future, yet we go through the exercise. Even though we should know that we will probably be wrong, there is a value on the process if done with the proper amount of cautious optimism tempered by reality. GRAY SWANS A gray swan is an event that is not very likely, that is difficult to predict, but is nonetheless possible to predict and expect. One example of a gray swan would be a nuclear war. It is possible, but not likely. Another event could be a major currency war. 3.11 ROGUE WAVES A scientific measurement in the North Sea off Norway on New Year’s Day, 1995 aboard the oil-drilling Draupner platform convinced scientists that rogue waves do occur in nature. Measured from the trough to the crest, the Draupner Wave was 25 meters or 82 feet tall. The measuring device, an on-board laser, survived the event to tell the tale as it was secured to the gas pipeline platform anchored to the sea bottom and suspended above the rogue wave.
As an aberration, the Draupner Wave was a single wave that is twice the average height of the largest waves and three to four times the average height of the smallest ones. The impact force of a wave is an exponential function of its height, assuming the same velocity of comparable waves. The destructive capacity of a rogue wave is proportional to its volume and kinetic energy expressed as its speed.
No modern ship is designed to survive a direct hit from a wave of this magnitude. The current design standard for ships is waves that are 49 ft or 15 meters in height, while the Draupner Wave was nearly 82 ft tall or 25 meters. This could be the reason, in addition to severe storms and hurricanes, for the rarity of surviving eye witnesses to tell about their encounters with these rare events, and an explanation for the floors of the sea and oceans
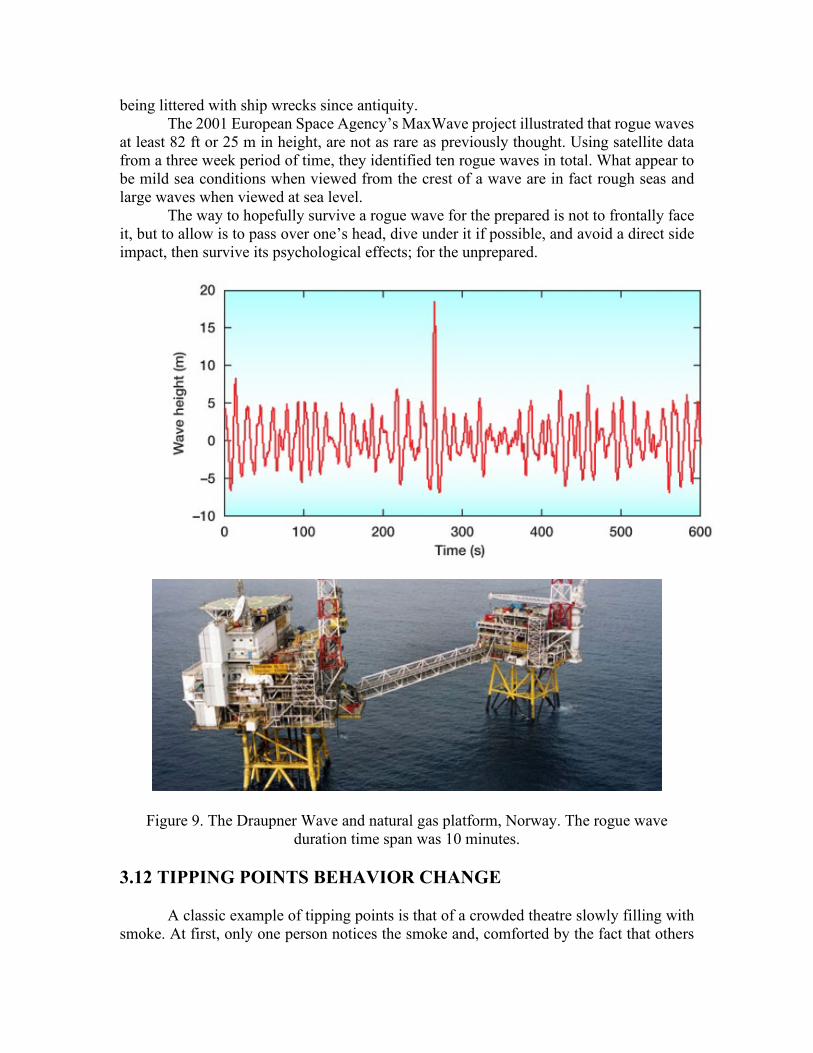
being littered with ship wrecks since antiquity. The 2001 European Space Agency’s MaxWave project illustrated that rogue waves
at least 82 ft or 25 m in height, are not as rare as previously thought. Using satellite data from a three week period of time, they identified ten rogue waves in total. What appear to be mild sea conditions when viewed from the crest of a wave are in fact rough seas and large waves when viewed at sea level.
The way to hopefully survive a rogue wave for the prepared is not to frontally face it, but to allow is to pass over one’s head, dive under it if possible, and avoid a direct side impact, then survive its psychological effects; for the unprepared.
Figure 9. The Draupner Wave and natural gas platform, Norway. The rogue wave duration time span was 10 minutes.
3.12 TIPPING POINTS BEHAVIOR CHANGE A classic example of tipping points is that of a crowded theatre slowly filling with smoke. At first, only one person notices the smoke and, comforted by the fact that others

remain calm, remains seated. Then a handful of other spectators notice the presence of the smoke and become apprehensive. At some point, the members of the audience stop watching the show and instead start watching each other.
As the growing concern across the theatre becomes evident, someone finally makes off for the exit. This triggers a stampede and a rush for the exit by others. Many of those rushing out might not have noticed any smoke, they just panic and follow the rush to the exits. A critical point is reached “not because more people notice the smoke; rather, more notice changes in others’ behavior and thus change their own.” 3.13 BASTIAT’S SEEN AND UNSEEN LIONS IN THE GRASS
Frédéric Bastiat was a French classical liberal theorist, political economist, and member of the French Assemblée Nationale (National Assembly). He developed the economic concept of “Opportunity Cost.” He had a strong influence on economists Ludwig von Mises, Murray Rothbard, and Henry Hazlitt. Bastiat was a proponent of limited government and free trade, but he advocated that subsidies should be provided by governments for those in need: “For urgent cases, the state should set aside some resources to assist certain unfortunate people, to help them adjust to changing conditions.”
In an 1850 essay, Frédéric Bastiat: “That Which Is Seen and That Which Is Unseen” remarks:
“In the economic sphere an act, a habit, an institution, a law produces not only one effect, but a series of effects. Of these effects, the first alone is immediate; it appears simultaneously with its cause; it is seen. The other effects emerge only subsequently; they are not seen; we are fortunate if we foresee them.
“There is only one difference between a bad economist and a good one: the bad economist confines himself to the visible effect; the good economist takes into account both the effect that can be seen and those effects that must be foreseen.
“Yet this difference is tremendous; for it almost always happens that when the immediate consequence is favorable, the later consequences are disastrous, and vice versa. Whence it follows that the bad economist pursues a small present good that will be followed by a great evil to come, while the good economist pursues a great good to come, at the risk of a small present evil.”
Rob Arnott of Research Affiliates and the creator of Fundamental Indexes. Took the photos in Fig. 10 of lions in the grass of the savannah in Tanzania, Africa. According to economist John Mauldin:
“I should note that a lion in the grass is different from a black swan. A black swan is a random event, something which takes us all by surprise. Economic black swans are actually quite rare – 9/11 was a true black swan. Other than Nostradamus some 500 years ago, who saw it coming?”
“It is natural to focus on the apparent dangers in front of us. That is

part of our evolutionary heritage from the time when humans were first dodging lions and chasing antelopes on the very African savannah in Rob’s picture. But we soon learned that, if we were to survive, it was not enough to dodge the lions we could see. It is the hidden lions that may spring upon us suddenly and take an arm or a leg.”
“I showed this to a friend of mine who is a hunter, and he found it almost immediately. But then he has taught himself over the years to look for hidden game. And as Bastiat noted, it is the skilled economist who looks for the effects that are hidden, the surprises that are unseen. It should be a habit to look at the potential second- and third-order consequences of what we can see happening before our eyes. That way, we not only avoid the hidden lions, we also turn what would hurt us and do us harm into the hunted. Sometimes, the dangers themselves can be turned into a very nice trophy indeed – if you can act in time.”
Figure 10. Lions in the grass concept is deterministic in nature and is different than Black Swans which are probabilistic events. Photo: Robb Arnott.

3.14 PARADIGM SHIFTS In science and philosophy, a paradigm is a distinct set of concepts or thought patterns, including theories, research methods, postulates, and standards for what constitutes legitimate contributions to a field. There exists a good deal of evidence that we shall see more unpredictability in the future than we have witnessed in the last century. Ray Kurzweil in his 2000 book: “The Singularity is Near,” wrote about the accelerating pace of change that technology encompasses. He writes:
“The first technological steps - sharp edges, fire, the wheel - took tens of thousands of years. For people living in this era, there was little noticeable technological change in even a thousand years. By 1000 A.D., progress was much faster and a paradigm shift required only a century or two. In the nineteenth century, we saw more technological change than in the nine centuries preceding it. Then in the first twenty years of the twentieth century, we saw more advancement than in all of the nineteenth century. Now, paradigm shifts occur in only a few years-time. The World Wide Web did not exist in anything like its present form just a few years ago; it didn't exist at all a decade ago.”
“The paradigm shift rate (i.e., the overall rate of technical progress) is currently doubling (approximately) every decade; that is, paradigm shift times are halving every decade (and the rate of acceleration is itself growing exponentially). So, the technological progress in the twenty-first century will be equivalent to what would require (in the linear view) on the order of 200 centuries. In contrast, the twentieth century saw only about 25 years of progress (again at today's rate of progress) since we have been speeding up to current rates. So the twenty-first century will see almost a thousand times greater technological change than its predecessor.”
Ray Kurzweil is saying that most people project future growth in technology at
today's rate of change. But the rate of change is accelerating, so that more and more change is packed into smaller and smaller amounts of time. While the vast majority of the thousand times greater technological change Ray Kurzweil is talking about happens in the last part of this century, some of it happens in the next twenty years. At current levels, that means the 20th century was equivalent to about 20 years of progress at today's rate of change. That pace will continue to increase the amount of innovation we pack into just a few years.
From his book Fantastic Voyage: “And we'll make another 20 years of progress at today's rate [of growth], equivalent to that of the entire 20th century, in the next fourteen years. And then we'll do it again in just seven years”
That suggests that in the next 21 years we will see double the technological change that we saw in the entire 20th century. At that pace, we will see almost four times the rate of change within 25 years. The only safe bet is that the future will be radically different in ways that we cannot imagine.

3.15 RISK MANAGEMENT
In theory, the occurrence of accidents should look like a smooth bell curve or a Gaussian or a Normal distribution, with the ends tapering off to zero. According to this theoretical distribution, the events that deviate from the mean by 5 or more standard deviations or 5-sigma events are extremely rare, with 10 or more sigma being practically impossible.
However, under some applications, such events appear to be more common than expected; 15 or more sigma events have happened in the world of investments. Examples of such unlikely events would be any of a dozen bubbles such as the Tulip, dot.com and the sub-prime mortgages, and, one could venture saying, the social networks manias. The real world commonality of these high sigma events is much greater than in theory, suggesting that the distribution is “fatter” at the extremes or tails than a truly normal one.
This implies that the build-up of the critical states or those fingers of instability is perpetuated even as, and precisely because, we hedge risks. We try to “stabilize” the risks we see, shoring them up with “derivatives,” “safety procedures,” emergency plans, insurance, and all manner of risk management procedures. By doing so, the system can absorb more blows and the risks and the effects are distributed throughout the system.
As we reduce the known risks we see, we lay the seeds for the next 10 sigma event. It is the improbable risks or the possible risks that we do not yet envision which will create the next real crisis. It is not that the fingers of instability have been removed from the pile of sand. It is that they are to occur in different places and are not yet at the observable stage. 3.16 THE MINSKY MOMENT, COMPLACENCY
Figure 11. Chance encounter on a trail between a hiker and a Grizzly bear.

Figure 12. Surfers riding waves with a shark beneath them in the water. Byron Bay, New South Wales, Australia, November 3rd, 2016. Source: Video grab, Accuweather.
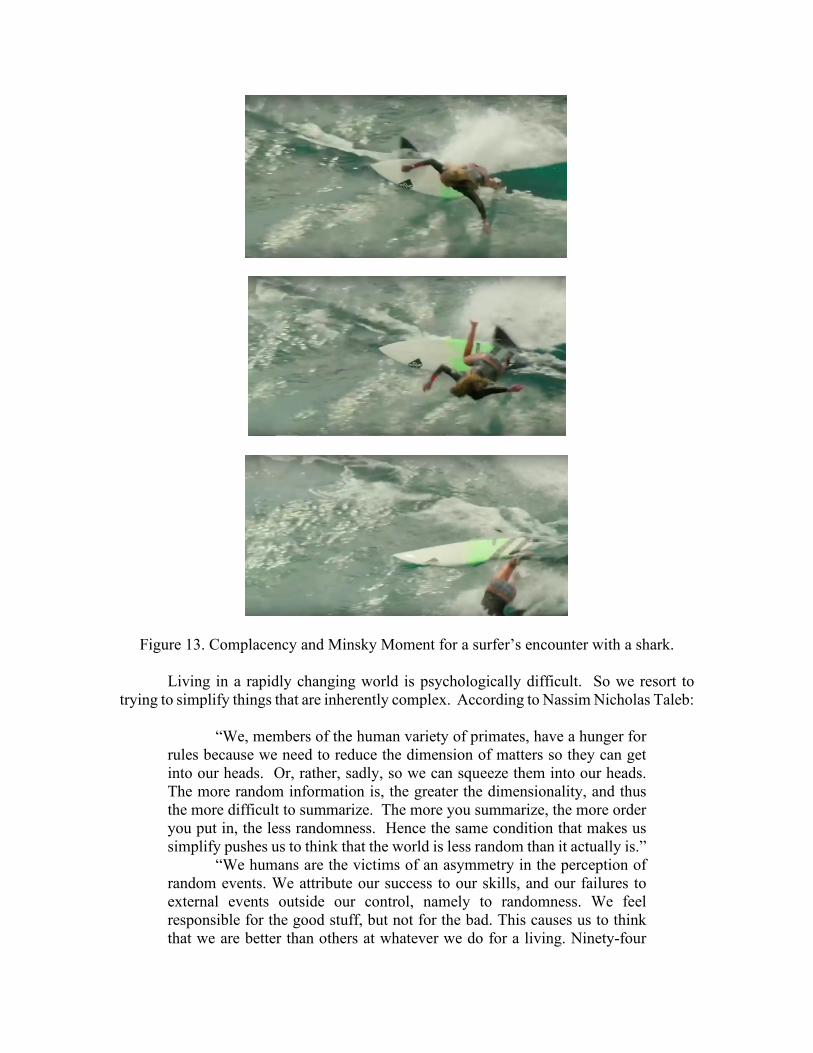
Figure 13. Complacency and Minsky Moment for a surfer’s encounter with a shark. Living in a rapidly changing world is psychologically difficult. So we resort to trying to simplify things that are inherently complex. According to Nassim Nicholas Taleb:
“We, members of the human variety of primates, have a hunger for rules because we need to reduce the dimension of matters so they can get into our heads. Or, rather, sadly, so we can squeeze them into our heads. The more random information is, the greater the dimensionality, and thus the more difficult to summarize. The more you summarize, the more order you put in, the less randomness. Hence the same condition that makes us simplify pushes us to think that the world is less random than it actually is.”
“We humans are the victims of an asymmetry in the perception of random events. We attribute our success to our skills, and our failures to external events outside our control, namely to randomness. We feel responsible for the good stuff, but not for the bad. This causes us to think that we are better than others at whatever we do for a living. Ninety-four
percent of Swedes believe that their driving skills put them in the top 50 percent of Swedish drivers; 84 percent of Frenchmen feel that their lovemaking abilities put them in the top half of French lovers.”
That tendency lulls us into complacency. That in turn eventually results in a
“Minsky Moment.” Hyman Minsky suggested that stability produces instability, and that the longer things are stable, the greater the instability that will result, precisely because we are unprepared for it. 3.17 FLOCK, HERD, COPYCAT VERSUS PACK BEHAVIOR Flocks of sheep or birds, herds of cattle, schools of fish, and crowds or mobs of humans are never out of sight of each other, and their decision-making is entirely driven by what they see happening to others, not to themselves.
A flock is a social structure designed to promote neighbors and similar individuals’ awareness. It has no goals, no coordinating purpose other than communication. A flock simply exists for the sake of the survival of the flock. It is a crowd responding to the crowd.
Jukeboxes made a comeback when its user interface started showing the customers what melodies other people had chosen to play in the past. The “Jukebox Effect” now refers to the marketing of products by the intentional effort to force customers into engaging in flock behavior in purchasing products that their “friends” or even complete strangers have also purchased.
A pack, on the other hand, is a social structure designed to harness self-aware individuals in service to some goal requiring joint action such the raising of cubs, the hunting of meat, the schooling of children and the operation of complex engineering, political or economic structures. Both the flock and the pack are extremely effective social structures, but they operate under entirely different logics.
Disequilibrium occurs, and hence accidents, when engineering structures are operated by what are thought as packs of individuals like lions or wolves, living by the logic of the pack, when in fact they act like sheep or cattle, interacting according to the logic of the flock. 3.18 DISCUSSION
The mathematical models describing how to avoid catastrophes do not really exist yet in the mathematical realm. We just have empirical observations and simulation games. The empirical data suggests that these phenomena follow a power curve with roughly the same shape.
Earth scientists believe that critical state theorists are overreaching when they try to liken the behavior of something as complicated as the Earth's crust to a pile of sand. When the technique is employed to explain forest fires, stock market fluctuations, mass extinctions and upheavals in human history, many feel an overreach. Historians, economists and historical scientists seem willing to look in bewilderment as the mathematicians fly past.
If the models of interacting constituents lead generally to power laws means that a successful model might not teach one much about the actual interactions in a system. Mark

Buchanan gives up to early by suggesting that since the events of all sizes have the same cause in a critical state; it is hopeless to think about predicting large events. To understand the actual microscopic interactions could be more important than the overall macroscopic behavior. Along this line of reasoning any size hurricane, even weaker than Katrina would have devastated the city of New Orleans in the summer of 2005, as long as the critical state was existing and the associated fingers of instability were in place.
If one understood the actual system and its interactions with other systems, one might be able to identify observable signatures of the critical organization that precedes a large event, either in the system itself or in systems with which it interacts. Developing an Anticipatory System rather than a reactive system, we would be able construct a control system that would steer the system away from its anticipated undesirable state to a desirable state as suggested by Ragheb and Tsoukalas [4-7].
For example, measuring the density of trees or underbrush in a forest area would allow us to anticipate the possible occurrence of a catastrophic fire, or in the tensions between nations and the attitudes of their citizens prior to a major war. Controlled burns or brush removal could then be implemented to avoid the anticipated catastrophic fire, or negotiations and accommodations could avoid anticipated future upheavals or wars.
Considering a glimmer of the positive, Nassim Nicholas Taleb states:
“We are gliding into disorder, but not necessarily bad disorder. This implies that we will see more periods of calm and stability, with most problems concentrated into a small number of Black Swans.”
One can surmise that the risks of possible events must be managed using the tools
of possibility theory in addition to the use of the tools of probability theory for the observable events.
The objective of risk assessment and management could then be defined as “the identification and isolation of the fingers of instability and managing them, so as when an initiating event of any size occurs, they are not allowed to place the system into a critical unstable stage.”
Anticipating specific undesirable consequences could be daunting task, yet it is possible. One could hopefully construct the monitoring and control systems which could anticipate the precursor states and the imminent occurrence of the critical state which precludes a catastrophe, recognize the possibility of a collapse, and act in time to steer the system away from its occurrence. APPENDIX SELF ORGANIZED CRITICALITY EXPERIMENT
A home experiment is proposed to the reader by Per Bak, Chao Tang and Kurt Wiesenfeld [1], to test the concepts of self-organized critical equilibrium. One uses a shoe box and a cup or two of sand, sugar, salt or wheat kernels.
The interested experimenter would wet the sand with a small amount of water, then gather it into the steepest slope in one corner of the shoe box. The threshold slope or angle of repose is larger for wet sand than it is for dry sand. As the water is allowed to evaporate,
one would observe a sequence of slides, some very small, and some quite large occurring at random positions in the pile.
The evaporation process can be accelerated by placing the shoe box on a warm surface or in direct sunlight, … preferably at the beach. Dropping individual or collections of grains of sand or kernels of wheat can also precipitate local avalanches. REFERENCES 1. Per Bak, Chao Tang and Kurt Wiesenfeld, “Self-organized Criticality,” Phys. Rev. A 38, 364-374, 1988. 2. Mark Buchanan, “Ubiquity: Why Catastrophes Happen,” Crown, Random House, Inc., 2001. 3. Didier Sornette, “Complexity, Catastrophe and Physics,” Physics World, p.57, December 1999. 4. M. Ragheb and L. Tsoukalas, “Monitoring Performance of Devices Using a Coupled Probability-Possibility Method,” International Journal of Expert Systems, Research and Applications, 1988. 5. M. Ragheb, L. Tsoukalas, T. McDonough and M. Parker, “A Production-Rule Analysis System for Nuclear Plant Monitoring and Emergency Response Applications,” in: “Artificial Intelligence and other Innovative Computer Applications in the Nuclear Industry,” M. C. Majumdar, D. Majumdar and J. I. Sackett, Eds., Plenum Press, New York, pp. 231-238, 1988. 6. M. Ragheb and L. Tsoukalas, “A Coupled Probability-Possibility Method for Decision-Making in Knowledge-Based Systems,” Knowledge-Based Expert Systems for Manufacturing, S. C-Y. Lu, R. Commanduri, Eds., ASME, New York, 1986. 7. L. Tsoukalas and M. Ragheb, “Performance Monitoring and Diagnosis in a Process Environment Using a Probability-Possibility Approach,” in: “Manufacturing International '88: Symposium on Manufacturing Systems - Design, Integration, and Control,” G. Chryssolouris, B. Von Turkovich, and P, Francis, Eds., American Society of Mechanical Engineers, 1988. EXERCISES 1. Prove that the power law for the energy release in an earthquake:
002( ) ,EP E dE dE E E
E= ≥ ,
is a probability density function. 2. Deduce the power law describing the size of shards produced from a shattered frozen potato: doubling the size of a shard makes it six times as rare. 3. Carry out the shoe box experiment suggested by Per Bak, Chao Tang and Kurt Wiesenfeld, to test the concepts of self-organized critical equilibrium. Describe your observations.