Embed Size (px)
Citation preview

1
CHAPTER 3 – INTERDEPENDENCE BETWEEN MAJOR SECTORS, MARKETS AND FLOWS IN THE MIXED ECONOMY
STUDY UNIT 1 Production, Income and Spending *Identify the three major flows in the economy Production – occurs and generates income Income - earned Spending – Buy available goods and services *Distinguish between a flow and a stock (Box 3-1 Stocks and Flows)
STOCKS FLOWS
Measured at a particular point in time
NO time dimension
Has a Time dimension – only measured over a period
Water level of dam measured at a particular point in time (at 00:00 on May 1 2007 capacity was 72,64%)
Flow of water into the dam measured over a period (1 May 2007 inflow was measured as 250 cubic metres per second
Stock Takes Calculation of sales, profit or loss
Still pictures Moving pictures
Examples
Wealth
Assets
Liabilities
Capital
Population
Balance in savings account
Unemployment
Gold reserves held by SA Res bank
Examples
Income
Profit
Loss
Investment
Number of births and deaths
Saving
Demand for labour
Gold sales, gold production
Stocks and flows are related
Stocks can only change as a result of flows
Prices are ratios between different flows
Ratios between a stock and flow and visa versa have a time dimension
Ratios between two stocks and two flows have no time dimension “Identify the two basic sets of markets in the economy Goods Markets – Markets for goods and services Factor Markets – Markets for factors of production

2
Interdependence of households and firms
HOUSEHOLDS FIRMS
All people who live together and who make joint economic decisions or who are subjected to others who make such decisions for them
Unit that employs factors of production to produce goods and services that are sold on the goods market
Every individual is a member of a household
Own factors of production
Sell them on factors markets to firms
In exchange they receive income to purchase consumer goods in the goods market
Goods then consumed to satisfy human wants
Firms purchase factors of production in the factor market
Transform factors into goods and services
Sell these goods in the goods market
Members are called consumers – the act of consuming is consumption
Capital purchased by firms – the act of purchasing capital goods is investment or capital formation ( I )
Total spending is called total or aggregate consumption ( C )
CIRCULAR FLOW OF GOODS & SERVICES
CIRCULAR FLOW OF INCOME AND SPENDING
Households sell their factors of production to firms in the factor market
Firms purchase factors of production in the factor market
Firms transform factors into goods and services
Firms spending = income of the households
Sell product to household in the goods market
Households spend income to purchase goods and services
Household spending = income of firms

3
Circular flow of goods and services (Figure 3-2) Circular flow of income and spending (Figure 3-3)
Factor Market
Goods Market
FIRMS
HOUSEHOLDS
FIRMS
HOUSEHOLDS
Factor Market
Goods Market
Spending Income
Spending Income (Wages, profit, etc)

4
*Identify the various injections into leakages from the circular flow of income and spending Introducing the government
Local, Regional and National (Public Sector)
Primary function – establish framework within which the economy operates
Purchases factors of production from households (factor market)
Purchases goods and services from firms (goods market)
Provides households and firms with public goods and services
In return taxes are paid and households and firms
Government’s economic activity involves 3 important flows Government expenditure ( G ) Taxes ( T ) Transfer payments – e.g. wealthy to poor
Government spending – injection into flow of spending and income
Taxes – leakage or withdrawal from flow of income between households and firms
The government in the circular flow of production, income and spending (Figure 3-4)
Introducing the foreign sector
FIRMS
HOUSEHOLDS
GOVERNMENT Factor
Market Goods
Market
Income (sales revenue) Spending on factors
of production
Labour, capital
Taxes
Government Spending Government Spending
Goods
Taxes
Public goods and services
Public goods and services
Consumer spending on goods and services
Income (wages, interest, etc.)
Goods and services Labour, capital and other factors of production
Goods and services Labour, capital and other factors of production

5
The rest of the world
SA economy is an open economy
Goods produced in SA sold to other countries
Consumer and capital goods used in SA are produced in the rest of the world
Flows between SA and rest of the world summarised in balance of payments
Flows of goods and services between domestic economy and foreign sector = exports ( X ) and imports ( Z )
Exports constitute an addition or injection into circular flow of income and spending in domestic economy
Imports constitute a leakage or withdrawal from circular flow of income and spending in domestic economy
The foreign sector in the circular flow of income and spending (Figure 3-5)
Introducing the financial institutions
Banks, Insurance companies, Pension Funds, JSE
Not directly involved in production of goods
Links between households or firms with surplus funds and other participants that require funds
Surplus units (those who save) and deficit units (those who require funds)
Households and firms not spending all their income – save ( S )
Saving is a leakage or withdrawal from circular flow of income and spending and channelled into financial institutions as saving deposits
Funds available to firms who wish to borrow to expand productive capacity (deficit units)
Invest ( I ) in capital goods – addition or injection into the circular flow of income and spending
Financial sector therefore is a funnel for saving which is channelled back to circular flow in form of investment spending
Firms
Households
Foreign Sector
Payment for
imports (leakage)
Payment for
exports (injection)
Spending
and
income
Spending
and
income

6
Financial Institutions in the circular flow of income and spending (Figure 3-6)
Total production, income and spending: a summary *Identify the various economic participants/list the components of total spending
3 flows into the economy : Production, Income and Spending
Total(Aggregate) Production = production of all goods and services in the economy, this generates income (value = total production)
Total Income = income earned by various factors of production i.e. wages, salaries, rent, interest and profit
Total Spending (expenditure) consists of 4 factors: Households and firms on consumer goods ( C ) Government on goods and services ( G ) Foreigners on SA goods and services ( X ) MINUS SA on imported goods and
services ( Z )
Total expenditure = C + I + G + X – Z
Other flows = taxes ( T ) paid to government and saving ( S ) income not spent
Financial
sector
Households
Firms
Spending and
income Spending and
income
Saving
Saving Investment

7
The major elements of the circular flow of income and spending (Figure 3-7)
Firms
Financial
sector
Households
Foreign Sector Government
I S
S
G
T
Z
X C
C

8
STUDY UNIT 2 (Chapter 15)
The Monetary Sector
As per the checklist: 2.1 Functions of money (chapter 15.1) List the functions of money: 1. Money is a medium of exchange (this is the primary function)
o It allows us to move beyond a barter economy o where has to be a double coincidence of wants for exchange to happen o The system is cumbersome and inefficient o Thus monetary economies are much better, and serves as an
intermediary (or medium of exchange) o Generally acceptable means of payment
2. Money is a unit of account
It is a common measure of the cost to enable comparison
Also allows us to work out GDP
Can lose some of its usefulness during inflation
Is not the only unit of account as any commodity or product can be used, but it is the most convenient
3. Money as a store of value
I.e. for holding savings, which is convenient and easy to use at a later date (is liquid)
Can also have assets though, which is better at times of high inflation, when money LOSES value
Thus one can see that money is not the only store of value, and is not always the BEST store of money either
The store value of money also serves as a standard of deferred payment (ice you pay back a loan in rands and cents)
It is also the means by which credit is granted Define money
Money is anything that is generally accepted as payment for goods and services or that is accepted in settlement of debt
1. Money is a generally acceptable means of payment 2. This is because people believe it will be accepted as payment by other
people Differentiate between money, income and wealth
9
Money is anything that is generally accepted as payment for goods and services or that is accepted in settlement of debt
Income is the reward earned in the production process and is usually measured in money
Wealth is assets that are accumulated over time. Can include money. 2.2 Different kinds of money (chapter 15.2) List the properties of money
Uniform
Durable
Divisible
Able to be carried Explain why credit cards are not seen as money
Demand deposits are NOT created when someone is issued with a credit card
They are just a convenient way to make a purchase by making a short term loan from a bank or other financial institution
When you purchase with a credit card, the bank pays for the item, and you pay the bank at the end of the month
NOTE: cheques and debit cards also not money, but they allow people to transfer money from their own demand deposit to someone else to pay for something, and are thus a way of making transfer.
Activity 2
The South African money supply is NOT fully backed by the amount of gold in the vaults of the SARB.
Demand deposits can be withdrawn immediately by writing out a cheque (which is generally accepted as payment) and therefore demand (or cheque) deposits form part of the quantity of money
2.3 Money in South Africa (chapter 15.3) Explain the difference between M1, M2 and M3 M1 – includes coins, bank notes and demand deposits only M2 – includes short-term and medium-term deposits (quasi money) and is more than one and a half times the value of M1 M3 – which includes long-term deposits, is regarded as the best measure of developments in the monetary sector M1, M2 and M3 are the different ways in which the SARB measures the quantity of money The conventional measure (M1)

10
Defined on the basis of the functions of money as a medium of exchange
Includes all articles generally available as a medium of exchange (or means of payment)
M1 includes coins and notes (in circulation outside the monetary sector) as well as all demand deposits (including cheque and transmission deposits) of the domestic private sector with monetary institutions NOTES: 1. only money in the hands of public can be used as a means of payment – thus
the proviso “in circulation outside the monetary sector”) 2. Demand deposits refer to deposits that can be withdrawn immediately by
means of a cheque, against which cheques may be written out.
Can be written as equation: M = C + D Where: M = quantity of Money,
C = cash (coins and notes in circulation outside the monetary system) D = demand deposits (which is by far the largest component, usually around 90%)
A broader definition of money (M2) M2 is equal to M1 plus all other short-term and medium-term deposits of the domestic private sector with monetary institutions
medium to long term deposits are immediately available as a medium of exchange
They are invested for a certain period (> 30 days for short term, and > 6 months for medium term
Can only be drawn earlier at considerable cost
But are SIMILAR to M1 and are thus seen as quasi-money (or near money) M2 can therefore be defined as money plus quasi-money The most comprehensive measure of money (M3) M3 is equal to M2 plus all longer-term deposits of the domestic private sector with monetary institutions
Have maturity of longer than 6 months
Monetary authorities view this as most reliable indicator of developments in the monetary (or financial) sector
Can also use M3 to evaluate success of monetary policies and guidelines
Is a reflection of the store of value function and not only function of money as a medium of exchange

11
2.4 Financial intermediaries (chapter 15.4) Explain the basic function of a financial intermediary The one main function of a financial intermediary is to act as an intermediary between the surplus units and the deficit units in the monetary economy People pay and interest rate in exchange for being allowed to borrow money 2.5 The South African Reserve Bank (chapter 15.5) List the functions of the SARB (South African Reserve Bank)
Formulation and implementation of monetary policy
Refinancing or repo rate tendering system is the main instrument
This provides the daily liquid needs of private banks
In order to maintain effective influence on interest rates the Bank compels the banks to borrow a substantial amount (the liquidity requirement) from the SARB
Also can also impose cash reserve requirement and open market transactions to drain excess liquidity from the money market in order to ensure a liquidity shortage at all times
Service to the government
Banker and advisor
Custodian of gold and foreign exchange reserves
Formulation of exchange rate policy
Administration of exchange control
Provision of economic and statistical services
Collects, processes, interprets and publishes economic statistics and other info
Helps policy makers, analysts and researchers
Maintaining financial stability (currently its most nb objective)
Bank supervision and regulation (issues bank licenses)
Oversees the National Payment System to reduce potential systemic risk crisis from settlement defaults
Banker to the other banks o Monetary base – is custodian of the minimum cash reserves that
banks are legally required to hold o Clearing bank – these are the reserves held by the SARB which
are used to clear the banks’ mutual claims and obligations to one another. The success of clearing bank activities is very closely related to the smooth operation of the national Payment System
o “lender-of-last resort” – in certain circumstances can provide liquidity to banks experiencing liquidity problems
Has the sole right to make, issue and destroy: banknotes and coins

12
2.6 The supply of money (chapter 15-6 and box 15-4)
The reserve asset position and the credit multiplier:
Each bank has to ensure that it always has sufficient cash reserves available to provide for cash
withdrawals, must provide for the claims of other banks, which may exceed its own claims.
Confidence of creditors must be maintained. To maintain confidence in the banking system, the
monetary authorities lay down legal requirements stipulating the amount of cash reserves to be held
against the total liabilities of a bank. Any increase in the banks demand deposits increases the
amount that the banks have to hold in the form of cash reserves with the reserve bank.
R = cash reserves
D = demand deposits
Any increase in demand deposits will raise the required minimum cash reserves.
Increase in cash reserve requirements = reduction in credit multiplier
The present system of monetary control in SA seeks to control the amount of demand deposits by
influencing the cost of additional cash reserves rather than by variations in the cash reserve ration or
by seeking to control the actual amount of the banks aggregate cash reserve holdings.
Any increase in demand deposits as a result of an increase in the provision or use of overdraft
facilities forces banks to acquire additional reserves which have to be borrowed from the SARB at the
repo rate.
The higher the repo rate the more expensive credit becomes and the smaller the demand for credit
will be. As the credit falls so too will the size of M1.
Other factors that can influence the money supply:
1. Transactions with foreign countries, government transactions, foreign trade, international capital movements. . Payments for exports will have a negative impact on the quantity of money.
Foreign transactions – a countries money supply generally increases when it’s gold and foreign
exchange reserves increase and falls when gold and foreign exchange reserves decrease.
Activity 6
The cash reserve requirement of any South African bank is held in a non-interest-bearing account with the SARB.
The money creation process is based on the ability of banks to lend part of the deposits they receive to other customers.
Banks can create demand deposits by granting credit to their clients in the form of overdraft facilities.
When a person deposits cash in a cheque account there is no immediate change in the quantity of money.
The greater the monetary base, the more opportunities there are for creating money.

13
Transactions with foreign countries DO influence the domestic money supply.
Payments for imports have a negative impact on the quantity of money.
When a country's foreign reserves increase, its money supply generally INcreases.
Government transactions can exert an influence on the money supply. 2.7 The demand for Money (chapter 15.7) Define the demand for money “The demand of money is the amount that the various participants in the economy plan to hold in the form of money balances” Demand for money has two basic components:
The transaction demand for money which arises from the medium of exchange function
The demand for money as an asset which arises from the store of value function
Equation: L = f(Y, i), where L = quantity of money demanded Y – National income I = interest rate The equation states that the demand for money is a function of the income level and the interest rate level Mention the motives for holding money and the main determinant of each 3 motives for holding money (not keeping it in assets:
1. Transaction motive (as a medium of exchange) The MAIN DETERMINANT is Income
2. Precautionary motive (similar to transaction motive) At the macro level the precautionary demand is also a function of national income The MAIN DETERMINANT is Income The above two together are called the active balances
3. Speculative motive (related to the function of money as a store of value) Note: there is a negative (inverse) relationship between the quantity of money demanded for speculative purposes and the level of interest rate The MAIN DETERMINANT is Interest rate This is known as the passive balance
Table 15-2 The demand for money (or liquidity preference): a summary
Function Motive Active/passive Main determinant
Medium of exchange
Transactions Precautionary
Active balances Income
Store of value Speculative Passive balances Interest rate

14
The demand for money – figure 15-1 Figure 15-1 The demand for money i L=L₁ + L₂
L, M 0 Quantity of money
The total demand for money at the given level of income (Y1) is shown in (c)
The demand for active balances (L1), which is independent of the level of the interest rate, is show in (s) for a given level of real income Y1. The demand for passive balances (L2), which is inversely related to the interest rate, is shown in (b). The total demand for money (LL) is obtained by adding the quality of active balances (L1) and the quantity of passive balances (L2) at each interest rate.
Figure 15-1(a) and Figure 15-1(b) the demand for active balances (transactions and precautionary motives) and for passive balances (speculative motive) are shown separately.
(a) i i (b)
L₁ (at Y₁) i₁ L₂ L, M L, M 0 L₁ 0 Quantity of money Quantity of money
Symbol L denotes that we are dealing with liquidity preferences (and not ordinary commodity)
In
tere
st r
ate
Inte
rest
rat
e
Inte
rest
rat
e

15
L1: o Shows demand for active balances o not sensitive to interest rates variations o measured on the vertical axis o is determined by the income level o the higher the income level, the further to the right L1 will be
L2: o Shows the demand for passive balances o This curve demonstrates the negative relations between interest rates and
the quantity of passive balances demanded o At a certain interest rate level (i1) no funds will be demanded to be used
for speculative purposes
In Figure 15-1(c) the joint or total money demand curve or total liquidity preference (LL) is two individual demand curves in (a) and (b).
The negative slope reflects the inverse relationship between the interest rate level and the quantity of money demanded for speculative purposes
The position of the demand curve is mainly determined by the demand for active balances, which is determined by the income level. An increase in income shifts the total demand curve to the right, while a decrease in income level will cause the LL level to shift to the left
The effect of a change in income on the demand for money – figure 15-1
The higher the income level, the further to the right L1 will be
An increase in income will result in an increase in the quantity of money demanded at each interest rate, which can be illustrated by a rightward shift of the money demand curve.
Activity 7 (1) The opportunity cost of holding money is the interest that could have been earned by holding interest-bearing assets (eg bonds) instead. (2) The demand for money arises from the functions of money as a medium of exchange and as a store of value. (3) The quantity of money demanded for transaction purposes is related to the function of money as a medium of exchange. (4) The demand for money for speculative purposes arises from the function of money as a store of value. (5) There is a NEGATIVE relationship between the quantity of money demanded for speculative purposes and the level of income. (6) Since money is the most liquid of all assets, the demand for it is also called liquidity preference. (7) The quantity of money demanded for transactions and precautionary purposes is also called the demand for active balances and is related to the level of income in the economy. (8) If the interest rate is high, the quantity of money demanded for speculative purposes will be LOW (it is inverse relationship). (9) The demand for passive balances refers to the SPECULATVE demand for money.

16
(10) There is an inverse relationship between the interest rate and the quantity of money demanded for speculative purposes. (11) The total quantity of money demanded depends on the level of income and the interest rate. (12) An increase in income will result in an increase in the quantity of money demanded at each interest rate, which can be illustrated by a rightward shift of the money demand curve. Distinguish between active balances and passive balances and mention the main determinant of the quantity demanded of each type. (5)
Function Motive Active/passive Main determinant
Medium of exchange
Transactions Precautionary
Active balances Income
Store of value Speculative Passive incomes Interest rate
2.8 Equilibrium in the money market (chapter 15.8) Money market equilibrium Figure 15-2 Figure 15-2 The money market The quantity of money is determined by the interaction of the interest rate and the demand for money. At the initial interest rate i0 the quality of money is M0. A reduction in the interest rate to i1 will increase the quantity of money to M1, cet par
Supply of money is not really separate from demand for money (there is no independent supply curve)
The money demand curve LL above is the same as the one explained in above
The interest rate is largely determined through the repo rate
The quantity of money is determined the interaction of the interest rate and the demand for money
At an interest rate of i0 the quantity of money will be M0 The effect of a change in income on money market equilibrium - figure 15-2 i L E₀ i₀ i₁ E₁ L
0 M₀ M₁

17
The effect of a change in interest rate on money market equilibrium – Figure 15-2
A reduction in interest rates to i1, initiated by a lowering of the repo rate, will raise the quantity of money to M1, cet par
An increase of the interest rate, initiated by the raising of the repo rate, will decrease the quantity of money
Explain a demand determinant money supply According to the interpretation that money supply cannot be separated from money demand, there is NO independent money supply curve. The money supply (or quantity of money) depends on the demand for money and the cost of credit (i.e. the interest rate). This is called a demand-determined money supply 2.9 Instruments of monetary policy (chapter 15.10) Define monetary policy “Decisions made or actions taken by the monetary authorities to influence the quantity of money or the interest rate, with the aim of achieving the macroeconomic objectives of stable prices, full employment and economic growth”
In South Africa it is formulated and implemented by the SARB
The way in which the banks other functions are fulfilled is determined mainly by the goals of monetary policy
The repo rate tender systems is the main instrument through which monetary policy is conducted in South Africa
List the market-oriented monetary policy instruments
Accommodation policy (or the refinancing of the liquidity requirement) o Banks must hold 2.5% of total liabilities in to form of cash reserves with
SARB o When they have a shortage of cash can borrow from other banks o When this is not available, go to the SARB (lender of last resort), and
borrow via the repo system, which ensures liquidity o They are bought at auction, and have strict controls o Thus it accommodation policy mainly comprises changes in the repo rate
and other conditions on which cash is made available to banks, an instrument by which the SARB can regulate the quantity of money through variations in the cost of credit.
Open-market policy o Consists of the sale or purchase of domestic financial assets (mainly
Treasury bills and government bonds) by the central bank in order to exert a specific influence on interest rates and quantity of money
Public debt management
Intervention in foreign exchange markets

18
(these are listed as both market-oriented p0licy instruments on page 332, and as non-market orientated policy on page 335 – anyone have any idea which is correct?)
List the non-market-oriented monetary policy instruments
Credit ceilings
Deposit rate control
Changes in the terms of hire purchase agreements
Changes in exchange control regulations
Reserve Bank intervention in foreign exchange markets
Public debt management Define the repo rate
A repo maybe be defined as the sale of an existing security (financial asset) at an agreed price, coupled with an agreement to the seller to buy back the same security on a specified future date (normally seven days later at the same price
The maturity value of the repo is determined in the initial agreement and consists of the price plus an agreed amount of interest
The interest presents the cost of obtaining the funds for a week.

19
STUDY UNIT 3 (Chapter 16)
The Public Sector
Central government: concerned with national issues such as defence and our relationship with the rest of the work. Regional government: concerned with regional issues such as housing, health service and education. Local government: Deals with local issues such as the provision of sewerage, local roads, street lighting and traffic control. Public coporations: other government business enterprises such as Eskom, Transnet and Rand Water. General Government: consists of the general departments of the central, provincial and local government. Public Sector: General government plus the public corporations and other government enterprises.
3.1 Role of government in the economy: an overview (chapter 16.1)
All economies can be classified as mixed
Government, private sector and market forces all play a role 3.2 How does government intervene? (Chapter 16.4) What instruments can government use to achieve its objectives?
Public provision: achieved by public ownership and public financing.
Market participant: Government is the largest employer of labour
Government spending: Both the level and the composition of government spending has a powerful impact on the economy.
Taxation: To finance government spending
Regulation: Refers to all laws, rules and regulations that affect private behaviour.
3.4 Government failure (chapter 16.5) Two broad groups of public officials:
Politicians (who are elected) aim is vote maximising
Bureaucrats: (who are appointed) – agents for politicians and the public.
Rent-seeking (economic rent) interest groups: refers to attempts by private firms, households, organised business, organised labour and other interest groups to benefit at the expense of society at large.
3.5 Nationalisation and privatisation (chapter 16.6) Nationalisation: government takes over ownership or management of private enterprises.
Privatisation: opposite of nationalisation – it refers to the transfer of ownership of assets from the public sector to the private sector i.e. the sale of state owned assets to the private sector.)
o First concerns the problem of financing increasing government expenditure in a situation where tax burdens are already very high
o Second: Government ownership is less efficient than private ownership. o Third: based on the view that the losses of inefficient state-owned enterprises are an
important source of budget deficits and other fiscal problems. Arguments for privatisation:
Will attract foreign direct investment
Will broaden the tax base
Greater access to investment capital and will be able to adapt more easily to changing economic conditions
Make funds available for spending on housing, education and health

20
Increase share ownership in the economy and serve as an instrument of black economic empowerment.
Arguments against privatisation:
Private firms will not necessarily be exposed to greater competition and be more efficient that state-owned firms. (extreme: state monopoly could be replaced by private monopoly)
State-owned firms are supposed to take account of any possible external costs or benefits; the same does not apply to privately owned firms.
Private owned firms will not take a broader view of the public interest.
3.6 Fiscal policy and the budget (chapter 16.7) Define fiscal policy Policy in respect of the level and composition of government spending, taxation and borrowing that effects economic activity
It is an effective means of influencing total spending (is an instrument of demand management)- an instrument that can be used to manage or regulate the total demand for goods and services in the economy.
Monetary policy (manipulation of interest rates) is an important part of demand management (controlled by SARB)
Often close link between the National Treasury (who executes fiscal policy) and SARB as fiscal policy and monetary policy need to be applied in harmony
At times of recession expansionary fiscal and monetary policy are applied to simulate economic activity.(usually government spending is raised and taxes reduced) (which causes budget deficit(difference between government spending and taxation) to increase)
When expansion is too rapid (with inflation or balance of payment issues) contractionary or restrictive fiscal and monetary policies are applied (gov spending reduced and taxes increased)
Mention the instruments of fiscal policy The main instrument is the budget (spending and taxation are the main variables)
It reflects the political decisions about how much to spend, what to spend it on and how to finance the spending
Is often used to stimulate economic growth and employment, redistribution of income, control inflation or address balance of payments problems
4.3 Government spending (chapter 16.8) Explain briefly why government is involved in economic activity Government spending is a large share of the total spending in the economy Can be classified:
Economically (distinguish between consumption and investment spending) Total expenditure (consumption plus investment)

21
o There was a large increase in gov spending post war (not just SA) o Reasons include:
Changing consumer preferences (larger demand for public goods and services)
Political and other shocks (e.g. wars) increase gov spending Redistribution of income (in democratic countries where majority of
people have relatively low incomes) Misconceptions and entitlement mean excessive demand for public
services Population growth and urbanisation
or functionally (composition) o changing economic and social conditions o changes in priorities of government (decline in defence spending, increase
in social welfare spending) o increase in spending on interest on the public debt
Activity 3
o Government spending in South Africa consists largely of spending on consumption spending
o Changes in the level and composition of government spending sometimes reflect changes in social priorities but could also be the result of the influence of powerful special interest groups
o Political shocks and other major disturbances could exert strong upward pressure on government spending
o Excessive or unrealistic expectations about what government can deliver (eg in the form of improved education, health and housing) could exert upward pressure on real government spending
o Both a rapidly growing population and a high rate of urbanisation tend to exert upward pressure on government spending
3.7 Financing of government spending (chapter 16.9) Explain how government spending can be financed
1. Income from property Includes the interest and dividend income that is derived from governments full or partial ownership of enterprises such as: - from Eskom, Telkom and Transnet (public corporations) - production and sale of agricultural, forestry and fishing products - rent(e.g. mining rights) - other licenses and user charges
2. Taxes (taxation is main source of income) - is not sufficient to finance all gov spending - the difference between gov spending and current revenue is called the budget deficit
3. Borrowing
the budget deficit is financed by borrowing

22
Borrowing from the central bank, using overdraft facilities
this increases the money supply and can be inflationary (so called inflationary financing)
it increases the public debt, thus increasing interest on public debt (meaning less money to spend on things like social upliftment) - has increased dramatically over the years - cannot be justified on economic grounds as future generations must carry burden of debt (future generations will have to pay for the consumption enjoyed by this generation).
3.8 Taxation (chapter 16.10) Explain the criteria for a good tax Adam Smith’s four cannons of taxation: A good tax should be equitable, economical, convenient and certain. Now we classify 3 criteria
1. Neutrality - must not distort the allocation of resources and lower the welfare of society. - must not act as a disincentive for owners of factor of production -excess burden or deadweight loss of taxation must be kept as low as possible (i.e. do not induce taxpayers to change their behaviour) -have minimum possible effect on relative prices, should be as neutral as possible. -this does assume that market mechanism is working effectively
2. Equity
-fairly spread among various taxpayers -can mean people will be willing to pay higher taxes (if everyone equal) -needs to follow: -ability to pay principle (people should pay according to their ability.) Two notions:
Horizontal equity (referring to people in same position being taxed equally, e.g. same level of income) of
vertical equity (requires that people in different positions should be taxed differently (i.e. rich people should pay more tax than poor people)
Benefit principle. The recipients of the benefits generated by a particular gov expenditure should pay for the good or services concerned (charge or levy – the more you receive, the more you pay). These are usually called user charges
3. Administrative simplicity -taxes are a cost to taxpayers (tax itself, keeping records, paying accountants) called compliance costs design tax forms, collect taxes, etc) -therefore compliance costs and admin costs need to be LOW (must be simple – no loopholes so tax avoidance is reduced – is legal) -is different to tax evasion which is illegal
23
Explain the difference between - direct and indirect taxes Direct taxes
o Also called taxes on income and wealth o Are levied on persons - the income and wealth of individuals and
organisations such as companies o Include: personal income tax, company tax and estate duty
Indirect taxes
o Also called taxes on goods and services or taxes on products and production o Are levied on transactions – purchase of goods and services o Are usually paid by the person who consumes the goods and services in
questions o Include: VAT, customs and excise duties
General taxes and selective taxes
o VAT is a general tax – levied on most goods and services o Excise duties are selective taxes – levied on specific goods only. Eg: alcohol
and tabacco (also called sin taxes), fuel and few luxury goods. - progressive, proportional and regressive taxes Progressive taxes
o When the ratio of tax paid to taxable income increases as taxable income increases
o This means that people with high incomes pay a larger percentage than those with low incomes
o E.g. personal income tax Proportional taxes
o If the ratio of tax paid to taxable income is the same at all levels of income o This means the level of tax is the same for all taxpayers o E.g. basic company tax – fixed percentage on company profits.
Regressive taxes
o If the ratio between tax paid and taxable income decreases as taxable income increases (or rises as taxable income falls)
o This means that a regressive tax takes a larger percentage of income of low income individuals and groups than that of higher incomes
o E.g. indirect taxes (e.g. VAT) are often regressive 3.9 Taxation in South Africa (chapter 16.11) The three main taxes are:
Personal Income Tax: Most important form of direct taxation in South Africa. Tax is levied on individuals taxable income. The Marginal tax rate: rate at which each additional rand of income is taxed. Average tax rate: ratio between the amount of tax paid and taxable income. Effective tax rate: The average tax rate.

24
Is a progressive tax. Bracket creep: the effect of inflation on a progressive income tax. Capital gains tax (CGT): taxable income such as gains resulting from sales of assets, shares and fixed property.
Company Tax: Companies are separate legal entities and taxed independently from their shareholders and other individuals Example of proportional tax: Business profits are taxable income which is taxed at a uniform rate. The marginal tax rate = average tax rate. STC (secondary tax on companies) is levied on all profits distributed to shareholders in the form of dividends
VAT: most important indirect tax in South Africa Regressive tax – (most goods and services are taxed in the same standard rate) since lower income households spend a greater portion of their income on goods which carry VAT than high-income consumers.
Activity 6
o The South African government raises most of its tax revenue through personal income tax and value-added tax.
o Company tax is NOT the most important source of tax revenue in South Africa o The marginal tax rate is the rate at which every additional rand is taxed (e.g.
in the case of personal income tax) o Personal income tax in South Africa is a progressive tax o Company tax in South Africa is an example of a proportional tax o Value-added tax is a regressive tax.
Short question (a) Explain the difference between a marginal tax rate and an average tax rate (in respect of personal income tax). Marginal tax rate:
Tax tables are used to deduce how much tax someone should pay
The table has a number of tax brackets, each having a minimum amount of tax and a tax rate that is applied to each rand by which taxable income exceeds the starting point
This is called the marginal tax rate
It is the rate at which each additional rand of income is taxed The average tax rate:
The ratio between the amount of tax paid and taxable income
It is also called the effective tax rate 3.10 Tax incidence: Who really pays the taxes? (Chapter 16.12) Explain what is meant by the term tax incidence A tax incidence is a combination of the statutory or legal tax incidence (the laws on who pays taxes) and the effective tax incidence (who actually pays the burden of tax). In essence, it is the analysis of the effect of a particular tax on the distribution of economic welfare. Tax incidence is said to "fall" upon the group that, at the end of

25
the day, bears the burden of the tax. The key concept is that the tax incidence or tax burden does not depend on where the revenue is collected, but on the price elasticity of demand and price elasticity of supply. For example, a tax on apple farmers might actually be paid by owners of agricultural land or consumers of apples. Explain the difference between the legal and effective incidence of an excise tax Legal excise tax incidence
A legal tax incidence is the government’s decision (or the laws they create) they say who has to pay taxes, and how much
In terms of an excise tax, the government can decide that the tax on cigarettes shall be R4 per box
Effective excise tax incidence
Refers to the fact that government cannot actually determine who bears the burden of the taxes
In terms of the excise tax on cigarettes, there are actually three groups that share the burden of tax:
o The consumer, who have to pay more for each packet of cigarettes o The suppliers, who receive less for reach packet of cigarettes – this
means that the profits of the ownership of shareholders of the cigarettes companies are lower
o The employees of the cigarette companies – since the production of cigarettes has fallen, there will be fewer jobs available in the cigarette industry (alternatively, the existing employees will have to accept wage cuts which will shift the supply curve to the right)
The distribution of the burden between these groups will depend on the relative price elasticity’s of the demand curve and the supply curve.

26
Diagrams I am able to show and explain the following with the aid of a diagram: The impact of an excise tax - Figure 16-3
Study Unit 4 (Chapter 17)
The Foreign Sector
As per the checklist: 5.1 Why countries trade (chapter 17.1) Countries trade in order to gain goods that other countries can either supply cheaper than they themselves can produce the item, or for items they do not posses (such as crude oil or platinum that can only be found in some countries) Define absolute advantage
An absolute advantage is with regards to ONE good that one can produce faster/cheaper than another country
The example being Japan and Australia – Japan can produce video cameras better, and Australia wool. They each trade what they make best, and both countries benefit
E₁
E
₁
E
₂
St
S
S
St
D
D
R4,00
SS is the supply curve before the imposition
of the tax of R4,00 per packet of cigarettes.
DD is the demand curve.
The original equilibrium price is R12,00 per
packet and the equilibrium quantity is 150 000
packets per week.
After the imposition of the tax, the supply
curve shifts up by R4,00 to StSt.
The new equilibrium is indicated by E₁. The
equilibrium price is R14,40 per packet and
the equilibrium quantity is 120 000 packets
per week.
Suppliers receive the selling price less the
tax, that is, R10,40 per packet. This is
indicated by E₂ on the original supply curve.
The difference between E₁ and E₂ is the tax.
The consumers pay R2,40 extra per packet
and the suppliers received R1,60 less per
packet than before.

27
Define comparative advantage The ability to produce a product at a lower opportunity cost than another person or country. A country has a comparative advantage over another if in producing a commodity it can do so at a relatively lower opportunity cost in terms of the forgone alternative commodities that could be produced. Explain the law of comparative advantage
The law of comparative (or relative) advantage states that both countries will benefit from trade if the opportunity costs of production (or relative prices) differ between the two countries.
According to the theory each country will tend to specialise in and export those goods for which it has a comparative advantage
Example – Germany can produce both wine and cars cheaper than in SA (having an absolute advantage in both). However, when comparing the two RELATIVELY, the outcome is less straightforward: In one day:
o Germany = 2 cars or 8 barrels of wine o South Africa = 1 car or 6 barrels of wine
Making CARS:
o One can see that Germany has to give up less barrels of wine (4) than SA (6) to produce one car
o Thus it has a comparative advantage in producing cars Making WINE
o SA: to make one barrel of wine SA has to give up 1/6 of a car o Germany: to make one barrel of wine, Germany has to give up ¼ of a
car o Thus SA has the comparative advantage in producing wine
It now makes sense for SA to shift to producing wine, and Germany to shift to cars (if trade at 5 barrels per one car, they each gain one barrel in the exchange) For this to work it MUST be advantageous to both
List the main sources of comparative advantage The sources are found in those factors that determine the relative demands for and the relative supplies of each of the goods produced
1. Technology o superior production processes (more output per unit of input) o but this advantage can erode over time (e.g. Korea can copy
Germany’s technology, and as their labour costs are lower, Germany

28
eventually imports from Korea, and is known as the product life cycle theory of international trade
2. Resource endowments (different countries have differing amounts, giving them different advantages The Heckscher-Ohlin theory: each country will tend to export those goods that most intensively use the country’s relatively abundant resources
3. Differences in tastes or demand (forces of demand are also important in the determination of the country’s comparative advantage)
Equal exchange
This is where there is no comparative advantage, and then there is no reason for the countries to trade
Eg if Germany = 2 cars or 8 barrels of wine
SA = 1 car or 4 barrels of wine
Here there is NO comparative advantage, and no reason to trade Activity One
The more open a country's economy is, the more vulnerable it is to changes in economic conditions in other countries.
A country is said to have an open economy if a significant percentage of GDP is exported and a significant part of domestic spending is on imported goods and services.
Adam Smith argued that countries should NOT try to be as self-sufficient as possible.
One of the basic reasons for international trade is that not all countries possess the same factors of production (eg natural resources).
The law of relative (or comparative) advantage states that two countries will benefit from trade if the opportunity costs of production (or relative prices) differ between the two countries.
Absolute advantage is NOT a prerequisite for trade.
Equal advantage is NOT a prerequisite for trade.
Comparative (or relative) advantage IS a prerequisite for trade. Calculations: I am able to determine comparative advantage by calculating opportunity cost The following statements are based on this information: Susan can knit 4 jerseys or sew 8 dresses per week, while Jackie can knit 3 jerseys or sew 4 dresses per week.
Absolute cost is about who can produce more:
Susan has an absolute advantage in knitting jerseys (she can knit more per week)
Susan has an absolute advantage in sewing dresses (she can knit more per week)
Relative cost is about opportunity cost of specialising in production of one particular product:
Jackie has a relative (or comparative) advantage in knitting jerseys.

29
Susan has a relative (or comparative) advantage in sewing dresses.
Jackie should specialise in knitting jerseys while Susan should specialise in sewing dresses. (To knit 1 jersey per week Susan has to sacrifice 2 dresses, whereas Jackie sacrifices 1¼ dresses in order to produce a jersey. Jackie can knit jerseys "cheaper" and will specialise in the knitting of jerseys. Jackie has a relative advantage in the knitting of jerseys. On the other hand, to sew 1 dress Susan has to sacrifice ½ a jersey, while Jackie must sacrifice ¾ of a jersey. Susan can sew dresses "cheaper" and will specialise in the sewing of dresses. Susan has a relative advantage in the sewing of dresses.)
If country A can produce 2 400 tractors or 3 million tons of maize per year and country B can produce 1 500 tractors or 3 million tons of maize per year, then A should specialise in producing tractors, while B should specialise in producing maize.
To produce 1 unit of maize country A must sacrifice 800 (that is 2 400 ÷ 3) tractors, while country B must sacrifice 500 (1 500 ÷ 3) tractors. Country B can produce maize "cheaper" and will specialise in the production of maize. Country B has a relative advantage in the production of maize To produce 1 tractor, Country A has to sacrifice 3/2 400 (in other words 3 ÷ 2 400) units of maize whereas Country B sacrifices 3/1 500 (that is 3 ÷ 1 500) units of maize in order to produce a tractor. Country A can produce tractors "cheaper" and will specialise in the production of tractors. Country A has a relative advantage in the production of tractors.
5.2 Trade policy (chapter 17.2) Import tariffs are put in place to protect domestic firms against competition from imports (protective tariffs – these can be high, placing foreign producers at a disadvantage, though not enough to prevent imports altogether) or to raise government revenue (revenue tariffs – are usually imposed on items that are not produced in the domestic economy) Distinguish between a specific tariff and an ad volorem tariff Specific tariff: A specific tariff is a fixed amount that is levied on each unit of the imported commodity. E.g. a tariff of R5,00 is levied on each imported bottle of wine An ad volorem tariff: An ad valorem tariff is a tariff that is levied as a percentage of the value of the imported item. E.g. a tariff of 20% on the price of an imported motor car

30
Other Measures: Quantitative restrictions Import Quota: quantitative restriction on imports. Tariffs aimed at influencing the process of imported goods, seek to control the physical level of imports. Is a form of direct intervention in the market mechanism. Subsidies, other non-tariff barriers, exchange controls, exchange rate policy. Tariff = increased government revenue Quota restriction: the benefit of a higher price resulting from limited supply goes to the seller. Argue for and against the use of trade barriers For:
Balance of payments: o tariffs and controls imposed in short term can correct a deficit in the
balance of payments o Dependent on price elasticity of demand for imports (the higher the price
elasticity, the greater the saving of foreign currency will be)
Dumping: o When firms sell at a lower price in foreign market than they do at home. o When done to undercut competition is called predatory dumping o Governments impose protective tariff called countervailing duties to
counter it
Export subsidies: o If one country subsidises exports heavily, countries can use countervailing
duties to retaliate
Infant industries o Oldest and best argument for trade barriers. o Many developing countries have a potential comparative advantage in
manufacturing, but the industries cannot initially compete with well-established industries in developed countries.
o Thus gov should temporarily support them with tariffs, import quotas and subsidies) until they have grown strong enough to meet international competition.
o The GATT (General Agreement on tariffs and trade) recognises the infant industry argument as a legitimate reason for protectionism.
Employment o The need to protect jobs and industries in the domestic market. o Also need to protect from cheap foreign labour, especially if that labour is
being exploited
Government revenue o Is a crucial source of government revenue o Tariffs are often extremely efficient forms of revenue collection o It is more easy to collect than complex tax on such things as production,
consumption, income and property
National security o Government prefers not be dependent on foreign sources for essential
resources o Thus resources that would be essential during crisis or war are protected
(e.g. Armscor and Sasol during apartheid)

31
Against:
Infant industries o Protecting infant industries can foster inefficient industries without a hope
of ever standing up alone, which are complacent and unwilling to adapt to changing circumstances.
o It is also hard to “pick winners” – i.e. pick industries to protect now who will do well in the long run
Employment o Protecting jobs and industries can delay industries becoming
internationally competitive (which sometimes mean job restructuring). o Trade barriers are a very poor way of stimulating employment, or lowering
unemployment (and there are better ways this). o Also, while ONE country may success with import restrictions, all countries
cannot succeed simultaneously o Protecting from cheap foreign labour is not a valid argument. Low
wages are supposed to reflect low productivity and unit labour costs should not be affected by low wages
o Poor countries also need to exploit their comparative advantage of cheap labour
o It is very hard to prove exploitation of workers, and also should be addressed through labour policy, rather than through trade policy.
National security o EVERY industry seeking protection tries to show they are vital to national
security (even those producing peanuts and pens!!!) o It is a political issue, not an economic one
Retaliation by trade partners o Trade barriers invite retaliation (i.e. tit-for-tat trade war with no real
winners)
Welfare cost to society o Protectionist measures (particuarly tariffs) impose a cost on society o The introduction of a tariff is followed by an increase in the price paid by
domestic consumers, a fall in consumer surplus and a loss of welfare to society (figure 17-2)
Inefficiency o If protected, firms have less incentive to reduce their costs and increase
their efficiency
In general gains and losses from trade barriers are unpredictable o Consumers lose as prices are higher than they would be o Producers in the protected economy gain since demand for their product
increases o Foreign producers lose since they are deprived of a market

32
Diagrams: I am able to show the impact of the imposition of a specific import tariff on domestic production and imports Figure 17-1 Figure 17-1 The impact of a specific import tax S D Eₑ P₃ P₂ E₁ P₁ Sw S D
0 Q₁ Q₂ Q₃ Q₄ Q₅ Quantity of textiles The original demand and supply of textiles before international trade and are represented by DD and
SS. As indicated by Eₑ, the domestic price is P₄ and the quantity exchanged is Qs. With the
introduction of international competition the price falls to the world price P₁. The new equilibrium is E₂, indicating an equilibrium quantity of Q5. The world supply of textiles is represented by P₄Sw. With
the introduction of a specific tariff, the domestic price increases to P₂. The mew equilibrium is E₁. The
equilibrium quantity is Q4 of which Q2 is produced domestically. Domestic production increases and the volume of imports falls.
I am able to explain with or without the aid of a diagram (Figure 17-1): SPECIFIC tariff Figure 17-1 the domestic (South African) textiles industry - a product in which the country has a competitive disadvantage. DD represents the demand for textiles. SS represents the domestic supply of textiles.
With NO world trade, the equilibrium price is Pd and the equilibrium quantity is Q3 (point Ed).
When economy is opened to international trade, countries with a relative or comparative advantage (e.g. certain Asian countries) will export textiles to SA at a lower prices (the WORLD PRICE) – Pw.
The international supply is represented by line PwSw. This means that any quantity of textiles can be imported and therefore supplied at the world price (Pw).
E₂
Pri
ce o
f te
xtile
s

33
The domestic price for textiles will thus fall to the world price. At the lower price the quantity of textiles demanded increases to Q5. The new equilibrium point is indicated by Ew. The equilibrium prices is Pw, and the equilibrium quantity is Q5.
Domestic production has fallen from Q3 to Q1. South African producers who cannot compete at a price of Pw are eliminated from the market.
Imports are represented by the difference between Q5 and Q1 International competition causes a decrease in domestic production and employment and a weakening of the balance of payments (since imports increase). Domestic consumers benefit from lower prices. Also firms which use textiles as an intermediate product (e.g. producing clothes, linen, etc) and their production and income may therefore expand. NET IMPACT of the introduction of international competition is therefore uncertain If gov now introduces a specific tariff on imported textiles as worried about production and employment in the industry:
The tariff is indicated by the difference between Pt and Pw, with Pt being the domestic price of textiles after the introduction of the tariff.
The new equilibrium position is indicated by Et. The higher price of textiles reduces the quantity demanded from Q5 to Q1. At the same time the higher price stimulates the domestic production of
textiles and the quantity produced domestically increases to Q2. The difference between Q4 and Q2 represents the quantity imported, which is
now smaller than before the imposition of the tariff Thus domestic production (and employment) is raised, and quantity of imports is reduced. Revenue for government is increased. However, domestic price for textiles is increased, and the overall consequence unclear Calculate the level of local production, quantity demanded and the level of imports given an import tariff ????? Activity 2
A specific import tariff is a fixed amount which is levied on each unit of an imported good.
An ad valorem import tariff is NOT a percentage that is levied on the price of an imported good. (An ad valorem tariff is a tariff that is levied as a percentage of the value of the imported item) (I assume this means it is on the price paid to the foreign supplier, not the price that will be paid by the local consumer)
Import tariffs DO NOT benefit domestic consumers (they pay more)
An import tariff can be used to protect a domestic industry against foreign competition.

34
5.3 The balance of payments (chapters 4.6 and 17.3) Each country keeps a record of its transactions with the rest of the world. This accounting record is called the balance of payments. It has two major accounts: the current account and the financial account Distinguish between the current account and the financial account of the balance of payments Current account
It is a record of a countries purchases from and sale of goods and services to the rest of the world
All the exports (sales to the rest of the world) and imports (purchases from the rest of the world) as well as all the primary income receipts and payments are recorded in the current account of the balance of payments
All service receipts (money spent by tourist on food and accommodation while travelling in SA) and payments for services (money spent by South Africans while travelling).
All income receipts (income earned by South African residents in the rest of the world) and income payments (income earned by non-SA residents in SA)
If there is a surplus it means that the value of the exports exceeded the value imports during the period
If there is a deficit then imports were greater than exports The financial account
Like a bank account this is an accounting statement showing all the funds going into the account and all the funds going out of the account
It is thus all the purely financial flows of the balance of payments
A surplus means more flowed into the country than out for the period o We say there was a net flow of foreign capital into the country
If there is a deficit we say there was a net outflow of foreign capital
Records international transactions in assets and liabilities.
Has three main components: o Direct Investment: includes transactions where the purpose of the
investor is to gain control of or have a meaningful say in the management of the enterprise.
o Portfolio investment: Refers to the purchase of assets such as shares or bonds, where the investor is only interested in the return on the investment.
o Other investment: is a residual category which includes all financial transaction not included under direct or portfolio investment. (loans, currency and deposits)
Balance can be obtained by adding net direct, portfolio and other investment.
Both the current account and the financial account can be in surplus or deficit. If we add the two balances we obtain the change in the country’s gold and foreign

35
exchange reserves. This change serves as the balancing item on the balance of payments The balance of payments consists of four basic accounts
Current Account
Capital transfer account
Financial account
Unrecorded transactions – serves to balance the balance of payments. Trade balance = goods exported and imported together with net gold exports All recorded in the current account:
Service receipts: Money spent by foreign tourists while in South Africa
Payments for service: Money spent by South Africans while travelling abroad.
Income receipts: Income earned by South African residents in the rest of the world
Income Payments: Income earned by non-residents in South Africa.
Current transfers: Social security contributions and benefits, taxes imposed by government and private transfers of income (gifts, personal, immigrant and other remittances and charitable donations.)
GNI (Gross national income) = GDP plus primary income from the rest of the world minus primary income to the rest of the world. Exports can be promoted as follows:
Take steps to keep domestic costs of production in check so that goods can be supplied on international markets at competitive prices
Assist potential exporters to find international markets and subsidise some of their costs (export promotion)
Allow or engineer a depreciation of the rand against other currencies, thereby making exports more competitive, ceteris paribus.
Large portion of domestic spending in SA is on imported goods and services. 5.4 Exchange rates (Chapter 17.4) (This section is VERY important to know….) Define the exchange rate
The exchange rate is simply the price of one currency in terms of another currency, or in other words the rate at which currencies are exchanged
Rate at which one currency may be converted into another. Also called rate of exchange or foreign exchange rate or currency exchange rate.
Appreciation (an increase) in one currency, automatically means a depreciation (decrease) in the other currency
The foreign exchange market is the international market in which one currency can be exchanged for another, and is made up of all authorised currency dealers (which includes all major banks)

36
The exchange rate is determined by forces of supply and demand in a free functioning foreign exchange market. We can understand by (as with the US dollar and the Rand)
List the sources for the demand for dollar in South Africa Demand for dollars is a derived demand – e.g. it is derived from the demand of imported goods and services and foreign assets and foreigners supply of domestic liabilities. The exchange rate determines the domestic price of the goods, services and assets and the foreign price of domestic liabilities, and therefore affects the quantity of foreign currency demanded (i.e. if the dollar drops, a tractor from America is suddenly MUCH cheaper, so demand increases) Sources of demand for the dollar in SA:
1. South African importers who import goods and services for which they pay in dollars
2. SA residents who wish to purchase dollar denominated assets (e.g. shares of American companies)
3. American investors who sell their SA assets (e.g. shares, bonds) and want to turn them back into dollars
4. Tourists who buy dollars or dollar denominated travellers cheques 5. Speculators who anticipate a decline in the value of the rand relative to the
dollar General RULE: The more expensive the dollars are the smaller will be the quantity of dollars demanded, cet par
List the sources for the supply of dollar in South Africa Those who supply dollars are holders of dollars seeking to exchange them for rands:
1. SA exporters who export goods and services. The foreign buyers of SA exports whose prices are quoted in dollars supply dollars which are then exchanged for rands
2. Foreign holders of dollars who purchase SA assets (e.g. shares on the JSE Securities Exchange or government stock)
3. SA investors who sell foreign assets denominated in dollars and convert the proceeds back into rands
4. Foreign tourists in Sa who exchange dollars of dollar denominated travellers cheques for rands
5. Speculators who anticipate a rise in the value of the rand relative to the dollar As the rand price of the dollar falls, the quantity of South African exports demand by Americans therefore also the derived quantity of dollars supplied will fall. The supply curve therefore has a positive slope. Explain the exchange rate between the United States dollar and the South African rand

37
This is the equilibrium exchange rate: where the rate at which the quantity of dollars demanded equals the quantity of dollars supplied. It is also the basic exchange rate against all other currencies (eg pound sterling or the yen) – it is derived from those currencies exchange rates with the dollar E.g. if $1 = R8 and $1 = Euro € 0,80 then SA currency dealers will quote an exchange rate of Euro €1 = (R8 divided by 0,80) = R10 Explain changes in supply and demand: currency depreciation and appreciation. Anything that causes a change in the supply or demand of foreign exchange will result in a change in the exchange rate, cet par Appreciation and depreciation has to be viewed from one currency towards another. So the dollar appreciates against the rand (it gets more expensive) or to say it another way, the rand has depreciated against the dollar A fall in the price of the dollar:
Implies that the dollar has depreciated against the rand
OR the rand has appreciated against the dollar (A change in demand or supply of dollars will be reflected by a shift of the relevant curve) E.g. A decrease in the supply of dollars (i.e. a leftward shirt of the supply curve)
Can happen when US imports LESS goods from SA (fewer dollars are being earned)
Or price of gold falls on the world market (gold is quoted in dollars, so a fall in the gold price also means fewer dollars are earned as less dollars are supplied on the SA forex market for a given volume of gold exports)
A decrease in supply causes a leftward shift of the supply curve – the dollar has appreciated - this implies that the rand has depreciated against the dollar.
Imports from the United states become more expensive (in Rands) in South Africa and South African exports to the United States become cheaper (in dollars) in that country, ceteris Paribas. This will tend to dampen imports and stimulate exports (i.e to improve the balance on the current account.)
When authorities wish to combat inflation, they prefer an appreciation of the rand, but this tends to reduce the competitiveness of our exports (in the short run at least) and to stimulate imports.

38
Changes in supply and demand: A Summary Change Illustrated by Impact on rand/dollar
exchange rate (ceteris paribus)
Rand Dollar
Demand for dollars increases (eg because SA firms purchase more US capital goods at each exchange rate or because more SA tourists visit the United States
A Shift of the demand curve to the right
Depreciates Appreciates
Supply of dollars increases (eg because the gold price increases or because US firms buy more South African minerals)
A shift of the supply curve to the right
Appreciates Depreciates
Supply dollars decrease (eg because gold price falls or because US citizens stop investing in South Africa)
A shift of the supply curve to the left
Depreciates Appreciates
Demand for dollars falls (eg because a recession in South Africa causes a slump in the demand for US goods)
A Shift of the demand curve to the left
Appreciates Depreciates
Impact of changes in the rand/dollar exchange rate for South Africa Table 17-5
Change in R/$ exchange
rate
Impact on
Export prices (in dollars)
Import prices (in rands)
Current account
Domestic prices
Rand depreciates against the dollar
Decrease Increase Improves Rise
Rand appreciates against the dollar
Increase Decrease Worsens Fall

39
Diagrams I am able to: (i) show on a diagram (ii) explain with or without the aid of a diagram The impact of changes in the demand or supply of dollar on the South African forex market Table 17-4 ; Figure 17-4 (i) Figure 17-4 A decrease in the supply of dollars
The original supply (SS), demand (DD), equilibrium price and quantity are the same as in Figure 17-3.
The decrease in the supply of dollars shifts the supply curve to S₁S₁. The equilibrium price (or
exchange rate) changes to $1 = R9,00 and the equilibrium quantity falls to $8 billion
(ii) Anything that causes a change in the supply or demand of foreign exchange
will result in a change in the exchange rate, cet par. (I.e. there will be an appreciation or depreciation in a currency). A change in supply or demand will be reflected by a shift of the relevant curve. A decrease in the supply of dollars can occur when households, firms or the gov in the US import fewer SA goods, or when the price of gold falls on the world market. Both means less dollars are being earned. This causes a leftward shift in the supply curve to S1S1(with the associated depreciation of the rand to R9 per $1 and new equilibrium quantity of $8 billion) This means that the dollar has become more expensive in terms of rand (the dollar has appreciated against the rand, and the rand has depreciated against the dollar)
D
D
S S₁
S
S₁
E
E₁
0 8 10 Quantity of dollars per day (billions)
10,00
9,00
8,00
6,00
4,00
2,00
Price o
f dolla
rs (
exchange r
ate
)
Q
R/$

40
Calculations: I am able to use a numerical example to distinguish between an appreciation and depreciation of the rand against the dollar In this example, the original equilibrium exchange rate is $1 = R8, and the equilibrium quantity is $10 billion per day. This will change if there is a decrease in the supply of dollars, for example when households, firms or the gov in the US import few SA goods, or when the price of gold falls on the world market. Both means less dollars are being earned. This shifts the equilibrium price (or exchange rate) to $1 = R9 and the equilibrium quantity falls to $8 billion. This means that the dollar has become more expensive in terms of rand (the dollar has appreciated against the rand, and the rand has depreciated against the dollar) The reverse would happen if there was an increase in the supply of dollars, and then the rand would appreciate against the dollar. Intervention in the foreign exchange market: Because of the potential volatility of exchange rates, and because the authorities often wish to use the exchange rate to pursue particular policy objectives, exchange rates are often managed or manipulated to some extent by the central banks: known as managed floating. A central bank can only intervene to stabilise a depreciating currency if it has sufficient foreign exchange reserves to do so. Explain the policy options available to stabilise a currency under a floating exchange rate system
o Do nothing (allow market forces to determine exchange rates) o Intervene in the foreign exchange market (by buying or selling
foreign exchange (managed floating) but this is severely limited due to large turnover in the forex market
o Use interest rates (to influence exchange rates: if you raise interest rates relative to the rates in the rest of the world this will encourage an inflow of foreign capital and will also raise the cost of speculators who want to speculate against the rand. This causes an increase in the demand of rands, relative to what it would have been otherwise, and therefore a stronger rand

41
The terms of trade (Chapter 17.5) Define the terms of trade Terms of trade = export price index x 100 Import price index
The terms of trade are the ratio between export prices and import prices
Terms of trade (or TOT) is the relative prices of a country's export to import.
An increase or improvement in the terms of trade means that the welfare of the nation has increase, cet. Par.
"Terms of trade" are sometimes used as a proxy for the relative social welfare of a country
An improvement in a nation's terms of trade is good for that country in the sense that it has to pay less for the products it imports, that is, it has to give up fewer exports for the imports it receives.
EXAMPLE: In the simplified case of two countries and two commodities, terms of trade is defined as the ratio of the price a country receives for its export commodity to the price it pays for its import commodity. In this simple case the imports of one country are the exports of the other country. For example, if a country exports 50 dollars worth of product in exchange for 100 dollars worth of imported product, that country's terms of trade are 50/100 = 0.5. The terms of trade for the other country must be the reciprocal (100/50 = 2). When this number is falling, the country is said to have "deteriorating terms of trade". If multiplied by 100, these calculations can be expressed as a percentage (50% and 200% respectively). If a country's terms of trade fall from say 100% to 70% (from 1.0 to 0.7), it has experienced 30% deterioration in its terms of trade.
CHAPTER 4 – MEASURING THE PERFORMANCE OF THE ECONOMY STUDY UNIT 5
5.1 Macroeconomic objectives *List the 5 macroeconomic objectives
Economic Growth In a growing economy total production of goods and services increase. If
the population grows and there is no economic growth average living standards cannot increase
Full employment Ideally all factors of production (especially labour) should be fully
employed Unemployment has costs to people personally and society One of the purposes of economic growth is to create additional
employment opportunities

42
Price Stability Does not mean all prices should always stay constant Individual prices should respond to supply and demand Process of general level price increases = inflation Price stability is keeping inflation as low as possible
Balance of payments stability (external stability) SA exports to foreign countries and also imports from foreign countries To pay for imports foreign currency needs to be earned Balance between imports and exports is required Balance of payments and exchange rate need to be fairly stable
Equitable (socially acceptable) distribution of income Partly subjective or normative issue Value judgements important Unequal distribution of income can cause political and social conflict
5.2 Measuring the level of economic activity: gross domestic product *Define GDP Total value of all final goods and services produced within the boundaries of a country in a particular period (usually one year) How are different types of economic activity added up? Value – Use prices of various goods and services to obtain value of production Once production is expressed in Rands and Cents the total value of production can be determined by adding different values together Final – Distinguish between final and intermediate, the problem is double counting which can easily overestimate of inflate the value of GDP Example Farmer produces 1000 bags of wheat at R10 per bag Miller processes wheat into flour and sells to baker for R12 500 Baker bakes bread with flour and sells to shopkeeper for R18 000 Shopkeeper sell bread to final consumer for R21 000
Participant Value of sales Value added
Farmer R10 000 R10 000
Miller R12 500 R2 500
Baker R18 000 R5 500
Shopkeeper R21 000 R3 000
Total R61 500 R21 000
Cannot add the value of sales together as the value of production of wheat is included in the value of flour sold to the miller etc.
Concept of value added is then used
Value of the shop’s sales to final consumers amounts to R21 000, in other words you only need to count the value of sales where good and service reaches its final destination
This cuts out intermediate goods which do not form part of GDP

43
Ultimate use of product determines whether its final or intermediate Incomes – Consider only incomes earned during various stages of production by the owners factors of production Example R10 000 earned during farming stage R2 500 earned during milling stage R5 500 earned during baking stage R3 000 earned during final selling stage A Total of R21 000 Income is earned by producing, that is, by adding value to goods and services. Therefore value added, spending on final goods and income all have the same answer giving 3 ways to calculate GDP Three Methods of calculating GDP *Name the 3 methods to estimate GDP
Production method (value added)
Expenditure method (final goods and services)
Income method (incomes of factors of production) Why do they yield the same answer?
Value of final goods and services must necessarily be made up of successive values added in different stages
Production and income can be viewed as two sides of the same coin
Income earned by factors of production (labour, capital, natural resources and entrepreneurship) consist of (wages, salaries, interest, rent and profit)
Total value of production = Total value of wages, salaries, interest, rent, profit
Value added (Production) = spending on final goods Example Baker adds R5 500 to final product Baker needs factors of production (primary inputs) to produce
Wages and Salaries R2 500
Rentals (buildings) R1 000
Interest on loans R500
Total R4 000
Baker’s entrepreneurial profit (revenue (R5 500) – payments (R4 000) = R1 500 Selling price of baker (R18 000) is apportioned as follows:
Primary Inputs
Wages and Salaries R2 500
Rentals R1 000
Interest R500
Profit R1 500
Secondary Inputs
Intermediate goods and services (flour) R12 500
Total R18 000

44
Value of sales Primary Inputs Secondary Inputs (intermediate goods and services)
Farmer R10 000 R10 000 -
Miller R12 500 R2 500 R10 000
Baker R18 000 R5 500 R12 500
Shopkeeper R21 000 R3 000 R18 000
Total R61 500 R21 000 R40 500
Value of sales = Primary + Secondary Value of sales – Secondary = total Primary income Value of final goods and services = total income Output expressed in monetary terms must be equal to the total monetary income derived from it.
Further aspects of the definition of GDP Total value of all final goods and services produced within the boundaries of a country in a particular period (usually one year) – definition Two elements already explained: Meaning of value Meaning of final goods and services Two further aspects: Within the boundaries of a country – GDP is geographic and includes all production within the geographic area of a country (domestic) During a particular period – GDP concerns with production of new goods and services (current production) i.e. goods produced in a previous period and sold in current period and resale of existing goods are not part of GDP. It is also a flow and can only be measured over a period of time. Production and income two sides of same coin i.e. income can be substituted for “product” in GDP – gross domestic product same as gross domestic income Gross – means no provision has been made for capital equipment used up in production process (depreciation). Provision should be made for depreciation and subtracted from value of output (consumption of fixed capital); this then changes from gross total to net total Measurement at market prices, basic prices and factor cost (or income) *Explain difference between Market prices, basic prices and factor cost GDP only gets same result if same set of prices is used 3 sets of prices used to calculate GDP: Market prices – used when calculating GDP on expenditure method Basic Prices – used when calculating GDP on production (value added) method Factor Cost (factor income) – used when calculating GDP on income

45
Differences between these prices due to taxes and subsidies on goods and services: Indirect taxes (taxes on production and product) makes market price higher
than their basic price or factor cost e.g. cigarettes Subsidies (on production or products) makes market price lower than their
basic price or factor cost e.g. bread
When this happens the amount paid for a good or service differs from cost of production and income earned
Taxes on products – taxes which are payable per unit of some good or service (VAT, taxes and duties on imports and taxes on exports)
Other taxes on production – taxes on production that are not linked to specific goods or services (payroll taxes, recurring taxes on land, buildings and business and professional licences)
Subsidies on products – direct subsidies payable per unit exported to encourage exports and product linked subsidies on products used domestically
Other subsidies on production – subsidies that are not linked to specific goods or services (subsidies on employment or payroll)
The following identities apply:
GDP at market prices – taxes on products + subsidies on products = GDP at basic prices
GDP at basic prices – other taxes on production + other subsidies on production = GDP at factor cost
GDP at factor cost + other taxes on production – other subsidies on production = GDP at basic prices
GDP as basic prices + taxes on products – subsidies on products = GDP at market prices
Measurement at current prices and at constant prices *Explain difference between Nominal and real value When GDP is calculated for a specific year, the prices paid for the various goods and services in that year must be used. (Measurement at current prices or in nominal terms) GDP at constant prices or real GDP is done by valuing all the goods and services produced in each year in terms of the prices ruling in a certain year, called the base year.
GDP @ current prices GDP @ constant prices
Nominal GDP “Nominal means In Terms of name” Face Value Monetary value
Real GDP “Real means Actual or Essential” Purchasing power How much can you buy Prices increase, real value or purchasing power decreases
Example John gets salary of R5000 in 1992 and Sipho gets salary of R5000 in 2007

46
Nominally the same salary is earned Real terms John earned more than Sipho This differs because the value or purchasing power of money changes over time *Calculate change in real and nominal GDP
Nominal GDP 2000 Nominal GDP 2006 Real GDP 2006 at 2000 prices
100 apples @ 50c = R50 150 apples @ R1 = R150 150 apples @ 50c = R75
200 bananas @ 25c = R50 200 bananas @ 40c = R80 200 bananas @ 25c = R50
150 oranges @ 30c = R45 100 oranges at 50c = R50 100 oranges @ 30c = R30
Total = R145 Total = R280 Total = R155
Increase in nominal GDP between 2000 and 2006 = 93.1% 280 – 145/145 x 100/1 = 135/145 x 100/1 = 93,1% Increase in real GDP between 2000 and 2006 = 6,9% 155 – 145/145 x 100/1 = 10/145 x 100/1 = 6,9 % Other measures of production, income and expenditure Gross National Income or Gross National Product
All income earned by foreign-owned factors of production in SA is subtracted from GDP
All income earned by South African factors of production in the rest of the world has to be taken into account
Once this is done we have indication of National Income of permanent residents = Gross National Income (GNI), which equals Gross National Product (GNP)
To derive GNI from GDP the following must be done
Subtract from GDP Add to GDP
Profit, interest and other income from domestic investments accrued to residents of other countries (eg profits earned in South Africa by foreign owners of companies – BMW)
Profits, interest and other income from investments abroad accrued to permanent residents (eg the profits earned by South African construction company that builds roads in rest of Africa)
Wages and salaries of foreign workers engaged in domestic production (eg wages earned by residents in Lesotho)
Wages and salaries earned by permanent residents outside South Africa (eg Income earned by South Africans working in Britain)
Primary income payments to rest of world exceeds Primary Income Receipts – i.e. South Africans earning income in the rest of the world is less than foreigners earning income in South Africa
GNI is therefore smaller than GDP
GNI = GDP + primary income receipts – primary income payments
or if payments are larger GNI = GDP – net primary income payments to rest of world (primary income payments – primary income receipts)
47
GDP is best measure for level of economic activity and potential for creating jobs for residents – Economic growth is measured by calculating % change in real GDP from 1 year to next
GNI is best measure of income or standard of living by examining the level and rate of change in real GNI
Expenditure on GDP
With the expenditure method of calculating GDP – add together the spending of the 4 major sectors (households, firms, government, foreign sector)
Elements of total spending are: Consumption expenditure by households ( C ) Investment spending (Capital formation) by firms ( I ) Government spending ( G ) Expenditure on exports ( X ) – expenditure on imports ( Z )
GDP = expenditure on GDP ( C + I + G + X – Z)
Expenditure on GDP is always valued at market prices
Composition of expenditure on GDP
Final consumption expenditure by households ( C )
Largest single element of total expenditure
Subdivided into spending on durable, semi-durable and non-durable goods and services
Gross Capital Formation ( I )
Capital formation is additions to country’s capital stock (purchase of capital goods)
Gross capital formation means no provision has been made for the consumption of fixed capital
Subdivided into two components: Gross fixed capital formation and changes in inventories
Fixed capital formation refer to purchase of capital goods eg: machinery, buildings and equipment
Changes in inventories reflect goods produced not sold in the current period or goods produced in an earlier period and sold in current period
Final Consumption expenditure by general government ( G )
Does not include capital expenditure (investment) by government
Government’s capital formation is included in gross capital formation
Residual Item Serves to balance the national accounts when 3 methods do not yield the same answer
Exports of goods and services ( X )
Added to the other components of spending on GDP.
Minus Imports of goods and services ( Z )
Spending on GDP does not include imports as they are produced in the rest of the world
Spending on GDP includes spending on South African produced goods and services only. Gross Domestic Expenditure (GDE)
Expenditure on GDP always = GDP at market prices. It indicates total value of spending of goods and services produced in the country

48
Does not indicate total value of spending within the borders of the country.
The three Central domestic expenditure items ( C, I, G ) do not distinguish between goods and services manufactured locally and those manufactured in the rest of the world.
The 3 items constitute gross domestic expenditure
GDE includes imports and excludes exports *Explain difference between GDP and GDE GDE = C + I + G GDP = C + I + G + (X – Z) GDP: Includes exports but excludes imports GDE: includes imports excludes exports The difference between GDP and GDE is the difference between exports and imports (X – Z) – called net exports (NX) The difference between domestic production and domestic expenditure is reflected in the difference between exports and imports If GDP > GDE (exports > imports) (X > Z) If value of production > value of spending (value of exports > value of imports) If GDE > GDP (imports > exports) (Z > X) If value of spending > value of production (value of imports > value of exports) A summary of the basic national accounting totals GDE =
Expenditure on final goods and services by households ( C ), firms ( I ) and government ( G ) during a particular period.
Includes spending on imported goods and services ( Z ) and excludes exports ( X )
Expressed at market prices
GDE = C + I + G (these include imported goods and services) GDP at market prices =
Total market value of all final goods and services produced in a period LESS imports PLUS exports
GDP at market prices = GDE + X – Z = C + I + G + X – Z GNI at market prices =
Net primary payments to rest of the world have to be subtracted from GDP
GNI at market prices = GDP at market prices – net primary income payments Measuring employment and unemployment *Define the unemployment rate The number of unemployed persons expressed as a % of the total number of people willing and able to work The % is called the unemployment rate

49
Measuring prices: the consumer price index Prices and purchasing power
When prices of goods and services increase the purchasing power of our income decreases
The Consumer Price Index (CPI) *Define CPI Index of the prices of a representative “basket” of consumer goods and services. The CPI represents the cost of the “shopping basket” of goods and services of a typical SA household. In constructing CPI the following is done:
Selects goods and services to be included in the basket
Assign a weight to each good or service to indicate its relative importance in the basket
*The above two are done by conducting comprehensive, in-deprth surveys of household income and expenditure more or less every 5 years
Decide on base year for calculating CPI *Base year is year in which survey is done
Decide on formula for calculating CPI
Collect prices each month to calculate value of CPI for that month Once the items in the basket and their relative weights have been determined, this information is inserted into a standard price index formula. *Calculate the change in purchasing power Nominal values and real values (purchasing power) Base period 2000 CPI = 100,0 in 2000 and 133,9 in 2006 Basket purchased cost 33,9% more in 2006 than in 2000 (133,9 – 100,0 / 100,0 X 100) OR Purchasing power of a given amount of money declined between 2000 and 2006 Basket cost R100 in 2000; it would cost R133,90 in 2006 R100 enough to buy 1 basket in 2000, but only enough to buy a fraction in 2006 (100 / 133,90 = 0,75) Between 2000 and 2006 purchasing power of Rand fell from R1 to 75c Sandra earns R 1000 pm in 2000 – 10 baskets can be purchased @ R100pm Nominal income stays the same, the real value (purchasing power) falls 2006 she could only afford 7,5 baskets (R1000 / R133,90) Real Value = Nominal divided by price level As the price level increases, the real value of nominal amounts fall
During inflation, the purchasing power of a given nominal amount falls. Prices can also decrease.

50
Measuring links with the rest of the world: balance of payments *Define the balance of payments A record of transactions with the rest of the world
The SA balance of payments summarises the transactions between SA households, firms and governments and foreign households, firms and government
Consists of two major accounts: Current account and financial account
Current Account Financial Account
All sales of goods and services to rest of world (exports) All purchases of goods and services from the rest of world (imports)
All purely financial flows in and out of the country Purchases and sales of assets like bonds and shares
Surplus = value of exports > imports Deficit = value of imports > exports
Surplus = fund flow in > funds flow out = net inflow of foreign capital Deficit = fund outflow > fund inflow = net outflow of foreign capital
Both accounts can be in surplus or deficit
Add two balances together = change in the country’s gold and foreign exchange reserves = balancing item on the balance of payments
Measuring inequality: distribution of income *Name the 3 measures that are used to measure income inequality Lorenz Curve Simple graphic device which illustrates the degree of inequality in the distribution of income (or any other variable) Individuals or households must be ranked poorest to richest Cumulative percentages of population are plotted along horizontal axis Cumulative percentage of total income on the vertical axis Example
Percentage Cumulative percentage
Population Income Population Income
Poorest 20% 3 20 3
Next 20% 7 40 10
Next 20% 15 60 25
Next 20% 25 80 50
Richest 20 % 50 100 100

51
A Lorenz Curve (Figure 4-1) The line that goes through a, b, c, d is the Lorenz curve The diagonal 0B is line of perfect equality Shaded area is inequality Axes are joined to form a square Diagonal running from origin to point B serves as reference and indicates equal distribution of income Along the diagonal the first 20% of population receives 20% of income and so on Degree of inequality is shown by deviation from the diagonal The greater the distance the greater the degree of inequality The greatest possible inequality will be where one person earns the total income, then the Lorenz curve will run along axes 0 to A to B Gini Coefficient (Gini Ratio) Obtained by dividing the area of inequality shown by the Lorenz curve by the area of the right triangle formed by the axes and diagonal Gini coefficient can vary from 0 to 1 Sometimes also multiplied by 100 obtaining Gini Index, which varies between 0 and 100 If incomes are distributed perfectly equally – Gini coefficient is zero In this case the Lorenz curve coincides with the line of perfect equality and the area of inequality = 0 If total income goes to one individual or household (incomes distributed with perfect inequality) the Gini coefficient = 1 In this case the area of inequality will be same as triangle 0AB Gini coefficient usually ranges between 0,30 (highly equal) and 0,70 (highly unequal)
a
b
d
c
0 20 40 60 80 100
1
0
2
0
3
0
4
0
5
0
6
0
7
0
8
0
9
0
1
00
B
A
Cumulative percentage of population
Cu
mu
lati
ve p
erce
nta
ge o
f in
com
e

52
Quantile Ratio Ratio between the percentage of income received by the highest X per cent of the population and the percentage of income received by the lowest Y per cent of the population Compare income received by top 20% and bottom 20% = 50 / 3 = 16,7 The higher the ratio the greater the degree of inequality Ratio between top 20% and lowest 40% = 50 / 10 = 5 is used to compare income distributions between countries
STUDY UNIT 6 (Chapter 18)
Income determination in a simple Keynesian macroeconomic model
6.1 Production, income and spending (chapter 18.1) I am able to explain the relationship between the three central macroeconomic flows
Total production (or output)
Total income
Total spending (or expenditure) The National accounts are concerned with measuring the above:
These are recorded ex post (after the events have occurred)
Total production = total income (as economists are only interested in income earned in the process of production)
Total spending (or expenditure) = total production and income (because of the way in which spending is defined – changes in inventories are added to total investment spending (i.e. capital formation), one of the components of total spending
In macroeconomic theory there is no guarantee that total spending will equal to total production or income
If income is only sufficient to purchase the total product – there is no incentive for producers to expand production (as no one will have the money to buy the extra products). In this case production is at its equilibrium level
“Recall that equilibrium is a situation in which there is no tendency to change. Equilibrium occurs when none of the participants have any incentive to change their behaviour. Things will therefore remain the same (as long as the underlying forces do not change.)
But spending CAN exceed production (the demand for goods and services is greater than the available production or supply – is an incentive to expand production) – How spending can exceed income: if savings from a previous period are used, or they can buy on credit
Total spending can also be less than total income – total demand for goods and services will be less than total production – incentive to reduce
53
production. Happens when money is saved and does not make its way back into the circular flow of income, production and spending
Therefore there are three possibilities (where Y = total production, output or income and A = total or aggregate spending (or aggregate demand)
1. Spending may be equal to production and income (A = Y). In this case production and income are at their equilibrium levels – there is no tendency to change Will always occur at the full-employment level of production or income.
Full employment level of income = Y₁ 2. Spending may be greater than production and income (A > Y).
In this case production and income will tend to increase. They are therefore not at their equilibrium level
3. Spending may be less than production and income (A < Y). In this case production and income will tend to fall. They are therefore not at their equilibrium
I am able to define Say's law Y → A Supply creates its own demand This is the belief that A will always = Y and this occurs at the full-employment level
of production or income (Y₁) Jean-Baptiste Say formulated the idea that all leakages will automatically find their way back into the circular flow of income and spending. If this happens, total spending will always equal to total income. There can never be insufficient demand for goods and services In this model there is no requirement for the government to intervene in the economy Extra notes: The Keynesian model: A → Y Keynes took into account the Great Depression that proved that full-employment is not automatic, and that aggregate demand is not always sufficient to purchase all the goods and services produced
He said A is the force which determines Y
This means that equilibrium (where A = Y) can occur at ANY LEVEL, and not
just at full-employment (Yf)
There is no automatic tendency in the economy to full employment – spending has to be stimulated, or over-employment reduced in order to create equilibrium
This means there is often a need for government intervention (to stimulate or dampen)

54
Other names for A and Y Y is also known as: total production, total output, aggregate output, national output, aggregate production, aggregate income, national product and national income. It is the theoretical equivalent of national accounts such as GDP and GNI A is also known as: total spending, aggregate spending, total expenditure and aggregate expenditure Activity: In macro-economic theory there is no guarantee that total spending will be equal to total production or income In the national accounts, total spending during any particular period is also always equal to total production and income during that period. Macro-economic theory is used to explain and predict how the various sectors of the economy will react under certain circumstances and to analyse the possible effects on policy. National Accounts are a set of accounts which record what actually happened in an economy during a particular period. – can only describe what has already happened. 6.2 Basic assumptions of the model (chapter 18.2) Aim of the Keynesian macroeconomic model is to explain how national income is determined. The basic assumptions look at only the basics, excluding the government and the foreign sector so we are not confused: I am able to list the basic assumptions of the Keynesian macroeconomic model
The economy consist of households and firms only
There is no government
There is no foreign sector
Prices are given
Wages are given
The money supply and interest rates are given
Spending (and demand) is the driving force that determines the level of economic activity
When we say that prices, wages, the money supply and interest rates are given, we mean that their values are determined outside the model. These variables are used to determine other variables but they are not explained by the model (they are referred to as exogenous variables)

55
I am able to explain the implications of the assumptions of the Keynesian macroeconomic model
Assumption Implication The economy consist of households and firms only
Total spending consists of consumption spending (C) and investment spending (I)
There is no government The model cannot be used to analyse government spending or taxes
There is no foreign sector The model cannot be used to analyse exports, imports, exchange rates, trade policy and exchange rate policy
Prices are given The model cannot be used to study inflation
Wages are given The model cannot be used to study the workings of the labour market
The money supply and interest rates are given
The model cannot be used to study the financial markets or monetary policy
Spending (and demand) is the driving force that determines the level of economic activity
Production (supply) adjusts passively to changes in spending (demand)
Based on the above assumptions, there are only 2 kinds of spending: 1. consumption spending (by households – denoted by symbol C) 2. Investment spending (by firms – symbol I)
Equilibrium is where A = Y
A is I + C
Therefore equilibrium is where C + I = Y 6.3 Consumption spending (chapter 18.3) Aggregate consumption expenditure by households constitutes a relatively stable (and high) proportion of total income in any economy. The consumption function: the relationship between consumption expenditure by households and total income. It has 3 important characteristics:
1. Consumption increases as income increases (positive relationship between consumption spending and income)
2. Consumption is positive even if income is zero – this reflects the influence of the non-income determinants of consumption spending.– people will spend savings or use credit if their income is 0. This is the autonomous consumption)
3. When income increases, consumption increases but the increase in consumption is less than the increase in income – part of the additional income is saved
Autonomous consumption: that part of consumption which is independent of level of income (non-income determinants).Thus one can see that there are two parts of consumption spending: an autonomous part which is independent of income, and an induced part which is determined by income

56
I am able to (i) show on a diagram the three characteristics of the consumption function Figure 18-1 Figure 18-1 The consumption function
Both axes in the figure are drawn to the same scale. The line C is called the consumption function. It has three important features. It shows that households spend more as their total income increases; that consumption does not fall to zero when income falls to zero; and that the increase in consumption when income increases is smaller than the increase in income
C (consumption) and is measured along the vertical axis
Y (income) is measured along the horizontal axis
The consumption function shows the level of consumption spending at each level of income
It confirms the three features: 1. One can see that consumption spending increases as income increases 2. Consumption does not fall to zero even if income falls to zero. When Y is
zero, consumption is still at some positive level, indicated by C1 in the figure, which shows the income is not the only determinant of consumption. The distance between the origin to C1 is the autonomous consumption (it is the minimum level of consumption, financed by sources other than income)
3. As income increases, consumption increases, but the increase in consumption is smaller than the increase in income The ratio between the change in consumption and the change in income is one of the most in ratios in macroeconomics and is called the marginal propensity to consume. This is indicated by the symbol c, Note that it is equal to the slope of the consumption function To work this out you divide the change in C by the change in Y:
Y
C
Y
Y₁ Y₂
C
C₃
C₂
C₁
C
0
Total income
Tota
l co
nsu
mp
tio
n s
pen
din
g

57
c = ∆C ∆Y
I am able to (ii) explain with or without the aid of a diagram the three characteristics of the consumption function
1. Consumption increases as income increases (positive relationship between consumption spending and income)
2. Consumption is positive even if income is zero (there are non-income determinants – people will spend savings or use credit if their income is 0. This is the autonomous consumption)
3. When income increases, consumption increases but the increase in consumption is less than the increase in income – part of the additional income is saved
I am able to (i) show on a diagram the relationship between consumption and income Figure 18-2 Figure 18-2 Autonomous and induced consumption C
C=C₁ + cY
C₁ 0 Y The shaded area represents autonomous consumption while the remainder of the area under the consumption function represents induced consumption. Autonomous consumption is independent of the level of income, while induced consumption increase as income increases. Autonomous consumption changes as result of a change in one of the non-income determinants of consumption Non-income determinants of consumption(the factors that determine autonomous consumption)
Distribution if income
Autonomous Consumption
Induced Consumption
1
c

58
The age distribution of the population
Consumers holdings of financial assets
Availability and cost of credit I am able to (ii) explain with or without the aid of a diagram the relationship between consumption and income Consumption increases as income increases. Consumption is positive even if income is zero (there are non-income determinants – people will spend savings or use credit if their income is 0. This is the autonomous consumption). When income increases, consumption increases but the increase in consumption is less than the increase in income – part of the additional income is saved There are two parts of consumption spending: an autonomous part which is independent of income, and an induced part which is determined by income I am able to explain the relationship between consumption and saving
ALL income is either saved, or spent
If S is savings then Y = C + S
Saving is also thus not spending
The marginal propensity to save (s) is the proportion of an increase in income that is saved
s + c must equal = 1
e.g. if c = 0,75, then s = 0,25
as s is what is not c (savings is that which is not spent) it follows that the factors that determine aggregates saving are the same as that affect aggregate consumption (anything that increases c decreases s)
S = Y – C = Y – (C + cY) since C = C + cY
I am able to calculate private consumption expenditure C = C + cY C = autonomous spending (independent of level of income Y) cY = induced consumption
Induced consumption is determined by two things: 1. the marginal propensity to consumer (c) (which givers the slope of the
consumption function) 2. the level of income (Y)
EXAMPLE: If marginal propensity to consume (c) is ¾ (or 0.75) and the level of income (Y) is R1,000:
then induced consumption (cY) = 3/4 x R1,000 (or 0,75 x R1,000) = R750.
This means that R750 of the R1000 earned will be spent on consumption

59
I am able to calculate the level of autonomous spending This is the vertical intercept of the consumption function It is always greater than 0 I am able to calculate the marginal propensity to consume This is denoted by c and is worked out: c = ∆C ∆Y This shows us what portion of an increase in income will be used for consumption. It can never be greater than 1, since the extra spent out of the extra income cannot be more than the additional income!! It therefore lies between 0 and 1: 0 < c < 1 It is also equal to the slope of the slope of C (the consumption function slope) 6.4 Investment spending I am able to explain with or without the aid of a diagram the relationship between investment and the interest rate Figure 18-3
Intro to investment spending (I) which is related to the production and purchase capital goods (not to financial assets) eg: buildings, machinery and equipment.
Investment relates to capital as a factor of production.
Not primarily a functions of income. – independent of the level of income. Is not related to changes in total production or income Y (i.e. it is regarded as
autonomous with respect to Y) Is most volatile and therefore usually the main cause of fluctuations in economic
activity
Firms invest in order to make profit: they compare the cost to projected profit and the greater the expected profit, the greater the investment will be (and with no expected profit, there will be no investment)
Profit depends on cost of obtaining capital goods and the expected revenue they will yield in the future.
They must also consider the cost of borrowing (interest), as a large portion of investment spending is financed by borrowing (even using own funds (retained earnings) is related as firm must consider what interest would be earned by this money if it was in the bank - opportunity cost)
Thus the three important variables are: 1. the cost of capital goods 2. the interest rate 3. the expected revenue earned form the capital goods
there is an inverse relationship between the interest rate the expected return on investment spending, cet par (the higher the interest rate, the lower the expected

60
return on investment, and the lower the interest rate, the higher the expected return on the investment, cet par)
I am able to show on a diagram the relationship between investment and the interest rate Figure 18-3 Figure 18-3 The investment function i 0 Investment Spending I The level of investment I is inversely related to the interest rate I, cet par
Changes in interest rates causes a movement along the curve
Shifts in the curve are caused by the economic climate – e.g. whether people expect profits to be good or not. Improvement in profit estimates causes a rightward shift of the investment function and a deterioration in business confidence will cause a leftward shift
Investment spending (I) is therefore related to expectations and interest rates and not to the level of national income (Y) (i.e. it is regarded as autonomous with
respect to Y)
I In
tere
st R
ate

61
I am able to show on a diagram the relationship between investment and income Figure 18-4 Figure 18-4 Investment and the level of income
I Ī I = Ī 0 Income Y Investment spending I is independent of the level of income Y. Investment is thus autonomous with regard to the level of total income in the economy
The equation for the investment function: I = Ī
6.5 Simple Keynesian Model of a closed economy without a government We can now look at a simple model of income determination Remember that:
C is primarily a function of Y
I is not a function of Y I am able to explain with or without the aid of a diagram the equilibrium level of income Figure 18-7 There is equilibrium when: Y = A When A > Y
We have an excess demand
firms experience an unplanned decrease in their inventories
current production does not meet demand for goods and services
firms therefore have to draw on stocks or inventories to meet demand
there is therefore incentive to increase their production in the next period When A < Y
We have an excess supply
In
vestm
en
t S
pen
din
g

62
firms experience an unplanned increase in their inventories
they cannot sell all their goods and services
they therefore lower their production for the next period Equilibrium ONLY occurs when A = Y Aggregate spending function : A = C + I I am able to show on a diagram the equilibrium level of income Figure 18-7 FIGURE 18-7 The equilibrium level of income A
A=Y
A=C+I E A₀
45°
0 Y₀ Y
Total production, income The equilibrium level of income Y0 is the level of income at which the aggregate spending function A intersects the 45-degree line. At any level of income lower than Y0 there is excess demand at any level of income higher tan Y0 there is excess supply along the aggregate spending function Using symbols (and equations) to determine the equilibrium level of income: C = 50 + 4/5Y or C = 50 + 0.8Y I = 150 To obtain aggregate spending (A), we have to add C and I: A = C + I = (50 + 4/5Y) + 150 = 200 + 4/5Y Or A = C + I = (50 + 0.8Y) + 150 = 200 + 0.8Y
Excess Supply
Excess
Demand
Aggre
gate
Spen
din
g

63
We know there is equilibrium when Y = A. By substituting A in this equilibrium condition with 200 + 4/5Y or 200 + 0.8Y we obtain:
Y = 200 + 4/5Y Y – 4/5Y = 200 1/5Y = 200 Y = 200/1/5 = 200 x 5 = 1000 Or Y = 200 + 0.8Y Y – 0.8Y = 200 0.2Y = 200 Y = 200/0.2 = 2000/2 = 1000
6.6 Algebraic version of the simple Keynesian model closed economy without a government I am able to explain with or without the aid of a diagram the level of autonomous spending, the marginal propensity to consume and the equilibrium level of income Figure 18-8 The model has 3 elements:
a consumption function C = C + cY
where: C = total consumption spending C = autonomous consumption c = marginal propensity to consume Y = income cY = induced consumption
an investment function Investment spending is completely autonomous from income I = Ī
an equilibrium condition Where: Y = A (Y is total income and A is total spending)
We also know that total spending A = C + I (A = consumption spending (C) and (I) is investment spending)
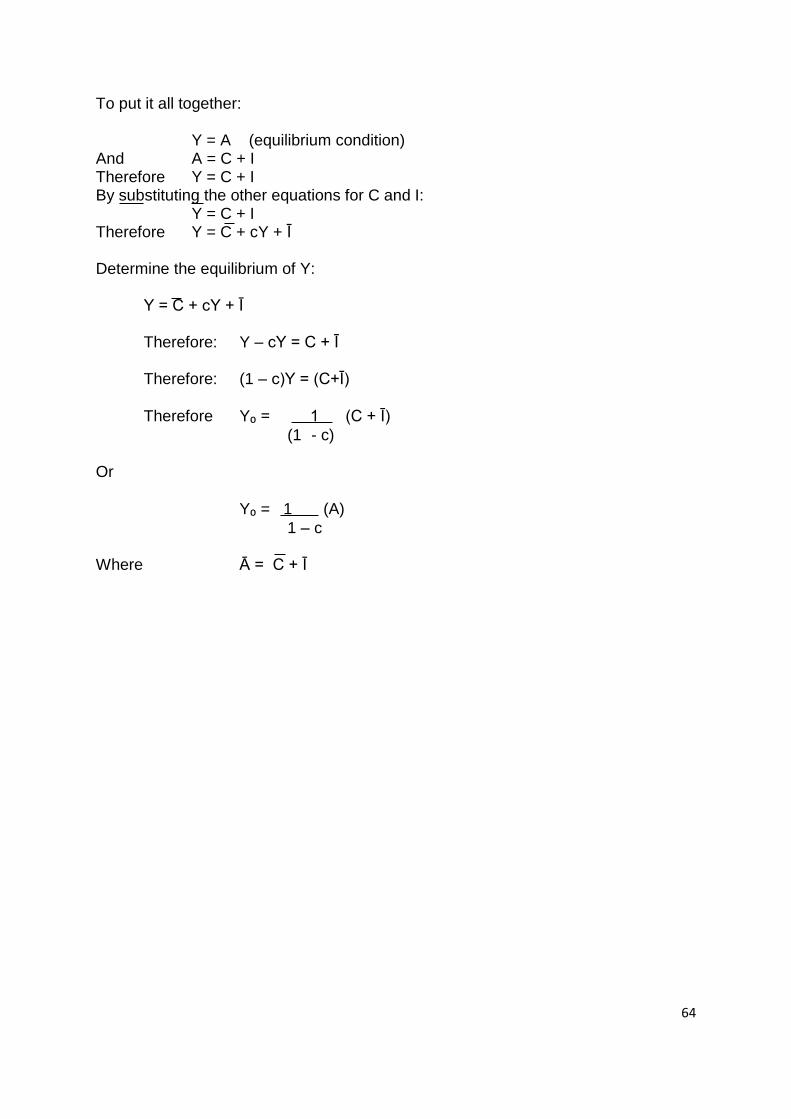
64
To put it all together:
Y = A (equilibrium condition) And A = C + I Therefore Y = C + I By substituting the other equations for C and I:
Y = C + I Therefore Y = C + cY + Ī Determine the equilibrium of Y:
Y = C + cY + Ī Therefore: Y – cY = C + Ī Therefore: (1 – c)Y = (C+Ī)
Therefore Y₀ = 1 (C + Ī)
(1 - c) Or
Y₀ = 1 (A)
1 – c
Where Ā = C + Ī

65
I am able to show on a diagram the level of autonomous spending, the marginal propensity to consume and the equilibrium level of income Figure 18-8 FIGURE 18-8 The equilibrium level of income A = Y A =200+4/5Y Ī = 150 1000 E C=50+4/5 Y 4 5 200 150 I = Ī 100 50
45° Y
0 1000 Total production, income
The figure shows the consumption function C = 50 + 4/5Y, the investment function I = 150, the aggregate spending function, A = 200 + 4/5Y and the equilibrium condition Y = A. The equilibrium level of income is determined by the intersection of the A curve and the 45-degree line at point E. The equilibrium level of income in this case is therefore 1 000. At levels of Y lower than 1 000 there is excess demand and at levels of Y higher than 1 000 there is excess supply
6.7 The multiplier I am able to define the multiplier It is the ratio between the eventual change in income and initial investment amount. The size of the multiplier depends on the fraction of the additional income generated in each round that is spent in the next round, that is, on the marginal propensity to consume (c) In economics, a multiplier is a factor of proportionality that measures how much an endogenous variable changes in response to a change in some exogenous variable. That is, suppose a one-unit change in some variable x causes another variable y to change by M units. Then the multiplier is M. Total increase in income can be expressed as: ΔY = 1 (ΔI) 1 – c
Agg
rega
te S
pen
din
g
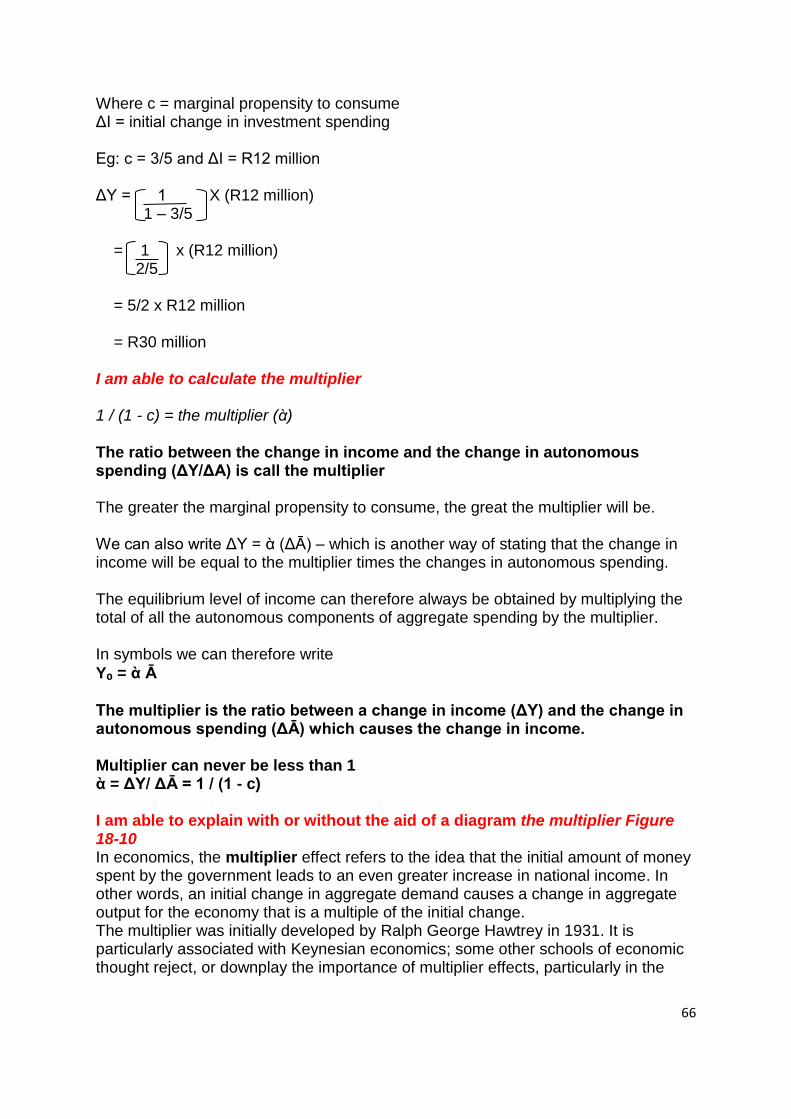
66
Where c = marginal propensity to consume ΔI = initial change in investment spending Eg: c = 3/5 and ΔI = R12 million ΔY = 1 X (R12 million) 1 – 3/5 = 1 x (R12 million) 2/5 = 5/2 x R12 million = R30 million I am able to calculate the multiplier 1 / (1 - c) = the multiplier (ὰ) The ratio between the change in income and the change in autonomous spending (ΔY/ΔA) is call the multiplier The greater the marginal propensity to consume, the great the multiplier will be. We can also write ΔY = ὰ (ΔĀ) – which is another way of stating that the change in income will be equal to the multiplier times the changes in autonomous spending. The equilibrium level of income can therefore always be obtained by multiplying the total of all the autonomous components of aggregate spending by the multiplier. In symbols we can therefore write
Y₀ = ὰ Ā
The multiplier is the ratio between a change in income (ΔY) and the change in autonomous spending (ΔĀ) which causes the change in income. Multiplier can never be less than 1 ὰ = ΔY/ ΔĀ = 1 / (1 - c) I am able to explain with or without the aid of a diagram the multiplier Figure 18-10 In economics, the multiplier effect refers to the idea that the initial amount of money spent by the government leads to an even greater increase in national income. In other words, an initial change in aggregate demand causes a change in aggregate output for the economy that is a multiple of the initial change. The multiplier was initially developed by Ralph George Hawtrey in 1931. It is particularly associated with Keynesian economics; some other schools of economic thought reject, or downplay the importance of multiplier effects, particularly in the

67
long run. The multiplier has been used as an argument for government spending or taxation relief to stimulate aggregate demand. I am able to show on a diagram the multiplier Figure 18-10 A = Y
A₂ = A₁ + ΔĀ
E₂ A₁
E₁ Ā₂ ΔĀ
Ā₁ 45° ΔY Y
0 Y₁ Y₂
Total production, income
The paradox of thrift: If all households start saving a greater proportion of their income, aggregate spending and income will fall.
STUDY UNIT 7
Keynesian models including the government and the foreign sector Economic theory has three purposes:
To explain what is happening in the economy
To predict what will happen if something changes
To help us to analyse economic policy.
How does gov spending G and taxes T affect A (aggregate spending), a (the multiplier) and Y (equilibrium income)?
Gov spending and taxes are also essential ingredients of the budget, and are the main instruments in fiscal policy
I am able to define fiscal policy Decisions by the President and Congress, usually relating to taxation and government spending, with the goals of full employment, price stability, and economic growth.
Ag
gre
ga
te S
pen
din
g

68
Government spending is essentially a political issue. I am able to explain the impact of the introduction of government spending on aggregate spending, the multiplier and the equilibrium level of income
Increases the level of aggregate spending A
Leaves the multiplier a unchanged
Raises the equilibrium level of income Y₀, cet par
There is no systematic relationship between G and Y – expressed in symbols as: G = Ḡ Ḡ - the stripe indicates that G is autonomous with respect to Y. Increases in government spending can be used to raise the level of production and income. Direct method Government spending on goods and services (G) has to be added to the other components of aggregate spending, consumption spending (C) and investment spending (I). Aggregate spending thus becomes: A = C + I + G G is autonomous and hence affects the position of the A curve but the slope remains unchanged. Government spending does not affect the multiplier. Government spending increased the equilibrium level of income, cet. Par. To calculate the equilibrium level of income Y: Y₀ = 1 / 1 – c (C + Ī + Ḡ)
General formula still remains : Y₀ = ὰ (Ā)
Where Y₀ = equilibrium level of income
ὰ = Multiplier Ā = total autonomous spending Taxes reduces the disposable (or after-tax) income of households, with the result that household can afford to purchase fewer goods and services than before which indirectly causes consumption spending by households (C) to decrease. What determines the level of taxes? Taxes are not autonomous. There is a link between taxes (T) and Income (Y). Taxes are a certain portion (t) of income Y – this proportion is called the Tax rate. T = tY Example: tax rate t = 0.2 we have T = 0.2Y – which means that 20 % of the total income in the economy (or 20cent of each Rand) has to be paid to the government in the form of taxes. In the economy as a whole we have a fixed tax rate (proportional tax). During the year taxes T for the economy as a whole are a certain proportion of income Y – T/Y = t or T = tY. Disposable income = Yd = Y – T Since T = tY We can also write: Yd = Y – tY or Yd = (1 - t) Y

69
As households can only spend their disposable income, the consumption function is: C = C + cYd or C = C + c(1 – t)Y The introduction of a proportional tax thus reduces the size of the multiplier. Multiplier with taxes: 1 1 – c(1 – t) Since income tax is a leakage, it reduces the equilibrium level of income, ceteris paribus. I am able to explain the impact of the introduction of a proportional income tax on - private consumption expenditure is reduced (disposable income) - leaves autonomous spending Ā unchanged - the multiplier is reduced - reduces the equilibrium level of income Y₀, ceteris paribus.
I am able to explain the difference between income and disposable income
With the introduction of a proportional income tax, households cannot spend all their income. They first have to pay tax. The difference between income earned and tax paid is disposable income

70
I am able to show on a diagram the impact of the introduction of a proportional income tax on private consumption expenditure – Figure 19-4 Figure 19-4 The impact of the introduction of taxes on the consumption function C C = C + cY C = C + cYd = C + c(1 – t) Y C 0 Y Total income The original consumption function is given by C = C + cY. With the introduction of a proportional income tax, households cannot spend all their income. They first have to pay tax. The difference between income earned and tax paid is disposable income Yd. The new consumption function is lower than the previous one, except at income level zero, where tax is also zero. The consumption function therefore becomes flatter, as indicated by C = C + c(1 – t)Y. Government spending is an injection into the circular flow and it raises the level of aggregate spending (A) at each level of income. Tax represents a leakage from the flow. A proportional income tax reduces disposable income thus reducing consumption spending (C) at each positive level of income Y. – thus reduces the size of the multiplier. Algebraically we now have the following model: Y = A (equilibrium function) A = C + Ī + Ḡ (aggregate spending) C = C + c(1 – t) Y (consumption function) To obtain the equilibrium of level of income:
Y₀ = ὰĀ
All that changes when the government is introduced is:
Autonomous spending Ā has an additional component Ḡ and the multiplier becomes smaller – thus reducing induced consumption.
1
c
1 c(1 – t)
C
onsum
ption s
pend
ing

71
I am able to show on a diagram and explain without a diagam:
the impact of a change in government spending or a change in the tax rate on the equilibrium level of income – Figures 19-5 and 19-6
the impact of fiscal policy on the equilibrium level of income – Figures 19-5 and 19-6
Figure 19-5 The impact of government spending and a proportional income tax on the equilibrium level of income A = Y A A₂ = Ā₂ + cY
E₂ A₃ = Ā₂ + c(1 – t) Y
A₁ = Ā₁ + cY
E₃
Ā₂ c (1 – t) E₁ 1
G Ā₁
45° 0 Y₁ Y₃ Y₂ Y
Total income
The original aggregate spending curve prior to the introduction of government is indicated by A1. The equilibrium level of income is Y1. With the introduction of government spending the aggregate spending curve shirts parallel to A2. With the introduction of a proportional income tax, the aggregate spending curve becomes flatter, as indicated by A3. The eventual equilibrium level of income is indicated by Y3 Fiscal policy If the government wishes to increase the equilibrium level of income, it can increase G and/or decrease t. The increase in G will initially have a direct impact on aggregate spending A which will then be multiplied as a result of an increase in induced consumption spending. The decrease in t will increase the multiplier, will raise the equilibrium level of income in an indirect way by increasing disposable income and consumption at each level of income – raises induced consumption. If the government wishes to reduce the equilibrium level of income, it can decrease G and/or increase t. The equilibrium level of income y₀ is below full-employment level of income (Yf) and that the
government wishes to close this income gap by increasing its spending – this sets a multiplier process in motion – the increase in G must be less than the required increase in Y. Income gap = ΔY and the change in G by ΔG then:
1
Aggre
gate
spen
din
g

72
ΔY = ὰΔG Therefore: ΔG = ΔY / ὰ Figure 19-6 Fiscal policy in the simple Keynesian model A = Y
A₁ = C + I + G₁
E₁
A₀ = C + I + G₀ Ā₁ ΔG E₀ Ā₀ Δ Y 45° 0 Y
Y₀ Yf
Total Income
The original equilibrium level of income (with aggregate spending at A₀) is Y₀ which is lower than the
full-employment level of income Yf. Government can close the gap between Y₀ and Yf (ΔY) by raising
government spending from ΔG - G₀ to G₁. The increase in income is greater than the income in
government spending, because of the effect of the multiplier
Introducing the foreign sector into the model: the open economy
The impact of imports and exports: Imports reduce the size of the multiplier Exports do not affect the size of the multiplier Aggregate spending function increases when net exports are added.
Exports (X) South africa’s exports depend largely on economic conditions in the rest of the world, our international competitiveness, and exchange rates. Exports X are autonomous with respect to total income Y X = Ẍ Introduction of exports X thus increases aggregate spending (A) on domestic production, ceteris paribus. – subject to multiplier effect, but does not affect the size of the multiplier. (leaves the slope of the A curve unchanged)
Imports (Z) Positive relationship between domestic economic activity and imports is one of the strongest macroeconomic relationships in the South African economy.
Aggre
gate
spen
din
g
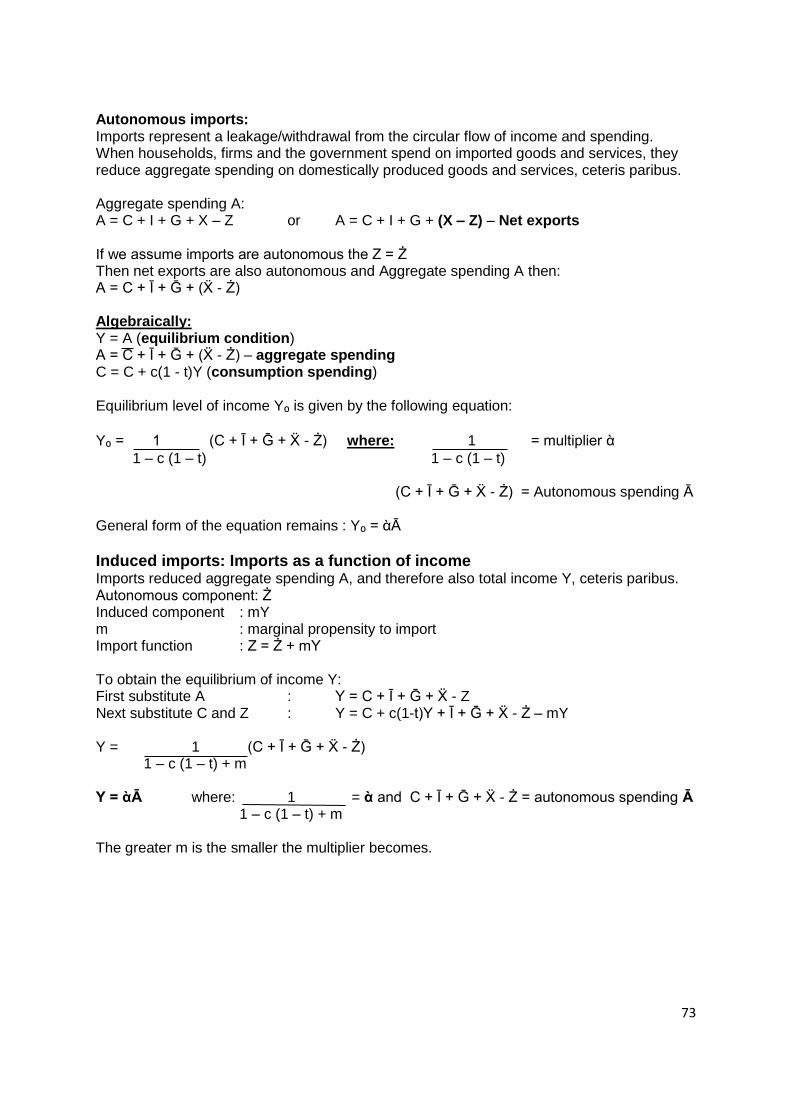
73
Autonomous imports: Imports represent a leakage/withdrawal from the circular flow of income and spending. When households, firms and the government spend on imported goods and services, they reduce aggregate spending on domestically produced goods and services, ceteris paribus. Aggregate spending A: A = C + I + G + X – Z or A = C + I + G + (X – Z) – Net exports If we assume imports are autonomous the Z = Ż Then net exports are also autonomous and Aggregate spending A then: A = C + Ī + Ḡ + (Ẍ - Ż) Algebraically: Y = A (equilibrium condition) A = C + Ī + Ḡ + (Ẍ - Ż) – aggregate spending C = C + c(1 - t)Y (consumption spending) Equilibrium level of income Y₀ is given by the following equation:
Y₀ = 1 (C + Ī + Ḡ + Ẍ - Ż) where: 1 = multiplier ὰ
1 – c (1 – t) 1 – c (1 – t) (C + Ī + Ḡ + Ẍ - Ż) = Autonomous spending Ā General form of the equation remains : Y₀ = ὰĀ
Induced imports: Imports as a function of income Imports reduced aggregate spending A, and therefore also total income Y, ceteris paribus. Autonomous component: Ż Induced component : mY m : marginal propensity to import Import function : Z = Ż + mY To obtain the equilibrium of income Y: First substitute A : Y = C + Ī + Ḡ + Ẍ - Z Next substitute C and Z : Y = C + c(1-t)Y + Ī + Ḡ + Ẍ - Ż – mY Y = 1 (C + Ī + Ḡ + Ẍ - Ż) 1 – c (1 – t) + m Y = ὰĀ where: 1 = ὰ and C + Ī + Ḡ + Ẍ - Ż = autonomous spending Ā 1 – c (1 – t) + m The greater m is the smaller the multiplier becomes.

74
I am able to show on a diagram and explain with or without the aid of a diagram the impact of changes in exports and imports on the equilibrium level of income – Figure 19-8 Figure 19-8 The impact of autonomous net exports A = Y
A₂ = A₀ + (Ẍ-Ż)₂ E₂
A₀ = C+I+G
A₁ = A₀ + (Ẋ-Ż)₁
Ā₂ E₀
Ā₀ E₁ Ā₁
45°
0 Y₁ Y₀ Y₃ Total Income
In (a) we show that autonomous net exports can be positive or negative. Prior to introduction of the foreign sector, aggregate spending is A0, and equilibrium is at E0, corresponding to an equilibrium level of income of Yo. This is showing in (b). If autonomous net exports are negative, the aggregate spending curve shifts parallel downwards tom A0 to A1, and the equilibrium level of income falls to Y1. If autonomous net exports are positive, the aggregate spending function shifts parallel upward from A0 to A2, and the equilibrium level of income increase to Y2
You will also need to be able to calculate - autonomous spending - the multiplier - the equilibrium level of income - the required change in government spending to achieve full employment - The budget deficit. The introduction of the government spending increase autonomous aggregate spending and raises the equilibrium level of income, ceteris paribus and has a multiplier effect on income but does not affect the size of the multiplier. The introduction of a proportional income tax reduces the size of the multiplier and therefore reduces the equilibrium level of income, ceteris paribus – affects spending and income indirectly via its influence on disposable income. Exports are an injection into the flow if income and spending. Increase autonomous aggregate spending and raises equilibrium level of income. Imports are a leakage form the domestic flow of income and spending. If autonomous – multiplier remains unchanged if positively related to income, the multiplier decreases.
A
ggre
gate
Spen
din
g

75
Study Unit 8: MORE MACROECONOMIC THEORY AND POLICY: The aggregate demand-aggregate supply model: The AD (aggregate-demand)-AS (aggregate-supply) serves as a guide to policy-making. Deals with the general level of prices in the economy (eg: consumer price index), instead of the price of a particular good or service, and the total production of goods and services (eg: gross domestic product).
The assumptions of the simple Keynesian and AD-AS models
Assumptions in Keynesian models Assumptions in AD-AS model Implications for AD-AS model
Prices are given
Wages are given
The money supply and interest rates are given
Spending (demand) is the driving force that determines the level of economic activity; supply adjusts passively to demand.
Prices are variable
Wages are variable
Interest rates are variable and the money supply can change
The level of economic activity is determined by the interaction of aggregate supply and aggregate demand.
The model can be used to study inflation
Aggregate supply can change independently from aggregate demand; the impact of changes in the general level of wages on production, income, employment (and unemployment) and inflation can be analysed.
The model can be used to study the impact of changes in the monetary sector, including monetary policy
Changes can originate on both the supply and demand side of the economy and the interaction between the two always has to be taken into account.
The decrease in the price level will be accompanied by an increase in total real expenditure (or the total quantity demanded) and that an increase in the price level will give rise to a decrease in total real expenditure (or the aggregate quantity demanded), ceteris paribus. The increase in the price level will give rise to an increase in real production supplied (or the aggregate quantity supplied) and a decrease in the price level will lead to a fall in real production (or the total quality supplied). What determines the position:
Changes in any of these non-price determinants or aggregate demand and aggregate supply will give rise to shifts of the curves.
The aggregate demand curve: Determined by everything that influences total expenditure (A) in the economy. Include: C, I, G, T, X, Z. As well as all factors which influence these. Most important factor = Interest rate (i) – which influences consumption and investment spending. Along with government spending and taxes (the basic instruments of fiscal policy) the interest rate (the basic instrument of monetary policy) is an important policy variable which influences aggregate demand in the economy. An expansionary fiscal policy (an increase in government spending G and/or a decrease in taxes T) will increase aggregate demand in the economy at each price level and this can be illustrated by rightward shift of the AD curve. Contractionary fiscal policy (a decrease in G and/or an increase in T) can be illustrated by a leftward shift of the AD curve – increase in the repo rate is illustrated by a leftward shift of the AD curve.
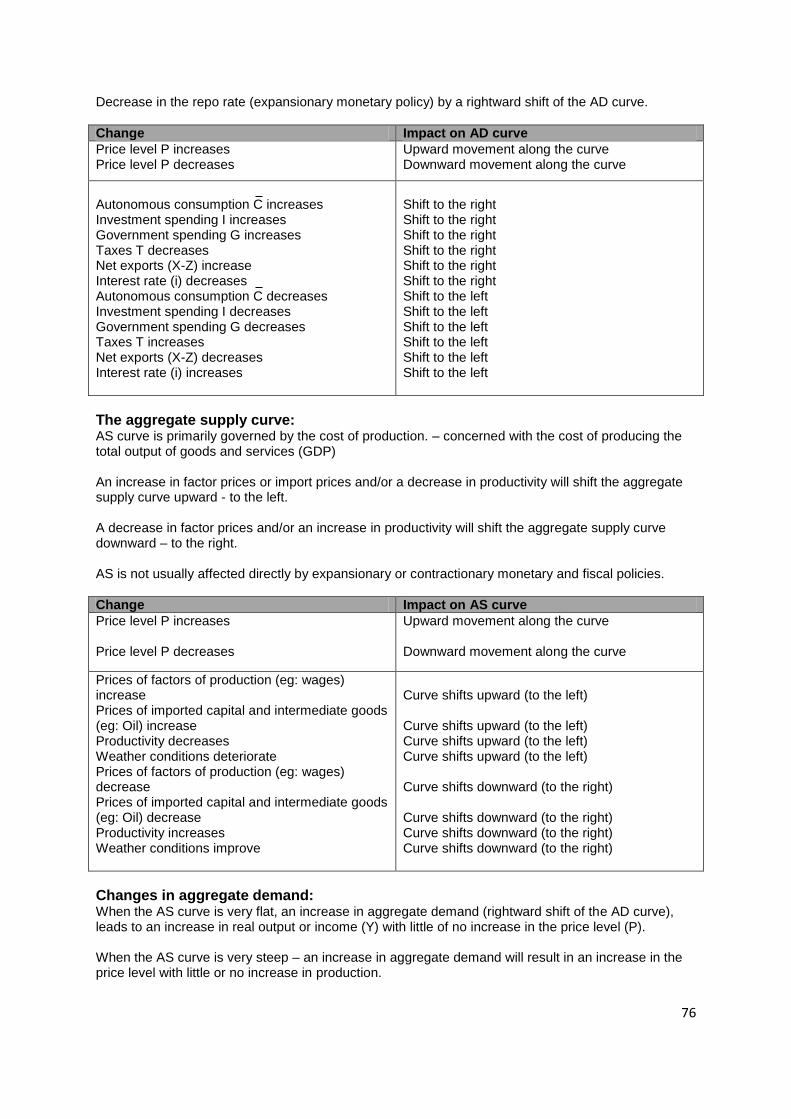
76
Decrease in the repo rate (expansionary monetary policy) by a rightward shift of the AD curve.
Change Impact on AD curve
Price level P increases Price level P decreases
Upward movement along the curve Downward movement along the curve
Autonomous consumption C increases Investment spending I increases Government spending G increases Taxes T decreases Net exports (X-Z) increase Interest rate (i) decreases Autonomous consumption C decreases Investment spending I decreases Government spending G decreases Taxes T increases Net exports (X-Z) decreases Interest rate (i) increases
Shift to the right Shift to the right Shift to the right Shift to the right Shift to the right Shift to the right Shift to the left Shift to the left Shift to the left Shift to the left Shift to the left Shift to the left
The aggregate supply curve: AS curve is primarily governed by the cost of production. – concerned with the cost of producing the total output of goods and services (GDP) An increase in factor prices or import prices and/or a decrease in productivity will shift the aggregate supply curve upward - to the left. A decrease in factor prices and/or an increase in productivity will shift the aggregate supply curve downward – to the right. AS is not usually affected directly by expansionary or contractionary monetary and fiscal policies.
Change Impact on AS curve
Price level P increases Price level P decreases
Upward movement along the curve Downward movement along the curve
Prices of factors of production (eg: wages) increase Prices of imported capital and intermediate goods (eg: Oil) increase Productivity decreases Weather conditions deteriorate Prices of factors of production (eg: wages) decrease Prices of imported capital and intermediate goods (eg: Oil) decrease Productivity increases Weather conditions improve
Curve shifts upward (to the left) Curve shifts upward (to the left) Curve shifts upward (to the left) Curve shifts upward (to the left) Curve shifts downward (to the right) Curve shifts downward (to the right) Curve shifts downward (to the right) Curve shifts downward (to the right)
Changes in aggregate demand: When the AS curve is very flat, an increase in aggregate demand (rightward shift of the AD curve), leads to an increase in real output or income (Y) with little of no increase in the price level (P). When the AS curve is very steep – an increase in aggregate demand will result in an increase in the price level with little or no increase in production.

77
Changes in aggregate supply: Stagflation: stagnation plus inflation Can be caused by any other factor which causes general increase in production costs in the economy. Egs: increase in wages and salaries without corresponding increases in productivity, decreases in productivity, increased profit margins and increases in the prices of other important inputs. Upward shifts of the AS curve are referred to as supply shocks. Expansionary fiscal or monetary policies increase aggregate demand and therefore production, income and employment – but at the same time price levels increase even further. Demand management policies can be used to counteract the effects of a supply shock on production, income and employment but only at the cost of even higher inflation. A solution to a supply shock is to take steps to lower costs of production. An anti-inflationary incomes policy is required – the aim is to establish a balance between the growth in incomes and the growth in productivity.
The monetary transmission mechanism: Monetary transmission mechanism – the way in which changes in the monetary sector are transmitted to the rest of the economy. Exogenous – under the control of the monetary authorities Money supply is Endogenous – in the sense being that it is determined by the interaction between the interest rate and the demand for money. The monetary transmission mechanism starts with a change in interest rates, not a change in the money supply. When the MPC (Monetary Policy Committee) of the SARB (south African reserve bank) adjust the repo rate – all other short-term interest rates (eg: overdraft rates of the banks) change in the same direction. A key element of the transmission mechanism is the relationship between the interest rate (i) and investment spending (I), which is an important component of aggregate spending (A) and aggregate demand (AD). The transmission mechanism in symbols: ∆i →∆I →∆A→∆Y A change in the interest rate leads to a change in investment spending, a change in aggregate spending and a change in total production or income. An increase in aggregate spending (A) – which causes an increase in aggregate demand (AD), now results in increases in the price level (P) as well as total real production and income (Y). The introduction of variable prices reduces the size of the multiplier. The monetary transmission mechanism with variable prices and wages: ∆Y ∆i →∆I →∆A→∆AD ∆P A change in interest rates leads to a change in investment spending, a change in aggregate spending and a change in aggregate demand. The change in aggregate demand results in a change in total production or income and a change in the price level. The split between ∆Y and ∆P depends on aggregate supply conditions in the economy (represented by the slope of the AS curve) Important links in the monetary transmission mechanism:
Link between interest rate and investment spending

78
Link between aggregate demand (on the one hand) and the price level and total production or income (on the other)
The smaller the interest elasticity of investment demand, and also the steeper the AS curve, the less effective and expansionary monetary policy will be as means of stimulating the economy. The steeper the AS curve, the more effective a contractionary monetary policy will be as a means of combating inflation.
Monetary and fiscal policy in the AD-AS framework: Expansionary and contractionary monetary and fiscal (demand management) policies: An expansionary monetary policy: implements with the central bank reduces the interest rate (eg: repo rate) at which it provides credit to the banks. In the AD-AS model this is illustrated by a rightward shift of the AD curve. Monetary policy is contractionary when the central bank raises the interest rate – illustrated by a leftward shift of the AD curve. An expansionary fiscal policy: is applied when the government increases government spending (G) and/or reduces taxes (T) – rightward shift of the AD curve Fiscal policy is contractionary when government spending is reduces and/or taxes are increased – leftward shift of the AD curve. Monetary and fiscal policy can also be neutral. – Not aimed at increasing or decreasing aggregate demand in the economy.
Monetary and fiscal policy lags:
1. Recognition lag (inside lag) – lag between changes in economic activity and recognition or realisation that the changes have occurred. Is the same for monetary and fiscal policy.
2. The decision lag (inside lag) – fiscal policy: ministers and officials from different departments have to meet to discuss matters and this takes time (announced only once a year in budget speeches by the Minister of Finance. Monetary policy: usually much shorter – decisions taken in a day or two.
3. Implementation lag (inside lag) – once decisions have been made it takes time to implement them. Fiscal policy: takes a long time to approve and implement changes.eg: adjusting income tax rates – only adjusted annually. Monetary Policy: is very short. Eg: repo rate changes are immediately implemented.
4. Impact lag (outside lag) – a further period lapses before they actually affect economic behaviour. Fiscal policy: eg: increase in taxes will not have its full impact on the economy immediately. Monetary Policy: is very long (estimated to be between 12 – 18 months (even up to 24) for a change in the repo rate to have its full impact on process, production, income and employment.
Inside lag – the delay from the time a need for action arises until the appropriate polices are implemented. A balanced budget refers to a situation in which all government spending is financed by taxes that is where the budget deficit is zero.
The relative effectiveness of monetary and fiscal policy: Fiscal policy has generally been more successful in stimulating a depressed economy, while monetary policy can be employed with greater assurance to dampen an overheated economy in when inflationary pressures are severe.
79
To achieve macroeconomic objectives such as economic growth and price stability, - a suitable combination of the different types of policy instruments has to be applied. The policy dilemma in an open economy: The balance of payments constraint: When exports and imports are taken into account Balance of payment considerations can complicate policy-making n an open economy, particularly if there is a persistent deficit on the financial account of the balance of payments.
Study Unit 9: INFLATION
Definition of inflation: Inflation is defined as a continuous and considerable rise in prices in general. Four aspects of this definition are:
Neutral definition: which does not attempt to define inflation in terms of specific causes. o Allows for all possible causes of inflation to be taken into account.
Casual definitions: definitions that highlight a particular cause of inflation and therefore excluding all other possible causes.
o Can result in formulation of inappropriate polices for fighting inflation
Process: Inflation refers to a process on which the prices of most goods and services are increasing from year to year (continuous increase)
Considerable: inflation is concerned with a considerable increase in prices.
In general: Inflation refers to an increase in prices in general. (there is inflation when the prices of most goods and services in the economy are increasing.
The measurement of inflation: The consumer price index: Measurement of inflation:
Month on the same month during the previous year: CPI (consumer price index) – most commonly used indicator of the general price level. Headline CPI: unadjusted CPI. Once we have a set of CPI figures we can calculate the inflation rate. – done by calculating the percentage change in the CPI from one period to the next. Inflation is always expressed as an annual rate. (eg: inflation rate of 10%, this means that prices are increasing at a rate of 10% per year.) CPI is estimated and published monthly. For any particular year there are therefore 12 figures. Calculation is as follows = index for a particular month for one year is compared to the same month of a previous year divided by the previous year figure x 100 X – Y
Y x 100 = %
Inflation calculated in this way is subject to considerable fluctuations and not all prices are measured every month. Therefore the Reserve Bank uses to CPIX to calculate their inflation target.
Annual average on annual average: Comparison of the average of all the monthly indices in a particular year with the corresponding average for the previous year.
aX – aY aY x 100 = % This way the short-term fluctuations in the index figures for particular months are eliminated. This measure gives a better indication of the inflation processes over a longer period.

80
Core inflation: The main objective of estimating core inflation is to capture the underlying inflationary pressures in the economy. Core inflation is estimated by excluding items for the CPI basket on the basis that their prices are highly volatile, subject to temporary influences or affected by government intervention and policy. Excluded items are as follows:
Fresh and frozen meat and fish (prices may be highly volatile)
Fresh and frozen vegetable and fresh fruit and nuts (prices may be highly volatile)
Interest rates on mortgage bonds and overdrafts/personal loans (excluded to eliminate the effects of changes in monetary policy)
Value added tax (VAT) (to eliminate the distorting effects of changes in vat)
Assessment rates (since they are determined by local government) The CPIX: The rate calculated on the basis of the CPI for metropolitan and other urban areas but excluding mortgage interest rates from the basket. The production prices index (PPI): PPI measures prices at the level of the first significant commercial transaction. Eg: the prices of imported goods are measured when they enter the country and not when they are sold to the customer.
Main differences between the CPI and PPI
Consumer price index Production price index
Pertains to cost of living Basket consists of consumer goods and services Capital and intermediate goods excluded Prices include VAT Interest rates taken into account Prices of imported good not shown explicitly
Pertains to cost of production Basket consists of goods only (no services) Capital and intermediate goods included Prices exclude VAT Interest rates excluded Prices of imported goods shown explicitly
Useful feature of the PPI:
Distinction drawn between goods produced in South Africa and imported goods.
The implicit GDP deflator: By using a variety of complicated techniques the national accountants at statistics South Africa and the South African Reserve Bank then transform GDP at current prices (nominal GDP) to GDP at constant prices (real GDP) – done to eliminate the effects of inflation. Real GDP measures GDP in terms of the prices ruling a certain base year (at constant prices) – basis of calculating economic growth. Implicit GDP deflator: index that can be used to calculate an inflation rate. (Implicit index since it is a side-effect of the calculation of economic growth.) The difference between nominal GDP and real GDP yields an index which we can use to calculate an inflation rate for the economy as a whole. The ratio between nominal and real GDP is call the GDP deflator. The GDP deflator or the inflation rate is obtained as follows: GDP at current prices GDP at constant prices x 100 = GDP deflator

81
Inflation rate: GDP deflator for current year – GDP deflator for base year x 100% = inflation for current year GDP deflator for current year
The effects of inflation: Effects of inflation:
distribution effects – inflation benefits debtors (borrowers) at the expense of creditors (lenders) The difference between the nominal interest rate and the inflation rate is the real interest rate. If nominal interest rate < inflation rate = real interest rate is negative (the real value of the lenders wealth declines and the interest income received is not sufficient to compensate for inflation.) If real interest rate is positive then only wealth redistributed. Redistributed wealth applies to assets whose nominal value is fixed: eg:
o money o government securities o bonds o certain insurance polices o certain pensions.
Inflation tends to redistribute income and wealth from the elderly to the young. Significant redistribution from the private sector to the government. – Inflation always benefits the government – the government is always the debtor. When there is inflation taxpayers nominal incomes (eg: wages and salaries) rise even when their real incomes remain unchanged. Therefore if the income tax schedule remains unchanged, inflation raised the average rates of personal income tax. – Bracket creep: results in redistribution of income from taxpayers to the government.
Fiscal dividend: increase government revenue from taxation through inflation.
Economic effects – has various economic effects that may result in lower economic growth and higher unemployment than would otherwise have occurred. Inflation stimulates speculative practices that do not add to a country’s productive capacity. By reducing the value of existing savings, inflation may also discourage saving in traditional forms – fixed deposits and pension fund contributions. One of the most serious economic effects of inflation is that it can produce balance of payment problems.
Social and political effects –inflation has social and political consequences: price increases makes people unhappy and different groups then start blaming one another for increases in the cost of living Inflation is regarded as public enemy number one.
The greatest cost of inflation: Hyperinflation: when there is an expected increase in the rate of inflation, consumers tend to rush and buy things now instead of later – which puts further upward pressure on prices. This can lead to hyperinflation.

82
The causes of inflation: Demand-pull and cost-push inflation: Demand-pull inflation occurs when the aggregate demand for goods and services increases while aggregate supply remains unchanged. The excess demand pulls up the prices of goods and services. Demand pull inflation can be caused any one of the various components of aggregate demand:
Increase consumption spending by households (C) – as a result of a greater availability of consumer credit or the availability of cheaper credit as a result of a drop in interest rates.
Increased investment spending by firms (I) – as a result of lower interest rates or an improvement in business sentiment and profit expectations
Increase government spending (G) – to combat unemployment or to provide more or better services to the population at large.
Increased export earnings (X) – as a result of improved economic conditions in the rest of the world or because of increases in the prices of important export products.
All these causes of demand-pull inflation are accompanied by increases in the money supply. Demand pull is illustrated by a rightward shift of the AD curve. To combat demand-pull inflation, the authorities have to keep the aggregate demand for goods and services in check – done by applying restrictive monetary and fiscal policies.
Cost-push inflation: Cost-push inflation is triggered by increases in the cost of production – increases in production costs push up the price level: Five main sources of cost-push inflation:
Increase in wages and salaries: wages and salaries are the largest single cost item in an economy.
Cost of imported capital and intermediate goods: these goods are essential to the functioning of the domestic economy – particularly the manufacturing sector.
Increases in profit margins: When firms push up their profit margins they are therefore raising the cost of production.
Decreased productivity: if the various factors of production become less productive while still receiving the same remuneration, the costs of producing each unit of output increases.
Natural disasters: such as droughts or floods, which occur periodically. They raise the costs of production and the prices of agricultural and other related products.
Cost-push is reflected in an upward shift of the AS curve. Cost-push inflation has a negative impact on production, income and employment, this phenomenon is called Stagflation – since price increases (inflation) are accompanied by increased unemployment (stagflation) Cost-push inflation is caused by factors which push up the costs of production. To avoid cost-push inflation, increases in wages and salaries and profits therefore have to be kept under control. – Increases in productivity can also help avoid or combat cost-push inflation. One of the possible measures is to apply an incomes policy. The distinction between demand-pull and cost-push inflation - a first step in analysing inflation. Drawbacks:
It ignores possible linkages between aggregate demand and aggregate supply in the economy.
It can only explain changes in the price level and does not deal with the dynamic process of inflation.
83
Study Unit 10: Unemployment and the Phillips Curve Unemployment: Unemployment rate: The number of unemployed persons expressed as a percentage of the total number of people who are willing and able to work.
The unemployment pool: The level or rate of unemployment is a stock concept. There are continuous flows in and out of unemployment as people enter and leave the unemployment pool. Measuring unemployment: Strict definition: unemployed persons are those persons who, being 15 years and older, (a) are not in paid employment or self-employment, (b) were available for paid employment or self-employment during the seven days preceding the interview and (c) took specific steps during the four weeks preceding the interview to find paid employment or self-employment. Expanded definition: unemployed persons are those persons who, being 15 years and older, (a) are not in paid employment or self-employment, (b) were available for paid employment or self-employment during the seven days preceding the interview and The costs of unemployment: To the individual: a loss of income, shock and frustration. Loss to society: If labour is not used when it is available it is lost forever. Also gives rise to crime as well as demonstrations and riots. Types of unemployment:
Frictional unemployment: Arises because it takes time to find a job or to move from one job to another.
Seasonal unemployment: Arises because certain occupations require workers only for part of each year.
Cyclical (or demand-deficiency) unemployment: occurs when a slump or recession in the economy (as a result of a temporary lack of demand) gives rise to unemployment. Business cycle: periods of rapid increase in aggregate demand (booms) followed by periods of slower increase or decline. –sales drop and some workers lose their jobs because there is insufficient demand for the goods and services they produce.
Structural unemployment: usually confined to certain industries, sectors or categories of workers. Occurs when there is a mismatch between workers qualifications and job requirements – or when jobs disappear because of structural changes in the economy:
Eg: o Certain workers lack the necessary education, training or skills required o Changes in production methods or techniques (technologically unemployed) o Changing consumer preferences o Foreign competition o Structural decline in certain industries: closure of gold mines and the decline in gold
production o Discrimination
Policies to reduce unemployment: Unemployment rate originates from the supply side of the labour market and the demand side. Supply side: rapid population growth can be a significant cause of unemployment –
steps to limit population growth can be regarded as a part of the strategy to reduce unemployment. (long-term strategy)
Stricter immigration control can also be regarded as an element of a policy strategy to reduce unemployment.
Policies to improve quality of labour through education and training.
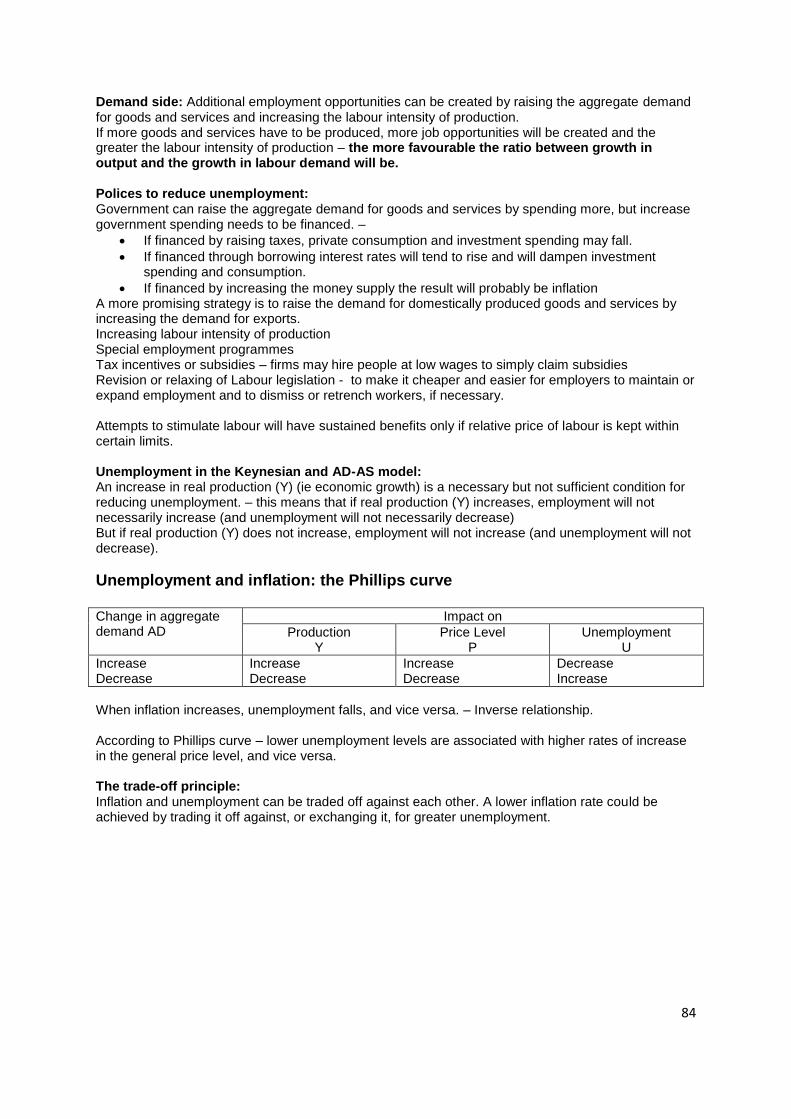
84
Demand side: Additional employment opportunities can be created by raising the aggregate demand for goods and services and increasing the labour intensity of production. If more goods and services have to be produced, more job opportunities will be created and the greater the labour intensity of production – the more favourable the ratio between growth in output and the growth in labour demand will be. Polices to reduce unemployment: Government can raise the aggregate demand for goods and services by spending more, but increase government spending needs to be financed. –
If financed by raising taxes, private consumption and investment spending may fall.
If financed through borrowing interest rates will tend to rise and will dampen investment spending and consumption.
If financed by increasing the money supply the result will probably be inflation A more promising strategy is to raise the demand for domestically produced goods and services by increasing the demand for exports. Increasing labour intensity of production Special employment programmes Tax incentives or subsidies – firms may hire people at low wages to simply claim subsidies Revision or relaxing of Labour legislation - to make it cheaper and easier for employers to maintain or expand employment and to dismiss or retrench workers, if necessary. Attempts to stimulate labour will have sustained benefits only if relative price of labour is kept within certain limits. Unemployment in the Keynesian and AD-AS model: An increase in real production (Y) (ie economic growth) is a necessary but not sufficient condition for reducing unemployment. – this means that if real production (Y) increases, employment will not necessarily increase (and unemployment will not necessarily decrease) But if real production (Y) does not increase, employment will not increase (and unemployment will not decrease).
Unemployment and inflation: the Phillips curve Change in aggregate demand AD
Impact on
Production Y
Price Level P
Unemployment U
Increase Decrease
Increase Decrease
Increase Decrease
Decrease Increase
When inflation increases, unemployment falls, and vice versa. – Inverse relationship. According to Phillips curve – lower unemployment levels are associated with higher rates of increase in the general price level, and vice versa. The trade-off principle: Inflation and unemployment can be traded off against each other. A lower inflation rate could be achieved by trading it off against, or exchanging it, for greater unemployment.

85
Study Unit 11: Economic growth Definition and measurement of economic growth: Economic growth is usually measured by determining the annual growth in real production or income. Production should be measured in real terms – means inflation should be eliminated. Figures should be adjusted for population growth – on a per capita basis. Positive economic growth only occurs when total real production or income is growing at a faster rate than the population Total real production is commonly represented by real gross domestic product (Real GDP) or real gross national income (GNI). Real GDP and real GNI means that the measurement is at constant prices.
Some problems associated with GDP: Non-market production: difficult to measure or estimate the value of activities that are not
sold in the market. Eg: farmers consumption of their own produce.
Unrecorded activity: transactions or activities in the economy that are never recorded. Eg: the informal sector.
Data revisions: original estimates are frequently adjusted as new and better data becomes available.
Economic welfare: unwanted by products (such as pollution, congestion and noise) are not taken into account. Economist argue that these bads should be subtracted from the value of goods included in the GDP.
Calculating economic growth: Four bases that are used:
Real GDP
Real GNI
Real GDP per capita
Real GNI per capita Sources of economic growth: These sources can be grouped together in two broad categories:
Supply factors
Demand factors Supply factors: Factors which cause an expansion in production capacity – potential output Relate to the factors of production: natural resources, labour, capital and entrepreneurship.
Natural resources: A country’s natural resources are fixed.
Labour: The size of the labour force depends on factors such as the size and the age and gender distribution of the population.
Capital: Capital widening: when capital stock is increased to accommodate an increasing labour force. Capital deepening: Occurs when the amount of capital per worker is increased. – when growth in stock of capital > growth in the number of workers. (increase in the capital intensity of production) The quality of capital is increased by applying new technology to capital equipment.
Entrepreneurship: The entrepreneur is the driving force behind economic growth.

86
Demand factors: An increase in the quantity and quality of the factors of production is not sufficient to ensure economic growth. There also has to be an adequate and growing demand for goods and services produced in the country. Three sets of demand factors:
Domestic demand: consumption (C), investment (I) and government spending (G) Inward industrialisation: growth strategy that is based on meeting the wants of the rapidly growing poor population in the urban areas in South Africa.
Export demand (X) Increase in exports raises the growth rate and also relives the balance of payments constraints.
Import substitution – involves attempts to reduce imports (z) by manufacturing previously imported goods domestically.
MULTIPLE Q & A FROM PAST ASSIGNMENTS AND EXAM PAPERS: 1. Most basic function of money is that it functions as a medium of exchange 2. when inflation is experienced , money loses some of its usefulness as a store of
value 3. The repo rate is the interest at which the reserve bank lends to commercial
banks. 4. the SARB is responsible for formulating monetary and fiscal policy 5. In terms of the money demand, the interest rate represents the opportunity cost
of holding money. 6. Government transaction can exert an influence on the money supply. 7. m1 = notes and coins + demand deposits 8. M3 is the most important comprehensive definition of money. 9. if government finances part of its spending from borrowing from the central bank ,
it is called inflationary financing 10. tax evasion is illegal 11. personal income tax is S.A is a direct , progressive tax 12. A tax is regressive if the marginal tax rate decreases as income increases. 13. criteria for good tax are neutrality , equity , compliance costs 14. excise taxes are levied on selected products produced locally 15. a specific tariff imposed on the imports of motor vehicles will increase the level of
domestic production of motor vehicles 16. The law of relative advantage states that 2 countries will benefit from trade if the
opportunity costs of production differ between the 2 countries. 17. One of the reasons for international trade is that all countries do not possess the
same factors of production. 18. The trade balance is the difference in the value of S.A merchandise exports plus
net gold exports and merchandise imports. 19. a farmer in free state buys a tractor from his neighbor – transaction not recorded
in BOP

87
20. In the simple Keynesian model equilibrium is attained where aggregate demand is equal to aggregate supply.
21. consumption spending consists of autonomous spending and induced spending 22. if the marginal propensity to save is 1/3 ,the marginal propensity to consume is
2/3 23. in the simple Keynesian model if aggregate demand exceeds aggregate supply
production must increase to reach equilibrium 24. Along the 45 degree line aggregate demand is equal to aggregate supply. 25. according to say’s law supply will create its own demand , at equilibrium there is
full employment 26. according to the Keynesian model equilibrium does not necessarily imply full
employment 27. if c = 2/3 then the multiplier is = 3 28. taxes decrease the size of the multiplier 29. if aggregate spending is 1200 and aggregate production is 1300 there is
unplanned increase in inventories 30. negative net exports will shift the aggregate demand curve downwards 31. if the equilibrium level of income is below the full employment level , full
employment can be reached by increasing autonomous consumption 32. a change in marginal propensity to consume will change the size of the multiplier 33. a decrease in the tax rate will increase induced consumption 34. Investment is negatively related to the interest rate. 35. government spending is independent of the level of income 36. an increase in income will increase induced consumption 37. imports are independent of the level of income 38. The equilibrium level of income is determined by multiplying the multiplier by
autonomous aggregate demand. 39. Negative net exports will shift the aggregate demand curve downwards. 40. autonomous aggregate demand – A = C + I + G + ( X – Z) 41. AD – AS model – the general price level and total production of goods and
services 42. the AD curve indicates the level of total expenditure at various price levels in the
economy 43. in the AD – AS curve model prices are assumed to vary 44. a decrease in the price of imported crude oil will reduce the costs of production
and the AS curve will shift to the right 45. the monetary transmission mechanism starts with a change in the interest rate 46. government spending and taxes are 2 basic instruments of fiscal policy 47. recognition , decision , implementation and impact lags are four types of policy
lags 48. a reduction in government spending is an example of contractionary fiscal policy 49. A decrease in the repo rate by the SARB is an example of expansionary
monetary policy. 50. a simultaneous increase in the price level and the level of production could be the
result of an increase in investment spending 51. inflation is the continuous and considerable increase in prices in general 52. demand-pull inflation can be caused by expansionary monetary and fiscal policy
measures 53. a depreciation of SA rand will increase the price of imported goods 54. cost-push inflation is triggered by increases in the cost of production 55. high inflation in SA can damage the countries international competitiveness 56. cost-push inflation leads to higher prices , decreased production and higher
unemployment 57. an increase in the aggregate demand for goods and services can reduce cyclical
unemployment 58. the costs of unemployment can be reduced through the availability of
unemployment benefits and other social welfare programmes 59. An increase in aggregate demand for goods and services can reduce cyclical
unemployment.

88
60. an unemployment steam locomotive driver is a victim of structural unemployment 61. seasonally unemployment – only employed during a specific season (life guard
that works during summer) 62. frictionally unemployed – one quits a job in one place to find another job in a
different place 63. voluntarily unemployed – not bothered to find a job 64. demand factors is one of the major sources if economic growth 65. when measuring economic growth changes in prices and population should be
taken into account 66. economic development and economic growth are both particularly important
issues in SA 67. real GDP is obtained by adjusting nominal GDP for inflation 68. GDP per capita is calculated by multiplying GDP by the number of people in the
population 69. If real GDP increased by 5% from one year to the next, SA undoubtedly
experienced economic growth during this period. 70. a flow variable is measured over specific period 71. stocks can change as a result of flows 72. in the circular flow of income and spending savings result in a decrease in the
volume of the income flow 73. financial institution acts as intermediary between those who save and those who
wish to invest 74. provincial government = government 75. macroeconomic objectives = external stability , full employment , economic
growth , equitable distribution of income and price stability 76. GDP defined as the value of all final goods and services produced in the
domestic economy during a specific period 77. 3 ways of calculating GDP = income , expenditure and production methods 78. only transactions that represent production of new goods and services are
included in the GDP 79. When prices increase nominal GDP increases even if the production of new
goods and services does not increase. 80. if nominal GDP increases by 5% GDP at current prices will also increase by 5% 81. BOP = all transactions with the rest of the world are recorded here. 82. The balance of payments is an important indicator of the state of an economy. 83. when constructing the Lorenz curve the cumulative percentage if the population
is plotted against the cumulative percentage f income 84. the higher the Gini coefficient the higher the income inequality 85. money serves as a medium of exchange , unit of account and store of value 86. modern bank notes value of exchange is based on confidence 87. banks can create demand deposits by granting credit to their clients in the form of
overdraft facilities 88. When person deposits cash in a cheque account there is no immediate change in
the quantity of money. 89. The demand for money for speculation purposes is determined by the interest
rate. 90. the demand for money is a function of income and the interest rate in general
terms the liquidity preference may be expressed as L=f(Y,I ) 91. the supply of money is determined by demand for money and the interest rate 92. open market policy – the purchase and sale of financial assets to and from the
banks by the SARB 93. the difference between government spending and borrowing is called the budget
deficit 94. taxes which distort relative prices are not neutral 95. tax is regressive when everyone pays the same amount of tax 96. the degree to which the burden of a tax can be shifted depends on the price
elasticities of demand and supply of the good or services in question 97. the government prefers levying excise taxes on the consumption of goods with a
high elasticity of demand

89
98. the purpose for the introduction of an import tariff is to serve as a source of income to the government
99. a country balance of payments can afford a deficit on the current account if there is a positive balance on the financial account
100. an increase in the supply of dollars in the South African foreign exchange market can be caused by an increase in the gold prices
101. 4 components of aggregate demand is investment , government expenditure , consumption spending and net exports
102. the AD curve indicates the level of total expenditure at various price levels in the economy
103. if real GDP increases and price level remains stable , it is likely that both aggregate demand and aggregate supply have increased
104. the monetary transmission mechanism explains how changes in the monetary sectors is transmitted to the financial sector
105. recognition lag is the same for fiscal and monetary policy 106. inflation means buying less with your money now than before prices
increased 107. purchasing power of a consumer’s income is inversely related with inflation 108. if the inflation rate is lower than the nominal interest rate , it is likely that
wealth will be redistributed from the borrower to the lender 109. fiscal dividend – during inflation government realizes increased revenue from
taxation 110. stagflation refers to an increase in the general price level and a decrease in
the level of output 111. unemployment includes everybody who are willing and able to work but do
not have a job 112. improvements in quality of labour can reduce structural unemployment in S.A 113. to combat unemployment steps must be taken to stimulate the demand for
labour 114. stricter immigration control could help to combat the unemployment problem
in S.A 115. imports and savings represent a withdrawal from the circular flow of income
and spending 116. GDP – the total value of all final goods and services produced in a country
during a particular period 117. example of GDP – the wages of a foreigner working at a S.A platinum mine 118. gdp can be estimated by calculating the total of all factor incomes 119. an inflation rate is calculated as the percentage change in a price index from
one period to another 120. the weights used in the calculation of the consumer price index take account
of the relative importance f different goods in the pattern of consumer expenditure 121. the real value of money is measured in terms of what it can purchase 122. a R650 price tag on a pair of shoes is an example of money functioning as a
unit of account 123. the repo rate is interest rate at which the reserve bank lends to commercial
banks 124. VAT systems important purpose is raising government revenue 125. personal income tax in S.A is a direct,progressive tax 126. the burden of an indirect tax on a good will fall more heavily on the producer
when demand for the good is price elastic 127. in order for a nation to gain from trade it must have a relative advantage in
the production of a particular product 128. an expected decline of the value of the rand relative to the dollar is likely to
increase the demand for US dollar 129. if the rand depreciates against the dollar the balance on the current account
of S.A balance of payments will improve 130. autonomous investment menas that investment is independent of the level of
income

90
131. if aggregate spending exceeds aggregate production in the simple Keynesian model unplanned decrease in inventories will occur
132. a drecrease in the budget surplus will lead to an increase in the level of economic activity
133. in the simple Keynesian model induced consumption is a function of the income level
134. in the simple Keynesian model with a government and foreign sector government spending is autonomous because it is essentially a political issue
135. the assumptions of the AD-As model imply that the model can be used to study monetary policy
136. in the AD-AS model a decrease in investment will result in a decrease in the price level
137. cost push inflation can be reduced by increasing productivity 138. stagflation refers to an increase in the price level accompanied by decreases
in real output and employment 139. the government can worsen inflationary situation if it borrows more from the
reserve bank to finance its expenditure 140. debtors tend to benefit during an inflationary period since the real value of
their debt tends to fall 141. cyclical employment refers to employment which occurs during recessions 142. the opportunity cost involved when a country takes fiscal policy measures to
stimulate economic growth is an increase in the inflation rate 143. an expansionary fiscal policy would be most likely to reduce unemployment
of the marginal propensity to save is low 144. a business cycle refers to a recurring sequence of changes in business
activity Questions from past exam papers:
1. name the 3 major flows in the economy - total production, total income and total spending.
2. list 3 basic functions of money - Medium of exchange - Money serves as a lubricant or intermediary to smooth the process of exchange and to make it more efficient. Money as a unit of account – is an agreed measure for stating the prices of goods and services. Money as a store of value – most common for holding wealth is money. It’s convenient and can be used immediately in exchange for other assets. Most liquid form in which wealth can be kept
3. mention the three broad ways in which government spending can be financed 4. is GDP a stock or flow – explain - flow variable as it is measured over a period of time
generally a year 5. distinguish between real and financial transactions 6. define the repo rate and explain how it can be used as an instrument of contractionary
monetary policy formation 7. explain the difference between direct taxes and indirect taxes – direct taxes – alos called
taxes on income and wealth , are levied on persons and organizations such as companies. They include personal income tax , company tax and estate duty. Indirect taxes – alos called taxes on goods and services or taxes on products and production are levied on transactions , eg purchase of goods and services and are usually paid by those who consume the goods and services (VAT)
8. the simple Keynesian model assumes amongst other things that prices and wages are given. What are the implications of these 2 assumptions
9. explain the difference between the statutory (or legal) incidence of tax and the effective incidence

91
10. explain why policy makers cannot solve the stagflation dilemma using only demand management policies
11. explain why it is important to use real GDP or GNI per capita when measuring economic growth.
12. explain the difference between a stock variable and a flow variable - Stock variable – can only be measured at a particular point in time and has no time dimension (wealth, assets, liabilities, capital, population, and balance on savings account). FLOW VARIABLE – can be measured over a period of time (income, profit, loss, investment).
13. distinguish between nominal gdp and real gpd Nominal GDP is GDP calculated at current prices where real GDP is calculated at constant prices.
14. distinguish between active balances and passive balances and mention the main determinant of the quantity demanded Transaction motive – main determinant income –money as a medium of exchange function Precautionary motive – main determinant income - money as a medium of exchange function Transaction motive and precautionary motive together make up the active balances Speculative motive – main determinant: interest – money as a store value function makes up the passive balances.
15. describe the cost of unemployment to the society at large – unlike other factors of production , labour cannot be saved and used later . if labour is not used when it is available it is lost forever. Unemployment is also damaging to the social and political structure. It tends to give rise to crime as well as to demonstrations, riots and other violent forms of unrest. In S.A there appears to be a definite correlation between criminal, social issues and violence and the level of unemployment. Unemployment can also lead to an overthrow of democratic institutions and processes.
16. list 3 problems associated with GDP as a measure of total production in the economy 17. list 4 main functions of the SARB - formulation and implementation of monetary policy –
repo rate tender system main instrument. Service to the government (banker and advisor, custodian of gold and foreign exchange reserves, administration of exchange control. provision of economic and statistical services. maintaining financial stability – (bank supervision , the national payment system , banker to other banks , banknotes and coins.
18. define monetary policy - Monetary policy can be defined as the measures taken by the monetary authorities to influence the quantity of money or the rate of interest with a view to achieving stable prices, full employment and economic growth.
19. name 3 important withdrawals from the circular flow of income and spending 20. name the four macroeconomic objectives - external stability , full employment , economic
growth , equitable distribution of income and price stability 21. mention 3 methods which are used to estimate GDP - production method (value added),
expenditure method – (final good and services), income method – (incomes of the FOP)
22. explain why taxes should be as neutral as possible 23. explain why government spending is classified as autonomous spending in the Keynesian
model 24. how does government spending affect the multiplier in the Keynesian model 25. what are the determinants of induced consumption in the Keynesian model of a closed
economy with a government sector The marginal propensity to consume, the level of income and taxes
26. explain the basic function of a financial intermediary - financial institution acts as intermediary between those who save and those who wish to invest
27. explain what measures can be taken to get rid of cost-push inflation 28. discuss the effect of an increase in sa imports from the USA on the value of the rand on the
S.A foreign exchange market – if the demand for dollars increase because of an increase will cause a change in the exchange rate , ceteris paribus. A change in the demand of dollars will be reflected by a shift of the demand cuve to the right and the rand will depreciate against the dollar and therefore the dollar will appreciate against the rand – ceteris paribus

92
29. name 3 measure used to measure inequality of distribution of income - Lorenz curve ,Gini coefficient ,quantile ratio
30. define GDP - GDP is the total value of all final goods and services produced with boundaries of the country in a specific period. Gdp is one of the most important barometers of the performance of the economy.
31. explain why credit cards are not considered as money – credit cards are not a medium of exchange. The card is simply a convenient means of making purchases (by obtaining short term loan from the bank or other financial institute which has issued the card.
32. name four lags associated with the implementation of fiscal and monetary policy - Recognition lag – lag between changes in economic activity and recognition or realization that the changes have occurred. the decision lag – ministers and officials from different departments have to meet to discuss matters and this takes time. implementation lag – once decisions have been made it takes
33. time to implement these decisions. Impact lag – a further period lapses before they actually affect economic behaviour.
34. what are the main sources of economic growth viewed from the demand side - there has to be an adequate and growing demand for goods and services produced in a country. Main sources are domestic demand (it is always possible to increase domestic demand by increasing government spending) , exports (international trade is an important factor in economic growth. An increase in exports raises the growth rate and also relieves the balance of payments constraint , import subsititution (another growth strategy likned to BOP is to reduce imports by manufacturing previously imported goods domestically)
35. learn ad-as model 36. learn he Keynesian model 37. learn cicular flow of income and spending – flow of money 38. explain why policy makers cannot solve the stagflation dilemma using only demand
management policy 39. given a Keynesian model of an economy with a government and a foreign sector. Explain the
impact of a decrease in the tax rate on the equilibrium level of income – a decrease in taxes increase the income of households (it increases disposable income) and therefore the consumption of households ( C ) increases. As C is a component of aggregate spending (A) , A will increase leading to an increase in the equilibrium level of income - pgs 57 & 165 & 166 of study guide
Use the following diagram to show how the equilibrium in the money market changes if the level of income in the economy increases. Remember to label your diagram. (4)

93
QUESTION 5 This question is based on the following figure which represents the impact of a specific import tariff on T-shirts.
The original domestic demand and supply curves of T-shirts before international trade are represented by D and S. The world price of T-shirts is R10,00. (i) What is the equilibrium quantity of T-shirts after international trade but without a tariff? (1) (ii) What is the level of domestic production of T-shirts after international trade but without a tariff? (1) Assume an import tariff of R5,00 per t-shirt is imposed. (iii) How many T-shirts are imported after international trade but with the imposition of the
tariff?

94
(i) Use the following diagrams of the money market to show the effect on equilibrium of:
Illustrate on the following diagram the impact of a decrease in imports on the equilibrium level of income.

95
Use the following diagram to show the effect on the equilibrium level of income of an increase in productivity.
Complete the following circular flow of income and spending (note that is the flow of money).

96
The following figure represents the introduction of an excise tax of R1,00 on cigarettes. The equilibrium price per packet before the introduction of the excise tax on cigarettes is R4,00.
Illustrate on the following diagram the impact of an increase in imports on the equilibrium level of income. (2)

97

98
Illustrate on the following diagrams the impact of an increase in the interest rate
Questions 1.16 to 1.35 are based on study units 1 and 2 of the study guide and the relevant chapters of the prescribed book. 1.16 Which of the following statements are correct about the three major flows in the economy? a. The circular flow of production, income and spending is a continuous process.

99
b. Production creates income. c. Spending generates income. [1] All the statements are correct. [2] a and b [3] a and c [4] c [5] None of the above statements. 1.17 Which one of the following statements explains the difference between stocks and flows? [1] Stocks have a time dimension and flows are measured at a point in time. [2] There is no clear difference between stocks and flows. [3] Flows have a time dimension and stocks are measured at a point in time. 1.18 Which of the following statements are correct? a. Investment is the act of purchasing capital goods. b. Households are engaged primarily in production. c. The factor market is where capital goods and labour are bought and sold. [1] a [2] a and c [3] b [4] b and c [5] c 1.19 In a circular flow of income and spending a. the firms' spending represents the expenditure of the households. b. the flow of income is in the same direction as the flow of spending. c. the firms supply goods in the factor market and households buy these goods in the goods market. [1] None of the above statements [2] a [3] b [4] c [5] All the statements are correct. 1.20 Given the government in the circular flow of income and spending, which of the following is a withdrawal? a. Income taxes. b. Government expenditure. c. Transfer payments. [1] a [2] b [3] c [4] a and c [5] a and b 1.21 The three important injections into the circular flow of income and spending are [1] investment spending, government spending and imports. [2] exports, taxes and savings. [3] exports, investment and government spending. [4] savings, imports and consumption.

100
1.22 Which of the following statements are correct? a. South Africa has an open economy as the volume of the country's imports exceed the volume of exports. b. Imports constitute a leakage while exports constitute a withdrawal from the circular flow of income and spending. c. Payment for exports constitutes an addition and payment for imports constitutes an injection into the circular flow of income and spending. [1] a and b [2] b and c [3] a [4] c [5] None of the statements is correct. 1.23 Which of the following statements are correct? a. Financial institutions act as intermediaries between those who save and those who wish to invest. b. Financial sector is the funnel through which saving is channeled back into the circular flow in the form of investment. c. Investment is the most important form of saving in the circular flow of income and spending. [1] All the statements are correct. [2] a and b [3] a and c [4] b and c [5] c 1.24 Total spending in the economy consists of spending by a. firms and households. b. government and foreign sector. c. government and financial sector. [1] All the statements are correct. [2] a and b [3] a and c [4] b and c [5] c 1.25 Which one of the following is NOT a function of money? [1] Money serves as a medium of exchange. [2] Money serves as unit of account. [3] Money serves as a store of value. [4] Money serves as a stock and flow. 1.26 The modern bank note’s value of exchange [1] is equal to its intrinsic value. [2] is undermined by its use as a store of value. [3] is supported by gold that the SARB vaults. [4] is based on confidence. 1.27 If product prices in South Africa were stated in terms of litres of milk (instead of rands and cents), then milk would be functioning primarily as [1] a store of value.

101
[2] a unit of account. [3] a medium of exchange. 1.28 The South African Reserve Bank [1] is responsible for the implementation of fiscal policy. [2] is lender of last resort for those consumers who are unable to secure a loan from commercial banks. [3] is co-responsible for tax collection. [4] is responsible for the formulation of monetary policy. 1.29 Which of the following statements are correct? a. Banks can create demand deposits by granting credit to their clients in the form of overdraft facilities. b. When a person deposits cash in a cheque account there is no immediate change in the quantity of money. c. When the cash reserve requirement increases, the credit multiplier increases. [1] All the statements are correct. [2] a and b [3] a and c [4] b and c [5] c 1.30 When the entire banking system makes use of excess reserves to grant new loans in the form of deposits, [1] the credit multiplier decreases. [2] the credit multiplier increases. [3] the credit multiplier remains unchanged. 1.31 Which of the following statements are correct? a. Transactions with foreign countries do not influence the domestic money supply. b. Government transactions can exert an influence on the money supply. c. When a country’s foreign reserves increase, its money supply generally decreases. [1] All the statements are correct. [2] a and b [3] a and c [4] b and c [5] b 1.32 The quantity of money demanded for precautionary purposes decreases if [1] total output decreases. [2] consumer incomes increase. [3] the interest rate increases. [4] the inflation rate increases . 1.33 Which of the following statements are correct? a. The demand for money is a function of income and the interest rate. b. In general terms the liquidity preference may be expressed as L = f (Y, i). c. The supply of money is determined by demand for money and the interest rate. [1] All the statements are correct. [2] a [3] b and c [4] a and c [5] None of the statements is correct.

102
1.34 The purchase and sale of financial assets to and from the banks by the South African Reserve Bank is known as the [1] accommodation policy. [2] credit control policy. [3] public debt management policy. [4] open market policy. 1.35 The South African Reserve Bank feels that the South African economy is overheated. To correct the problem the SARB could [1] sell bonds on the open market. [2] increase tax rates. [3] decrease government spending. [4] lower the reserve requirement. 2.1 Which of the following statements are correct? a. The difference between government spending and borrowing is called the budget deficit. b. If government finances part of its spending from borrowing from the central bank, this is called inflationary financing. c. Expansionary fiscal policy implies that taxes must increase and government spending must be limited. [1] All statements are correct. [2] a and b [3] b and c [4] a [5] b 2.2 Which one of the following statements regarding taxes is correct? [1] Taxes which distort relative prices are not neutral. [2] The aim of taxes is to change the behaviour of people. [3] Equity in the tax system ensures simplicity and neutrality. [4] In a good tax system compliance costs are equal to administration costs. 2.3 A tax is [1] regressive when everybody pays the same amount of tax. [2] regressive when all taxpayers pay the same rate. [3] proportional when everybody pays the same amount of tax. [4] proportional when it is levied on goods and services at the same standard rate. 2.4 Which of the following statements are correct? a. The statutory or legal incidence of a tax determines who ultimately bears the burden of the tax. b. The degree to which the burden of a tax can be shifted depends on the price elasticities of demand and supply of the good or service in question. c. The government prefers levying excise taxes on the consumption of goods with a high elasticity of demand. [1] None of the statements is correct. [2] a and b [3] a [4] b [5] c

103
2.5 Which one of the following statements on nationalisation and privatization is correct? [1] Nationalisation is the transfer of ownership from public sector to the private sector. [2] Privatisation is the transfer of ownership from private enterprise to government. [3] One of the arguments in favour of privatisation is that the privatised firm may attract foreign direct investment. [4] Commercialization is the same as privatisation. 2.6 Country A can produce 20 units of maize or 10 units of bananas. Country B can produce 30 units of maize or 20 units of bananas. Assuming constant opportunity costs, which of the following statements are correct? a. Country B has an absolute advantage in the production of maize. b. Country B has an absolute advantage in the production of bananas. c. Country A has a relative advantage in the production of bananas. [1] All the statements are correct. [2] a and b [3] a and c [4] b and c [5] c 2.7 One of the purposes for the introduction of an import tariff is to [1] expose local production to international competition. [2] reduce local production and increase imports. [3] restrict the importation of harmful products. [4] serve as a source of income for the government. 2.8 A country’s balance of payments [1] records all the economic activities which take place within the boundaries of the country. [2] will show a deficit on the current account if the value of exports exceeds the value of imports. [3] can afford a deficit on the current account if there is a positive balance on the financial account. [4] records all the transactions in the rest of world. 2.9 An increase in the supply of dollars in the South African foreign exchange market can be caused by [1] more South African firms purchasing capital goods from the United States. [2] an increase in the gold price. [3] a decrease in economic activity in the United States. [4] more South African tourists visiting the United States 2.10 Which one of the following is most likely to increase the demand for US dollar on the South African foreign exchange market? [1] A fall in the interest rates in the United States. [2] An expected decline of the value of the rand relative to the dollar. [3] A recession in South Africa. [4] A decrease in international tourism. 2.11 If the exchange rate changes from R9-60= $1-00 to R8-50 = $1-00 then [1] the rand has depreciated against the dollar. [2] the rand has weakened against the dollar. [3] the rand has appreciated against the dollar. 2.12 A depreciation of the rand against the US dollar will lead to a decrease in [1] the price of imported goods in South Africa. [2] the price of South African products sold in the USA. [3] the price of petrol in South Africa. [4] the number of tourist from the USA visiting South Africa. 2.13 Which of the following are macroeconomic objectives?

104
a. Unemployment, economic growth and inflation. b. External stability, full employment and economic growth. c. Equitable distribution of income and price stability. [1] All the statements are correct. [2] a and b [3] b and c [4] a and c [5] None of the above statements. 2.14 The three ways of calculating GDP are [1] production, prices and income methods. [2] income, product and services methods. [3] expenditure, spending and production methods. [4] income, expenditure and production methods. 2.15 Which one of the following is correct about the measurement of GDP? [1] If subsidies on production are lower than taxes on production, then GDP at factor costs will be higher than GDP at basic prices. [2] If subsidies on products are higher than taxes on products, then GDP at basic prices will be lower than GDP at market prices. [3] If taxes on products are lower than subsidies on products, then GDP at market prices will be lower than GDP at basic prices. [4] If taxes on products are higher than subsidies on products, then GDP at basic prices is lower than GDP at factor costs. 2.20 Which of the following are measurements of income inequality? a. Lorenz curve and Gini coefficient b. Income ratio c. Quantile ratio [1] a and b [2] a and c [3] b and c [4] a [5] All the statements are correct. 3.1 Which of the following statements is correct? a. Induced consumption refers to the fixed part of consumption spending which does not change as the level of income changes. b. The slope of the consumption function is always greater than that of the aggregate spending curve. c. If the marginal propensity to save increases, the equilibrium level of income will increase. [1] All the statements are correct. [2] a and b [3] b and c [4] a and c [5] None of the statements is correct. 3.2 An increase in autonomous consumption will result in [1] a movement from left to right along the consumption function. [2] a movement from right to left along the consumption function.

105
[3] an upward shift of the consumption function. [4] a downward shift of the consumption function. 3.3 If the marginal propensity to consume increases [1] there will be a movement from left to right along the consumption function. [2] the consumption function will shift parallel upwards. [3] the consumption function will shift parallel downwards. [4] the slope of the consumption function will be steeper. 3.4 The sum of the marginal propensity to consume and the marginal propensity to save equals [1] disposable income. [2] zero. [3] a value greater than one. [4] one. 3.5 Which of the following statements about investment spending is correct? a. A higher real interest rate results in less investment spending. b. When the economy moves into a recession, many firms will postpone buying investment goods even if the demand for their own product is strong. c. The optimism or pessimism of business firms is an important determinant of investment spending. [1] a [2] a and b [3] a and c [4] b and c [5] All the statements are correct 3.6 When aggregate spending is greater than income, [1] the total amount of production in the economy is the same as the total amount of spending. [2] inventories will rise. [3] the total amount of production in the economy is greater than the total amount of spending. [4] unplanned inventory adjustment will remain the same. [5] inventories will fall. 3.7 At points above the 45° line, [1] aggregate spending is less than GDP. [2] aggregate spending is greater than GDP. [3] aggregate spending is equal to GDP. [4] aggregate expenditure is in equilibrium. [5] None of the above alternatives is correct. 3.8 The multiplier is [1] the exponential increase in aggregate spending caused by a decrease in interest rates. [2] the amount by which spending will multiply when real GDP increases. [3] the product of the increase in equilibrium real GDP and an increase in induced spending. [4] the ratio of the increase in equilibrium real GDP to the increase in autonomous spending. [5] the ratio of the increase in equilibrium real GDP to the decrease in autonomous expenditures. Question 3.9 is based on the following equation which refers to a closed economy with no government. C = 100 + 0,75Y 3.9 Which of the following statements is correct? a. When income is zero, private savings are 100. b. The slope of the savings function is 0,75. c. The savings function is given by S = 100 + 0,25Y [1] None of the statements is correct.

106
[2] a and b [3] b and c [4] a and c [5] All the statements are correct. Questions 3.10 and 3.11 are based on the following equations which refer to a model of a closed economy without a government sector. A = C + I C = 600 + 3/4Y I = 200 3.10 Which of the following statements is correct? a. When income is zero, private consumption spending is 800. b. The slope of the C-curve is 3/4. c. The slope of the A-curve is 3/4. [1] All the statements are correct. [2] a and b [3] a and c [4] b and c [5] c 3.11 Which of the following statements is correct? a. The value of the multiplier is ¼. b. The equilibrium income level is 3 200. c. If investment increases, the equilibrium level of income will increase. [1] All the statements are correct [2] a and b [3] a and c [4] b and c [5] c 3.12 In the Keynesian model of a closed economy with a government sector, an increase in national income will lead to an increase in [1] consumption only. [2] saving and investment. [3] consumption and investment. [4] consumption and saving. [5] consumption, saving, and taxes. 3.13 Which of the following has a major impact on the level of net exports (X – Z)? a. The growth rate of GDP in South Africa relative to the growth rates of GDP in other countries. b. The price level in South Africa relative to the price levels in other countries. c. The exchange rate between the Rand and other currencies. [1] c [2] a and b [3] a and c [4] b and c [5] All of the above alternatives are correct. 3.14 Given C = 1000 + 0,75Yd, I = 500, G = 600, X = 200 and Z = 500 + mY. What is the value of autonomous spending? [1] 800 [2] 1 300 [3] 1 800 [4] 2 400

107
[5] 7 200 3.15 Assume that the full-employment income level is higher than the equilibrium income level. Full employment can be reached if a. exports increase. b. imports decrease. c. the tax rate decreases. [1] All the statements are correct [2] a and c [3] a [4] b [5] c 3.16 Given that country A relies more heavily on imports than country B, while other macroeconomic conditions are the same. If there is a positive relationship between domestic economic activity and imports, then the multiplier of country A will be [1] larger than country B’s. [2] smaller than country B’s. [3] as large as country B’s. [4] uncertain. [5] None of the above alternatives is correct. Questions 3.17 to 3.20 are based on the following information about an open economy with a government sector: Autonomous consumption = R 100 million Investment spending = R 300 million Government spending = R 200 million Exports = R 150 million Autonomous imports = R 100 million Marginal propensity to consume = 2/3 Tax rate = 1/10 Marginal propensity to import = 1/10 Yf - Full employment = R 2 150 million 3.17 The multiplier is equal to [1] 2 [2] 2½ [3] 3 [4] 3⅓ 3.18 The equilibrium level of income is

108
[1] R1 300 million. [2] R1 625 million. [3] R1 950 million. [4] R2 145 million. 3.19 The budget surplus at the equilibrium level of income is [1] R50 million. [2] R70 million. [3] R130 million. [4] R170 million. 3.20 The full employment income level can be reached by [1] increasing government spending by R200 million. [2] increasing exports by R175 million. [3] increasing imports by R175 million. [4] increasing investment spending by R425 million. [5] increasing government spending by R525 million. 4.1 An increase in the price level causes [1] the AS curve to shift upward to the left. [2] a leftward movement along the AS curve. [3] the AS curve to shift parallel to the left. [4] downward movement along the AS curve. Questions 4.2 and 4.3 are based on the figure below which represents the AS curve. 4.2 Between the points A and B it is called the [1] Keynesian range. [2] Classical range. [3] Positive range. 4.3 Which of the following statements are correct? a. Between the points A and B, an increase in the net exports will result in an increase in the price level and a decrease in output. b. Between the points B and C, a decrease in government spending will cause a decrease in both the price level and real output. c. Between the points C and D, a decrease in interest rates will cause a decrease in the price level and an increase in output. [1] a and b [2] a [3] b [4] c [5] b and c 4.4. An increase in the government’s budget deficit is most likely to reduce [1] the demand for imported goods and services. [2] unemployment. [3] interest rates. [4] inflation. 4.5. Suppose the SARB increase the interest rate while oil prices are rising. What would be the expected effect on the equilibrium level of real GDP and the price level? 4.6 An expansionary monetary policy will be less effective if

109
a. the AS curve is very steep. b. the multiplier is very large. c. the investment demand is interest inelastic. [1] a and b [2] b and c [3] a and c [4] c [5] a, b and c 4.7. If the actual inflation rate is less than the expected inflation rate, then [1] borrowers are worse off and lenders are better off. [2] borrowers are better off and lenders are worse off. [3] both borrowers and lenders are better off. [4] both borrowers and lenders are worse off. Price level Real GDP [1] uncertain decreases [2] uncertain uncertain [3] decreases decreases [4] increases increases Use the diagram below which represents demand-pull inflation to answer question 4.8.
4.8 Which of the following statements are correct? a. At point E3, there is full employment and no inflation. b. At point E4, there is full employment and inflation. c. Demand-pull inflation is shown by the rightward shift of the AD curve. [1] None of the above statements are correct. [2] a

110
[3] a and b [4] b and c [5] a and c 4.9 Which of the following statements are correct? a. Cost-push inflation is caused by factors which push up the cost of production. b. Increases in wages, salaries and productivity result in cost-push inflation. c. Increased cost of imported capital and intermediate goods lead to cost-push inflation. [1] All the statements are correct. [2] a [3] b [4] a and c [5] b and c 4.10 _____________ would result if new graduates enter the labour market seeking employment. [1] Cyclical unemployment. [2] Seasonal unemployment. [3] Frictional unemployment. [4] Structural unemployment. 38 4.11 According to Say's law _______ unemployment does not exist. [1] structural [2] cyclical [3] seasonal [4] frictional 4.12 Which of the following statements are correct? a. To reduce unemployment on the demand side, one can raise aggregate demand for goods and services. b. To reduce unemployment as long term strategy, population growth should be limited. c. To reduce unemployment, the business sector should reduce wages and salaries of employees. [1] All the statements are correct. [2] a [3] b [4] a and b [5] b and c Use the diagram below, which represents Phillips curves to answer question 4.13.

111
4.13 A simultaneous increase in inflation and unemployment from points A to B results in [1] hyperinflation. [2] stagflation. [3] cyclical unemployment. [4] seasonal unemployment. 4.14 Which of the following statements are correct regarding unemployment in the Keynesian and the ADAS models? a. In the production function, all the inputs are assumed to be fixed. b. The slope of the production function increases as the level of employment decreases. c. An increase in the real production always implies that unemployment rate will decline [1] a [2] c [3] b and c [4] a and b [5] None of the above statements is correct. 4.15 When measuring the GDP, ____________ should be considered? a. changes in population. b. changes in unemployment. c. changes in prices. [1] a [2] c [3] a and c [4] b and c [5] All the statements are correct. 4.16 If the base year prices are used during the measurement of GDP, then the ____________ is obtained. [1] current GDP. [2] GDP. [3] real GDP. [4] nominal GDP.

112
4.17 ________________ is NOT likely to cause a problem in the measurement of GDP. [1] Pollution [2] Smuggling [3] Commercial farming [4] Adjustment of original data 4.18 If nominal wages and prices rise at the same rate, say 6,5% per year, then real wages will [1] decrease. [2] increase. [3] remain constant. [4] be the same as nominal wages. 4.19 Suppose a computer manufacturer develops a new production method that allows them to make more computers with the same number of labourers. This is an example of [1] capital deepening. [2] technological widening. [3] capital widening. [4] increased productivity 4.20 Which of the following factors will not influence economic growth from the demand side? [1] Domestic demand [2] Exports [3] Investment [4] Entrepreneurship [5] Import substitution