Embed Size (px)
Citation preview
Chapter 3Milk Production and Dairy Sector Profiles
Germany
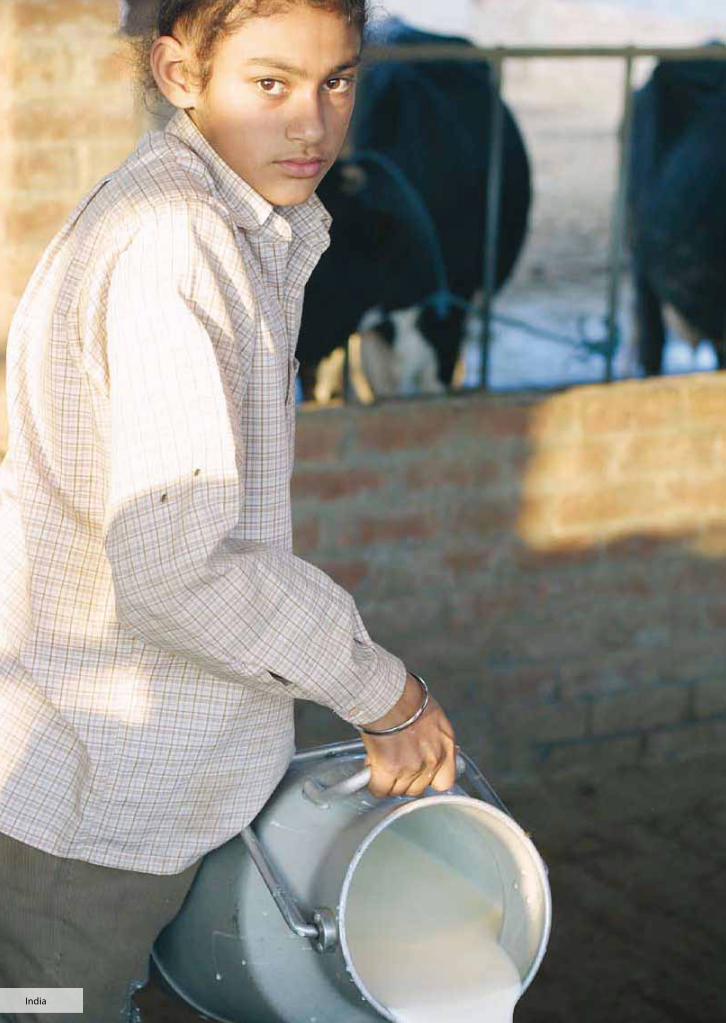
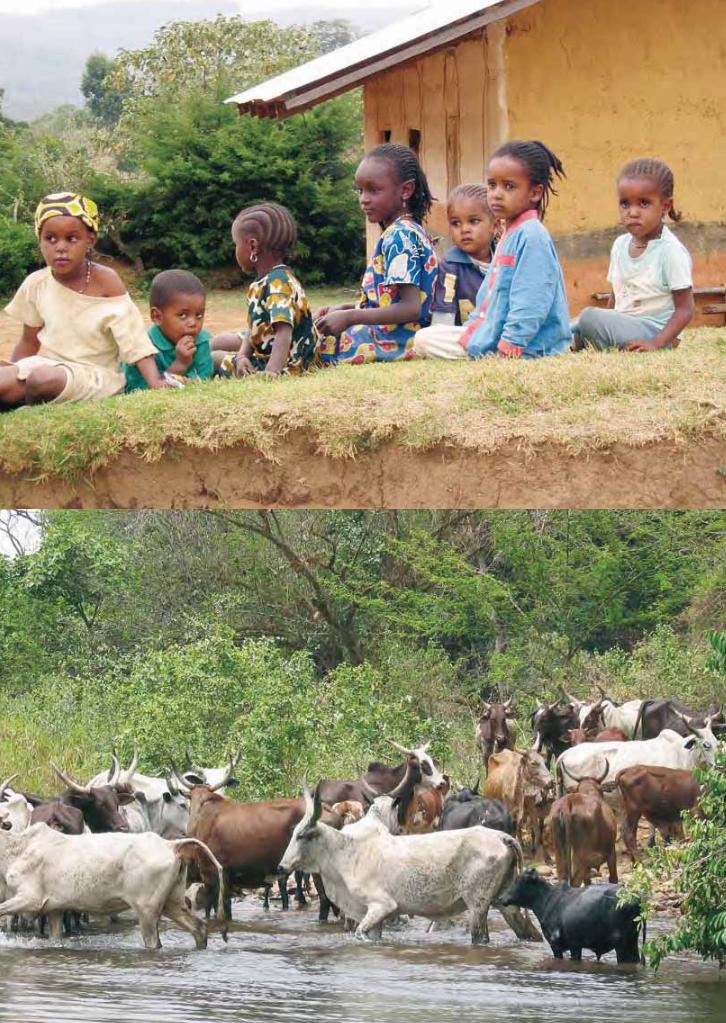
Pictures on this and previous double page: Kids on farms (Pictures by: Amit Saha, Asaah Ndambi and Katja Seifert)
3.1 Summary 34
3.2 India 38
3.3 Pakistan 42
3.4 Bangladesh 46
3.5 Thailand 50
3.6 Viet Nam 54
3.7 China 58
3.8 Uganda 62
3.9 Cameroon 66
3.10 Morocco 70
3.11 Peru 74
3.12 Germany 78
3.13 United States of America 82
3.14 New Zealand 86
34 © IFCN 2008
3.1 Summary
Introduction
This chapter contains a country-by-country analysis of the status of, and developments in, national dairy sectors and provides the wider perspective for the detailed farm-level analysis in the following Chapter. Because the availability and quality of data in most developing countries is problematic, the time frame chosen for this analysis, 1996 to 2005, relates to information contained in the IFCN Dairy Reports, 2006 and 2007. The country profiles provide an overview of a number of indicators illustrating the trends and drivers for milk supply and demand, and the dairy chain. The intention is to give each country’s dairy sector a ’face’. In all cases, it has been attempted to make the indicators comparable between the countries.
For the purpose of this analysis, ten developing countries were chosen as well as three developed dairy countries (Germany, New Zealand and USA) to put the developing countries analysed into a global context. The developing countries are Bangladesh, Cameroon, the People’s Republic of China (henceforth China), India, Morocco, Pakistan, Peru, Thailand, Uganda and Viet Nam. Comparable data were available because the IFCN is well established there.
India
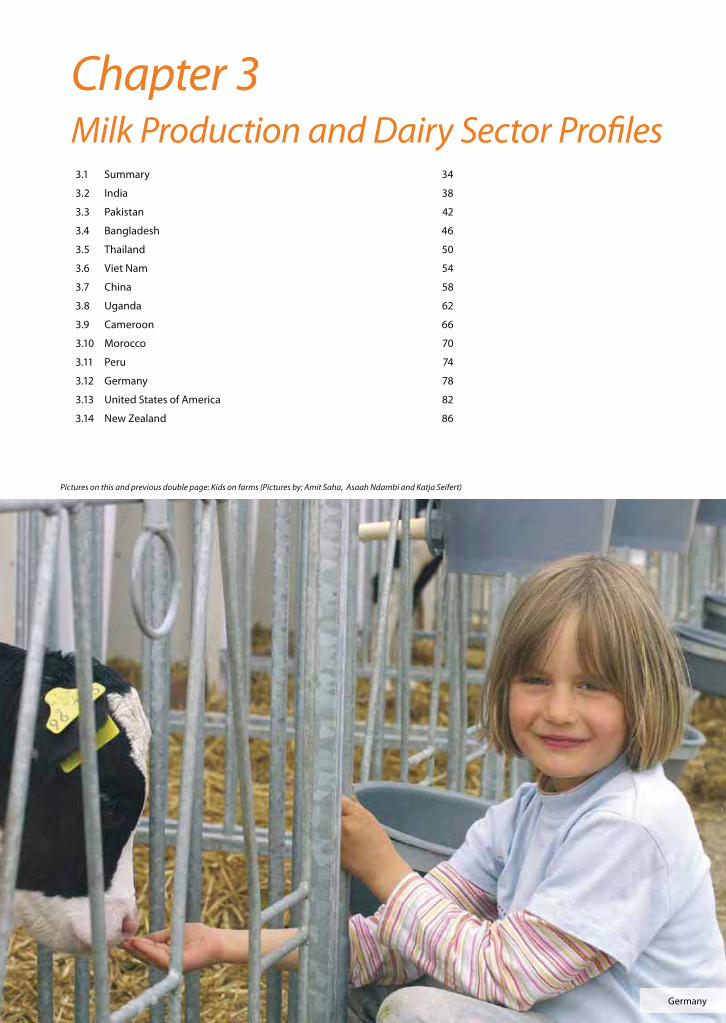
With an annual production of 108 million tons of ECM, 65 percent of which is produced by buffaloes, and a national herd of 113 million head of cattle/buffaloes, India is the world’s largest milk-producing country. Some 75 million dairy farming households, with an average of 1.5 adult female cows or buffaloes per farm, are engaged in the sector each producing
about 4 litres of milk per farm/day. During the period under review, production rose by 3 to 4 percent per annum or approximately 4 million tons, thanks to higher milk yields and more cows and buffaloes.
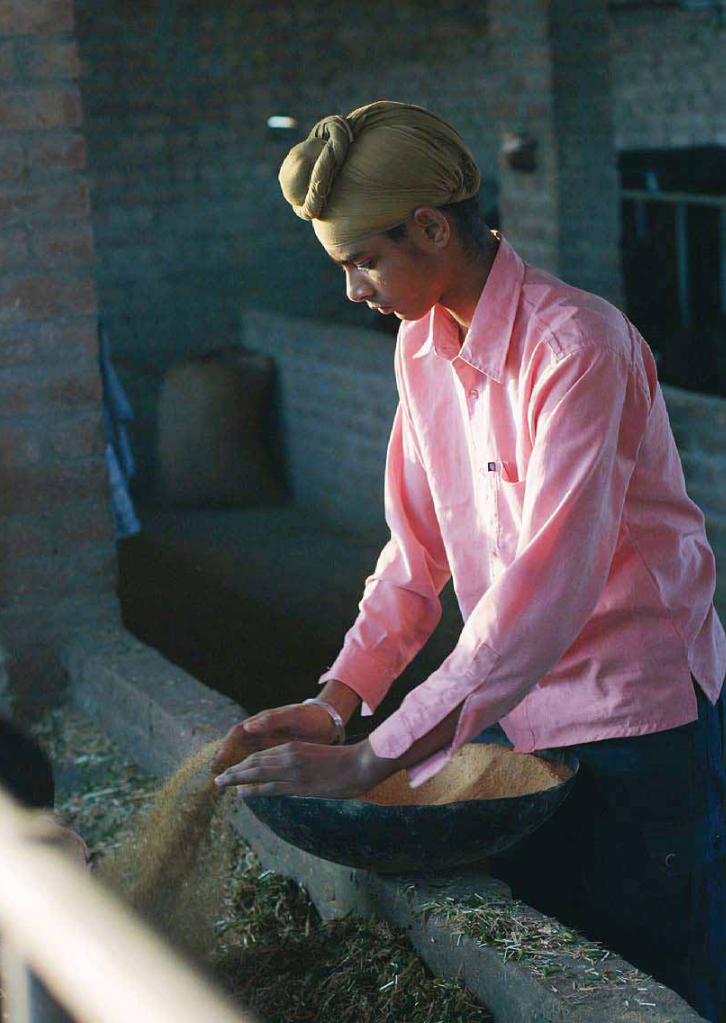
The predominant dairy production systems may be classified as low-input/low-yield systems (956 litres/cow/year). Feeding is based mainly on crop residues such as straw and green fodder, supplemented by small quantities of low-cost compound feed. Milking is done by hand and the milk transported to village collection centres or collected by local milkmen. About 45 percent of the milk is used by the farming households and only 15 to 20 percent is delivered to formal milk processors.
Annual per capita milk consumption increased by 1.5 to 2.4 percent per annum from 1990, reaching 98 kg in 2005.
Previously, rising demand for milk was mainly driven by population growth whereas increases in per capita consumption have now become an additional driver. India has always been 100 percent self-sufficient in milk, with total imports/exports of only 0.3 million tons per annum; it may thus be considered as almost unconnected with the world dairy market.
Pakistan
With a production of 34.4 million tons of ECM, Pakistan was the world’s third largest producer of milk in 2005, with buffaloes accounting for 75 percent of production. Milk is produced by
approximately 15 million dairy farming households with an average of 1.8 adult cows or buffaloes per farm producing approximately 6.4 litres of milk per farm/day. Between 2000 and 2005, production grew by 2.9 percent per annum, thanks more to increased numbers of milking animals than to higher milk yields.
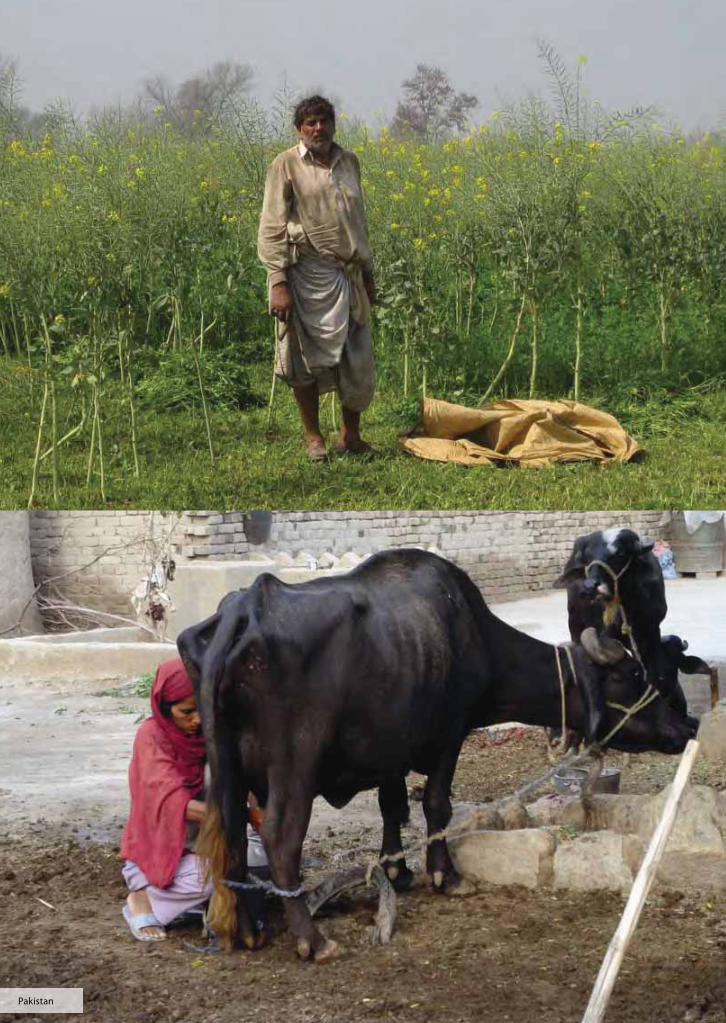
Dairy production systems in Pakistan are similar to those in India. Most (50 percent) of the milk is consumed by the farming households or sold on the informal market (40 percent); less than 10 percent is delivered to formal milk processors.
By 2005, yearly milk consumption in Pakistan had reached 230 kg per capita, significantly higher than in India. Increased demand for milk was mainly driven by population growth (from 2.0 to 2.2 percent per annum). Like India, Pakistan has always been completely self-sufficient in milk, with imports/exports of only 0.22 million tons per annum.
Bangladesh
Dairy production systems in Bangladesh are similar to those in India and Pakistan. However, milk production and yields (2.8 million
tons ECM from cows and buffaloes, and 711 kg of ECM per cow/per day, respectively) are significantly lower than in India and Pakistan.
Most of the milk is consumed by farming households or sold on the informal market, and less than 20 percent is delivered to formal milk processors. In 2005, per capita milk
© IFCN 2008 35
3.1 Summary
consumption stood at only 32 kg/year. Bangladesh is 85 percent self-sufficient in milk and imports 0.4 million tons per annum.
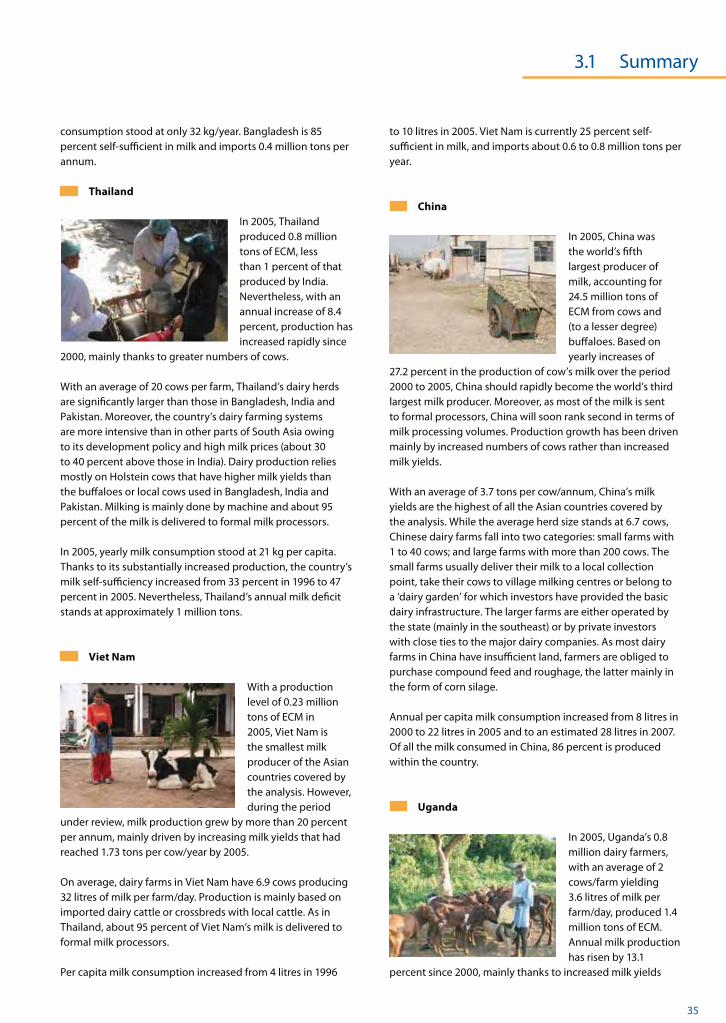
Thailand
In 2005, Thailand produced 0.8 million tons of ECM, less than 1 percent of that produced by India. Nevertheless, with an annual increase of 8.4 percent, production has increased rapidly since
2000, mainly thanks to greater numbers of cows.
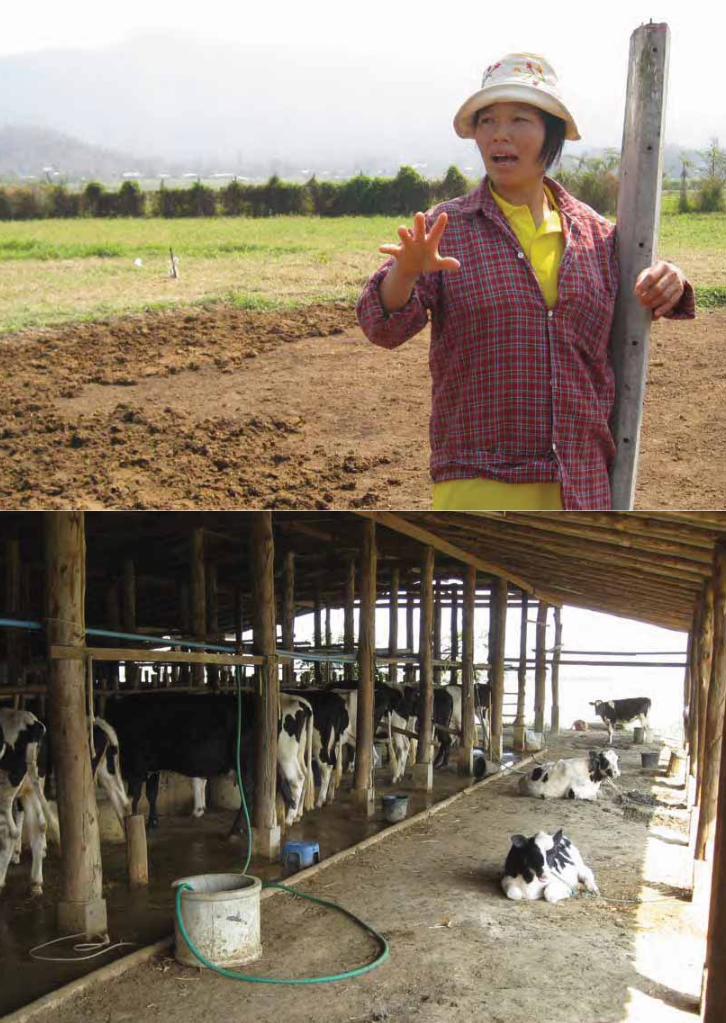
With an average of 20 cows per farm, Thailand’s dairy herds are significantly larger than those in Bangladesh, India and Pakistan. Moreover, the country’s dairy farming systems are more intensive than in other parts of South Asia owing to its development policy and high milk prices (about 30 to 40 percent above those in India). Dairy production relies mostly on Holstein cows that have higher milk yields than the buffaloes or local cows used in Bangladesh, India and Pakistan. Milking is mainly done by machine and about 95 percent of the milk is delivered to formal milk processors.
In 2005, yearly milk consumption stood at 21 kg per capita. Thanks to its substantially increased production, the country’s milk self-sufficiency increased from 33 percent in 1996 to 47 percent in 2005. Nevertheless, Thailand’s annual milk deficit stands at approximately 1 million tons.
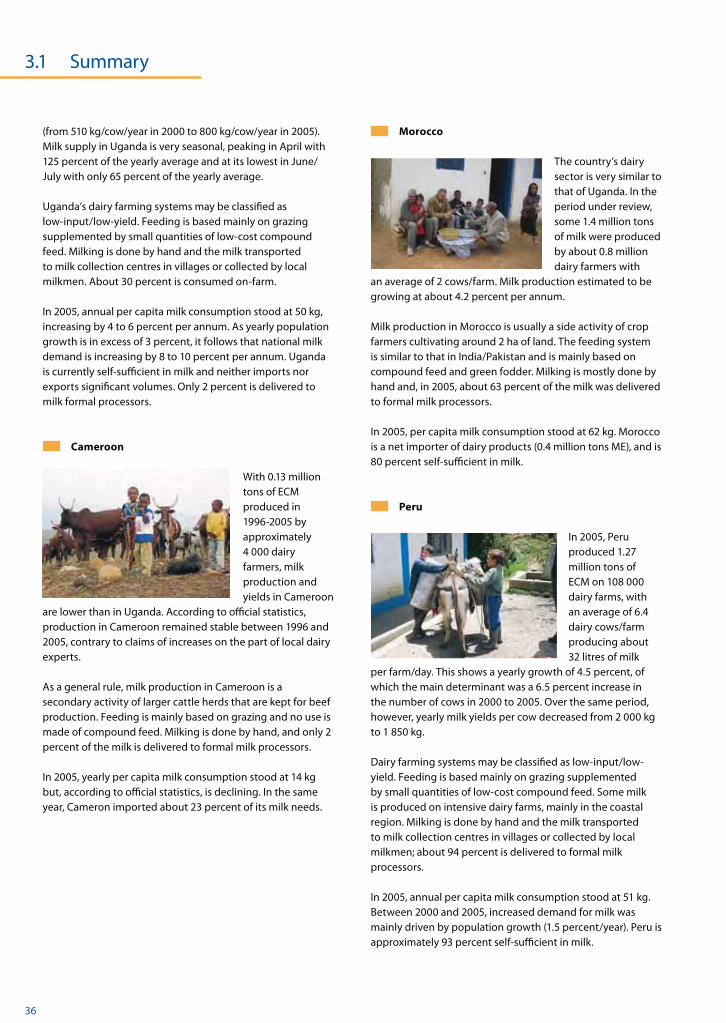
Viet Nam
With a production level of 0.23 million tons of ECM in 2005, Viet Nam is the smallest milk producer of the Asian countries covered by the analysis. However, during the period
under review, milk production grew by more than 20 percent per annum, mainly driven by increasing milk yields that had reached 1.73 tons per cow/year by 2005.
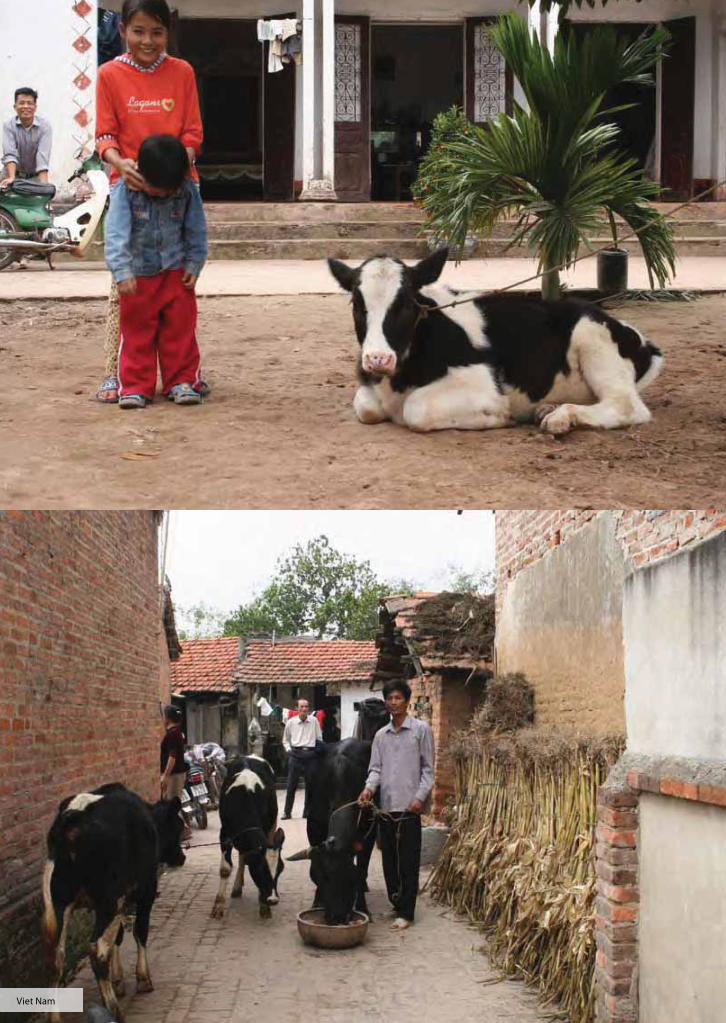
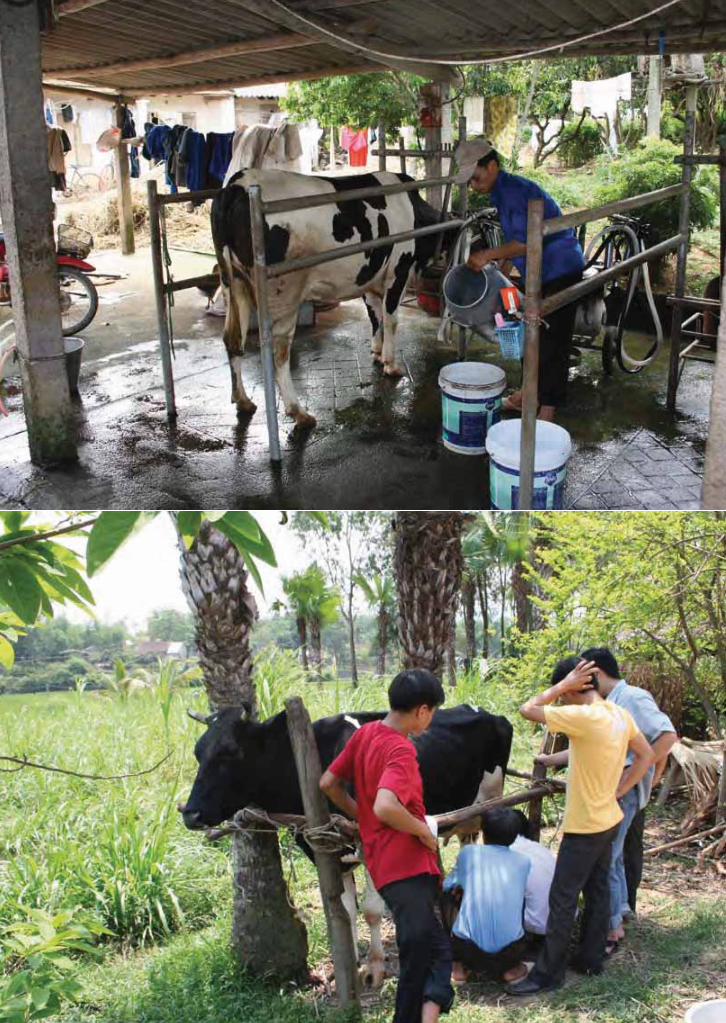
On average, dairy farms in Viet Nam have 6.9 cows producing 32 litres of milk per farm/day. Production is mainly based on imported dairy cattle or crossbreds with local cattle. As in Thailand, about 95 percent of Viet Nam’s milk is delivered to formal milk processors.
Per capita milk consumption increased from 4 litres in 1996
to 10 litres in 2005. Viet Nam is currently 25 percent self-sufficient in milk, and imports about 0.6 to 0.8 million tons per year.
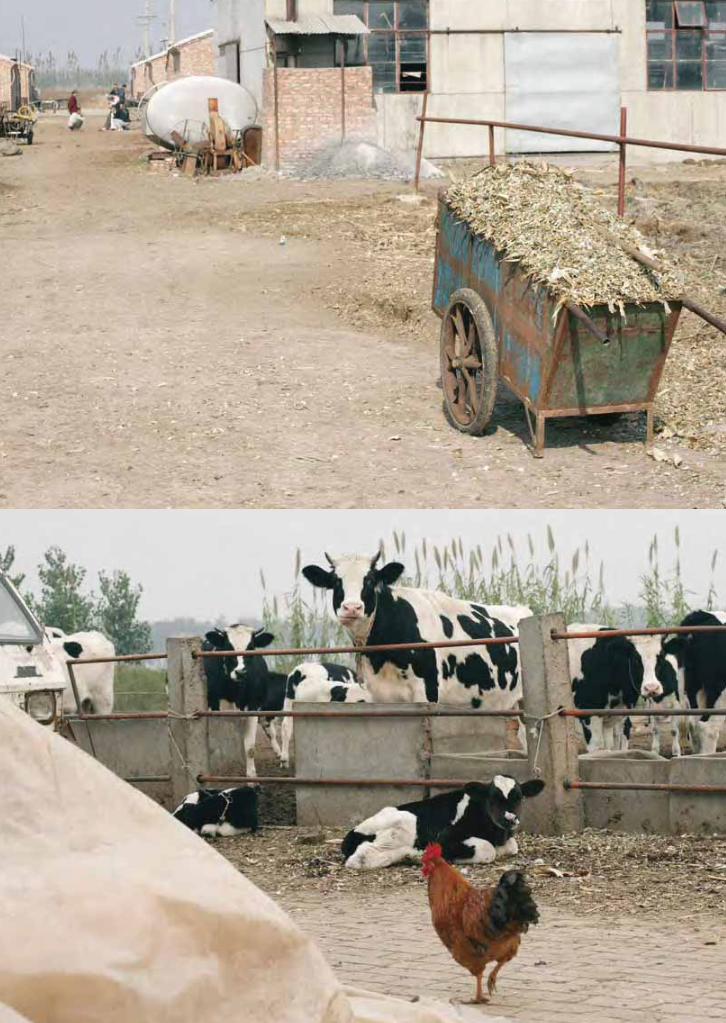
China
In 2005, China was the world’s fifth largest producer of milk, accounting for 24.5 million tons of ECM from cows and (to a lesser degree) buffaloes. Based on yearly increases of
27.2 percent in the production of cow’s milk over the period 2000 to 2005, China should rapidly become the world’s third largest milk producer. Moreover, as most of the milk is sent to formal processors, China will soon rank second in terms of milk processing volumes. Production growth has been driven mainly by increased numbers of cows rather than increased milk yields.
With an average of 3.7 tons per cow/annum, China’s milk yields are the highest of all the Asian countries covered by the analysis. While the average herd size stands at 6.7 cows, Chinese dairy farms fall into two categories: small farms with 1 to 40 cows; and large farms with more than 200 cows. The small farms usually deliver their milk to a local collection point, take their cows to village milking centres or belong to a ‘dairy garden’ for which investors have provided the basic dairy infrastructure. The larger farms are either operated by the state (mainly in the southeast) or by private investors with close ties to the major dairy companies. As most dairy farms in China have insufficient land, farmers are obliged to purchase compound feed and roughage, the latter mainly in the form of corn silage.
Annual per capita milk consumption increased from 8 litres in 2000 to 22 litres in 2005 and to an estimated 28 litres in 2007. Of all the milk consumed in China, 86 percent is produced within the country.
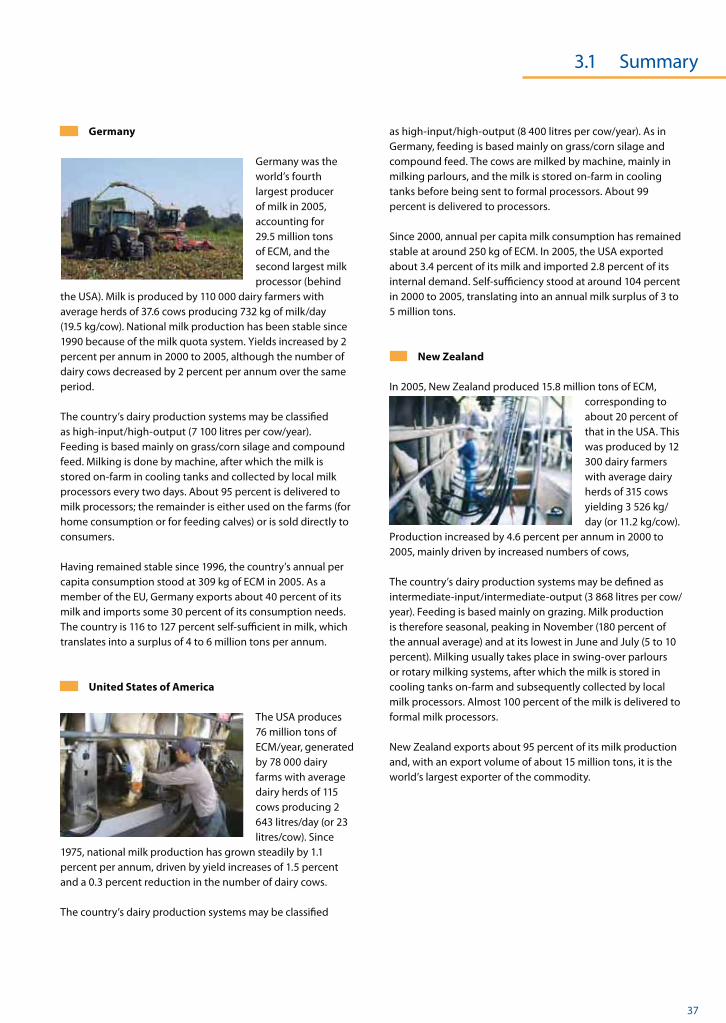
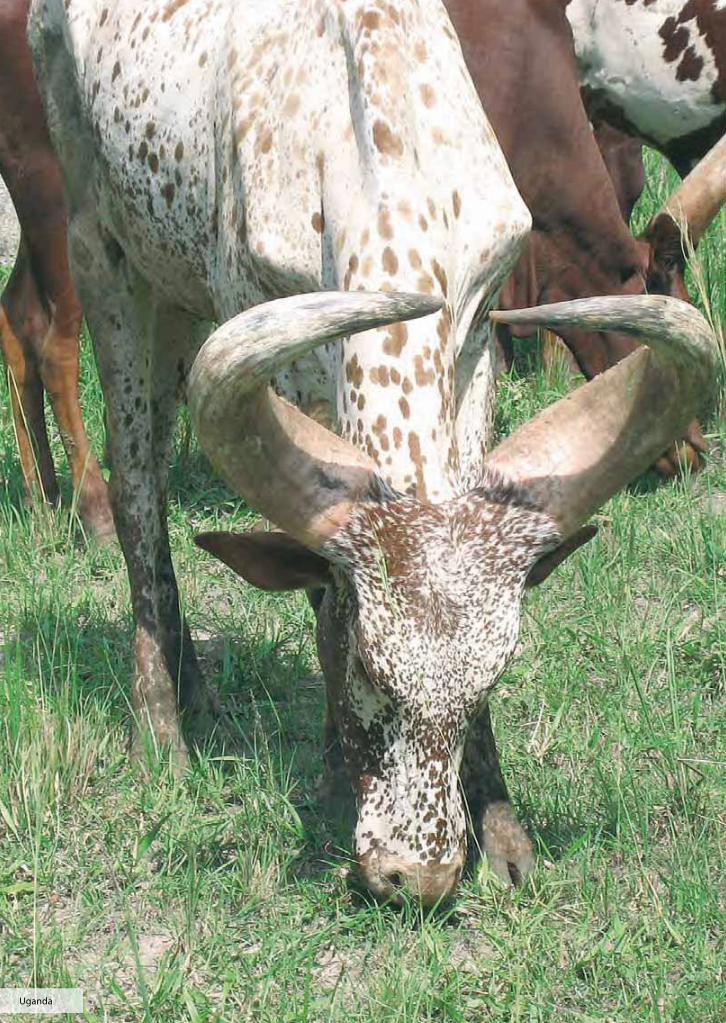
Uganda
In 2005, Uganda’s 0.8 million dairy farmers, with an average of 2 cows/farm yielding 3.6 litres of milk per farm/day, produced 1.4 million tons of ECM. Annual milk production has risen by 13.1
percent since 2000, mainly thanks to increased milk yields
36 © IFCN 2008
3.1 Summary
(from 510 kg/cow/year in 2000 to 800 kg/cow/year in 2005). Milk supply in Uganda is very seasonal, peaking in April with 125 percent of the yearly average and at its lowest in June/July with only 65 percent of the yearly average.
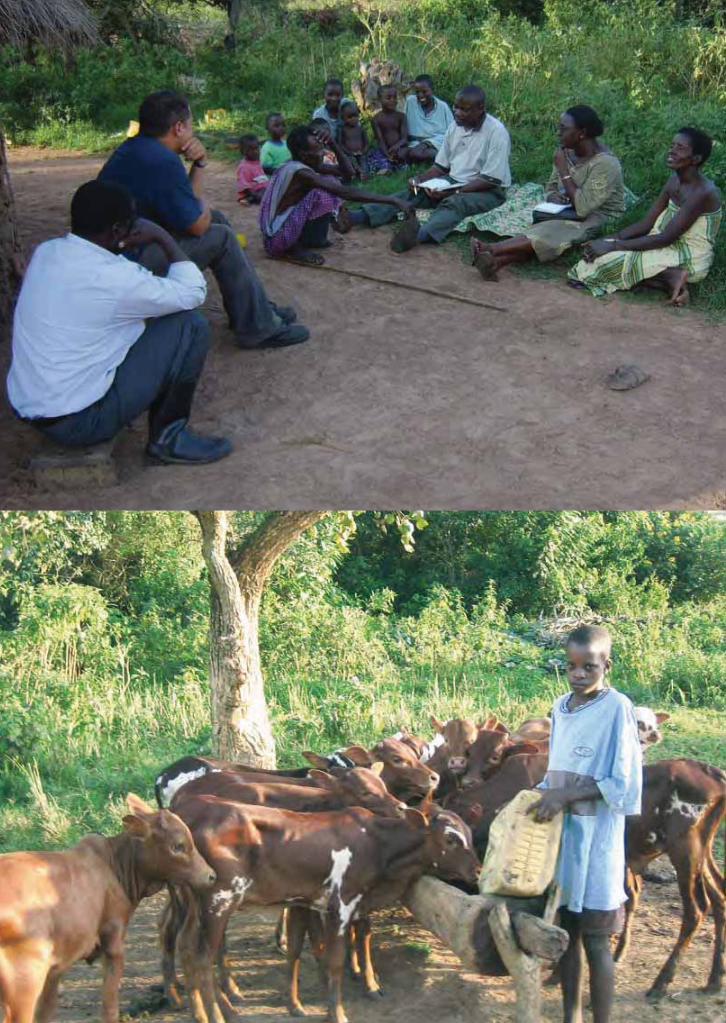
Uganda’s dairy farming systems may be classified as low-input/low-yield. Feeding is based mainly on grazing supplemented by small quantities of low-cost compound feed. Milking is done by hand and the milk transported to milk collection centres in villages or collected by local milkmen. About 30 percent is consumed on-farm.
In 2005, annual per capita milk consumption stood at 50 kg, increasing by 4 to 6 percent per annum. As yearly population growth is in excess of 3 percent, it follows that national milk demand is increasing by 8 to 10 percent per annum. Uganda is currently self-sufficient in milk and neither imports nor exports significant volumes. Only 2 percent is delivered to milk formal processors.
Cameroon
With 0.13 million tons of ECM produced in 1996-2005 by approximately 4 000 dairy farmers, milk production and yields in Cameroon
are lower than in Uganda. According to official statistics, production in Cameroon remained stable between 1996 and 2005, contrary to claims of increases on the part of local dairy experts.
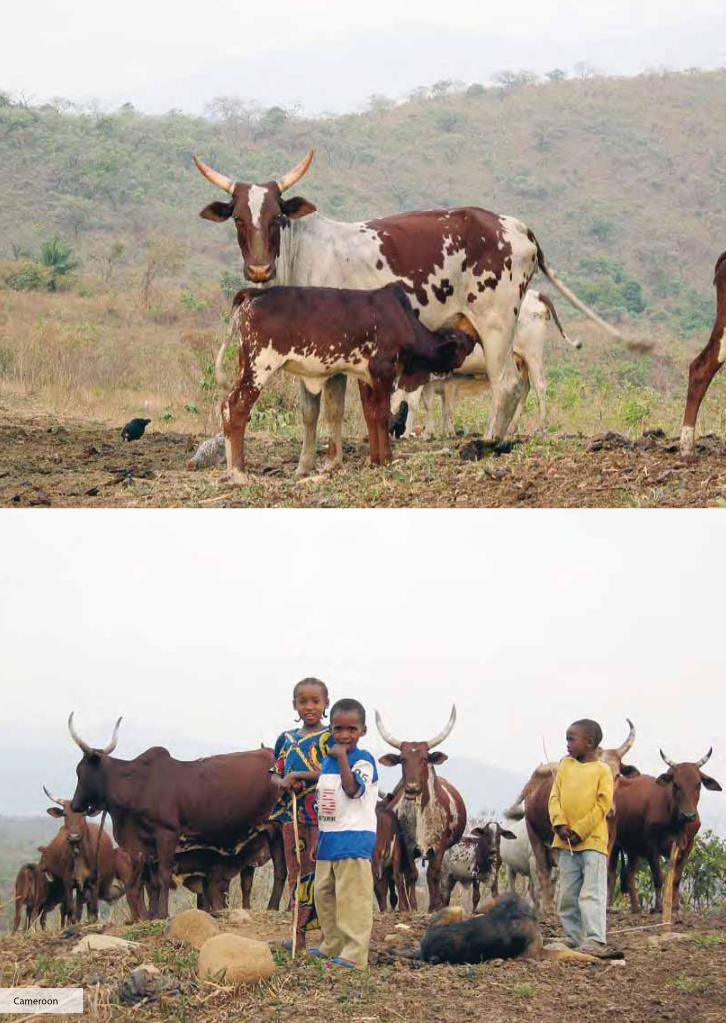
As a general rule, milk production in Cameroon is a secondary activity of larger cattle herds that are kept for beef production. Feeding is mainly based on grazing and no use is made of compound feed. Milking is done by hand, and only 2 percent of the milk is delivered to formal milk processors.
In 2005, yearly per capita milk consumption stood at 14 kg but, according to official statistics, is declining. In the same year, Cameron imported about 23 percent of its milk needs.
Morocco
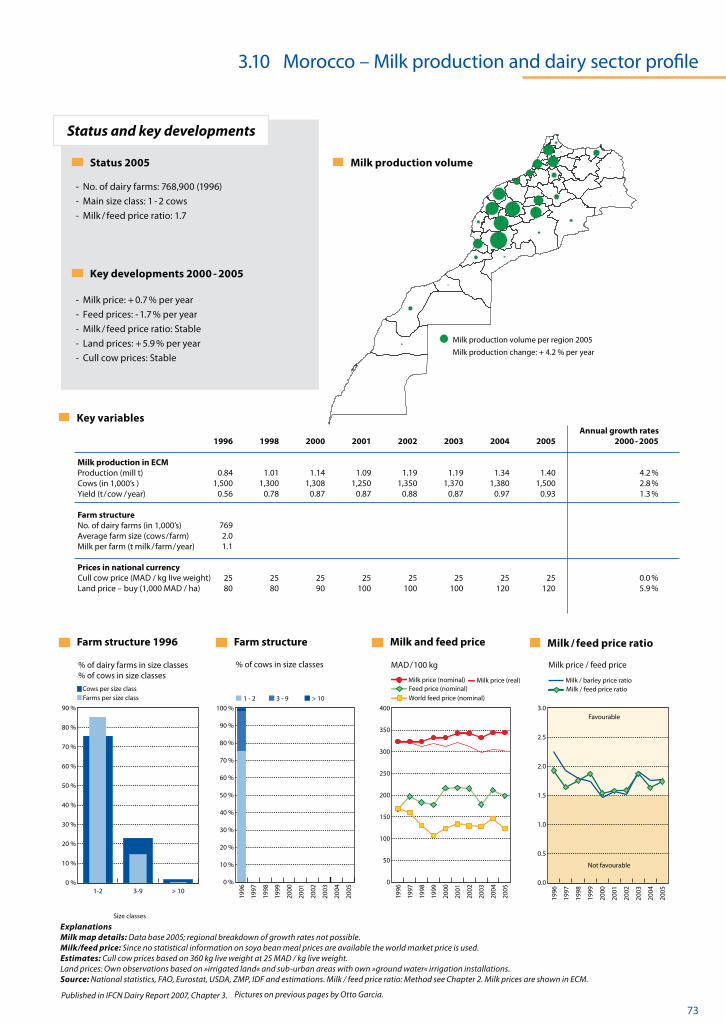
The country’s dairy sector is very similar to that of Uganda. In the period under review, some 1.4 million tons of milk were produced by about 0.8 million dairy farmers with
an average of 2 cows/farm. Milk production estimated to be growing at about 4.2 percent per annum.
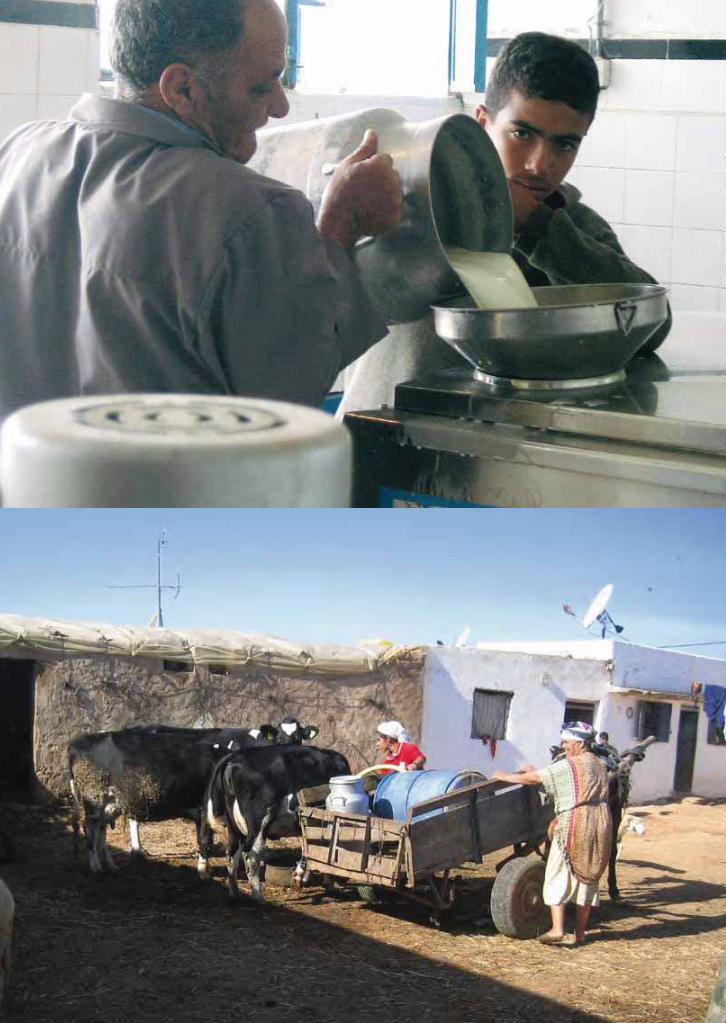
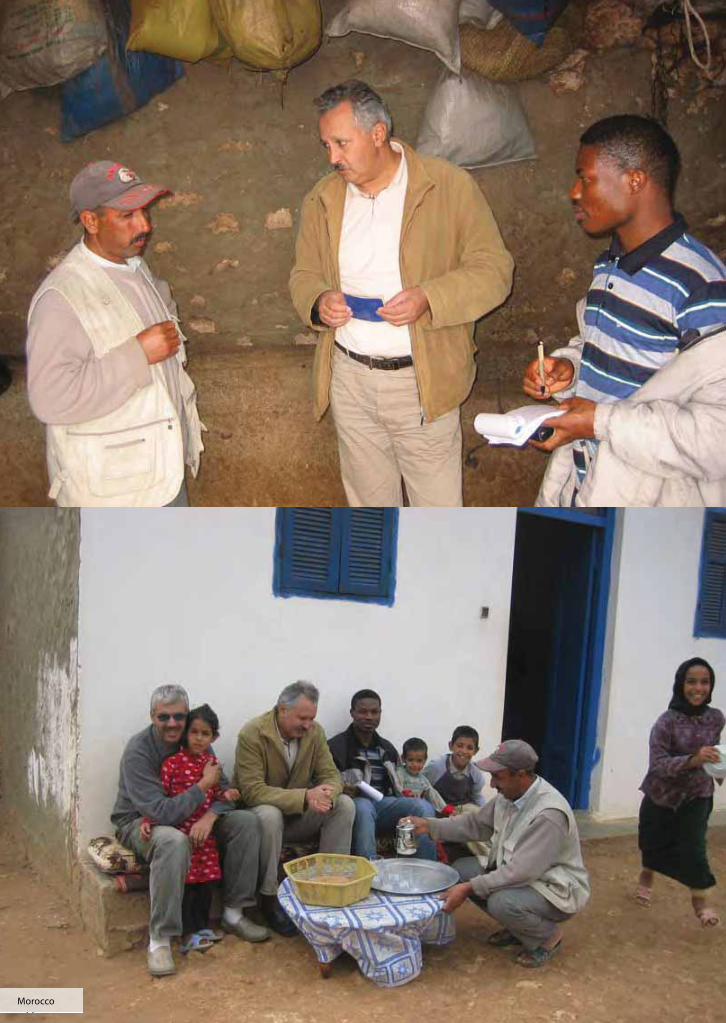
Milk production in Morocco is usually a side activity of crop farmers cultivating around 2 ha of land. The feeding system is similar to that in India/Pakistan and is mainly based on compound feed and green fodder. Milking is mostly done by hand and, in 2005, about 63 percent of the milk was delivered to formal milk processors.
In 2005, per capita milk consumption stood at 62 kg. Morocco is a net importer of dairy products (0.4 million tons ME), and is 80 percent self-sufficient in milk.
Peru
In 2005, Peru produced 1.27 million tons of ECM on 108 000 dairy farms, with an average of 6.4 dairy cows/farm producing about 32 litres of milk
per farm/day. This shows a yearly growth of 4.5 percent, of which the main determinant was a 6.5 percent increase in the number of cows in 2000 to 2005. Over the same period, however, yearly milk yields per cow decreased from 2 000 kg to 1 850 kg.
Dairy farming systems may be classified as low-input/low-yield. Feeding is based mainly on grazing supplemented by small quantities of low-cost compound feed. Some milk is produced on intensive dairy farms, mainly in the coastal region. Milking is done by hand and the milk transported to milk collection centres in villages or collected by local milkmen; about 94 percent is delivered to formal milk processors.
In 2005, annual per capita milk consumption stood at 51 kg. Between 2000 and 2005, increased demand for milk was mainly driven by population growth (1.5 percent/year). Peru is approximately 93 percent self-sufficient in milk.
© IFCN 2008 37
Germany
Germany was the world’s fourth largest producer of milk in 2005, accounting for 29.5 million tons of ECM, and the second largest milk processor (behind
the USA). Milk is produced by 110 000 dairy farmers with average herds of 37.6 cows producing 732 kg of milk/day (19.5 kg/cow). National milk production has been stable since 1990 because of the milk quota system. Yields increased by 2 percent per annum in 2000 to 2005, although the number of dairy cows decreased by 2 percent per annum over the same period.
The country’s dairy production systems may be classified as high-input/high-output (7 100 litres per cow/year). Feeding is based mainly on grass/corn silage and compound feed. Milking is done by machine, after which the milk is stored on-farm in cooling tanks and collected by local milk processors every two days. About 95 percent is delivered to milk processors; the remainder is either used on the farms (for home consumption or for feeding calves) or is sold directly to consumers.
Having remained stable since 1996, the country’s annual per capita consumption stood at 309 kg of ECM in 2005. As a member of the EU, Germany exports about 40 percent of its milk and imports some 30 percent of its consumption needs. The country is 116 to 127 percent self-sufficient in milk, which translates into a surplus of 4 to 6 million tons per annum.
United States of America
The USA produces 76 million tons of ECM/year, generated by 78 000 dairy farms with average dairy herds of 115 cows producing 2 643 litres/day (or 23 litres/cow). Since
1975, national milk production has grown steadily by 1.1 percent per annum, driven by yield increases of 1.5 percent and a 0.3 percent reduction in the number of dairy cows.
The country’s dairy production systems may be classified
as high-input/high-output (8 400 litres per cow/year). As in Germany, feeding is based mainly on grass/corn silage and compound feed. The cows are milked by machine, mainly in milking parlours, and the milk is stored on-farm in cooling tanks before being sent to formal processors. About 99 percent is delivered to processors.
Since 2000, annual per capita milk consumption has remained stable at around 250 kg of ECM. In 2005, the USA exported about 3.4 percent of its milk and imported 2.8 percent of its internal demand. Self-sufficiency stood at around 104 percent in 2000 to 2005, translating into an annual milk surplus of 3 to 5 million tons.
New Zealand
In 2005, New Zealand produced 15.8 million tons of ECM, corresponding to about 20 percent of that in the USA. This was produced by 12 300 dairy farmers with average dairy herds of 315 cows yielding 3 526 kg/day (or 11.2 kg/cow).
Production increased by 4.6 percent per annum in 2000 to 2005, mainly driven by increased numbers of cows,
The country’s dairy production systems may be defined as intermediate-input/intermediate-output (3 868 litres per cow/year). Feeding is based mainly on grazing. Milk production is therefore seasonal, peaking in November (180 percent of the annual average) and at its lowest in June and July (5 to 10 percent). Milking usually takes place in swing-over parlours or rotary milking systems, after which the milk is stored in cooling tanks on-farm and subsequently collected by local milk processors. Almost 100 percent of the milk is delivered to formal milk processors.
New Zealand exports about 95 percent of its milk production and, with an export volume of about 15 million tons, it is the world’s largest exporter of the commodity.
3.1 Summary
India
40 © IFCN 2008
Milk pricing and quality
Production vs demand Export / Import profilein Mill tons ME
Processing profile in % of milk produced
Consumption pattern in kg ME / capita / year
Status and key developments
Milk prices and tariffs The chain for liquid milk
Trade ratios
Seasonality profile 2004
Self-sufficiency in milkExports / nat. productionImports / nat. consumption
in Mill tons ME
Surplus / deficit
Milk productionDemand Imports
Exports
year average = 100
Milk price monthlyMilk production monthly
Published in IFCN Dairy Report 2006, Chapter 3.
50
60
70
80
90
100
110
120
130
140
150
Milk price monthlyMilk production monthly
Dec
NovOct
Sep
Au
gJu
lJu
nM
ayA
pr
Mar
Feb
Jan
0
200
400
600
800
1,000
1,200
1,400
1,600
2004
2003
2002
2001
2000
1999
1998
1997
1996
Consumer price
Margin (Processor, retailer, VAT)»Farmers' milk price« (ECM)
0
200
400
600
800
1,000
1,200
1,400
1,600
1,800
World market price + 2004 tariffs
World market price (SMP/butter)Milk price in the country
2004
2003
2002
2001
2000
1999
1998
1997
1996
0
20
40
60
80
100
120
2004
2003
2002
2001
2000
1999
1998
1997
1996
1995
1994
1993
1992
1991
1990
0 %
10 %
20 %
30 %
40 %
50 %
60 %
70 %
80 %
90 %
100 %
2004
2003
2002
2001
2000
1999
1998
1997
1996
1995
1994
1993
1992
1991
1990
0.00
0.05
0.10
0.15
0.20
0.25
0.30
0.35
2004
2003
2002
2001
2000
1999
1998
1997
1996
1995
1994
1993
1992
1991
1990
-20
0
20
40
60
80
100
120
2004
2003
2002
2001
2000
1999
1998
1997
1996
1995
1994
1993
1992
1991
1990
Status 2004
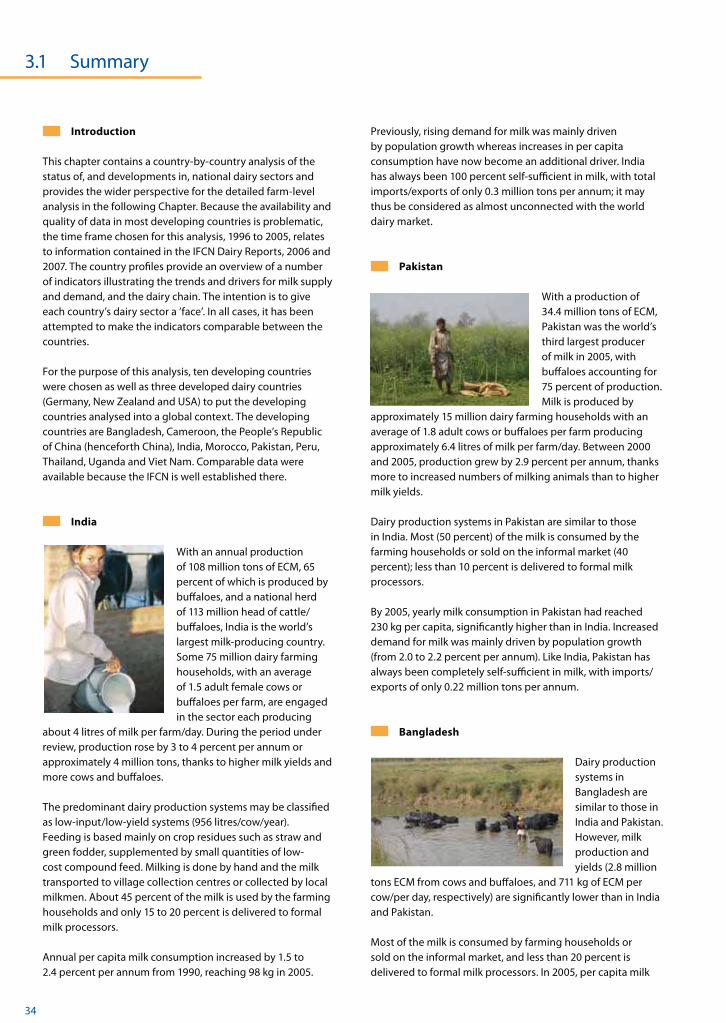
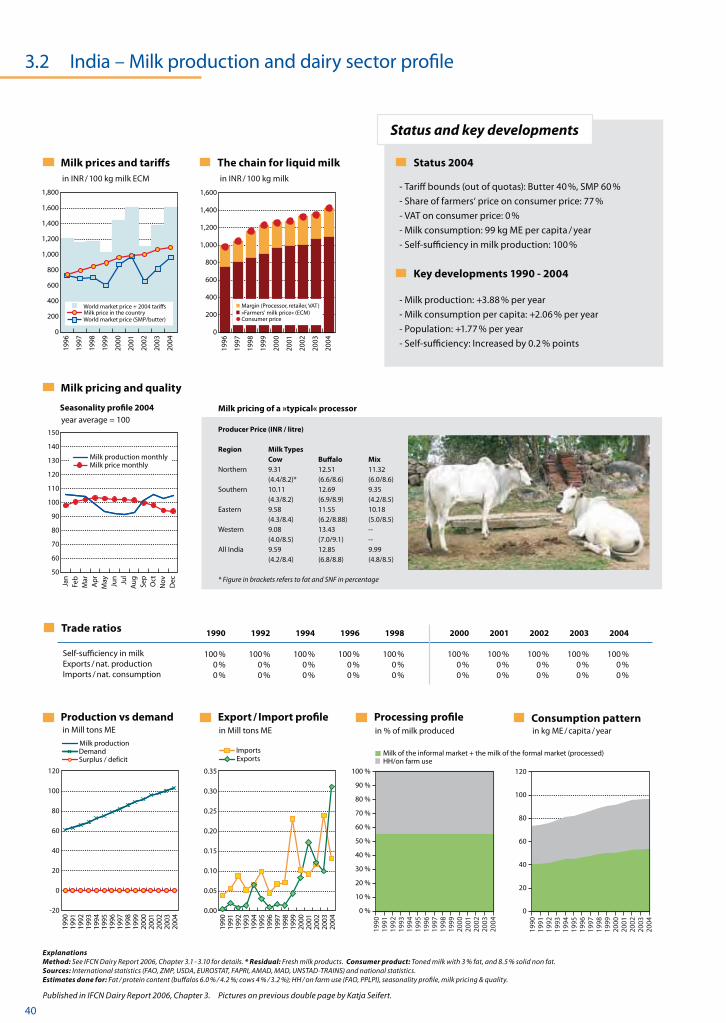
- Tariff bounds (out of quotas): Butter 40 %, SMP 60 %- Share of farmers‘ price on consumer price: 77 % - VAT on consumer price: 0 %- Milk consumption: 99 kg ME per capita / year- Self-sufficiency in milk production: 100 %
Key developments 1990 - 2004 - Milk production: +3.88 % per year- Milk consumption per capita: +2.06 % per year- Population: +1.77 % per year- Self-sufficiency: Increased by 0.2 % points
in INR / 100 kg milk ECM in INR / 100 kg milk
ExplanationsMethod: See IFCN Dairy Report 2006, Chapter 3.1 - 3.10 for details. * Residual: Fresh milk products. Consumer product: Toned milk with 3 % fat, and 8.5 % solid non fat. Sources: International statistics (FAO, ZMP, USDA, EUROSTAT, FAPRI, AMAD, MAD, UNSTAD-TRAINS) and national statistics. Estimates done for: Fat / protein content (buffalos 6.0 % / 4.2 %; cows 4 % / 3.2 %); HH / on farm use (FAO, PPLPI), seasonality profile, milk pricing & quality.
1990 1992 1994 1996 1998 2000 2001 2002 2003 2004
100 % 100 % 100 % 100 % 100 % 100 % 100 % 100 % 100 % 100 % 0 % 0 % 0 % 0 % 0 % 0 % 0 % 0 % 0 % 0 % 0 % 0 % 0 % 0 % 0 % 0 % 0 % 0 % 0 % 0 %
Milk pricing of a »typical« processor
Producer Price (INR / litre)
Region Milk Types Cow Buffalo Mix Northern 9.31 12.51 11.32 (4.4/8.2)* (6.6/8.6) (6.0/8.6)Southern 10.11 12.69 9.35 (4.3/8.2) (6.9/8.9) (4.2/8.5)Eastern 9.58 11.55 10.18 (4.3/8.4) (6.2/8.88) (5.0/8.5)Western 9.08 13.43 -- (4.0/8.5) (7.0/9.1) --All India 9.59 12.85 9.99 (4.2/8.4) (6.8/8.8) (4.8/8.5)
* Figure in brackets refers to fat and SNF in percentage
Milk of the informal market + the milk of the formal market (processed)HH/on farm use
3.2 India – Milk production and dairy sector profile
Pictures on previous double page by Katja Seifert.
© IFCN 2008 41
Key variables
Farm structure 2005
Milk production in ECM Production (mill t)Cows (in 1,000’s )Yield (t / cow / year)
Farm structure No. of dairy farms (in 1,000’s)Average farm size (cow s / farm)Milk per farm (t milk / farm / year) Prices in national currencyCull cow price (EUR / kg live weight)Land price – buy (EUR / ha)Quota price (EUR / kg milk)
Farm structure Milk and feed price Milk / feed price ratio
Status and key developments
Size classes
% of dairy farms in size classes % of cows in size classes
% of cows in size classes EUR / 100 kg Milk price / feed price
Cows per size classFarms per size class
Milk / barley price ratioMilk / feed price ratio
World feed price (nominal)
Milk price (nominal) Milk price (real)Feed price (nominal)
Published in IFCN Dairy Report 2007, Chapter 3.
Change in milk production (% per year)
1.2
2.7
2.8 1.43.3
1.81.3
3.2 4.6
15.3
6.5
2.7
7.7
3.1
1.42.5
2.7
1.8
2.38.0
8.91.6
5.7
5.5
0.0-9.03.0
6.7
-2.64.5
0.0
-4.62.2 3.0
-1.9
3.2 India – Milk production and dairy sector profile
0 %
10 %
20 %
30 %
40 %
50 %
60 %
70 %
80 %
90 %
100 %
Total female bovines
Total male bovines
All
milk
spec
ies
Bu
ffal
o
Ind
igen
ou
sco
w
Cro
ssb
red
cow
2005
2004
2003
2002
2001
2000
1999
1998
1997
1996
0
100
200
300
400
500
600
700
800
900
1,000Favourable
Not favourable
0.0
0.5
1.0
1.5
2.0
2.5
3.0
2005
2004
2003
2002
2001
2000
1999
1998
1997
1996
Annual growth rates 1996 1998 2000 2001 2002 2003 2004 2005 2000 - 2005
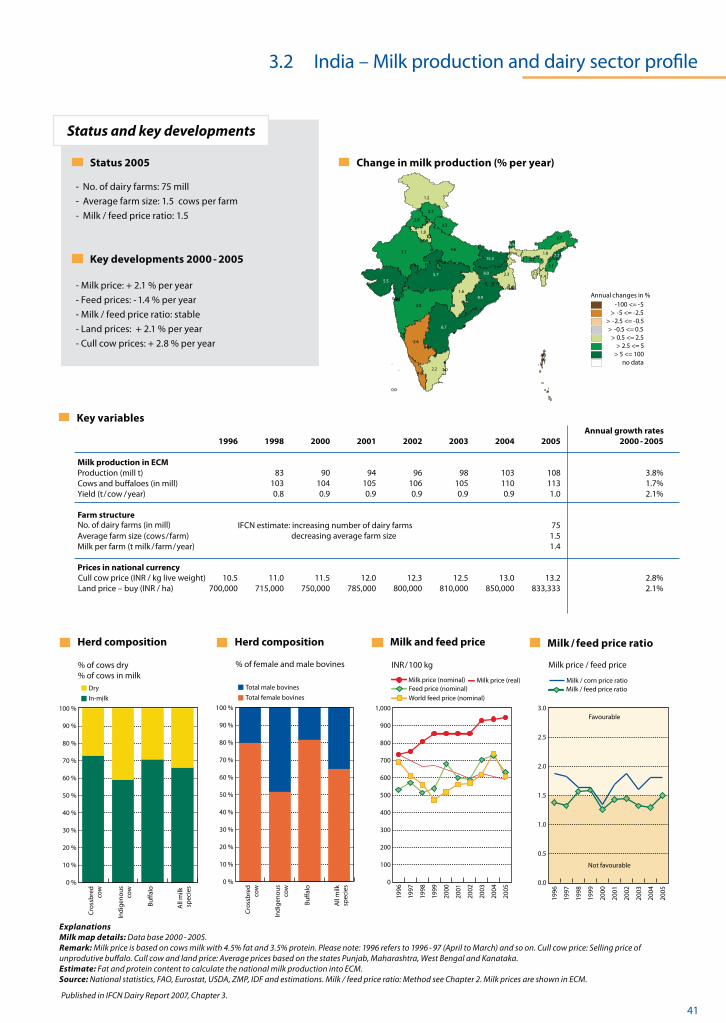
83 90 94 96 98 103 108 3.8% 103 104 105 106 105 110 113 1.7% 0.8 0.9 0.9 0.9 0.9 0.9 1.0 2.1% IFCN estimate: increasing number of dairy farms 75 decreasing average farm size 1.5 1.4 10.5 11.0 11.5 12.0 12.3 12.5 13.0 13.2 2.8% 700,000 715,000 750,000 785,000 800,000 810,000 850,000 833,333 2.1%
INR / 100 kg
Milk / corn price ratio
0 %
10 %
20 %
30 %
40 %
50 %
60 %
70 %
80 %
90 %
100 %
In-milk
Dry
All
milk
sp
ecie
s
Bu
ffal
o
Ind
igen
ou
sco
w
Cro
ssb
red
cow
Annual changes in %-100 <= -5
> -5 <= -2.5> -2.5 <= -0.5> -0.5 <= 0.5
> 0.5 <= 2.5> 2.5 <= 5
> 5 <= 100no data
Status 2005
- No. of dairy farms: 75 mill- Average farm size: 1.5 cows per farm- Milk / feed price ratio: 1.5
Key developments 2000 - 2005 - Milk price: + 2.1 % per year- Feed prices: - 1.4 % per year- Milk / feed price ratio: stable- Land prices: + 2.1 % per year- Cull cow prices: + 2.8 % per year
Cull cow price (INR / kg live weight)Land price – buy (INR / ha)
ExplanationsMilk map details: Data base 2000 - 2005.Remark: Milk price is based on cows milk with 4.5% fat and 3.5% protein. Please note: 1996 refers to 1996 - 97 (April to March) and so on. Cull cow price: Selling price of unprodutive buffalo. Cull cow and land price: Average prices based on the states Punjab, Maharashtra, West Bengal and Kanataka.Estimate: Fat and protein content to calculate the national milk production into ECM. Source: National statistics, FAO, Eurostat, USDA, ZMP, IDF and estimations. Milk / feed price ratio: Method see Chapter 2. Milk prices are shown in ECM.
Cows and buffaloes (in mill)
Herd composition
% of cows dry % of cows in milk
Herd composition
% of female and male bovines
No. of dairy farms (in mill)
Pakistan
44 © IFCN 2008
Milk pricing and quality
Production vs demand Export / Import profilein Mill tons ME
Processing profile in % of milk produced
Consumption pattern in kg ME / capita / year
Status and key developments
Milk prices and tariffs The chain for liquid milk
Trade ratios
Seasonality profile 2004
Self-sufficiency in milkExports / nat. productionImports / nat. consumption
in Mill tons ME
Surplus / deficit
Milk productionDemand Imports
Exports
year average = 100
Milk price monthlyMilk production monthly
Published in IFCN Dairy Report 2006, Chapter 3.
0
500
1,000
1,500
2,000
2,500
3,000
3,500
2004
2003
2002
2001
2000
1999
1998
1997
1996
Consumer price
Margin (Processor, retailer, VAT)»Farmers' milk price« (ECM)
0
200
400
600
800
1,000
1,200
1,400
1,600
1,800
World market price + 2004 tariffs
World market price (SMP/butter)Milk price in the country
2004
2003
2002
2001
2000
1999
1998
1997
1996
in PKR / 100 kg milk ECM in PKR / 100 kg milk
3.3 Pakistan – Milk production and dairy sector profile
50
60
70
80
90
100
110
120
130
140
150
Milk price monthlyMilk production monthly
Dec
NovOct
Sep
Au
gJu
lJu
nM
ayA
pr
Mar
Feb
Jan
0
50
100
150
200
250
2004
2003
2002
2001
2000
1999
1998
1997
1996
1995
1994
1993
1992
1991
1990
0 %
10 %
20 %
30 %
40 %
50 %
60 %
70 %
80 %
90 %
100 %
2004
2003
2002
2001
2000
1999
1998
1997
1996
1995
1994
1993
1992
1991
1990
0.00
0.05
0.10
0.15
0.20
0.25
2004
2003
2002
2001
2000
1999
1998
1997
1996
1995
1994
1993
1992
1991
1990
-5
0
5
10
15
20
25
30
35
40
2004
2003
2002
2001
2000
1999
1998
1997
1996
1995
1994
1993
1992
1991
1990
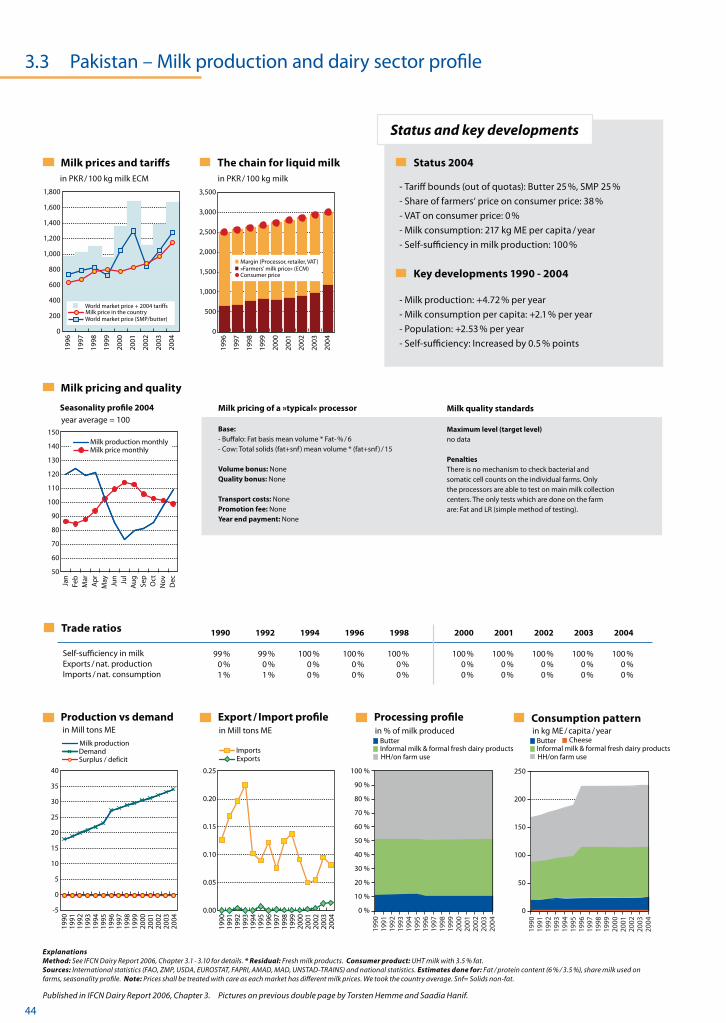
Status 2004
- Tariff bounds (out of quotas): Butter 25 %, SMP 25 %- Share of farmers‘ price on consumer price: 38 % - VAT on consumer price: 0 %- Milk consumption: 217 kg ME per capita / year- Self-sufficiency in milk production: 100 %
Key developments 1990 - 2004 - Milk production: +4.72 % per year- Milk consumption per capita: +2.1 % per year- Population: +2.53 % per year- Self-sufficiency: Increased by 0.5 % points
ExplanationsMethod: See IFCN Dairy Report 2006, Chapter 3.1 - 3.10 for details. * Residual: Fresh milk products. Consumer product: UHT milk with 3.5 % fat.Sources: International statistics (FAO, ZMP, USDA, EUROSTAT, FAPRI, AMAD, MAD, UNSTAD-TRAINS) and national statistics. Estimates done for: Fat / protein content (6 % / 3.5 %), share milk used on farms, seasonality profile. Note: Prices shall be treated with care as each market has different milk prices. We took the country average. Snf= Solids non-fat.
1990 1992 1994 1996 1998 2000 2001 2002 2003 2004
99 % 99 % 100 % 100 % 100 % 100 % 100 % 100 % 100 % 100 % 0 % 0 % 0 % 0 % 0 % 0 % 0 % 0 % 0 % 0 % 1 % 1 % 0 % 0 % 0 % 0 % 0 % 0 % 0 % 0 %
Milk pricing of a »typical« processor
Base: - Buffalo: Fat basis mean volume * Fat- % / 6- Cow: Total solids (fat+snf ) mean volume * (fat+snf ) / 15
Volume bonus: NoneQuality bonus: None
Transport costs: NonePromotion fee: NoneYear end payment: None
Milk quality standards
Maximum level (target level)no data
PenaltiesThere is no mechanism to check bacterial and somatic cell counts on the individual farms. Onlythe processors are able to test on main milk collectioncenters. The only tests which are done on the farmare: Fat and LR (simple method of testing).
Informal milk & formal fresh dairy productsButter
HH/on farm useInformal milk & formal fresh dairy productsButter
HH/on farm use
Cheese
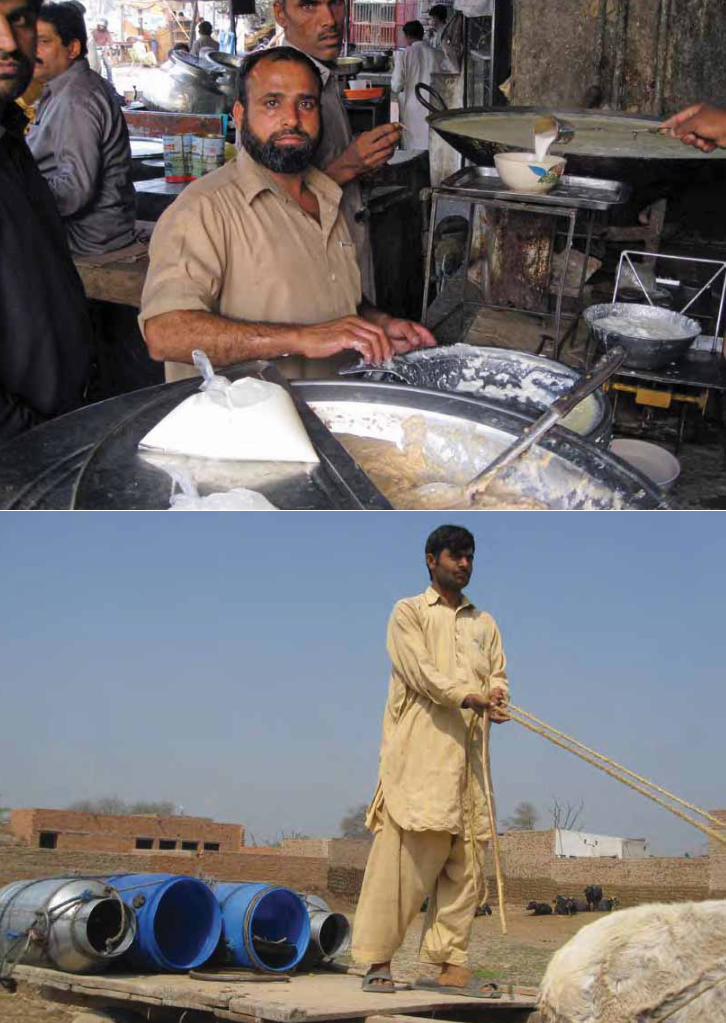
Pictures on previous double page by Torsten Hemme and Saadia Hanif.
© IFCN 2008 45
Key variables
Farm structure 2005
Milk production in ECM Production (mill t)Cows (in 1,000’s )Yield (t / cow / year)
Farm structure No. of dairy farms (in 1,000’s)Average farm size (cow s / farm)Milk per farm (t milk / farm / year) Prices in national currencyCull cow price (EUR / kg live weight)Land price – buy (EUR / ha)Quota price (EUR / kg milk)
Farm structure Milk and feed price Milk / feed price ratio
Status and key developments
Size classes
% of dairy farms in size classes % of cows in size classes
% of cows in size classes EUR / 100 kg Milk price / feed price
Cows per size classFarms per size class
Milk / barley price ratioMilk / feed price ratio
World feed price (nominal)
Milk price (nominal) Milk price (real)Feed price (nominal)
Published in IFCN Dairy Report 2007, Chapter 3.
3.3 Pakistan – Milk production and dairy sector profile
0 %
10 %
20 %
30 %
40 %
50 %
60 %
70 %
80 %
90 %
100 %
16 - 25
> 40
6 - 15
26 - 40
1 - 5
2003
2002
2001
2000
1999
1998
1997
1996
2005
2004
2003
2002
2001
2000
1999
1998
1997
1996
0
200
400
600
800
1,000
1,200
1,400Favourable
Not favourable
0.0
0.5
1.0
1.5
2.0
2.5
3.0
2005
2004
2003
2002
2001
2000
1999
1998
1997
1996
0 %
10 %
20 %
30 %
40 %
50 %
60 %
70 %
> 2010-193-91-2
Milk production volume per region 2005
Milk production change: + 2.9 % per year
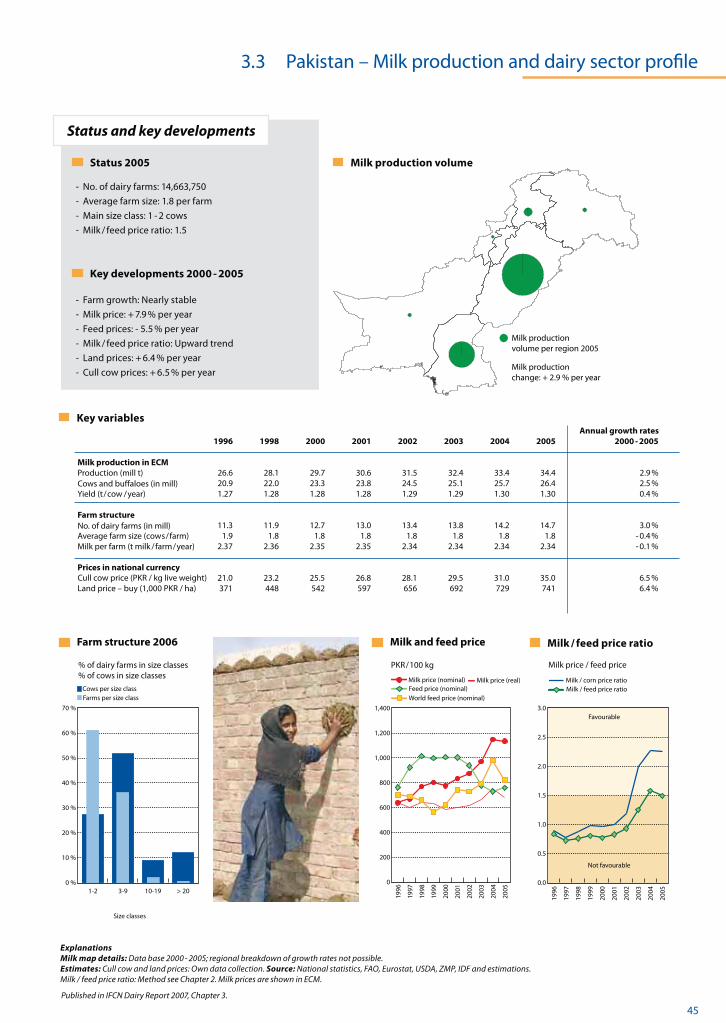
Annual growth rates 1996 1998 2000 2001 2002 2003 2004 2005 2000 - 2005
26.6 28.1 29.7 30.6 31.5 32.4 33.4 34.4 2.9 % 20.9 22.0 23.3 23.8 24.5 25.1 25.7 26.4 2.5 % 1.27 1.28 1.28 1.28 1.29 1.29 1.30 1.30 0.4 % 11.3 11.9 12.7 13.0 13.4 13.8 14.2 14.7 3.0 % 1.9 1.8 1.8 1.8 1.8 1.8 1.8 1.8 - 0.4 % 2.37 2.36 2.35 2.35 2.34 2.34 2.34 2.34 - 0.1 % 21.0 23.2 25.5 26.8 28.1 29.5 31.0 35.0 6.5 % 371 448 542 597 656 692 729 741 6.4 %
Status 2005
- No. of dairy farms: 14,663,750- Average farm size: 1.8 per farm- Main size class: 1 - 2 cows- Milk / feed price ratio: 1.5
Key developments 2000 - 2005 - Farm growth: Nearly stable- Milk price: + 7.9 % per year- Feed prices: - 5.5 % per year- Milk / feed price ratio: Upward trend- Land prices: + 6.4 % per year- Cull cow prices: + 6.5 % per year
Milk production volume
ExplanationsMilk map details: Data base 2000 - 2005; regional breakdown of growth rates not possible.Estimates: Cull cow and land prices: Own data collection. Source: National statistics, FAO, Eurostat, USDA, ZMP, IDF and estimations. Milk / feed price ratio: Method see Chapter 2. Milk prices are shown in ECM.
Cull cow price (PKR / kg live weight)Land price – buy (1,000 PKR / ha)
Cows and buffaloes (in mill)
PKR / 100 kg
Milk / corn price ratio
Farm structure 2006
No. of dairy farms (in mill)
Bangladesh
48 © IFCN 2008
Milk pricing and quality
Production vs demand Export / Import profilein Mill tons ME
Processing profile in % of milk produced
Consumption pattern in kg ME / capita / year
Status and key developments
Milk prices and tariffs The chain for liquid milk
Trade ratios
Seasonality profile 2004
Self-sufficiency in milkExports / nat. productionImports / nat. consumption
in Mill tons ME
Surplus / deficit
Milk productionDemand Imports
Exports
year average = 100
Milk price monthlyMilk production monthly
Published in IFCN Dairy Report 2006, Chapter 3.
3.4 Bangladesh – Milk production and dairy sector profile
0
200
400
600
800
1,000
1,200
1,400
1,600
1,800
2,000
World market price + 2004 tariffs
World market price (SMP/butter)Milk price in the country
2004
2003
2002
2001
2000
1999
1998
1997
1996
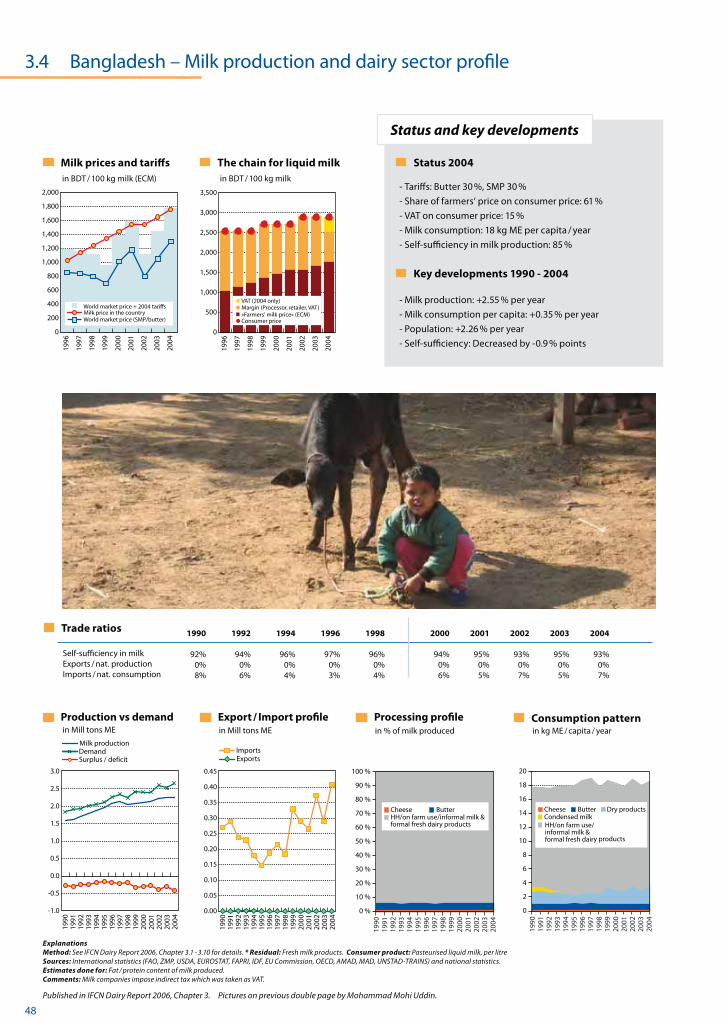
Status 2004
- Tariffs: Butter 30 %, SMP 30 %- Share of farmers‘ price on consumer price: 61 % - VAT on consumer price: 15 % - Milk consumption: 18 kg ME per capita / year- Self-sufficiency in milk production: 85 %
Key developments 1990 - 2004 - Milk production: +2.55 % per year- Milk consumption per capita: +0.35 % per year- Population: +2.26 % per year- Self-sufficiency: Decreased by -0.9 % points
in BDT / 100 kg milk (ECM)
ExplanationsMethod: See IFCN Dairy Report 2006, Chapter 3.1 - 3.10 for details. * Residual: Fresh milk products. Consumer product: Pasteurised liquid milk, per litreSources: International statistics (FAO, ZMP, USDA, EUROSTAT, FAPRI, IDF, EU Commission, OECD, AMAD, MAD, UNSTAD-TRAINS) and national statistics.Estimates done for: Fat / protein content of milk produced.Comments: Milk companies impose indirect tax which was taken as VAT.
0
500
1,000
1,500
2,000
2,500
3,000
3,500
2004
2003
2002
2001
2000
1999
1998
1997
1996
Consumer price
Margin (Processor, retailer, VAT)»Farmers' milk price« (ECM)
VAT (2004 only)
in BDT / 100 kg milk
0
2
4
6
8
10
12
14
16
18
20
2004
2003
2002
2001
2000
1999
1998
1997
1996
1995
1994
1993
1992
1991
1990
0 %
10 %
20 %
30 %
40 %
50 %
60 %
70 %
80 %
90 %
100 %
2004
2003
2002
2001
2000
1999
1998
1997
1996
1995
1994
1993
1992
1991
1990
0.00
0.05
0.10
0.15
0.20
0.25
0.30
0.35
0.40
0.45
2004
2003
2002
2001
2000
1999
1998
1997
1996
1995
1994
1993
1992
1991
1990
-1.0
-0.5
0.0
0.5
1.0
1.5
2.0
2.5
3.0
2004
2003
2002
2001
2000
1999
1998
1997
1996
1995
1994
1993
1992
1991
1990
HH/on farm use/informal milk & formal fresh dairy products
ButterCheeseCondensed milk
Dry productsButterCheese
HH/on farm use/informal milk & formal fresh dairy products
HH/on farm use/informal milk & formal fresh dairy
1990 1992 1994 1996 1998 2000 2001 2002 2003 2004
92% 94% 96% 97% 96% 94% 95% 93% 95% 93% 0% 0% 0% 0% 0% 0% 0% 0% 0% 0% 8% 6% 4% 3% 4% 6% 5% 7% 5% 7%
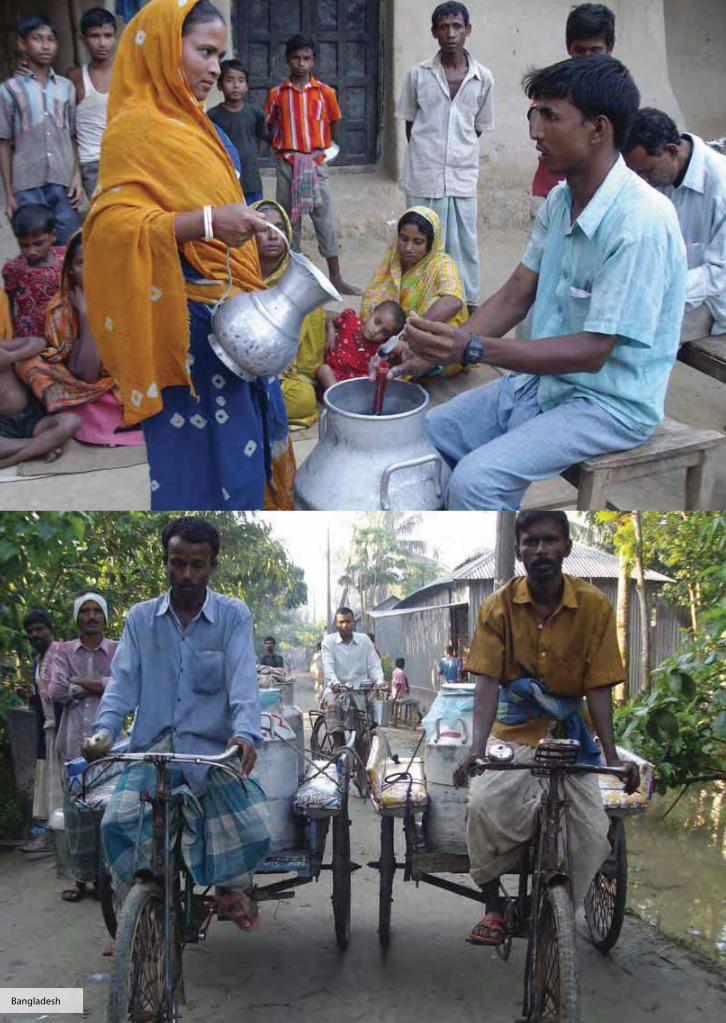
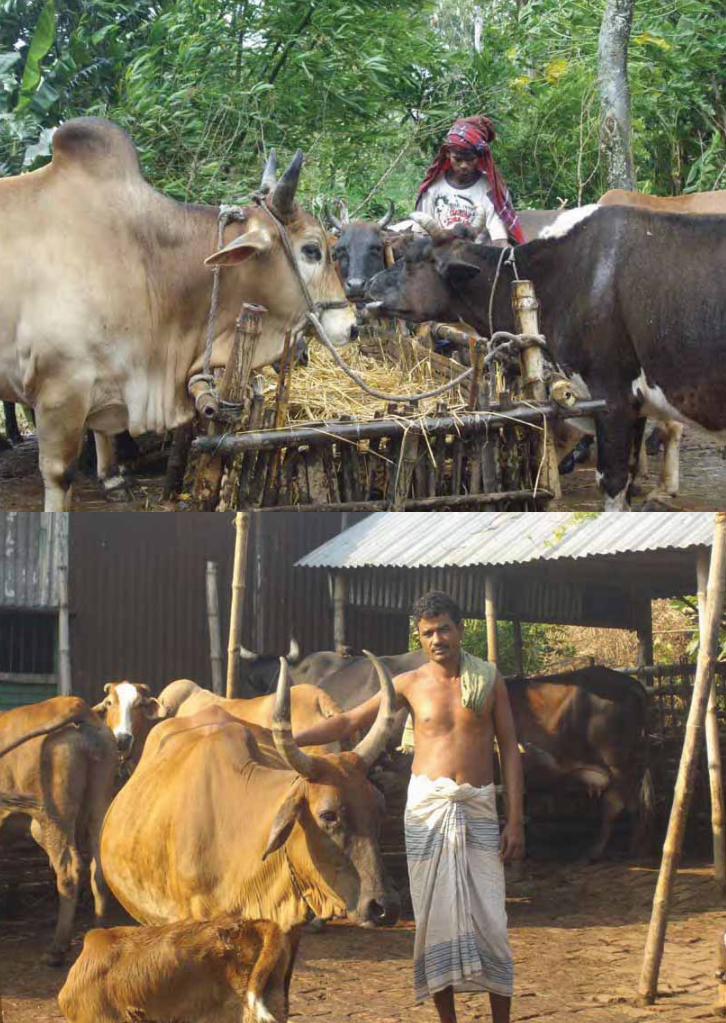
Pictures on previous double page by Mohammad Mohi Uddin.
© IFCN 2008 49
Key variables
Farm structure 2005
Milk production in ECM Production (mill t)Cows (in 1,000’s )Yield (t / cow / year)
Farm structure No. of dairy farms (in 1,000’s)Average farm size (cow s / farm)Milk per farm (t milk / farm / year) Prices in national currencyCull cow price (EUR / kg live weight)Land price – buy (EUR / ha)Quota price (EUR / kg milk)
Farm structure Milk and feed price Milk / feed price ratio
Status and key developments
Size classes
% of dairy farms in size classes % of cows in size classes
% of cows in size classes EUR / 100 kg Milk price / feed price
Cows per size classFarms per size class
Milk / barley price ratioMilk / feed price ratio
World feed price (nominal)
Milk price (nominal) Milk price (real)Feed price (nominal)
Published in IFCN Dairy Report 2007, Chapter 3.
3.4 Bangladesh – Milk production and dairy sector profile
2005
2004
2003
2002
2001
2000
1999
1998
1997
1996
0
500
1,000
1,500
2,000
2,500Favourable
Not favourable
0.0
0.5
1.0
1.5
2.0
2.5
3.0
2005
2004
2003
2002
2001
2000
1999
1998
1997
1996
Milk production volume per region 2003
Milk production change: + 0.5 % per year
Milk production volume
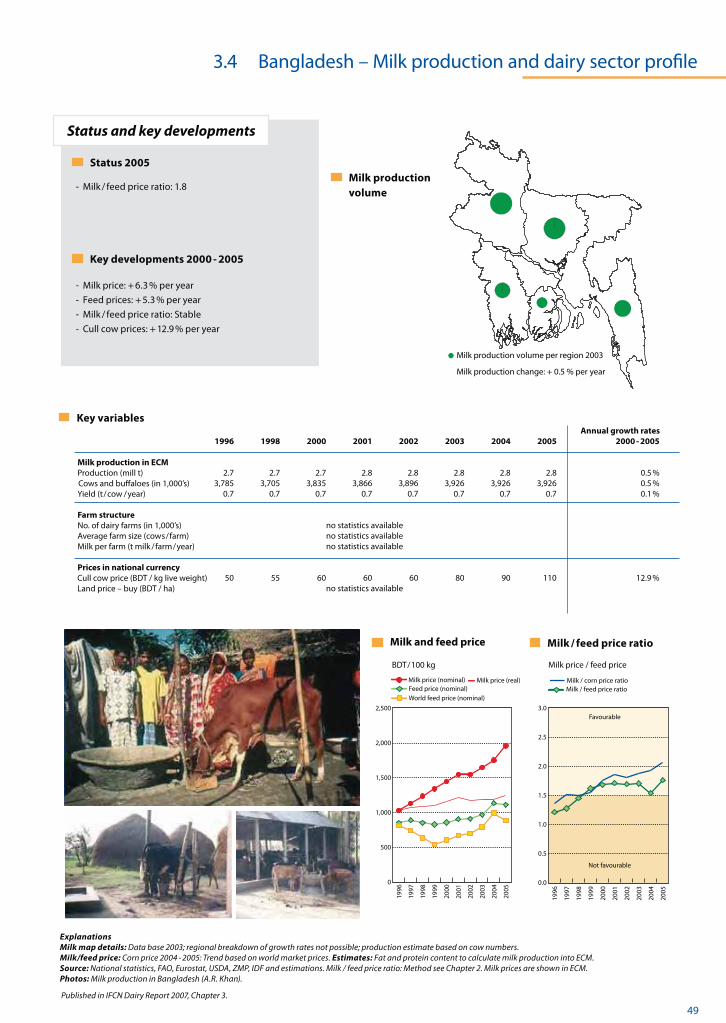
Status 2005
- Milk / feed price ratio: 1.8
Key developments 2000 - 2005 - Milk price: + 6.3 % per year- Feed prices: + 5.3 % per year- Milk / feed price ratio: Stable- Cull cow prices: + 12.9 % per year
Annual growth rates 1996 1998 2000 2001 2002 2003 2004 2005 2000 - 2005 2.7 2.7 2.7 2.8 2.8 2.8 2.8 2.8 0.5 % 3,785 3,705 3,835 3,866 3,896 3,926 3,926 3,926 0.5 % 0.7 0.7 0.7 0.7 0.7 0.7 0.7 0.7 0.1 % no statistics available no statistics available no statistics available 50 55 60 60 60 80 90 110 12.9 % no statistics available
Cows and buffaloes (in 1,000’s)
ExplanationsMilk map details: Data base 2003; regional breakdown of growth rates not possible; production estimate based on cow numbers.Milk/feed price: Corn price 2004 - 2005: Trend based on world market prices. Estimates: Fat and protein content to calculate milk production into ECM. Source: National statistics, FAO, Eurostat, USDA, ZMP, IDF and estimations. Milk / feed price ratio: Method see Chapter 2. Milk prices are shown in ECM. Photos: Milk production in Bangladesh (A.R. Khan).
BDT / 100 kg
Milk / corn price ratio
Cull cow price (BDT / kg live weight)Land price – buy (BDT / ha)
50 © IFCN 2008Thailand
© IFCN 2008 51
52 © IFCN 2008
Milk pricing and quality
Production vs demand Export / Import profilein Mill tons ME
Processing profile in % of milk produced
Consumption pattern in kg ME / capita / year
Status and key developments
Milk prices and tariffs The chain for liquid milk
Trade ratios
Seasonality profile 2004
Self-sufficiency in milkExports / nat. productionImports / nat. consumption
in Mill tons ME
Surplus / deficit
Milk productionDemand Imports
Exports
year average = 100
Milk price monthlyMilk production monthly
Published in IFCN Dairy Report 2006, Chapter 3.
0
5
10
15
20
25
30
35
2004
2003
2002
2001
2000
1999
1998
1997
1996
1995
1994
1993
1992
1991
1990
0 %
10 %
20 %
30 %
40 %
50 %
60 %
70 %
80 %
90 %
100 %
2004
2003
2002
2001
2000
1999
1998
1997
1996
1995
1994
1993
1992
1991
1990
0.0
0.2
0.4
0.6
0.8
1.0
1.2
1.4
1.6
2004
2003
2002
2001
2000
1999
1998
1997
1996
1995
1994
1993
1992
1991
1990
-1.5
-1.0
-0.5
0.0
0.5
1.0
1.5
2.0
2004
2003
2002
2001
2000
1999
1998
1997
1996
1995
1994
1993
1992
1991
1990
3.5 Thailand – Milk production and dairy sector profile
HH/on farm use/informal milk & formal fresh dairy
0
200
400
600
800
1,000
1,200
1,400
1,600
World market price + 2004 tariffs
World market price (SMP/butter)Milk price in the country
2004
2003
2002
2001
2000
1999
1998
1997
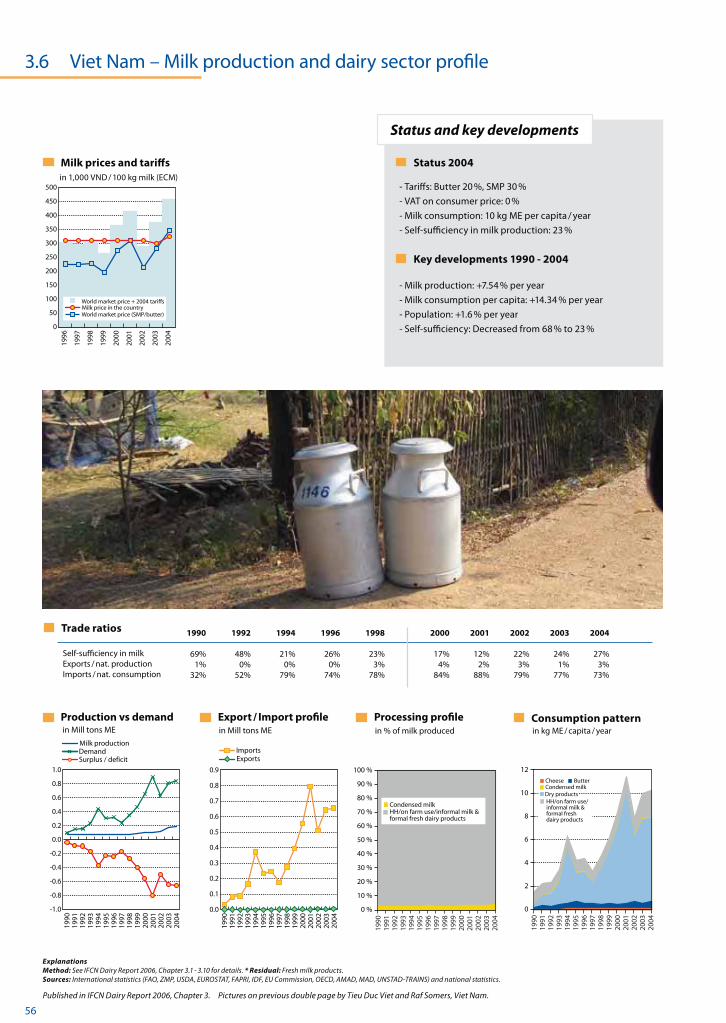
1996
in THB / 100 kg milk (ECM)
1990 1992 1994 1996 1998 2000 2001 2002 2003 2004
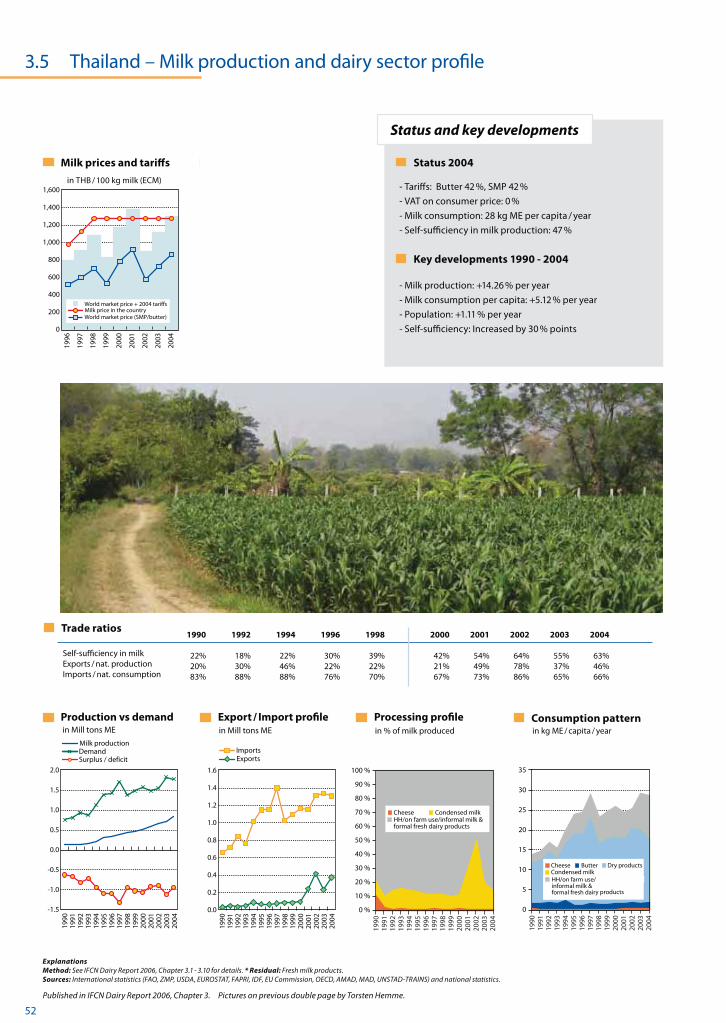
22% 18% 22% 30% 39% 42% 54% 64% 55% 63% 20% 30% 46% 22% 22% 21% 49% 78% 37% 46% 83% 88% 88% 76% 70% 67% 73% 86% 65% 66%
ExplanationsMethod: See IFCN Dairy Report 2006, Chapter 3.1 - 3.10 for details. * Residual: Fresh milk products. Sources: International statistics (FAO, ZMP, USDA, EUROSTAT, FAPRI, IDF, EU Commission, OECD, AMAD, MAD, UNSTAD-TRAINS) and national statistics.
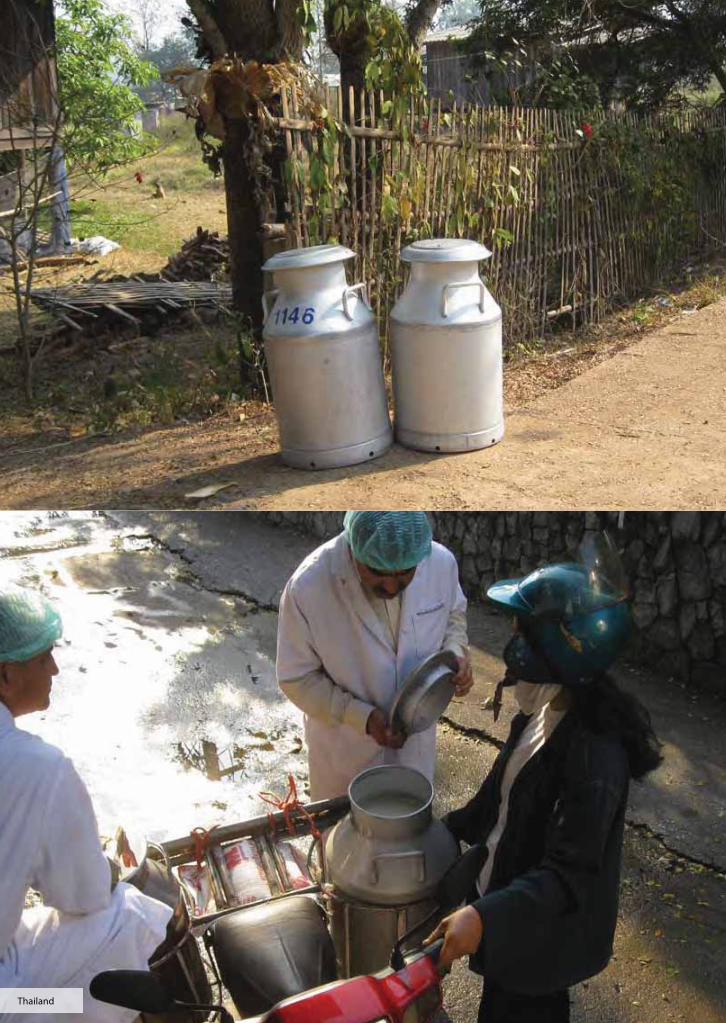
Pictures on previous double page by Torsten Hemme.
Status 2004
- Tariffs: Butter 42 %, SMP 42 % - VAT on consumer price: 0 % - Milk consumption: 28 kg ME per capita / year- Self-sufficiency in milk production: 47 %
Key developments 1990 - 2004 - Milk production: +14.26 % per year- Milk consumption per capita: +5.12 % per year- Population: +1.11 % per year- Self-sufficiency: Increased by 30 % points
HH/on farm use/informal milk & formal fresh dairy products
Condensed milkCheese
Condensed milkDry productsButterCheese
HH/on farm use/informal milk & formal fresh dairy products
HH/on farm use/informal milk & formal fresh dairy
© IFCN 2008 53
Key variables
Farm structure 2005
Milk production in ECM Production (mill t)Cows (in 1,000’s )Yield (t / cow / year)
Farm structure No. of dairy farms (in 1,000’s)Average farm size (cow s / farm)Milk per farm (t milk / farm / year) Prices in national currencyCull cow price (EUR / kg live weight)Land price – buy (EUR / ha)Quota price (EUR / kg milk)
Farm structure Milk and feed price Milk / feed price ratio
Status and key developments
Size classes
% of dairy farms in size classes % of cows in size classes
% of cows in size classes EUR / 100 kg Milk price / feed price
Cows per size classFarms per size class
Milk / barley price ratioMilk / feed price ratio
World feed price (nominal)
Milk price (nominal) Milk price (real)Feed price (nominal)
Published in IFCN Dairy Report 2007, Chapter 3.
3.5 Thailand – Milk production and dairy sector profile
0 %
10 %
20 %
30 %
40 %
50 %
60 %
70 %
80 %
90 %
100 %
2005
2004
2003
2002
2001
2000
1999
1998
1997
1996
> 200 - 10 11 - 20
2005
2004
2003
2002
2001
2000
1999
1998
1997
1996
0
200
400
600
800
1,000
1,200
1,400Favourable
Not favourable
0.0
0.5
1.0
1.5
2.0
2.5
3.0
2005
2004
2003
2002
2001
2000
1999
1998
1997
1996
Annual growth rates 1996 1998 2000 2001 2002 2003 2004 2005 2000 - 2005
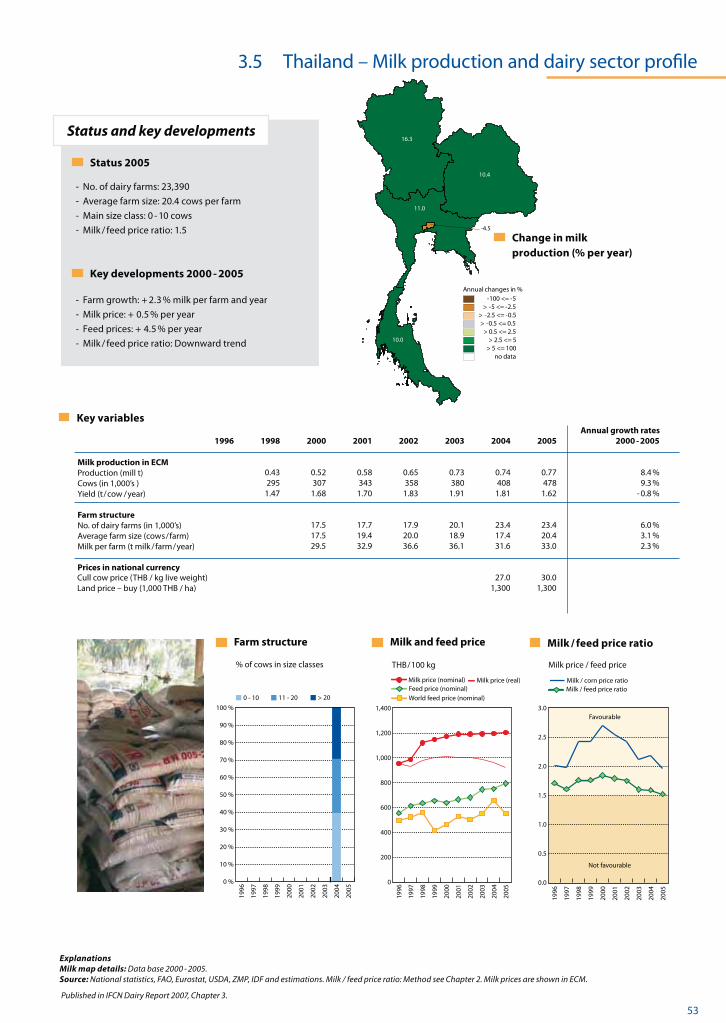
0.43 0.52 0.58 0.65 0.73 0.74 0.77 8.4 % 295 307 343 358 380 408 478 9.3 % 1.47 1.68 1.70 1.83 1.91 1.81 1.62 - 0.8 % 17.5 17.7 17.9 20.1 23.4 23.4 6.0 % 17.5 19.4 20.0 18.9 17.4 20.4 3.1 % 29.5 32.9 36.6 36.1 31.6 33.0 2.3 % 27.0 30.0 1,300 1,300
Status 2005
- No. of dairy farms: 23,390- Average farm size: 20.4 cows per farm- Main size class: 0 - 10 cows- Milk / feed price ratio: 1.5
Key developments 2000 - 2005 - Farm growth: + 2.3 % milk per farm and year- Milk price: + 0.5 % per year- Feed prices: + 4.5 % per year- Milk / feed price ratio: Downward trend
ExplanationsMilk map details: Data base 2000 - 2005.Source: National statistics, FAO, Eurostat, USDA, ZMP, IDF and estimations. Milk / feed price ratio: Method see Chapter 2. Milk prices are shown in ECM.
THB / 100 kg
Milk / corn price ratio
-4.5
11.0
10.4
16.3
10.0
-4.5
11.0
10.4
16.3
10.0
Change in milk production (% per year)
Annual changes in %-100 <= -5
> -5 <= -2.5> -2.5 <= -0.5> -0.5 <= 0.5
> 0.5 <= 2.5> 2.5 <= 5
> 5 <= 100no data
Cull cow price (THB / kg live weight)Land price – buy (1,000 THB / ha)
Viet Nam
56 © IFCN 2008
Milk pricing and quality
Production vs demand Export / Import profilein Mill tons ME
Processing profile in % of milk produced
Consumption pattern in kg ME / capita / year
Status and key developments
Milk prices and tariffs The chain for liquid milk
Trade ratios
Seasonality profile 2004
Self-sufficiency in milkExports / nat. productionImports / nat. consumption
in Mill tons ME
Surplus / deficit
Milk productionDemand Imports
Exports
year average = 100
Milk price monthlyMilk production monthly
Published in IFCN Dairy Report 2006, Chapter 3.
3.6 Viet Nam – Milk production and dairy sector profile
ExplanationsMethod: See IFCN Dairy Report 2006, Chapter 3.1 - 3.10 for details. * Residual: Fresh milk products. Sources: International statistics (FAO, ZMP, USDA, EUROSTAT, FAPRI, IDF, EU Commission, OECD, AMAD, MAD, UNSTAD-TRAINS) and national statistics.
0
2
4
6
8
10
12
2004
2003
2002
2001
2000
1999
1998
1997
1996
1995
1994
1993
1992
1991
1990
0 %
10 %
20 %
30 %
40 %
50 %
60 %
70 %
80 %
90 %
100 %
2004
2003
2002
2001
2000
1999
1998
1997
1996
1995
1994
1993
1992
1991
1990
0.0
0.1
0.2
0.3
0.4
0.5
0.6
0.7
0.8
0.9
2004
2003
2002
2001
2000
1999
1998
1997
1996
1995
1994
1993
1992
1991
1990
-1.0
-0.8
-0.6
-0.4
-0.2
0.0
0.2
0.4
0.6
0.8
1.0
2004
2003
2002
2001
2000
1999
1998
1997
1996
1995
1994
1993
1992
1991
1990
HH/on farm use/informal milk & formal fresh dairy products
Condensed milk
Condensed milkButterCheese
Dry productsHH/on farm use/informal milk & formal fresh dairy products
0
50
100
150
200
250
300
350
400
450
500
World market price + 2004 tariffs
World market price (SMP/butter)Milk price in the country
2004
2003
2002
2001
2000
1999
1998
1997
1996
in 1,000 VND / 100 kg milk (ECM)
1990 1992 1994 1996 1998 2000 2001 2002 2003 2004
69% 48% 21% 26% 23% 17% 12% 22% 24% 27% 1% 0% 0% 0% 3% 4% 2% 3% 1% 3% 32% 52% 79% 74% 78% 84% 88% 79% 77% 73%
Status 2004
- Tariffs: Butter 20 %, SMP 30 %- VAT on consumer price: 0 % - Milk consumption: 10 kg ME per capita / year- Self-sufficiency in milk production: 23 %
Key developments 1990 - 2004 - Milk production: +7.54 % per year- Milk consumption per capita: +14.34 % per year- Population: +1.6 % per year- Self-sufficiency: Decreased from 68 % to 23 %
Pictures on previous double page by Tieu Duc Viet and Raf Somers, Viet Nam.
© IFCN 2008 57
Key variables
Farm structure 2005
Milk production in ECM Production (mill t)Cows (in 1,000’s )Yield (t / cow / year)
Farm structure No. of dairy farms (in 1,000’s)Average farm size (cow s / farm)Milk per farm (t milk / farm / year) Prices in national currencyCull cow price (EUR / kg live weight)Land price – buy (EUR / ha)Quota price (EUR / kg milk)
Farm structure Milk and feed price Milk / feed price ratio
Status and key developments
Size classes
% of dairy farms in size classes % of cows in size classes
% of cows in size classes EUR / 100 kg Milk price / feed price
Cows per size classFarms per size class
Milk / barley price ratioMilk / feed price ratio
World feed price (nominal)
Milk price (nominal) Milk price (real)Feed price (nominal)
Published in IFCN Dairy Report 2007, Chapter 3.
3.6 Viet Nam – Milk production and dairy sector profile
0 %
10 %
20 %
30 %
40 %
50 %
60 %
70 %
80 %
90 %
100 %
2005
2004
2003
2002
2001
2000
1999
1998
1997
1996
6 - 9
3 - 5
2
1 > 10
2005
2004
2003
2002
2001
2000
1999
1998
1997
1996
0
50
100
150
200
250
300
350
400
450Favourable
Not favourable
0.0
0.5
1.0
1.5
2.0
2.5
3.0
2005
2004
2003
2002
2001
2000
1999
1998
1997
1996
0 %
5 %
10 %
15 %
20 %
25 %
30 %
35 %
40 %
> 10 6-9 3-5 21
20
276
15
184
5
38
20
43
Annual changes in %
0 <= 2020 <= 5050 <= 300
Annual growth rates 1996 1998 2000 2001 2002 2003 2004 2005 2000 - 2005
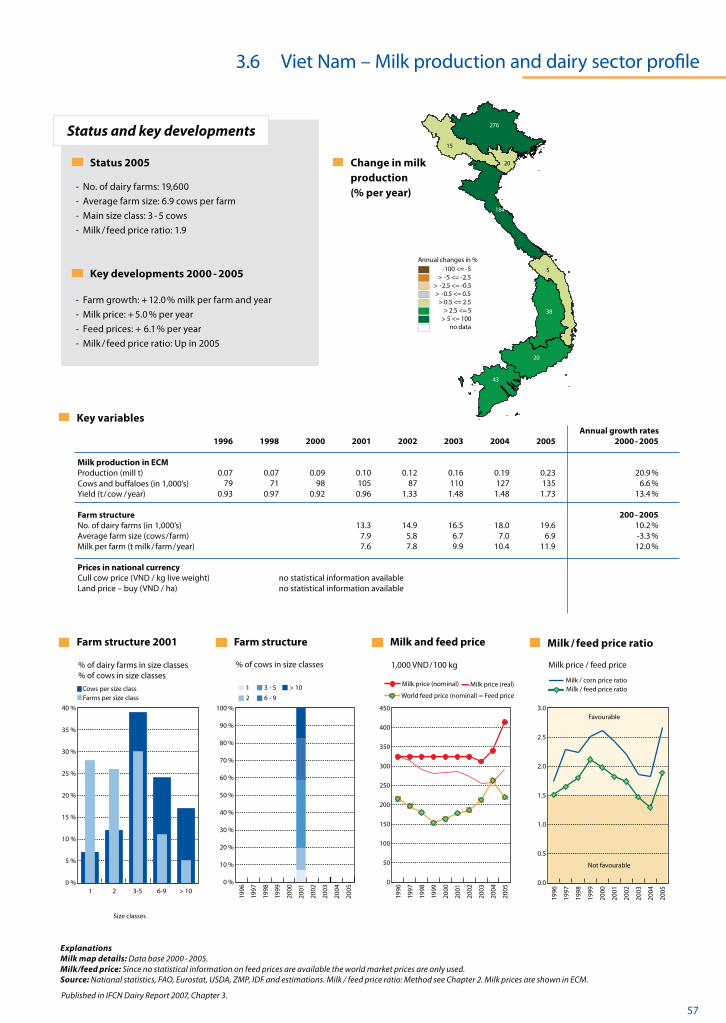
0.07 0.07 0.09 0.10 0.12 0.16 0.19 0.23 20.9 % 79 71 98 105 87 110 127 135 6.6 % 0.93 0.97 0.92 0.96 1.33 1.48 1.48 1.73 13.4 % 200 - 2005 13.3 14.9 16.5 18.0 19.6 10.2 % 7.9 5.8 6.7 7.0 6.9 -3.3 % 7.6 7.8 9.9 10.4 11.9 12.0 % no statistical information available no statistical information available
Status 2005
- No. of dairy farms: 19,600- Average farm size: 6.9 cows per farm- Main size class: 3 - 5 cows- Milk / feed price ratio: 1.9
Key developments 2000 - 2005 - Farm growth: + 12.0 % milk per farm and year- Milk price: + 5.0 % per year- Feed prices: + 6.1 % per year- Milk / feed price ratio: Up in 2005
Change in milk production (% per year)
ExplanationsMilk map details: Data base 2000 - 2005.Milk/feed price: Since no statistical information on feed prices are available the world market prices are only used.Source: National statistics, FAO, Eurostat, USDA, ZMP, IDF and estimations. Milk / feed price ratio: Method see Chapter 2. Milk prices are shown in ECM.
Cull cow price (VND / kg live weight)Land price – buy (VND / ha)
2001
Cows and buffaloes (in 1,000’s)
1,000 VND / 100 kg
Milk / corn price ratio
Annual changes in %-100 <= -5
> -5 <= -2.5> -2.5 <= -0.5> -0.5 <= 0.5
> 0.5 <= 2.5> 2.5 <= 5
> 5 <= 100no data
World feed price (nominal) = Feed price
Milk price (nominal) Milk price (real)
China
60 © IFCN 2008
Milk pricing and quality
Production vs demand Export / Import profilein Mill tons ME
Processing profile in % of milk produced
Consumption pattern in kg ME / capita / year
Status and key developments
Milk prices and tariffs The chain for liquid milk
Trade ratios
Seasonality profile 2004
Self-sufficiency in milkExports / nat. productionImports / nat. consumption
in Mill tons ME
Surplus / deficit
Milk productionDemand Imports
Exports
year average = 100
Milk price monthlyMilk production monthly
Published in IFCN Dairy Report 2006, Chapter 3.
0
50
100
150
200
250
300
350
400
450
500
Consumer price
Margin (Processor, retailer, VAT)»Farmers' milk price« (ECM)
VAT (2004 only)
2004
2003
2002
2001
2000
1999
1998
1997
1996
0
50
100
150
200
250
World market price + 2004 tariffs
World market price (SMP/butter)Milk price in the country
2004
2003
2002
2001
2000
1999
1998
1997
1996
in CNY / 100 kg milk (ECM) in CNY / 100 kg milk
3.7 China – Milk production and dairy sector profile
50
70
90
110
130
150
170
Milk price monthlyMilk production monthly
Dec
NovOct
Sep
Au
gJu
lJu
nM
ayA
pr
Mar
Feb
Jan
0
5
10
15
20
25
2004
2003
2002
2001
2000
1999
1998
1997
1996
1995
1994
1993
1992
1991
1990
0 %
10 %
20 %
30 %
40 %
50 %
60 %
70 %
80 %
90 %
100 %
2004
2003
2002
2001
2000
1999
1998
1997
1996
1995
1994
1993
1992
1991
1990
0.0
0.5
1.0
1.5
2.0
2.5
3.0
3.5
4.0
4.5
2004
2003
2002
2001
2000
1999
1998
1997
1996
1995
1994
1993
1992
1991
1990
-10
-5
0
5
10
15
20
25
30
2004
2003
2002
2001
2000
1999
1998
1997
1996
1995
1994
1993
1992
1991
1990
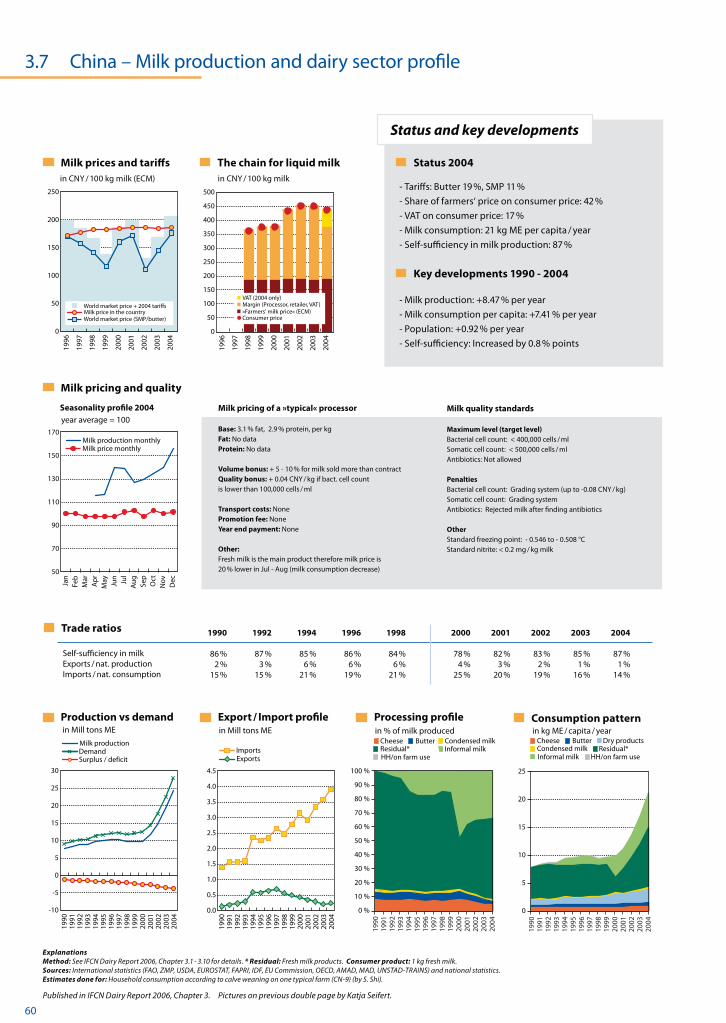
Status 2004
- Tariffs: Butter 19 %, SMP 11 %- Share of farmers‘ price on consumer price: 42 % - VAT on consumer price: 17 % - Milk consumption: 21 kg ME per capita / year- Self-sufficiency in milk production: 87 %
Key developments 1990 - 2004 - Milk production: +8.47 % per year- Milk consumption per capita: +7.41 % per year- Population: +0.92 % per year- Self-sufficiency: Increased by 0.8 % points
ExplanationsMethod: See IFCN Dairy Report 2006, Chapter 3.1 - 3.10 for details. * Residual: Fresh milk products. Consumer product: 1 kg fresh milk.Sources: International statistics (FAO, ZMP, USDA, EUROSTAT, FAPRI, IDF, EU Commission, OECD, AMAD, MAD, UNSTAD-TRAINS) and national statistics.Estimates done for: Household consumption according to calve weaning on one typical farm (CN-9) (by S. Shi).
1990 1992 1994 1996 1998 2000 2001 2002 2003 2004
86 % 87 % 85 % 86 % 84 % 78 % 82 % 83 % 85 % 87 % 2 % 3 % 6 % 6 % 6 % 4 % 3 % 2 % 1 % 1 % 15 % 15 % 21 % 19 % 21 % 25 % 20 % 19 % 16 % 14 %
Milk pricing of a »typical« processor
Base: 3.1 % fat, 2.9 % protein, per kgFat: No dataProtein: No data
Volume bonus: + 5 - 10 % for milk sold more than contractQuality bonus: + 0.04 CNY / kg if bact. cell countis lower than 100,000 cells / ml
Transport costs: NonePromotion fee: NoneYear end payment: None
Other: Fresh milk is the main product therefore milk price is 20 % lower in Jul - Aug (milk consumption decrease)
Milk quality standards
Maximum level (target level)Bacterial cell count: < 400,000 cells / mlSomatic cell count: < 500,000 cells / mlAntibiotics: Not allowed
PenaltiesBacterial cell count: Grading system (up to -0.08 CNY / kg)Somatic cell count: Grading systemAntibiotics: Rejected milk after finding antibiotics
OtherStandard freezing point: - 0.546 to - 0.508 °CStandard nitrite: < 0.2 mg / kg milk
Informal milkResidual*Condensed milkButterCheese
HH/on farm useResidual*Condensed milk
Dry productsButterCheese
HH/on farm useInformal milk
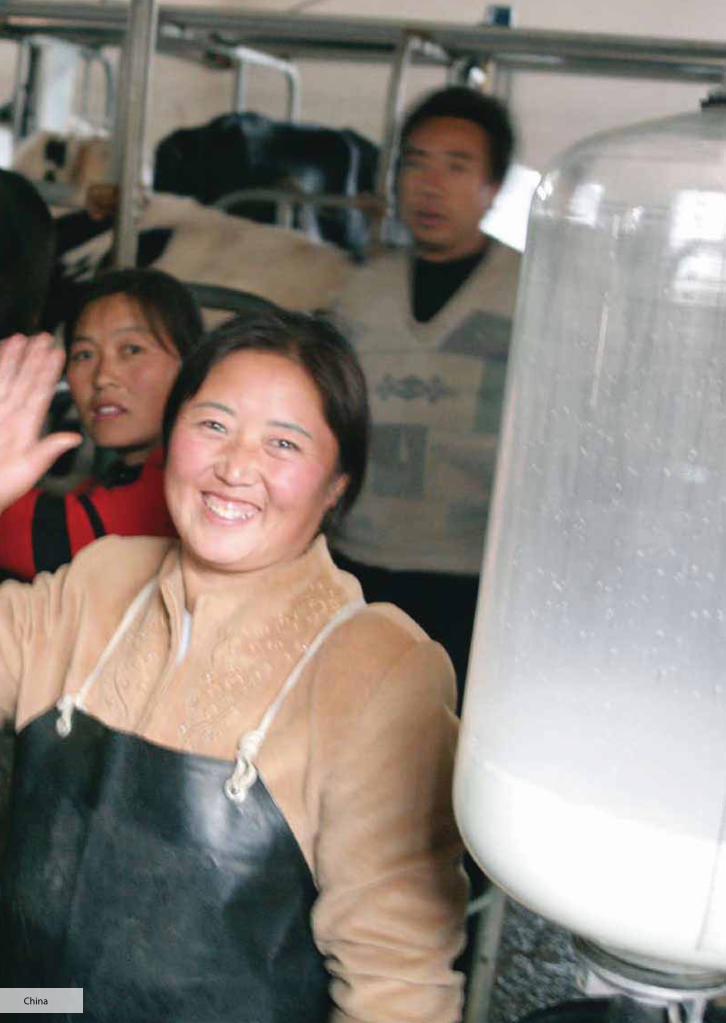
Pictures on previous double page by Katja Seifert.
© IFCN 2008 61
Key variables
Farm structure 2005
Milk production in ECM Production (mill t)Cows (in 1,000’s )Yield (t / cow / year)
Farm structure No. of dairy farms (in 1,000’s)Average farm size (cow s / farm)Milk per farm (t milk / farm / year) Prices in national currencyCull cow price (EUR / kg live weight)Land price – buy (EUR / ha)Quota price (EUR / kg milk)
Farm structure Milk and feed price Milk / feed price ratio
Status and key developments
Size classes
% of dairy farms in size classes % of cows in size classes
% of cows in size classes EUR / 100 kg Milk price / feed price
Cows per size classFarms per size class
Milk / barley price ratioMilk / feed price ratio
World feed price (nominal)
Milk price (nominal) Milk price (real)Feed price (nominal)
Published in IFCN Dairy Report 2007, Chapter 3.
Annual changes in %
-5 <= 00 <= 10
10 <= 2020 <= 60
hina
2035
3618
57
33
15
23
-2
27
22
22
1517
42
40
24
44
730
30
1115
17
20
8
32
17
3
21
18
20
3536
18
57
33
15
23
-2
27
22
22
1517
42
40
24
44
730
30
11
15
17
20
8
32173
21
18
Annual changes in %
-5 <= 00 <= 10
10 <= 2020 <= 60
Annual changes
-5 <=0 <=
10 <=20 <=
Annual changes in %
-5 <= 00 <= 10
10 <= 2020 <= 60
Change in milk production (% per year)
3.7 China – Milk production and dairy sector profile
0 %
10 %
20 %
30 %
40 %
50 %
60 %
70 %
80 %
90 %
100 %
> 200
100 - 200
20 - 100
1 - 20
different statistics
2005
2004
2003
2002
2001
2000
1999
1998
1997
1996
2005
2004
2003
2002
2001
2000
1999
1998
1997
1996
0
20
40
60
80
100
120
140
160
180
200Favourable
Not favourable
0.0
0.5
1.0
1.5
2.0
2.5
3.0
2005
2004
2003
2002
2001
2000
1999
1998
1997
1996
0 %
20 %
40 %
60 %
80 %
100 %
> 200100-20020-1001-20
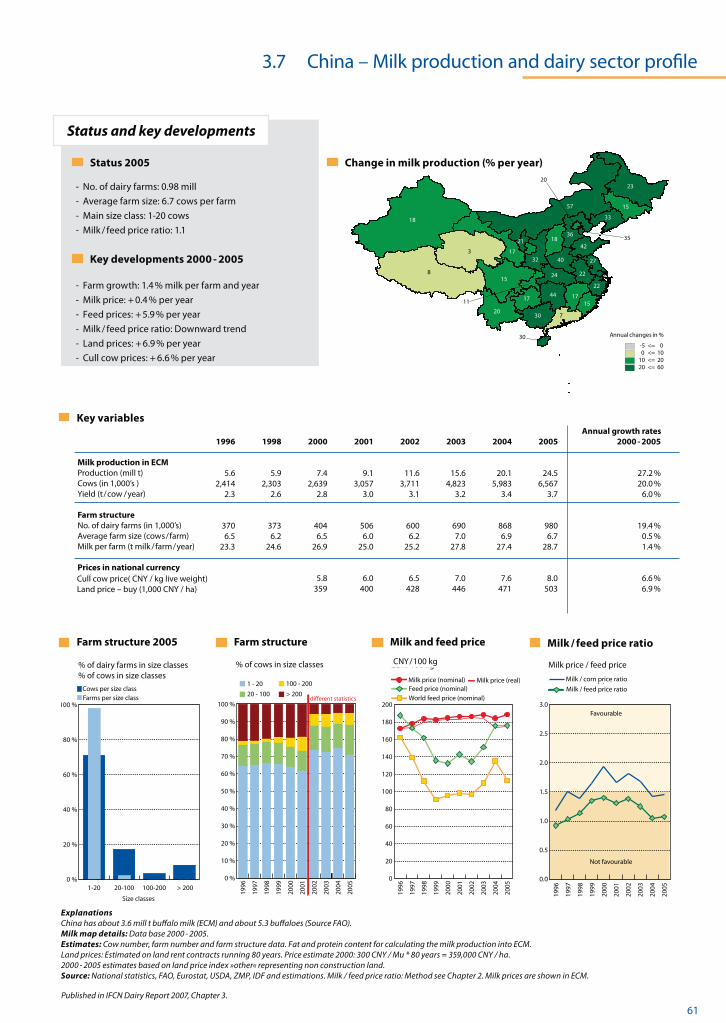
Status 2005
- No. of dairy farms: 0.98 mill- Average farm size: 6.7 cows per farm- Main size class: 1-20 cows- Milk / feed price ratio: 1.1
Key developments 2000 - 2005 - Farm growth: 1.4 % milk per farm and year- Milk price: + 0.4 % per year- Feed prices: + 5.9 % per year- Milk / feed price ratio: Downward trend- Land prices: + 6.9 % per year- Cull cow prices: + 6.6 % per year
Annual growth rates 1996 1998 2000 2001 2002 2003 2004 2005 2000 - 2005 5.6 5.9 7.4 9.1 11.6 15.6 20.1 24.5 27.2 % 2,414 2,303 2,639 3,057 3,711 4,823 5,983 6,567 20.0 % 2.3 2.6 2.8 3.0 3.1 3.2 3.4 3.7 6.0 % 370 373 404 506 600 690 868 980 19.4 % 6.5 6.2 6.5 6.0 6.2 7.0 6.9 6.7 0.5 % 23.3 24.6 26.9 25.0 25.2 27.8 27.4 28.7 1.4 %
5.8 6.0 6.5 7.0 7.6 8.0 6.6 % 359 400 428 446 471 503 6.9 %
ExplanationsChina has about 3.6 mill t buffalo milk (ECM) and about 5.3 buffaloes (Source FAO).Milk map details: Data base 2000 - 2005.Estimates: Cow number, farm number and farm structure data. Fat and protein content for calculating the milk production into ECM. Land prices: Estimated on land rent contracts running 80 years. Price estimate 2000: 300 CNY / Mu * 80 years = 359,000 CNY / ha.2000 - 2005 estimates based on land price index »other« representing non construction land.Source: National statistics, FAO, Eurostat, USDA, ZMP, IDF and estimations. Milk / feed price ratio: Method see Chapter 2. Milk prices are shown in ECM.
CNY / 100 kg
Milk / corn price ratio
Size classes
Cull cow price( CNY / kg live weight)Land price – buy (1,000 CNY / ha)
62 © IFCN 2008Uganda
© IFCN 2008 63
64 © IFCN 2008
Milk pricing and quality
Production vs demand Export / Import profilein Mill tons ME
Processing profile in % of milk produced
Consumption pattern in kg ME / capita / year
Status and key developments
Milk prices and tariffs The chain for liquid milk
Trade ratios
Seasonality profile 2004
Self-sufficiency in milkExports / nat. productionImports / nat. consumption
in Mill tons ME
Surplus / deficit
Milk productionDemand Imports
Exports
year average = 100
Milk price monthlyMilk production monthly
Published in IFCN Dairy Report 2006, Chapter 3.
0
20,000
40,000
60,000
80,000
100,000
120,000
2004
2003
2002
2001
2000
1999
1998
1997
1996
Consumer price
Margin (Processor, retailer)»Farmers' milk price« (ECM)
0
5,000
10,000
15,000
20,000
25,000
30,000
35,000
40,000
45,000
50,000World market price + 2004 tariffs
World market price (SMP/butter)
Milk price in the country
2004
2003
2002
2001
2000
1999
1998
1997
1996
in UGX / 100 kg milk (ECM) in UGX / 100 kg milk
3.8 Uganda – Milk production and dairy sector profile
50
60
70
80
90
100
110
120
130
140
150
Milk price monthlyMilk production monthly
Dec
NovOct
Sep
Au
gJu
lJu
nM
ayA
pr
Mar
Feb
Jan
0
10
20
30
40
50
60
2004
2003
2002
2001
2000
1999
1998
1997
1996
1995
1994
1993
1992
1991
1990
0 %
10 %
20 %
30 %
40 %
50 %
60 %
70 %
80 %
90 %
100 %
2004
2003
2002
2001
2000
1999
1998
1997
1996
1995
1994
1993
1992
1991
1990
0.000
0.002
0.004
0.006
0.008
0.010
0.012
0.014
0.016
0.018
2004
2003
2002
2001
2000
1999
1998
1997
1996
1995
1994
1993
1992
1991
1990
-0.2
-0.0
0.2
0.4
0.6
0.8
1.0
1.2
1.4
2004
2003
2002
2001
2000
1999
1998
1997
1996
1995
1994
1993
1992
1991
1990
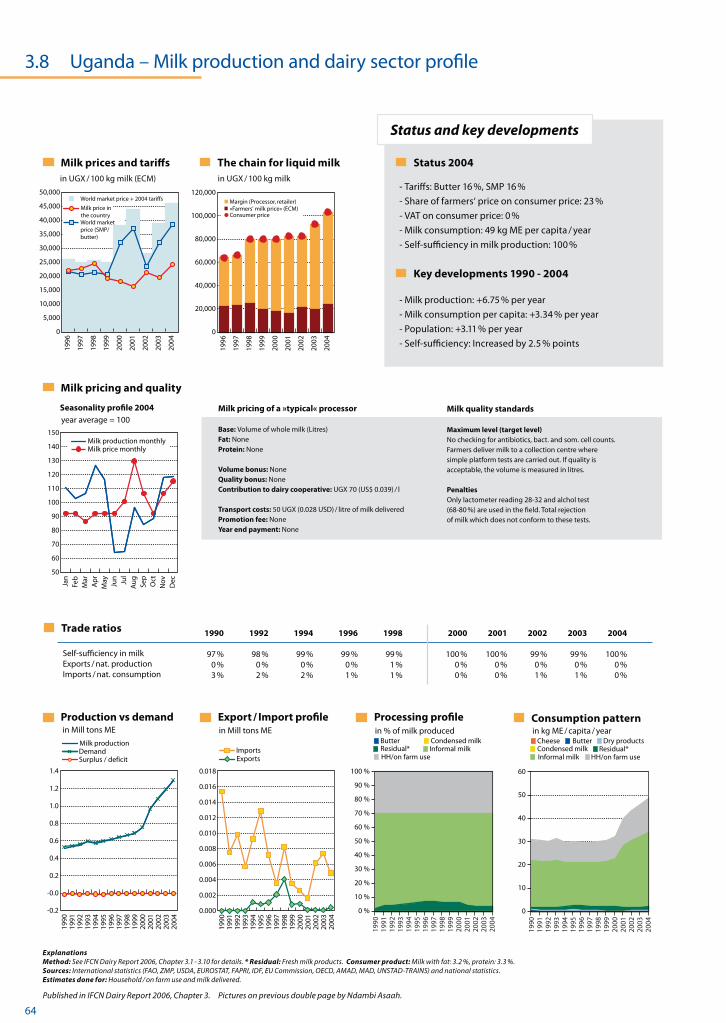
Status 2004
- Tariffs: Butter 16 %, SMP 16 %- Share of farmers‘ price on consumer price: 23 % - VAT on consumer price: 0 % - Milk consumption: 49 kg ME per capita / year- Self-sufficiency in milk production: 100 %
Key developments 1990 - 2004 - Milk production: +6.75 % per year- Milk consumption per capita: +3.34 % per year- Population: +3.11 % per year- Self-sufficiency: Increased by 2.5 % points
ExplanationsMethod: See IFCN Dairy Report 2006, Chapter 3.1 - 3.10 for details. * Residual: Fresh milk products. Consumer product: Milk with fat: 3.2 %, protein: 3.3 %.Sources: International statistics (FAO, ZMP, USDA, EUROSTAT, FAPRI, IDF, EU Commission, OECD, AMAD, MAD, UNSTAD-TRAINS) and national statistics.Estimates done for: Household / on farm use and milk delivered.
1990 1992 1994 1996 1998 2000 2001 2002 2003 2004
97 % 98 % 99 % 99 % 99 % 100 % 100 % 99 % 99 % 100 % 0 % 0 % 0 % 0 % 1 % 0 % 0 % 0 % 0 % 0 % 3 % 2 % 2 % 1 % 1 % 0 % 0 % 1 % 1 % 0 %
Milk pricing of a »typical« processor
Base: Volume of whole milk (Litres)Fat: NoneProtein: None
Volume bonus: NoneQuality bonus: NoneContribution to dairy cooperative: UGX 70 (US$ 0.039) / l
Transport costs: 50 UGX (0.028 USD) / litre of milk deliveredPromotion fee: None Year end payment: None
Milk quality standards
Maximum level (target level)No checking for antibiotics, bact. and som. cell counts.Farmers deliver milk to a collection centre where simple platform tests are carried out. If quality isacceptable, the volume is measured in litres.
PenaltiesOnly lactometer reading 28-32 and alchol test (68-80 %) are used in the field. Total rejectionof milk which does not conform to these tests.
Informal milkResidual*Condensed milkButter
HH/on farm useResidual*Condensed milk
Dry productsButterCheese
HH/on farm useInformal milk
Pictures on previous double page by Ndambi Asaah.
© IFCN 2008 65
Key variables
Farm structure 2005
Milk production in ECM Production (mill t)Cows (in 1,000’s )Yield (t / cow / year)
Farm structure No. of dairy farms (in 1,000’s)Average farm size (cow s / farm)Milk per farm (t milk / farm / year) Prices in national currencyCull cow price (EUR / kg live weight)Land price – buy (EUR / ha)Quota price (EUR / kg milk)
Farm structure Milk and feed price Milk / feed price ratio
Status and key developments
Size classes
% of dairy farms in size classes % of cows in size classes
% of cows in size classes EUR / 100 kg Milk price / feed price
Cows per size classFarms per size class
Milk / barley price ratioMilk / feed price ratio
World feed price (nominal)
Milk price (nominal) Milk price (real)Feed price (nominal)
Published in IFCN Dairy Report 2007, Chapter 3.
3.8 Uganda – Milk production and dairy sector profile
2005
2004
2003
2002
2001
2000
1999
1998
1997
1996
0
5
10
15
20
25
30
35
40
45Favourable
Not favourable
0.0
0.5
1.0
1.5
2.0
2.5
3.0
2005
2004
2003
2002
2001
2000
1999
1998
1997
1996
-3.2
-100.0
-100.0
4.7
25.8
18.6
10.9 -3.2
-100.0
-100.0
4.7
25.8
18.6
10.9
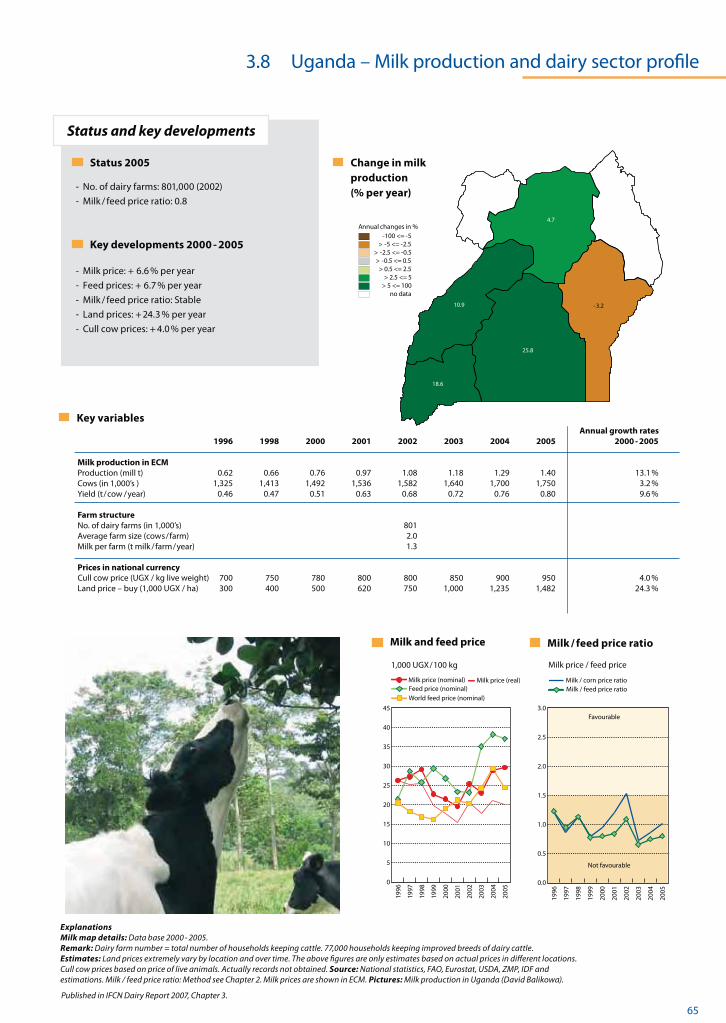
Annual growth rates 1996 1998 2000 2001 2002 2003 2004 2005 2000 - 2005
0.62 0.66 0.76 0.97 1.08 1.18 1.29 1.40 13.1 % 1,325 1,413 1,492 1,536 1,582 1,640 1,700 1,750 3.2 % 0.46 0.47 0.51 0.63 0.68 0.72 0.76 0.80 9.6 % 801 2.0 1.3 700 750 780 800 800 850 900 950 4.0 % 300 400 500 620 750 1,000 1,235 1,482 24.3 %
Status 2005
- No. of dairy farms: 801,000 (2002)- Milk / feed price ratio: 0.8
Key developments 2000 - 2005 - Milk price: + 6.6 % per year- Feed prices: + 6.7 % per year- Milk / feed price ratio: Stable- Land prices: + 24.3 % per year- Cull cow prices: + 4.0 % per year
Change in milk production (% per year)
ExplanationsMilk map details: Data base 2000 - 2005.Remark: Dairy farm number = total number of households keeping cattle. 77,000 households keeping improved breeds of dairy cattle.Estimates: Land prices extremely vary by location and over time. The above figures are only estimates based on actual prices in different locations. Cull cow prices based on price of live animals. Actually records not obtained. Source: National statistics, FAO, Eurostat, USDA, ZMP, IDF and estimations. Milk / feed price ratio: Method see Chapter 2. Milk prices are shown in ECM. Pictures: Milk production in Uganda (David Balikowa).
Cull cow price (UGX / kg live weight)Land price – buy (1,000 UGX / ha)
1,000 UGX / 100 kg
Milk / corn price ratio
Annual changes in %-100 <= -5
> -5 <= -2.5> -2.5 <= -0.5> -0.5 <= 0.5
> 0.5 <= 2.5> 2.5 <= 5
> 5 <= 100no data
66 © IFCN 2008Cameroon
© IFCN 2008 67
68 © IFCN 2008
Milk pricing and quality
Production vs demand Export / Import profilein Mill tons ME
Processing profile in % of milk produced
Consumption pattern in kg ME / capita / year
Status and key developments
Milk prices and tariffs The chain for liquid milk
Trade ratios
Seasonality profile 2004
Self-sufficiency in milkExports / nat. productionImports / nat. consumption
in Mill tons ME
Surplus / deficit
Milk productionDemand Imports
Exports
year average = 100
Milk price monthlyMilk production monthly
Published in IFCN Dairy Report 2006, Chapter 3.
3.9 Cameroon – Milk production and dairy sector profile
40
50
60
70
80
90
100
110
120
130
140
150
Milk price monthly
Milk production monthly
Dec
NovOct
Sep
Au
gJu
lJu
nM
ayA
pr
Mar
Feb
Jan
0
20
40
60
80
100
120
140
160
180
2004
2003
2002
2001
2000
1999
1998
1997
1996
Consumer price
Margin (Processor, retailer)»Farmers' milk price« (ECM)
0
5
10
15
20
25
World market price + 2004 tariffs
World market price (SMP/ butter)Milk price in the country
2004
2003
2002
2001
2000
1999
1998
1997
1996
0
5
10
15
20
25
2004
2003
2002
2001
2000
1999
1998
1997
1996
1995
1994
1993
1992
1991
1990
0 %
10 %
20 %
30 %
40 %
50 %
60 %
70 %
80 %
90 %
100 %
2004
2003
2002
2001
2000
1999
1998
1997
1996
1995
1994
1993
1992
1991
1990
0.00
0.01
0.02
0.03
0.04
0.05
0.06
0.07
2004
2003
2002
2001
2000
1999
1998
1997
1996
1995
1994
1993
1992
1991
1990
-0.10
-0.05
0.00
0.05
0.10
0.15
0.20
0.25
0.30
2004
2003
2002
2001
2000
1999
1998
1997
1996
1995
1994
1993
1992
1991
1990
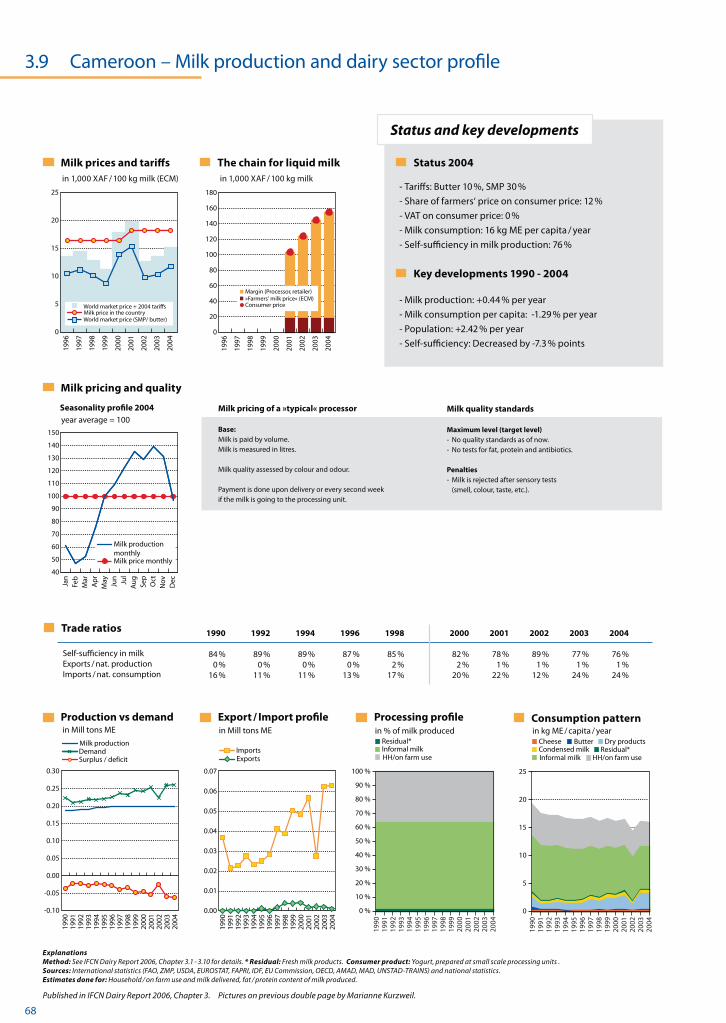
Status 2004
- Tariffs: Butter 10 %, SMP 30 %- Share of farmers‘ price on consumer price: 12 % - VAT on consumer price: 0 %- Milk consumption: 16 kg ME per capita / year- Self-sufficiency in milk production: 76 %
Key developments 1990 - 2004 - Milk production: +0.44 % per year- Milk consumption per capita: -1.29 % per year- Population: +2.42 % per year- Self-sufficiency: Decreased by -7.3 % points
in 1,000 XAF / 100 kg milk (ECM) in 1,000 XAF / 100 kg milk
ExplanationsMethod: See IFCN Dairy Report 2006, Chapter 3.1 - 3.10 for details. * Residual: Fresh milk products. Consumer product: Yogurt, prepared at small scale processing units .Sources: International statistics (FAO, ZMP, USDA, EUROSTAT, FAPRI, IDF, EU Commission, OECD, AMAD, MAD, UNSTAD-TRAINS) and national statistics.Estimates done for: Household / on farm use and milk delivered, fat / protein content of milk produced.
1990 1992 1994 1996 1998 2000 2001 2002 2003 2004
84 % 89 % 89 % 87 % 85 % 82 % 78 % 89 % 77 % 76 % 0 % 0 % 0 % 0 % 2 % 2 % 1 % 1 % 1 % 1 % 16 % 11 % 11 % 13 % 17 % 20 % 22 % 12 % 24 % 24 %
Milk pricing of a »typical« processor
Base: Milk is paid by volume.Milk is measured in litres.
Milk quality assessed by colour and odour.
Payment is done upon delivery or every second weekif the milk is going to the processing unit.
Milk quality standards
Maximum level (target level)- No quality standards as of now.- No tests for fat, protein and antibiotics.
Penalties- Milk is rejected after sensory tests (smell, colour, taste, etc.).
Informal milkResidual*
HH/on farm useResidual*Condensed milk
Dry productsButterCheese
HH/on farm useInformal milk
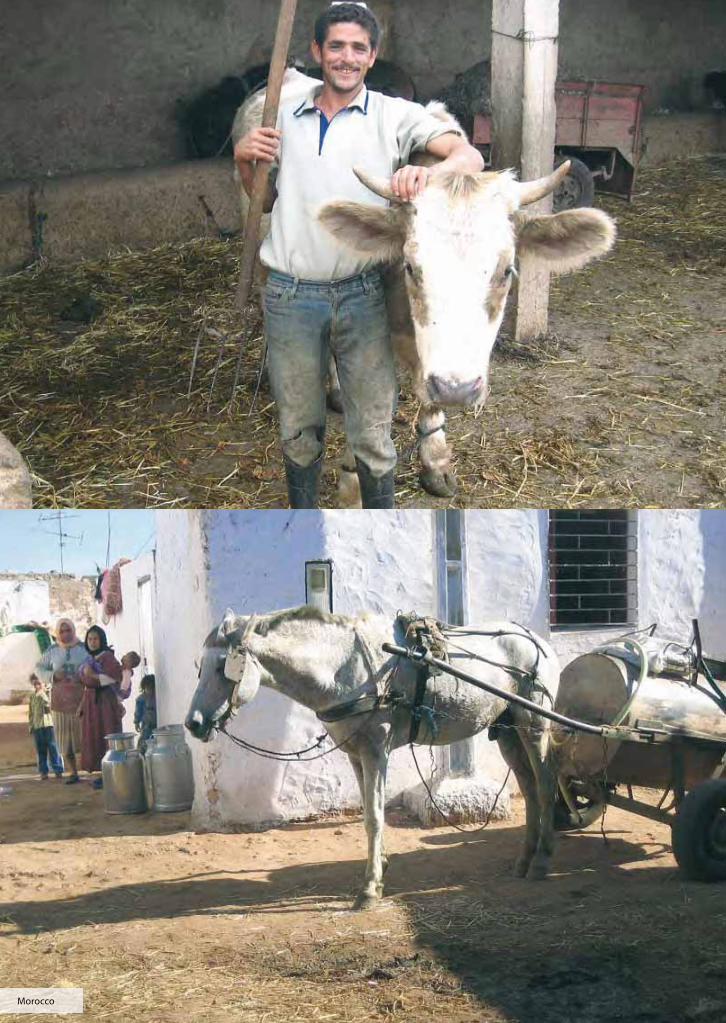
Pictures on previous double page by Marianne Kurzweil.
© IFCN 2008 69
Key variables
Farm structure 2005
Milk production in ECM Production (mill t)Cows (in 1,000’s )Yield (t / cow / year)
Farm structure No. of dairy farms (in 1,000’s)Average farm size (cow s / farm)Milk per farm (t milk / farm / year) Prices in national currencyCull cow price (EUR / kg live weight)Land price – buy (EUR / ha)Quota price (EUR / kg milk)
Farm structure Milk and feed price Milk / feed price ratio
Status and key developments
Size classes
% of dairy farms in size classes % of cows in size classes
% of cows in size classes EUR / 100 kg Milk price / feed price
Cows per size classFarms per size class
Milk / barley price ratioMilk / feed price ratio
World feed price (nominal)
Milk price (nominal) Milk price (real)Feed price (nominal)
Published in IFCN Dairy Report 2007, Chapter 3.
3.9 Cameroon – Milk production and dairy sector profile
0 %
10 %
20 %
30 %
40 %
50 %
60 %
70 %
80 %
90 %
100 %
2005
2004
2003
2002
2001
2000
1999
1998
1997
1996
20 - 29
10 - 19
3 - 9
1 - 2 > 100
50 - 99
30 - 49
2005
2004
2003
2002
2001
2000
1999
1998
1997
1996
0
5
10
15
20
25Favourable
Not favourable
0.0
0.5
1.0
1.5
2.0
2.5
3.0
2005
2004
2003
2002
2001
2000
1999
1998
1997
1996
0 %
10 %
20 %
30 %
40 %
50 %
60 %
70 %
80 %
>10
0
50-9
9
30-4
9
20-2
9
10-1
9
3-9
1-2
Milk production volume per region 2005
Milk production change: + 0.01% per year
Annual growth rates 1996 1998 2000 2001 2002 2003 2004 2005 2000 - 2005
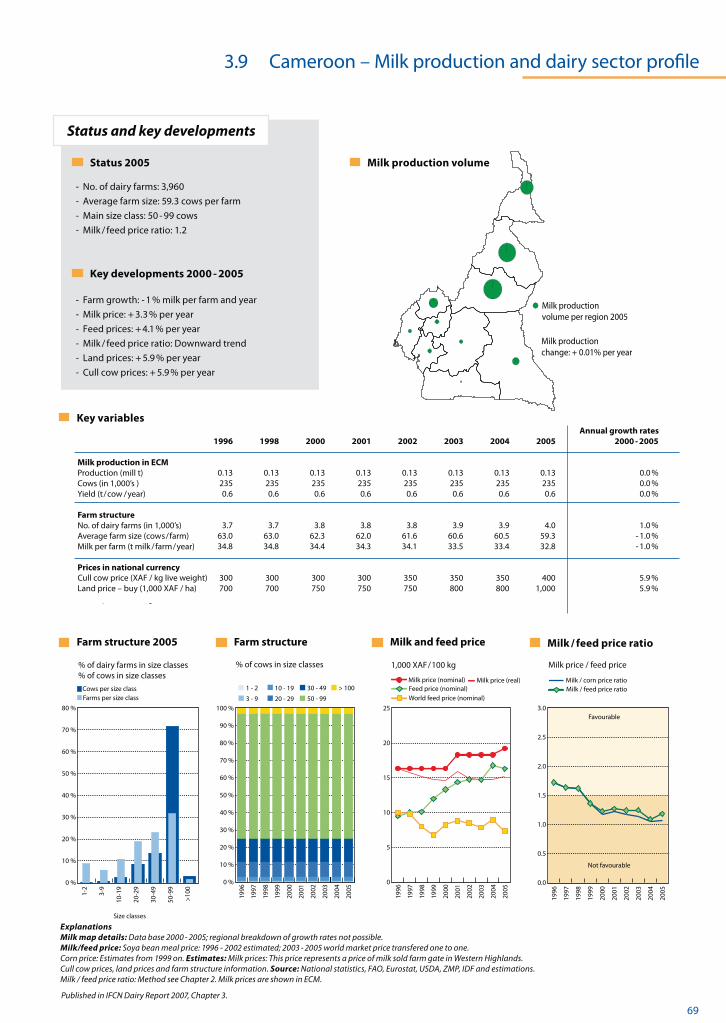
0.13 0.13 0.13 0.13 0.13 0.13 0.13 0.13 0.0 % 235 235 235 235 235 235 235 235 0.0 % 0.6 0.6 0.6 0.6 0.6 0.6 0.6 0.6 0.0 % 3.7 3.7 3.8 3.8 3.8 3.9 3.9 4.0 1.0 % 63.0 63.0 62.3 62.0 61.6 60.6 60.5 59.3 - 1.0 % 34.8 34.8 34.4 34.3 34.1 33.5 33.4 32.8 - 1.0 % 300 300 300 300 350 350 350 400 5.9 % 700 700 750 750 750 800 800 1,000 5.9 %
Cull cow price (XAF / kg live weight)Land price – buy (1,000 XAF / ha)
ExplanationsMilk map details: Data base 2000 - 2005; regional breakdown of growth rates not possible.Milk/feed price: Soya bean meal price: 1996 - 2002 estimated; 2003 - 2005 world market price transfered one to one. Corn price: Estimates from 1999 on. Estimates: Milk prices: This price represents a price of milk sold farm gate in Western Highlands. Cull cow prices, land prices and farm structure information. Source: National statistics, FAO, Eurostat, USDA, ZMP, IDF and estimations. Milk / feed price ratio: Method see Chapter 2. Milk prices are shown in ECM.
Milk production volume Status 2005
- No. of dairy farms: 3,960- Average farm size: 59.3 cows per farm- Main size class: 50 - 99 cows- Milk / feed price ratio: 1.2
Key developments 2000 - 2005 - Farm growth: - 1 % milk per farm and year- Milk price: + 3.3 % per year- Feed prices: + 4.1 % per year- Milk / feed price ratio: Downward trend- Land prices: + 5.9 % per year- Cull cow prices: + 5.9 % per year
1,000 XAF / 100 kg
Milk / corn price ratio
70 © IFCN 2008Morocco
© IFCN 2008 71
72 © IFCN 2008Morocco
© IFCN 2008 73
Key variables
Farm structure 2005
Milk production in ECM Production (mill t)Cows (in 1,000’s )Yield (t / cow / year)
Farm structure No. of dairy farms (in 1,000’s)Average farm size (cow s / farm)Milk per farm (t milk / farm / year) Prices in national currencyCull cow price (EUR / kg live weight)Land price – buy (EUR / ha)Quota price (EUR / kg milk)
Farm structure Milk and feed price Milk / feed price ratio
Status and key developments
Size classes
% of dairy farms in size classes % of cows in size classes
% of cows in size classes EUR / 100 kg Milk price / feed price
Cows per size classFarms per size class
Milk / barley price ratioMilk / feed price ratio
World feed price (nominal)
Milk price (nominal) Milk price (real)Feed price (nominal)
Published in IFCN Dairy Report 2007, Chapter 3.
3.10 Morocco – Milk production and dairy sector profile
0 %
10 %
20 %
30 %
40 %
50 %
60 %
70 %
80 %
90 %
100 %
2005
2004
2003
2002
2001
2000
1999
1998
1997
1996
> 101 - 2 3 - 9
2005
2004
2003
2002
2001
2000
1999
1998
1997
1996
0
50
100
150
200
250
300
350
400Favourable
Not favourable
0.0
0.5
1.0
1.5
2.0
2.5
3.0
2005
2004
2003
2002
2001
2000
1999
1998
1997
1996
0 %
10 %
20 %
30 %
40 %
50 %
60 %
70 %
80 %
90 %
> 103-91-2
Milk production volume per region 2005
Milk production change: + 4.2 % per year
Annual growth rates 1996 1998 2000 2001 2002 2003 2004 2005 2000 - 2005
0.84 1.01 1.14 1.09 1.19 1.19 1.34 1.40 4.2 % 1,500 1,300 1,308 1,250 1,350 1,370 1,380 1,500 2.8 % 0.56 0.78 0.87 0.87 0.88 0.87 0.97 0.93 1.3 % 769 2.0 1.1 25 25 25 25 25 25 25 25 0.0 % 80 80 90 100 100 100 120 120 5.9 %
Status 2005
- No. of dairy farms: 768,900 (1996)- Main size class: 1 - 2 cows- Milk / feed price ratio: 1.7
Key developments 2000 - 2005 - Milk price: + 0.7 % per year- Feed prices: - 1.7 % per year- Milk / feed price ratio: Stable- Land prices: + 5.9 % per year- Cull cow prices: Stable
Milk production volume
ExplanationsMilk map details: Data base 2005; regional breakdown of growth rates not possible. Milk/feed price: Since no statistical information on soya bean meal prices are available the world market price is used. Estimates: Cull cow prices based on 360 kg live weight at 25 MAD / kg live weight. Land prices: Own observations based on »irrigated land« and sub-urban areas with own »ground water« irrigation installations.Source: National statistics, FAO, Eurostat, USDA, ZMP, IDF and estimations. Milk / feed price ratio: Method see Chapter 2. Milk prices are shown in ECM.
Cull cow price (MAD / kg live weight)Land price – buy (1,000 MAD / ha)
MAD / 100 kg
Farm structure 1996
Pictures on previous pages by Otto Garcia.
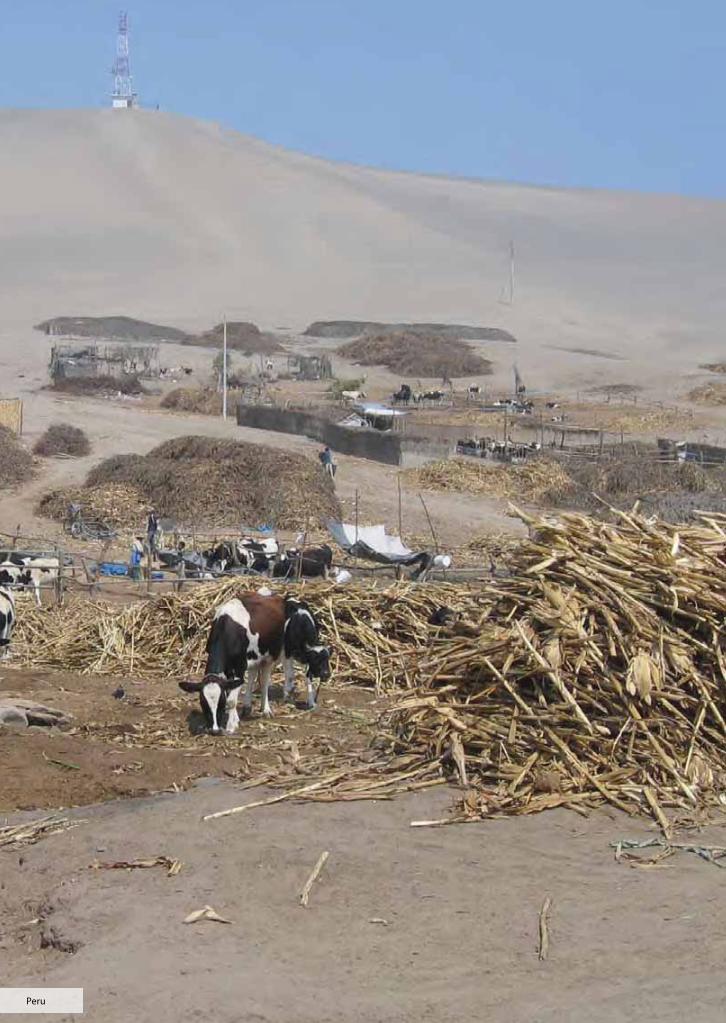
74 © IFCN 2008Peru
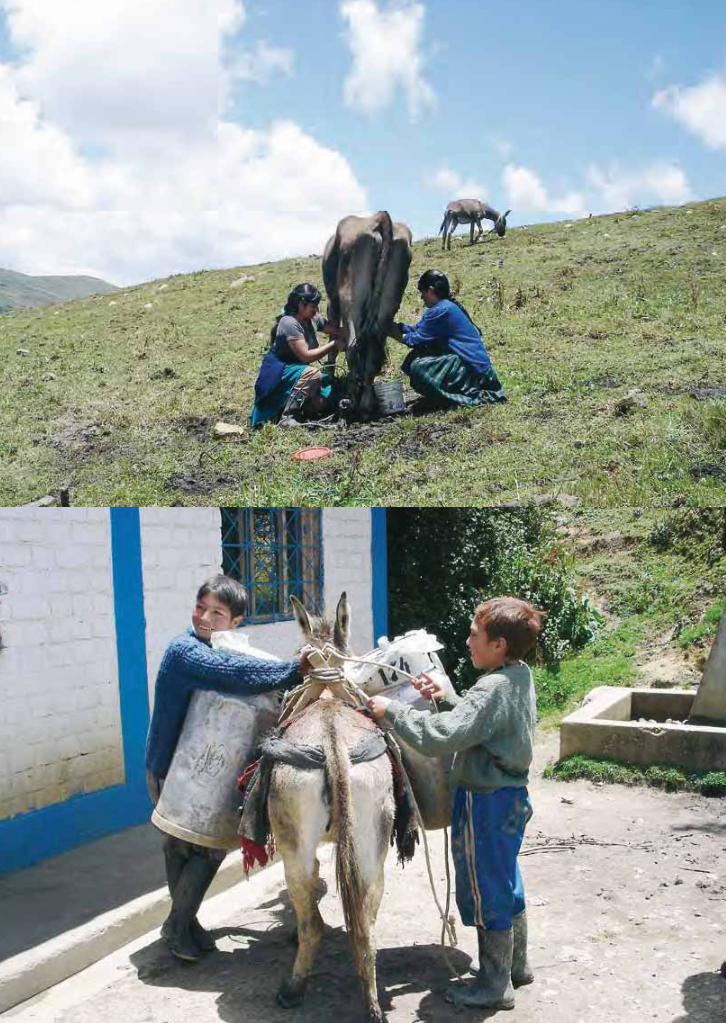
© IFCN 2008 75
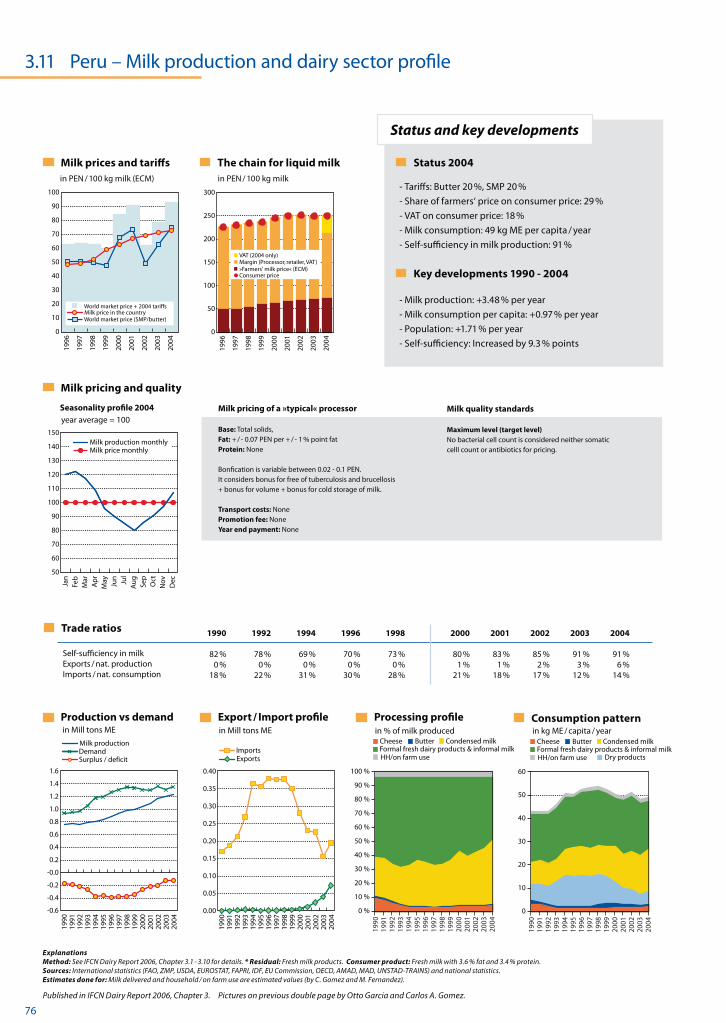
76 © IFCN 2008
Milk pricing and quality
Production vs demand Export / Import profilein Mill tons ME
Processing profile in % of milk produced
Consumption pattern in kg ME / capita / year
Status and key developments
Milk prices and tariffs The chain for liquid milk
Trade ratios
Seasonality profile 2004
Self-sufficiency in milkExports / nat. productionImports / nat. consumption
in Mill tons ME
Surplus / deficit
Milk productionDemand Imports
Exports
year average = 100
Milk price monthlyMilk production monthly
Published in IFCN Dairy Report 2006, Chapter 3.
0
50
100
150
200
250
300
2004
2003
2002
2001
2000
1999
1998
1997
1996
Consumer price
Margin (Processor, retailer, VAT)»Farmers' milk price« (ECM)
VAT (2004 only)
0
10
20
30
40
50
60
70
80
90
100
World market price + 2004 tariffs
World market price (SMP/butter)Milk price in the country
2004
2003
2002
2001
2000
1999
1998
1997
1996
in PEN / 100 kg milk (ECM) in PEN / 100 kg milk
3.11 Peru – Milk production and dairy sector profile
50
60
70
80
90
100
110
120
130
140
150
Milk price monthlyMilk production monthly
Dec
NovOct
Sep
Au
gJu
lJu
nM
ayA
pr
Mar
Feb
Jan
0
10
20
30
40
50
60
2004
2003
2002
2001
2000
1999
1998
1997
1996
1995
1994
1993
1992
1991
1990
0 %
10 %
20 %
30 %
40 %
50 %
60 %
70 %
80 %
90 %
100 %
2004
2003
2002
2001
2000
1999
1998
1997
1996
1995
1994
1993
1992
1991
1990
0.00
0.05
0.10
0.15
0.20
0.25
0.30
0.35
0.40
2004
2003
2002
2001
2000
1999
1998
1997
1996
1995
1994
1993
1992
1991
1990
-0.6
-0.4
-0.2
-0.0
0.2
0.4
0.6
0.8
1.0
1.2
1.4
1.6
2004
2003
2002
2001
2000
1999
1998
1997
1996
1995
1994
1993
1992
1991
1990
Status 2004
- Tariffs: Butter 20 %, SMP 20 %- Share of farmers‘ price on consumer price: 29 % - VAT on consumer price: 18 % - Milk consumption: 49 kg ME per capita / year- Self-sufficiency in milk production: 91 %
Key developments 1990 - 2004 - Milk production: +3.48 % per year- Milk consumption per capita: +0.97 % per year- Population: +1.71 % per year- Self-sufficiency: Increased by 9.3 % points
ExplanationsMethod: See IFCN Dairy Report 2006, Chapter 3.1 - 3.10 for details. * Residual: Fresh milk products. Consumer product: Fresh milk with 3.6 % fat and 3.4 % protein.Sources: International statistics (FAO, ZMP, USDA, EUROSTAT, FAPRI, IDF, EU Commission, OECD, AMAD, MAD, UNSTAD-TRAINS) and national statistics.Estimates done for: Milk delivered and household / on farm use are estimated values (by C. Gomez and M. Fernandez).
1990 1992 1994 1996 1998 2000 2001 2002 2003 2004
82 % 78 % 69 % 70 % 73 % 80 % 83 % 85 % 91 % 91 % 0 % 0 % 0 % 0 % 0 % 1 % 1 % 2 % 3 % 6 % 18 % 22 % 31 % 30 % 28 % 21 % 18 % 17 % 12 % 14 %
Milk pricing of a »typical« processor
Base: Total solids, Fat: + / - 0.07 PEN per + / - 1 % point fatProtein: None
Bonfication is variable between 0.02 - 0.1 PEN. It considers bonus for free of tuberculosis and brucellosis+ bonus for volume + bonus for cold storage of milk.
Transport costs: NonePromotion fee: NoneYear end payment: None
Milk quality standards
Maximum level (target level)No bacterial cell count is considered neither somaticcelll count or antibiotics for pricing.
Formal fresh dairy products & informal milkCondensed milkButterCheese
HH/on farm useFormal fresh dairy products & informal milk
Condensed milkButterCheese
HH/on farm use Dry products
Pictures on previous double page by Otto Garcia and Carlos A. Gomez.
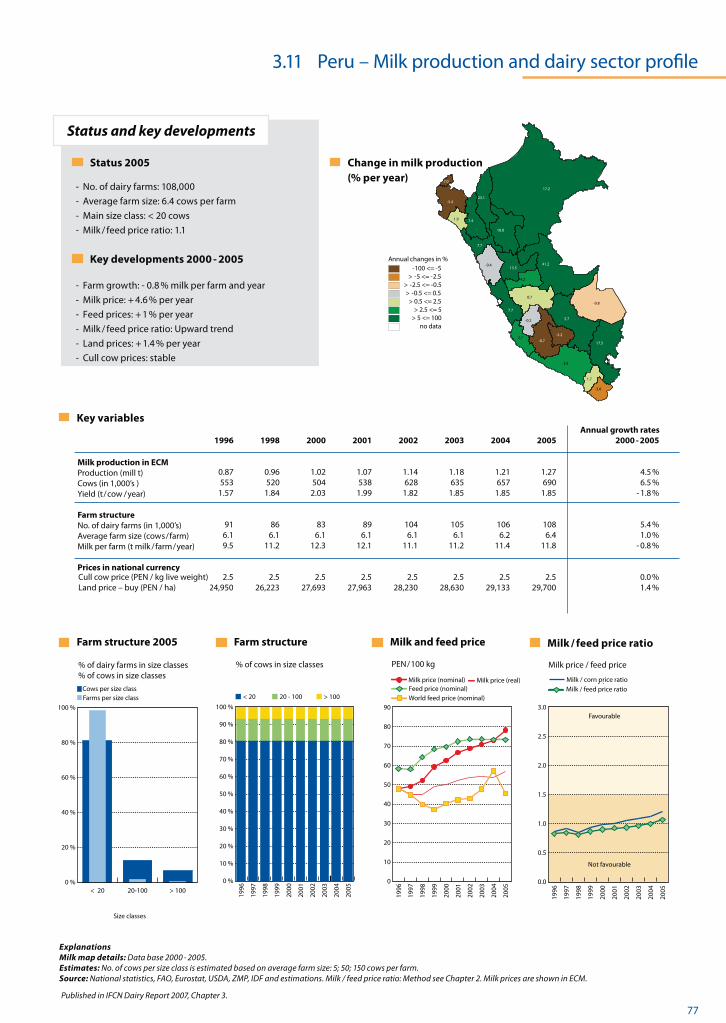
© IFCN 2008 77
Key variables
Farm structure 2005
Milk production in ECM Production (mill t)Cows (in 1,000’s )Yield (t / cow / year)
Farm structure No. of dairy farms (in 1,000’s)Average farm size (cow s / farm)Milk per farm (t milk / farm / year) Prices in national currencyCull cow price (EUR / kg live weight)Land price – buy (EUR / ha)Quota price (EUR / kg milk)
Farm structure Milk and feed price Milk / feed price ratio
Status and key developments
Size classes
% of dairy farms in size classes % of cows in size classes
% of cows in size classes EUR / 100 kg Milk price / feed price
Cows per size classFarms per size class
Milk / barley price ratioMilk / feed price ratio
World feed price (nominal)
Milk price (nominal) Milk price (real)Feed price (nominal)
Published in IFCN Dairy Report 2007, Chapter 3.
23.1
-0.4
-5.2
3.9
-8.7
7.4
5.7-0.2
13.5
2.7
0.7
7.7
1.9
7.7
17.2
-0.8
1.7
4.2
-5.4
17.5
18.0
-3.0
-7.0
41.2
23.1
-0.4
-5.2
3.9
-8.7
7.4
5.7-0.2
13.5
2.7
0.7
7.7
1.9
7.7
17.2
-0.8
1.7
4.2
-5.4
17.5
18.0
-3.0
-7.0
41.2
3.11 Peru – Milk production and dairy sector profile
0 %
10 %
20 %
30 %
40 %
50 %
60 %
70 %
80 %
90 %
100 %
2005
2004
2003
2002
2001
2000
1999
1998
1997
1996
> 100< 20 20 - 100
2005
2004
2003
2002
2001
2000
1999
1998
1997
1996
0
10
20
30
40
50
60
70
80
90Favourable
Not favourable
0.0
0.5
1.0
1.5
2.0
2.5
3.0
2005
2004
2003
2002
2001
2000
1999
1998
1997
1996
0 %
20 %
40 %
60 %
80 %
100 %
> 10020-100< 20
Annual growth rates 1996 1998 2000 2001 2002 2003 2004 2005 2000 - 2005
0.87 0.96 1.02 1.07 1.14 1.18 1.21 1.27 4.5 % 553 520 504 538 628 635 657 690 6.5 % 1.57 1.84 2.03 1.99 1.82 1.85 1.85 1.85 - 1.8 % 91 86 83 89 104 105 106 108 5.4 % 6.1 6.1 6.1 6.1 6.1 6.1 6.2 6.4 1.0 % 9.5 11.2 12.3 12.1 11.1 11.2 11.4 11.8 - 0.8 % 2.5 2.5 2.5 2.5 2.5 2.5 2.5 2.5 0.0 % 24,950 26,223 27,693 27,963 28,230 28,630 29,133 29,700 1.4 %
Status 2005
- No. of dairy farms: 108,000- Average farm size: 6.4 cows per farm- Main size class: < 20 cows- Milk / feed price ratio: 1.1
Key developments 2000 - 2005 - Farm growth: - 0.8 % milk per farm and year- Milk price: + 4.6 % per year- Feed prices: + 1 % per year- Milk / feed price ratio: Upward trend- Land prices: + 1.4 % per year- Cull cow prices: stable
Cull cow price (PEN / kg live weight)Land price – buy (PEN / ha)
ExplanationsMilk map details: Data base 2000 - 2005.Estimates: No. of cows per size class is estimated based on average farm size: 5; 50; 150 cows per farm.Source: National statistics, FAO, Eurostat, USDA, ZMP, IDF and estimations. Milk / feed price ratio: Method see Chapter 2. Milk prices are shown in ECM.
PEN / 100 kg
Milk / corn price ratio
Change in milk production (% per year)
Annual changes in %-100 <= -5
> -5 <= -2.5> -2.5 <= -0.5> -0.5 <= 0.5
> 0.5 <= 2.5> 2.5 <= 5
> 5 <= 100no data
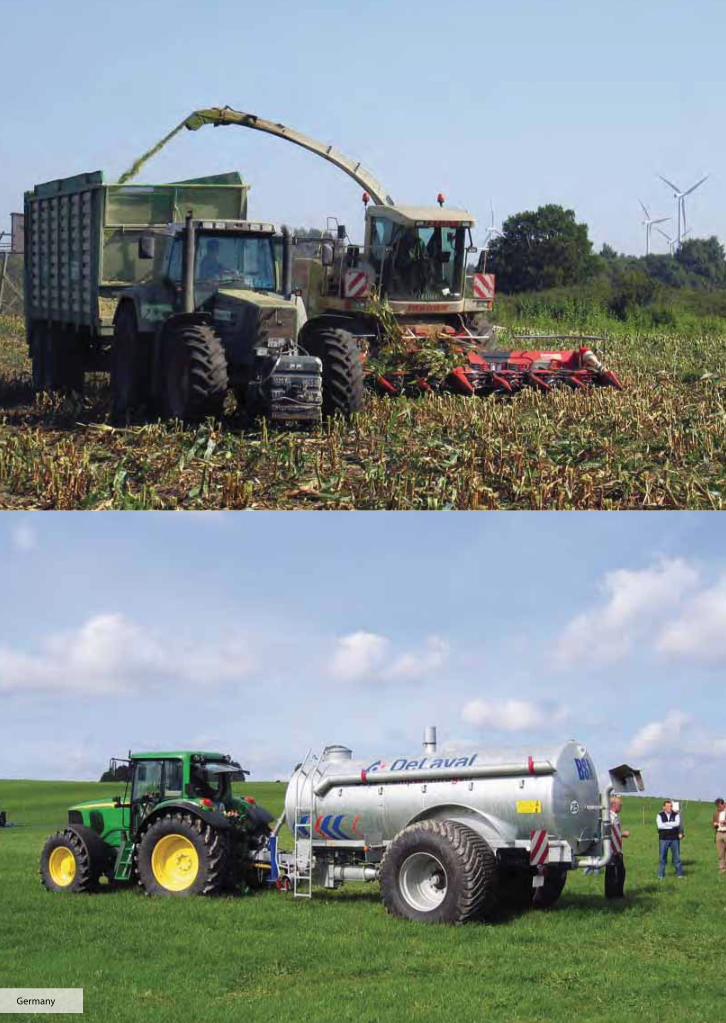
78 © IFCN 2008Germany
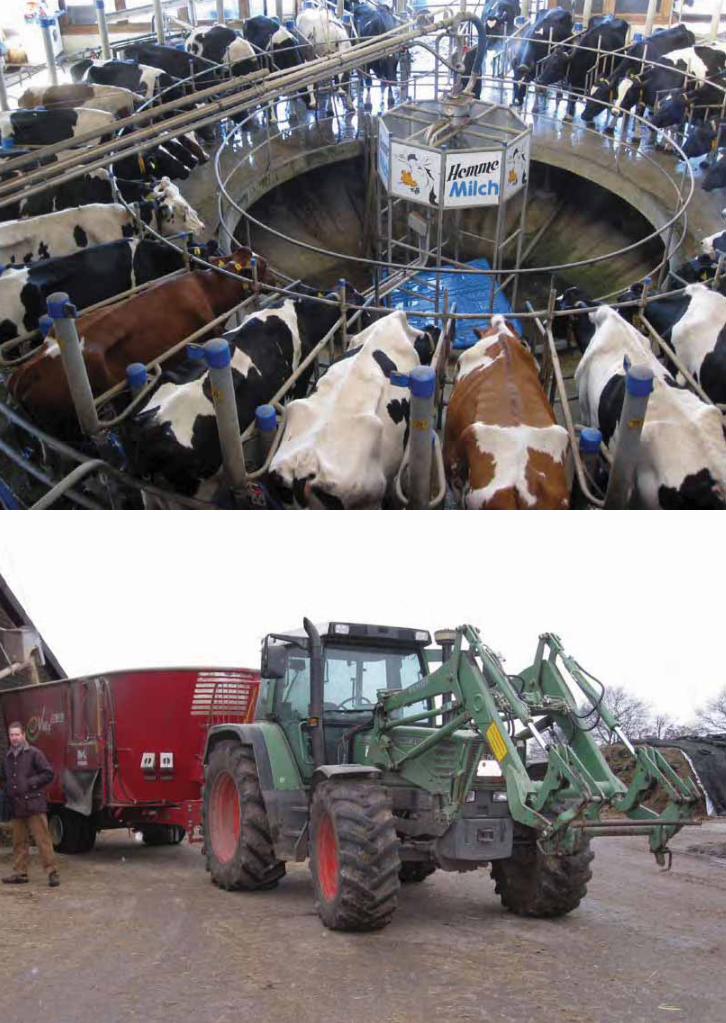
© IFCN 2008 79
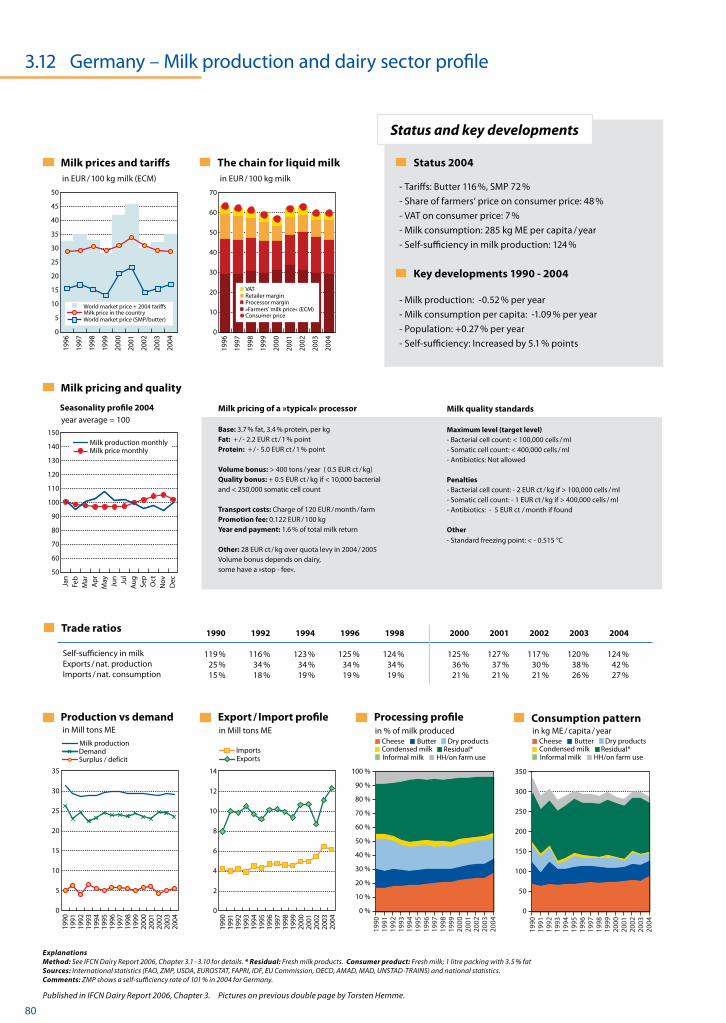
80 © IFCN 2008
Milk pricing and quality
Production vs demand Export / Import profilein Mill tons ME
Processing profile in % of milk produced
Consumption pattern in kg ME / capita / year
Status and key developments
Milk prices and tariffs The chain for liquid milk
Trade ratios
Seasonality profile 2004
Self-sufficiency in milkExports / nat. productionImports / nat. consumption
in Mill tons ME
Surplus / deficit
Milk productionDemand Imports
Exports
year average = 100
Milk price monthlyMilk production monthly
Published in IFCN Dairy Report 2006, Chapter 3.
3.12 Germany – Milk production and dairy sector profile
50
60
70
80
90
100
110
120
130
140
150
Milk price monthlyMilk production monthly
Dec
NovOct
Sep
Au
gJu
lJu
nM
ayA
pr
Mar
Feb
Jan
0
10
20
30
40
50
60
70
Consumer price
Retailer marginProcessor margin»Farmers' milk price« (ECM)
VAT
2004
2003
2002
2001
2000
1999
1998
1997
1996
0
5
10
15
20
25
30
35
40
45
50
World market price + 2004 tariffs
World market price (SMP/butter)Milk price in the country
2004
2003
2002
2001
2000
1999
1998
1997
1996
0
50
100
150
200
250
300
350
2004
2003
2002
2001
2000
1999
1998
1997
1996
1995
1994
1993
1992
1991
1990
0 %
10 %
20 %
30 %
40 %
50 %
60 %
70 %
80 %
90 %
100 %
2004
2003
2002
2001
2000
1999
1998
1997
1996
1995
1994
1993
1992
1991
1990
0
2
4
6
8
10
12
14
2004
2003
2002
2001
2000
1999
1998
1997
1996
1995
1994
1993
1992
1991
1990
0
5
10
15
20
25
30
35
2004
2003
2002
2001
2000
1999
1998
1997
1996
1995
1994
1993
1992
1991
1990
in EUR / 100 kg milk (ECM) in EUR / 100 kg milk
Status 2004
- Tariffs: Butter 116 %, SMP 72 %- Share of farmers‘ price on consumer price: 48 % - VAT on consumer price: 7 % - Milk consumption: 285 kg ME per capita / year- Self-sufficiency in milk production: 124 %
Key developments 1990 - 2004 - Milk production: -0.52 % per year- Milk consumption per capita: -1.09 % per year- Population: +0.27 % per year- Self-sufficiency: Increased by 5.1 % points
ExplanationsMethod: See IFCN Dairy Report 2006, Chapter 3.1 - 3.10 for details. * Residual: Fresh milk products. Consumer product: Fresh milk; 1 litre packing with 3.5 % fatSources: International statistics (FAO, ZMP, USDA, EUROSTAT, FAPRI, IDF, EU Commission, OECD, AMAD, MAD, UNSTAD-TRAINS) and national statistics.Comments: ZMP shows a self-sufficiency rate of 101 % in 2004 for Germany.
1990 1992 1994 1996 1998 2000 2001 2002 2003 2004
119 % 116 % 123 % 125 % 124 % 125 % 127 % 117 % 120 % 124 % 25 % 34 % 34 % 34 % 34 % 36 % 37 % 30 % 38 % 42 % 15 % 18 % 19 % 19 % 19 % 21 % 21 % 21 % 26 % 27 %
Milk pricing of a »typical« processor
Base: 3.7 % fat, 3.4 % protein, per kgFat: + / - 2.2 EUR ct / 1 % pointProtein: + / - 5.0 EUR ct / 1 % point
Volume bonus: > 400 tons / year ( 0.5 EUR ct / kg)Quality bonus: + 0.5 EUR ct / kg if < 10,000 bacterial and < 250,000 somatic cell count
Transport costs: Charge of 120 EUR / month / farmPromotion fee: 0.122 EUR / 100 kgYear end payment: 1.6 % of total milk return
Other: 28 EUR ct / kg over quota levy in 2004 / 2005Volume bonus depends on dairy, some have a »stop - fee«.
Milk quality standards
Maximum level (target level)- Bacterial cell count: < 100,000 cells / ml- Somatic cell count: < 400,000 cells / ml- Antibiotics: Not allowed
Penalties- Bacterial cell count: - 2 EUR ct / kg if > 100,000 cells / ml- Somatic cell count: - 1 EUR ct / kg if > 400,000 cells / ml- Antibiotics: - 5 EUR ct / month if found
Other- Standard freezing point: < - 0.515 °C
Residual*Condensed milkDry productsButterCheese
HH/on farm useInformal milkResidual*Condensed milk
Dry productsButterCheese
HH/on farm useInformal milk
Pictures on previous double page by Torsten Hemme.
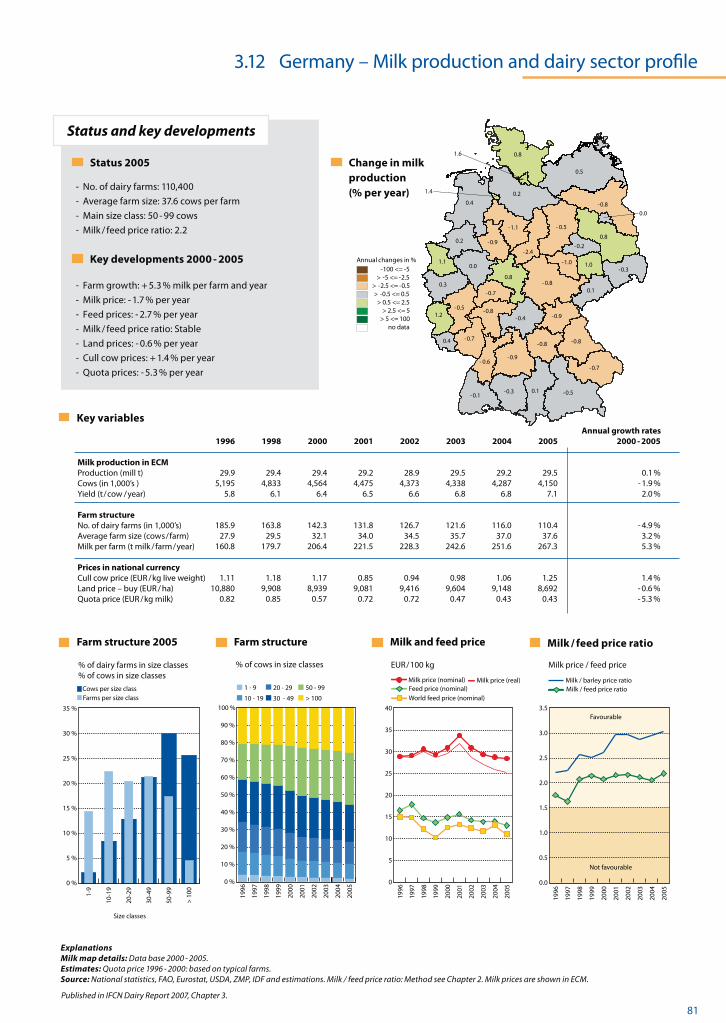
© IFCN 2008 81
Key variables
Farm structure 2005
Milk production in ECM Production (mill t)Cows (in 1,000’s )Yield (t / cow / year)
Farm structure No. of dairy farms (in 1,000’s)Average farm size (cow s / farm)Milk per farm (t milk / farm / year) Prices in national currencyCull cow price (EUR / kg live weight)Land price – buy (EUR / ha)Quota price (EUR / kg milk)
Farm structure Milk and feed price Milk / feed price ratio
Status and key developments
Size classes
% of dairy farms in size classes % of cows in size classes
% of cows in size classes EUR / 100 kg Milk price / feed price
Cows per size classFarms per size class
Milk / barley price ratioMilk / feed price ratio
World feed price (nominal)
Milk price (nominal) Milk price (real)Feed price (nominal)
Published in IFCN Dairy Report 2007, Chapter 3.
-0.9-0.6
-0.1-0.3 -0.5
-0.7
-0.8
-0.9
-0.8
-0.4
0.1
0.0
-0.8
0.8
1.4
1.6
-0.8
-0.7
0.8
0.5
-2.4
-1.1
0.2
0.4
1.1
0.3
0.2 -0.9
0.0
-0.5
1.2
-0.70.4
0.1
-0.31.0
-0.2
-1.0
-0.5
0.8
-0.8
-0.9- 0.6
-0.1-0.3 -0.5
-0.7
-0.8
-0.9
-0.8
-0.4
0.1
0.0
-0.8
0.8
1.4
1.6
-0.8
-0.7
0.8
0.5
-2.4
-1.1
0.2
0.4
1.1
0.3
0.2 -0.9
0.0
-0.51.2
-0.70.4
0.1
-0.31.0
-0.2
-1.0
- 0.5
0.8
-0.8
Change in milk production (% per year)
Annual changes in %-100 <= -5
> -5 <= -2.5> -2.5 <= -0.5> -0.5 <= 0.5
> 0.5 <= 2.5> 2.5 <= 5
> 5 <= 100no data
3.12 Germany – Milk production and dairy sector profile
0 %
10 %
20 %
30 %
40 %
50 %
60 %
70 %
80 %
90 %
100 %
2005
2004
2003
2002
2001
2000
1999
1998
1997
1996
30 - 49
20 - 29
10 - 19
1 - 9
> 100
50 - 99
2005
2004
2003
2002
2001
2000
1999
1998
1997
1996
0
5
10
15
20
25
30
35
40Favourable
Not favourable
2005
2004
2003
2002
2001
2000
1999
1998
1997
1996
0.0
0.5
1.0
1.5
2.0
2.5
3.0
3.5
0 %
5 %
10 %
15 %
20 %
25 %
30 %
35 %
> 1
00
50-9
9
30-4
9
20-2
9
10-
19 1-9
Annual growth rates 1996 1998 2000 2001 2002 2003 2004 2005 2000 - 2005
29.9 29.4 29.4 29.2 28.9 29.5 29.2 29.5 0.1 % 5,195 4,833 4,564 4,475 4,373 4,338 4,287 4,150 - 1.9 % 5.8 6.1 6.4 6.5 6.6 6.8 6.8 7.1 2.0 % 185.9 163.8 142.3 131.8 126.7 121.6 116.0 110.4 - 4.9 % 27.9 29.5 32.1 34.0 34.5 35.7 37.0 37.6 3.2 % 160.8 179.7 206.4 221.5 228.3 242.6 251.6 267.3 5.3 % 1.11 1.18 1.17 0.85 0.94 0.98 1.06 1.25 1.4 % 10,880 9,908 8,939 9,081 9,416 9,604 9,148 8,692 - 0.6 % 0.82 0.85 0.57 0.72 0.72 0.47 0.43 0.43 - 5.3 %
Status 2005
- No. of dairy farms: 110,400- Average farm size: 37.6 cows per farm- Main size class: 50 - 99 cows- Milk / feed price ratio: 2.2
Key developments 2000 - 2005 - Farm growth: + 5.3 % milk per farm and year- Milk price: - 1.7 % per year- Feed prices: - 2.7 % per year- Milk / feed price ratio: Stable- Land prices: - 0.6 % per year- Cull cow prices: + 1.4 % per year- Quota prices: - 5.3 % per year
ExplanationsMilk map details: Data base 2000 - 2005.Estimates: Quota price 1996 - 2000: based on typical farms.Source: National statistics, FAO, Eurostat, USDA, ZMP, IDF and estimations. Milk / feed price ratio: Method see Chapter 2. Milk prices are shown in ECM.
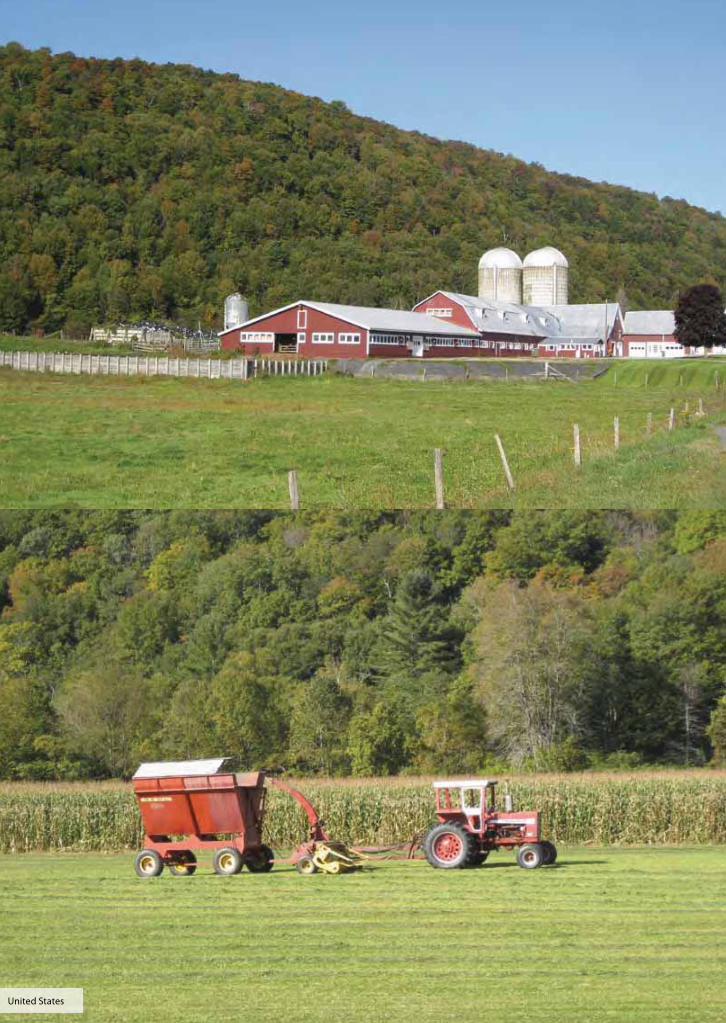
82 © IFCN 2008United States
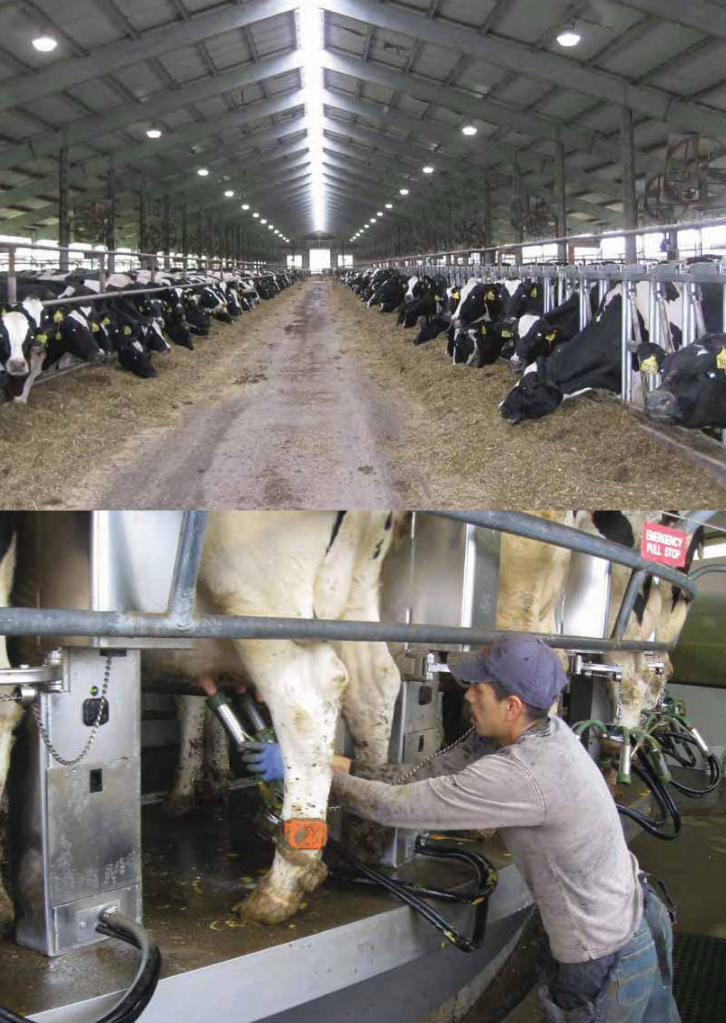
© IFCN 2008 83
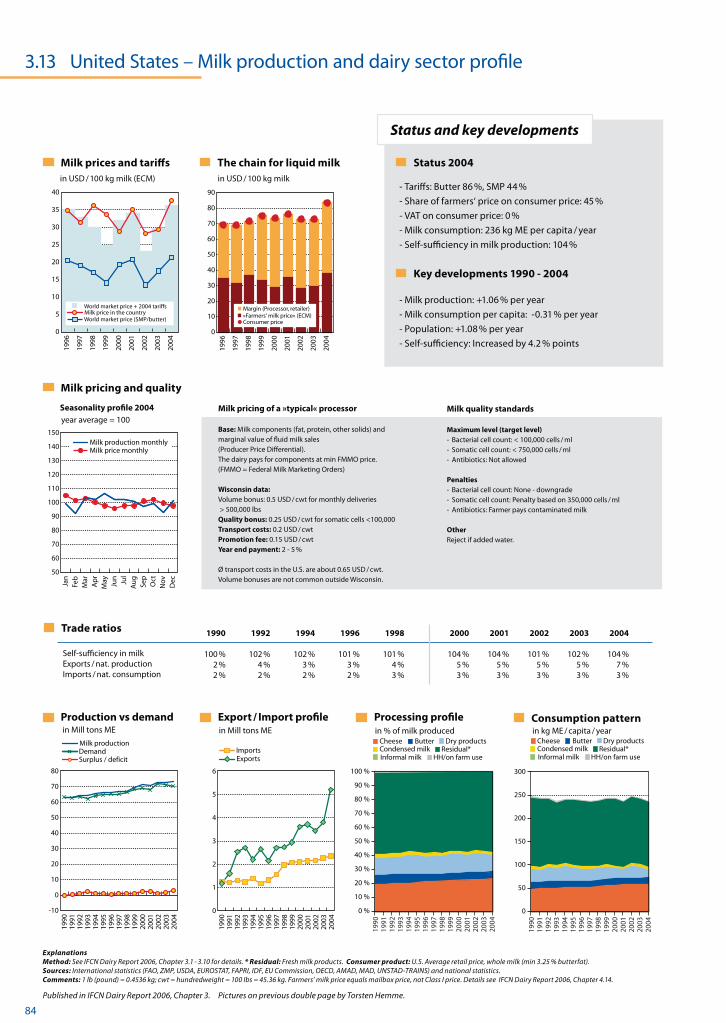
84 © IFCN 2008
Milk pricing and quality
Production vs demand Export / Import profilein Mill tons ME
Processing profile in % of milk produced
Consumption pattern in kg ME / capita / year
Status and key developments
Milk prices and tariffs The chain for liquid milk
Trade ratios
Seasonality profile 2004
Self-sufficiency in milkExports / nat. productionImports / nat. consumption
in Mill tons ME
Surplus / deficit
Milk productionDemand Imports
Exports
year average = 100
Milk price monthlyMilk production monthly
Published in IFCN Dairy Report 2006, Chapter 3.
0
10
20
30
40
50
60
70
80
90
2004
2003
2002
2001
2000
1999
1998
1997
1996
Consumer price
Margin (Processor, retailer)»Farmers' milk price« (ECM)
0
5
10
15
20
25
30
35
40
World market price + 2004 tariffs
World market price (SMP/butter)Milk price in the country
2004
2003
2002
2001
2000
1999
1998
1997
1996
in USD / 100 kg milk (ECM) in USD / 100 kg milk
3.13 United States – Milk production and dairy sector profile
50
60
70
80
90
100
110
120
130
140
150
Milk price monthlyMilk production monthly
Dec
NovOct
Sep
Au
gJu
lJu
nM
ayA
pr
Mar
Feb
Jan
0
50
100
150
200
250
300
2004
2003
2002
2001
2000
1999
1998
1997
1996
1995
1994
1993
1992
1991
1990
0 %
10 %
20 %
30 %
40 %
50 %
60 %
70 %
80 %
90 %
100 %
2004
2003
2002
2001
2000
1999
1998
1997
1996
1995
1994
1993
1992
1991
1990
0
1
2
3
4
5
6
2004
2003
2002
2001
2000
1999
1998
1997
1996
1995
1994
1993
1992
1991
1990
-10
0
10
20
30
40
50
60
70
80
2004
2003
2002
2001
2000
1999
1998
1997
1996
1995
1994
1993
1992
1991
1990
Status 2004
- Tariffs: Butter 86 %, SMP 44 %- Share of farmers‘ price on consumer price: 45 % - VAT on consumer price: 0 % - Milk consumption: 236 kg ME per capita / year- Self-sufficiency in milk production: 104 %
Key developments 1990 - 2004 - Milk production: +1.06 % per year- Milk consumption per capita: -0.31 % per year- Population: +1.08 % per year- Self-sufficiency: Increased by 4.2 % points
ExplanationsMethod: See IFCN Dairy Report 2006, Chapter 3.1 - 3.10 for details. * Residual: Fresh milk products. Consumer product: U.S. Average retail price, whole milk (min 3.25 % butterfat).Sources: International statistics (FAO, ZMP, USDA, EUROSTAT, FAPRI, IDF, EU Commission, OECD, AMAD, MAD, UNSTAD-TRAINS) and national statistics.Comments: 1 lb (pound) = 0.4536 kg; cwt = hundredweight = 100 Ibs = 45.36 kg. Farmers’ milk price equals mailbox price, not Class I price. Details see IFCN Dairy Report 2006, Chapter 4.14.
1990 1992 1994 1996 1998 2000 2001 2002 2003 2004
100 % 102 % 102 % 101 % 101 % 104 % 104 % 101 % 102 % 104 % 2 % 4 % 3 % 3 % 4 % 5 % 5 % 5 % 5 % 7 % 2 % 2 % 2 % 2 % 3 % 3 % 3 % 3 % 3 % 3 %
Milk pricing of a »typical« processor
Base: Milk components (fat, protein, other solids) andmarginal value of fluid milk sales (Producer Price Differential).The dairy pays for components at min FMMO price.(FMMO = Federal Milk Marketing Orders)
Wisconsin data:Volume bonus: 0.5 USD / cwt for monthly deliveries > 500,000 lbsQuality bonus: 0.25 USD / cwt for somatic cells <100,000Transport costs: 0.2 USD / cwt Promotion fee: 0.15 USD / cwtYear end payment: 2 - 5 %
Ø transport costs in the U.S. are about 0.65 USD / cwt.Volume bonuses are not common outside Wisconsin.
Milk quality standards
Maximum level (target level)- Bacterial cell count: < 100,000 cells / ml- Somatic cell count: < 750,000 cells / ml- Antibiotics: Not allowed
Penalties- Bacterial cell count: None - downgrade- Somatic cell count: Penalty based on 350,000 cells / ml- Antibiotics: Farmer pays contaminated milk
OtherReject if added water.
Residual*Condensed milkDry productsButterCheese
HH/on farm useInformal milkResidual*Condensed milk
Dry productsButterCheese
HH/on farm useInformal milk
Pictures on previous double page by Torsten Hemme.
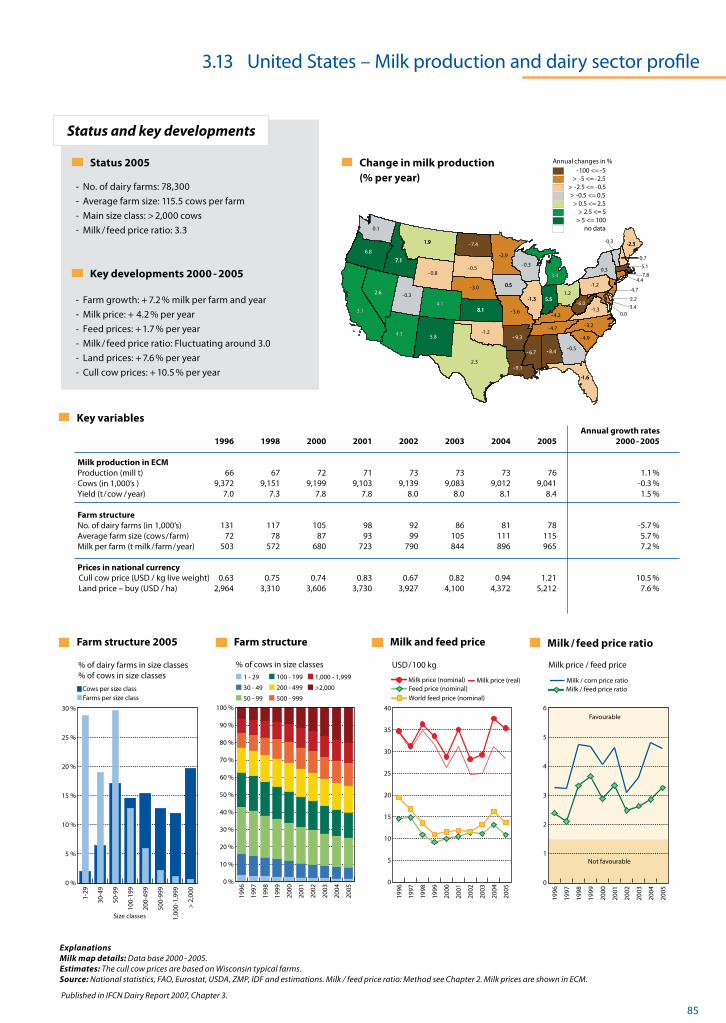
© IFCN 2008 85
Key variables
Farm structure 2005
Milk production in ECM Production (mill t)Cows (in 1,000’s )Yield (t / cow / year)
Farm structure No. of dairy farms (in 1,000’s)Average farm size (cow s / farm)Milk per farm (t milk / farm / year) Prices in national currencyCull cow price (EUR / kg live weight)Land price – buy (EUR / ha)Quota price (EUR / kg milk)
Farm structure Milk and feed price Milk / feed price ratio
Status and key developments
Size classes
% of dairy farms in size classes % of cows in size classes
% of cows in size classes EUR / 100 kg Milk price / feed price
Cows per size classFarms per size class
Milk / barley price ratioMilk / feed price ratio
World feed price (nominal)
Milk price (nominal) Milk price (real)Feed price (nominal)
Published in IFCN Dairy Report 2007, Chapter 3.
3.13 United States – Milk production and dairy sector profile
0 %
10 %
20 %
30 %
40 %
50 %
60 %
70 %
80 %
90 %
100 %
2005
2004
2003
2002
2001
2000
1999
1998
1997
1996
50 - 99
30 - 49
500 - 999
200 - 499 >2,000
1 - 29 100 - 199 1,000 - 1,999
2005
2004
2003
2002
2001
2000
1999
1998
1997
1996
0
5
10
15
20
25
30
35
40Favourable
Not favourable
0
1
2
3
4
5
6
2005
2004
2003
2002
2001
2000
1999
1998
1997
1996
0 %
5 %
10 %
15 %
20 %
25 %
30 %
> 2
,000
1,0
00-1
,999
500
-999
200
-499
100
-199
50-
99
30-
49
1-2
9
Annual growth rates 1996 1998 2000 2001 2002 2003 2004 2005 2000 - 2005
66 67 72 71 73 73 73 76 1.1 % 9,372 9,151 9,199 9,103 9,139 9,083 9,012 9,041 -0.3 % 7.0 7.3 7.8 7.8 8.0 8.0 8.1 8.4 1.5 % 131 117 105 98 92 86 81 78 -5.7 % 72 78 87 93 99 105 111 115 5.7 % 503 572 680 723 790 844 896 965 7.2 % 0.63 0.75 0.74 0.83 0.67 0.82 0.94 1.21 10.5 % 2,964 3,310 3,606 3,730 3,927 4,100 4,372 5,212 7.6 %
Status 2005
- No. of dairy farms: 78,300- Average farm size: 115.5 cows per farm- Main size class: > 2,000 cows- Milk / feed price ratio: 3.3
Key developments 2000 - 2005 - Farm growth: + 7.2 % milk per farm and year- Milk price: + 4.2 % per year- Feed prices: + 1.7 % per year- Milk / feed price ratio: Fluctuating around 3.0- Land prices: + 7.6 % per year- Cull cow prices: + 10.5 % per year
Cull cow price (USD / kg live weight)Land price – buy (USD / ha)
ExplanationsMilk map details: Data base 2000 - 2005.Estimates: The cull cow prices are based on Wisconsin typical farms.Source: National statistics, FAO, Eurostat, USDA, ZMP, IDF and estimations. Milk / feed price ratio: Method see Chapter 2. Milk prices are shown in ECM.
USD / 100 kg
Milk / corn price ratio
US -
USA
-8.4
-9.34.3
3.14.1
-4.4
0.0-2.2
-1.6
-0.5
0.5
7.1
-1.3 5.5
8.1-4.2
-9.1
-5.1
-3.4
-2.3
3.4
-2.9
-3.6
-6.7
1.9
-3.2
-7.4
-3.0
-0.7
-4.7
5.8
2.6
0.3
1.2
-1.2
6.8
-1.2
-7.8
-4.9
-0.5
-4.7
2.3
-0.3
-1.3
-0.3
0.1
-0.3
-6.0
-0.8
-
-4.3
3.14.1
-1.6
-0.5
0.5
7.1
-1.3 5.5
8.1-
- 9.1
-
-2.3
3.4
-2.9
-
-
1.9
-3.2
-7.4
-3.0
-0.7
-4.7
-
-4.3
3.14.1
- 4.4
0.0
-2.2
-1.6
-
0.5
7.1
-1.3 5.5
8.1-
-
-5.1
-3.4
-2.3
3.4
-
-
-
1.9
-
-
-
-0.7
-4.72.6
0.3
1.2
-1.2
6.8
-1.2
-7.8
-
-
-
2.3
-0.3
-1.3
-0.3
0.1
-
-6.0
-
8.4
9.3
4.23.6
6.7
3.2
7.4
3.0
4.9
0.5
4.7
0.3
0.8
5.8
Change in milk production (% per year)
Annual changes in %-100 <= -5
> -5 <= -2.5> -2.5 <= -0.5> -0.5 <= 0.5
> 0.5 <= 2.5> 2.5 <= 5
> 5 <= 100no data
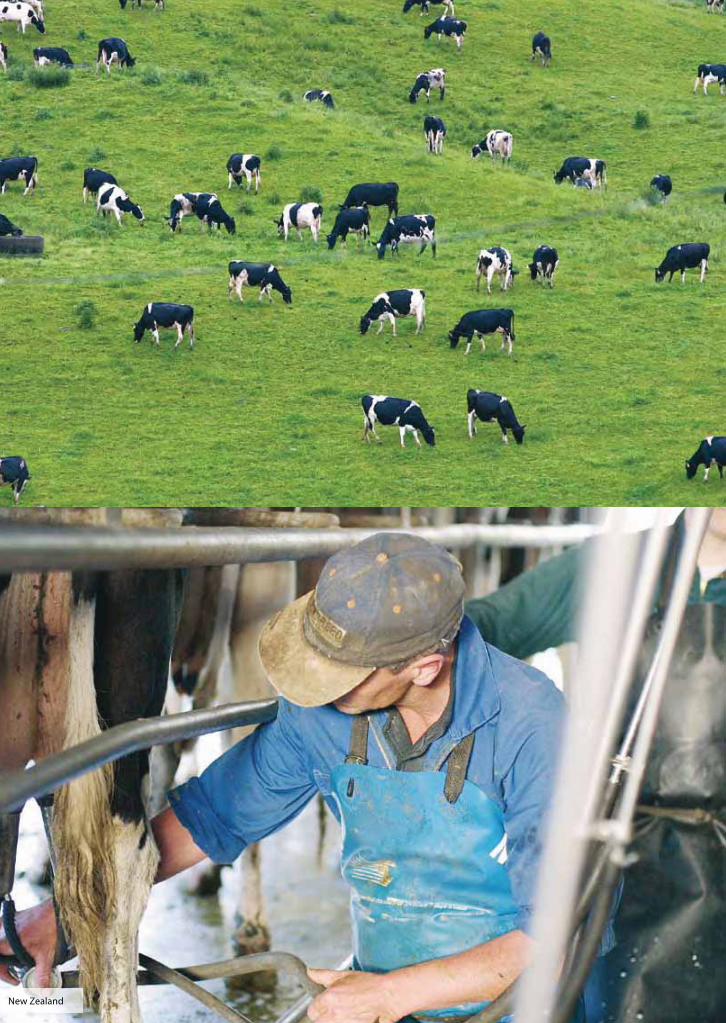
86 © IFCN 2008New Zealand
© IFCN 2008 87
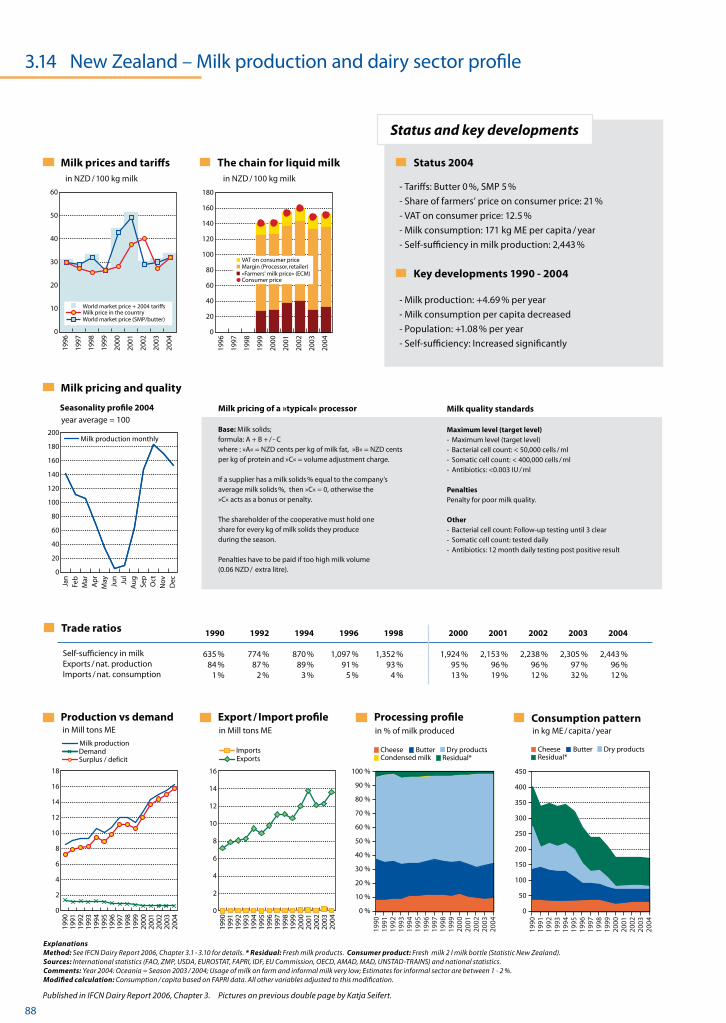
88 © IFCN 2008
Milk pricing and quality
Production vs demand Export / Import profilein Mill tons ME
Processing profile in % of milk produced
Consumption pattern in kg ME / capita / year
Status and key developments
Milk prices and tariffs The chain for liquid milk
Trade ratios
Seasonality profile 2004
Self-sufficiency in milkExports / nat. productionImports / nat. consumption
in Mill tons ME
Surplus / deficit
Milk productionDemand Imports
Exports
year average = 100
Milk price monthlyMilk production monthly
Published in IFCN Dairy Report 2006, Chapter 3.
3.14 New Zealand – Milk production and dairy sector profile
0
20
40
60
80
100
120
140
160
180
200Milk production monthly
Dec
NovOct
Sep
Au
gJu
lJu
nM
ayA
pr
Mar
Feb
Jan
0
50
100
150
200
250
300
350
400
450
2004
2003
2002
2001
2000
1999
1998
1997
1996
1995
1994
1993
1992
1991
1990
0 %
10 %
20 %
30 %
40 %
50 %
60 %
70 %
80 %
90 %
100 %
2004
2003
2002
2001
2000
1999
1998
1997
1996
1995
1994
1993
1992
1991
1990
0
2
4
6
8
10
12
14
16
2004
2003
2002
2001
2000
1999
1998
1997
1996
1995
1994
1993
1992
1991
1990
0
2
4
6
8
10
12
14
16
18
2004
2003
2002
2001
2000
1999
1998
1997
1996
1995
1994
1993
1992
1991
1990
Status 2004
- Tariffs: Butter 0 %, SMP 5 %- Share of farmers’ price on consumer price: 21 % - VAT on consumer price: 12.5 % - Milk consumption: 171 kg ME per capita / year- Self-sufficiency in milk production: 2,443 %
Key developments 1990 - 2004 - Milk production: +4.69 % per year- Milk consumption per capita decreased- Population: +1.08 % per year- Self-sufficiency: Increased significantly
0
20
40
60
80
100
120
140
160
180
2004
2003
2002
2001
2000
1999
1998
1997
1996
Consumer price
Margin (Processor, retailer)»Farmers' milk price« (ECM)
VAT on consumer price
0
10
20
30
40
50
60
World market price + 2004 tariffs
World market price (SMP/butter)Milk price in the country
2004
2003
2002
2001
2000
1999
1998
1997
1996
in NZD / 100 kg milk in NZD / 100 kg milk
ExplanationsMethod: See IFCN Dairy Report 2006, Chapter 3.1 - 3.10 for details. * Residual: Fresh milk products. Consumer product: Fresh milk 2 l milk bottle (Statistic New Zealand).Sources: International statistics (FAO, ZMP, USDA, EUROSTAT, FAPRI, IDF, EU Commission, OECD, AMAD, MAD, UNSTAD-TRAINS) and national statistics.Comments: Year 2004: Oceania = Season 2003 / 2004; Usage of milk on farm and informal milk very low; Estimates for informal sector are between 1 - 2 %.Modified calculation: Consumption / capita based on FAPRI data. All other variables adjusted to this modification.
1990 1992 1994 1996 1998 2000 2001 2002 2003 2004
635 % 774 % 870 % 1,097 % 1,352 % 1,924 % 2,153 % 2,238 % 2,305 % 2,443 % 84 % 87 % 89 % 91 % 93 % 95 % 96 % 96 % 97 % 96 % 1 % 2 % 3 % 5 % 4 % 13 % 19 % 12 % 32 % 12 %
Milk pricing of a »typical« processor
Base: Milk solids; formula: A + B + / - C where : »A« = NZD cents per kg of milk fat, »B« = NZD cents per kg of protein and »C« = volume adjustment charge.
If a supplier has a milk solids % equal to the company‘s average milk solids %, then »C« = 0, otherwise the »C« acts as a bonus or penalty.
The shareholder of the cooperative must hold oneshare for every kg of milk solids they produceduring the season.
Penalties have to be paid if too high milk volume(0.06 NZD / extra litre).
Milk quality standards
Maximum level (target level)- Maximum level (target level)- Bacterial cell count: < 50,000 cells / ml- Somatic cell count: < 400,000 cells / ml- Antibiotics: <0.003 IU / ml
PenaltiesPenalty for poor milk quality.
Other- Bacterial cell count: Follow-up testing until 3 clear- Somatic cell count: tested daily- Antibiotics: 12 month daily testing post positive result
Residual*Condensed milkDry productsButterCheese
Residual*Dry productsButterCheese
Pictures on previous double page by Katja Seifert.
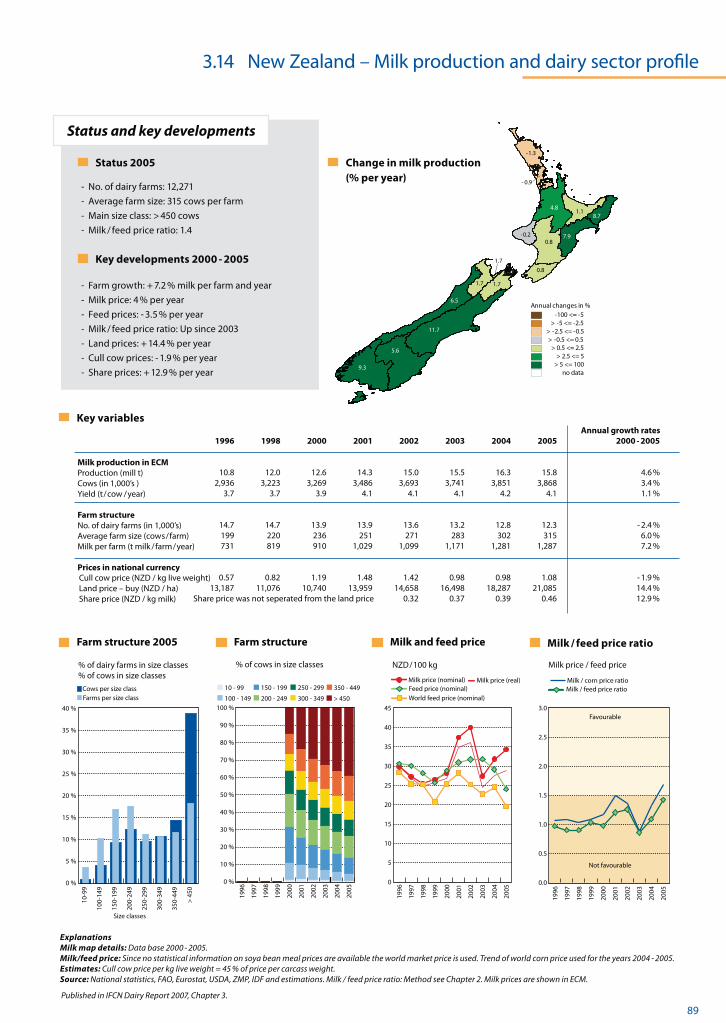
© IFCN 2008 89
Key variables
Farm structure 2005
Milk production in ECM Production (mill t)Cows (in 1,000’s )Yield (t / cow / year)
Farm structure No. of dairy farms (in 1,000’s)Average farm size (cow s / farm)Milk per farm (t milk / farm / year) Prices in national currencyCull cow price (EUR / kg live weight)Land price – buy (EUR / ha)Quota price (EUR / kg milk)
Farm structure Milk and feed price Milk / feed price ratio
Status and key developments
Size classes
% of dairy farms in size classes % of cows in size classes
% of cows in size classes EUR / 100 kg Milk price / feed price
Cows per size classFarms per size class
Milk / barley price ratioMilk / feed price ratio
World feed price (nominal)
Milk price (nominal) Milk price (real)Feed price (nominal)
Published in IFCN Dairy Report 2007, Chapter 3.
land
-1.3
-0.9
4.81.1
8.7
7.9-0.2
0.8
0.8
6.5
11.7
5.69.3
1.7
1.7
1.7
-1.3
- 0.9
4.81.1
8.7
7.9-0.20.8
0.8
6.5
11.7
5.6
9.3
1.7
1.7
1.7
Change in milk production (% per year)
Annual changes in %-100 <= -5
> -5 <= -2.5> -2.5 <= -0.5> -0.5 <= 0.5
> 0.5 <= 2.5> 2.5 <= 5
> 5 <= 100no data
3.14 New Zealand – Milk production and dairy sector profile
0 %
10 %
20 %
30 %
40 %
50 %
60 %
70 %
80 %
90 %
100 %
2005
2004
2003
2002
2001
2000
1999
1998
1997
1996
200 - 249
150 - 199
100 - 149
10 - 99
300 - 349
250 - 299 350 - 449
> 450
2005
2004
2003
2002
2001
2000
1999
1998
1997
1996
0
5
10
15
20
25
30
35
40
45Favourable
Not favourable
0.0
0.5
1.0
1.5
2.0
2.5
3.0
2005
2004
2003
2002
2001
2000
1999
1998
1997
1996
0 %
5 %
10 %
15 %
20 %
25 %
30 %
35 %
40 %
> 4
50
350-
449
300-
349
250-
299
200-
249
150-
199
100-
149
10-9
9
Status 2005
- No. of dairy farms: 12,271- Average farm size: 315 cows per farm- Main size class: > 450 cows- Milk / feed price ratio: 1.4
Key developments 2000 - 2005 - Farm growth: + 7.2 % milk per farm and year- Milk price: 4 % per year- Feed prices: - 3.5 % per year- Milk / feed price ratio: Up since 2003- Land prices: + 14.4 % per year- Cull cow prices: - 1.9 % per year- Share prices: + 12.9 % per year
Cull cow price (NZD / kg live weight)Land price – buy (NZD / ha)Share price (NZD / kg milk)
ExplanationsMilk map details: Data base 2000 - 2005.Milk/feed price: Since no statistical information on soya bean meal prices are available the world market price is used. Trend of world corn price used for the years 2004 - 2005.Estimates: Cull cow price per kg live weight = 45 % of price per carcass weight.Source: National statistics, FAO, Eurostat, USDA, ZMP, IDF and estimations. Milk / feed price ratio: Method see Chapter 2. Milk prices are shown in ECM.
NZD / 100 kg
Milk / corn price ratio
Annual growth rates 1996 1998 2000 2001 2002 2003 2004 2005 2000 - 2005
10.8 12.0 12.6 14.3 15.0 15.5 16.3 15.8 4.6 % 2,936 3,223 3,269 3,486 3,693 3,741 3,851 3,868 3.4 % 3.7 3.7 3.9 4.1 4.1 4.1 4.2 4.1 1.1 % 14.7 14.7 13.9 13.9 13.6 13.2 12.8 12.3 - 2.4 % 199 220 236 251 271 283 302 315 6.0 % 731 819 910 1,029 1,099 1,171 1,281 1,287 7.2 % 0.57 0.82 1.19 1.48 1.42 0.98 0.98 1.08 - 1.9 % 13,187 11,076 10,740 13,959 14,658 16,498 18,287 21,085 14.4 % Share price was not seperated from the land price 0.32 0.37 0.39 0.46 12.9 %
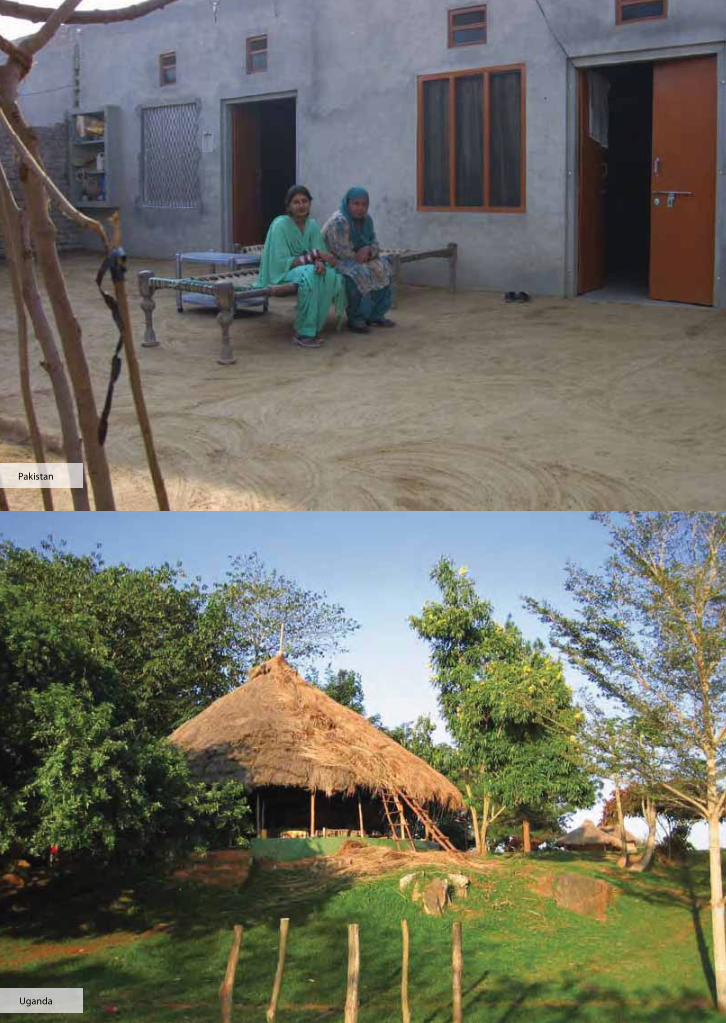
Pakistan
Uganda
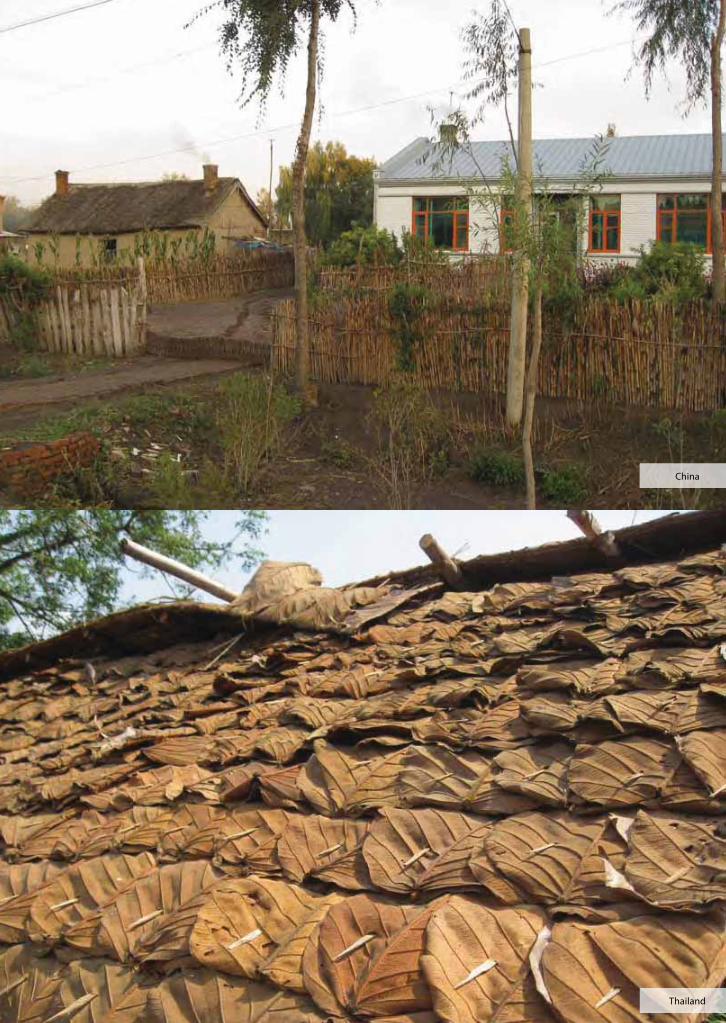
China
Thailand
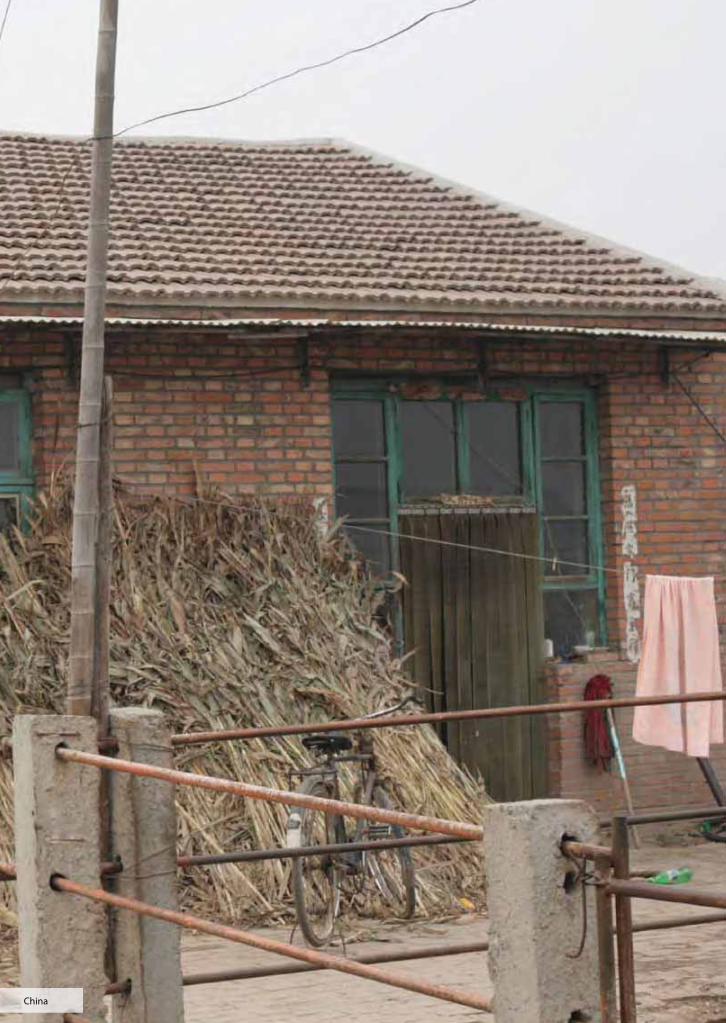
China