Embed Size (px)
Citation preview

51

52
CHAPTER 2
MATERIALS AND METHODS
2. 1. Materials
2.1. 1. Microorganisms
Lactic acid bacteria isolated from different sources like sour dough, whey, fermented
vegetables (cabbage, snake gourd), excreta of sheep and human baby were used for the
probiotic characterization. Twenty cultures isolated were screened for probiotic
characterization which comprised of four from sour dough (designated as SD1, SD2, SD3
and SD4), three from whey (designated as W1, W2 and W3), two from snake gourd
(designated as SG1 and SG2), five from cabbage (designated as CB1, CB2, CB3, CB4 and
CB5), one from curd (designated as MC1), three from sheep excreta (designated as G1, G2
and G3) and two from human baby faeces (designated as WJ1 and MCJ1). Subsequently,
MC1 identified as Lactobacillus plantarum MTCC 9510, a facultative anaerobe isolated from
curd was used for exopolysaccharide production.
Escherichia coli MTCC 739, Shigella sonnei MTCC 2957, Shigella flexnerii MTCC
1457 and Staphylococcus aureus MTCC 96 obtained from Microbial Type Culture Collection
(MTCC) , Chandigarh were used for anti-microbial activity studies. E. coli DH α used for
transformation was obtained from Novagen Inc., CA, USA. Lactococcus lactis NIZO B40, an
EPS producer, which harbours EPS biosynthetic genes in an operon, was obtained from
NIZO Food Research, The Netherlands.
2.1.2. Culture Media
MRS (de Man, Rogosa and Sharpe) broth was used for Lactobacillus species and M17
broth for Lactococcus species. E. coli cells were cultured in Luria Bertani (LB) broth.
Shigella and Staphylococcus strains were grown in Nutrient agar medium. All the general
Chapter 2: Materials & Methods
53
media components were obtained from Hi-media Laboratories, Mumbai. Annexure I shows
the composition of different media mentioned above.
2.1.3. Cell lines and maintenance
The human breast adenocarcinoma cell line (MCF-7) for anti-tumour studies and
normal cell line L929 were obtained from American Type Culture Collection (ATCC),
Manassas, VA, USA). Cancer cell lines were cultured in Dulbecco’s Modified Eagle’s
Medium (DMEM, Gibco, Invitrogen, Germany) with 10 % Fetal Bovine Serum (FBS).
Lymphocytes were maintained in RPMI 1640 Medium (Invitrogen, Grand Island, New York,
USA) with 10 % FBS (Gemini Bio-Products, Inc. CA, USA). Both cell line and lymphocytes
were maintained in a 37°C incubator with 5 % CO2.
All tissue culture plates and other plastic wares were from Costar (Corning, New
York, USA).
2.1.4. Chemicals, Reagents and kits
The chemicals used in media for exopolysaccharide production such as glucose,
lactose, sucrose, galactose, yeast extract, corn steep liquor, beef extract, tryptone, ammonium
sulphate, ammonium nitrate, ammonium chloride, ammonium citrate, sodium nitrite,
potassium nitrate, sodium acetate, di-potassium hydrogen phosphate, magnesium sulphate,
manganese sulphate tween 80 etc were purchased from Hi-media Laboratories, Merck
(India) and SRL Pvt. Ltd. Other chemicals like deuterium oxide for Nuclear magnetic
Resonance (NMR) spectroscopy, potassium bromide for Fourier transform-infrared (FT-IR)
spectroscopy, dithranol for Matrix-assisted laser desorption ionization (MALDI) mass
spectrometry and potassium ferricyanide and ascorbic acid for anti-oxidant activity were
procured from Sigma Chemical Co., USA.

Chapter 2: Materials & Methods
54
Chemicals for extraction and purification of exopolysaccharide such as ethanol,
phenol-chloroform-isoamyl alcohol, acetone and the chemicals like phenol and concentrated
sulphuric acid were obtained from SRL Pvt. Ltd and Sd Fine Chemicals. Sephadex G-200
used for gel filtration was procured from Sigma chemicals, USA.
Trypsin/EDTA for anti-tumour activity studies was obtained from Gibco BRL (Life
Technologies Inc., Grand Island, NY, USA).
The stains used for microscopy such as crystal violet, safranin, alcian blue and
ruthenium red were procured from Fischer scientific chemicals. (Mumbai, India). Acridine
orange (AO), ethidium bromide (EB), and Hoechst 33342 were purchased from Sigma (St.
Louis, MO, USA). The dye mix for the EB/AO staining was 100 μg/ml acridine orange and
100 μg/ml ethidium bromide in PBS.
The T vector cloning kit, plasmid mini-prep kit and gel extraction kit were obtained
from Qiagen, Germany and Fermentas, USA. T4 DNA ligase and DNA polymerase were
procured from New England Biolabs, MBI Fermentas and Sigma, USA. Primers and Taq
DNA polymerase were procured from IDT and Sigma Co., USA respectively.
All other molecular biology grade chemicals such as agarose, Tris, SDS,
EDTA, sucrose, gelatine, DL-threonine, ampicillin, chloramphenicol, erythromycin and
lysozyme used were procured from either Sigma or Merck, USA or Hi-media laboratories,
India.
2.2. Computer Softwares
The software Design Expert (Version 6.0.6, Stat-Ease Inc., USA) and StatisticaTM
(Version 7.1) (StatSoft Inc., USA) were used for statistical bioprocess analysis of EPS
production. Oligoanalyzer program (www.idtdna.com) was used to analyse specific PCR

Chapter 2: Materials & Methods
55
primers for their Tm values and secondary structures, prior to getting them custom
synthesized.
2.3. General Microbiology
2.3.1. Microorganisms and Maintenance
All microbes except the Lactococcus spp. were grown at 37 ºC and the Lactococcus
strains were grown at 30 ºC. All microorganisms were sub-cultured in their appropriate
medium as mentioned in 2.1.2 and were maintained in agar slants or stabs at 4 ºC for
immediate use and sub-cultured every two weeks. For long time preservation they were
maintained in 30 % glycerol stock and stored at -80 ºC.
2.3.2. Preparation of Inoculum
For EPS production, an inoculum of Lactobacillus plantarum MTCC 9510 (MC1)
was prepared in 50 ml MRS medium in 250 ml Erlenmeyer flasks by inoculating with a loop
full of culture from agar stabs and incubating at 37 ºC for 18 h. The culture absorbance was
noted at 620 nm and unless specified, 109 CFU/ml culture was used as inoculum.
2.3.3. Fermentation and Extraction of EPS
Unless otherwise mentioned, exopolysaccharide production was done by submerged
fermentation (SmF) in 250 ml Erlenmeyer flasks with 50 ml exopolysaccharide production
medium ( Annexure I ). More description on fermentation was given in the chapter dealing
with submerged fermentation (chapter 4, section 4.2.2). The steps involved in the EPS
extraction from lactic acid bacteria are shown as a flow chart (Fig. 2.1).

Chapter 2: Materials & Methods
56
Fig. 2. 1. Steps involved in the extraction of EPS from lactic acid bacteria

Chapter 2: Materials & Methods
57
2.4. Analytical Methods
For the convenience, specific methods/assays had been described in
corresponding chapters. Only the general analytical methods covered in this chapter.
2.4.1. Phenol-Sulphuric Acid Method for EPS detection (Total
Carbohydrate)
Exopolysaccharides were estimated as total carbohydrates by phenol-sulphuric
acid method (Dubois et al., 1956). Concentrated sulphuric acid causes hydrolysis of
glycosidic linkages, these hydrolysed neutral sugars are then partially dehydrated with the
elimination of three molecules of water to form furfural or furfural derivatives. The
coloured compounds developed by the condensation of furfural or furfural derivatives
with phenol are measured at 490 nm.
2.4.1.1. Reagents
Phenol - 5 % (w/v)
Sulphuric acid – Concentrated (35.7 N)
2.4.1.2. Procedure
To 1 ml of sample, 1ml 5 % (w/v) phenol was added followed by 5 ml
concentrated sulphuric acid. The sample tubes were kept in ice while adding sulphuric
acid. The mixture was incubated at room temperature for 20 min and the absorbance read
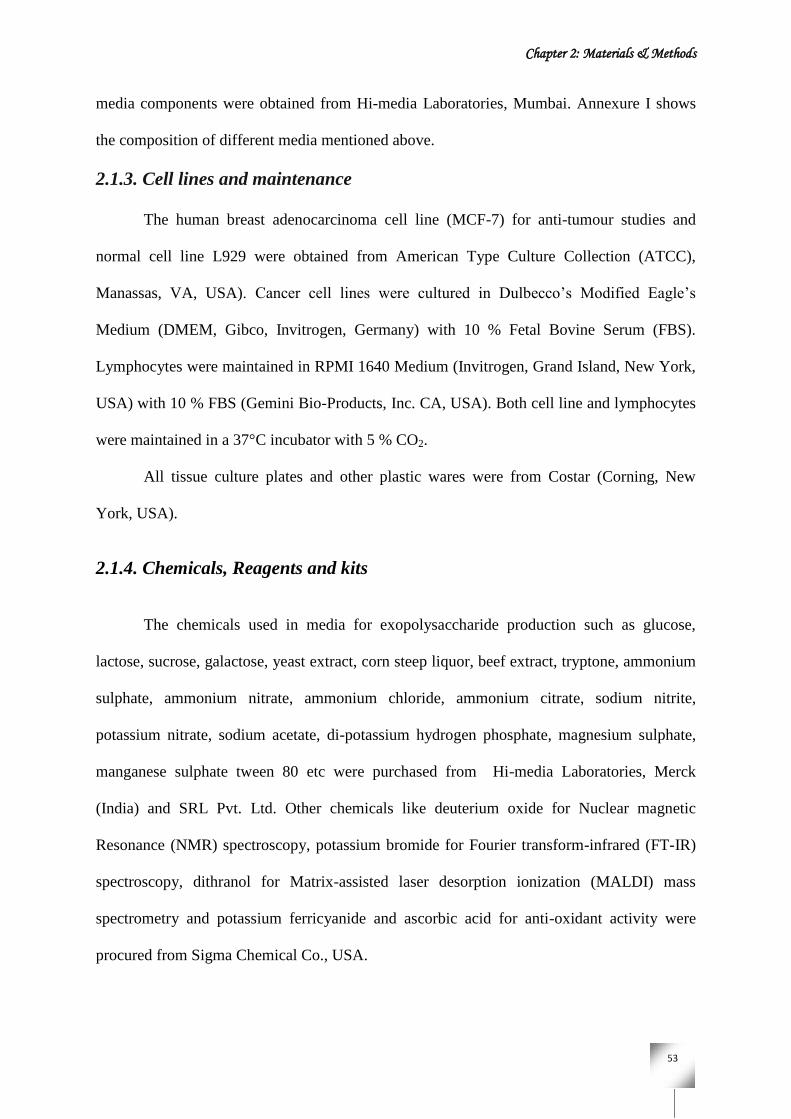
at 490 nm. Glucose was used as the standard in the range of 0-100 µg concentration from
1 mg/ml stock solution. A standard graph (Fig. 2.2) was plotted with absorbance at 490
nm against concentration of glucose. A blank was also prepared in the same way (0 mg
glucose).
Chapter 2: Materials & Methods
58
Fig. 2.2. Standard graph for phenol-sulphuric acid method
2.4.2. Lowry’s Assay for Total Soluble Protein
Total soluble protein content present in the samples was estimated by Folin-
Lowry method (Lowry et al., 1951). The assay is based on the biuret reaction of proteins
with cupric sulfate at alkaline conditions and the Folin-Ciocalteau
phosphomolybdotungstate reduction to heteropolymolybdenum blue which is measured
at 660 nm. The reaction is primarily due to the presence of the amino acids tyrosine and
tryptophan, and to a lesser extent cystine, cysteine, and histidine.
2.4.2.1. Reagents
Reagent A – 2 % Na2CO3 in 0.1 N NaOH
Reagent B – 0.5 % CuSO4 in 1 % Potassium sodium tartarate
Reagent C – Reagent A and Reagent B in the ratio of 50:1

Chapter 2: Materials & Methods
59
Regent D – 1N Folin-Ciocalteau reagent
2.4.2.2. Procedure
To 1 ml sample, 5 ml reagent C was added and mixed well. The mixture was
incubated at room temperature for 10 min. To this added 0.5 ml reagent D, mixed and
kept at dark for 20 min. The resulting colour was measured at 660 nm. Bovine Serum
Albumin (BSA) was used as the standard for preparing the standard graph (Fig. 2. 3).
Fig. 2.3. Standard graph for Lowry’s estimation of proteins
2.4.3. Barker & Summerson Assay for Lactic Acid Detection
Total lactic acid produced by the organisms was estimated by Barker &
Summerson assay (1941) for lactic acid. Heating culture supernatant (containing lactic
acid) in concentrated sulphuric acid produced acetaldehyde which was directly
determined by the purple colour formed with p-hydroxy diphenyl in the presence of
cupric copper. This blue colour was measured at 560 nm.

Chapter 2: Materials & Methods
60
2.4.3.1. Reagents
Copper sulphate – 4 %
Sulphuric acid – Concentrated
p-hydroxydiphenyl – 1.5 % p-hydroxydiphenyl in 0.5 % NaOH
2.4.3.2. Procedure
To 1 ml of sample, added 0.05 ml of 4 % CuS04 mixed well and added 6 ml of
concentrated sulphuric acid. The mixture incubated in boiling water bath for 10 min and
added 100 µl of p-hydroxydiphenyl and kept in room temperature for 30 min. The
absorbance read at 560 nm. Lactic acid (Sigma) was used as the standard in the range 0-
25 µg. Standard graph plotted with absorbance at 560 nm against concentrationof lactic
acid shown in Fig. 2.4. A blank was prepared in the same way (0 µg lactic acid).
Fig. 2. 4. Standard graph for lactic acid assay

Chapter 2: Materials & Methods
61
2.4.4. Dinitro Salicylic Acid (DNS) method for Reducing Sugar Analysis
The amount of reducing sugars in samples was estimated by DNS method (Miller,
1959). The aldehyde group of sugars reduces 3, 5-dinitro salicylic acid to 3-amino,
5-nitro salicylate giving rise to a brown colour measured at 575 nm.
2.4.4.1. Reagents
3, 5-Dinitro salicylic acid - 1 %
Sodium sulphite - 0.05 %
Sodium hydroxide -1 %
Phenol - 0.2 %
Rochelle salt - 40 %
2.4.4.2. Preparation of DNS
Dinitro salicylic acid and sodium hydroxide in water was dissolved gently in a water bath
at 80 ºC until a clear solution was obtained and then added the remaining chemicals.
Once the ingredients are dissolved, the solution is filtered and stored at room temperature
in amber coloured bottles in order to avoid photo oxidation.
2.4.4.3. Procedure
To 1 ml of sample, added 3 ml of DNS reagent and incubated in boiling water
bath for 5 min. The colour developed was read at 575 nm. Glucose was used as the
standard for the preaparation of standard graph (Fig. 2. 5). A blank was also prepared in
the same way.

Chapter 2: Materials & Methods
62
Fig. 2. 5. Standard graph for DNS method of reducing sugar analysis
2.5. Agarose Gel Electrophoresis
Nucleic acid molecules are separated by applying an electric field to move the
negatively charged molecules through an agarose matrix. Shorter molecules move faster
and migrate farther than longer ones because shorter molecules migrate more easily
through the pores of the gel. The yield and purity of genomic and plasmid DNA,
estimation of size of DNA molecules, analysis of PCR products etc were done using
agarose gel electrophoresis. 0.7-1 % agarose has been used with ethidium bromide to
view DNA under UV light. Tris-acetate-EDTA (TAE) buffer (1X, 40 mM Tris-acetate
and 1 mM EDTA, pH 8.3) was used as running buffer for agarose gel electrophoresis.

Chapter 2: Materials & Methods
63
2.6. Molecular Methods
Molecular biology methods such as plasmid DNA isolation from E. coli, PCR
amplification, competent cell preparation of E. coli and transformation were carried out
as per standard protocol described by Sambrook et al (1989) and explained in detail in
chapter 7 (section 7.2.5.1 and 7.2.5.2).
2.7. Equipments
The major equipments used for this study were listed in Annnexure I. Most of the
facilities were available in NIIST, Trivandrum and some of the microscopic observations
of cell lines were done in nearby institutes in Trivandrum, Rajiv Gandhi centre for
Biotechnology (RGCB), Regional cancer Centre (RCC), and Sree Chithira Thirunal
Institute (SCTI).