Embed Size (px)
Citation preview
Plausible Futures | Chapter 25: The UK NEA Scenarios: Development of Storylines and Analysis of Outcomes 1195
Key Findings ......................................................................................................................................................... 119625.1 Introduction .................................................................................................................................................. 120125.2 Developing the UK NEA Storylines ............................................................................................................... 1201 25.2.1 Identifying the Focal Questions ................................................................................................................................1201 25.2.2 Other Scenario Studies ............................................................................................................................................. 1203 25.2.3 Creating the UK NEA Scenario Using a Morphological Analysis .......................................................................... 120625.3 The UK NEA Scenarios .................................................................................................................................1207 25.3.1 Scenarios: Representing their Internal Logics ........................................................................................................ 1207 25.3.2 The UK NEA Scenarios: Key Contrasts .....................................................................................................................1210 25.3.3 Green and Pleasant Land ..........................................................................................................................................1212 25.3.4 Nature@Work ............................................................................................................................................................. 1222 25.3.5 World Markets ........................................................................................................................................................... 1226 25.3.6 National Security ....................................................................................................................................................... 1230 25.3.7 Local Stewardship ..................................................................................................................................................... 1233 25.3.8 Go with the Flow ....................................................................................................................................................... 123725.4 The Six Scenarios: Land Cover Change and Impacts on UK Ecosystem Services and Habitats .................. 1241 25.4.1 Comparing Scenario Outcomes ................................................................................................................................1241 25.4.2 Quantifying Differences ............................................................................................................................................ 124225.5 The UK NEA and Scenario Methodologies ................................................................................................... 1247 25.5.1 Scenarios: Products or Processes? ...........................................................................................................................1247 25.5.2 Judging Success ......................................................................................................................................................... 125025.6 Working with UK NEA Scenarios .................................................................................................................. 1251References ............................................................................................................................................................1253Appendix 25.1 User Responses for Focal Questions ............................................................................................1256Appendix 25.2 Indirect Drivers of Change and their Component Parts for Each of the Six UK NEA Scenarios ...........................................................................................................................................1262
Chapter 25:The UK NEA Scenarios: Development of Storylines and Analysis of OutcomesCoordinating Lead Author: Roy Haines-YoungLead Authors: James Paterson and Marion PotschinContributing Authors: Alister Wilson and Gary Kass
1196 UK National Ecosystem Assessment: Technical Report
Key Findings
Storylines
The six UK National Ecosystem Assessment (UK NEA) scenarios have been developed to gather insight into how ecosystem services and human well-being might change under a range of plausible futures. The UK NEA scenarios explore how emerging driving forces might combine to create different socio-political and economic conditions in the future and describe different ways the world might look in 2060.
Green and Pleasant Land is a scenario in which the conservation of biodiversity and landscape are dominant driving forces. Although society recognises the intrinsic value of biodiversity, the push for conservation is essentially cultural: the UK is well enough off that it can choose how it looks after its own backyard. Society’s choice is to preserve its natural assets and the countryside is a highly managed cultural landscape, with policy focused on protecting, maintaining and improving its aesthetic appeal. The drive for conservation has led to a greater emphasis on habitat restoration and recreation and, consequently, a reduction in productive farmland. The approach has boosted tourism and leisure, which has increased its contribution to the UK economy. In general, conservation of biodiversity and preservation of landscape sit hand in hand, but the continued pressure of climate change on some habitats and ecosystems means this is an area of growing social—and perhaps economic—conflict.
Nature@Work is a scenario where population growth and the adoption of new technologies are dominant driving forces. Maintaining and enhancing the output of ecosystem services in response to climate change is a key priority and society accepts that trade-offs are necessary to achieve it. Conservation of habitats and species remains desirable, but not at the expense of wider benefits—and the introduction of non-native species to provide food, energy, shade or habitat conversion (e.g. Semi-natural Grasslands to Woodlands) are commonplace if they promote ecosystem-based adaptations that enhance society’s resilience to climate change. Society takes a pragmatic view that values nature for what it provides or does and accepts the need to create multifunctional landscapes to maintain ecosystem services and quality of life. ‘Balanced service provision’ is key and many ecosystem services are the result of careful evaluation of the trade-offs through scientific and community review.
The World Markets scenario is driven by the push for economic growth through the complete liberalisation of trade. International trade barriers have dissolved, agriculture subsidies have disappeared and farming is industrialised and large-scale. Consumption in society is high, which results in greater resource use and more imports. Competition for land is high, and this, coupled with the reduced rural and urban planning regulations on
housing, agriculture and industry, means that biodiversity is often the loser. Technological development in all industries is mainly privately funded and is burgeoning. Food production has benefited from technological development and intensification and food is cheap and plentiful, but mostly of low quality. Land and sea are mainly seen as resources for exploitation and there is little effort to manage them sustainably. Fish stocks have plummeted and some species have been become locally extinct; most fish eaten in the UK is imported from Asia now. The UK’s coastal areas are changing in response to the increasing demand for ecosystem services. The east coast is the prime location of the desalination plants that have been built to meet the high demand for water. Coastal areas elsewhere accommodate the network of power plants and gas pipeline stations that are required now that domestic fossil fuel energy production is declining and imports of gas have increased. The UK’s expanded nuclear industry is financed by the private sector and supplies of other ecosystem services are increasingly being privatised as well.
The National Security scenario is driven primarily by increasing global energy prices that force most countries to seek greater self-sufficiency and efficiency in many of their core industries. This is not an easy transition for the UK and it relies on a heavy government hand in setting policy for ecosystem service provision and in creating a competition-free environment for industry within the UK. Trade barriers and tariffs have been increased to protect jobs and livelihoods, and immigration is tightly controlled. Technological development is state funded and many industries (including agriculture) are subsidised. Food, fuel, timber and mineral resources are prioritised over the conservation of biodiversity. Protectionism is a necessary response to the challenges posed by climate change rather than a source of conflict between nations, and trade continues where it can. Nevertheless, life is uncomfortable and people work hard to get by. Economic growth is low and every last resource in the UK is utilised for the provision of services. This has led to the reopening of many coalmines, greater protection of the UK’s fisheries and the conversion of previously non-productive land to farming. Resource consumption is curbed and society is less profligate and more sustainable—though perhaps out of economic necessity as much as environmental concern.
The Local Stewardship scenario is driven by similar external pressures to National Security, but society has made a more conscious effort to reduce the intensity of economic activity and the high levels of consumption that were a characteristic of the early years of the century. People understand the need to think and act differently and want to be responsible for managing resources for the future. Political power has been devolved and many major issues are decided at a regional or local level (except crucial national aspects like defence). Local timber and energy production is encouraged and there
1197Plausible Futures | Chapter 25: The UK NEA Scenarios: Development of Storylines and Analysis of Outcomes
is great pride in the varied local food products. Consumption has reduced to more sustainable (and healthy) levels and societal equity fits alongside environmental equity. People are motivated to live in low carbon economies, and consequently travel less and depend more on their own locality for food and leisure activities. Technology supports sustainability and its development and is driven by a mix of private innovation and government funding. Alternative economies such as LETS (Local Exchange Trading Systems) schemes are popular. Increased local specialisation means that the UK is now less homogenised—landscapes are more distinctive and local economies vary considerably. Economic growth is slow but the economy is stable.
Go with the Flow describes a scenario in which the dominant sociopolitical and economic drivers acting on the UK at the end of 2010 continue. In this sense it is not a ‘do-nothing’ storyline, but a projection of current approaches. Thus pursuing environmental improvement is important in this world, but society and industry are reluctant to adopt many global or national environmental policies that would lead to radical change. Progress towards a low-carbon economy and better environmental standards across industry and society is therefore slow and bumpy. Although there has been a marked improvement in the delivery of all ecosystem services, with a gradual shift away from provisioning services to regulating and cultural services, the battle between socioeconomic forces and environmental improvement continues. For now, access to ecosystem services is managed, but some regions (such as the South East, for example) are increasingly unable to meet their own needs and rely on other parts of the UK.
Drivers
The combined effects of the major indirect drivers of change (demographic, sociopolitical, economic, scientific and technological, and cultural and religious) differ according to each scenario, and this results in both increases and decreases in ecosystem function and processes. Indirect drivers form the backbone of each of the storylines, which explore how assumptions about the size and scale of their impact might influence the more immediate causes of change (direct drivers), such as climate and land management. The storylines are, as far as possible, evidence-based in terms of the assumptions made about the potential impacts of the various drivers on ecosystem services. Climate change has been explored for two levels of impact (‘high’ and ‘low’), based on UKCIP09 (Murphy et al. 2009) data. The impacts (both direct on species, natural and semi-natural ecosystems and human behaviour) and responses (mitigation and adaptation) are major points of variation within the storylines, and result in a range of different outcomes for many ecosystem services. The storylines differ in terms of the assumptions made about the size of the UK population in 2060, levels of immigration and emigration, and geographical distribution of people within the country. The population in 2060 is assumed be around 65 million for Green and Pleasant Land and Local Stewardship, but between 75 and 77 million for Go
with the Flow and World Markets. Nature@Work sits in the middle with around 67 million. One of the ways in which the differences brought about by the direct and indirect drivers can be seen in the consequence for the UK’s overseas ‘environmental footprint’. This allows the UK’s ecosystem service use and provision to be viewed in a global context. The footprint is highest for World Markets, Green and Pleasant Land and Go with the Flow, intermediate for Nature@Work and National Security, and lowest for Local Stewardship.
Biodiversity and Ecosystem Services
Three key direct drivers affect biodiversity in the scenarios: land use change, pollution and climate change. The state of biodiversity in 2060 reflects the prevailing societal attitudes of each of the storylines: Green and Pleasant Land, Nature@Work, Local Stewardship and Go with the Flow are characterised by more environmentally benign perspectives, compared to World Markets and National Security. The storylines take different approaches, too, in their focus on different aspects of biodiversity and ecosystem character. In Green and Pleasant Land a more static ‘preservationist’ attitude seeks to conserve native flora and fauna as well as cultural landscapes. In contrast, in Local Stewardship, and particularly in Nature@Work, a more dynamic view of ecosystems is taken, and adaptability is considered more important than the degree of ‘nativeness’; novel ecosystems composed of non-native species develop or are created if they provide the requisite suite of ecosystem services.
Land Cover Responses
Mountains, Moorlands and Heaths The extent of Mountains, Moorlands and Heaths does not change radically from today, and remains around 18% of the national land area. The largest changes are associated with Local Stewardship, in which an extensive programme of coniferous afforestation is needed to meet local demand for resources; this results in the loss of some Mountain, Moorland and Heath habitats. On the whole, however, mountain habitats remain the least human-influenced ecosystem for the other storylines, although they are enhanced in Nature@Work, Green and Pleasant Land and Local Stewardship.
The main drivers affecting this habitat change slightly from the current day. Grazing pressure is reduced substantially in Green and Pleasant Land, Nature@Work, Local Stewardship and Go with the Flow in response to indirect driver pressures (environmental attitudes). The two climate change scenarios do not differ substantially in regard to land cover change in Mountains, Moorlands and Heaths. However, the human response to climate change does vary across the storylines (e.g. the adoption of wind farms, or the maintenance of flood alleviation programmes). Agricultural land use shifts due to a warmer and drier climate, and results in some loss of this habitat type. More radical approaches to land use planning and population pressures in the World Markets storyline also lead to a loss of habitat to housing and other development.
1198 UK National Ecosystem Assessment: Technical Report
Ecosystem service provision from Mountains, Moorlands and Heaths changes not only in quantity but in type across the storylines. In some, a focus on regulating services is stressed (Nature@Work); others highlight the need to maintain provisioning services (National Security) or cultural services (Green and Pleasant Land). Despite these habitats being a major source of drinking water, this service is not protected and maintained in World Markets or National Security, resulting in the need to source water from coastal desalination systems. Soil carbon is maintained and conserved in Nature@Work, Green and Pleasant Land, Local Stewardship and Go with the Flow. The multifunctional aspect of Mountains, Moorlands and Heaths are particularly developed and maintained in the Nature@Work storyline—provisioning, cultural and regulating services are kept in balance.
Semi-natural GrasslandsThe huge loss of Semi-natural Grasslands in the 20th Century is partially addressed by restoration programmes in four of the storylines (Green and Pleasant Land, Nature@Work, Local Stewardship and Go with the Flow). Further declines in World Markets and Local Stewardship occur, due to pressure from other land uses such as agriculture, forestry and development. An increase in recreation and the maintenance of soil carbon are two of the main service gains in the four storylines that include restoration programmes, but other, more localised services include provisioning (use of traditional and local livestock grazing for high quality meat).
Enclosed Farmland Enclosed Farmland continues to be a dominant land cover type in all six storylines. However, its importance as a provider of multiple ecosystem services does vary considerably between them. In Local Stewardship, food production is of prime importance and little regard is given to other ecosystem services; in World Markets, whilst Enclosed Farmland cover declines, a switch to greater intensification and industrial agricultural models increases productivity (with deleterious outcomes for regulating and cultural services). In contrast, Nature@Work seeks to improve productivity through technology and sustainable management techniques in order to maintain other ecosystem services too (e.g. soil carbon). Green and Pleasant Land and Local Stewardship adopt a low-input agricultural model which seeks to conserve a range of ecosystem services (although provisioning declines). Go with the Flow takes a middle-ground approach with better environmental standards than today, but also greater productivity. Energy production in farmland is also a dominant driver in Local Stewardship, and to a lesser degree in Nature@Work.
The drivers affecting Enclosed Farmland in the future are mainly fourfold: population pressure from the UK (fuelling demand), global economic forces (the degree to which it is easy to import food from overseas rather than producing it indigenously), technology (further management improvements and crop/livestock breeding) and societal (the adoption of environmental considerations). These three factors shape the approach to farm production and management in the six storylines. The higher population
storylines (World Markets, Local Stewardship and Go with the Flow) maintain high food production; however in the case of World Markets, food imports are also high. Green and Pleasant Land also requires large food imports to offset the smaller area used as farmland and the demands of a high population. In contrast, Local Stewardship, with a relatively low population and a greater emphasis on local food production, has very low import requirements. Nature@Work seeks to balance food production for home demand by adopting sustainable but high output management.
The attitude towards the environment is also largely played out in the approach to meat production in each of the storylines. Where environmental concerns are high (Nature@Work, Green and Pleasant Land), improved grassland cover for livestock production declines dramatically as society demands greater land use efficiency for its protein demands (e.g. through legume crops such as soybeans). In contrast, the World Markets storyline moves further towards low-quality meat production, based on the use of intensive methods. Local Stewardship also maintains low input livestock production for environmental reasons: as a result, the landscape becomes more heterogeneous and there is an enhancement of farmland biodiversity.
WoodlandsThe area of woodland in 2060 increases in all the storylines except World Markets, reflecting its importance in delivering multiple ecosystem services, but the emphasis given to broadleaved and conifer woodland is different. Where provisioning services are important (Local Stewardship) an emphasis is placed on species with high yield class (conifers sourced from around the world); this is also the case in Nature@Work, but it is balanced by a need to increase broadleaved cover for other reasons (recreation, biodiversity). Go with the Flow and Local Stewardship create new forest area through planting native species; this is also the case in Nature@Work, except for areas that have become unsuitable for native species through climate change—in these instances, more adaptable congeners from southern Europe are used.
Management of woodland is also an important driver affecting ecosystem service provision, and sustainable woodland management is the norm for Green and Pleasant Land, Nature@Work, Local Stewardship and Go with the Flow. As a consequence, biodiversity, carbon stocks, flood alleviation, and opportunities for recreation, as well as timber and non-timber forest production, are enhanced. In contrast, the high-tech silvicultural approach to timber production in Local Stewardship does have negative consequences for a range of other services (soil quality, recreation, biodiversity).
Woodland cover also expands in areas close to and within major conurbations, because multiple ecosystem service benefits can be derived from locating forests there. This is a particular pattern in Nature@Work, as woodlands are created to provide cultural benefits as well as flood alleviation; a further benefit is derived from shade provision in hotter summers in the high climate change scenario.
1199Plausible Futures | Chapter 25: The UK NEA Scenarios: Development of Storylines and Analysis of Outcomes
Freshwaters – Openwaters, Wetlands and FloodplainsFreshwater cover increases or remains the same in all the storylines, but for different reasons. In the more environmentally benign storylines, restoration of old, traditional wetland and riverine habitats is a major policy focus—this has cross-benefits for biodiversity and recreation as well as improving flood mitigation, erosion regulation and water quality. Land cover adjacent to riverine habitats also benefits from conversion (often from Improved Grassland or Arable) to wetland grazing or marshland. This pattern is further enhanced in the high climate change scenario, partly due to greater winter flood pressures. In World Markets and Local Stewardship, freshwater expansion still occurs in the high climate change scenario, but is mainly due to land abandonment resulting from a lack of investment or a lack of willingness to adapt to a higher incidence of flooding. The consequences of major wetland drainage programmes in the 19th and 20th Centuries are partially amended.
Freshwater habitats continue to provide multiple ecosystem services in most of the storylines. In some (Local Stewardship), the renewal of traditional practices is carried out (greater emphasis given to using local fish for food supplies). Better quality riverine systems result in greater recreational usage too.
UrbanThe land cover of urban areas in the UK remains fairly constant in all the storylines except two: in World Markets, a large population increase (domestic and from immigration) and a reduction in planning restrictions results in major urban sprawl, with a greater concentration in the South East. In contrast, Local Stewardship, a storyline with a static population and a slight return to primary industry, results in a pattern or counter-urbanisation which provides an opportunity for urban greening and ‘softening’.
The development of greenspace in urban areas is a common theme for Nature@Work, Green and Pleasant Land, Go with the Flow and Local Stewardship. This is either through creating parks, gardens or open spaces (Green and Pleasant Land, Go with the Flow) but also through the creation of green areas with a focus on food production as well as recreation (allotments, permaculture gardens and urban farms in Nature@Work and Local Stewardship).
The management of water in urban areas is also considered important. In Nature@Work, Green and Pleasant Land and Go with the Flow, rivers, lakes and ponds are restored, protected, re-channelled and managed to ensure connectivity for wildlife (through towns and cities), whilst recreational opportunities and flood mitigation are improved.
Climate change is a major driver of change in urban areas for all six storylines. This may just be witnessed through an increase in urban street tree planting or maintaining garden cover (Go with the Flow, Local Stewardship) but is also seen through the adoption of vegetated roof cover to increase cooling (Nature@Work, Green and Pleasant Land, Local Stewardship).
Coastal MarginsCoastal Margin habitats remain constant or increase slightly in all the storylines except for World Markets. In this scenario, Coastal Margin habitats come under pressure from industrial expansion in the form of ports, petrochemical and desalination plants, tourism, and housing in the south.
Better management of coastal habitats does occur in Nature@Work, Green and Pleasant Land and Local Stewardship, all of which adopt an ecosystem approach to planning and management. A particular emphasis is placed on geomorphological processes as well as biodiversity. A dynamic view of habitat change is taken in Nature@Work, which recognises the importance of working with natural processes; habitats are allowed to ‘migrate’ and, where appropriate, coastal inundation is encouraged.
Marine Marine ecosystems have contrasting outcomes in the six storylines. The most exploitative are World Markets and Local Stewardship, which have echoes of the ‘Tragedy of the Commons’ in relation to fish stocks and the use of marine minerals. In Green and Pleasant Land, the Marine ecosystem is given due conservation protection but is also valued as a source of recreation. In Local Stewardship a regional management approach to the sea is adopted and the sustainable fishing of unfashionable species is encouraged to offset declines in the traditional seafood species. The most holistic approach to marine management occurs in Nature@Work, which stresses the importance of conserving all marine ecosystem services.
In the marine sector, the World Markets storyline continues the most harmful human activities prevalent today (e.g. trawl fisheries, aggregate extraction, coastal defences, ports and coastal developments). Some of these activities are also adopted by other storylines (offshore wind farms by Nature@Work and Local Stewardship; trawl fisheries by Local Stewardship).
Sea-level rise caused by climate change will lead to the loss of some coastal habitat in all the storylines. However, this is particularly evident in the World Markets storyline because it assumes no serious effort to adapt.
Comparing Ecosystem Services Across the Scenarios
A comparison of the sustainability of ecosystem service outputs was made for each scenario by counting the number of services that appeared to be increasing, stable or declining under the assumptions of each storyline. This indicative analysis showed that while current policy approaches, as characterised in Go with the Flow, were likely to lead to some improvements in ecosystem service output, the UK can make significant gains where policy takes the approach outlined in three scenarios: Green and Pleasant Land, Nature@Work and Local Stewardship. In each of these, the majority of services appeared to show improving trends, compared to the present where a more mixed picture has
1200 UK National Ecosystem Assessment: Technical Report
been reported. By contrast, World Markets and National Security showed significant losses compared to the present and Go with the Flow. The comparison between scenarios described here is exploratory and further work is needed to develop the evidence base describing how changes in the various direct drivers impact on service output for the major habitat types. Nevertheless, despite the preliminary nature of the analysis, two important insights emerge that should be explored more deeply. The first is that quantitative comparison between storylines shows that the difference in ecosystem services outputs between the high and low climate change versions of each scenarios are smaller than the difference observed between different scenarios. It may be, therefore, that future changes in land use could have as much impact on ecosystem services as the direct effects of climate change.
The second is that none of the scenarios which show significant gains in ecosystem service outputs over Go with the Flow, such as Green and Pleasant Land, Nature@Work and Local Stewardship, share enough similarity that we can infer a single set of characteristics that lead to improving or more balanced service outputs. Equally, none of the scenarios which show significant losses over Go with the Flow (World Markets and National Security) are similar enough to highlight a specific or core policy risk that needs to be addressed. This suggests that there are no simple policy solutions which can deliver improved ecosystem service output. A better understanding of the way in which changes in habitat condition affect service output, and the relative importance of the different habitats in terms of service output, are two important gaps in knowledge that need to be addressed before these important policy questions can be resolved.
1201Plausible Futures | Chapter 25: The UK NEA Scenarios: Development of Storylines and Analysis of Outcomes
25.1 Introduction
The UK National Ecosystem Assessment (UK NEA) has shown that over the last 50 years there have been major changes in the way we have used the land and sea, with considerable impacts on ecosystem services. Although we have increased the output of our provisioning services from sectors such as agriculture, land use change and pollution have had major impacts on many biodiversity groups in the UK and the ability of many ecosystems to deliver important services. The climate and water regulation services provided by many terrestrial ecosystems in the UK have diminished in the 20th Century. In the marine sector, the sustainability of food provision has been under threat because of overexploitation and the impacts of fishing activities on other marine ecosystem services. The pressures on the marine space have also been growing with the expansion of renewable energy, recreation and port activities. What will happen if these trends continue? Are present policy approaches sufficient to reverse them? What would the world look like in 2060 if we gave greater priority to ecosystem services or if we had to face an uncertain world where national security was the main issue? These are some of the questions the UK NEA scenario work has explored. To help answer them six storylines have been developed: ■ Green and Pleasant Land is a future where high economic
growth has focused more on secondary and tertiary industries, while primary industry has continued to decline. As a result, development pressures in rural areas decline, making space for ‘beautifying’ the countryside. This has many positive benefits for biodiversity.
■ Nature@Work is a version of today, but with a very strong emphasis on maintaining ecosystem services through all sectors in the UK. It is inherently about resolving trade-offs between ecosystem services and sustaining multifunctional ecosystems. Indeed, in this world, sustainability is the underlying principle across all sectors of society.
■ World Markets is a vision of unfettered economic growth and trade. Trade barriers disappear, imports increase, and environmental perspectives are given little weight. As a result, the countryside becomes more developed.
■ National Security shares many characteristics with World Markets but is different in one key area, namely that it is strongly focused on self-sufficiency and economic protectionism.
■ Local Stewardship presents a slower pace of life and a determined move towards a low-impact, low resource-use society. In this world there have been major shifts in values and attitudes compared to today.
■ Go with the Flow offers a vision of how the UK might evolve if we continue with current socioeconomic and environmental policies. It is not a base-line because people continue to see the need for changes; the problem is that visions are often blurred and compromise reigns as we continue to ‘muddle through’.
Section 25.2 explains how the scenarios were developed and Section 25.3 examines how ecosystems and their services
in the UK might change under each of these futures, what the effects might be on human well-being and who might be affected most. The conceptual framework used for the UK NEA (Chapter 2) describes more fully the context for the scenarios work. In building the scenarios there has been no attempt to predict the future, or to construct a set of policy choices. Rather, the task has been to use current knowledge of ecosystems and ecosystem services to explore how they might respond under different assumptions about the processes driving change over the next 50 years. There are many issues that surround the methods used to construct scenarios, and questions about methodology are important in terms of judging the success of any scenario exercise (Ash et al. 2010). However, rather than beginning by explaining the particular approaches used in the UK NEA, this discussion is postponed until the end of this chapter. In Sections 25.4, 25.5 and 25.6 we reflect critically on what was attempted and how the work can be taken further.
25.2 Developing the UK NEA Storylines
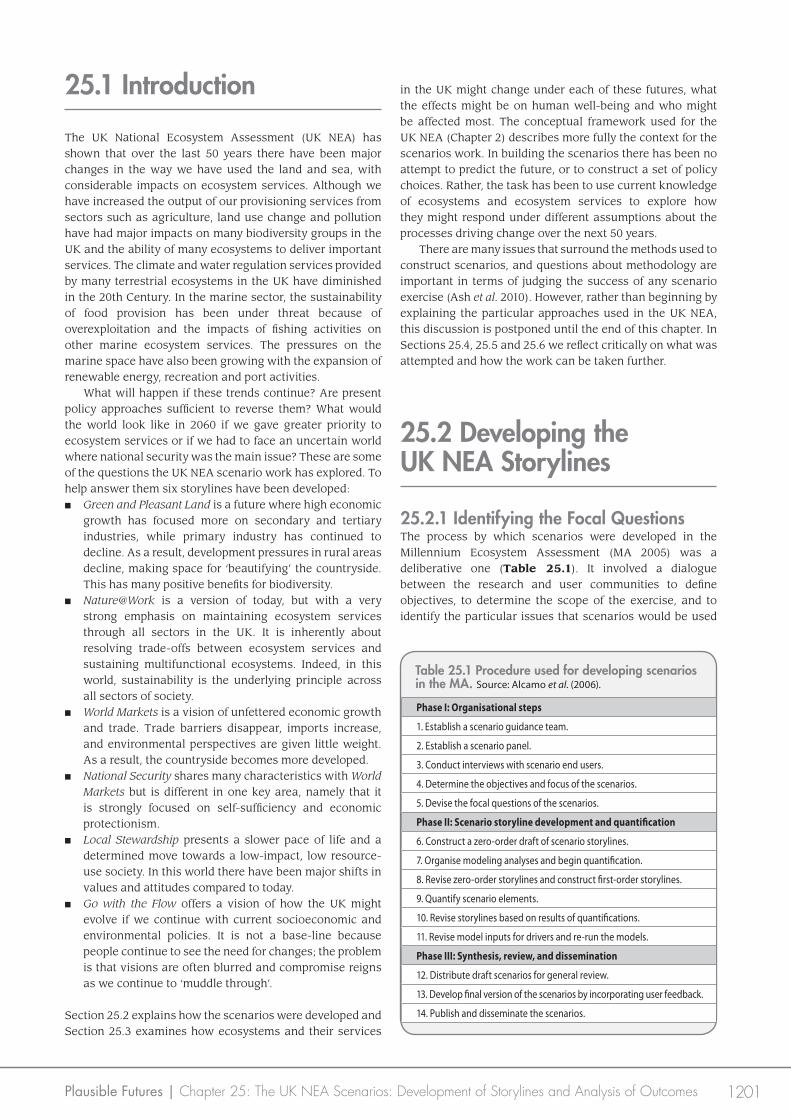
25.2.1 Identifying the Focal QuestionsThe process by which scenarios were developed in the Millennium Ecosystem Assessment (MA 2005) was a deliberative one (Table 25.1). It involved a dialogue between the research and user communities to define objectives, to determine the scope of the exercise, and to identify the particular issues that scenarios would be used
Phase I: Organisational steps
1. Establish a scenario guidance team.
2. Establish a scenario panel.
3. Conduct interviews with scenario end users.
4. Determine the objectives and focus of the scenarios.
5. Devise the focal questions of the scenarios.
Phase II: Scenario storyline development and quantification
6. Construct a zero-order draft of scenario storylines.
7. Organise modeling analyses and begin quantification.
8. Revise zero-order storylines and construct first-order storylines.
9. Quantify scenario elements.
10. Revise storylines based on results of quantifications.
11. Revise model inputs for drivers and re-run the models.
Phase III: Synthesis, review, and dissemination
12. Distribute draft scenarios for general review.
13. Develop final version of the scenarios by incorporating user feedback.
14. Publish and disseminate the scenarios.
Table 25.1 Procedure used for developing scenarios in the MA. Source: Alcamo et al. (2006).
1202 UK National Ecosystem Assessment: Technical Report
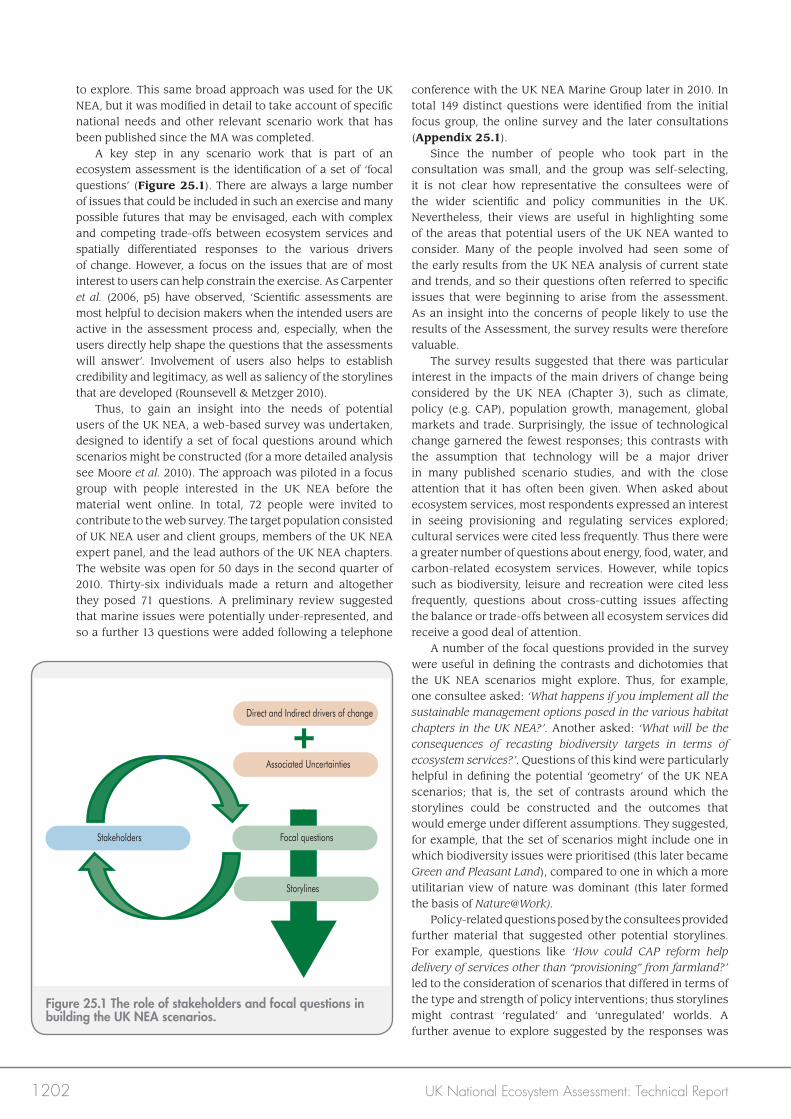
to explore. This same broad approach was used for the UK NEA, but it was modified in detail to take account of specific national needs and other relevant scenario work that has been published since the MA was completed. A key step in any scenario work that is part of an ecosystem assessment is the identification of a set of ‘focal questions’ (Figure 25.1). There are always a large number of issues that could be included in such an exercise and many possible futures that may be envisaged, each with complex and competing trade-offs between ecosystem services and spatially differentiated responses to the various drivers of change. However, a focus on the issues that are of most interest to users can help constrain the exercise. As Carpenter et al. (2006, p5) have observed, ‘Scientific assessments are most helpful to decision makers when the intended users are active in the assessment process and, especially, when the users directly help shape the questions that the assessments will answer’. Involvement of users also helps to establish credibility and legitimacy, as well as saliency of the storylines that are developed (Rounsevell & Metzger 2010). Thus, to gain an insight into the needs of potential users of the UK NEA, a web-based survey was undertaken, designed to identify a set of focal questions around which scenarios might be constructed (for a more detailed analysis see Moore et al. 2010). The approach was piloted in a focus group with people interested in the UK NEA before the material went online. In total, 72 people were invited to contribute to the web survey. The target population consisted of UK NEA user and client groups, members of the UK NEA expert panel, and the lead authors of the UK NEA chapters. The website was open for 50 days in the second quarter of 2010. Thirty-six individuals made a return and altogether they posed 71 questions. A preliminary review suggested that marine issues were potentially under-represented, and so a further 13 questions were added following a telephone
conference with the UK NEA Marine Group later in 2010. In total 149 distinct questions were identified from the initial focus group, the online survey and the later consultations (Appendix 25.1). Since the number of people who took part in the consultation was small, and the group was self-selecting, it is not clear how representative the consultees were of the wider scientific and policy communities in the UK. Nevertheless, their views are useful in highlighting some of the areas that potential users of the UK NEA wanted to consider. Many of the people involved had seen some of the early results from the UK NEA analysis of current state and trends, and so their questions often referred to specific issues that were beginning to arise from the assessment. As an insight into the concerns of people likely to use the results of the Assessment, the survey results were therefore valuable. The survey results suggested that there was particular interest in the impacts of the main drivers of change being considered by the UK NEA (Chapter 3), such as climate, policy (e.g. CAP), population growth, management, global markets and trade. Surprisingly, the issue of technological change garnered the fewest responses; this contrasts with the assumption that technology will be a major driver in many published scenario studies, and with the close attention that it has often been given. When asked about ecosystem services, most respondents expressed an interest in seeing provisioning and regulating services explored; cultural services were cited less frequently. Thus there were a greater number of questions about energy, food, water, and carbon-related ecosystem services. However, while topics such as biodiversity, leisure and recreation were cited less frequently, questions about cross-cutting issues affecting the balance or trade-offs between all ecosystem services did receive a good deal of attention. A number of the focal questions provided in the survey were useful in defining the contrasts and dichotomies that the UK NEA scenarios might explore. Thus, for example, one consultee asked: ‘What happens if you implement all the sustainable management options posed in the various habitat chapters in the UK NEA?’. Another asked: ‘What will be the consequences of recasting biodiversity targets in terms of ecosystem services?’. Questions of this kind were particularly helpful in defining the potential ‘geometry’ of the UK NEA scenarios; that is, the set of contrasts around which the storylines could be constructed and the outcomes that would emerge under different assumptions. They suggested, for example, that the set of scenarios might include one in which biodiversity issues were prioritised (this later became Green and Pleasant Land), compared to one in which a more utilitarian view of nature was dominant (this later formed the basis of Nature@Work). Policy-related questions posed by the consultees provided further material that suggested other potential storylines. For example, questions like ‘How could CAP reform help delivery of services other than “provisioning” from farmland?’ led to the consideration of scenarios that differed in terms of the type and strength of policy interventions; thus storylines might contrast ‘regulated’ and ‘unregulated’ worlds. A further avenue to explore suggested by the responses was
Direct and Indirect drivers of change
Associated Uncertainties
Focal questions
Storylines
Stakeholders
+
Figure 25.1 The role of stakeholders and focal questions in building the UK NEA scenarios.
1203Plausible Futures | Chapter 25: The UK NEA Scenarios: Development of Storylines and Analysis of Outcomes
the effect of external global actors and market forces on the UK’s future. Here, questions like ‘What would 70% food security mean for the UK’s ecosystems?’ were extremely useful in suggesting a security-related storyline (later to become the National Security scenario) that might be contrasted with one in which trade operated with few barriers (to become World Markets) or a future like today (later to become Go with the Flow). Another version of a less regulated world to emerge from the material and later discussions was one in which more ‘place-based’ or ‘fine-grained’ responses dominated (this became Local Stewardship). From the outset the UK NEA work programme recognised that different conditions and concerns may exist between England, Scotland, Wales and Northern Ireland. In terms of the UK NEA scenario development, it was also considered important that any potential contrasts between outcomes or issues in the four countries should be explored. However, the focal questions collected through the survey were largely ‘UK-centric’. Just one respondent mentioned cross-country relationships in a question related to the water sector, and only one other was interested in ‘how different amounts of habitat per nation affect what is important’. These results were not interpreted to mean that significant differences between the four countries do not exist, but rather that further dialogue was needed. It was felt that this could be done by constructing the scenarios at the UK level and exploring the implications for the separate administrations at a later stage. Climate change was clearly an important issue for many respondents, while some were specifically interested in comparisons across different climate futures, as implied by: ‘What would be the impact of a specific set of UK climate change predictions … on the continued delivery of provisioning and regulating services across a range of UK broad ecosystems?’, or more specifically: ‘What are the implications of climate change and a growing population on the availability of water for agriculture?’. However, many consultees accepted some level of climate change as a given. They were mostly interested in the ways in which other drivers might impact on emissions or what the implications different emissions reduction strategies might have in different environmental, social or economic contexts, as in: ‘How can we integrate climate adaptation strategies, energy needs and waste management together with maintenance of quality habitats to ensure continuity of ecosystem regulation?’, or ‘Are semi-natural grasslands becoming more or less productive in terms of meat and milk production per unit of greenhouse gas emissions?’ and ‘What are the implications of any trends observed for emissions of greenhouse gas from grassland and the efficiency of milk and meat production?’. The conclusion drawn from the way the questions about climate change were framed was that in any set of scenarios, the differences between ‘low’ and ‘high’ climate change versions of each narrative might be worth considering, to explore how sensitive different types of future might be to different climate trajectories. However, given that the storylines are only considering the next 50 years, it was decided that they must start from the assumption that whatever we do now as a society will not have much effect on the climate over this period. Given the time lag between mitigation activity and climate response, it was decided that
the most useful things to consider would be how different mitigation or adaptation strategies might play themselves out in these different types of future, or how different policies or trends in other areas might support or undermine them.
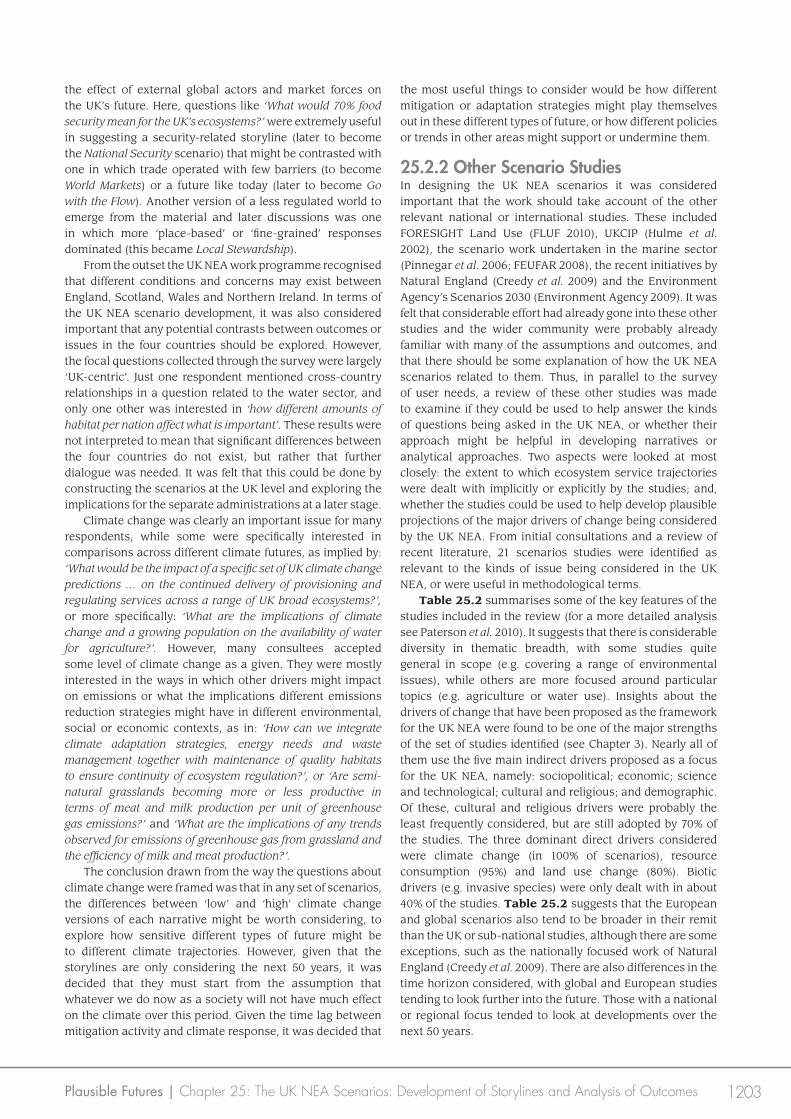
25.2.2 Other Scenario StudiesIn designing the UK NEA scenarios it was considered important that the work should take account of the other relevant national or international studies. These included FORESIGHT Land Use (FLUF 2010), UKCIP (Hulme et al. 2002), the scenario work undertaken in the marine sector (Pinnegar et al. 2006; FEUFAR 2008), the recent initiatives by Natural England (Creedy et al. 2009) and the Environment Agency’s Scenarios 2030 (Environment Agency 2009). It was felt that considerable effort had already gone into these other studies and the wider community were probably already familiar with many of the assumptions and outcomes, and that there should be some explanation of how the UK NEA scenarios related to them. Thus, in parallel to the survey of user needs, a review of these other studies was made to examine if they could be used to help answer the kinds of questions being asked in the UK NEA, or whether their approach might be helpful in developing narratives or analytical approaches. Two aspects were looked at most closely: the extent to which ecosystem service trajectories were dealt with implicitly or explicitly by the studies; and, whether the studies could be used to help develop plausible projections of the major drivers of change being considered by the UK NEA. From initial consultations and a review of recent literature, 21 scenarios studies were identified as relevant to the kinds of issue being considered in the UK NEA, or were useful in methodological terms. Table 25.2 summarises some of the key features of the studies included in the review (for a more detailed analysis see Paterson et al. 2010). It suggests that there is considerable diversity in thematic breadth, with some studies quite general in scope (e.g. covering a range of environmental issues), while others are more focused around particular topics (e.g. agriculture or water use). Insights about the drivers of change that have been proposed as the framework for the UK NEA were found to be one of the major strengths of the set of studies identified (see Chapter 3). Nearly all of them use the five main indirect drivers proposed as a focus for the UK NEA, namely: sociopolitical; economic; science and technological; cultural and religious; and demographic. Of these, cultural and religious drivers were probably the least frequently considered, but are still adopted by 70% of the studies. The three dominant direct drivers considered were climate change (in 100% of scenarios), resource consumption (95%) and land use change (80%). Biotic drivers (e.g. invasive species) were only dealt with in about 40% of the studies. Table 25.2 suggests that the European and global scenarios also tend to be broader in their remit than the UK or sub-national studies, although there are some exceptions, such as the nationally focused work of Natural England (Creedy et al. 2009). There are also differences in the time horizon considered, with global and European studies tending to look further into the future. Those with a national or regional focus tended to look at developments over the next 50 years.
1204 UK National Ecosystem Assessment: Technical Report
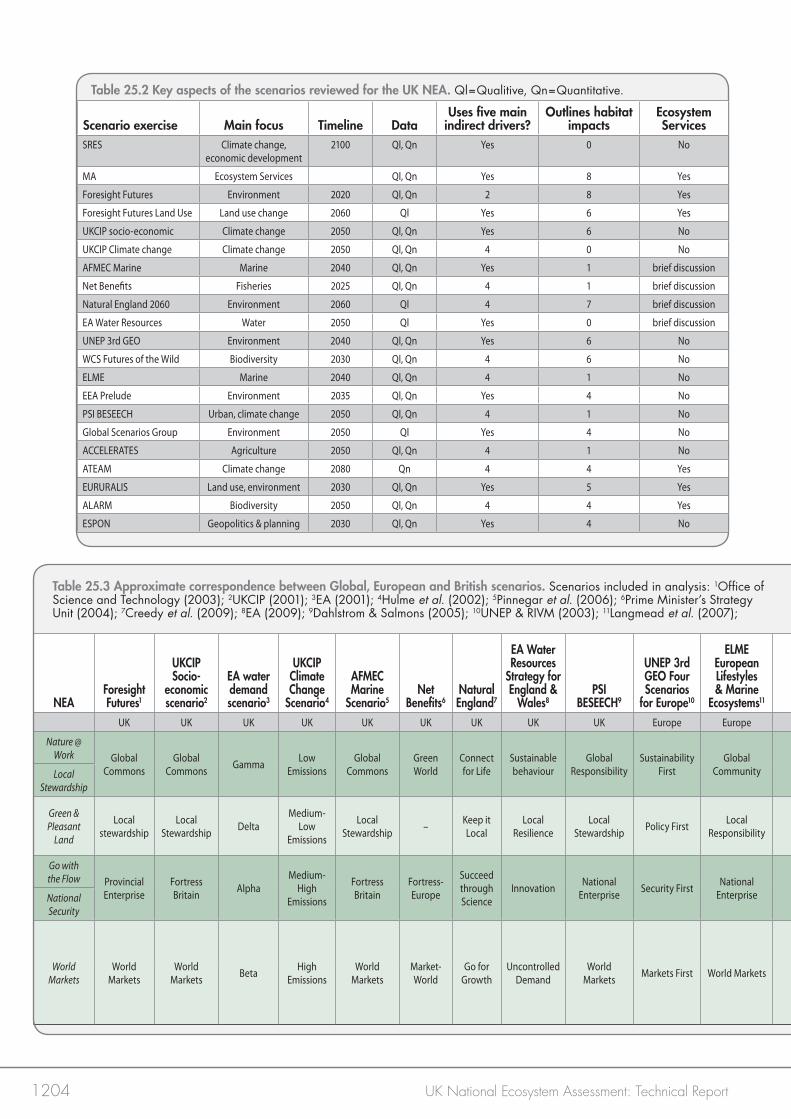
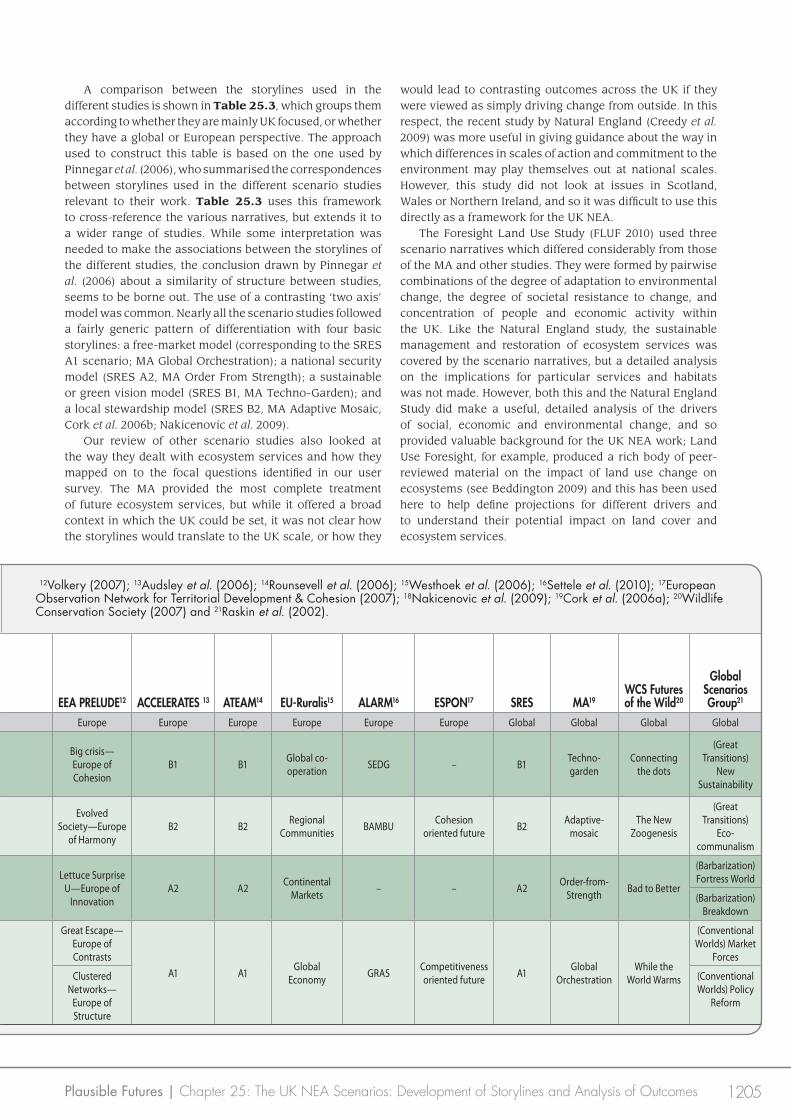
Table 25.3 Approximate correspondence between Global, European and British scenarios. Scenarios included in analysis: 1Office of Science and Technology (2003); 2UKCIP (2001); 3EA (2001); 4Hulme et al. (2002); 5Pinnegar et al. (2006); 6Prime Minister’s Strategy Unit (2004); 7Creedy et al. (2009); 8EA (2009); 9Dahlstrom & Salmons (2005); 10UNEP & RIVM (2003); 11Langmead et al. (2007);
12Volkery (2007); 13Audsley et al. (2006); 14Rounsevell et al. (2006); 15Westhoek et al. (2006); 16Settele et al. (2010); 17European Observation Network for Territorial Development & Cohesion (2007); 18Nakicenovic et al. (2009); 19Cork et al. (2006a); 20Wildlife Conservation Society (2007) and 21Raskin et al. (2002).
NEAForesight Futures1
UKCIP Socio-
economic scenario2
EA water demand scenario3
UKCIP Climate Change
Scenario4
AFMEC Marine
Scenario5Net
Benefits6Natural England7
EA Water Resources
Strategy for England &
Wales8PSI
BESEECH9
UNEP 3rd GEO Four Scenarios
for Europe10
ELME European Lifestyles & Marine
Ecosystems11 EEA PRELUDE12 ACCELERATES 13 ATEAM14 EU-Ruralis15 ALARM16 ESPON17 SRES MA19WCS Futures of the Wild20
Global Scenarios Group21
UK UK UK UK UK UK UK UK UK Europe Europe Europe Europe Europe Europe Europe Europe Global Global Global Global
Nature @ Work Global
CommonsGlobal
Commons Gamma Low Emissions
Global Commons
Green World
Connect for Life
Sustainable behaviour
Global Responsibility
Sustainability First
Global Community
Big crisis—Europe of Cohesion
B1 B1 Global co-operation SEDG – B1 Techno-
gardenConnecting
the dots
(Great Transitions)
New Sustainability
Local Stewardship
Green & Pleasant
Land
Local stewardship
Local Stewardship Delta
Medium-Low
Emissions
Local Stewardship – Keep it
LocalLocal
ResilienceLocal
Stewardship Policy First Local Responsibility
Evolved Society—Europe
of HarmonyB2 B2 Regional
Communities BAMBU Cohesion oriented future B2 Adaptive-
mosaicThe New
Zoogenesis
(Great Transitions)
Eco-communalism
Go with the Flow Provincial
EnterpriseFortress Britain Alpha
Medium-High
Emissions
Fortress Britain
Fortress-Europe
Succeed through Science
Innovation National Enterprise Security First National
Enterprise
Lettuce Surprise U—Europe of
InnovationA2 A2 Continental
Markets – – A2 Order-from-Strength Bad to Better
(Barbarization) Fortress World
National Security
(Barbarization) Breakdown
World Markets
World Markets
World Markets Beta High
EmissionsWorld
MarketsMarket-World
Go for Growth
Uncontrolled Demand
World Markets Markets First World Markets
Great Escape—Europe of Contrasts
A1 A1 Global Economy GRAS Competitiveness
oriented future A1 Global Orchestration
While the World Warms
(Conventional Worlds) Market
Forces
Clustered Networks—
Europe of Structure
(Conventional Worlds) Policy
Reform
Scenario exercise Main focus Timeline DataUses five main
indirect drivers?Outlines habitat
impactsEcosystem Services
SRES Climate change, economic development
2100 Ql, Qn Yes 0 No
MA Ecosystem Services Ql, Qn Yes 8 Yes
Foresight Futures Environment 2020 Ql, Qn 2 8 Yes
Foresight Futures Land Use Land use change 2060 Ql Yes 6 Yes
UKCIP socio-economic Climate change 2050 Ql, Qn Yes 6 No
UKCIP Climate change Climate change 2050 Ql, Qn 4 0 No
AFMEC Marine Marine 2040 Ql, Qn Yes 1 brief discussion
Net Benefits Fisheries 2025 Ql, Qn 4 1 brief discussion
Natural England 2060 Environment 2060 Ql 4 7 brief discussion
EA Water Resources Water 2050 Ql Yes 0 brief discussion
UNEP 3rd GEO Environment 2040 Ql, Qn Yes 6 No
WCS Futures of the Wild Biodiversity 2030 Ql, Qn 4 6 No
ELME Marine 2040 Ql, Qn 4 1 No
EEA Prelude Environment 2035 Ql, Qn Yes 4 No
PSI BESEECH Urban, climate change 2050 Ql, Qn 4 1 No
Global Scenarios Group Environment 2050 Ql Yes 4 No
ACCELERATES Agriculture 2050 Ql, Qn 4 1 No
ATEAM Climate change 2080 Qn 4 4 Yes
EURURALIS Land use, environment 2030 Ql, Qn Yes 5 Yes
ALARM Biodiversity 2050 Ql, Qn 4 4 Yes
ESPON Geopolitics & planning 2030 Ql, Qn Yes 4 No
Table 25.2 Key aspects of the scenarios reviewed for the UK NEA. Ql=Qualitive, Qn=Quantitative.
1205Plausible Futures | Chapter 25: The UK NEA Scenarios: Development of Storylines and Analysis of Outcomes
Table 25.3 Approximate correspondence between Global, European and British scenarios. Scenarios included in analysis: 1Office of Science and Technology (2003); 2UKCIP (2001); 3EA (2001); 4Hulme et al. (2002); 5Pinnegar et al. (2006); 6Prime Minister’s Strategy Unit (2004); 7Creedy et al. (2009); 8EA (2009); 9Dahlstrom & Salmons (2005); 10UNEP & RIVM (2003); 11Langmead et al. (2007);
12Volkery (2007); 13Audsley et al. (2006); 14Rounsevell et al. (2006); 15Westhoek et al. (2006); 16Settele et al. (2010); 17European Observation Network for Territorial Development & Cohesion (2007); 18Nakicenovic et al. (2009); 19Cork et al. (2006a); 20Wildlife Conservation Society (2007) and 21Raskin et al. (2002).
NEAForesight Futures1
UKCIP Socio-
economic scenario2
EA water demand scenario3
UKCIP Climate Change
Scenario4
AFMEC Marine
Scenario5Net
Benefits6Natural England7
EA Water Resources
Strategy for England &
Wales8PSI
BESEECH9
UNEP 3rd GEO Four Scenarios
for Europe10
ELME European Lifestyles & Marine
Ecosystems11 EEA PRELUDE12 ACCELERATES 13 ATEAM14 EU-Ruralis15 ALARM16 ESPON17 SRES MA19WCS Futures of the Wild20
Global Scenarios Group21
UK UK UK UK UK UK UK UK UK Europe Europe Europe Europe Europe Europe Europe Europe Global Global Global Global
Nature @ Work Global
CommonsGlobal
Commons Gamma Low Emissions
Global Commons
Green World
Connect for Life
Sustainable behaviour
Global Responsibility
Sustainability First
Global Community
Big crisis—Europe of Cohesion
B1 B1 Global co-operation SEDG – B1 Techno-
gardenConnecting
the dots
(Great Transitions)
New Sustainability
Local Stewardship
Green & Pleasant
Land
Local stewardship
Local Stewardship Delta
Medium-Low
Emissions
Local Stewardship – Keep it
LocalLocal
ResilienceLocal
Stewardship Policy First Local Responsibility
Evolved Society—Europe
of HarmonyB2 B2 Regional
Communities BAMBU Cohesion oriented future B2 Adaptive-
mosaicThe New
Zoogenesis
(Great Transitions)
Eco-communalism
Go with the Flow Provincial
EnterpriseFortress Britain Alpha
Medium-High
Emissions
Fortress Britain
Fortress-Europe
Succeed through Science
Innovation National Enterprise Security First National
Enterprise
Lettuce Surprise U—Europe of
InnovationA2 A2 Continental
Markets – – A2 Order-from-Strength Bad to Better
(Barbarization) Fortress World
National Security
(Barbarization) Breakdown
World Markets
World Markets
World Markets Beta High
EmissionsWorld
MarketsMarket-World
Go for Growth
Uncontrolled Demand
World Markets Markets First World Markets
Great Escape—Europe of Contrasts
A1 A1 Global Economy GRAS Competitiveness
oriented future A1 Global Orchestration
While the World Warms
(Conventional Worlds) Market
Forces
Clustered Networks—
Europe of Structure
(Conventional Worlds) Policy
Reform
A comparison between the storylines used in the different studies is shown in Table 25.3, which groups them according to whether they are mainly UK focused, or whether they have a global or European perspective. The approach used to construct this table is based on the one used by Pinnegar et al. (2006), who summarised the correspondences between storylines used in the different scenario studies relevant to their work. Table 25.3 uses this framework to cross-reference the various narratives, but extends it to a wider range of studies. While some interpretation was needed to make the associations between the storylines of the different studies, the conclusion drawn by Pinnegar et al. (2006) about a similarity of structure between studies, seems to be borne out. The use of a contrasting ‘two axis’ model was common. Nearly all the scenario studies followed a fairly generic pattern of differentiation with four basic storylines: a free-market model (corresponding to the SRES A1 scenario; MA Global Orchestration); a national security model (SRES A2, MA Order From Strength); a sustainable or green vision model (SRES B1, MA Techno-Garden); and a local stewardship model (SRES B2, MA Adaptive Mosaic, Cork et al. 2006b; Nakicenovic et al. 2009). Our review of other scenario studies also looked at the way they dealt with ecosystem services and how they mapped on to the focal questions identified in our user survey. The MA provided the most complete treatment of future ecosystem services, but while it offered a broad context in which the UK could be set, it was not clear how the storylines would translate to the UK scale, or how they
would lead to contrasting outcomes across the UK if they were viewed as simply driving change from outside. In this respect, the recent study by Natural England (Creedy et al. 2009) was more useful in giving guidance about the way in which differences in scales of action and commitment to the environment may play themselves out at national scales. However, this study did not look at issues in Scotland, Wales or Northern Ireland, and so it was difficult to use this directly as a framework for the UK NEA. The Foresight Land Use Study (FLUF 2010) used three scenario narratives which differed considerably from those of the MA and other studies. They were formed by pairwise combinations of the degree of adaptation to environmental change, the degree of societal resistance to change, and concentration of people and economic activity within the UK. Like the Natural England study, the sustainable management and restoration of ecosystem services was covered by the scenario narratives, but a detailed analysis on the implications for particular services and habitats was not made. However, both this and the Natural England Study did make a useful, detailed analysis of the drivers of social, economic and environmental change, and so provided valuable background for the UK NEA work; Land Use Foresight, for example, produced a rich body of peer-reviewed material on the impact of land use change on ecosystems (see Beddington 2009) and this has been used here to help define projections for different drivers and to understand their potential impact on land cover and ecosystem services.
1206 UK National Ecosystem Assessment: Technical Report
The conclusion to emerge from the review of other studies was that none of existing sets of storylines could be used in their entirety for the UK NEA because they either did not consider ecosystem services in sufficient depth or because their focus did not map on to the concerns expressed in the user survey. The conventional 2x2 axis structure, that juxtaposed global/local and reactive/proactive futures, seemed particularly unhelpful in exploring the nuances between alternative green futures that emphasised biodiversity priorities on the one hand and ecosystem services on the other. The other studies also did not seem to fully capture the issues of risk and security identified by the users and, especially, the differing impacts of alternative climate change trajectories. The review suggested that a different configuration of scenarios was probably needed for the UK NEA.
25.2.3 Creating the UK NEA Scenarios Using a Morphological AnalysisThe results of the user survey and the review of existing scenario studies were brought together by means of a ‘morphological analysis’. Morphological analyses are useful for investigating the relationships between multiple quantifiable and qualitative factors. They have been used widely in developing scenarios because they provide a simple way of representing the links between drivers and the storylines (Godet 2000; Ritchey 2010). They are also a good way of mapping out clearly the assumptions embodied in the different scenario narratives.
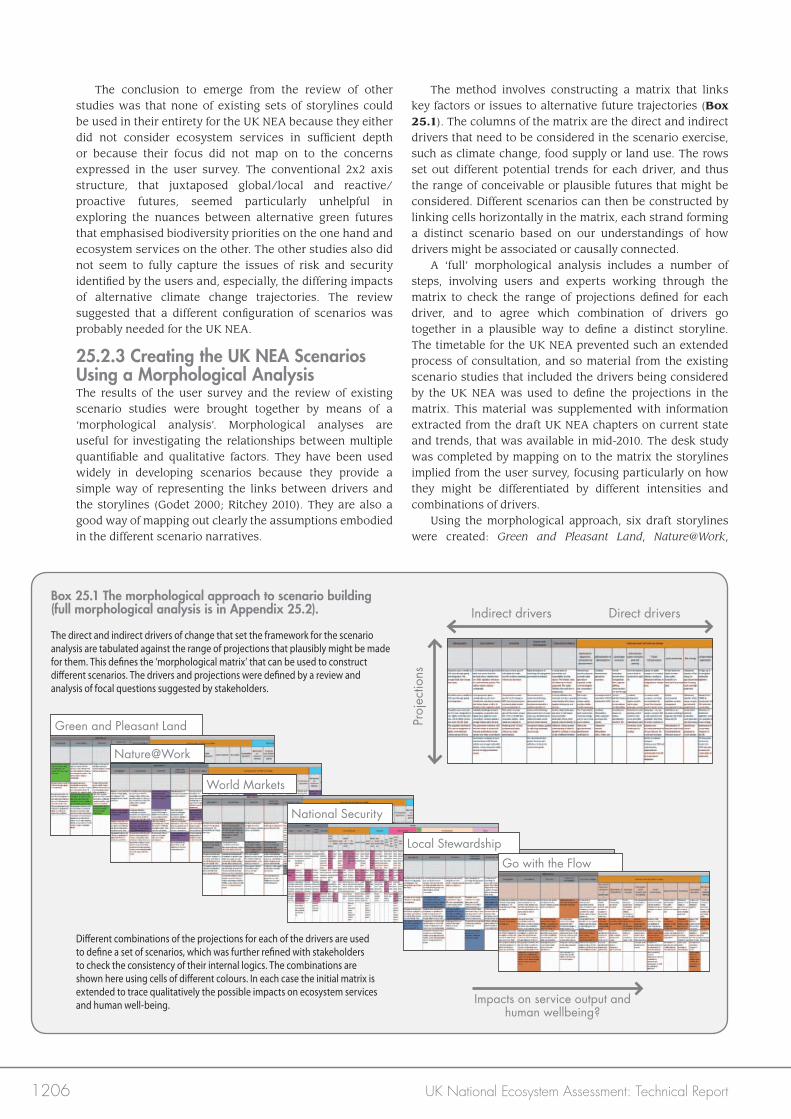
The method involves constructing a matrix that links key factors or issues to alternative future trajectories (Box 25.1). The columns of the matrix are the direct and indirect drivers that need to be considered in the scenario exercise, such as climate change, food supply or land use. The rows set out different potential trends for each driver, and thus the range of conceivable or plausible futures that might be considered. Different scenarios can then be constructed by linking cells horizontally in the matrix, each strand forming a distinct scenario based on our understandings of how drivers might be associated or causally connected. A ‘full’ morphological analysis includes a number of steps, involving users and experts working through the matrix to check the range of projections defined for each driver, and to agree which combination of drivers go together in a plausible way to define a distinct storyline. The timetable for the UK NEA prevented such an extended process of consultation, and so material from the existing scenario studies that included the drivers being considered by the UK NEA was used to define the projections in the matrix. This material was supplemented with information extracted from the draft UK NEA chapters on current state and trends, that was available in mid-2010. The desk study was completed by mapping on to the matrix the storylines implied from the user survey, focusing particularly on how they might be differentiated by different intensities and combinations of drivers. Using the morphological approach, six draft storylines were created: Green and Pleasant Land, Nature@Work,
Box 25.1 The morphological approach to scenario building(full morphological analysis is in Appendix 25.2).
The direct and indirect drivers of change that set the framework for the scenario analysis are tabulated against the range of projections that plausibly might be made for them. This defines the ‘morphological matrix’ that can be used to construct different scenarios. The drivers and projections were defined by a review and analysis of focal questions suggested by stakeholders.
Different combinations of the projections for each of the drivers are used to define a set of scenarios, which was further refined with stakeholders to check the consistency of their internal logics. The combinations are shown here using cells of different colours. In each case the initial matrix is extended to trace qualitatively the possible impacts on ecosystem services and human well-being.
Green and Pleasant Land
Nature@Work
World Markets
National Security
Local Stewardship
Go with the Flow
Impacts on service output and human wellbeing?
Indirect drivers Direct drivers
Proj
ectio
ns
1207Plausible Futures | Chapter 25: The UK NEA Scenarios: Development of Storylines and Analysis of Outcomes
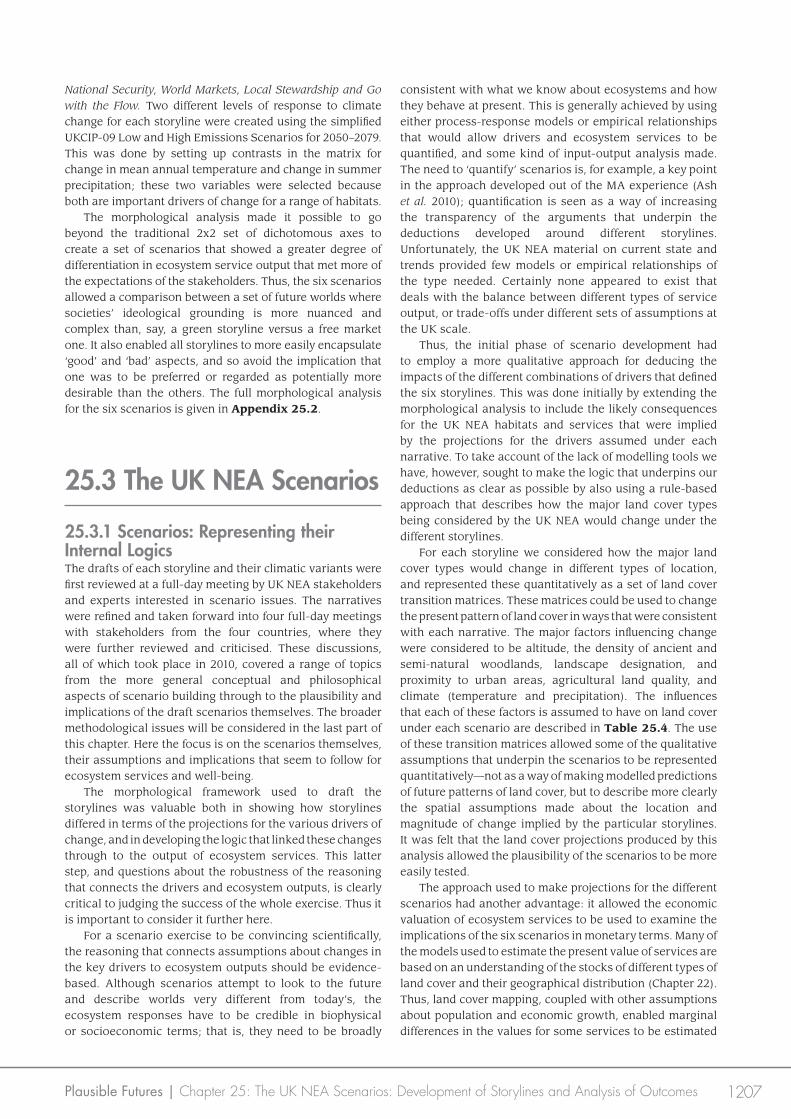
National Security, World Markets, Local Stewardship and Go with the Flow. Two different levels of response to climate change for each storyline were created using the simplified UKCIP-09 Low and High Emissions Scenarios for 2050–2079. This was done by setting up contrasts in the matrix for change in mean annual temperature and change in summer precipitation; these two variables were selected because both are important drivers of change for a range of habitats. The morphological analysis made it possible to go beyond the traditional 2x2 set of dichotomous axes to create a set of scenarios that showed a greater degree of differentiation in ecosystem service output that met more of the expectations of the stakeholders. Thus, the six scenarios allowed a comparison between a set of future worlds where societies’ ideological grounding is more nuanced and complex than, say, a green storyline versus a free market one. It also enabled all storylines to more easily encapsulate ‘good’ and ‘bad’ aspects, and so avoid the implication that one was to be preferred or regarded as potentially more desirable than the others. The full morphological analysis for the six scenarios is given in Appendix 25.2.
25.3 The UK NEA Scenarios
25.3.1 Scenarios: Representing their Internal Logics The drafts of each storyline and their climatic variants were first reviewed at a full-day meeting by UK NEA stakeholders and experts interested in scenario issues. The narratives were refined and taken forward into four full-day meetings with stakeholders from the four countries, where they were further reviewed and criticised. These discussions, all of which took place in 2010, covered a range of topics from the more general conceptual and philosophical aspects of scenario building through to the plausibility and implications of the draft scenarios themselves. The broader methodological issues will be considered in the last part of this chapter. Here the focus is on the scenarios themselves, their assumptions and implications that seem to follow for ecosystem services and well-being. The morphological framework used to draft the storylines was valuable both in showing how storylines differed in terms of the projections for the various drivers of change, and in developing the logic that linked these changes through to the output of ecosystem services. This latter step, and questions about the robustness of the reasoning that connects the drivers and ecosystem outputs, is clearly critical to judging the success of the whole exercise. Thus it is important to consider it further here. For a scenario exercise to be convincing scientifically, the reasoning that connects assumptions about changes in the key drivers to ecosystem outputs should be evidence- based. Although scenarios attempt to look to the future and describe worlds very different from today’s, the ecosystem responses have to be credible in biophysical or socioeconomic terms; that is, they need to be broadly
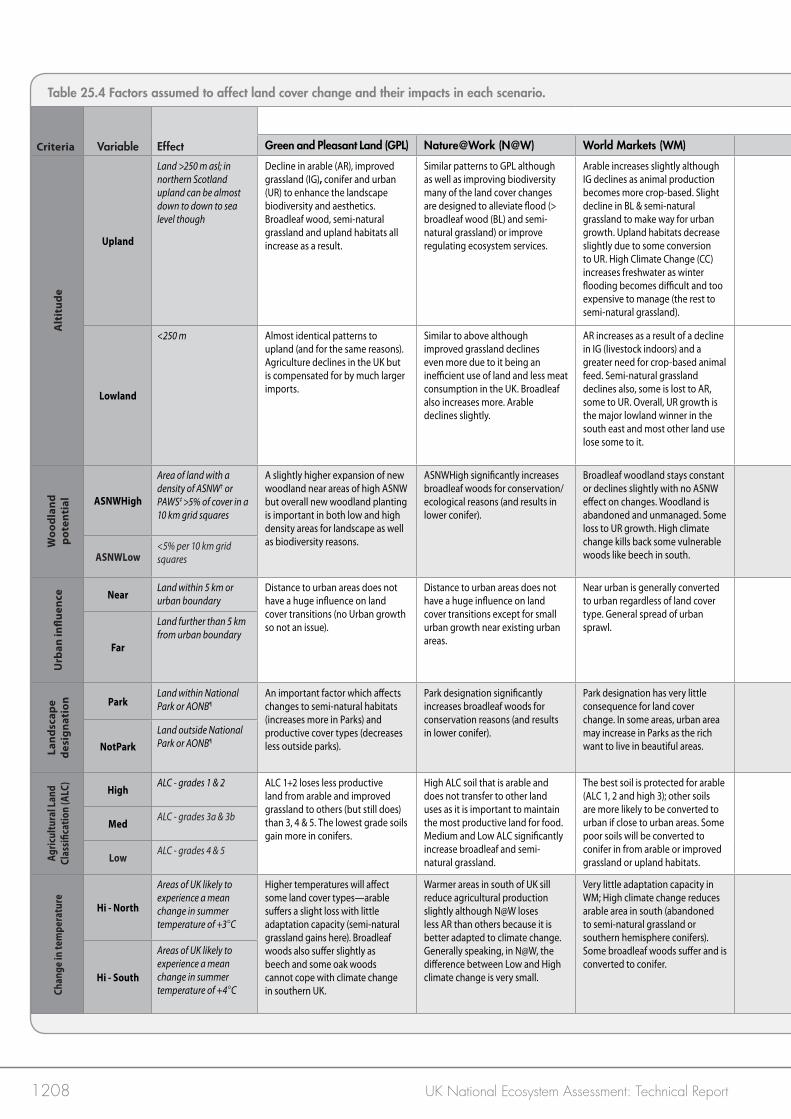
consistent with what we know about ecosystems and how they behave at present. This is generally achieved by using either process-response models or empirical relationships that would allow drivers and ecosystem services to be quantified, and some kind of input-output analysis made. The need to ‘quantify’ scenarios is, for example, a key point in the approach developed out of the MA experience (Ash et al. 2010); quantification is seen as a way of increasing the transparency of the arguments that underpin the deductions developed around different storylines. Unfortunately, the UK NEA material on current state and trends provided few models or empirical relationships of the type needed. Certainly none appeared to exist that deals with the balance between different types of service output, or trade-offs under different sets of assumptions at the UK scale. Thus, the initial phase of scenario development had to employ a more qualitative approach for deducing the impacts of the different combinations of drivers that defined the six storylines. This was done initially by extending the morphological analysis to include the likely consequences for the UK NEA habitats and services that were implied by the projections for the drivers assumed under each narrative. To take account of the lack of modelling tools we have, however, sought to make the logic that underpins our deductions as clear as possible by also using a rule-based approach that describes how the major land cover types being considered by the UK NEA would change under the different storylines. For each storyline we considered how the major land cover types would change in different types of location, and represented these quantitatively as a set of land cover transition matrices. These matrices could be used to change the present pattern of land cover in ways that were consistent with each narrative. The major factors influencing change were considered to be altitude, the density of ancient and semi-natural woodlands, landscape designation, and proximity to urban areas, agricultural land quality, and climate (temperature and precipitation). The influences that each of these factors is assumed to have on land cover under each scenario are described in Table 25.4. The use of these transition matrices allowed some of the qualitative assumptions that underpin the scenarios to be represented quantitatively—not as a way of making modelled predictions of future patterns of land cover, but to describe more clearly the spatial assumptions made about the location and magnitude of change implied by the particular storylines. It was felt that the land cover projections produced by this analysis allowed the plausibility of the scenarios to be more easily tested. The approach used to make projections for the different scenarios had another advantage: it allowed the economic valuation of ecosystem services to be used to examine the implications of the six scenarios in monetary terms. Many of the models used to estimate the present value of services are based on an understanding of the stocks of different types of land cover and their geographical distribution (Chapter 22). Thus, land cover mapping, coupled with other assumptions about population and economic growth, enabled marginal differences in the values for some services to be estimated
1208 UK National Ecosystem Assessment: Technical Report
Table 25.4 Factors assumed to affect land cover change and their impacts in each scenario.
Criteria Variable Effect
Storyline
Green and Pleasant Land (GPL) Nature@Work (N@W) World Markets (WM) National Security (NS) Local Stewardship (LS) Go with the Flow (GF)
Alt
itud
e
Upland
Land >250 m asl; in northern Scotland upland can be almost down to down to sea level though
Decline in arable (AR), improved grassland (IG), conifer and urban (UR) to enhance the landscape biodiversity and aesthetics. Broadleaf wood, semi-natural grassland and upland habitats all increase as a result.
Similar patterns to GPL although as well as improving biodiversity many of the land cover changes are designed to alleviate flood (> broadleaf wood (BL) and semi-natural grassland) or improve regulating ecosystem services.
Arable increases slightly although IG declines as animal production becomes more crop-based. Slight decline in BL & semi-natural grassland to make way for urban growth. Upland habitats decrease slightly due to some conversion to UR. High Climate Change (CC) increases freshwater as winter flooding becomes difficult and too expensive to manage (the rest to semi-natural grassland).
Food and timber production very important and conifer cover increases considerably as does arable. Slight decline in improved grassland due to a move towards more efficient food production (i.e. crop-based protein). Broadleaf wood also slightly increases at the expense of semi-natural grassland and upland habitats. High CC reduces arable area in uplands and more is switched to improved grassland.
Semi-natural grassland and broadleaf woods two main winners here. Food production is very important but is managed sustainably and extensively hence the transition to more semi-natural habitats. Upland stays constant but is managed more sustainably.
Slight increases in broadleaf woods, semi-natural grassland and upland habitats reflecting the continuing pattern of ‘softening’ landscapes through agri-environment schemes and other conservation grant-aided programmes.
Lowland
<250 m Almost identical patterns to upland (and for the same reasons). Agriculture declines in the UK but is compensated for by much larger imports.
Similar to above although improved grassland declines even more due to it being an inefficient use of land and less meat consumption in the UK. Broadleaf also increases more. Arable declines slightly.
AR increases as a result of a decline in IG (livestock indoors) and a greater need for crop-based animal feed. Semi-natural grassland declines also, some is lost to AR, some to UR. Overall, UR growth is the major lowland winner in the south east and most other land use lose some to it.
Arable and conifers increase considerably as does arable. Decline in improved grassland due to a move towards more efficient food production (i.e. crop-based protein). BL woods also slightly increases at the expense of semi-natural grassland. High CC reduces arable area in south and more is switched to drought-tolerant conifer.
Similar to above although improved grassland declines slightly (and more under High climate change). Main underlying factor behind land cover changes is a lower demand for food (low population, less waste)—as a result, semi-natural grassland increases (but is used for livestock production too). Loss of arable due to less demand for food.
Continuation of current agri-environment policy—slight loss of arable to semi-natural grassland and broadleaf woods. Continued conversion of PAWS conifer to broadleaf woods. Loss of improved grassland as more livestock reared indoors and requires arable crop land. Slight increase in urban as population continues to rise.
Woo
dlan
d po
tent
ial ASNWHigh
Area of land with a density of ASNW† or PAWS‡ >5% of cover in a 10 km grid squares
A slightly higher expansion of new woodland near areas of high ASNW but overall new woodland planting is important in both low and high density areas for landscape as well as biodiversity reasons.
ASNWHigh significantly increases broadleaf woods for conservation/ecological reasons (and results in lower conifer).
Broadleaf woodland stays constant or declines slightly with no ASNW effect on changes. Woodland is abandoned and unmanaged. Some loss to UR growth. High climate change kills back some vulnerable woods like beech in south.
Increase in broadleaf woods and huge increase in conifer with little regard to presence or absence of ANSW. ALC is a more important factor here.
Biodiversity is very important in this storyline, as are timber and non-timber forest products hence increase in traditional native woodland types near existing ANSW woods. Increases in High climate change to replace arable which struggles with heat and drought.
Presence of ASNW increases likelihood of new broadleaf woods to improve biodiversity value.
ASNWLow<5% per 10 km grid squares
Urb
an in
fluen
ce NearLand within 5 km or urban boundary
Distance to urban areas does not have a huge influence on land cover transitions (no Urban growth so not an issue).
Distance to urban areas does not have a huge influence on land cover transitions except for small urban growth near existing urban areas.
Near urban is generally converted to urban regardless of land cover type. General spread of urban sprawl.
Generally, proximity to urban has little effect on other land cover changes.
No influence on land use transitions except for increase in arable (for local peri-urban food production).
Near urban is more likely to become urban; rural areas generally protected from housing development.
Far
Land further than 5 km from urban boundary
Land
scap
e de
sign
atio
n ParkLand within National Park or AONB¶
An important factor which affects changes to semi-natural habitats (increases more in Parks) and productive cover types (decreases less outside parks).
Park designation significantly increases broadleaf woods for conservation reasons (and results in lower conifer).
Park designation has very little consequence for land cover change. In some areas, urban area may increase in Parks as the rich want to live in beautiful areas.
Park designation has very little consequence for land cover change. Recreation and conservation not important in this storyline.
Has major influence - Park areas protect semi-natural grassland and broadleaf and both increase at expense of arable and improved grassland.
National Parks etc. continue to maintain strict planning laws. Conversions of arable and improved grassland to semi-natural grassland and broadleaf occurs, as does some to freshwater habitats.
NotParkLand outside National Park or AONB¶
Agric
ultu
ral L
and
Clas
sific
atio
n (A
LC)
HighALC - grades 1 & 2 ALC 1+2 loses less productive
land from arable and improved grassland to others (but still does) than 3, 4 & 5. The lowest grade soils gain more in conifers.
High ALC soil that is arable and does not transfer to other land uses as it is important to maintain the most productive land for food. Medium and Low ALC significantly increase broadleaf and semi-natural grassland.
The best soil is protected for arable (ALC 1, 2 and high 3); other soils are more likely to be converted to urban if close to urban areas. Some poor soils will be converted to conifer in from arable or improved grassland or upland habitats.
Major determinant factor on arable—the best land is kept or converted to arable even ALC 3 is protected. Maximising yield is paramount.
High ALC soils are kept as arable; lower ALC soils more likely to become broadleaf woods and semi-natural grassland throughout UK. Some Medium ALC soils will become improved grassland to increase farmland heterogeneity.
High ALC soils are kept arable; lower ALC soils more likely to become broadleaf woods and semi-natural grassland through UK.
MedALC - grades 3a & 3b
LowALC - grades 4 & 5
Chan
ge in
tem
pera
ture
Hi - North
Areas of UK likely to experience a mean change in summer temperature of +3°C
Higher temperatures will affect some land cover types—arable suffers a slight loss with little adaptation capacity (semi-natural grassland gains here). Broadleaf woods also suffer slightly as beech and some oak woods cannot cope with climate change in southern UK.
Warmer areas in south of UK sill reduce agricultural production slightly although N@W loses less AR than others because it is better adapted to climate change. Generally speaking, in N@W, the difference between Low and High climate change is very small.
Very little adaptation capacity in WM; High climate change reduces arable area in south (abandoned to semi-natural grassland or southern hemisphere conifers). Some broadleaf woods suffer and is converted to conifer.
High climate change temperatures reduce arable production in south east; adaptation capacity (e.g. drought resistant crops) not as prevalent as in N@W); switch to conifer or improved grassland in these circumstances.
Reduces arable but increases native wood planting (not beech or other climate change intolerant species). Some improved grassland is converted to semi-natural grassland because it is more climate change tolerant.
Loss of arable and improved grassland as High climate change impacts make growing crops more difficult. Some degree of adaptation but not enough to see small transition to either water, broadleaf woods or semi-natural grassland.
Hi - South
Areas of UK likely to experience a mean change in summer temperature of +4°C
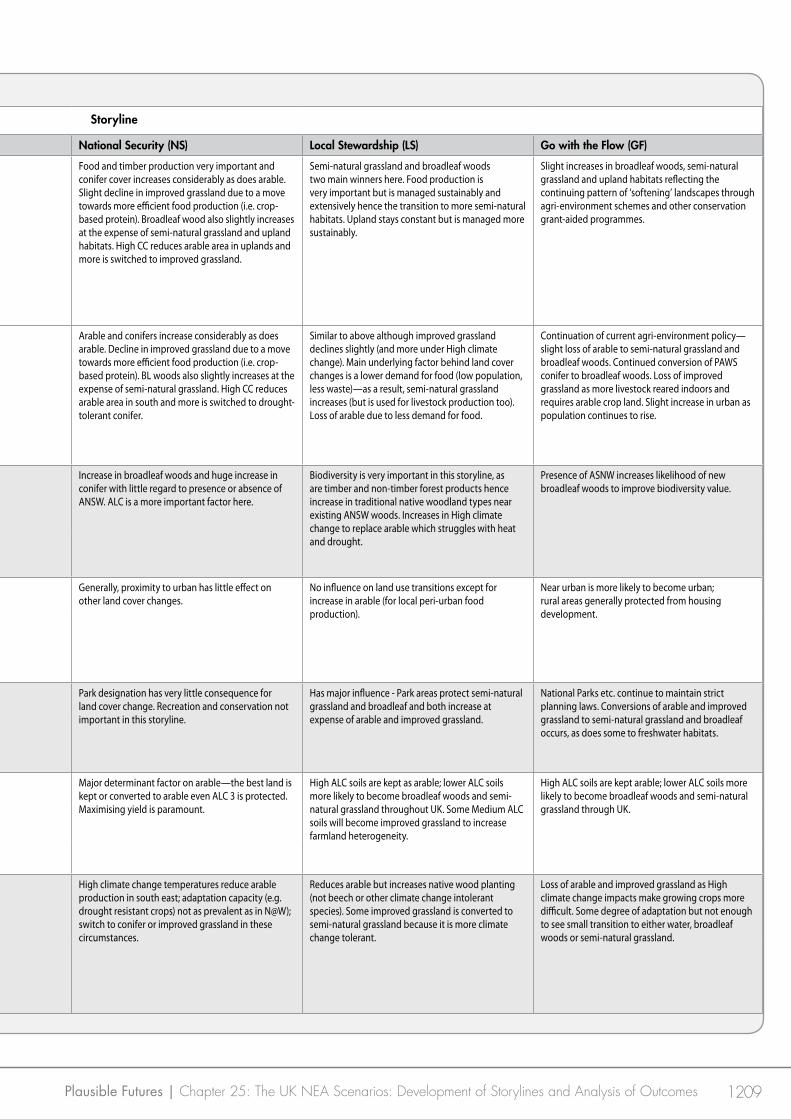
1209Plausible Futures | Chapter 25: The UK NEA Scenarios: Development of Storylines and Analysis of Outcomes
Table 25.4 Factors assumed to affect land cover change and their impacts in each scenario.
Criteria Variable Effect
Storyline
Green and Pleasant Land (GPL) Nature@Work (N@W) World Markets (WM) National Security (NS) Local Stewardship (LS) Go with the Flow (GF)
Alt
itud
e
Upland
Land >250 m asl; in northern Scotland upland can be almost down to down to sea level though
Decline in arable (AR), improved grassland (IG), conifer and urban (UR) to enhance the landscape biodiversity and aesthetics. Broadleaf wood, semi-natural grassland and upland habitats all increase as a result.
Similar patterns to GPL although as well as improving biodiversity many of the land cover changes are designed to alleviate flood (> broadleaf wood (BL) and semi-natural grassland) or improve regulating ecosystem services.
Arable increases slightly although IG declines as animal production becomes more crop-based. Slight decline in BL & semi-natural grassland to make way for urban growth. Upland habitats decrease slightly due to some conversion to UR. High Climate Change (CC) increases freshwater as winter flooding becomes difficult and too expensive to manage (the rest to semi-natural grassland).
Food and timber production very important and conifer cover increases considerably as does arable. Slight decline in improved grassland due to a move towards more efficient food production (i.e. crop-based protein). Broadleaf wood also slightly increases at the expense of semi-natural grassland and upland habitats. High CC reduces arable area in uplands and more is switched to improved grassland.
Semi-natural grassland and broadleaf woods two main winners here. Food production is very important but is managed sustainably and extensively hence the transition to more semi-natural habitats. Upland stays constant but is managed more sustainably.
Slight increases in broadleaf woods, semi-natural grassland and upland habitats reflecting the continuing pattern of ‘softening’ landscapes through agri-environment schemes and other conservation grant-aided programmes.
Lowland
<250 m Almost identical patterns to upland (and for the same reasons). Agriculture declines in the UK but is compensated for by much larger imports.
Similar to above although improved grassland declines even more due to it being an inefficient use of land and less meat consumption in the UK. Broadleaf also increases more. Arable declines slightly.
AR increases as a result of a decline in IG (livestock indoors) and a greater need for crop-based animal feed. Semi-natural grassland declines also, some is lost to AR, some to UR. Overall, UR growth is the major lowland winner in the south east and most other land use lose some to it.
Arable and conifers increase considerably as does arable. Decline in improved grassland due to a move towards more efficient food production (i.e. crop-based protein). BL woods also slightly increases at the expense of semi-natural grassland. High CC reduces arable area in south and more is switched to drought-tolerant conifer.
Similar to above although improved grassland declines slightly (and more under High climate change). Main underlying factor behind land cover changes is a lower demand for food (low population, less waste)—as a result, semi-natural grassland increases (but is used for livestock production too). Loss of arable due to less demand for food.
Continuation of current agri-environment policy—slight loss of arable to semi-natural grassland and broadleaf woods. Continued conversion of PAWS conifer to broadleaf woods. Loss of improved grassland as more livestock reared indoors and requires arable crop land. Slight increase in urban as population continues to rise.
Woo
dlan
d po
tent
ial ASNWHigh
Area of land with a density of ASNW† or PAWS‡ >5% of cover in a 10 km grid squares
A slightly higher expansion of new woodland near areas of high ASNW but overall new woodland planting is important in both low and high density areas for landscape as well as biodiversity reasons.
ASNWHigh significantly increases broadleaf woods for conservation/ecological reasons (and results in lower conifer).
Broadleaf woodland stays constant or declines slightly with no ASNW effect on changes. Woodland is abandoned and unmanaged. Some loss to UR growth. High climate change kills back some vulnerable woods like beech in south.
Increase in broadleaf woods and huge increase in conifer with little regard to presence or absence of ANSW. ALC is a more important factor here.
Biodiversity is very important in this storyline, as are timber and non-timber forest products hence increase in traditional native woodland types near existing ANSW woods. Increases in High climate change to replace arable which struggles with heat and drought.
Presence of ASNW increases likelihood of new broadleaf woods to improve biodiversity value.
ASNWLow<5% per 10 km grid squares
Urb
an in
fluen
ce NearLand within 5 km or urban boundary
Distance to urban areas does not have a huge influence on land cover transitions (no Urban growth so not an issue).
Distance to urban areas does not have a huge influence on land cover transitions except for small urban growth near existing urban areas.
Near urban is generally converted to urban regardless of land cover type. General spread of urban sprawl.
Generally, proximity to urban has little effect on other land cover changes.
No influence on land use transitions except for increase in arable (for local peri-urban food production).
Near urban is more likely to become urban; rural areas generally protected from housing development.
Far
Land further than 5 km from urban boundary
Land
scap
e de
sign
atio
n ParkLand within National Park or AONB¶
An important factor which affects changes to semi-natural habitats (increases more in Parks) and productive cover types (decreases less outside parks).
Park designation significantly increases broadleaf woods for conservation reasons (and results in lower conifer).
Park designation has very little consequence for land cover change. In some areas, urban area may increase in Parks as the rich want to live in beautiful areas.
Park designation has very little consequence for land cover change. Recreation and conservation not important in this storyline.
Has major influence - Park areas protect semi-natural grassland and broadleaf and both increase at expense of arable and improved grassland.
National Parks etc. continue to maintain strict planning laws. Conversions of arable and improved grassland to semi-natural grassland and broadleaf occurs, as does some to freshwater habitats.
NotParkLand outside National Park or AONB¶
Agric
ultu
ral L
and
Clas
sific
atio
n (A
LC)
HighALC - grades 1 & 2 ALC 1+2 loses less productive
land from arable and improved grassland to others (but still does) than 3, 4 & 5. The lowest grade soils gain more in conifers.
High ALC soil that is arable and does not transfer to other land uses as it is important to maintain the most productive land for food. Medium and Low ALC significantly increase broadleaf and semi-natural grassland.
The best soil is protected for arable (ALC 1, 2 and high 3); other soils are more likely to be converted to urban if close to urban areas. Some poor soils will be converted to conifer in from arable or improved grassland or upland habitats.
Major determinant factor on arable—the best land is kept or converted to arable even ALC 3 is protected. Maximising yield is paramount.
High ALC soils are kept as arable; lower ALC soils more likely to become broadleaf woods and semi-natural grassland throughout UK. Some Medium ALC soils will become improved grassland to increase farmland heterogeneity.
High ALC soils are kept arable; lower ALC soils more likely to become broadleaf woods and semi-natural grassland through UK.
MedALC - grades 3a & 3b
LowALC - grades 4 & 5
Chan
ge in
tem
pera
ture
Hi - North
Areas of UK likely to experience a mean change in summer temperature of +3°C
Higher temperatures will affect some land cover types—arable suffers a slight loss with little adaptation capacity (semi-natural grassland gains here). Broadleaf woods also suffer slightly as beech and some oak woods cannot cope with climate change in southern UK.
Warmer areas in south of UK sill reduce agricultural production slightly although N@W loses less AR than others because it is better adapted to climate change. Generally speaking, in N@W, the difference between Low and High climate change is very small.
Very little adaptation capacity in WM; High climate change reduces arable area in south (abandoned to semi-natural grassland or southern hemisphere conifers). Some broadleaf woods suffer and is converted to conifer.
High climate change temperatures reduce arable production in south east; adaptation capacity (e.g. drought resistant crops) not as prevalent as in N@W); switch to conifer or improved grassland in these circumstances.
Reduces arable but increases native wood planting (not beech or other climate change intolerant species). Some improved grassland is converted to semi-natural grassland because it is more climate change tolerant.
Loss of arable and improved grassland as High climate change impacts make growing crops more difficult. Some degree of adaptation but not enough to see small transition to either water, broadleaf woods or semi-natural grassland.
Hi - South
Areas of UK likely to experience a mean change in summer temperature of +4°C
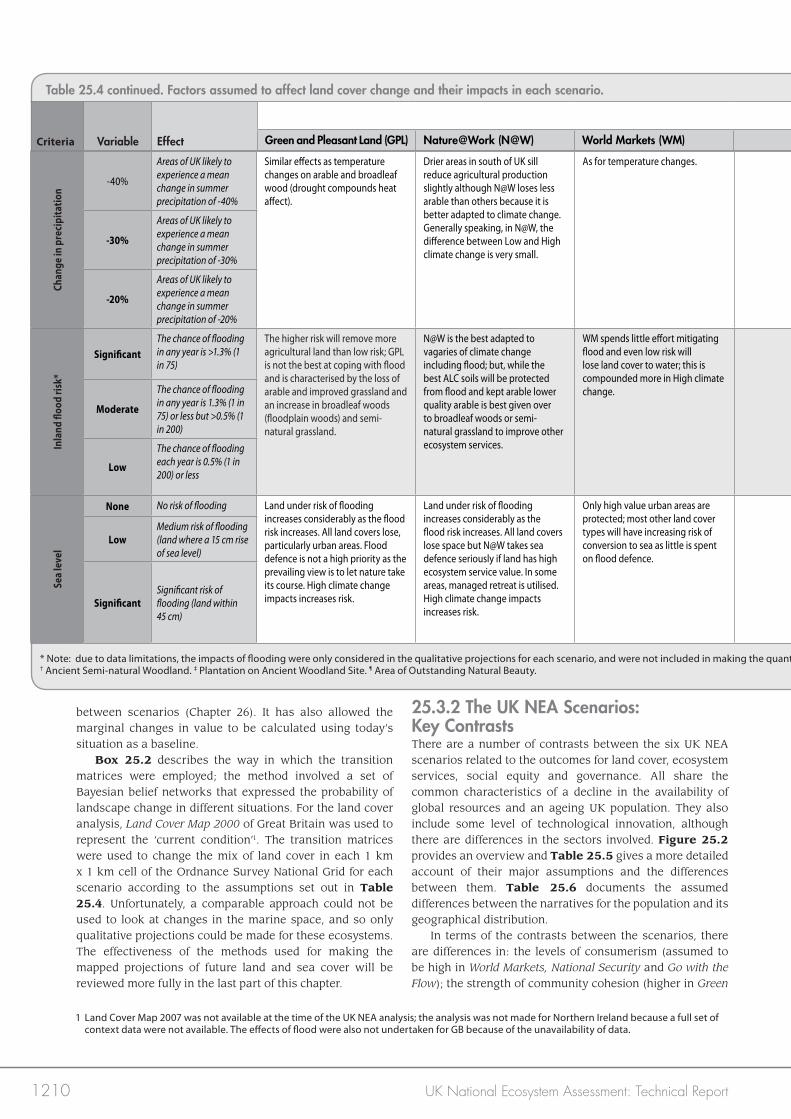
1210 UK National Ecosystem Assessment: Technical Report
Table 25.4 continued. Factors assumed to affect land cover change and their impacts in each scenario.
between scenarios (Chapter 26). It has also allowed the marginal changes in value to be calculated using today’s situation as a baseline. Box 25.2 describes the way in which the transition matrices were employed; the method involved a set of Bayesian belief networks that expressed the probability of landscape change in different situations. For the land cover analysis, Land Cover Map 2000 of Great Britain was used to represent the ‘current condition’1. The transition matrices were used to change the mix of land cover in each 1 km x 1 km cell of the Ordnance Survey National Grid for each scenario according to the assumptions set out in Table 25.4. Unfortunately, a comparable approach could not be used to look at changes in the marine space, and so only qualitative projections could be made for these ecosystems. The effectiveness of the methods used for making the mapped projections of future land and sea cover will be reviewed more fully in the last part of this chapter.
25.3.2 The UK NEA Scenarios: Key ContrastsThere are a number of contrasts between the six UK NEA scenarios related to the outcomes for land cover, ecosystem services, social equity and governance. All share the common characteristics of a decline in the availability of global resources and an ageing UK population. They also include some level of technological innovation, although there are differences in the sectors involved. Figure 25.2 provides an overview and Table 25.5 gives a more detailed account of their major assumptions and the differences between them. Table 25.6 documents the assumed differences between the narratives for the population and its geographical distribution. In terms of the contrasts between the scenarios, there are differences in: the levels of consumerism (assumed to be high in World Markets, National Security and Go with the Flow); the strength of community cohesion (higher in Green
1 Land Cover Map 2007 was not available at the time of the UK NEA analysis; the analysis was not made for Northern Ireland because a full set of context data were not available. The effects of flood were also not undertaken for GB because of the unavailability of data.
Chan
ge in
pre
cipi
tatio
n
-40%
Areas of UK likely to experience a mean change in summer precipitation of -40%
Similar effects as temperature changes on arable and broadleaf wood (drought compounds heat affect).
Drier areas in south of UK sill reduce agricultural production slightly although N@W loses less arable than others because it is better adapted to climate change. Generally speaking, in N@W, the difference between Low and High climate change is very small.
As for temperature changes. As for temperature changes. Drier conditions more likely to result in arable converting to conifer woods.
As for temperature changes. Loss of arable and improved grassland as High climate change impacts make growing crops more difficult.
-30%
Areas of UK likely to experience a mean change in summer precipitation of -30%
-20%
Areas of UK likely to experience a mean change in summer precipitation of -20%
Inla
nd fl
ood
risk*
SignificantThe chance of flooding in any year is >1.3% (1 in 75)
The higher risk will remove more agricultural land than low risk; GPL is not the best at coping with flood and is characterised by the loss of arable and improved grassland and an increase in broadleaf woods (floodplain woods) and semi-natural grassland.
N@W is the best adapted to vagaries of climate change including flood; but, while the best ALC soils will be protected from flood and kept arable lower quality arable is best given over to broadleaf woods or semi-natural grassland to improve other ecosystem services.
WM spends little effort mitigating flood and even low risk will lose land cover to water; this is compounded more in High climate change.
Flood control is important for food or timber producing land. High risk areas will lose to water but for moderate or low every effort is made to protect arable. Some loss of urban to water too.
Increased flood risk is seen as an opportunity to return land to grazing marsh or floodplain woods rather than hindrance. Conversion of arable, improved grassland to broadleaf woods and semi-natural grassland rises with increased flood risk.
Housing development in floodplains is protected though afforestation projects (hence in high flood risk areas some degree of arable and improved grassland to broadleaf woods).
Moderate
The chance of flooding in any year is 1.3% (1 in 75) or less but >0.5% (1 in 200)
Low
The chance of flooding each year is 0.5% (1 in 200) or less
Sea
leve
l
None No risk of flooding Land under risk of flooding increases considerably as the flood risk increases. All land covers lose, particularly urban areas. Flood defence is not a high priority as the prevailing view is to let nature take its course. High climate change impacts increases risk.
Land under risk of flooding increases considerably as the flood risk increases. All land covers lose space but N@W takes sea defence seriously if land has high ecosystem service value. In some areas, managed retreat is utilised. High climate change impacts increases risk.
Only high value urban areas are protected; most other land cover types will have increasing risk of conversion to sea as little is spent on flood defence.
As with inland flood risk— arable near coast is protected more than urban.
Managed retreat is fully accepted by society, loss of arable and improved grassland occurs.
Some managed retreat in coastal areas away from urban zones—loss of some arable and improved grassland.
LowMedium risk of flooding (land where a 15 cm rise of sea level)
SignificantSignificant risk of flooding (land within 45 cm)
* Note: due to data limitations, the impacts of flooding were only considered in the qualitative projections for each scenario, and were not included in making the quantitative projections for land cover based on the construction of a set of transition matrices. † Ancient Semi-natural Woodland. ‡ Plantation on Ancient Woodland Site. ¶ Area of Outstanding Natural Beauty.
Criteria Variable Effect
Storyline
Green and Pleasant Land (GPL) Nature@Work (N@W) World Markets (WM) National Security (NS) Local Stewardship (LS) Go with the Flow (GF)
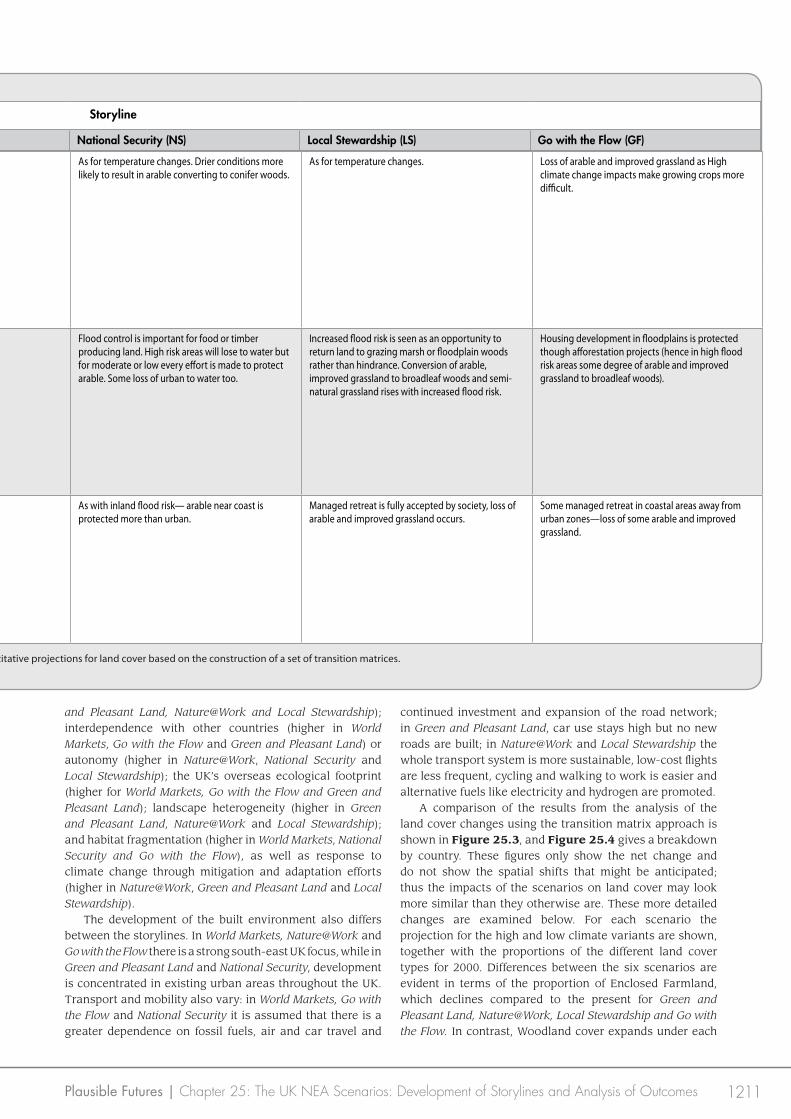
1211Plausible Futures | Chapter 25: The UK NEA Scenarios: Development of Storylines and Analysis of Outcomes
and Pleasant Land, Nature@Work and Local Stewardship); interdependence with other countries (higher in World Markets, Go with the Flow and Green and Pleasant Land) or autonomy (higher in Nature@Work, National Security and Local Stewardship); the UK’s overseas ecological footprint (higher for World Markets, Go with the Flow and Green and Pleasant Land); landscape heterogeneity (higher in Green and Pleasant Land, Nature@Work and Local Stewardship); and habitat fragmentation (higher in World Markets, National Security and Go with the Flow), as well as response to climate change through mitigation and adaptation efforts (higher in Nature@Work, Green and Pleasant Land and Local Stewardship). The development of the built environment also differs between the storylines. In World Markets, Nature@Work and Go with the Flow there is a strong south-east UK focus, while in Green and Pleasant Land and National Security, development is concentrated in existing urban areas throughout the UK. Transport and mobility also vary: in World Markets, Go with the Flow and National Security it is assumed that there is a greater dependence on fossil fuels, air and car travel and
continued investment and expansion of the road network; in Green and Pleasant Land, car use stays high but no new roads are built; in Nature@Work and Local Stewardship the whole transport system is more sustainable, low-cost flights are less frequent, cycling and walking to work is easier and alternative fuels like electricity and hydrogen are promoted. A comparison of the results from the analysis of the land cover changes using the transition matrix approach is shown in Figure 25.3, and Figure 25.4 gives a breakdown by country. These figures only show the net change and do not show the spatial shifts that might be anticipated; thus the impacts of the scenarios on land cover may look more similar than they otherwise are. These more detailed changes are examined below. For each scenario the projection for the high and low climate variants are shown, together with the proportions of the different land cover types for 2000. Differences between the six scenarios are evident in terms of the proportion of Enclosed Farmland, which declines compared to the present for Green and Pleasant Land, Nature@Work, Local Stewardship and Go with the Flow. In contrast, Woodland cover expands under each
Chan
ge in
pre
cipi
tatio
n
-40%
Areas of UK likely to experience a mean change in summer precipitation of -40%
Similar effects as temperature changes on arable and broadleaf wood (drought compounds heat affect).
Drier areas in south of UK sill reduce agricultural production slightly although N@W loses less arable than others because it is better adapted to climate change. Generally speaking, in N@W, the difference between Low and High climate change is very small.
As for temperature changes. As for temperature changes. Drier conditions more likely to result in arable converting to conifer woods.
As for temperature changes. Loss of arable and improved grassland as High climate change impacts make growing crops more difficult.
-30%
Areas of UK likely to experience a mean change in summer precipitation of -30%
-20%
Areas of UK likely to experience a mean change in summer precipitation of -20%
Inla
nd fl
ood
risk*
SignificantThe chance of flooding in any year is >1.3% (1 in 75)
The higher risk will remove more agricultural land than low risk; GPL is not the best at coping with flood and is characterised by the loss of arable and improved grassland and an increase in broadleaf woods (floodplain woods) and semi-natural grassland.
N@W is the best adapted to vagaries of climate change including flood; but, while the best ALC soils will be protected from flood and kept arable lower quality arable is best given over to broadleaf woods or semi-natural grassland to improve other ecosystem services.
WM spends little effort mitigating flood and even low risk will lose land cover to water; this is compounded more in High climate change.
Flood control is important for food or timber producing land. High risk areas will lose to water but for moderate or low every effort is made to protect arable. Some loss of urban to water too.
Increased flood risk is seen as an opportunity to return land to grazing marsh or floodplain woods rather than hindrance. Conversion of arable, improved grassland to broadleaf woods and semi-natural grassland rises with increased flood risk.
Housing development in floodplains is protected though afforestation projects (hence in high flood risk areas some degree of arable and improved grassland to broadleaf woods).
Moderate
The chance of flooding in any year is 1.3% (1 in 75) or less but >0.5% (1 in 200)
Low
The chance of flooding each year is 0.5% (1 in 200) or less
Sea
leve
l
None No risk of flooding Land under risk of flooding increases considerably as the flood risk increases. All land covers lose, particularly urban areas. Flood defence is not a high priority as the prevailing view is to let nature take its course. High climate change impacts increases risk.
Land under risk of flooding increases considerably as the flood risk increases. All land covers lose space but N@W takes sea defence seriously if land has high ecosystem service value. In some areas, managed retreat is utilised. High climate change impacts increases risk.
Only high value urban areas are protected; most other land cover types will have increasing risk of conversion to sea as little is spent on flood defence.
As with inland flood risk— arable near coast is protected more than urban.
Managed retreat is fully accepted by society, loss of arable and improved grassland occurs.
Some managed retreat in coastal areas away from urban zones—loss of some arable and improved grassland.
LowMedium risk of flooding (land where a 15 cm rise of sea level)
SignificantSignificant risk of flooding (land within 45 cm)
* Note: due to data limitations, the impacts of flooding were only considered in the qualitative projections for each scenario, and were not included in making the quantitative projections for land cover based on the construction of a set of transition matrices. † Ancient Semi-natural Woodland. ‡ Plantation on Ancient Woodland Site. ¶ Area of Outstanding Natural Beauty.
Criteria Variable Effect
Storyline
Green and Pleasant Land (GPL) Nature@Work (N@W) World Markets (WM) National Security (NS) Local Stewardship (LS) Go with the Flow (GF)
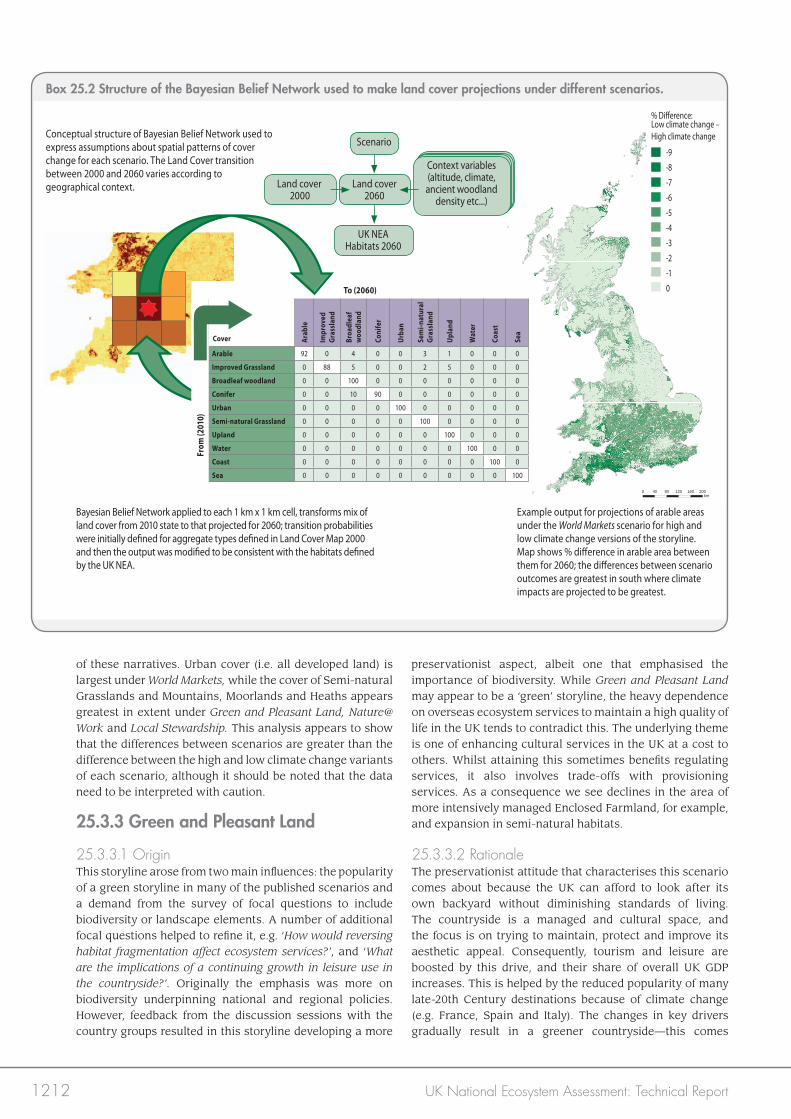
1212 UK National Ecosystem Assessment: Technical Report
0 40 80 120 160 200km
Box 25.2 Structure of the Bayesian Belief Network used to make land cover projections under different scenarios.
Conceptual structure of Bayesian Belief Network used to express assumptions about spatial patterns of cover change for each scenario. The Land Cover transition between 2000 and 2060 varies according to geographical context.
Bayesian Belief Network applied to each 1 km x 1 km cell, transforms mix of land cover from 2010 state to that projected for 2060; transition probabilities were initially defined for aggregate types defined in Land Cover Map 2000 and then the output was modified to be consistent with the habitats defined by the UK NEA.
Example output for projections of arable areas under the World Markets scenario for high and low climate change versions of the storyline. Map shows % difference in arable area between them for 2060; the differences between scenario outcomes are greatest in south where climate impacts are projected to be greatest.
of these narratives. Urban cover (i.e. all developed land) is largest under World Markets, while the cover of Semi-natural Grasslands and Mountains, Moorlands and Heaths appears greatest in extent under Green and Pleasant Land, Nature@Work and Local Stewardship. This analysis appears to show that the differences between scenarios are greater than the difference between the high and low climate change variants of each scenario, although it should be noted that the data need to be interpreted with caution.
25.3.3 Green and Pleasant Land
25.3.3.1 OriginThis storyline arose from two main influences: the popularity of a green storyline in many of the published scenarios and a demand from the survey of focal questions to include biodiversity or landscape elements. A number of additional focal questions helped to refine it, e.g. ‘How would reversing habitat fragmentation affect ecosystem services? ’, and ‘What are the implications of a continuing growth in leisure use in the countryside? ’. Originally the emphasis was more on biodiversity underpinning national and regional policies. However, feedback from the discussion sessions with the country groups resulted in this storyline developing a more
preservationist aspect, albeit one that emphasised the importance of biodiversity. While Green and Pleasant Land may appear to be a ‘green’ storyline, the heavy dependence on overseas ecosystem services to maintain a high quality of life in the UK tends to contradict this. The underlying theme is one of enhancing cultural services in the UK at a cost to others. Whilst attaining this sometimes benefits regulating services, it also involves trade-offs with provisioning services. As a consequence we see declines in the area of more intensively managed Enclosed Farmland, for example, and expansion in semi-natural habitats.
25.3.3.2 RationaleThe preservationist attitude that characterises this scenario comes about because the UK can afford to look after its own backyard without diminishing standards of living. The countryside is a managed and cultural space, and the focus is on trying to maintain, protect and improve its aesthetic appeal. Consequently, tourism and leisure are boosted by this drive, and their share of overall UK GDP increases. This is helped by the reduced popularity of many late-20th Century destinations because of climate change (e.g. France, Spain and Italy). The changes in key drivers gradually result in a greener countryside—this comes
Scenario
Land cover 2060
UK NEA Habitats 2060
Land cover 2000
Context variables(altitude, climate,
ancient woodland density etc...)
-9
-8
-7
-6
-5
-4
-3
-2
-1
0
% Di�erence: Low climate change – High climate change
Cover Arab
le
Impr
oved
Gr
assl
and
Broa
dlea
f w
oodl
and
Coni
fer
Urba
n
Sem
i-nat
ural
Gr
assl
and
Upla
nd
Wat
er
Coas
t
Sea
Arable 92 0 4 0 0 3 1 0 0 0
Improved Grassland 0 88 5 0 0 2 5 0 0 0
Broadleaf woodland 0 0 100 0 0 0 0 0 0 0
Conifer 0 0 10 90 0 0 0 0 0 0
Urban 0 0 0 0 100 0 0 0 0 0
Semi-natural Grassland 0 0 0 0 0 100 0 0 0 0
Upland 0 0 0 0 0 0 100 0 0 0
Water 0 0 0 0 0 0 0 100 0 0
Coast 0 0 0 0 0 0 0 0 100 0
Sea 0 0 0 0 0 0 0 0 0 100
To (2060)
From
(201
0)
➦
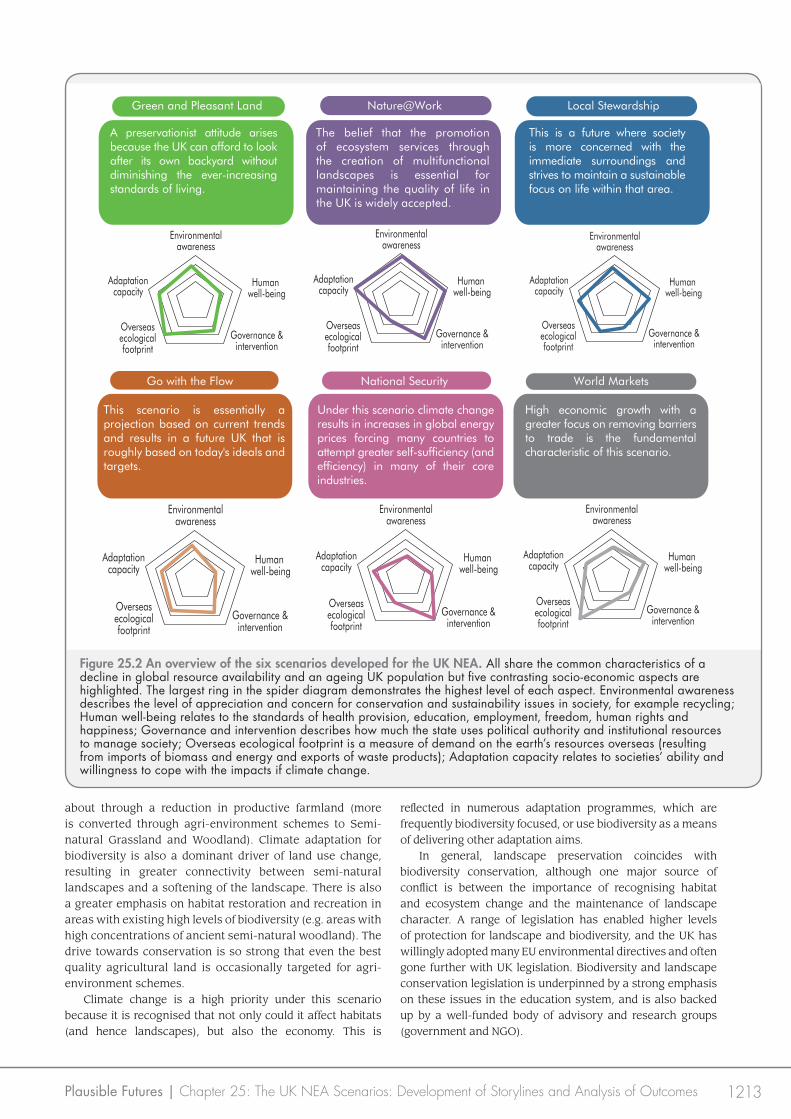
1213Plausible Futures | Chapter 25: The UK NEA Scenarios: Development of Storylines and Analysis of Outcomes
Environmentalawareness
Adaptationcapacity
Overseasecologicalfootprint
Human well-being
Governance &intervention
Environmentalawareness
Adaptationcapacity
Overseasecologicalfootprint
Human well-being
Governance &intervention
Environmentalawareness
Adaptationcapacity
Overseasecologicalfootprint
Human well-being
Governance &intervention
Environmentalawareness
Adaptationcapacity
Overseasecologicalfootprint
Human well-being
Governance &intervention
Environmentalawareness
Adaptationcapacity
Overseasecologicalfootprint
Human well-being
Governance &intervention
Environmentalawareness
Adaptationcapacity
Overseasecologicalfootprint
Human well-being
Governance &intervention
Green and Pleasant Land Nature@Work
World MarketsNational Security
Local Stewardship
Go with the Flow
A preservationist attitude arises because the UK can afford to look after its own backyard without diminishing the ever-increasing standards of living.
The belief that the promotion of ecosystem services through the creation of multifunctional landscapes is essential for maintaining the quality of life in the UK is widely accepted.
This is a future where society is more concerned with the immediate surroundings and strives to maintain a sustainable focus on life within that area.
This scenario is essentially a projection based on current trends and results in a future UK that is roughly based on today's ideals and targets.
Under this scenario climate change results in increases in global energy prices forcing many countries to attempt greater self-sufficiency (and efficiency) in many of their core industries.
High economic growth with a greater focus on removing barriers to trade is the fundamental characteristic of this scenario.
about through a reduction in productive farmland (more is converted through agri-environment schemes to Semi-natural Grassland and Woodland). Climate adaptation for biodiversity is also a dominant driver of land use change, resulting in greater connectivity between semi-natural landscapes and a softening of the landscape. There is also a greater emphasis on habitat restoration and recreation in areas with existing high levels of biodiversity (e.g. areas with high concentrations of ancient semi-natural woodland). The drive towards conservation is so strong that even the best quality agricultural land is occasionally targeted for agri-environment schemes. Climate change is a high priority under this scenario because it is recognised that not only could it affect habitats (and hence landscapes), but also the economy. This is
reflected in numerous adaptation programmes, which are frequently biodiversity focused, or use biodiversity as a means of delivering other adaptation aims. In general, landscape preservation coincides with biodiversity conservation, although one major source of conflict is between the importance of recognising habitat and ecosystem change and the maintenance of landscape character. A range of legislation has enabled higher levels of protection for landscape and biodiversity, and the UK has willingly adopted many EU environmental directives and often gone further with UK legislation. Biodiversity and landscape conservation legislation is underpinned by a strong emphasis on these issues in the education system, and is also backed up by a well-funded body of advisory and research groups (government and NGO).
Figure 25.2 An overview of the six scenarios developed for the UK NEA. All share the common characteristics of a decline in global resource availability and an ageing UK population but five contrasting socio-economic aspects are highlighted. The largest ring in the spider diagram demonstrates the highest level of each aspect. Environmental awareness describes the level of appreciation and concern for conservation and sustainability issues in society, for example recycling; Human well-being relates to the standards of health provision, education, employment, freedom, human rights and happiness; Governance and intervention describes how much the state uses political authority and institutional resources to manage society; Overseas ecological footprint is a measure of demand on the earth’s resources overseas (resulting from imports of biomass and energy and exports of waste products); Adaptation capacity relates to societies’ ability and willingness to cope with the impacts if climate change.
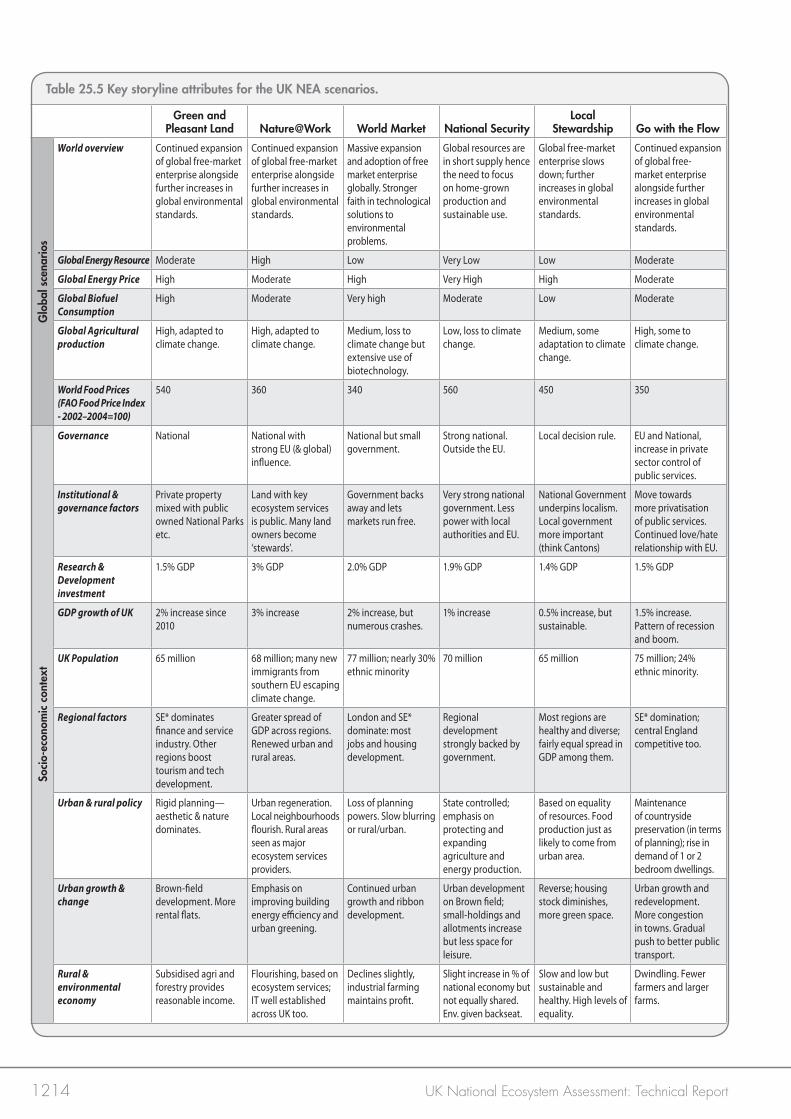
1214 UK National Ecosystem Assessment: Technical Report
Table 25.5 Key storyline attributes for the UK NEA scenarios.
Green and Pleasant Land Nature@Work World Market National Security
Local Stewardship Go with the Flow
Glo
bal s
cena
rios
World overview Continued expansion of global free-market enterprise alongside further increases in global environmental standards.
Continued expansion of global free-market enterprise alongside further increases in global environmental standards.
Massive expansion and adoption of free market enterprise globally. Stronger faith in technological solutions to environmental problems.
Global resources are in short supply hence the need to focus on home-grown production and sustainable use.
Global free-market enterprise slows down; further increases in global environmental standards.
Continued expansion of global free-market enterprise alongside further increases in global environmental standards.
Global Energy Resource Moderate High Low Very Low Low Moderate
Global Energy Price High Moderate High Very High High Moderate
Global Biofuel Consumption
High Moderate Very high Moderate Low Moderate
Global Agricultural production
High, adapted to climate change.
High, adapted to climate change.
Medium, loss to climate change but extensive use of biotechnology.
Low, loss to climate change.
Medium, some adaptation to climate change.
High, some to climate change.
World Food Prices (FAO Food Price Index - 2002–2004=100)
540 360 340 560 450 350
Soci
o-ec
onom
ic c
onte
xt
Governance National National with strong EU (& global) influence.
National but small government.
Strong national. Outside the EU.
Local decision rule. EU and National, increase in private sector control of public services.
Institutional & governance factors
Private property mixed with public owned National Parks etc.
Land with key ecosystem services is public. Many land owners become ‘stewards’.
Government backs away and lets markets run free.
Very strong national government. Less power with local authorities and EU.
National Government underpins localism. Local government more important (think Cantons)
Move towards more privatisation of public services. Continued love/hate relationship with EU.
Research & Development investment
1.5% GDP 3% GDP 2.0% GDP 1.9% GDP 1.4% GDP 1.5% GDP
GDP growth of UK 2% increase since 2010
3% increase 2% increase, but numerous crashes.
1% increase 0.5% increase, but sustainable.
1.5% increase. Pattern of recession and boom.
UK Population 65 million 68 million; many new immigrants from southern EU escaping climate change.
77 million; nearly 30% ethnic minority
70 million 65 million 75 million; 24% ethnic minority.
Regional factors SE* dominates finance and service industry. Other regions boost tourism and tech development.
Greater spread of GDP across regions. Renewed urban and rural areas.
London and SE* dominate: most jobs and housing development.
Regional development strongly backed by government.
Most regions are healthy and diverse; fairly equal spread in GDP among them.
SE* domination; central England competitive too.
Urban & rural policy Rigid planning— aesthetic & nature dominates.
Urban regeneration. Local neighbourhoods flourish. Rural areas seen as major ecosystem services providers.
Loss of planning powers. Slow blurring or rural/urban.
State controlled; emphasis on protecting and expanding agriculture and energy production.
Based on equality of resources. Food production just as likely to come from urban area.
Maintenance of countryside preservation (in terms of planning); rise in demand of 1 or 2 bedroom dwellings.
Urban growth & change
Brown-field development. More rental flats.
Emphasis on improving building energy efficiency and urban greening.
Continued urban growth and ribbon development.
Urban development on Brown field; small-holdings and allotments increase but less space for leisure.
Reverse; housing stock diminishes, more green space.
Urban growth and redevelopment. More congestion in towns. Gradual push to better public transport.
Rural & environmental economy
Subsidised agri and forestry provides reasonable income.
Flourishing, based on ecosystem services; IT well established across UK too.
Declines slightly, industrial farming maintains profit.
Slight increase in % of national economy but not equally shared. Env. given backseat.
Slow and low but sustainable and healthy. High levels of equality.
Dwindling. Fewer farmers and larger farms.
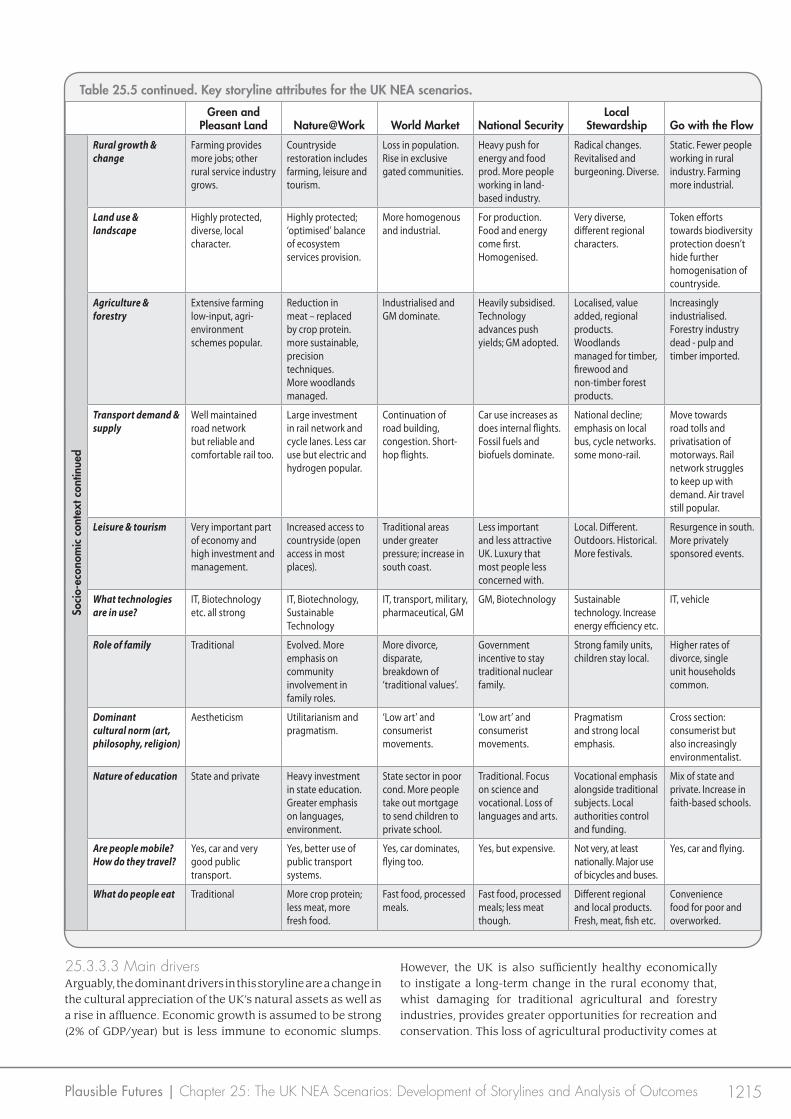
1215Plausible Futures | Chapter 25: The UK NEA Scenarios: Development of Storylines and Analysis of Outcomes
Soci
o-ec
onom
ic c
onte
xt c
ontin
ued
Rural growth & change
Farming provides more jobs; other rural service industry grows.
Countryside restoration includes farming, leisure and tourism.
Loss in population. Rise in exclusive gated communities.
Heavy push for energy and food prod. More people working in land-based industry.
Radical changes. Revitalised and burgeoning. Diverse.
Static. Fewer people working in rural industry. Farming more industrial.
Land use & landscape
Highly protected, diverse, local character.
Highly protected; ‘optimised’ balance of ecosystem services provision.
More homogenous and industrial.
For production. Food and energy come first. Homogenised.
Very diverse, different regional characters.
Token efforts towards biodiversity protection doesn’t hide further homogenisation of countryside.
Agriculture & forestry
Extensive farming low-input, agri-environment schemes popular.
Reduction in meat – replaced by crop protein. more sustainable, precision techniques. More woodlands managed.
Industrialised and GM dominate.
Heavily subsidised. Technology advances push yields; GM adopted.
Localised, value added, regional products. Woodlands managed for timber, firewood and non-timber forest products.
Increasingly industrialised. Forestry industry dead - pulp and timber imported.
Transport demand & supply
Well maintained road network but reliable and comfortable rail too.
Large investment in rail network and cycle lanes. Less car use but electric and hydrogen popular.
Continuation of road building, congestion. Short-hop flights.
Car use increases as does internal flights. Fossil fuels and biofuels dominate.
National decline; emphasis on local bus, cycle networks. some mono-rail.
Move towards road tolls and privatisation of motorways. Rail network struggles to keep up with demand. Air travel still popular.
Leisure & tourism Very important part of economy and high investment and management.
Increased access to countryside (open access in most places).
Traditional areas under greater pressure; increase in south coast.
Less important and less attractive UK. Luxury that most people less concerned with.
Local. Different. Outdoors. Historical. More festivals.
Resurgence in south. More privately sponsored events.
What technologies are in use?
IT, Biotechnology etc. all strong
IT, Biotechnology, Sustainable Technology
IT, transport, military, pharmaceutical, GM
GM, Biotechnology Sustainable technology. Increase energy efficiency etc.
IT, vehicle
Role of family Traditional Evolved. More emphasis on community involvement in family roles.
More divorce, disparate, breakdown of ‘traditional values’.
Government incentive to stay traditional nuclear family.
Strong family units, children stay local.
Higher rates of divorce, single unit households common.
Dominant cultural norm (art, philosophy, religion)
Aestheticism Utilitarianism and pragmatism.
‘Low art’ and consumerist movements.
‘Low art’ and consumerist movements.
Pragmatism and strong local emphasis.
Cross section: consumerist but also increasingly environmentalist.
Nature of education State and private Heavy investment in state education. Greater emphasis on languages, environment.
State sector in poor cond. More people take out mortgage to send children to private school.
Traditional. Focus on science and vocational. Loss of languages and arts.
Vocational emphasis alongside traditional subjects. Local authorities control and funding.
Mix of state and private. Increase in faith-based schools.
Are people mobile? How do they travel?
Yes, car and very good public transport.
Yes, better use of public transport systems.
Yes, car dominates, flying too.
Yes, but expensive. Not very, at least nationally. Major use of bicycles and buses.
Yes, car and flying.
What do people eat Traditional More crop protein; less meat, more fresh food.
Fast food, processed meals.
Fast food, processed meals; less meat though.
Different regional and local products. Fresh, meat, fish etc.
Convenience food for poor and overworked.
Green and Pleasant Land Nature@Work World Market National Security
Local Stewardship Go with the Flow
Table 25.5 continued. Key storyline attributes for the UK NEA scenarios.
25.3.3.3 Main driversArguably, the dominant drivers in this storyline are a change in the cultural appreciation of the UK’s natural assets as well as a rise in affluence. Economic growth is assumed to be strong (2% of GDP/year) but is less immune to economic slumps.
However, the UK is also sufficiently healthy economically to instigate a long-term change in the rural economy that, whist damaging for traditional agricultural and forestry industries, provides greater opportunities for recreation and conservation. This loss of agricultural productivity comes at
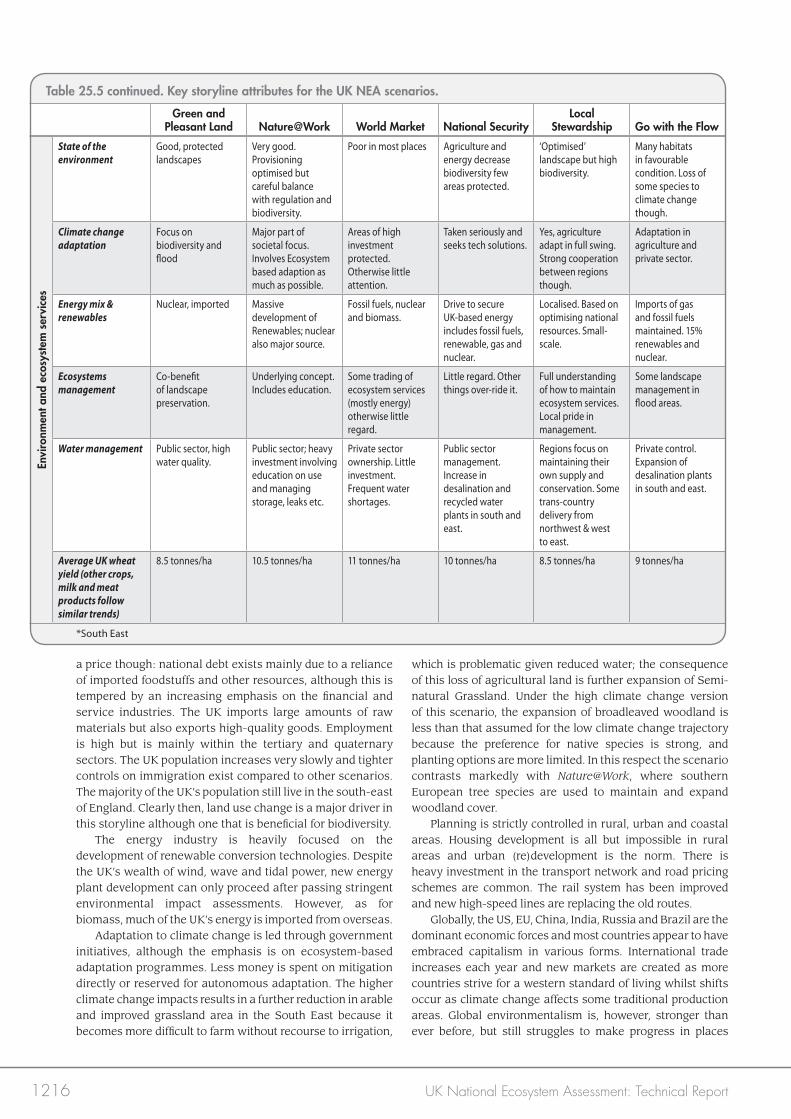
1216 UK National Ecosystem Assessment: Technical Report
Envi
ronm
ent a
nd e
cosy
stem
ser
vice
s
State of the environment
Good, protected landscapes
Very good. Provisioning optimised but careful balance with regulation and biodiversity.
Poor in most places Agriculture and energy decrease biodiversity few areas protected.
‘Optimised’ landscape but high biodiversity.
Many habitats in favourable condition. Loss of some species to climate change though.
Climate change adaptation
Focus on biodiversity and flood
Major part of societal focus. Involves Ecosystem based adaption as much as possible.
Areas of high investment protected. Otherwise little attention.
Taken seriously and seeks tech solutions.
Yes, agriculture adapt in full swing. Strong cooperation between regions though.
Adaptation in agriculture and private sector.
Energy mix & renewables
Nuclear, imported Massive development of Renewables; nuclear also major source.
Fossil fuels, nuclear and biomass.
Drive to secure UK-based energy includes fossil fuels, renewable, gas and nuclear.
Localised. Based on optimising national resources. Small-scale.
Imports of gas and fossil fuels maintained. 15% renewables and nuclear.
Ecosystems management
Co-benefit of landscape preservation.
Underlying concept. Includes education.
Some trading of ecosystem services (mostly energy) otherwise little regard.
Little regard. Other things over-ride it.
Full understanding of how to maintain ecosystem services. Local pride in management.
Some landscape management in flood areas.
Water management Public sector, high water quality.
Public sector; heavy investment involving education on use and managing storage, leaks etc.
Private sector ownership. Little investment. Frequent water shortages.
Public sector management. Increase in desalination and recycled water plants in south and east.
Regions focus on maintaining their own supply and conservation. Some trans-country delivery from northwest & west to east.
Private control. Expansion of desalination plants in south and east.
Average UK wheat yield (other crops, milk and meat products follow similar trends)
8.5 tonnes/ha 10.5 tonnes/ha 11 tonnes/ha 10 tonnes/ha 8.5 tonnes/ha 9 tonnes/ha
Green and Pleasant Land Nature@Work World Market National Security
Local Stewardship Go with the Flow
Table 25.5 continued. Key storyline attributes for the UK NEA scenarios.
a price though: national debt exists mainly due to a reliance of imported foodstuffs and other resources, although this is tempered by an increasing emphasis on the financial and service industries. The UK imports large amounts of raw materials but also exports high-quality goods. Employment is high but is mainly within the tertiary and quaternary sectors. The UK population increases very slowly and tighter controls on immigration exist compared to other scenarios. The majority of the UK’s population still live in the south-east of England. Clearly then, land use change is a major driver in this storyline although one that is beneficial for biodiversity. The energy industry is heavily focused on the development of renewable conversion technologies. Despite the UK’s wealth of wind, wave and tidal power, new energy plant development can only proceed after passing stringent environmental impact assessments. However, as for biomass, much of the UK’s energy is imported from overseas. Adaptation to climate change is led through government initiatives, although the emphasis is on ecosystem-based adaptation programmes. Less money is spent on mitigation directly or reserved for autonomous adaptation. The higher climate change impacts results in a further reduction in arable and improved grassland area in the South East because it becomes more difficult to farm without recourse to irrigation,
which is problematic given reduced water; the consequence of this loss of agricultural land is further expansion of Semi-natural Grassland. Under the high climate change version of this scenario, the expansion of broadleaved woodland is less than that assumed for the low climate change trajectory because the preference for native species is strong, and planting options are more limited. In this respect the scenario contrasts markedly with Nature@Work, where southern European tree species are used to maintain and expand woodland cover. Planning is strictly controlled in rural, urban and coastal areas. Housing development is all but impossible in rural areas and urban (re)development is the norm. There is heavy investment in the transport network and road pricing schemes are common. The rail system has been improved and new high-speed lines are replacing the old routes. Globally, the US, EU, China, India, Russia and Brazil are the dominant economic forces and most countries appear to have embraced capitalism in various forms. International trade increases each year and new markets are created as more countries strive for a western standard of living whilst shifts occur as climate change affects some traditional production areas. Global environmentalism is, however, stronger than ever before, but still struggles to make progress in places
*South East
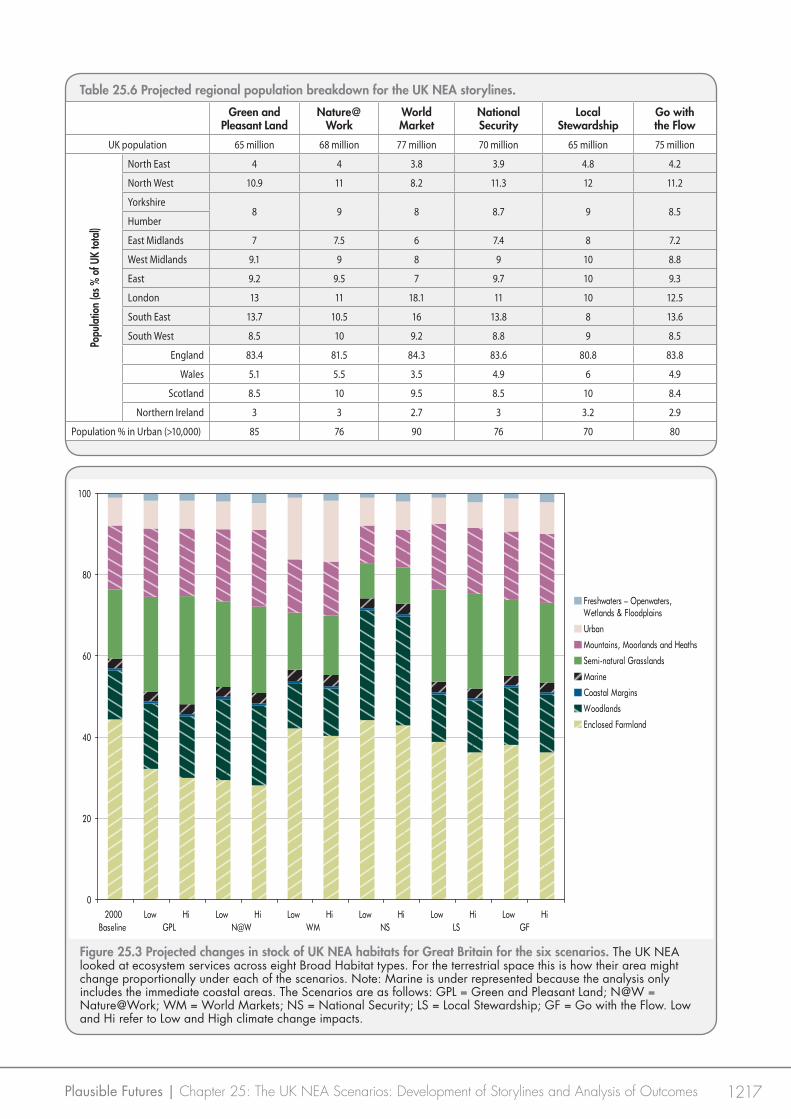
1217Plausible Futures | Chapter 25: The UK NEA Scenarios: Development of Storylines and Analysis of Outcomes
Table 25.6 Projected regional population breakdown for the UK NEA storylines.
Green and Pleasant Land
Nature@Work
World Market
National Security
Local Stewardship
Go with the Flow
UK population 65 million 68 million 77 million 70 million 65 million 75 million
Popu
latio
n (a
s % o
f UK
tota
l)
North East 4 4 3.8 3.9 4.8 4.2
North West 10.9 11 8.2 11.3 12 11.2
Yorkshire8 9 8 8.7 9 8.5
Humber
East Midlands 7 7.5 6 7.4 8 7.2
West Midlands 9.1 9 8 9 10 8.8
East 9.2 9.5 7 9.7 10 9.3
London 13 11 18.1 11 10 12.5
South East 13.7 10.5 16 13.8 8 13.6
South West 8.5 10 9.2 8.8 9 8.5
England 83.4 81.5 84.3 83.6 80.8 83.8
Wales 5.1 5.5 3.5 4.9 6 4.9
Scotland 8.5 10 9.5 8.5 10 8.4
Northern Ireland 3 3 2.7 3 3.2 2.9
Population % in Urban (>10,000) 85 76 90 76 70 80
Figure 25.3 Projected changes in stock of UK NEA habitats for Great Britain for the six scenarios. The UK NEA looked at ecosystem services across eight Broad Habitat types. For the terrestrial space this is how their area might change proportionally under each of the scenarios. Note: Marine is under represented because the analysis only includes the immediate coastal areas. The Scenarios are as follows: GPL = Green and Pleasant Land; N@W = Nature@Work; WM = World Markets; NS = National Security; LS = Local Stewardship; GF = Go with the Flow. Low and Hi refer to Low and High climate change impacts.
0
20
40
60
80
100
2000Baseline
LowGPL
Hi LowN@W
Hi LowWM
Hi LowNS
Hi LowLS
Hi LowGF
Hi
Freshwaters – Openwaters, Wetlands & Floodplains
Urban
Mountains, Moorlands and Heaths
Semi-natural Grasslands
Marine
Coastal Margins
Woodlands
Enclosed Farmland
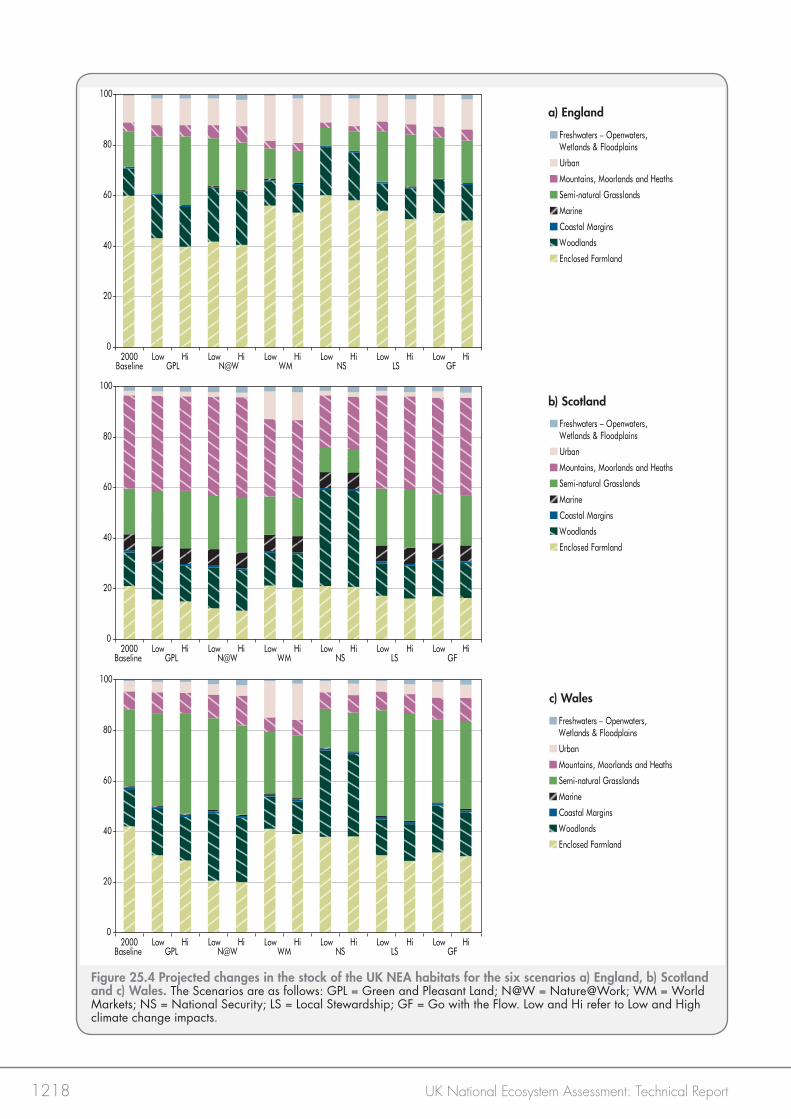
1218 UK National Ecosystem Assessment: Technical Report
Figure 25.4 Projected changes in the stock of the UK NEA habitats for the six scenarios a) England, b) Scotland and c) Wales. The Scenarios are as follows: GPL = Green and Pleasant Land; N@W = Nature@Work; WM = World Markets; NS = National Security; LS = Local Stewardship; GF = Go with the Flow. Low and Hi refer to Low and High climate change impacts.
0
20
40
60
80
100
2000Baseline
LowGPL
Hi LowN@W
Hi LowWM
Hi LowNS
Hi LowLS
Hi LowGF
Hi
0
20
40
60
80
100
2000Baseline
LowGPL
Hi LowN@W
Hi LowWM
Hi LowNS
Hi LowLS
Hi LowGF
Hi
0
20
40
60
80
100
2000Baseline
LowGPL
Hi LowN@W
Hi LowWM
Hi LowNS
Hi LowLS
Hi LowGF
Hi
a) England
c) Wales
b) Scotland
0
20
40
60
80
100
2000Baseline
LowGPL
Hi LowN@W
Hi LowWM
Hi LowNS
Hi LowLS
Hi LowGF
Hi
Freshwaters – Openwaters, Wetlands & Floodplains
Urban
Mountains, Moorlands and Heaths
Semi-natural Grasslands
Marine
Coastal Margins
Woodlands
Enclosed Farmland
0
20
40
60
80
100
2000Baseline
LowGPL
Hi LowN@W
Hi LowWM
Hi LowNS
Hi LowLS
Hi LowGF
Hi
Freshwaters – Openwaters, Wetlands & Floodplains
Urban
Mountains, Moorlands and Heaths
Semi-natural Grasslands
Marine
Coastal Margins
Woodlands
Enclosed Farmland
0
20
40
60
80
100
2000Baseline
LowGPL
Hi LowN@W
Hi LowWM
Hi LowNS
Hi LowLS
Hi LowGF
Hi
Freshwaters – Openwaters, Wetlands & Floodplains
Urban
Mountains, Moorlands and Heaths
Semi-natural Grasslands
Marine
Coastal Margins
Woodlands
Enclosed Farmland
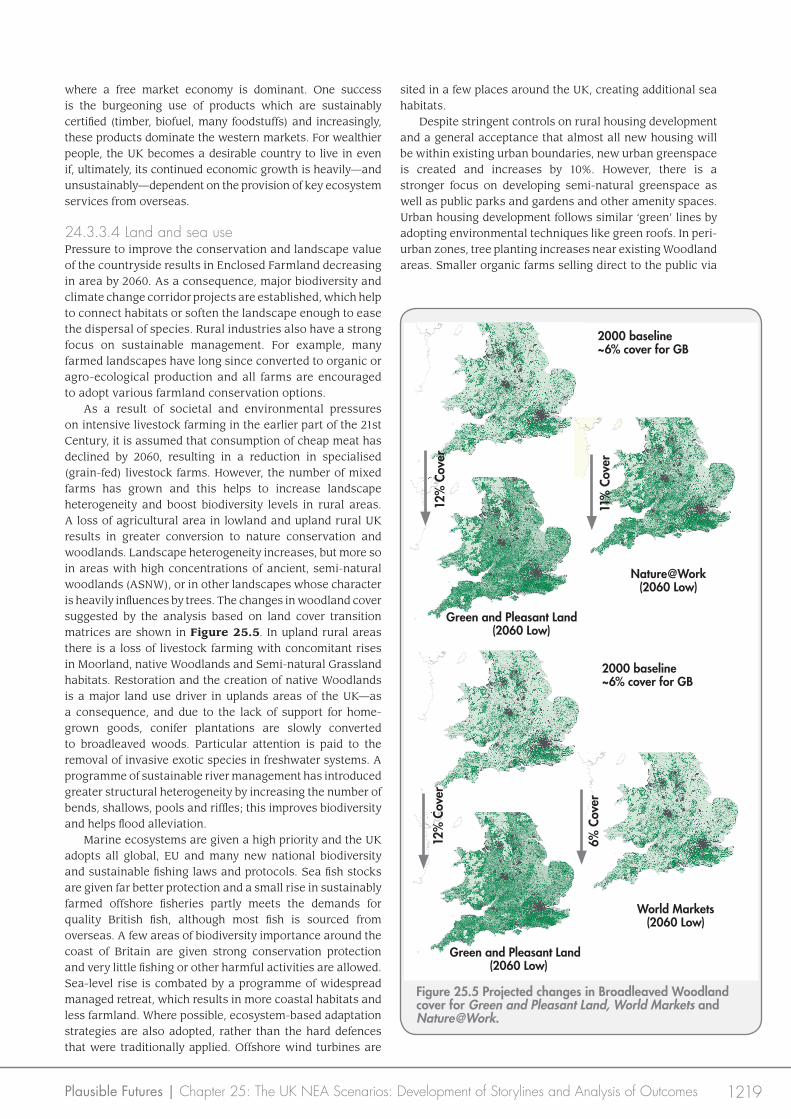
1219Plausible Futures | Chapter 25: The UK NEA Scenarios: Development of Storylines and Analysis of Outcomes
Change in Broadleaved woodland coverBL_Baseline
Change in Broadleaved woodland coverBL_Baseline
Change in Broadleaved woodland coverBL_Baseline
Change in Broadleaved woodland coverBL_GPLLow
Change in Broadleaved woodland coverBL_NWLow
where a free market economy is dominant. One success is the burgeoning use of products which are sustainably certified (timber, biofuel, many foodstuffs) and increasingly, these products dominate the western markets. For wealthier people, the UK becomes a desirable country to live in even if, ultimately, its continued economic growth is heavily—and unsustainably—dependent on the provision of key ecosystem services from overseas.
24.3.3.4 Land and sea usePressure to improve the conservation and landscape value of the countryside results in Enclosed Farmland decreasing in area by 2060. As a consequence, major biodiversity and climate change corridor projects are established, which help to connect habitats or soften the landscape enough to ease the dispersal of species. Rural industries also have a strong focus on sustainable management. For example, many farmed landscapes have long since converted to organic or agro-ecological production and all farms are encouraged to adopt various farmland conservation options. As a result of societal and environmental pressures on intensive livestock farming in the earlier part of the 21st Century, it is assumed that consumption of cheap meat has declined by 2060, resulting in a reduction in specialised (grain-fed) livestock farms. However, the number of mixed farms has grown and this helps to increase landscape heterogeneity and boost biodiversity levels in rural areas. A loss of agricultural area in lowland and upland rural UK results in greater conversion to nature conservation and woodlands. Landscape heterogeneity increases, but more so in areas with high concentrations of ancient, semi-natural woodlands (ASNW), or in other landscapes whose character is heavily influences by trees. The changes in woodland cover suggested by the analysis based on land cover transition matrices are shown in Figure 25.5. In upland rural areas there is a loss of livestock farming with concomitant rises in Moorland, native Woodlands and Semi-natural Grassland habitats. Restoration and the creation of native Woodlands is a major land use driver in uplands areas of the UK—as a consequence, and due to the lack of support for home-grown goods, conifer plantations are slowly converted to broadleaved woods. Particular attention is paid to the removal of invasive exotic species in freshwater systems. A programme of sustainable river management has introduced greater structural heterogeneity by increasing the number of bends, shallows, pools and riffles; this improves biodiversity and helps flood alleviation. Marine ecosystems are given a high priority and the UK adopts all global, EU and many new national biodiversity and sustainable fishing laws and protocols. Sea fish stocks are given far better protection and a small rise in sustainably farmed offshore fisheries partly meets the demands for quality British fish, although most fish is sourced from overseas. A few areas of biodiversity importance around the coast of Britain are given strong conservation protection and very little fishing or other harmful activities are allowed. Sea-level rise is combated by a programme of widespread managed retreat, which results in more coastal habitats and less farmland. Where possible, ecosystem-based adaptation strategies are also adopted, rather than the hard defences that were traditionally applied. Offshore wind turbines are
sited in a few places around the UK, creating additional sea habitats. Despite stringent controls on rural housing development and a general acceptance that almost all new housing will be within existing urban boundaries, new urban greenspace is created and increases by 10%. However, there is a stronger focus on developing semi-natural greenspace as well as public parks and gardens and other amenity spaces. Urban housing development follows similar ‘green’ lines by adopting environmental techniques like green roofs. In peri-urban zones, tree planting increases near existing Woodland areas. Smaller organic farms selling direct to the public via
Figure 25.5 Projected changes in Broadleaved Woodland cover for Green and Pleasant Land, World Markets and Nature@Work.
Change in Broadleaved woodland coverBL_GPLLow
12%
Cov
er
11%
Cov
er6%
Cov
er
12%
Cov
er
2000 baseline~6% cover for GB
Green and Pleasant Land(2060 Low)
2000 baseline~6% cover for GB
Green and Pleasant Land(2060 Low)
World Markets(2060 Low)
Nature@Work(2060 Low)
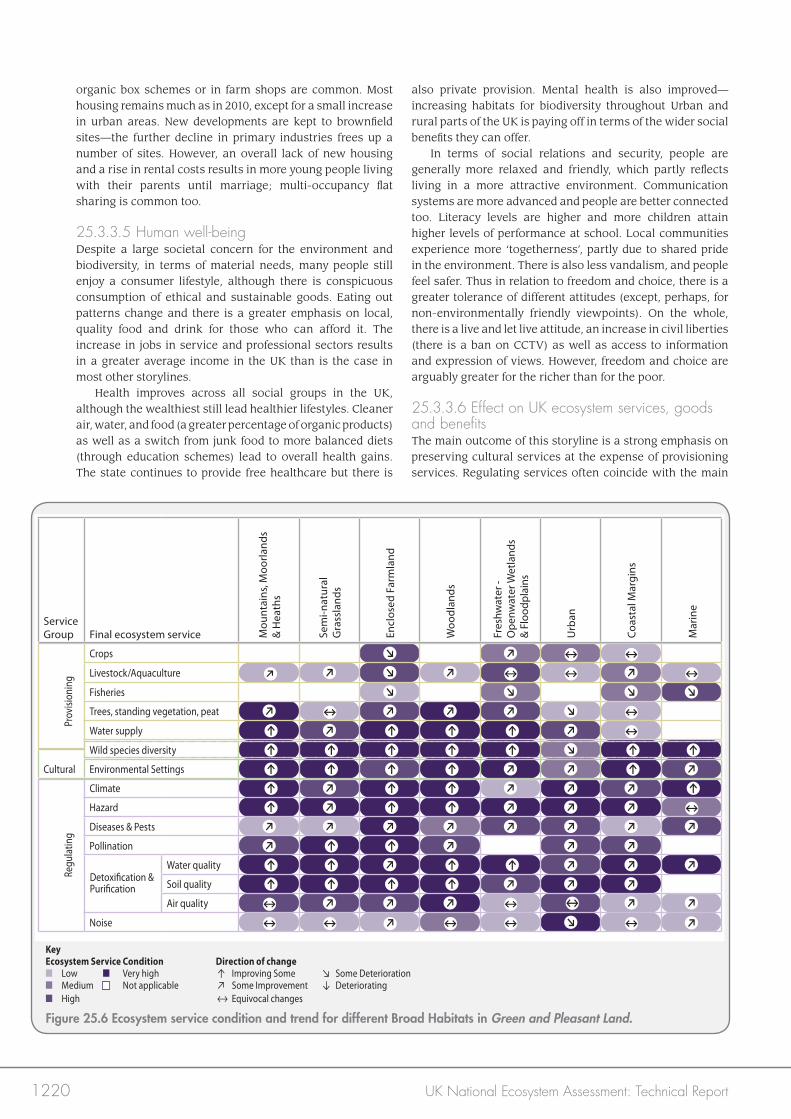
1220 UK National Ecosystem Assessment: Technical Report
organic box schemes or in farm shops are common. Most housing remains much as in 2010, except for a small increase in urban areas. New developments are kept to brownfield sites—the further decline in primary industries frees up a number of sites. However, an overall lack of new housing and a rise in rental costs results in more young people living with their parents until marriage; multi-occupancy flat sharing is common too.
25.3.3.5 Human well-beingDespite a large societal concern for the environment and biodiversity, in terms of material needs, many people still enjoy a consumer lifestyle, although there is conspicuous consumption of ethical and sustainable goods. Eating out patterns change and there is a greater emphasis on local, quality food and drink for those who can afford it. The increase in jobs in service and professional sectors results in a greater average income in the UK than is the case in most other storylines. Health improves across all social groups in the UK, although the wealthiest still lead healthier lifestyles. Cleaner air, water, and food (a greater percentage of organic products) as well as a switch from junk food to more balanced diets (through education schemes) lead to overall health gains. The state continues to provide free healthcare but there is
also private provision. Mental health is also improved—increasing habitats for biodiversity throughout Urban and rural parts of the UK is paying off in terms of the wider social benefits they can offer. In terms of social relations and security, people are generally more relaxed and friendly, which partly reflects living in a more attractive environment. Communication systems are more advanced and people are better connected too. Literacy levels are higher and more children attain higher levels of performance at school. Local communities experience more ‘togetherness’, partly due to shared pride in the environment. There is also less vandalism, and people feel safer. Thus in relation to freedom and choice, there is a greater tolerance of different attitudes (except, perhaps, for non-environmentally friendly viewpoints). On the whole, there is a live and let live attitude, an increase in civil liberties (there is a ban on CCTV) as well as access to information and expression of views. However, freedom and choice are arguably greater for the richer than for the poor.
25.3.3.6 Effect on UK ecosystem services, goods and benefitsThe main outcome of this storyline is a strong emphasis on preserving cultural services at the expense of provisioning services. Regulating services often coincide with the main
Figure 25.6 Ecosystem service condition and trend for different Broad Habitats in Green and Pleasant Land.
Detoxi�cation &Puri�cation
Service Group Final ecosystem service M
ount
ains
, Moo
rland
s &
Hea
ths
Sem
i-nat
ural
G
rass
land
s
Encl
osed
Far
mla
nd
Woo
dlan
ds
Fres
hwat
er -
Ope
nwat
er W
etla
nds
& Fl
oodp
lain
s
Urb
an
Coas
tal M
argi
ns
Mar
ine
Prov
ision
ing
Crops
Livestock/Aquaculture
Fisheries
Trees, standing vegetation, peat
Water supply
Wild species diversity
Cultural Environmental Settings
Regu
latin
g
Climate
Hazard
Diseases & Pests
Pollination
Water quality
Soil quality
Air quality
Noise
↘ ↗ ↔ ↔
↗ ↗ ↘ ↗ ↔ ↔ ↗ ↔
↘ ↘ ↘ ↘
↗ ↔ ↗ ↗ ↗ ↘ ↔
↑ ↗ ↑ ↑ ↑ ↗ ↔
↑ ↑ ↑ ↑ ↑ ↘ ↑ ↑
↑ ↑ ↑ ↑ ↗ ↗ ↑ ↗
↑ ↗ ↑ ↑ ↗ ↗ ↗ ↑
↑ ↗ ↑ ↑ ↗ ↗ ↗ ↔
↗ ↗ ↗ ↗ ↗ ↗ ↗ ↗
↗ ↑ ↑ ↗ ↗ ↗
↑ ↑ ↗ ↑ ↑ ↗ ↗ ↗
↑ ↑ ↑ ↑ ↗ ↗ ↗
↔ ↗ ↗ ↗ ↔ ↔ ↗ ↗
↗ ↔ ↔ ↗ ↔ ↔ ↘ ↔
KeyEcosystem Service Condition Direction of change■ Low ■ Very high ↑ Improving Some ↘ Some Deterioration■ Medium ■ Not applicable ↗ Some Improvement ↓ Deteriorating■ High ↔ Equivocal changes
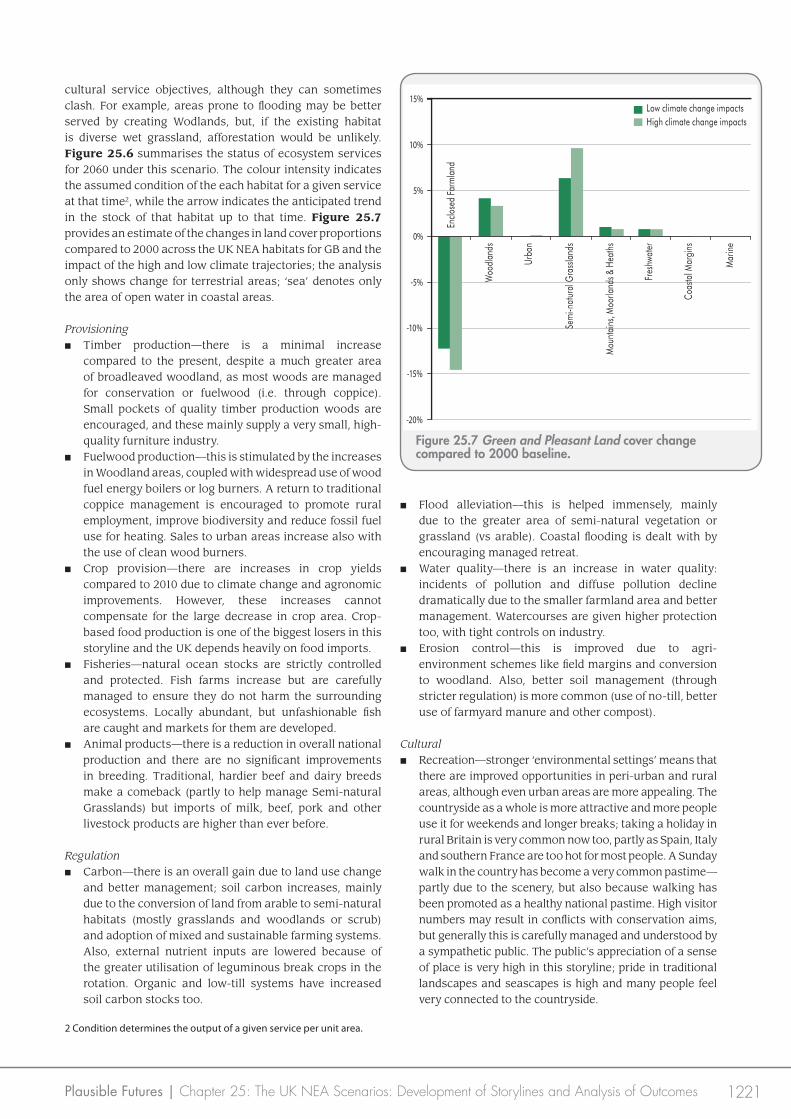
1221Plausible Futures | Chapter 25: The UK NEA Scenarios: Development of Storylines and Analysis of Outcomes
cultural service objectives, although they can sometimes clash. For example, areas prone to flooding may be better served by creating Wodlands, but, if the existing habitat is diverse wet grassland, afforestation would be unlikely. Figure 25.6 summarises the status of ecosystem services for 2060 under this scenario. The colour intensity indicates the assumed condition of the each habitat for a given service at that time2, while the arrow indicates the anticipated trend in the stock of that habitat up to that time. Figure 25.7 provides an estimate of the changes in land cover proportions compared to 2000 across the UK NEA habitats for GB and the impact of the high and low climate trajectories; the analysis only shows change for terrestrial areas; ‘sea’ denotes only the area of open water in coastal areas.
Provisioning■ Timber production—there is a minimal increase
compared to the present, despite a much greater area of broadleaved woodland, as most woods are managed for conservation or fuelwood (i.e. through coppice). Small pockets of quality timber production woods are encouraged, and these mainly supply a very small, high-quality furniture industry.
■ Fuelwood production—this is stimulated by the increases in Woodland areas, coupled with widespread use of wood fuel energy boilers or log burners. A return to traditional coppice management is encouraged to promote rural employment, improve biodiversity and reduce fossil fuel use for heating. Sales to urban areas increase also with the use of clean wood burners.
■ Crop provision—there are increases in crop yields compared to 2010 due to climate change and agronomic improvements. However, these increases cannot compensate for the large decrease in crop area. Crop-based food production is one of the biggest losers in this storyline and the UK depends heavily on food imports.
■ Fisheries—natural ocean stocks are strictly controlled and protected. Fish farms increase but are carefully managed to ensure they do not harm the surrounding ecosystems. Locally abundant, but unfashionable fish are caught and markets for them are developed.
■ Animal products—there is a reduction in overall national production and there are no significant improvements in breeding. Traditional, hardier beef and dairy breeds make a comeback (partly to help manage Semi-natural Grasslands) but imports of milk, beef, pork and other livestock products are higher than ever before.
Regulation■ Carbon—there is an overall gain due to land use change
and better management; soil carbon increases, mainly due to the conversion of land from arable to semi-natural habitats (mostly grasslands and woodlands or scrub) and adoption of mixed and sustainable farming systems. Also, external nutrient inputs are lowered because of the greater utilisation of leguminous break crops in the rotation. Organic and low-till systems have increased soil carbon stocks too.
2 Condition determines the output of a given service per unit area.
Figure 25.7 Green and Pleasant Land cover change compared to 2000 baseline.
0%
5%
10%
15%
-5%
-10%
-15%
Urba
n
Sem
i-nat
ural
Gra
ssla
nds
Mou
ntai
ns, M
oorla
nds &
Hea
ths
Fres
hwat
er
Coas
tal M
argi
ns
Mar
ine
-20%
Enclo
sed
Farm
land
Woo
dlan
ds
Low climate change impactsHigh climate change impacts
■ Flood alleviation—this is helped immensely, mainly due to the greater area of semi-natural vegetation or grassland (vs arable). Coastal flooding is dealt with by encouraging managed retreat.
■ Water quality—there is an increase in water quality: incidents of pollution and diffuse pollution decline dramatically due to the smaller farmland area and better management. Watercourses are given higher protection too, with tight controls on industry.
■ Erosion control—this is improved due to agri-environment schemes like field margins and conversion to woodland. Also, better soil management (through stricter regulation) is more common (use of no-till, better use of farmyard manure and other compost).
Cultural■ Recreation—stronger ‘environmental settings’ means that
there are improved opportunities in peri-urban and rural areas, although even urban areas are more appealing. The countryside as a whole is more attractive and more people use it for weekends and longer breaks; taking a holiday in rural Britain is very common now too, partly as Spain, Italy and southern France are too hot for most people. A Sunday walk in the country has become a very common pastime—partly due to the scenery, but also because walking has been promoted as a healthy national pastime. High visitor numbers may result in conflicts with conservation aims, but generally this is carefully managed and understood by a sympathetic public. The public’s appreciation of a sense of place is very high in this storyline; pride in traditional landscapes and seascapes is high and many people feel very connected to the countryside.
1222 UK National Ecosystem Assessment: Technical Report
■ Historical—a strong shift in cultural appreciation of local history is developed and many historical and archaeological monuments, buildings, etc. are conserved. This historical interest even extends to long-extinct species (e.g. beavers) and reintroduction schemes are encouraged and well supported.
25.3.3.7 Ecosystem service trade-offs and changes since todayThe main gains in ecosystem service provision offered by this scenario compared to today are in the rise in the output of cultural services, driven by the availability of a more preserved, accessible and scenic countryside (stronger environmental settings) and of regulating services (Figure 25.6). The prioritisation of cultural services in this storyline does have a clear effect in terms of reducing the area devoted to provisioning services, particularly food from Enclosed Farmlands (Figure 25.7). Despite some gains in improving crop and livestock yields (and hence productivity per unit area), loss of agricultural area reduces overall UK productivity. To counter this, food supply in the UK becomes more dependent on imports from overseas. The shifts to Semi-natural Grassland, Mountains, Moorlands and Heaths and broadleaved Woodland brings with it benefits for many regulating services, including maintaining soil quality, flood alleviation, air quality, water quality, etc. These changes also help to ameliorate the impacts of climate change, although the higher impact scenario starts to reduce some regulating service provision by affecting Woodland habitats in the south (e.g. climate and hazard regulation). In common with all the scenarios, it is difficult to estimate how the overall balance in service output would change, however, because we lack any clear indication of how the output of services varies per unit area of each habitat type, either under present conditions or in the future. The implications of this knowledge gap for the interpretation of the scenario outcomes generally will be considered in Section 25.4.
25.3.4 Nature@Work
25.3.4.1 OriginThis scenario arose from the need, identified in the consultation work, for a green storyline that relates to increased interest in ecosystem services and their management as a model for sustainability. It attempts to outline a future where balancing trade-offs in delivering ecosystem services are one of the main challenges in society, and the overall goal is to create a multifunctional landscape. As the title of this scenario suggests, people have a utilitarian outlook on nature. They value it because of what it provides or does. Many of the focal questions asked were about the trade-offs that would have to be made with ecosystem services, and this storyline attempts to provide a pragmatic approach to balancing multiple aims; there is no attempt to prioritise any one ecosystem service group over another.
25.3.4.2 RationaleThe belief that the promotion of ecosystem services through the creation of multifunctional landscapes is essential for maintaining the quality of life in the UK is now widely
accepted. This has resulted from a heavily promoted education programme, and a growing awareness in society that a more sustainable UK is a necessity. Society accepts and understands that some trade-offs have to be made and as a result, becomes more environmentally aware and sophisticated. Habitat restoration and creation is seen as an important component of this campaign, but the explicit conservation of species is sometimes overruled by a ‘greater’ ecosystem service benefit; this sometimes results in habitat conversion (e.g. Semi-natural Grassland to Woodland). Climate change is accepted as a very important driver of change so, as well as carbon mitigation, an important focus is the enhancement of society’s resilience to climate change through ‘ecosystem-based adaptation’. Modern technology is used were appropriate, though, and biotechnology is adopted where it can be shown to enhance ecosystem services. This includes the use of drought-tolerant crops to maintain production and reduce soil erosion. This storyline is a heavily ‘top-down’ in terms of how ecosystems are managed. There is policy prescription through UK and EU legislation (ecosystem services have influenced legislation in many different sectors), and strong incentives via a range of environmental schemes (not just directed at farmers). Education has been a major contributor to the shift towards sustainability and environment is a central part of the curricula in all schools. Backing for maintaining the balance between different ecosystem services is provided by regional planning teams made up of experts from different fields—this feeds into a national ecosystem services accounting system and efforts are made to ensure a balance at the national level. ‘Balanced service provision’ is a key feature of this scenario, and the management of ‘bundles’ of ecosystem services is a result of careful examination of the trade-offs through scientific review: this entails an examination of the needs at local, landscape and regional levels. Areas with a strong potential to produce high-yield crops sustainably are maintained and kept in arable production, for example. Areas known to be at high flood risk would have mitigation plans instigated (e.g. conversion of arable or intensive grazing to woodland).
25.3.4.3 Main driversThe population has continued to age, but numbers have increased steadily through immigration, which is one of the main drivers in this scenario. Economic growth is strong (3% of GDP/year), sustainable and increasingly based on the ‘green economy’. National debt is low (but exists) and the balance of trade is slightly negative (despite an emphasis on more sustainable consumerism), due to a continuation of some food imports. This scenario is one in which science and technology are embraced, and in which most of society are appreciative of public funding in these sectors. There is a drive to develop technologies that solve environmental problems, and this includes a widespread adoption of many different forms of biotechnology (e.g. to deal with pathogens, drought or flooding, or to enhance salt tolerance in crops). The national government has introduced ecosystem services as the dominant policy paradigm, which is backed up by a fully integrated national ‘ecosystem service account’.
1223Plausible Futures | Chapter 25: The UK NEA Scenarios: Development of Storylines and Analysis of Outcomes
As in other storylines, land cover change is an important driver of ecosystem service output; in this vision, semi-natural and wooded land covers generally increase at the expense of improved grassland. This is a radical and important change to the UK and is a result of a slow change in societal attitudes towards meat production (rather than meat consumption); UK meat becomes more of a luxury and dependence on crop-based protein is far higher than ever before (although cheaper meat is still imported). The energy industry is encouraged to develop renewable conversion technologies as well as nuclear power. However, despite the UK’s wealth of wind, wave and tidal power, new energy plant developments only go ahead if their impact on ecosystems is minimal, resulting in a greater number of small-scale plants; domestic energy systems become very popular. The national response to climate change is a well-funded programme of carbon mitigation schemes alongside planned adaptation programmes focusing on increasing the resilience of communities so that they are better able to adapt autonomously. Invasive species are a constant threat to ecosystem service delivery throughout the UK, but a huge and well-funded national programme to screen and manage them has been successful. Of all the storylines, this is the best adapted to climate change, and differences in proportions of land cover between the low and high impact scenarios are marginal. This scenario sits into a world where the ‘business as usual’ has evolved into ‘green business as usual’. Global environmentalism is stronger than ever before. Sustainable development is finally beginning to mean something tangible to people. The US, EU, China, Russia, India and Brazil are dominant economic forces but many other countries with the capacity to export vitally important ecosystem services are gaining importance. Global trade increases each year and includes a growing share of trade in ecosystem services.
25.3.4.4 Land and sea useFarmers are paid to provide services based on locally determined market prices. Soil erosion, water storage, water quality improvement, flood alleviation, carbon sequestration, and recreation, as well as food and fuel provision, are all targeted throughout the country. As meat production decreases, the nation’s protein requirements are easily met by an increase in pulse production (and other protein crops such as quinoa, hempseed and buckwheat); large areas of grassland are converted to biofuels or Woodland, resulting in a higher percentage of Woodland in the north and western parts of the country where beef, sheep and dairy production previously dominated. Floodplain woods are encouraged in the main river landscapes in the UK (e.g. the Thames, Severn, and Trent). However, ecosystem service provision is ubiquitous throughout the UK, so most regions see an increase in Woodland area (to meet carbon mitigation, recreation and shade needs). Organic farming, as well as no-till cultivation, is widespread, as soil management is very important. Lowland rural farmed areas become slightly more heterogeneous; Woodland area increases and there is some increase in mixed farming in eastern counties. Many areas with high concentrations of ancient and semi-natural
Woodland or with major river networks also increase Woodland cover. Woodlands are seen as a potential solution to many problems and the conservation of existing ancient and semi-natural woodlands is maintained; mixed-plantation woods are almost equally important though, and home-grown timber production is encouraged (although clear-cut systems are rare and more sophisticated shelterwood or selection systems are common). New Woodland creation is also heavily supported, especially near to where people live. Some localised woody biomass (short rotation coppice) production is found on large estates wanting to mechanise as much as possible (large harvesters are used as opposed to men with chainsaws) and similar projects crop up where villages and towns have started community heat and power generation systems. New floodplain woodlands utilise willow, alder, birch and poplar, but also ash and oak. Livestock farms in the west and north diversify and reduce their beef and sheep enterprises. More land is used for recreation as well, and many large, privately owned estates are opened up for free public access. Most Semi-natural Grasslands are protected from Woodland or Enclosed Farmland encroachment but they are also utilised for service provision. This includes traditional uses such as grazing land for sheep and beef breeds, but increasingly, payments for recreation and education services are seen. Areas of traditional species-rich grasslands are restored (e.g. chalk grasslands), often taking poor quality arable land out of production (this is a good example of optimising ecosystem services and providing synergies). Wet grasslands are conserved for floodplain health; in mountain regions, wind farms are often deemed more important than other land uses. The conservation and protection of freshwater is one of the highest priority aims. In the case of farming, this involves measures such as 25 m buffer strips bordering rivers to protect them from any potentially damaging operations, including organic farming systems. Coastal Margins, in particular, are protected from development, and in certain areas, coastal erosion and sea level rise are allowed to progress through a system of managed retreat. Marine and Coastal Margin habitats are given greater conservation protection through a number of European and British laws. However, as in terrestrial ecosystems, despite seeking synergies, there are inevitably some trade-offs between biodiversity, food provision and energy. The UK’s marine energy resources are particularly valuable and are developed considerably to the point where some energy is exported. A co-benefit here, though, is an increase in Marine habitats around energy farms as they cease to become fishing grounds, and an additional benefit is the conservation of carbon-rich seabeds. Sustainable fishing is very important, but there is research investment into farmed species to maintain an adequate supply for the UK market (another benefit of increased research and development are marine biotechnology spin-offs). In urban areas there is an emphasis on the role of urban trees, gardens, urban farms and green roofs; urban greenspace increases by nearly 6% and a large percentage of that is in semi-natural habitats. The housing stock stays
1224 UK National Ecosystem Assessment: Technical Report
static, with an emphasis on restoring and upgrading old buildings to improve energy efficiency. Compared to today, a more holistic approach to town planning is taken, which incorporates energy use and transmission, waste removal, transport and dwellings. Many towns have been ‘greened’ so that they become net exporters of some ecosystem services, e.g. water purification. Similarly, urban food production becomes common and takes advantage of allotment and park space as well as roof space. This increase in small market producers, urban farms and forest gardens helps meet the demand for produce with low food miles. The South East still houses the largest proportion of people in the UK, although this is mainly due to a fairly static building construction programme elsewhere. A precondition of this scenario is the implementation of an extensive programme of renewable energy development across the UK to harness wind, sea, solar and biomass resources in the most effective manner. Conflicts between landscape aesthetics and energy are much rarer and most people are more accepting of local wind farms, etc. Nuclear power is also a major provider of energy. Most of the UK sees far greater recreation in rural and urban areas. Urban areas, in particular, have increased greenspace and many cities have seen increases in visitor numbers. Traditionally popular rural areas continue to attract many people (although there is greater use of extended public transport systems to get there), but most rural counties develop recreational activities and consequently boost visitor numbers. The decarbonisation of the road transport system is all but complete. New technologies and improvements in electric vehicle systems mean that air pollution from the internal combustion engine does not plague the towns and cities of the UK. Aviation, shipping and heavy transport now use biofuel, much of which is grown in the UK and the EU. Short-hop air travel has disappeared from the UK (replaced by high-speed rail); short-distance travel is largely undertaken by bicycle, and cycle lane networks are extensive, well maintained and easy to use. In summary, the main land cover changes are a huge decline in Improved Grassland cover, a slight decline in Arable and Horticultural cover and increases in Woodland (broadleaved and conifer), upland (Mountains, Moorlands and Heaths) and Semi-natural Grassland.
25.3.4.5 Human well-beingCompared to 2010, society’s material needs are lower and less frivolous; there is still a strong demand for electrical goods for domestic and leisure purposes and, in most aspects, people are happier with possessions that work well and last longer (but cost more because they are of higher quality). Locally produced items are very important and in many parts of the UK, regional variations in clothing style can be seen. Society in the UK benefits from improved nutrition; cleaner air, water, and food; better access to information about health and medicine; reduced stress; and better mental health. The concept of the green gym takes off and is a common prescription for many people; more importantly, it is seen as a preventative measure and is
heavily promoted. Technological improvements have also advanced surgical techniques and drug development; the UK, US and other EU countries inject considerable funding into a global initiative to developing ‘drugs for all’ that allow even the poorest citizens access to the latest medicines. Bioprospecting for pharmaceuticals is considered a global good for all, and patents are not allowed on drugs derived from natural fauna and flora (funding for development is provided by tax). Society is more secure, mainly due to greater equality and better standards of living for all. People are connected with each other, both within the UK and overseas. Cheap communication systems are universal and high-speed and high-bandwidth internet connection is ubiquitous throughout the urban and rural UK (indeed, a large part of the economy is utterly dependent on it). Tolerance and ‘live and let live’ attitudes are the main credos. Increased political freedom, civil liberties, information flow, movement, expression, and association are values held highly and rarely contravened. All environmental data are available to everyone, to ensure that supplies of ecosystem services are equitable and justifiable. An important part of ecosystem service provision is that flows of ecosystem services go to the poor as well as to the rich.
25.3.4.6 Effect on UK ecosystem services, goods and benefitsThe essence of this storyline is the development of an understanding of how to balance and create synergies between ecosystem services. Inevitably some ecosystem services will become less common ‘luxuries’. Climate change is also important within the environmental agenda and service provision heavily incorporates mitigation and adaptation. Figure 25.8 summarises the status of ecosystem services for 2060 under this scenario. The colour intensity indicates the assumed condition of each habitat for a given service at that time, while the arrow indicates the anticipated trend in the stock of that habitat up to that time. Figure 25.9 provides an estimate of the changes in land cover proportions compared to 2000 across the UK NEA habitats for GB and the impact of the high and low climate trajectories; the analysis only shows change for terrestrial areas; ‘sea’ denotes only the area of open water in coastal areas.
Provisioning■ Timber production—home-grown timber is encouraged
and supported by the public. Everyone wants to live in a house ‘made in Britain’; large plantations (sustainably managed) in the traditional areas (Wales, the Borders) are joined by new Woodland planting in carefully chosen sites in the north of Scotland. Timber from broadleaved Woodlands is also utilised and, more importantly, managed properly, and becomes an increasingly common building material.
■ Fuelwood production—as with Green and Pleasant Land, this increases considerably due to short rotation coppice production as well as conservation coppice woodlands. The area of Woodlands is also much higher than in 2010, helping to meet the nation’s timber requirements.

1225Plausible Futures | Chapter 25: The UK NEA Scenarios: Development of Storylines and Analysis of Outcomes
■ Biofuel production—the quantity of biofuels from cropped land increases considerably to meet energy requirements. However, biofuels are only ever grown on poor quality agricultural land and do not displace high-yielding food crops.
■ Crop production—overall production declines slightly as the cropped area reduces, but technological advances in agronomy and a warmer climate maintain the trend of increasing yields. There is a major switch from meat production to crop protein so that the UK’s supply of protein for human consumption increases.
■ Animal production—meat consumption declines and the super-high yielding dairy and beef breeds of 2010 have almost disappeared to make way for better adapted animals and a focus on flavour, not quantity. Meat and dairy production are still important, but they are focused on quality rather than quantity.
■ Marine production—natural sea and freshwater stocks are strictly protected and only harvested under a sustainable catch regime. The total natural catch is far lower than today’s. Farmed fisheries proliferate (offshore) but follow careful management guidelines so they do not affect natural ecosystems. Energy from the marine environment is hugely important; there are networks of wind farms and the use of wave energy is widespread.
Figure 25.8 Ecosystem service condition and trend for different Broad Habitats in Nature@Work.
Figure 25.9 Nature@Work land cover change compared to 2000 baseline.
0%
5%
10%
-5%
-10%
-15%
Urba
n
Sem
i-nat
ural
Gra
ssla
nds
Mou
ntai
ns, M
oorla
nds &
Hea
ths
Fres
hwat
er
Coas
tal M
argi
ns
Mar
ine
-20%
Enclo
sed
Farm
land
Woo
dlan
ds
Low climate change impactsHigh climate change impacts
Detoxi�cation &Puri�cation
Service Group Final ecosystem service M
ount
ains
, Moo
rland
s &
Hea
ths
Sem
i-nat
ural
G
rass
land
s
Encl
osed
Far
mla
nd
Woo
dlan
ds
Fres
hwat
er -
Ope
nwat
er W
etla
nds
& Fl
oodp
lain
s
Urb
an
Coas
tal M
argi
ns
Mar
ine
Prov
ision
ing
Crops
Livestock/Aquaculture
Fisheries
Trees, standing vegetation, peat
Water supply
Wild species diversity
Cultural Environmental Settings
Regu
latin
g
Climate
Hazard
Diseases & Pests
Pollination
Water quality
Soil quality
Air quality
Noise
↑ ↗
↗ ↗ ↘ ↗ ↗ ↗ ↔ ↗
↗ ↗ ↗ ↗
↗ ↔ ↑ ↑ ↗ ↗ ↗
↑ ↗ ↑ ↗ ↑ ↗ ↔
↑ ↑ ↗ ↑ ↑ ↗ ↑ ↑
↑ ↑ ↑ ↑ ↑ ↗ ↗ ↗
↗ ↗ ↑ ↑ ↑ ↗ ↗ ↑
↑ ↗ ↑ ↑ ↑ ↗ ↑ ↗
↗ ↗ ↗ ↑ ↑ ↗ ↔ ↔
↗ ↑ ↑ ↗ ↔ ↔
↑ ↑ ↑ ↑ ↑ ↗ ↗ ↗
↗ ↗ ↑ ↑ ↗ ↗ ↗
↗ ↗ ↗ ↑ ↗ ↗ ↗ ↗
↔ ↔ ↔ ↔ ↔ ↗ ↔ ↔
KeyEcosystem service condition Direction of change■ Low ■ Very high ↑ Improving Some ↘ Some Deterioration■ Medium ■ Not applicable ↗ Some Improvement ↓ Deteriorating■ High ↔ Equivocal changes
1226 UK National Ecosystem Assessment: Technical Report
■ Wild species diversity—in general, biodiversity conservation is boosted in this storyline and many species’ populations are in better health than in 2010, despite climate change. Conflicts between biodiversity and ecosystem service provision will only occur if any given species has a healthy population outside the target area.
Regulation■ Carbon—there are overall gains in lowland areas
previously dominated by arable production; soil carbon increases mainly due to the conversion of land from arable to semi-natural habitats (mostly grasslands and woodlands or scrub) and adoption of mixed farming systems. Also, external nutrient inputs are lowered because of the greater utilisation of leguminous break crops in the rotation. Organic and low-till systems have increased soil carbon stocks dramatically. Upland areas also improve above and below-ground carbon through better management and habitat restoration.
■ Flood alleviation—the restoration and creation of floodplain Woodlands becomes a major factor in reducing flood impacts throughout the UK. This involves conversion of vulnerable areas from intensive arable or improved grassland use to appropriate alternatives (often Woodlands but also Semi-natural Grassland).
■ Erosion control—problem areas throughout the UK are targeted and controlled by implementing new management regimes (e.g. change to woodland, grassland or no-till cultivation). This is one of the main success stories of this scenario.
■ Water quality—this is vastly improved everywhere. Polluters are heavily fined and so rarely make mistakes, while sustainable land management technologies have allowed farmers to grow crops with minimal risk of pollution from fertiliser and pesticides.
Cultural■ Recreation—outdoor activities become more popular
in urban, peri-urban and rural areas, as environmental settings are strengthened generally. The countryside as a whole is more attractive and more people use it for weekend and longer breaks. A Sunday walk in the country has become a very common form of recreation, partly due to the scenery, but also because walking has been promoted as a healthy national pastime. Some key areas have been nationalised in order to maintain them for public use. Urban regeneration has transformed many cities, making them more attractive places to live in and to visit. In contrast to Green and Pleasant Land, society in this storyline does not have quite the same romantic ideals and ‘sense of place’ towards the countryside, although it is still a very important aspect of human well-being.
25.3.4.7 Ecosystem service trade-offs and changes since todayThe goal in this storyline is to balance and provide synergies between ecosystem services within a region and, indeed, nationally (Figure 25.8, Figure 25.9). Maintenance and promotion of multifunctionality is the key; comparing
Figure 25.8 with Figure 25.5, for example, suggests that there is a more even pattern of improvement across all habitats and services. In terms of projected land cover changes, there is also a more even gain of area across the Woodlands, Semi-natural Grasslands, Mountains, Moorlands and Heaths, and Freshwaters—Openwaters, Wetlands and Floodplains categories for Nature@Work compared to Green and Pleasant Land. Inevitably, in some areas certain ecosystem services will be reduced in favour of others, but the emphasis is on achieving synergies and where possible no net loss. Within the Enclosed Farmland landscape there will probably be a greater loss of improved pasture to Semi-natural Grasslands under this scenario compared to Green and Pleasant Land. Perhaps one crucial element to the goal represented in the Nature@Work scenario is that although biodiversity is valued for its intrinsic worth, this can sometimes clash with the an ecosystem service value. For example, in some parts of the South East, climate change may slowly change the structural composition of Woodlands, even to the point that they become more scrub than woodland. In certain circumstances, tree species from southern Europe that are drought tolerant may be used to maintain a woodland’s structure and function. This storyline, along with Local Stewardship, shows the starkest difference with the current suite of ecosystem service provision in the UK. As the dominant paradigm in society and government policy, the goal of improving provisioning, regulating and cultural services is taken very seriously and largely succeeds in improving them all. Climate change mitigation and adaptation is a high priority policy (and societal) goal and many habitats are managed to cope with extremes of temperature and precipitation (both wetter winters and drier summers). In areas of particular vulnerability to climate change impacts (e.g. drought in the South East, sea-level rise in low lying coastal areas), the appropriate response to optimise ecosystem service provision is taken (e.g. the adoption of drought- and heat-tolerant crops or coastal retreat schemes). However, as with the discussion of Green and Pleasant Land (and in common with all the scenarios), it is difficult to estimate how the overall balance in service output would change, because we lack any clear indication of how the output of services varies per unit area of each habitat type.
25.3.5 World Markets
25.3.5.1 OriginThis storyline is a very common one in many published studies of scenarios, and provides an opportunity to examine how a suite of dominant socioeconomic and demographic drivers could affect the UK’s ecosystem services. It also reflects the desire from some potential users of the UK NEA to see how a relaxation in rural and green belt regulation (and hence a spread of urbanisation) would affect ecosystem services in the UK. Other influencing focal questions raised issues about increasing dependence on commodities from overseas, rises in global food prices, a societal rejection of the importance of climate change, continuing increases in atmospheric nitrogen pollution and increases in housing density.
1227Plausible Futures | Chapter 25: The UK NEA Scenarios: Development of Storylines and Analysis of Outcomes
25.3.5.2 RationaleThe fundamental characteristic of this scenario is high economic growth driven by short-term profit, with a greater focus on removing impediments to trade. International trade barriers are assumed to have dissolved or to have limited impact as markets are liberalised. The UK’s agricultural area declines slightly in the face of global competition, and there is a small shift from Improved Grassland to arable, but overall it becomes more industrial and large-scale in character. Demand for land is very competitive and housing or small-scale industrial units are often the winners. However, food production is still deemed more important than many other ‘uneconomic’ land uses, and food is produced in a highly industrial manner. As in land-based food production, the food supply from the seas is seen as resource that does not require recourse to sustainable management. Fish stocks subsequently decline further and a few species have become locally extinct in the North Sea. Most fish is now imported from Asia. Desalination plants are built in areas along the east coast to meet water demand for the southern and eastern counties. ‘Home-grown’ fossil fuel energy production is dwindling and has been overtaken by imports of gas from Eastern Europe and privately funded nuclear industry in the UK. Consequently, coastal areas are built upon to accommodate power plants and gas pipeline stations. Supplies of other ecosystem services increasingly become privatised where they can become profitable. The underlying policy prescription in this storyline is essentially a ‘hands off’ approach, i.e. there is very little legislation or incentive geared towards ecosystem service delivery in the UK. Market forces dominate and, along with population growth, are among the main drivers of change. Legislation relating to land use planning is greatly diminished. The consequence of this is a radical change in the rural and urban fabric of the UK: Urban areas continue to grow with very little curbing them; traditional conservation and landscape areas do not have the same restrictions on development; and threats to land cover (floods, sea-level rise) are only targeted if considerable financial loss is likely.
25.3.5.3 Main driversThe UK’s population rises through immigration, which is encouraged in this truly libertarian storyline, and there is an increase in the 60+ age group. Also, more people wish to live alone and the average household is smaller than in 2010. As a consequence there is a strong demand for new housing. Planning restrictions on green belt and rural areas are relaxed throughout the UK, often resulting in conversion of agricultural, woodland and grassland habitats to housing development. The influence of local groups and rural communities on development is somewhat limited and large business often gets its own way with little effective opposition. Many small towns are either subsumed by larger neighbours or become part of ribbon developments along major road and rail corridors. In this scenario it is assumed that the UK is determined to be part of an expanding global trade system. New business models that maximise some ecosystem service provision
(but not most) are created. Economics, based on monetary valuation of stocks and flows of critical natural capital, becomes the preferred option for tacking environmental problems that urgently need addressing (this way at least some ecosystem services are conserved). Investments in technology are mostly privately funded and the state plays a smaller role in everyday life. There are large differences in income levels within society, and divisions in terms of equality are greater than ever. Although there are strong centralised government structures in the different parts of the UK, there is an emphasis on allowing people freedom to choose in many of the important aspects of life (health, education, etc.). There are minimal sets of environmental standards that maintain important aspects of urban life (e.g. air quality) but otherwise there are few restrictions on economic growth unless a market is created to protect some services (e.g. the rural beauty of some charismatic areas). Climate change is hardly given any attention in national policy and there is limited investment in mitigation. Climate change is considered ‘natural’ and is assumed that the market will take care of responses. Thus adaptation is mostly local and autonomous (and often led by business innovators and early adopters). Any recourse to renewable energy production is solely down to a decline in fossil fuel resources rather than a concern for the environment. The consequences of this attitude are that the differences between the high and low climate change trajectories for this scenario are amongst the greatest observed: arable and Improved Grassland are lost to Semi-natural Grassland through abandonment, and even some broadleaved woodland suffers dieback. The US, EU, China, India, Russia and Brazil are dominant economic forces and global trade increases each year; global environmental legislation and conventions have become somewhat toothless and are rarely adopted by governments.
25.3.5.4 Land and sea useIn a free-trade world all land-based subsidies have been removed and the agricultural industry is dominated by large agri-businesses, which include the large retail supermarkets. Technological advances in agriculture push yields to new heights; biotechnology is very much a part of this. Specialisation is normal in farming and there are very few mixed farms; farm size continues to increase, as does the average field size. Large factory pig/dairy/beef/poultry units, which produce cheap meat efficiently, rise up throughout lowland areas, and increasingly in northern areas because they are cooler in the summer; increasingly, food produced in large glasshouses becomes more common too. Petroleum prices increase significantly in the UK, so woody biomass cropping and other cropped biofuels increase to meet demand where this can be competitive. Agricultural production intensifies on the best land as well as lower grade land (although this is also utilised for biofuels), and areas of semi-natural habitats are also converted to agricultural land. Climate change presents a problem but advanced husbandry, air-conditioned livestock units and biotechnology crop-breeding result in high adaptation in the sector (possibly the only sector where adaptation to climate change is taken seriously).
1228 UK National Ecosystem Assessment: Technical Report
Modern arable farms are industrialised and homogeneous, with large fields of cereal or protein crops; this trend has resulted in hedges and some woodlands being grubbed out. Apart from a huge increase in willow for short-rotation coppice, most surviving woods have been replanted with exotic species to maintain timber production. Woodlands for conservation and recreation have minimal importance. Intensive management of existing Woodlands is promoted (including the coppicing of ancient and semi-natural woodlands). Semi-natural Grasslands are not considered a high priority and consequently, many are converted to biofuel cropping or housing. Some grassland on steep slopes gradually reverts to scrub and woodland. Lowland rural areas see a decrease in existing woodland but woody biofuel area increases. Housing stock increases with new towns being built, resulting in an overall decrease of farm area. In upland rural areas the cooler climate is utilised for housed livestock production in valley bottoms—most feed is imported. Overall, however, there is still a decrease in farm area; Improved Grassland decreases as more livestock is housed in larger feedlot complexes. Some parts of mountainous areas are maintained for the most competitive services they can supply (i.e. freshwater provision, wind for energy generation and also recreation near large conurbations). However, in many mountainous areas, deregulation and lack of environmental protection have resulted in development or conversion to woodland in the warmer climate; large conifer and Eucalyptus woodlands have begun to appear in many hilly areas of the UK. Water quality regulations are less strict than in 2010; the UK’s rivers are in poor condition in terms of biodiversity, water quality and the presence of invasive species. Coastal erosion is a continuing problem in many areas and requires state intervention, especially where huge investment (affluent housing, major ports, desalination plants) is threatened. Since the removal of the Common Fisheries Policy, the seas around the UK have become a free-for-all, except in the exclusive economic zone (EEZ) of 200 nautical miles from the coast. Even within the EEZ, however, the UK seas are more open to consumption of resources, including increases in fishing and aggregate extraction, with little regard to sustainable management. Most commercial fish populations have been overharvested and marine aggregate extraction has also increased in many areas. Shipping increases due to greater trade with other countries, particularly countries with whom the UK has entered into exclusive trade agreements to harvest resources. An expansion of housing into green belts, parks and gardens results in a loss of nearly 30% of greenspace (resulting in greenspace accounting for only 39% of Urban cover). Built-on surfaces increase by nearly 80% to represent one-third of all Urban cover. Street trees are replaced as they die, but otherwise there is little urban woodland planting. Urban space has diminished considerably as the demand for housing targets every space available. In peri-urban areas there is a large decrease in Woodland and Enclosed Farmland due to housing expansion and small-scale industry. Dependency on nuclear power and fossil fuels continues and there is very little use of renewable energy (with the exception of biofuels), although large tidal barrage schemes
do provide around 5% of the UK’s energy requirements. Technology continues to improve efficiencies in most energy sectors. The UK sees a huge decline in internal and overseas tourism, partly due to a gradual erosion of the country’s cultural services (both in rural and urban areas); the wealthy middle classes around the globe still travel extensively, but the UK is losing out as a tourism destination. Recreation in the UK is now more home-based. The transport network is heavily biased in favour of cars and air travel. Motorway-widening schemes reduce farmland and semi-natural areas, and a few new toll motorways are created between London and the Manchester-Leeds belt. Nearly all the major airports expand, including Heathrow and Birmingham, and in east London an airport is built in the Thames Estuary. The major land use winner in this scenario is Urban—large increases in Urban cover throughout the UK occur, although there is a stronger growth in the South East. The main losers are Semi-natural Grasslands and upland habitats.
25.3.5.5 Human well-beingPeople strive for personal wealth and material possessions or experiences. This is truly the age of mass consumerism. Mean income is higher than ever before and the poor have higher incomes too (but see below). The private education sector has increased considerably, as state-funded schooling is underfunded and in decline. Many services are provided by private companies. Health standards are very high for those who can afford it; the NHS survives with many private providers included but struggles to cope with ensuring quality service provision. Obesity increases due to poorer diets and less exercise (linked to more people spending their leisure time at home in virtual worlds). There is a rise in diabetes, cancers, stress and depression, and other ‘affluenzic’ diseases. Every decade there is an increase in human health pandemics in the UK. Increasingly, unwell people are forced to pay for their health care if it can be shown that they are responsible for their condition (e.g. smoking-, drug- and drink-related diseases). This is a disjointed and unfriendly society. People feel secure if they can afford to pay for security services or live in gated communities. Despite a higher standard of living for the poor, there is great resentment of the rich, who almost live in a different world. Street violence, mass protest and other civil unrest is common. Further afield, the UK frequently has to assert itself in a struggle for diminishing resources. Freedom is more restricted for all, although the rich have more access, more say and more influence than the poor. Many goods that were once public are now private, and this affects access to recreation, food and decision-making more generally. Increasingly, politics is becoming a commercial enterprise and it becomes more difficult for someone to enter national politics without significant funding. Underground political movements spring up, but are controlled.
25.3.5.6 Effect on UK ecosystem services, goods and benefitsEcosystem services that have monetary value and are easy to trade are protected, but in this unregulated, urbanising world,
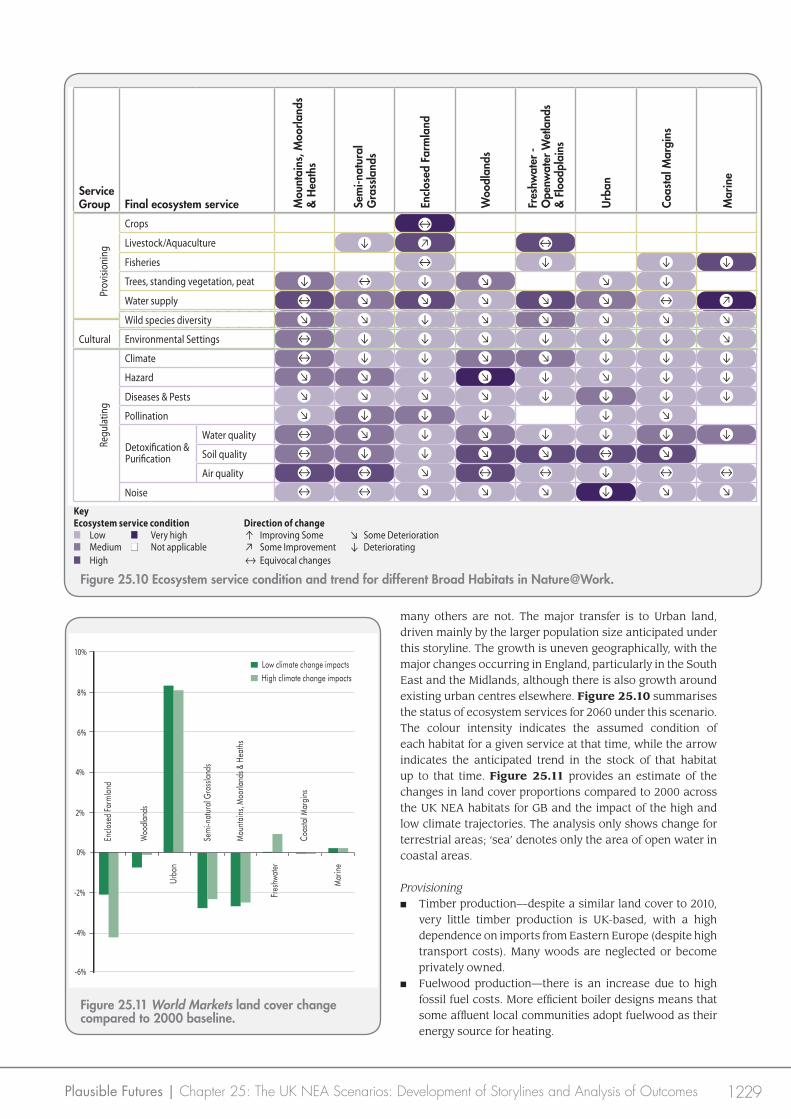
1229Plausible Futures | Chapter 25: The UK NEA Scenarios: Development of Storylines and Analysis of Outcomes
many others are not. The major transfer is to Urban land, driven mainly by the larger population size anticipated under this storyline. The growth is uneven geographically, with the major changes occurring in England, particularly in the South East and the Midlands, although there is also growth around existing urban centres elsewhere. Figure 25.10 summarises the status of ecosystem services for 2060 under this scenario. The colour intensity indicates the assumed condition of each habitat for a given service at that time, while the arrow indicates the anticipated trend in the stock of that habitat up to that time. Figure 25.11 provides an estimate of the changes in land cover proportions compared to 2000 across the UK NEA habitats for GB and the impact of the high and low climate trajectories. The analysis only shows change for terrestrial areas; ‘sea’ denotes only the area of open water in coastal areas.
Provisioning■ Timber production—despite a similar land cover to 2010,
very little timber production is UK-based, with a high dependence on imports from Eastern Europe (despite high transport costs). Many woods are neglected or become privately owned.
■ Fuelwood production—there is an increase due to high fossil fuel costs. More efficient boiler designs means that some affluent local communities adopt fuelwood as their energy source for heating.
Figure 25.10 Ecosystem service condition and trend for different Broad Habitats in Nature@Work.
0%
2%
4%
-4%
-6%
Urba
n
Sem
i-nat
ural
Gra
ssla
nds
Mou
ntai
ns, M
oorla
nds &
Hea
ths
Fres
hwat
er
Coas
tal M
argi
ns
Mar
ine
Enclo
sed
Farm
land
Woo
dlan
ds
Low climate change impactsHigh climate change impacts
6%
8%
10%
-2%
Figure 25.11 World Markets land cover change compared to 2000 baseline.
Detoxi�cation &Puri�cation
Service Group Final ecosystem service M
ount
ains
, Moo
rland
s &
Hea
ths
Sem
i-nat
ural
G
rass
land
s
Encl
osed
Far
mla
nd
Woo
dlan
ds
Fres
hwat
er -
Ope
nwat
er W
etla
nds
& F
lood
plai
ns
Urb
an
Coas
tal M
argi
ns
Mar
ine
Prov
ision
ing
Crops
Livestock/Aquaculture
Fisheries
Trees, standing vegetation, peat
Water supply
Wild species diversity
Cultural Environmental Settings
Regu
latin
g
Climate
Hazard
Diseases & Pests
Pollination
Water quality
Soil quality
Air quality
Noise
↔
↓ ↗ ↔
↔ ↓ ↓ ↓
↓ ↔ ↓ ↘ ↘ ↓
↔ ↘ ↘ ↘ ↘ ↘ ↔ ↗
↘ ↘ ↓ ↘ ↘ ↘ ↘ ↘
↔ ↓ ↓ ↘ ↓ ↓ ↓ ↘
↔ ↓ ↓ ↘ ↘ ↓ ↓ ↓
↘ ↘ ↓ ↘ ↓ ↘ ↓ ↓
↘ ↘ ↘ ↘ ↓ ↓ ↓ ↓
↘ ↓ ↓ ↓ ↓ ↘
↔ ↘ ↓ ↘ ↓ ↓ ↓ ↓
↔ ↓ ↓ ↘ ↘ ↔ ↘
↔ ↔ ↘ ↔ ↔ ↓ ↔ ↔
↔ ↔ ↘ ↘ ↘ ↓ ↘ ↘
KeyEcosystem service condition Direction of change■ Low ■ Very high ↑ Improving Some ↘ Some Deterioration■ Medium ■ Not applicable ↗ Some Improvement ↓ Deteriorating■ High ↔ Equivocal changes
1230 UK National Ecosystem Assessment: Technical Report
■ Crop production—this increases dramatically: free market enterprise has increased research and development, and the arable area has also expanded; a large proportion of crop production is used for animal feed.
■ Animal production—there is a similar increase in yield per head but overall, national production stays the same as 2010 levels because of the demand for cheap, low quality meat. The vast majority of meat and dairy production systems are indoors.
■ Wild species diversity—there are declines in most habitats: climate change, land use change and pollution are all major contributors to the decline. Increases in invasive species also reduce native species diversity.
Regulation■ Carbon—land carbon stocks decrease due to loss of semi-
natural and upland habitat and conversion of Improved Grassland to housing. A decline in good soil management also diminishes soil carbon levels further.
■ Flood alleviation—nothing is done to prevent the impacts of flood events on vulnerable communities. Those who can afford it move away; otherwise, people cope as best they can. Land management in the surrounding countryside does not change to help mitigate flood impact.
■ Erosion control—this is a neglected problem, which increases in some areas due to lack of vegetation or inappropriate land management.
■ Water quality—this declines to mid-1980s levels in the UK due to lower environmental standards across industry and agriculture.
■ Invasive species—numbers increase due to more unregulated trade with other countries, an increase in traffic (a main vector for many species) and climate change; very little is done to control species except in affluent areas.
Cultural■ Recreation—there are declining opportunities for
woodland, upland and farmland recreation, with a general weakening of environmental settings. Most woods are privately owned or managed for fuel to supply local heat generation systems; farming has reduced the beauty of much of the countryside. Upland areas are often privately controlled and the right to roam statute has been repealed. ‘High quality’ rural recreation remains an expensive pastime; game shooting (and even a day in the country) is an exclusive treat for the few.
■ Historic and spiritual—values throughout the UK have been degraded or lost. These are seen as non-tangible, pointless and not worth conserving. Beautiful landscapes remain in areas almost exclusively utilised by the wealthy (homes and services here are too costly for most people).
25.3.5.7 Ecosystem service trade-offs and changes since todayThe emphasis on provisioning services at the expense of almost all others is the notable pattern that arises in this storyline, although even food and timber production in the UK has to compete in a market driven by value (hence a
reliance on cheaper food imports from overseas). Thus the loss of Enclosed Farmland under this scenario is much less than that assumed for Green and Pleasant Land and Nature@Work (compare Figure 25.11, Figure 25.9 and Figure 25.7). However, sustainable land and sea management is not always practised, which results in losses of regulating and cultural services. The pattern of large-scale loss of semi-natural habitat, as well as the unsustainable management of land and sea resources in this storyline, explains the overall ecosystem service provision compared to 2010. Whilst there is the potential for increases in ecosystem service provision (technology driving crop and livestock yields, for example), the demand for land for housing and industrial development results in a further overall decline in provisioning, regulating and cultural services. Climate change significantly reduces the already eroding ecosystem services in this storyline: worst hit are provisioning services (loss of food production) and regulating services (from a decline in woodland cover). Once again, however, although we can project potential changes in the area of the different habitats, it is difficult to estimate how the overall balance in service output will change because we lack information on how the output of services varies per unit area.
25.3.6 National Security
25.3.6.1 OriginThis storyline is also very common in the published scenarios. The survey of focal questions also highlighted a number of issues that could be explored with this narrative, including: where the UK will get its ecosystem services from; the impacts of trying to secure national food, fibre and bioenergy supplies; the consequences for ecosystem services if there were an increase to 70% self-sufficiency in food; the consequences of maximising domestic food production to protect overseas ecosystems; and the future of CAP. Many of these questions helped to design a storyline that shared a lot of aspects with the World Markets storyline, except that global trade would be much reduced and there would be an emphasis on home-grown provisioning services.
25.3.6.2 RationaleUnder this scenario it is assumed that climate change results in increases in global energy prices, forcing many countries to attempt greater self-sufficiency and efficiency in many of their core industries. The UK is no exception and agricultural and other primary industries intensify accordingly. Society understands that a move towards sustainable resource management is a desirable way forward, although it is not always attainable. For example, many farmers are better at maintaining good soil quality, but this is more out of a desire to maintain food production rather than for any long-term environmental goals. Food and energy production to meet UK demands is the main priority and often comes at an environmental price if it ensures the UK’s self-reliance. This storyline relies on a heavy government hand in setting policy for the provision of ecosystem services; it
1231Plausible Futures | Chapter 25: The UK NEA Scenarios: Development of Storylines and Analysis of Outcomes
also reduces the scope of market-driven forces (at least externally to the UK) to have an effect. Trade barriers provide a relatively competition-free environment for industry within the UK; subsidies for food and timber production exist also, to encourage their growth. Removal or weakening of environmental legislation results in a greater switch from semi-natural and Woodland habitats to Arable and Horticultural and Improved Grassland, and conifer plantations also make huge gains in upland areas.
25.3.6.3 Main driversSociety is UK-focused. Immigration is strictly controlled and allows entry to only the most skilled workers. The housing stock increases to meet the demand for single-occupancy households, but this is mainly concentrated in brownfield development and results in an increase in new flat complexes. Population growth is 0.5% per year. Economic growth is lower than in the World Markets scenario. Planning is strongly controlled by the state: the expansion of home-grown industry is allowed if it provides jobs and benefits for the wider community and does not threaten green belts or rural land. Every last resource in the UK is utilised for the provision of services, and this results in: the reactivation of many coalmines; greater protection of the UK’s fisheries; and the conversion of much non-productive land to farming. Resource consumption is somewhat curbed, and a slightly more sustainable and less profligate society develops. Protectionism and trade barriers are put in place to secure the health of the UK’s industries. The drive towards self-sufficiency is seen as a necessary step forward by many countries throughout the world, although trade still exists. Diminishing energy and freshwater resources have resulted in countries refocusing their efforts towards ensuring sustainable supplies of their own ecosystem services (albeit mainly regulatory and provisioning). No longer can countries guarantee supplies of many goods, but some countries will still export where they have an excess in supply and where there is demand. Climate change is a driver of change in this storyline, but its greatest impact is felt in a reduction in arable area in the high impact scenario. Although technology plays a major role in this storyline, the insularity of the country results in a lower adoption of better adapted crop cultivars. In other habitats, climate change adaptation is more developed, e.g. suitable drought- and heat-tolerant conifer species are planted.
25.3.6.4 Land and sea usePrecision farming and other sustainable techniques are promoted and constantly evolve. Biotechnology crops are also heavily utilised and are considered essential to sustainable land management. Plant-based protein is a more efficient use of agricultural land and meat production is heavily taxed with a climate change levy (and thus declines becoming a food for the affluent); this results in some surplus grassland becoming available for arable, short rotation coppice bio-ethanol production, as well as new forest plantations for timber. Forestry is an important sector and home-grown timber production is promoted. Climate change has put pay to the promotion of conserving
native species and foresters are free to experiment with exotic trees, with the exception of some potentially problematic species. Ancient semi-natural woodlands are managed for fuelwood, but in some cases also for quality timber or furniture products; although in places conservation objectives are met too. Plantations are by far the dominant Woodland type and increases in conifer cover are seen through the UK, especially in the uplands in Wales and Scotland. Semi-natural Grassland becomes a conservation luxury that society cannot afford and it is now either planted for bioethanol or converted to Woodland if the topography is too difficult for farm machinery. Many of these Mountain, Moorland and Heath habitats have increased Woodland cover to accommodate the drive for home-grown timber. Overseas conifer species are widely used (Monterey and Corsican pines cope well with the climate and soils). Freshwater supply is controlled and use is governed by licence, e.g. for irrigation or drinking water. New desalination plants are built along the east coast; more reservoirs for potable water are built also. Coastal resources are protected if they are important for the economic growth of the UK; desalination plants, nuclear power stations and some built-on areas are given priority for defence against sea-level rise. In other areas, high value farmland is also protected from sea intrusion. The fish resources of the waters around the UK are harvested as before, but under strict sustainable catch quotas and protection measures. However, subsidised low trophic-level aquaculture has developed into an important food resource and is pursued in many areas around the UK. Renewable energy schemes are also heavily promoted and include a huge programme of offshore wind farms and wave energy units. Large tidal barrage schemes provide around 5% of the UK’s energy requirements. Large market gardens, urban gardens (not just allotments) and even urban ‘forest gardens’ are developed and represent nearly 20% of all urban greenspace in the UK. However, as a consequence, greenspace for recreation, in the form of public parks and gardens and amenity areas, declines dramatically although these can provide space for relaxation despite their prime food-producing role. The housing stock is maintained and improved for energy efficiency; new housing is built to high-energy standards but is small and functional. Peri-urban zones are similar to Urban, but small agricultural fields also dominate; market gardens thrive and even previously, large private gardens are converted to food production. Wind energy is heavily subsidised and much of the coast around the UK is utilised. Nuclear power is also developed through a programme of international control of uranium resources. However, uranium is one of the few overseas resources required for energy production and much of the UK relies on a continuation of fossil fuels use from North Sea gas reservoirs and the remaining coal seams. The major road networks are maintained and car use increases in the UK. Internal flights remain, although more people use rail travel to commute too. More people holiday at home than overseas compared to the present. Fossil fuels are in decline and are rationed; electric and biofuels dominate.
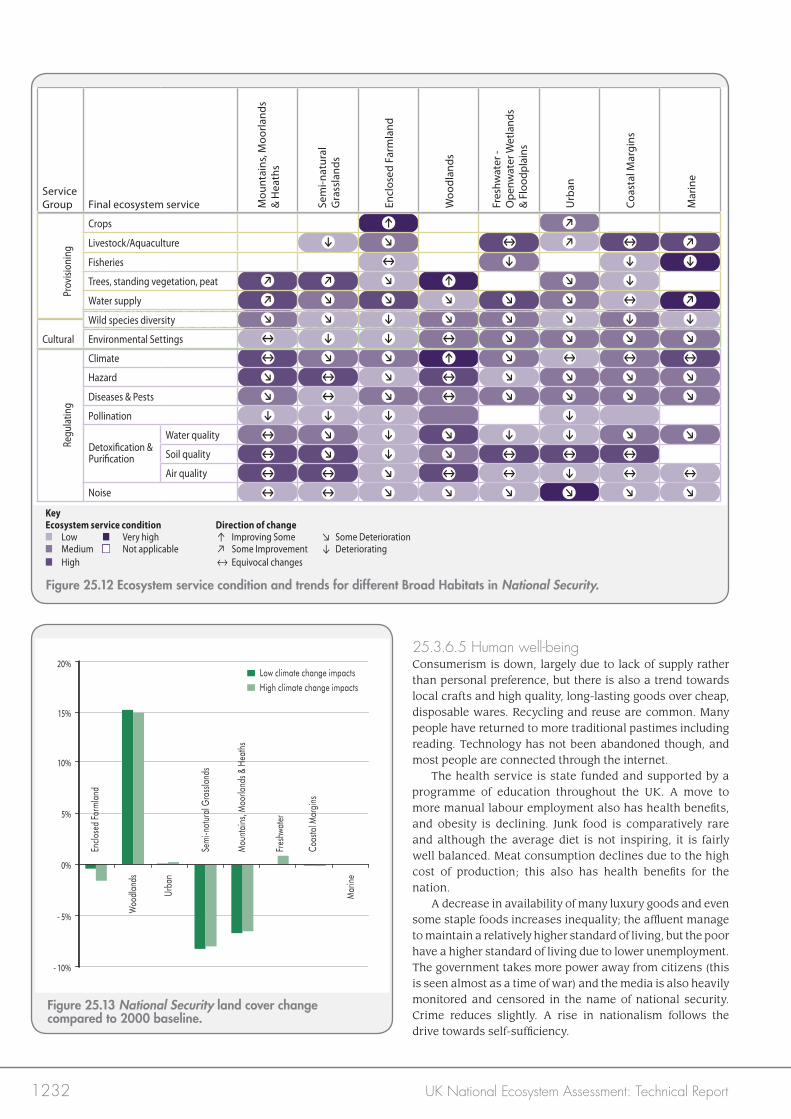
1232 UK National Ecosystem Assessment: Technical Report
25.3.6.5 Human well-beingConsumerism is down, largely due to lack of supply rather than personal preference, but there is also a trend towards local crafts and high quality, long-lasting goods over cheap, disposable wares. Recycling and reuse are common. Many people have returned to more traditional pastimes including reading. Technology has not been abandoned though, and most people are connected through the internet. The health service is state funded and supported by a programme of education throughout the UK. A move to more manual labour employment also has health benefits, and obesity is declining. Junk food is comparatively rare and although the average diet is not inspiring, it is fairly well balanced. Meat consumption declines due to the high cost of production; this also has health benefits for the nation. A decrease in availability of many luxury goods and even some staple foods increases inequality; the affluent manage to maintain a relatively higher standard of living, but the poor have a higher standard of living due to lower unemployment. The government takes more power away from citizens (this is seen almost as a time of war) and the media is also heavily monitored and censored in the name of national security. Crime reduces slightly. A rise in nationalism follows the drive towards self-sufficiency.
Figure 25.12 Ecosystem service condition and trends for different Broad Habitats in National Security.
Figure 25.13 National Security land cover change compared to 2000 baseline.
Detoxi�cation &Puri�cation
Service Group Final ecosystem service M
ount
ains
, Moo
rland
s &
Hea
ths
Sem
i-nat
ural
G
rass
land
s
Encl
osed
Far
mla
nd
Woo
dlan
ds
Fres
hwat
er -
Ope
nwat
er W
etla
nds
& Fl
oodp
lain
s
Urb
an
Coas
tal M
argi
ns
Mar
ine
Prov
ision
ing
Crops
Livestock/Aquaculture
Fisheries
Trees, standing vegetation, peat
Water supply
Wild species diversity
Cultural Environmental Settings
Regu
latin
g
Climate
Hazard
Diseases & Pests
Pollination
Water quality
Soil quality
Air quality
Noise
↑ ↗
↓ ↘ ↔ ↗ ↔ ↗
↔ ↓ ↓ ↓
↗ ↗ ↘ ↑ ↘ ↓
↗ ↘ ↘ ↘ ↘ ↘ ↔ ↗
↘ ↘ ↓ ↘ ↘ ↘ ↓ ↓
↔ ↓ ↓ ↔ ↘ ↘ ↘ ↘
↔ ↘ ↘ ↑ ↘ ↔ ↔ ↔
↘ ↔ ↘ ↔ ↘ ↘ ↘ ↘
↘ ↔ ↘ ↔ ↘ ↘ ↘ ↘
↓ ↓ ↓ ↓
↔ ↘ ↓ ↘ ↓ ↓ ↘ ↘
↔ ↘ ↓ ↘ ↔ ↔ ↔
↔ ↔ ↘ ↔ ↔ ↓ ↔ ↔
↔ ↔ ↘ ↘ ↘ ↘ ↘ ↘
KeyEcosystem service condition Direction of change■ Low ■ Very high ↑ Improving Some ↘ Some Deterioration■ Medium ■ Not applicable ↗ Some Improvement ↓ Deteriorating■ High ↔ Equivocal changes
0%
5%
10%
- 5%
- 10%
Urba
n
Sem
i-nat
ural
Gra
ssla
nds
Mou
ntai
ns, M
oorla
nds &
Hea
ths
Fres
hwat
er
Coas
tal M
argi
ns
Mar
ine
Enclo
sed
Farm
land
Woo
dlan
ds
Low climate change impactsHigh climate change impacts
15%
20%
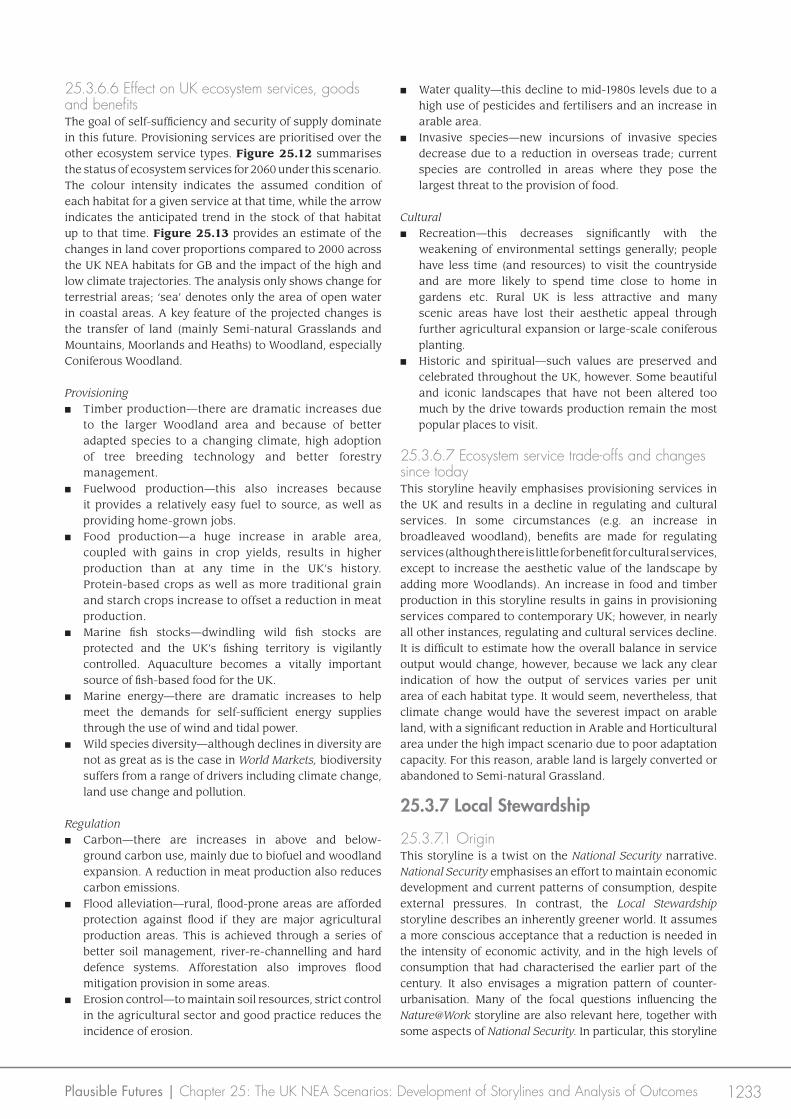
1233Plausible Futures | Chapter 25: The UK NEA Scenarios: Development of Storylines and Analysis of Outcomes
25.3.6.6 Effect on UK ecosystem services, goods and benefitsThe goal of self-sufficiency and security of supply dominate in this future. Provisioning services are prioritised over the other ecosystem service types. Figure 25.12 summarises the status of ecosystem services for 2060 under this scenario. The colour intensity indicates the assumed condition of each habitat for a given service at that time, while the arrow indicates the anticipated trend in the stock of that habitat up to that time. Figure 25.13 provides an estimate of the changes in land cover proportions compared to 2000 across the UK NEA habitats for GB and the impact of the high and low climate trajectories. The analysis only shows change for terrestrial areas; ‘sea’ denotes only the area of open water in coastal areas. A key feature of the projected changes is the transfer of land (mainly Semi-natural Grasslands and Mountains, Moorlands and Heaths) to Woodland, especially Coniferous Woodland.
Provisioning■ Timber production—there are dramatic increases due
to the larger Woodland area and because of better adapted species to a changing climate, high adoption of tree breeding technology and better forestry management.
■ Fuelwood production—this also increases because it provides a relatively easy fuel to source, as well as providing home-grown jobs.
■ Food production—a huge increase in arable area, coupled with gains in crop yields, results in higher production than at any time in the UK’s history. Protein-based crops as well as more traditional grain and starch crops increase to offset a reduction in meat production.
■ Marine fish stocks—dwindling wild fish stocks are protected and the UK’s fishing territory is vigilantly controlled. Aquaculture becomes a vitally important source of fish-based food for the UK.
■ Marine energy—there are dramatic increases to help meet the demands for self-sufficient energy supplies through the use of wind and tidal power.
■ Wild species diversity—although declines in diversity are not as great as is the case in World Markets, biodiversity suffers from a range of drivers including climate change, land use change and pollution.
Regulation■ Carbon—there are increases in above and below-
ground carbon use, mainly due to biofuel and woodland expansion. A reduction in meat production also reduces carbon emissions.
■ Flood alleviation—rural, flood-prone areas are afforded protection against flood if they are major agricultural production areas. This is achieved through a series of better soil management, river-re-channelling and hard defence systems. Afforestation also improves flood mitigation provision in some areas.
■ Erosion control—to maintain soil resources, strict control in the agricultural sector and good practice reduces the incidence of erosion.
■ Water quality—this decline to mid-1980s levels due to a high use of pesticides and fertilisers and an increase in arable area.
■ Invasive species—new incursions of invasive species decrease due to a reduction in overseas trade; current species are controlled in areas where they pose the largest threat to the provision of food.
Cultural■ Recreation—this decreases significantly with the
weakening of environmental settings generally; people have less time (and resources) to visit the countryside and are more likely to spend time close to home in gardens etc. Rural UK is less attractive and many scenic areas have lost their aesthetic appeal through further agricultural expansion or large-scale coniferous planting.
■ Historic and spiritual—such values are preserved and celebrated throughout the UK, however. Some beautiful and iconic landscapes that have not been altered too much by the drive towards production remain the most popular places to visit.
25.3.6.7 Ecosystem service trade-offs and changes since todayThis storyline heavily emphasises provisioning services in the UK and results in a decline in regulating and cultural services. In some circumstances (e.g. an increase in broadleaved woodland), benefits are made for regulating services (although there is little for benefit for cultural services, except to increase the aesthetic value of the landscape by adding more Woodlands). An increase in food and timber production in this storyline results in gains in provisioning services compared to contemporary UK; however, in nearly all other instances, regulating and cultural services decline. It is difficult to estimate how the overall balance in service output would change, however, because we lack any clear indication of how the output of services varies per unit area of each habitat type. It would seem, nevertheless, that climate change would have the severest impact on arable land, with a significant reduction in Arable and Horticultural area under the high impact scenario due to poor adaptation capacity. For this reason, arable land is largely converted or abandoned to Semi-natural Grassland.
25.3.7 Local Stewardship
25.3.7.1 OriginThis storyline is a twist on the National Security narrative. National Security emphasises an effort to maintain economic development and current patterns of consumption, despite external pressures. In contrast, the Local Stewardship storyline describes an inherently greener world. It assumes a more conscious acceptance that a reduction is needed in the intensity of economic activity, and in the high levels of consumption that had characterised the earlier part of the century. It also envisages a migration pattern of counter-urbanisation. Many of the focal questions influencing the Nature@Work storyline are also relevant here, together with some aspects of National Security. In particular, this storyline
1234 UK National Ecosystem Assessment: Technical Report
tries to address issues raised about the future importance of localism and balancing ecosystem service delivery. It also seeks to describe a future where economic growth has not continued unabated and so provides us with a picture of how the UK could evolve sustainably under a global decline in economic growth and reduced access to dwindling resources.
25.3.7.2 RationaleLocal Stewardship is a future where society is more concerned with its immediate surroundings (community, land, etc.) and strives to maintain a sustainable focus on life within that area. However, unlike the National Security storyline, and despite the local focus, people are connected and have more solidarity with communities in other countries. This scenario assumes that societal equity goes alongside environmental equity. People travel less and depend more on local resources; more of our food production and leisure activities take place in our immediate surroundings. The implementation of the sustainable management of resources is emphasised and society relies less on technological innovation for meeting social and environmental needs compared to the other scenarios. Low carbon economies spring up everywhere and there is a greater use of alternative economies such as LETS (Local Exchange Trading Systems) schemes. National GDP accounting has been complemented with GPI (Genuine Progress Indicator) to take into account environmental aspects and human welfare. Waste is considered an anathema: very little food is wasted, and, for example, farmers and smallholders utilise every last part of the animal. Many families keep chickens, pigs or geese. Self-sufficiency is a key concept and so many exports and imports are reduced considerably, but still exist for commodities not produced in the UK. Agricultural land declines only slightly from 2010, and the population in this storyline is the lowest of all the scenarios. The overall levels of biodiversity increase and many ecosystems, including farmland and woodland, are managed more sustainably. Climate change is taken seriously and mitigation (an example of the ‘think global’ aspect) and adaptation projects spring up around the country. The main land cover changes due to climate change are seen in arable and grassland (small declines in area with concomitant rises in Semi-natural Grassland and broadleaved woodland). However, the low input and heterogeneous nature of the farm enterprises in Local Stewardship increase the adaptation capacity, so losses are minimal. Through local specialisation the UK becomes less homogenised—the landscapes become more distinct and local economies vary considerably. Technological development occurs in localised areas due to private innovation and a government initiative for embedding sustainability into the development of technology. Social and environmental regulation have advanced, particularly in workers’ welfare and rights and in environmental protection. Policy encourages smaller businesses and small and medium-sized enterprises proliferate. Although economic growth is slower compared to some storylines, the economy is more stable and does not suffer periodic dips and crashes. The ‘localism’ aspect of this storyline is enabled by a reduction in state interference in the everyday life. UK
government has largely devolved much of the day-to-day running of many aspects of life (e.g. education, health) but it still plays a role in environmental governance through legislation. Most environmental policy and legislation is related to the protection of semi-natural habitats and wildlife; other than this, there are no incentives for environmental management. Instead, the national government helps to provide education on sustainability and other environmental issues: environmentalism is generally based on a ‘bottom-up’ approach. Land cover transitions are driven by a greater appreciation and desire for sustainability, but are also permitted to a large extent because of a lower demand for food provision due to smaller national population and shifts in diet. Biodiversity is afforded greater protection, and the desire to produce food locally results in greater heterogeneity in the landscape. This also improves the conservation value of the countryside.
25.3.7.3 Main driversImmigration is reduced and internal migration between regions falls dramatically too. Population growth relative to 2010 is very small, mainly due to a government policy of encouraging small families. However, the population continues to age; the age of retirement reflects the better health of the old and rises to 70. A focus on sustainable households results in more people living together under one roof. As a result, there is no housing crisis and as a consequence, much poor quality housing from the 20th Century is demolished to make way for greenspace. One consequence of this scenario is lower overall GDP (but higher GPI). However, the country as a whole is healthier, happier and the environment is better protected. Unemployment is much lower than 2010 and although average income is reduced, there is much greater employment security and more people are engaged in labour-intensive jobs. An investment in water and energy efficiency is one area where some technological advancement is made. A greater desire to develop diverse energy resources locally means that the energy industry is radically changed. Domestically, more houses take up a mix of solar, ground-source heat and wind. Fossil fuel is still used; some abandoned coalmines are reworked and energy is generated using cleaner technologies and carbon storage. Society is wary of nuclear power and no new power plants are created. Internationally, the drive towards self-sufficiency is seen as a necessary step forward by many countries, although trade still exists. Diminishing energy and freshwater resources have resulted in countries refocusing their efforts towards ensuring sustainable supplies of their own ecosystem services (albeit mainly regulatory and provisioning services). No longer can countries guarantee supplies of many goods although, of course, some countries will still export goods where they have an excess of supply and where there is demand. 25.3.7.4 Land and sea useAgriculture changes considerably as a consequence of two factors: the drive towards self-sufficiency means that some crops are reduced in area (e.g. wheat exports reduce, to be replaced by more protein and vegetable crops); mixed farms
1235Plausible Futures | Chapter 25: The UK NEA Scenarios: Development of Storylines and Analysis of Outcomes
(many organic or low-input) become more common too. One major difference from many of the other storylines is the continued presence of Improved Grassland to maintain livestock production. However, whilst the overall land cover may stay the same, the location of Improved Grassland has changed and many arable farms have become mixed. These changes are largely driven by the local market. Some meat production becomes more extensive and traditional British breeds do well, although increasingly, breeds with a high tolerance to heat are kept. The second factor is the promotion, through market forces and policy, coupled with bottom-up demand for local production, of a distinct local or regional character for food production. Traditional areas for specialist foods return. Agriculture is subsidised by the government and is focused on an integrated programme of biodiversity conservation and sustainable management practices. Most woodlands have a similar species composition to today’s, but are better managed through coppice (used for local domestic energy or other craft products) and other (sustainable, like shelterwood) high forest silvicultural systems. Lower grade agricultural land is converted to woody biofuel in peri-urban areas and in lowland rural counties. Overall agricultural land area declines only slightly compared with 2010 but changes considerably in type. It is more heterogeneous and average farm size is smaller. Perhaps the most significant change is a large increase in Semi-natural Grassland ecosystems that are maintained by grazing and provide opportunities for recreation and biodiversity too. Mountain habitats are protected from development and provide grazing for sheep and hardy cattle breeds. Recreation is important but often locally based. The quality of water in all freshwater habitats improves as a result of better agricultural management and more extensive production systems. A reduction in freshwater provision in the South East due to climate change is partly met by better water use efficiency and delivery from western and northern parts of the UK. Invasive species are controlled and new introductions from overseas decline due to greater border control. In coastal areas, managed retreat is common (landowners are well compensated) and hard defences are actively removed in favour of ‘softer’, more natural approaches. Areas of valuable agricultural land are protected, but some systems are changed from highly drained farmland to wetland farm systems (e.g. rice production). Coastal development for shipping, oil and gas is reduced and the UK’s coastline and Marine habitats reap the benefits. Renewable energy from the sea is encouraged and backed by government schemes—wave and tidal energy sources become common but do not conflict with areas of high biodiversity. Marine bioresources are managed sustainably, with local quotas implemented and managed through local groups, and the number of small fishing vessels increases. Local fish-based cuisine is very popular. Mobile fish populations (i.e. transboundary) are managed by national quota systems and a new fisheries committee. Despite a lower overall fish haul than in 2010, fish catches are more diverse. Carbon sequestration in Marine environments is also taken seriously; local marine areas are rewarded by the national government for maintaining carbon stocks.
The UK settlement pattern is very similar to 2010 except in areas prone to flooding, where some of the housing stock has been removed. Existing housing development occurs only in relatively safe and ‘climate-proof’ areas. There is a small outflow of people from urban to rural areas. Thus counter-urbanisation is a feature of this scenario. In urban areas the housing stock diminishes to make way for more greenspace (gardens both for leisure and food production) and the total city greenspace is the second highest proportion of Urban cover, after Green and Pleasant Land (57%). Street trees are planted and maintained and urban farms crop up throughout the UK. In peri-urban areas there is a large increase in working woodlands and conservation areas due to the contraction of housing. Small tenanted farms arise from the break-up of larger units. Domestic energy supply is very important in this scenario and many houses are installed with a combination of wind, solar and ground-source heat systems. Energy efficiency is also improved across the national housing stock. Transport adopts a combination of biofuel, electric and fossil fuels. Large-scale renewable energy also plays an important part, but only where it does not conflict with biodiversity: e.g. wind farms crop up around the coast but avoid major bird migratory routes as well as important Marine habitats.
25.3.7.5 Human well-beingThe belief in sustainable production systems pervades attitudes towards consumption and lifestyles; most people do not want or miss high-tech goods and enjoy a more relaxed pace to life. Simple things provide simple and rewarding pleasures. Food is very important, though: many people pride themselves on their cooking abilities and local food is easily sourced. Although there are regional differences, the overall health of the nation increases due to a lower stress lifestyle, better nutrition, better education, more outdoor work and better housing standards. However, technological developments in medicine have not progressed as much as they have in other storylines, but mental health is much better than ever before. Overall the UK is a much happier place. There are lower incidences of crime and aggressive behaviour toward others; tolerance of minorities and different viewpoints is high and many local communities are so well connected and supported that any transgressions are easily dealt with if they arise. Community pride and peer pressure to ‘behave’ is strong. Localism does not mean inconsistent standards in law or freedom. Everyone in the UK has a voice, a vote and freedom to do what they want within the laws of a civil society. Many local customs are maintained, but these do not encroach on equality and civility. Access to land and production systems is good and anyone has the opportunity to do well in life if they work hard.
25.3.7.6 Effect on UK ecosystem services, goods and benefitsFigure 25.14 summarises the status of ecosystem services for 2060 under this scenario. The colour intensity indicates the assumed condition of each habitat for a given service
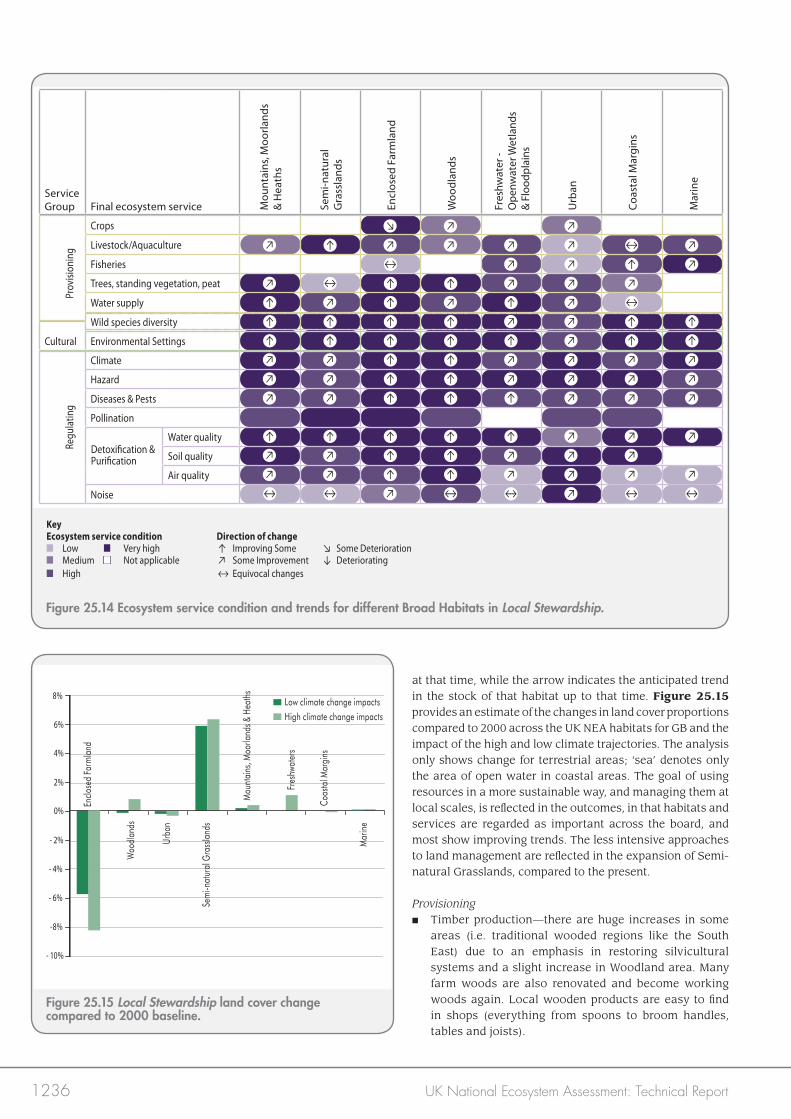
1236 UK National Ecosystem Assessment: Technical Report
at that time, while the arrow indicates the anticipated trend in the stock of that habitat up to that time. Figure 25.15 provides an estimate of the changes in land cover proportions compared to 2000 across the UK NEA habitats for GB and the impact of the high and low climate trajectories. The analysis only shows change for terrestrial areas; ‘sea’ denotes only the area of open water in coastal areas. The goal of using resources in a more sustainable way, and managing them at local scales, is reflected in the outcomes, in that habitats and services are regarded as important across the board, and most show improving trends. The less intensive approaches to land management are reflected in the expansion of Semi-natural Grasslands, compared to the present.
Provisioning ■ Timber production—there are huge increases in some
areas (i.e. traditional wooded regions like the South East) due to an emphasis in restoring silvicultural systems and a slight increase in Woodland area. Many farm woods are also renovated and become working woods again. Local wooden products are easy to find in shops (everything from spoons to broom handles, tables and joists).
Figure 25.15 Local Stewardship land cover change compared to 2000 baseline.
Figure 25.14 Ecosystem service condition and trends for different Broad Habitats in Local Stewardship.
0%
2%
4%
- 2%
- 4%
Urba
n
Fres
hwat
ers
Coas
tal M
argi
ns
Mar
ine
Enclo
sed
Farm
land
Woo
dlan
ds
- 10%
-8%
- 6%
6%
8%
Sem
i-nat
ural
Gra
ssla
nds
Mou
ntai
ns, M
oorla
nds &
Hea
ths
Low climate change impactsHigh climate change impacts
Detoxi�cation &Puri�cation
Service Group Final ecosystem service M
ount
ains
, Moo
rland
s &
Hea
ths
Sem
i-nat
ural
G
rass
land
s
Encl
osed
Far
mla
nd
Woo
dlan
ds
Fres
hwat
er -
Ope
nwat
er W
etla
nds
& Fl
oodp
lain
s
Urb
an
Coas
tal M
argi
ns
Mar
ine
Prov
ision
ing
Crops
Livestock/Aquaculture
Fisheries
Trees, standing vegetation, peat
Water supply
Wild species diversity
Cultural Environmental Settings
Regu
latin
g
Climate
Hazard
Diseases & Pests
Pollination
Water quality
Soil quality
Air quality
Noise
↘ ↗ ↗
↗ ↑ ↗ ↗ ↗ ↗ ↔ ↗
↔ ↗ ↗ ↑ ↗
↗ ↔ ↑ ↑ ↗ ↗ ↗
↑ ↗ ↑ ↗ ↑ ↗ ↔
↑ ↑ ↑ ↑ ↗ ↗ ↑ ↑
↑ ↑ ↑ ↑ ↑ ↗ ↑ ↑
↗ ↗ ↑ ↑ ↗ ↗ ↗ ↗
↗ ↗ ↑ ↑ ↗ ↗ ↗ ↗
↗ ↗ ↑ ↑ ↑ ↗ ↗ ↗
↑ ↑ ↑ ↑ ↑ ↗ ↗ ↗
↗ ↗ ↑ ↑ ↗ ↗ ↗
↗ ↗ ↑ ↑ ↗ ↗ ↗ ↗
↔ ↔ ↗ ↔ ↔ ↗ ↔ ↔
KeyEcosystem service condition Direction of change■ Low ■ Very high ↑ Improving Some ↘ Some Deterioration■ Medium ■ Not applicable ↗ Some Improvement ↓ Deteriorating■ High ↔ Equivocal changes
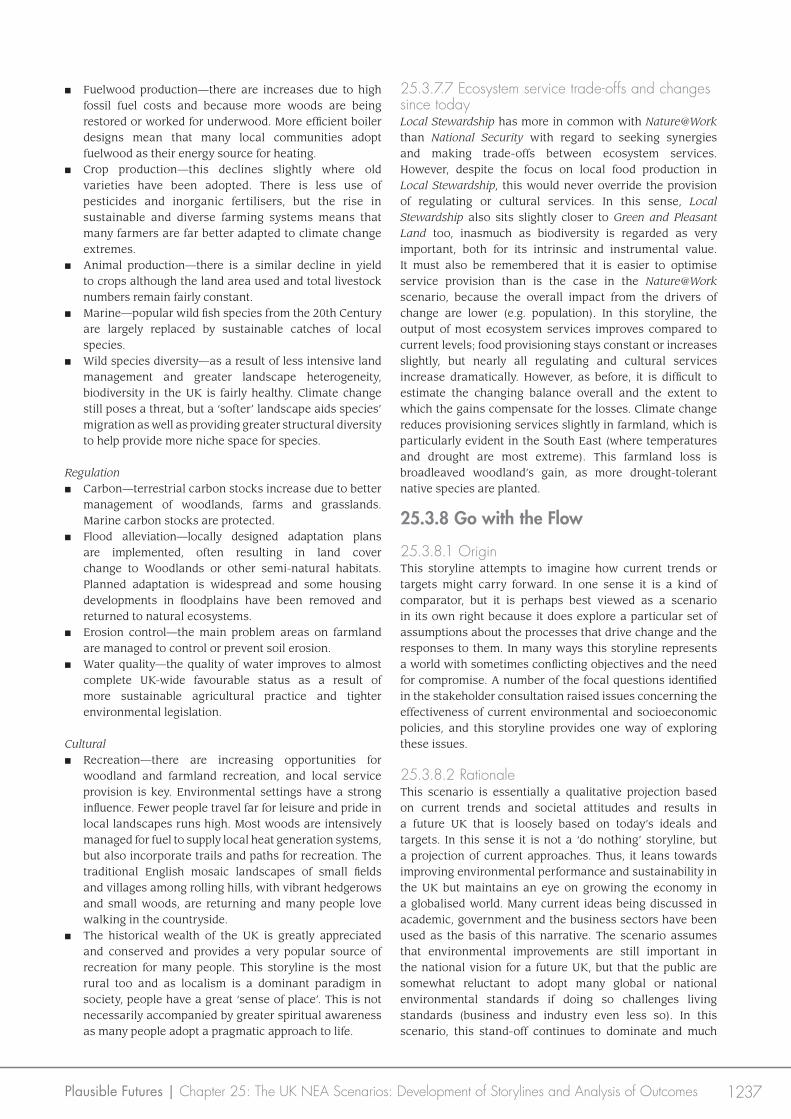
1237Plausible Futures | Chapter 25: The UK NEA Scenarios: Development of Storylines and Analysis of Outcomes
■ Fuelwood production—there are increases due to high fossil fuel costs and because more woods are being restored or worked for underwood. More efficient boiler designs mean that many local communities adopt fuelwood as their energy source for heating.
■ Crop production—this declines slightly where old varieties have been adopted. There is less use of pesticides and inorganic fertilisers, but the rise in sustainable and diverse farming systems means that many farmers are far better adapted to climate change extremes.
■ Animal production—there is a similar decline in yield to crops although the land area used and total livestock numbers remain fairly constant.
■ Marine—popular wild fish species from the 20th Century are largely replaced by sustainable catches of local species.
■ Wild species diversity—as a result of less intensive land management and greater landscape heterogeneity, biodiversity in the UK is fairly healthy. Climate change still poses a threat, but a ‘softer’ landscape aids species’ migration as well as providing greater structural diversity to help provide more niche space for species.
Regulation■ Carbon—terrestrial carbon stocks increase due to better
management of woodlands, farms and grasslands. Marine carbon stocks are protected.
■ Flood alleviation—locally designed adaptation plans are implemented, often resulting in land cover change to Woodlands or other semi-natural habitats. Planned adaptation is widespread and some housing developments in floodplains have been removed and returned to natural ecosystems.
■ Erosion control—the main problem areas on farmland are managed to control or prevent soil erosion.
■ Water quality—the quality of water improves to almost complete UK-wide favourable status as a result of more sustainable agricultural practice and tighter environmental legislation.
Cultural■ Recreation—there are increasing opportunities for
woodland and farmland recreation, and local service provision is key. Environmental settings have a strong influence. Fewer people travel far for leisure and pride in local landscapes runs high. Most woods are intensively managed for fuel to supply local heat generation systems, but also incorporate trails and paths for recreation. The traditional English mosaic landscapes of small fields and villages among rolling hills, with vibrant hedgerows and small woods, are returning and many people love walking in the countryside.
■ The historical wealth of the UK is greatly appreciated and conserved and provides a very popular source of recreation for many people. This storyline is the most rural too and as localism is a dominant paradigm in society, people have a great ‘sense of place’. This is not necessarily accompanied by greater spiritual awareness as many people adopt a pragmatic approach to life.
25.3.7.7 Ecosystem service trade-offs and changes since todayLocal Stewardship has more in common with Nature@Work than National Security with regard to seeking synergies and making trade-offs between ecosystem services. However, despite the focus on local food production in Local Stewardship, this would never override the provision of regulating or cultural services. In this sense, Local Stewardship also sits slightly closer to Green and Pleasant Land too, inasmuch as biodiversity is regarded as very important, both for its intrinsic and instrumental value. It must also be remembered that it is easier to optimise service provision than is the case in the Nature@Work scenario, because the overall impact from the drivers of change are lower (e.g. population). In this storyline, the output of most ecosystem services improves compared to current levels; food provisioning stays constant or increases slightly, but nearly all regulating and cultural services increase dramatically. However, as before, it is difficult to estimate the changing balance overall and the extent to which the gains compensate for the losses. Climate change reduces provisioning services slightly in farmland, which is particularly evident in the South East (where temperatures and drought are most extreme). This farmland loss is broadleaved woodland’s gain, as more drought-tolerant native species are planted.
25.3.8 Go with the Flow
25.3.8.1 OriginThis storyline attempts to imagine how current trends or targets might carry forward. In one sense it is a kind of comparator, but it is perhaps best viewed as a scenario in its own right because it does explore a particular set of assumptions about the processes that drive change and the responses to them. In many ways this storyline represents a world with sometimes conflicting objectives and the need for compromise. A number of the focal questions identified in the stakeholder consultation raised issues concerning the effectiveness of current environmental and socioeconomic policies, and this storyline provides one way of exploring these issues.
25.3.8.2 RationaleThis scenario is essentially a qualitative projection based on current trends and societal attitudes and results in a future UK that is loosely based on today’s ideals and targets. In this sense it is not a ‘do nothing’ storyline, but a projection of current approaches. Thus, it leans towards improving environmental performance and sustainability in the UK but maintains an eye on growing the economy in a globalised world. Many current ideas being discussed in academic, government and the business sectors have been used as the basis of this narrative. The scenario assumes that environmental improvements are still important in the national vision for a future UK, but that the public are somewhat reluctant to adopt many global or national environmental standards if doing so challenges living standards (business and industry even less so). In this scenario, this stand-off continues to dominate and much
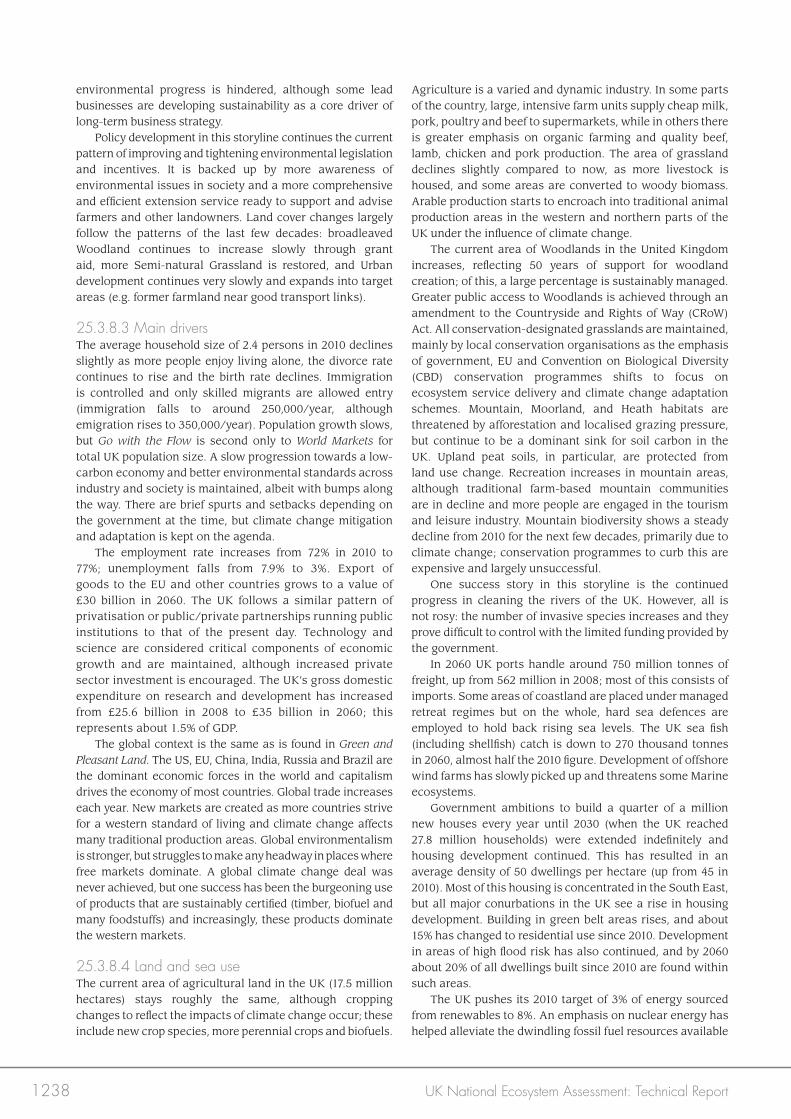
1238 UK National Ecosystem Assessment: Technical Report
environmental progress is hindered, although some lead businesses are developing sustainability as a core driver of long-term business strategy. Policy development in this storyline continues the current pattern of improving and tightening environmental legislation and incentives. It is backed up by more awareness of environmental issues in society and a more comprehensive and efficient extension service ready to support and advise farmers and other landowners. Land cover changes largely follow the patterns of the last few decades: broadleaved Woodland continues to increase slowly through grant aid, more Semi-natural Grassland is restored, and Urban development continues very slowly and expands into target areas (e.g. former farmland near good transport links).
25.3.8.3 Main driversThe average household size of 2.4 persons in 2010 declines slightly as more people enjoy living alone, the divorce rate continues to rise and the birth rate declines. Immigration is controlled and only skilled migrants are allowed entry (immigration falls to around 250,000/year, although emigration rises to 350,000/year). Population growth slows, but Go with the Flow is second only to World Markets for total UK population size. A slow progression towards a low-carbon economy and better environmental standards across industry and society is maintained, albeit with bumps along the way. There are brief spurts and setbacks depending on the government at the time, but climate change mitigation and adaptation is kept on the agenda. The employment rate increases from 72% in 2010 to 77%; unemployment falls from 7.9% to 3%. Export of goods to the EU and other countries grows to a value of £30 billion in 2060. The UK follows a similar pattern of privatisation or public/private partnerships running public institutions to that of the present day. Technology and science are considered critical components of economic growth and are maintained, although increased private sector investment is encouraged. The UK’s gross domestic expenditure on research and development has increased from £25.6 billion in 2008 to £35 billion in 2060; this represents about 1.5% of GDP. The global context is the same as is found in Green and Pleasant Land. The US, EU, China, India, Russia and Brazil are the dominant economic forces in the world and capitalism drives the economy of most countries. Global trade increases each year. New markets are created as more countries strive for a western standard of living and climate change affects many traditional production areas. Global environmentalism is stronger, but struggles to make any headway in places where free markets dominate. A global climate change deal was never achieved, but one success has been the burgeoning use of products that are sustainably certified (timber, biofuel and many foodstuffs) and increasingly, these products dominate the western markets.
25.3.8.4 Land and sea useThe current area of agricultural land in the UK (17.5 million hectares) stays roughly the same, although cropping changes to reflect the impacts of climate change occur; these include new crop species, more perennial crops and biofuels.
Agriculture is a varied and dynamic industry. In some parts of the country, large, intensive farm units supply cheap milk, pork, poultry and beef to supermarkets, while in others there is greater emphasis on organic farming and quality beef, lamb, chicken and pork production. The area of grassland declines slightly compared to now, as more livestock is housed, and some areas are converted to woody biomass. Arable production starts to encroach into traditional animal production areas in the western and northern parts of the UK under the influence of climate change. The current area of Woodlands in the United Kingdom increases, reflecting 50 years of support for woodland creation; of this, a large percentage is sustainably managed. Greater public access to Woodlands is achieved through an amendment to the Countryside and Rights of Way (CRoW) Act. All conservation-designated grasslands are maintained, mainly by local conservation organisations as the emphasis of government, EU and Convention on Biological Diversity (CBD) conservation programmes shifts to focus on ecosystem service delivery and climate change adaptation schemes. Mountain, Moorland, and Heath habitats are threatened by afforestation and localised grazing pressure, but continue to be a dominant sink for soil carbon in the UK. Upland peat soils, in particular, are protected from land use change. Recreation increases in mountain areas, although traditional farm-based mountain communities are in decline and more people are engaged in the tourism and leisure industry. Mountain biodiversity shows a steady decline from 2010 for the next few decades, primarily due to climate change; conservation programmes to curb this are expensive and largely unsuccessful. One success story in this storyline is the continued progress in cleaning the rivers of the UK. However, all is not rosy: the number of invasive species increases and they prove difficult to control with the limited funding provided by the government. In 2060 UK ports handle around 750 million tonnes of freight, up from 562 million in 2008; most of this consists of imports. Some areas of coastland are placed under managed retreat regimes but on the whole, hard sea defences are employed to hold back rising sea levels. The UK sea fish (including shellfish) catch is down to 270 thousand tonnes in 2060, almost half the 2010 figure. Development of offshore wind farms has slowly picked up and threatens some Marine ecosystems. Government ambitions to build a quarter of a million new houses every year until 2030 (when the UK reached 27.8 million households) were extended indefinitely and housing development continued. This has resulted in an average density of 50 dwellings per hectare (up from 45 in 2010). Most of this housing is concentrated in the South East, but all major conurbations in the UK see a rise in housing development. Building in green belt areas rises, and about 15% has changed to residential use since 2010. Development in areas of high flood risk has also continued, and by 2060 about 20% of all dwellings built since 2010 are found within such areas. The UK pushes its 2010 target of 3% of energy sourced from renewables to 8%. An emphasis on nuclear energy has helped alleviate the dwindling fossil fuel resources available
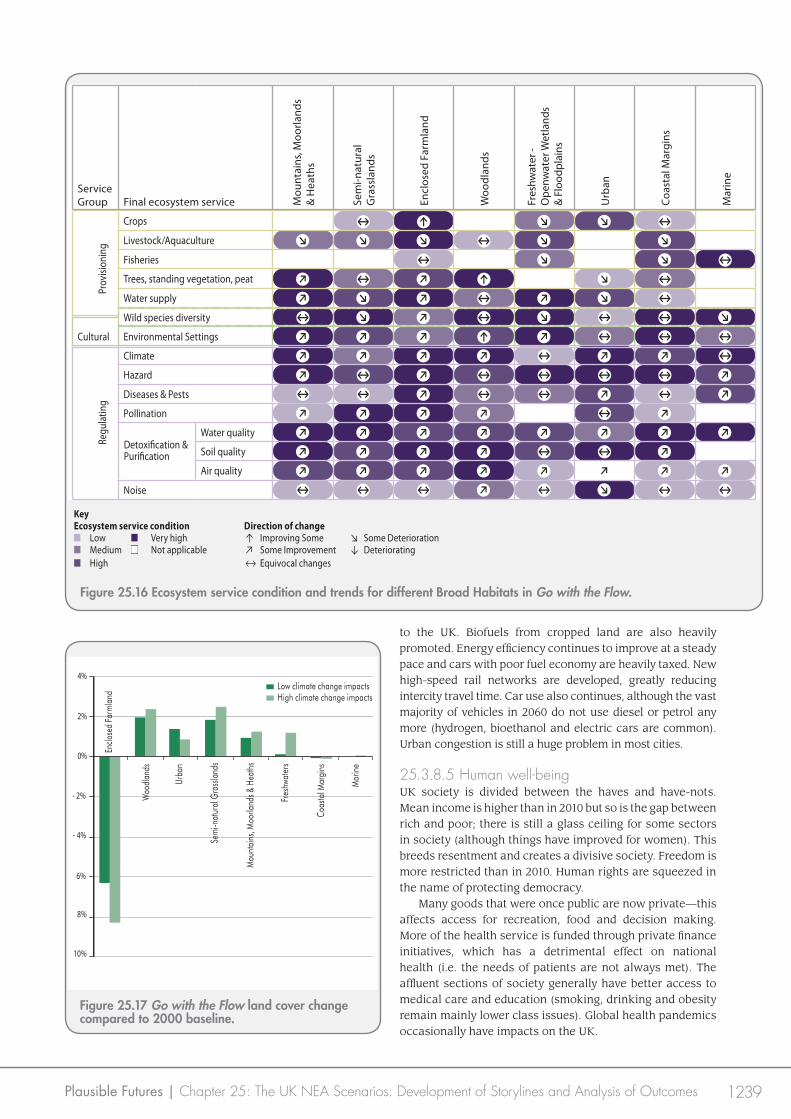
1239Plausible Futures | Chapter 25: The UK NEA Scenarios: Development of Storylines and Analysis of Outcomes
to the UK. Biofuels from cropped land are also heavily promoted. Energy efficiency continues to improve at a steady pace and cars with poor fuel economy are heavily taxed. New high-speed rail networks are developed, greatly reducing intercity travel time. Car use also continues, although the vast majority of vehicles in 2060 do not use diesel or petrol any more (hydrogen, bioethanol and electric cars are common). Urban congestion is still a huge problem in most cities.
25.3.8.5 Human well-beingUK society is divided between the haves and have-nots. Mean income is higher than in 2010 but so is the gap between rich and poor; there is still a glass ceiling for some sectors in society (although things have improved for women). This breeds resentment and creates a divisive society. Freedom is more restricted than in 2010. Human rights are squeezed in the name of protecting democracy. Many goods that were once public are now private—this affects access for recreation, food and decision making. More of the health service is funded through private finance initiatives, which has a detrimental effect on national health (i.e. the needs of patients are not always met). The affluent sections of society generally have better access to medical care and education (smoking, drinking and obesity remain mainly lower class issues). Global health pandemics occasionally have impacts on the UK.
Figure 25.16 Ecosystem service condition and trends for different Broad Habitats in Go with the Flow.
Figure 25.17 Go with the Flow land cover change compared to 2000 baseline.
0%
2%
4%
- 2%
- 4%
Urba
n
Fres
hwat
ers
Coas
tal M
argi
ns
Mar
ine
Enclo
sed
Farm
land
Woo
dlan
ds
Low climate change impactsHigh climate change impacts
Sem
i-nat
ural
Gra
ssla
nds
Mou
ntai
ns, M
oorla
nds &
Hea
ths
8%
10%
6%
Detoxi�cation &Puri�cation
Service Group Final ecosystem service M
ount
ains
, Moo
rland
s &
Hea
ths
Sem
i-nat
ural
G
rass
land
s
Encl
osed
Far
mla
nd
Woo
dlan
ds
Fres
hwat
er -
Ope
nwat
er W
etla
nds
& Fl
oodp
lain
s
Urb
an
Coas
tal M
argi
ns
Mar
ine
Prov
ision
ing
Crops
Livestock/Aquaculture
Fisheries
Trees, standing vegetation, peat
Water supply
Wild species diversity
Cultural Environmental Settings
Regu
latin
g
Climate
Hazard
Diseases & Pests
Pollination
Water quality
Soil quality
Air quality
Noise
↔ ↑ ↘ ↘ ↔
↘ ↘ ↘ ↔ ↘ ↘
↔ ↘ ↘ ↔
↗ ↔ ↗ ↑ ↘ ↔
↗ ↘ ↗ ↔ ↗ ↘ ↔
↔ ↘ ↗ ↔ ↘ ↔ ↔ ↘
↗ ↗ ↗ ↑ ↗ ↔ ↔ ↔
↗ ↗ ↗ ↗ ↔ ↗ ↗ ↔
↗ ↔ ↗ ↔ ↔ ↔ ↔ ↗
↔ ↔ ↗ ↔ ↔ ↗ ↔ ↗
↗ ↗ ↗ ↗ ↔ ↗
↗ ↗ ↗ ↗ ↗ ↗ ↗ ↗
↗ ↗ ↗ ↗ ↔ ↔ ↗
↗ ↗ ↗ ↗ ↗ ↗ ↗ ↗
↔ ↔ ↔ ↗ ↔ ↘ ↔ ↔
KeyEcosystem service condition Direction of change■ Low ■ Very high ↑ Improving Some ↘ Some Deterioration■ Medium ■ Not applicable ↗ Some Improvement ↓ Deteriorating■ High ↔ Equivocal changes
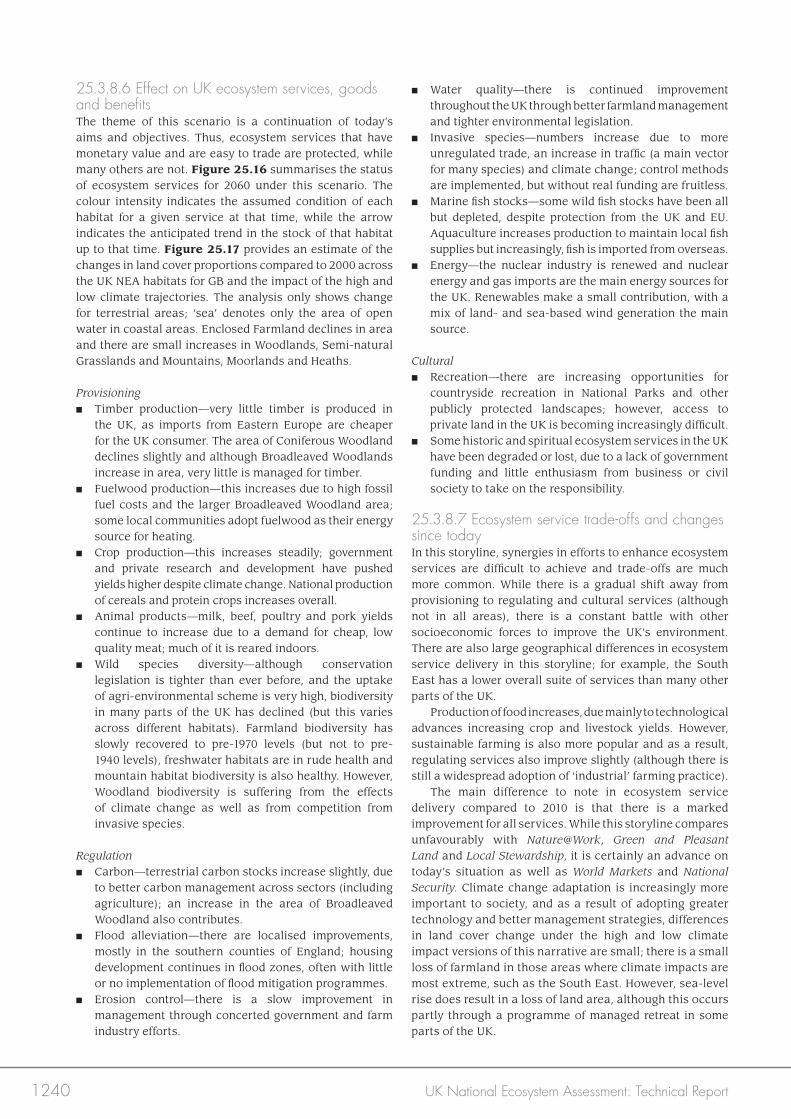
1240 UK National Ecosystem Assessment: Technical Report
25.3.8.6 Effect on UK ecosystem services, goods and benefitsThe theme of this scenario is a continuation of today’s aims and objectives. Thus, ecosystem services that have monetary value and are easy to trade are protected, while many others are not. Figure 25.16 summarises the status of ecosystem services for 2060 under this scenario. The colour intensity indicates the assumed condition of each habitat for a given service at that time, while the arrow indicates the anticipated trend in the stock of that habitat up to that time. Figure 25.17 provides an estimate of the changes in land cover proportions compared to 2000 across the UK NEA habitats for GB and the impact of the high and low climate trajectories. The analysis only shows change for terrestrial areas; ‘sea’ denotes only the area of open water in coastal areas. Enclosed Farmland declines in area and there are small increases in Woodlands, Semi-natural Grasslands and Mountains, Moorlands and Heaths.
Provisioning ■ Timber production—very little timber is produced in
the UK, as imports from Eastern Europe are cheaper for the UK consumer. The area of Coniferous Woodland declines slightly and although Broadleaved Woodlands increase in area, very little is managed for timber.
■ Fuelwood production—this increases due to high fossil fuel costs and the larger Broadleaved Woodland area; some local communities adopt fuelwood as their energy source for heating.
■ Crop production—this increases steadily; government and private research and development have pushed yields higher despite climate change. National production of cereals and protein crops increases overall.
■ Animal products—milk, beef, poultry and pork yields continue to increase due to a demand for cheap, low quality meat; much of it is reared indoors.
■ Wild species diversity—although conservation legislation is tighter than ever before, and the uptake of agri-environmental scheme is very high, biodiversity in many parts of the UK has declined (but this varies across different habitats). Farmland biodiversity has slowly recovered to pre-1970 levels (but not to pre-1940 levels), freshwater habitats are in rude health and mountain habitat biodiversity is also healthy. However, Woodland biodiversity is suffering from the effects of climate change as well as from competition from invasive species.
Regulation■ Carbon—terrestrial carbon stocks increase slightly, due
to better carbon management across sectors (including agriculture); an increase in the area of Broadleaved Woodland also contributes.
■ Flood alleviation—there are localised improvements, mostly in the southern counties of England; housing development continues in flood zones, often with little or no implementation of flood mitigation programmes.
■ Erosion control—there is a slow improvement in management through concerted government and farm industry efforts.
■ Water quality—there is continued improvement throughout the UK through better farmland management and tighter environmental legislation.
■ Invasive species—numbers increase due to more unregulated trade, an increase in traffic (a main vector for many species) and climate change; control methods are implemented, but without real funding are fruitless.
■ Marine fish stocks—some wild fish stocks have been all but depleted, despite protection from the UK and EU. Aquaculture increases production to maintain local fish supplies but increasingly, fish is imported from overseas.
■ Energy—the nuclear industry is renewed and nuclear energy and gas imports are the main energy sources for the UK. Renewables make a small contribution, with a mix of land- and sea-based wind generation the main source.
Cultural■ Recreation—there are increasing opportunities for
countryside recreation in National Parks and other publicly protected landscapes; however, access to private land in the UK is becoming increasingly difficult.
■ Some historic and spiritual ecosystem services in the UK have been degraded or lost, due to a lack of government funding and little enthusiasm from business or civil society to take on the responsibility.
25.3.8.7 Ecosystem service trade-offs and changes since todayIn this storyline, synergies in efforts to enhance ecosystem services are difficult to achieve and trade-offs are much more common. While there is a gradual shift away from provisioning to regulating and cultural services (although not in all areas), there is a constant battle with other socioeconomic forces to improve the UK’s environment. There are also large geographical differences in ecosystem service delivery in this storyline; for example, the South East has a lower overall suite of services than many other parts of the UK. Production of food increases, due mainly to technological advances increasing crop and livestock yields. However, sustainable farming is also more popular and as a result, regulating services also improve slightly (although there is still a widespread adoption of ‘industrial’ farming practice). The main difference to note in ecosystem service delivery compared to 2010 is that there is a marked improvement for all services. While this storyline compares unfavourably with Nature@Work, Green and Pleasant Land and Local Stewardship, it is certainly an advance on today’s situation as well as World Markets and National Security. Climate change adaptation is increasingly more important to society, and as a result of adopting greater technology and better management strategies, differences in land cover change under the high and low climate impact versions of this narrative are small; there is a small loss of farmland in those areas where climate impacts are most extreme, such as the South East. However, sea-level rise does result in a loss of land area, although this occurs partly through a programme of managed retreat in some parts of the UK.
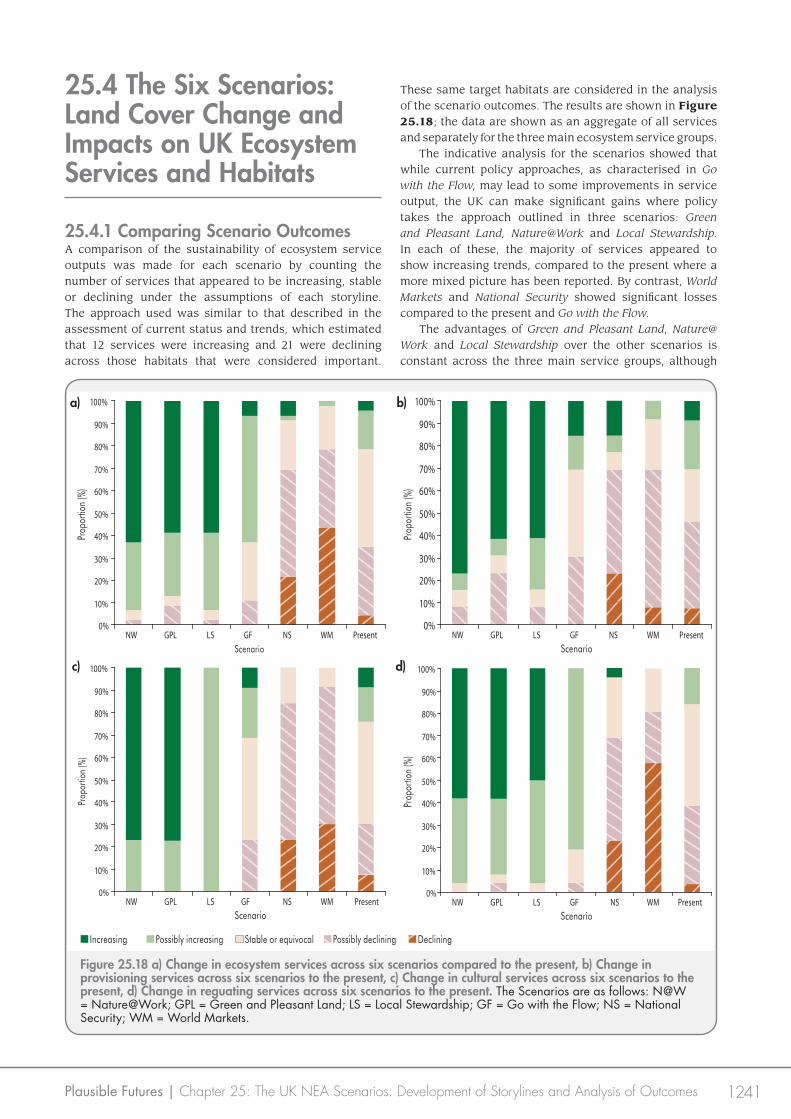
1241Plausible Futures | Chapter 25: The UK NEA Scenarios: Development of Storylines and Analysis of Outcomes
25.4 The Six Scenarios: Land Cover Change and Impacts on UK Ecosystem Services and Habitats
25.4.1 Comparing Scenario OutcomesA comparison of the sustainability of ecosystem service outputs was made for each scenario by counting the number of services that appeared to be increasing, stable or declining under the assumptions of each storyline. The approach used was similar to that described in the assessment of current status and trends, which estimated that 12 services were increasing and 21 were declining across those habitats that were considered important.
These same target habitats are considered in the analysis of the scenario outcomes. The results are shown in Figure 25.18; the data are shown as an aggregate of all services and separately for the three main ecosystem service groups. The indicative analysis for the scenarios showed that while current policy approaches, as characterised in Go with the Flow, may lead to some improvements in service output, the UK can make significant gains where policy takes the approach outlined in three scenarios: Green and Pleasant Land, Nature@Work and Local Stewardship. In each of these, the majority of services appeared to show increasing trends, compared to the present where a more mixed picture has been reported. By contrast, World Markets and National Security showed significant losses compared to the present and Go with the Flow. The advantages of Green and Pleasant Land, Nature@Work and Local Stewardship over the other scenarios is constant across the three main service groups, although
Figure 25.18 a) Change in ecosystem services across six scenarios compared to the present, b) Change in provisioning services across six scenarios to the present, c) Change in cultural services across six scenarios to the present, d) Change in reguating services across six scenarios to the present. The Scenarios are as follows: N@W = Nature@Work; GPL = Green and Pleasant Land; LS = Local Stewardship; GF = Go with the Flow; NS = National Security; WM = World Markets.
0%
10%
20%
30%
40%
50%
60%
70%
80%
90%
100%
NW GPL LS GF NS WM PresentScenario
Prop
ortio
n (%
)
0%
10%
20%
30%
40%
50%
60%
70%
80%
90%
100%
NW GPL LS GF NS WM PresentScenario
Prop
ortio
n (%
)
0%
10%
20%
30%
40%
50%
60%
70%
80%
90%
100%
NW GPL LS GF NS WM PresentScenario
Prop
ortio
n (%
)
0%
10%
20%
30%
40%
50%
60%
70%
80%
90%
100%
NW GPL LS GF NS WM PresentScenario
Prop
ortio
n (%
)a) b)
c) d)
Increasing Possibly increasing Stable or equivocal Possibly declining Declining
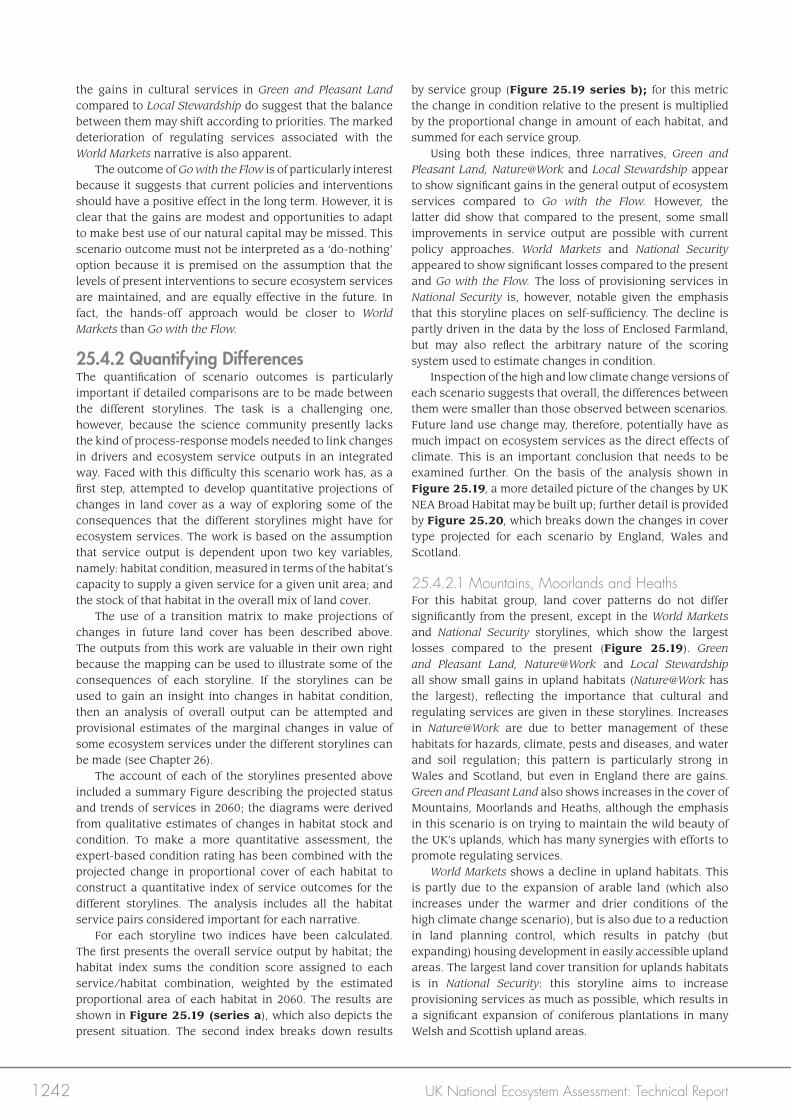
1242 UK National Ecosystem Assessment: Technical Report
the gains in cultural services in Green and Pleasant Land compared to Local Stewardship do suggest that the balance between them may shift according to priorities. The marked deterioration of regulating services associated with the World Markets narrative is also apparent. The outcome of Go with the Flow is of particularly interest because it suggests that current policies and interventions should have a positive effect in the long term. However, it is clear that the gains are modest and opportunities to adapt to make best use of our natural capital may be missed. This scenario outcome must not be interpreted as a ‘do-nothing’ option because it is premised on the assumption that the levels of present interventions to secure ecosystem services are maintained, and are equally effective in the future. In fact, the hands-off approach would be closer to World Markets than Go with the Flow.
25.4.2 Quantifying DifferencesThe quantification of scenario outcomes is particularly important if detailed comparisons are to be made between the different storylines. The task is a challenging one, however, because the science community presently lacks the kind of process-response models needed to link changes in drivers and ecosystem service outputs in an integrated way. Faced with this difficulty this scenario work has, as a first step, attempted to develop quantitative projections of changes in land cover as a way of exploring some of the consequences that the different storylines might have for ecosystem services. The work is based on the assumption that service output is dependent upon two key variables, namely: habitat condition, measured in terms of the habitat’s capacity to supply a given service for a given unit area; and the stock of that habitat in the overall mix of land cover. The use of a transition matrix to make projections of changes in future land cover has been described above. The outputs from this work are valuable in their own right because the mapping can be used to illustrate some of the consequences of each storyline. If the storylines can be used to gain an insight into changes in habitat condition, then an analysis of overall output can be attempted and provisional estimates of the marginal changes in value of some ecosystem services under the different storylines can be made (see Chapter 26). The account of each of the storylines presented above included a summary Figure describing the projected status and trends of services in 2060; the diagrams were derived from qualitative estimates of changes in habitat stock and condition. To make a more quantitative assessment, the expert-based condition rating has been combined with the projected change in proportional cover of each habitat to construct a quantitative index of service outcomes for the different storylines. The analysis includes all the habitat service pairs considered important for each narrative. For each storyline two indices have been calculated. The first presents the overall service output by habitat; the habitat index sums the condition score assigned to each service/habitat combination, weighted by the estimated proportional area of each habitat in 2060. The results are shown in Figure 25.19 (series a), which also depicts the present situation. The second index breaks down results
by service group (Figure 25.19 series b); for this metric the change in condition relative to the present is multiplied by the proportional change in amount of each habitat, and summed for each service group. Using both these indices, three narratives, Green and Pleasant Land, Nature@Work and Local Stewardship appear to show significant gains in the general output of ecosystem services compared to Go with the Flow. However, the latter did show that compared to the present, some small improvements in service output are possible with current policy approaches. World Markets and National Security appeared to show significant losses compared to the present and Go with the Flow. The loss of provisioning services in National Security is, however, notable given the emphasis that this storyline places on self-sufficiency. The decline is partly driven in the data by the loss of Enclosed Farmland, but may also reflect the arbitrary nature of the scoring system used to estimate changes in condition. Inspection of the high and low climate change versions of each scenario suggests that overall, the differences between them were smaller than those observed between scenarios. Future land use change may, therefore, potentially have as much impact on ecosystem services as the direct effects of climate. This is an important conclusion that needs to be examined further. On the basis of the analysis shown in Figure 25.19, a more detailed picture of the changes by UK NEA Broad Habitat may be built up; further detail is provided by Figure 25.20, which breaks down the changes in cover type projected for each scenario by England, Wales and Scotland.
25.4.2.1 Mountains, Moorlands and HeathsFor this habitat group, land cover patterns do not differ significantly from the present, except in the World Markets and National Security storylines, which show the largest losses compared to the present (Figure 25.19). Green and Pleasant Land, Nature@Work and Local Stewardship all show small gains in upland habitats (Nature@Work has the largest), reflecting the importance that cultural and regulating services are given in these storylines. Increases in Nature@Work are due to better management of these habitats for hazards, climate, pests and diseases, and water and soil regulation; this pattern is particularly strong in Wales and Scotland, but even in England there are gains. Green and Pleasant Land also shows increases in the cover of Mountains, Moorlands and Heaths, although the emphasis in this scenario is on trying to maintain the wild beauty of the UK’s uplands, which has many synergies with efforts to promote regulating services. World Markets shows a decline in upland habitats. This is partly due to the expansion of arable land (which also increases under the warmer and drier conditions of the high climate change scenario), but is also due to a reduction in land planning control, which results in patchy (but expanding) housing development in easily accessible upland areas. The largest land cover transition for uplands habitats is in National Security: this storyline aims to increase provisioning services as much as possible, which results in a significant expansion of coniferous plantations in many Welsh and Scottish upland areas.
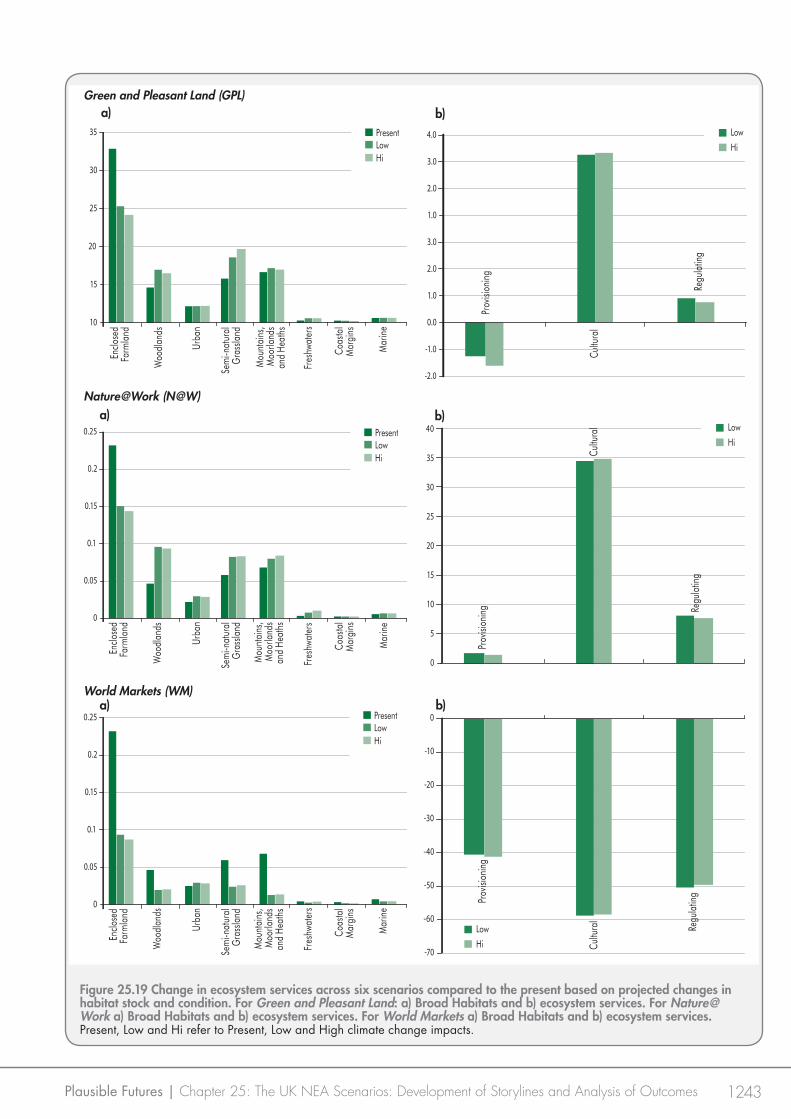
1243Plausible Futures | Chapter 25: The UK NEA Scenarios: Development of Storylines and Analysis of Outcomes
30
20
25
35
Coas
tal
Mar
gins
Enclo
sed
Far
mla
nd
Urba
n
Mar
ine
Woo
dlan
ds
Fres
hwat
ers
Mou
ntai
ns,
Moo
rland
san
d He
aths
Sem
i-nat
ural
Gra
ssla
nd
10
15
1.0
2.0
3.0
1.0
2.0
3.0
4.0
Regu
latin
g
Prov
ision
ing
Cultu
ral
-2.0
-1.0
0.0
b)
0
5
10
15
30
25
20
35
40
Regu
latin
g
Prov
ision
ing
Cultu
ral
-70
-60
-30
-40
-50
-10
-20
0
Regu
latin
gProv
ision
ing
Cultu
ral
a)
0.2
0.1
0.15
0.25
Coas
tal
Mar
gins
Enclo
sed
Far
mla
nd
Urba
n
Mar
ine
Woo
dlan
ds
Fres
hwat
ers
Mou
ntai
ns,
Moo
rland
san
d He
aths
Sem
i-nat
ural
Gra
ssla
nd
0
0.05
0.2
0.1
0.15
0.25
Coas
tal
Mar
gins
Enclo
sed
Far
mla
nd
Urba
n
Mar
ine
Woo
dlan
ds
Fres
hwat
ers
Mou
ntai
ns,
Moo
rland
san
d He
aths
Sem
i-nat
ural
Gra
ssla
nd
0
0.05
HiLowPresent
Hi
Low
HiLowPresent
Green and Pleasant Land (GPL)
Nature@Work (N@W)
World Markets (WM)
b)a)
b)a)
Hi
Low
Hi
Low
HiLowPresent
Figure 25.19 Change in ecosystem services across six scenarios compared to the present based on projected changes in habitat stock and condition. For Green and Pleasant Land: a) Broad Habitats and b) ecosystem services. For Nature@ Work a) Broad Habitats and b) ecosystem services. For World Markets a) Broad Habitats and b) ecosystem services. Present, Low and Hi refer to Present, Low and High climate change impacts.
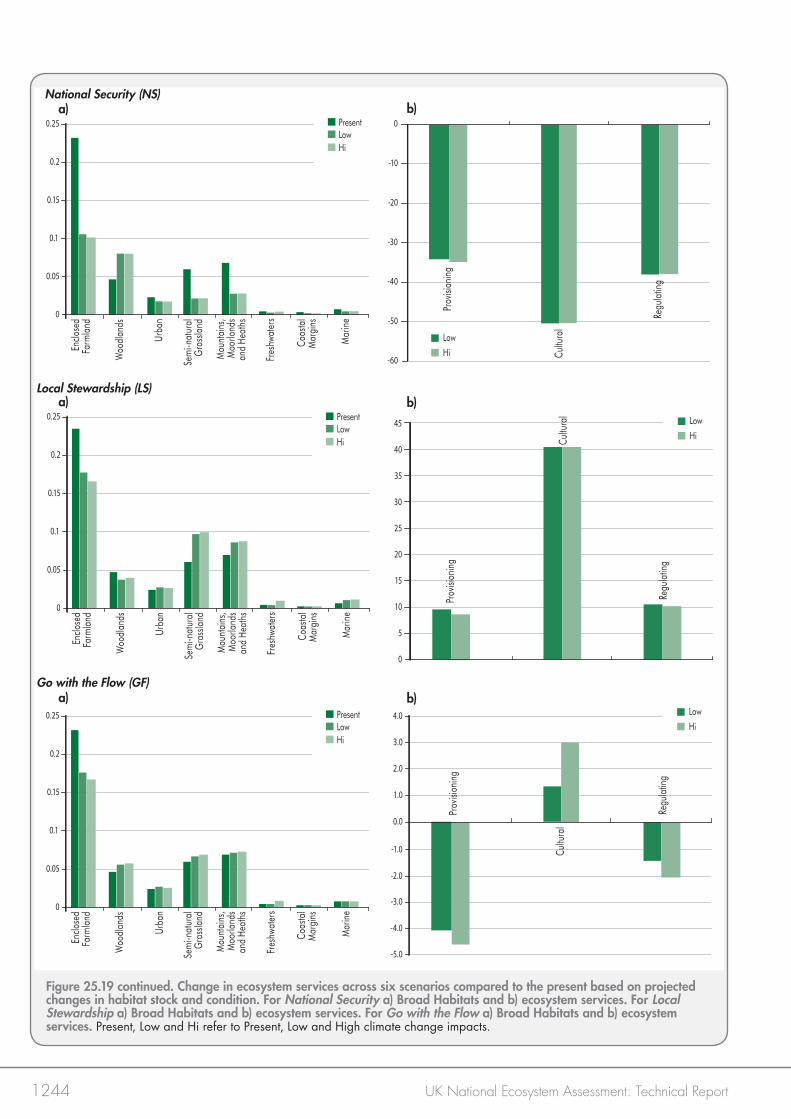
1244 UK National Ecosystem Assessment: Technical Report
0.2
0.1
0.15
0.25
Coas
tal
Mar
gins
Enclo
sed
Far
mla
nd
Urba
n
Mar
ine
Woo
dlan
ds
Fres
hwat
ers
Mou
ntai
ns,
Moo
rland
san
d He
aths
Sem
i-nat
ural
Gra
ssla
nd
0
0.05
-60
-30
-40
-50
-10
-20
0
Regu
latin
g
Prov
ision
ing
Cultu
ral
0.0
1.0
2.0
3.0
4.0
Regu
latin
g
Prov
ision
ing
Cultu
ral
-2.0
-1.0
-3.0
-4.0
-5.0
b)a)
0.2
0.1
0.15
0.25
Coas
tal
Mar
gins
Enclo
sed
Far
mla
nd
Urba
n
Mar
ine
Woo
dlan
ds
Fres
hwat
ers
Mou
ntai
ns,
Moo
rland
san
d He
aths
Sem
i-nat
ural
Gra
ssla
nd
0
0.05
HiLowPresent
Hi
Low
HiLowPresent
Hi
Low
HiLowPresent
Local Stewardship (LS)
Go with the Flow (GF)
National Security (NS)
b)
b)a)
0.2
0.1
0.15
0.25
Coas
tal
Mar
gins
Enclo
sed
Far
mla
nd
Urba
n
Mar
ine
Woo
dlan
ds
Fres
hwat
ers
Mou
ntai
ns,
Moo
rland
san
d He
aths
Sem
i-nat
ural
Gra
ssla
nd
0
0.05
a)
0
5
10
15
30
25
20
40
35
45
Regu
latin
g
Prov
ision
ing
Cultu
ral
HiLowPresent
Hi
Low
Figure 25.19 continued. Change in ecosystem services across six scenarios compared to the present based on projected changes in habitat stock and condition. For National Security a) Broad Habitats and b) ecosystem services. For Local Stewardship a) Broad Habitats and b) ecosystem services. For Go with the Flow a) Broad Habitats and b) ecosystem services. Present, Low and Hi refer to Present, Low and High climate change impacts.
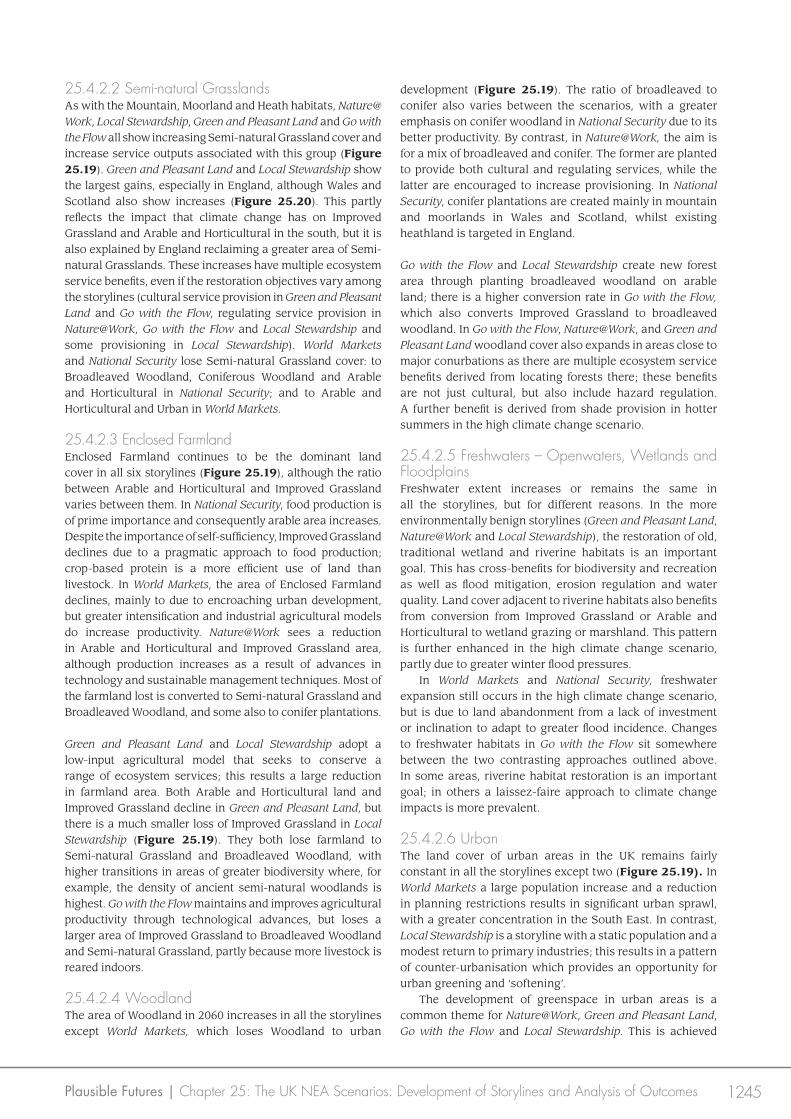
1245Plausible Futures | Chapter 25: The UK NEA Scenarios: Development of Storylines and Analysis of Outcomes
25.4.2.2 Semi-natural GrasslandsAs with the Mountain, Moorland and Heath habitats, Nature@Work, Local Stewardship, Green and Pleasant Land and Go with the Flow all show increasing Semi-natural Grassland cover and increase service outputs associated with this group (Figure 25.19). Green and Pleasant Land and Local Stewardship show the largest gains, especially in England, although Wales and Scotland also show increases (Figure 25.20). This partly reflects the impact that climate change has on Improved Grassland and Arable and Horticultural in the south, but it is also explained by England reclaiming a greater area of Semi-natural Grasslands. These increases have multiple ecosystem service benefits, even if the restoration objectives vary among the storylines (cultural service provision in Green and Pleasant Land and Go with the Flow, regulating service provision in Nature@Work, Go with the Flow and Local Stewardship and some provisioning in Local Stewardship). World Markets and National Security lose Semi-natural Grassland cover: to Broadleaved Woodland, Coniferous Woodland and Arable and Horticultural in National Security; and to Arable and Horticultural and Urban in World Markets.
25.4.2.3 Enclosed Farmland Enclosed Farmland continues to be the dominant land cover in all six storylines (Figure 25.19), although the ratio between Arable and Horticultural and Improved Grassland varies between them. In National Security, food production is of prime importance and consequently arable area increases. Despite the importance of self-sufficiency, Improved Grassland declines due to a pragmatic approach to food production; crop-based protein is a more efficient use of land than livestock. In World Markets, the area of Enclosed Farmland declines, mainly to due to encroaching urban development, but greater intensification and industrial agricultural models do increase productivity. Nature@Work sees a reduction in Arable and Horticultural and Improved Grassland area, although production increases as a result of advances in technology and sustainable management techniques. Most of the farmland lost is converted to Semi-natural Grassland and Broadleaved Woodland, and some also to conifer plantations.
Green and Pleasant Land and Local Stewardship adopt a low-input agricultural model that seeks to conserve a range of ecosystem services; this results a large reduction in farmland area. Both Arable and Horticultural land and Improved Grassland decline in Green and Pleasant Land, but there is a much smaller loss of Improved Grassland in Local Stewardship (Figure 25.19). They both lose farmland to Semi-natural Grassland and Broadleaved Woodland, with higher transitions in areas of greater biodiversity where, for example, the density of ancient semi-natural woodlands is highest. Go with the Flow maintains and improves agricultural productivity through technological advances, but loses a larger area of Improved Grassland to Broadleaved Woodland and Semi-natural Grassland, partly because more livestock is reared indoors.
25.4.2.4 WoodlandThe area of Woodland in 2060 increases in all the storylines except World Markets, which loses Woodland to urban
development (Figure 25.19). The ratio of broadleaved to conifer also varies between the scenarios, with a greater emphasis on conifer woodland in National Security due to its better productivity. By contrast, in Nature@Work, the aim is for a mix of broadleaved and conifer. The former are planted to provide both cultural and regulating services, while the latter are encouraged to increase provisioning. In National Security, conifer plantations are created mainly in mountain and moorlands in Wales and Scotland, whilst existing heathland is targeted in England.
Go with the Flow and Local Stewardship create new forest area through planting broadleaved woodland on arable land; there is a higher conversion rate in Go with the Flow, which also converts Improved Grassland to broadleaved woodland. In Go with the Flow, Nature@Work, and Green and Pleasant Land woodland cover also expands in areas close to major conurbations as there are multiple ecosystem service benefits derived from locating forests there; these benefits are not just cultural, but also include hazard regulation. A further benefit is derived from shade provision in hotter summers in the high climate change scenario.
25.4.2.5 Freshwaters – Openwaters, Wetlands and FloodplainsFreshwater extent increases or remains the same in all the storylines, but for different reasons. In the more environmentally benign storylines (Green and Pleasant Land, Nature@Work and Local Stewardship), the restoration of old, traditional wetland and riverine habitats is an important goal. This has cross-benefits for biodiversity and recreation as well as flood mitigation, erosion regulation and water quality. Land cover adjacent to riverine habitats also benefits from conversion from Improved Grassland or Arable and Horticultural to wetland grazing or marshland. This pattern is further enhanced in the high climate change scenario, partly due to greater winter flood pressures. In World Markets and National Security, freshwater expansion still occurs in the high climate change scenario, but is due to land abandonment from a lack of investment or inclination to adapt to greater flood incidence. Changes to freshwater habitats in Go with the Flow sit somewhere between the two contrasting approaches outlined above. In some areas, riverine habitat restoration is an important goal; in others a laissez-faire approach to climate change impacts is more prevalent.
25.4.2.6 UrbanThe land cover of urban areas in the UK remains fairly constant in all the storylines except two (Figure 25.19). In World Markets a large population increase and a reduction in planning restrictions results in significant urban sprawl, with a greater concentration in the South East. In contrast, Local Stewardship is a storyline with a static population and a modest return to primary industries; this results in a pattern of counter-urbanisation which provides an opportunity for urban greening and ‘softening’. The development of greenspace in urban areas is a common theme for Nature@Work, Green and Pleasant Land, Go with the Flow and Local Stewardship. This is achieved
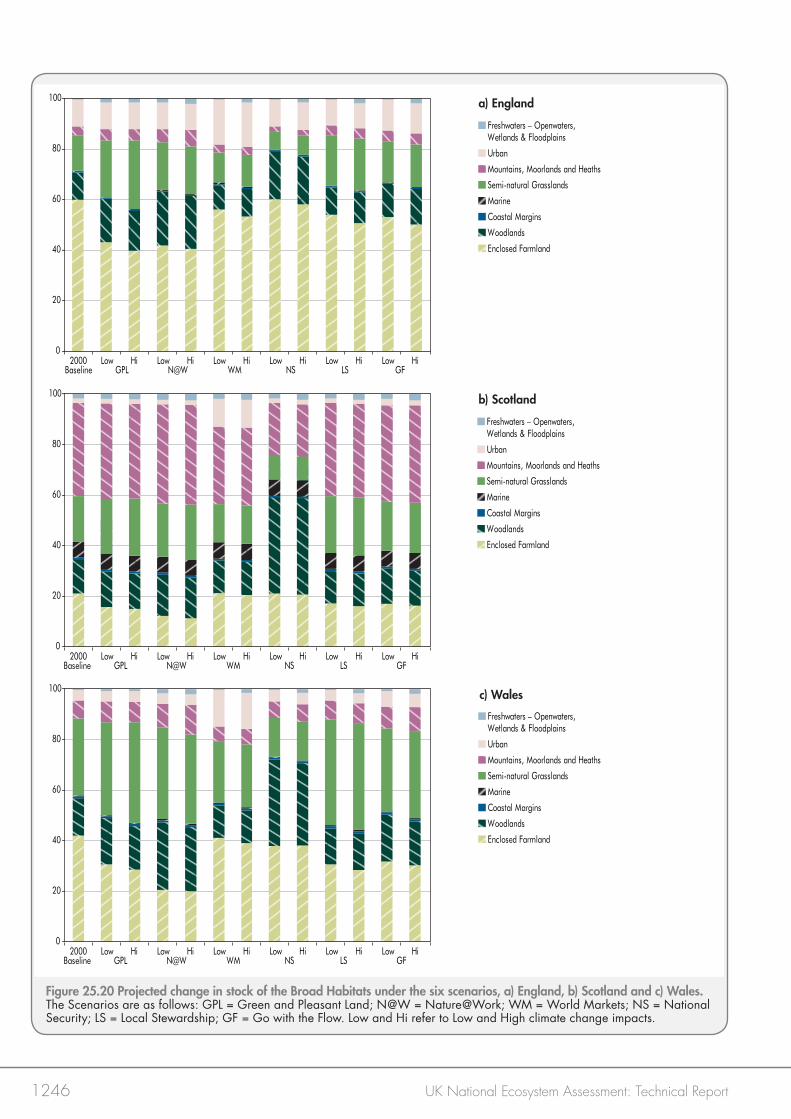
1246 UK National Ecosystem Assessment: Technical Report
Figure 25.20 Projected change in stock of the Broad Habitats under the six scenarios, a) England, b) Scotland and c) Wales. The Scenarios are as follows: GPL = Green and Pleasant Land; N@W = Nature@Work; WM = World Markets; NS = National Security; LS = Local Stewardship; GF = Go with the Flow. Low and Hi refer to Low and High climate change impacts.
0
20
40
60
80
100
2000Baseline
LowGPL
Hi LowN@W
Hi LowWM
Hi LowNS
Hi LowLS
Hi LowGF
Hi
a) England
0
20
40
60
80
100
2000Baseline
LowGPL
Hi LowN@W
Hi LowWM
Hi LowNS
Hi LowLS
Hi LowGF
Hi
Freshwaters – Openwaters, Wetlands & Floodplains
Urban
Mountains, Moorlands and Heaths
Semi-natural Grasslands
Marine
Coastal Margins
Woodlands
Enclosed Farmland
c) Wales
0
20
40
60
80
100
2000Baseline
LowGPL
Hi LowN@W
Hi LowWM
Hi LowNS
Hi LowLS
Hi LowGF
Hi
Freshwaters – Openwaters, Wetlands & Floodplains
Urban
Mountains, Moorlands and Heaths
Semi-natural Grasslands
Marine
Coastal Margins
Woodlands
Enclosed Farmland
b) Scotland
0
20
40
60
80
100
2000Baseline
LowGPL
Hi LowN@W
Hi LowWM
Hi LowNS
Hi LowLS
Hi LowGF
Hi
Freshwaters – Openwaters, Wetlands & Floodplains
Urban
Mountains, Moorlands and Heaths
Semi-natural Grasslands
Marine
Coastal Margins
Woodlands
Enclosed Farmland
0
20
40
60
80
100
2000Baseline
LowGPL
Hi LowN@W
Hi LowWM
Hi LowNS
Hi LowLS
Hi LowGF
Hi
0
20
40
60
80
100
2000Baseline
LowGPL
Hi LowN@W
Hi LowWM
Hi LowNS
Hi LowLS
Hi LowGF
Hi
1247Plausible Futures | Chapter 25: The UK NEA Scenarios: Development of Storylines and Analysis of Outcomes
either through creating parks, gardens or open spaces (Green and Pleasant Land, Go with the Flow) or through the creation of green areas with a focus on food production as well as recreation (allotments, permaculture gardens and urban farms in Nature@Work and Local Stewardship). The management of water in urban areas is also considered important. In Nature@Work, Green and Pleasant Land and Go with the Flow, rivers, lakes and ponds are restored, protected, re-channelled and managed to ensure connectivity for wildlife through towns and cities. Recreation and flood mitigation is also improved.
25.4.2.7 Coastal Margins and MarineThe extent of Coastal Margin habitats is constant in all the storylines except for World Markets. In this narrative, industrial expansion in the form of ports, petrochemical plants, desalination plants, housing (particularly in the south) and tourism squeeze much of the remaining Coastal Margins habitat out. Better management of coastal habitats is assumed to occur in Nature@Work, Green and Pleasant Land and Local Stewardship, and all adopt a stronger ecosystem and land-/seascape approach to ecosystem service delivery; this results in the conversion of Arable and Horticultural , Improved Grassland and some conifer patches being to Coastal Margins habitats. In Go with the Flow (as well as Nature@Work, Green and Pleasant Land and Local Stewardship), climate change adaptation is important, and some Arable and Horticultural and Improved Grassland is lost to coast habitats due to the pressure of sea-level increases. Extreme sea-level rise results in a small amount of coastal habitat being lost to sea in all the storylines; this loss is probably lower in Nature@Work and National Security (both with very proactive adaptation schemes in place) and higher in Green and Pleasant Land (a laissez-faire approach) and World Markets (no planned adaptation). The comparison between scenarios shown in Figure 25.19 is exploratory and further research is required to establish more robust, evidence-based measures of the output of each service per unit area. Only then could reliable comparisons between scenarios be made using the different projections of land cover change. Two significant gaps in our knowledge that need to be resolved before the scenario work can be taken forward are a better understanding of the way modifications in habitat condition impact on service output, and the relative importance of the different habitats in terms of overall service output. To illustrate the kind of analysis that might be possible if we had a better understanding of how the capacity to supply a service varied between habitats, the land cover projections for each scenario have been used to estimate differences in the amount of carbon stored in vegetation in 2060 (Figure 25.21). The estimates of carbon density for the major land cover types are taken from Milne & Brown (1997), and they have been assumed not to change over the period covered by the scenarios. For comparison, Figure 25.21 includes an inset of the mapping by Milne & Brown (1997) for present conditions. Some of the differences between our mapping of the present (Figure 25.21a) and that of Milne & Brown (1997) arise because they used the Institute of Terrestrial Ecology (ITE) Land Classes to make their assessment, which
resulted in a somewhat coarser picture. However, in general terms there appears to be good agreement between the two maps. The high levels of vegetation carbon in the South East are apparent in both maps, as is the belt north east from Hampshire into Lincolnshire. The high values in the South West, Wales and north east Scotland are also apparent on both maps. Figure 25.21 b & c show projections for vegetation carbon in 2060 for two scenarios, Nature@Work and World Markets. In both cases the low climate change projection has been used. The scenarios suggest that there are significant changes in the geographical patterns, with increases observed under Nature@Work in the south and west compared to the present. This is driven by the expansion of Woodland cover and the conversion of some Enclosed Farmland to Semi-natural Grasslands. The patterns under World Markets are much more similar to the present in the lowlands. For this scenario the greatest changes appear to be in the uplands where some increases are apparent due to abandonment and Woodland expansion. The analysis presented in Figure 25.21 clearly makes a number of simplifying assumptions about the nature of land cover change (e.g. that Woodland expansion has resulted in fully mature stands by 2060), and takes no account of the differences in carbon storage in soils. However, it illustrates the kind of analysis based on land cover that might be attempted if we had better unit area estimates of service output for particular habitats or habitat groups. The issue of how we can use projections of land cover change to model ecosystem service outcomes is also addressed in the UK NEA chapter dealing with the economic valuation of scenario outcomes (Chapter 26).
25.5 The UK NEA and Scenario Methodologies
25.5.1 Scenarios: Products or Processes?Although the methods for scenario building developed in the MA set the context for the UK NEA work (see Ash et al. 2010), the complexities of such exercises should not be underestimated. Although widely applied and discussed, the use of scenarios is controversial and there is no single approach that is acceptable to all. Bradfield et al. (2005) observe, for example, that while scenarios have been used for more than three decades, a number of methodological issues are unresolved. In preparation for the UK NEA exercise, a reading of the large body of work concerned with scenario development (e.g. De Jouvenel 2000; Alcamo 2001; van Notten et al. 2003; Börjeson et al. 2006; Bishop et al. 2007; O’Neill et al. 2008; Wilkinson & Eidinow 2008) confirmed this view. The situation arises, Bradfield et al. (2005) suggest, because of the many conflicting definitions, principles and ideas about scenarios that exist in the literature, and the fact that terms such as ‘planning’, ‘thinking’, ‘forecasting’, ‘analysis’ and ‘learning’ are all variously used in describing
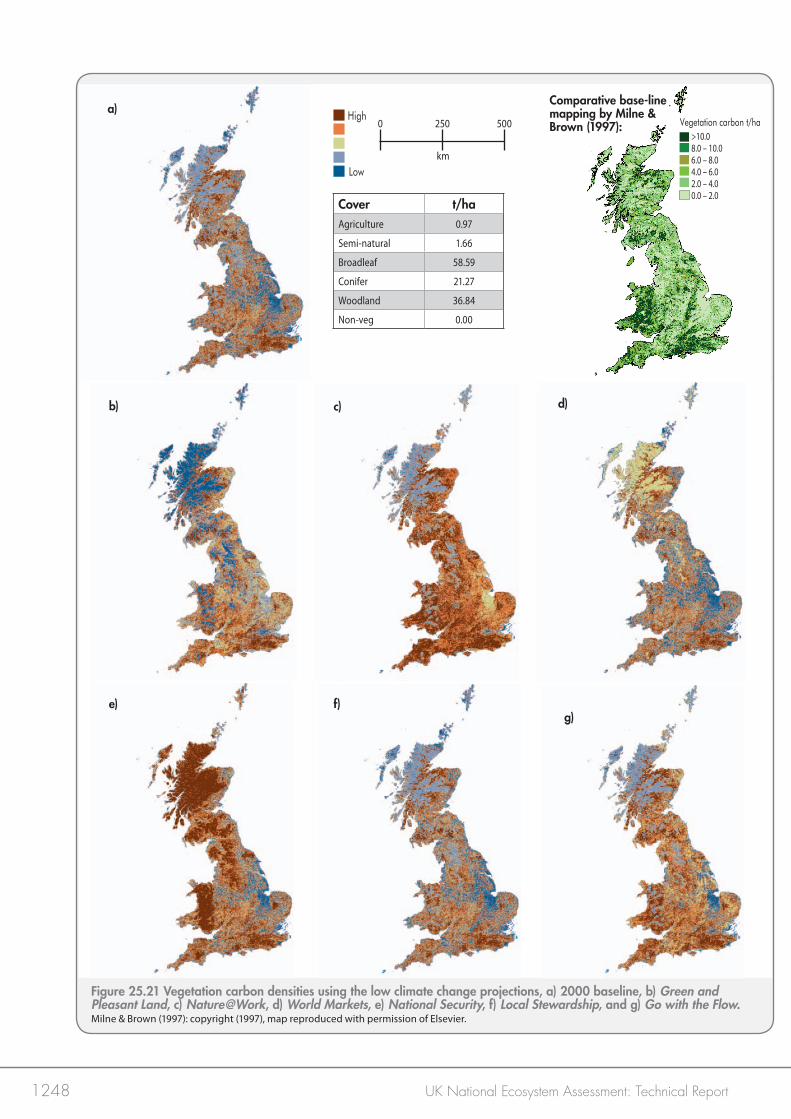
1248 UK National Ecosystem Assessment: Technical Report
Vegetation carbon t/ha>10.08.0 – 10.06.0 – 8.04.0 – 6.02.0 – 4.00.0 – 2.0
b)
a)
c) d)
e) f)g)
Comparative base-line mapping by Milne & Brown (1997):
Low
High0 250 500
km
Cover t/haAgriculture 0.97
Semi-natural 1.66
Broadleaf 58.59
Conifer 21.27
Woodland 36.84
Non-veg 0.00
Figure 25.21 Vegetation carbon densities using the low climate change projections, a) 2000 baseline, b) Green and Pleasant Land, c) Nature@Work, d) World Markets, e) National Security, f) Local Stewardship, and g) Go with the Flow. Milne & Brown (1997): copyright (1997), map reproduced with permission of Elsevier.
1249Plausible Futures | Chapter 25: The UK NEA Scenarios: Development of Storylines and Analysis of Outcomes
what scenarios might be used for. The tension between the forecasting and learning perspectives is particularly acute, and it is one that has recurred throughout the current work. O’Neill et al. (2008) have recently set out some of the issues, and suggest that a theme that is evident in recent debates is the dichotomy between two contrasting perspectives on the role of scenarios, namely ‘scenarios as products and scenarios as processes’. Wilkinson & Eidinow (2008) make a similar point, and argue that often ‘… environmental scenarios are produced with enthusiasm but deployed with limited effect’ because this dichotomy is not fully addressed. This situation comes about, they claim, because people often neglect to examine the nature and scope of the knowledge and beliefs that underlie the different scenario approaches, and as a result they fail to get to grips with ‘wicked’ problems that characterise debates about environmental change. They propose a new typology for scenario studies to help guide future work and resolve the tension between ‘problem-focused’ and ‘actor-centric’ approaches to scenario construction. It involves a more hybrid approach to scenario construction. These discussions about the different purposes of scenario construction are relevant in any review of the approach used in the UK NEA, which has sought to assemble and make available the best current scientific information to users and stimulate new approaches to monitoring and planning for ecosystem services based on their importance for human well-being. It is useful, therefore, to consider the methodological questions surrounding scenarios in more detail so that the work can be better located in these different conceptual frameworks. The ‘product’ perspective recognised by O’Neill et al. (2008) is one that views scenarios as mainly helping users to understand ‘environmental outcomes produced, how they relate to the various factors driving them, and what the results tell us about the prospects for future environmental change, for impacts, and for mitigation’ (O’Neill et al. 2008). This perspective often leads to the belief that scenarios ultimately have ‘lives of their own, divorced from the processes that generated them…’ (O’Neill et al. 2008). By contrast, the ‘process-perspective’ emphasises the importance of scenario building as a way of encouraging social learning within and between diverse groups, of finding synergies between different viewpoints, of consensus building, and of developing shared responsibilities for problem solving. From this perspective, the scenarios themselves are perhaps less important than the dialogue generated in their production, and the legacy that those dialogues leave. Thus, although the MA framework provided a guide for the UK NEA, it was felt that the process aspect of the framework was one that needed greater emphasis in the UK. While the importance of deliberation is emphasised in the published overview of the MA approach, given the time that has elapsed since their publication, the MA scenarios tend now to be regarded more as products to be used, rather than modified and refined through further discussion. The tendency to treat the MA scenarios as a ‘given’ is strengthened by the fact that they were, to a large extent, model-based and are therefore inherently more difficult to manipulate in any follow-up study. It was therefore concluded that the MA scenarios could not
simply be customised or scaled down for UK NEA purposes, because this approach would not fully capture UK concerns. The extent to which the MA approach to scenario building was essentially product- or process-orientated must be debated elsewhere. For those constructing the UK NEA scenarios, the important point was to pursue an approach that was most appropriate in the national context. Thus, it was considered important that the work should take account of, and build on, other national scenario exercises that had been undertaken, such as Land Use Foresight (FLUF 2010) and the UKCIP (Hulme et al. 2002). It was also felt that the scenarios should be built around a set of focal questions generated by potential users of the UK NEA outputs, and that the work should, where appropriate, reflect any differences between the countries that make up the UK. As a result, a purpose-built set of storylines has been constructed using a more deliberative, process-based approach. It could be argued that the process/product dichotomy is not as stark as that described by other commentators, because it is clear that different types of approach may be needed at different points in the development of policy or management responses. The early stages of scenario building are inevitably exploratory and when different stakeholders are involved, they must involve a significant learning process, as people try to make sense of a complex range of drivers and driver interactions that describe different aspects of the future. If these shared understandings result in a distinct and interesting set of narratives that people can begin to work with (whether they have been involved in the scenario building or not), the scenarios may take on more of the character of a product—as they must if they are to contribute to the later phases of policy development. It is in these later phases when people start to use scenarios more as products to identify policy options (e.g. by asking such questions as, ‘What would we do if we found ourselves in this future?’), or to test identified policy options (as in, ‘If we apply this policy idea, will it have the impact we want it to?’). The key, it seems, to avoiding the problem that scenarios can be deployed with ‘limited effect’ (Wilkinson & Eidinow 2008) is to ensure that participants understand what stage of the policy cycle they are in, and how engaging with the scenarios can deliver the required outcomes. One view of the current UK NEA scenarios is, therefore, that they are transitional between the process and product phases of development. The work presented here documents a range of concerns of potential users and translates them into a set of storylines that must be refined further. Although we have sought to quantify them, at this stage the mapping is intended more to help people examine their plausibility and implied contrasts, than to draw any firm conclusions about current policy or management approaches. The questions that further work needs to address must include: whether the contrasts represented by the different narratives sufficiently capture user concerns; whether their internal logics are sufficiently robust to justify the projections of change; how the process-response evidence on which they are based can be refined; and, how we might better quantify the scenario outcomes and the differences between the storylines so that the implications of the different sets of assumptions can be examined in detail.
1250 UK National Ecosystem Assessment: Technical Report
25.5.2 Judging SuccessRecent discussions of methodological questions have identified a second aspect of scenario construction that needs to be considered, namely: what criteria are used to judge the success of any exercise. Although it is widely acknowledged that scenario building is not about trying to predict the future, but is about identifying a range of possible futures that might unfold, notions of ‘predictive success’ often enter into and sometimes shape discussions—and these issues need to be addressed here when reviewing the outcomes of the UK NEA work. In the context of climate change studies, Hulme & Dessai (2008) have looked at the ‘predictive success’ of scenarios alongside two other potential outcome measures, namely ‘decision success’ and ‘learning success’, and emphasised just how misleading it can be in scientific terms to regard them as the ‘prophetic devices’. Problems include the fact that, by looking to predictive success we often try, inappropriately, to make a judgement about which scenario from a family of scenarios is ‘better’ or ‘more accurate’, when the actual outcomes are within the plausible or probable range of many of them. We might add that if we have to wait for outcomes to judge the success of a scenario study, then there is little point in building them in the first place. They therefore suggest that perhaps other ways of judging the success of scenarios are needed. For Hulme & Dessai (2008), the idea of ‘decision success’ involves asking whether the judgments made on the basis of a scenario-building exercise were ‘good ones’. They find this also to be problematic. Like notions of predictive efficacy, they feel that this measure also embodies an ‘instrumentalist position’ that essentially regards scenarios as products. These authors argue that measures based on ‘decision success’ only make sense if we move away from judging decisions by some kind of retrospective analysis of outcomes, to look at the robustness of the decision-making processes themselves. A key test, they suggest, is whether the scenario exercise allowed the full range of uncertainties surrounding an issue to be considered by the decision makers. This suggestion helps bring the assessment of the success of scenario building into the ‘here and now’, but as a measure it is difficult to apply, because we cannot know what should be included if situations are uncertain. This is certainly the case with the UK NEA scenarios. It is clearly too soon to consider the nature of any decisions that might be made in relation to them. As indicated above, further deliberation with stakeholders is needed to ensure that they capture the full range of concerns. However, while the present work is still at a preliminary stage, it is clear that even in their present form, the scenarios do start to pose challenges that decision makers might want to consider and examine further. For example, the contrasts between Green and Pleasant Land and Nature@Work do seem to suggest that there might be gains in developing policies around ecosystem service rather than biodiversity and conservation alone, and that both are probably better than Go with the Flow. Although difficult to measure, the extent to which scenario building leads to effective social learning is, according to Hulme & Dessai (2008), probably the most appropriate test of the success of such studies. In fact, this
kind of measure is closer to the original intention of scenario studies, which was to introduce ideas about alternative and multiple views of possible futures into discussions so that different strategies and plans could be examined. Learning success is, they suggest, also more lasting that ‘product outcomes’, because these can rapidly become outdated as the relationships between the science, society and policy communities continue to evolve. In this context it is worth noting how many of the questions suggested in our consultations with potential users were about wanting to understand mechanisms and processes, rather than the implications for future trends (Appendix 25.1). These responses suggest that the UK NEA in general must address these broader social-learning or awareness-raising issues if progress is to be made. Garb et al. (2008) have argued that if we recognise that scenarios ‘shape and embed their social contexts’, they can be used more effectively as decision-support tools. If we consider the set of focal questions suggested by the UK NEA stakeholders, then it is undoubtedly the case that they reflect the concerns of a particular interest group. They obviously focus heavily on ecosystem services and the conditions under which they might flourish or be diminished, and in many cases possibly give a higher priority to environmental issues than others might do. The UK NEA itself represents a particular environmental paradigm, one that seeks to explore a utilitarian view of nature. Thus, while further work might involve refining the storylines with UK NEA stakeholders, it is probably just as important to go beyond these groups to examine other reactions. All storylines will involve both ‘goods’ and ‘bads’, and only by talking to others might a richer understanding of the implications of particular sets of assumptions be established. The argument about the importance of process in scenario development is not, it seems, just about encouraging greater levels of participation. As Wilkinson & Eidinow (2008) suggest, it is perhaps more about ensuring that participatory processes are effective. These authors reviewed current scenario typologies and concluded overall that a modified approach to the process of developing scenarios was needed. It is not simply a matter, they argue, of understanding who is involved and their respective world views, but understanding better the ‘... aims, intentions and underlying epistemological assumptions of those participating in the process’ (Wilkinson & Eidinow 2008, p6). They proposed a reflexive interventionist or multi-agent-based approach (RIMA) to scenario building that tries to avoid simple consensus, but accepts that ‘knowledge is multiple, temporary and dependent on context—with different points of view providing a constant challenge to any existing viewpoint or system’ (Wilkinson & Eidinow 2008). Moss et al. (2010) have also argued that more pluralistic and iterative approaches to the construction of scenarios may be appropriate in the context of the climate change debate, in order to better explore and evaluate different adaptation needs and strategies, the options available for mitigation, and the understanding of feedbacks between biophysical and social systems. Both positions imply that future deliberations on the UK NEA scenarios must include wider circles of views.
1251Plausible Futures | Chapter 25: The UK NEA Scenarios: Development of Storylines and Analysis of Outcomes
The conclusion one may draw from these debates about scenario methodologies is that there is no ‘best way’ of building them, or any simple recipe that guarantees success. Having argued the case for RIMA, Wilkinson & Eidinow (2008), for example, ‘draw back’ from prescribing how the approach might be made operational. However, on the basis of their review, O’Neill et al. (2008) do usefully set out a number of points that those embarking on scenario construction might consider in relation to the lessons that might be drawn from recent debates (Table 25.7). These points are useful in judging the current work undertaken for the UK NEA. The issue of transparency (Table 25.7 point 2), for example, has been highlighted as an important part of the work, as well as the need to structure the exercise around a set of user-defined focal questions (point 1, Table 25.7). The need to include reference to social processes in the scenarios (point 4), so as to help understand different future transition pathways, was also acknowledged in emphasising the links that had to be made to the discussions of the response group (see Chapter 27). Finally, disaggregation of outputs (points 3 and 6, Table 25.7) was also flagged up as an early aim of the scenario work, as evidenced by the recognition that outputs would have to be differentiated across different types of users (especially to take account of the various ‘country interests’)
and across space (to help identify how potential synergies and trade-offs express themselves and to understand where particular sensitivities lie in relation to different drivers of change). The value of making scenarios spatially explicit was not one that was highlighted as important by O’Neill et al. (2008) and others. Nevertheless, it is an important feature of the UK NEA exercise, because mapping outcomes could potentially help make assumptions clearer and allow plausibility to be looked at more closely (cf. Hulme & Dessai 2008). It has also enabled economic valuation tools to be applied in the context of scenario work, and provide insights into the sorts of marginal gains and losses that might be associated with different kinds of future (Chapter 26). The issue of confronting and building on the different world views represented by the various interest groups associated with the UK NEA (point 7) was also captured by the attempt to ground the exercise on a set of focal questions. To help in this process, those consulted were encouraged to forecast and extrapolate from the present using different assumption sets, and also to ‘backcast’ from some set of desired goals. With backcasting, users are asked to identify some target future and think through the kinds of pathway that might achieve it, and identify the barriers that might lie in the way. However, our work with stakeholders and expert contributors to the UK NEA has revealed that there are very different world views, and the tension between those who see scenarios mainly from the ‘product’ and ‘process’ perspectives was certainly evident in the group. It has been recognised from the outset, however, that it was important that the UK NEA should leave a legacy, and it is clear that part of this must be the social learning that is begun or achieved through the initiative. Many of the remaining points made in Table 25.7 concern these social and institutional issues, and while they are important, they are not ones that can be resolved just by devising the scenarios. Rather, they must be judged in the context of the success of the UK NEA as a whole. The gaps in knowledge that we faced in building scenarios are the same gaps that have be to confronted by the whole assessment exercise, and ultimately the robustness of the scenarios depends on the strength of the current evidence base that is available.
25.6 Working with the UK NEA Scenarios
The UK will not be guaranteed the ecosystem services it needs automatically, and all parts of the country will not necessarily be guaranteed access to these services. Consequently, the government and its stakeholders will need to work together to make choices about the levels and patterns of investment required to secure the quality of life that we want now and for future generations. Making choices of this type is not always straightforward. In a world of rapid change and increasing uncertainty, it can be difficult to know what the right choices are, and different
Table 25.7 Recommendations for Improving Scenario Development. Source: adapted from O’Neill et al. (2008).
1. Focus scenario exercises on specific questions so that results from multiple models can be more illuminating.
2. Enhance scenario transparency so as to enable extensions by users, rather than further expanding representation in global scenarios themselves.
3. Incorporate relatively simple measures (such as sub-national disaggregation of income distributions and climate change impacts) to boost the equity sensitivity of scenarios.
4. Recognise topics where social science inputs are becoming important for improving modelling and model relevance, such as providing a logic for how societies manage to transition from historical paths to the various future development paths foreseen in the scenarios, or developing measures of well-being which are independent of income levels, and include in global environmental scenario teams more representatives of social science professionals.
5. Invest greater resources in assessing scenario results, and in understanding and overcoming the barriers to carrying out such assessment.
6. Disaggregate the variety of global change decision makers targeted as audiences for scenarios.
7. Develop an additional ‘reflective interventionist’ scenarios approach that involves different epistemologies for active learning in the public interest.
8. Draw on the extensive toolkit of social science research methods to analyse the social work of scenarios.
9. Create new institutions and scenario activities that can adapt and extend global scenarios to specific, often local or regional decision contexts.
10. Create fora in which scenario practitioners, modellers, decision-makers, and social scientists of various kinds can discuss the process of scenario construction and use.
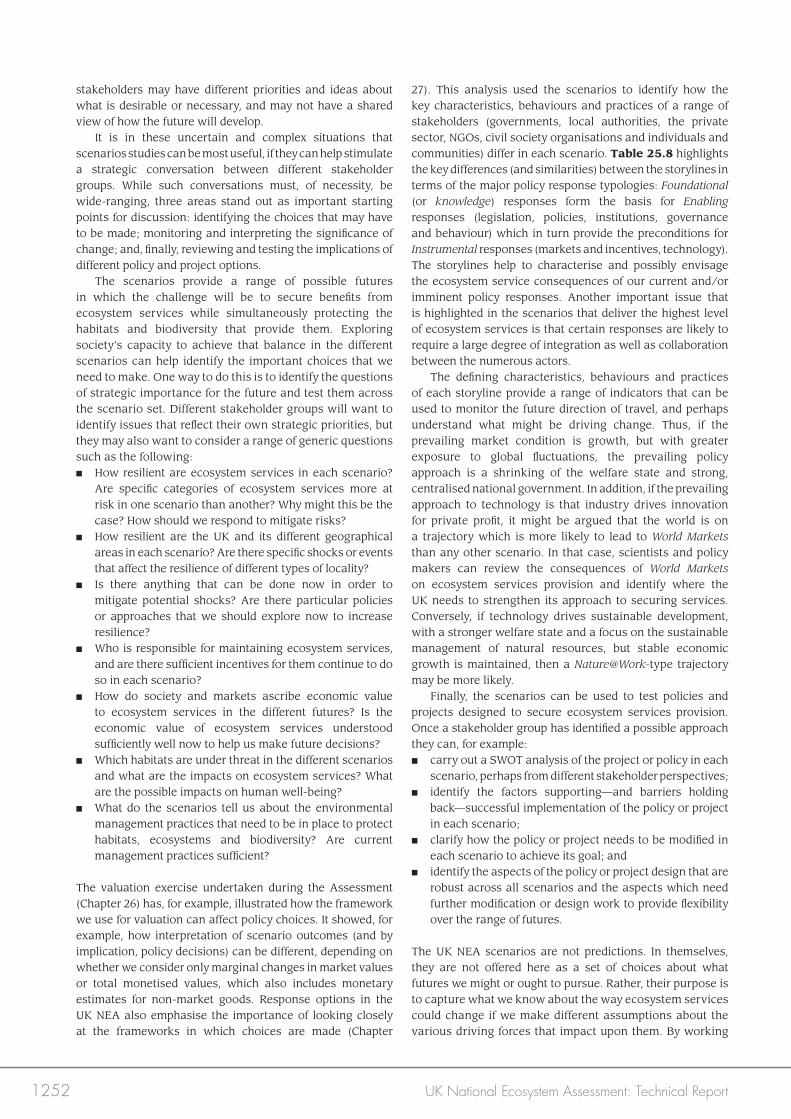
1252 UK National Ecosystem Assessment: Technical Report
stakeholders may have different priorities and ideas about what is desirable or necessary, and may not have a shared view of how the future will develop. It is in these uncertain and complex situations that scenarios studies can be most useful, if they can help stimulate a strategic conversation between different stakeholder groups. While such conversations must, of necessity, be wide-ranging, three areas stand out as important starting points for discussion: identifying the choices that may have to be made; monitoring and interpreting the significance of change; and, finally, reviewing and testing the implications of different policy and project options. The scenarios provide a range of possible futures in which the challenge will be to secure benefits from ecosystem services while simultaneously protecting the habitats and biodiversity that provide them. Exploring society’s capacity to achieve that balance in the different scenarios can help identify the important choices that we need to make. One way to do this is to identify the questions of strategic importance for the future and test them across the scenario set. Different stakeholder groups will want to identify issues that reflect their own strategic priorities, but they may also want to consider a range of generic questions such as the following:■ How resilient are ecosystem services in each scenario?
Are specific categories of ecosystem services more at risk in one scenario than another? Why might this be the case? How should we respond to mitigate risks?
■ How resilient are the UK and its different geographical areas in each scenario? Are there specific shocks or events that affect the resilience of different types of locality?
■ Is there anything that can be done now in order to mitigate potential shocks? Are there particular policies or approaches that we should explore now to increase resilience?
■ Who is responsible for maintaining ecosystem services, and are there sufficient incentives for them continue to do so in each scenario?
■ How do society and markets ascribe economic value to ecosystem services in the different futures? Is the economic value of ecosystem services understood sufficiently well now to help us make future decisions?
■ Which habitats are under threat in the different scenarios and what are the impacts on ecosystem services? What are the possible impacts on human well-being?
■ What do the scenarios tell us about the environmental management practices that need to be in place to protect habitats, ecosystems and biodiversity? Are current management practices sufficient?
The valuation exercise undertaken during the Assessment (Chapter 26) has, for example, illustrated how the framework we use for valuation can affect policy choices. It showed, for example, how interpretation of scenario outcomes (and by implication, policy decisions) can be different, depending on whether we consider only marginal changes in market values or total monetised values, which also includes monetary estimates for non-market goods. Response options in the UK NEA also emphasise the importance of looking closely at the frameworks in which choices are made (Chapter
27). This analysis used the scenarios to identify how the key characteristics, behaviours and practices of a range of stakeholders (governments, local authorities, the private sector, NGOs, civil society organisations and individuals and communities) differ in each scenario. Table 25.8 highlights the key differences (and similarities) between the storylines in terms of the major policy response typologies: Foundational (or knowledge) responses form the basis for Enabling responses (legislation, policies, institutions, governance and behaviour) which in turn provide the preconditions for Instrumental responses (markets and incentives, technology). The storylines help to characterise and possibly envisage the ecosystem service consequences of our current and/or imminent policy responses. Another important issue that is highlighted in the scenarios that deliver the highest level of ecosystem services is that certain responses are likely to require a large degree of integration as well as collaboration between the numerous actors. The defining characteristics, behaviours and practices of each storyline provide a range of indicators that can be used to monitor the future direction of travel, and perhaps understand what might be driving change. Thus, if the prevailing market condition is growth, but with greater exposure to global fluctuations, the prevailing policy approach is a shrinking of the welfare state and strong, centralised national government. In addition, if the prevailing approach to technology is that industry drives innovation for private profit, it might be argued that the world is on a trajectory which is more likely to lead to World Markets than any other scenario. In that case, scientists and policy makers can review the consequences of World Markets on ecosystem services provision and identify where the UK needs to strengthen its approach to securing services. Conversely, if technology drives sustainable development, with a stronger welfare state and a focus on the sustainable management of natural resources, but stable economic growth is maintained, then a Nature@Work-type trajectory may be more likely. Finally, the scenarios can be used to test policies and projects designed to secure ecosystem services provision. Once a stakeholder group has identified a possible approach they can, for example:■ carry out a SWOT analysis of the project or policy in each
scenario, perhaps from different stakeholder perspectives;■ identify the factors supporting—and barriers holding
back—successful implementation of the policy or project in each scenario;
■ clarify how the policy or project needs to be modified in each scenario to achieve its goal; and
■ identify the aspects of the policy or project design that are robust across all scenarios and the aspects which need further modification or design work to provide flexibility over the range of futures.
The UK NEA scenarios are not predictions. In themselves, they are not offered here as a set of choices about what futures we might or ought to pursue. Rather, their purpose is to capture what we know about the way ecosystem services could change if we make different assumptions about the various driving forces that impact upon them. By working
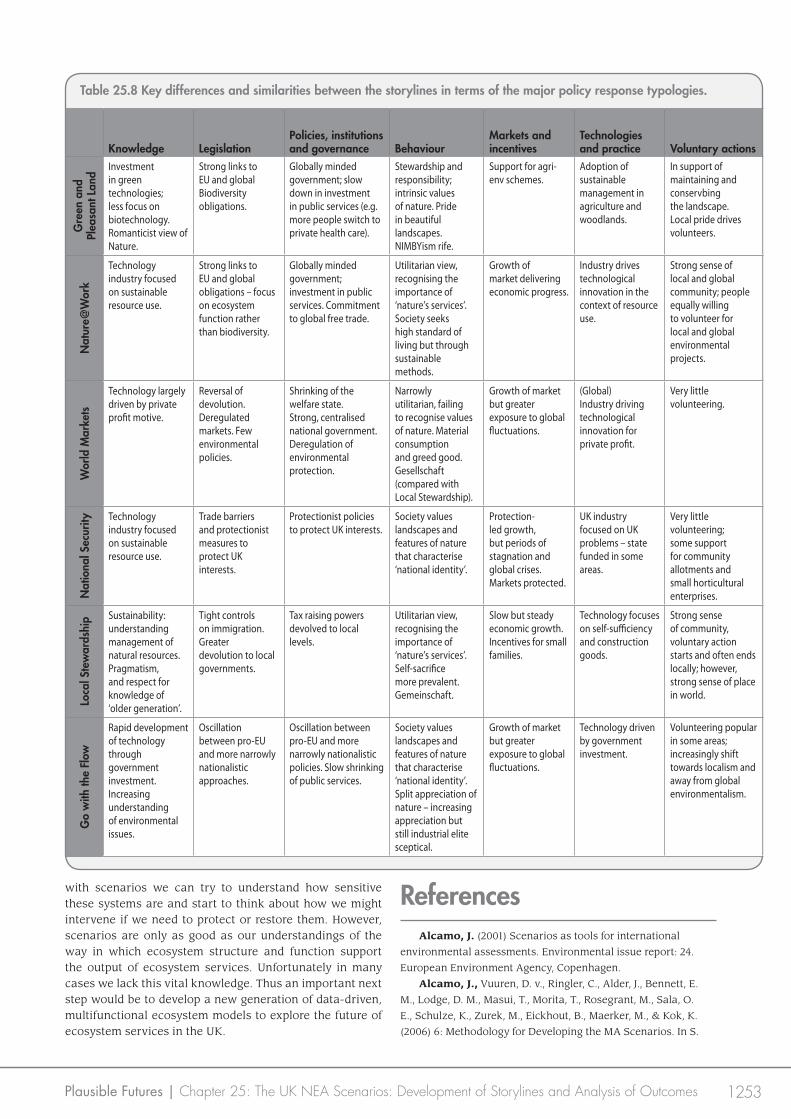
1253Plausible Futures | Chapter 25: The UK NEA Scenarios: Development of Storylines and Analysis of Outcomes
Knowledge LegislationPolicies, institutions and governance Behaviour
Markets and incentives
Technologies and practice Voluntary actions
Gre
en a
nd
Plea
sant
Lan
d
Investment in green technologies; less focus on biotechnology. Romanticist view of Nature.
Strong links to EU and global Biodiversity obligations.
Globally minded government; slow down in investment in public services (e.g. more people switch to private health care).
Stewardship and responsibility; intrinsic values of nature. Pride in beautiful landscapes. NIMBYism rife.
Support for agri-env schemes.
Adoption of sustainable management in agriculture and woodlands.
In support of maintaining and conservbing the landscape. Local pride drives volunteers.
Nat
ure@
Wor
k
Technology industry focused on sustainable resource use.
Strong links to EU and global obligations – focus on ecosystem function rather than biodiversity.
Globally minded government; investment in public services. Commitment to global free trade.
Utilitarian view, recognising the importance of ‘nature’s services’. Society seeks high standard of living but through sustainable methods.
Growth of market delivering economic progress.
Industry drives technological innovation in the context of resource use.
Strong sense of local and global community; people equally willing to volunteer for local and global environmental projects.
Wor
ld M
arke
ts
Technology largely driven by private profit motive.
Reversal of devolution. Deregulated markets. Few environmental policies.
Shrinking of the welfare state. Strong, centralised national government. Deregulation of environmental protection.
Narrowly utilitarian, failing to recognise values of nature. Material consumption and greed good. Gesellschaft (compared with Local Stewardship).
Growth of market but greater exposure to global fluctuations.
(Global) Industry driving technological innovation for private profit.
Very little volunteering.
Nat
iona
l Sec
urity Technology
industry focused on sustainable resource use.
Trade barriers and protectionist measures to protect UK interests.
Protectionist policies to protect UK interests.
Society values landscapes and features of nature that characterise ‘national identity’.
Protection-led growth, but periods of stagnation and global crises. Markets protected.
UK industry focused on UK problems – state funded in some areas.
Very little volunteering; some support for community allotments and small horticultural enterprises.
Loca
l Ste
war
dshi
p Sustainability: understanding management of natural resources. Pragmatism, and respect for knowledge of ‘older generation’.
Tight controls on immigration. Greater devolution to local governments.
Tax raising powers devolved to local levels.
Utilitarian view, recognising the importance of ‘nature’s services’. Self-sacrifice more prevalent. Gemeinschaft.
Slow but steady economic growth. Incentives for small families.
Technology focuses on self-sufficiency and construction goods.
Strong sense of community, voluntary action starts and often ends locally; however, strong sense of place in world.
Go
with
the
Flow
Rapid development of technology through government investment. Increasing understanding of environmental issues.
Oscillation between pro-EU and more narrowly nationalistic approaches.
Oscillation between pro-EU and more narrowly nationalistic policies. Slow shrinking of public services.
Society values landscapes and features of nature that characterise ‘national identity’. Split appreciation of nature – increasing appreciation but still industrial elite sceptical.
Growth of market but greater exposure to global fluctuations.
Technology driven by government investment.
Volunteering popular in some areas; increasingly shift towards localism and away from global environmentalism.
Table 25.8 Key differences and similarities between the storylines in terms of the major policy response typologies.
with scenarios we can try to understand how sensitive these systems are and start to think about how we might intervene if we need to protect or restore them. However, scenarios are only as good as our understandings of the way in which ecosystem structure and function support the output of ecosystem services. Unfortunately in many cases we lack this vital knowledge. Thus an important next step would be to develop a new generation of data-driven, multifunctional ecosystem models to explore the future of ecosystem services in the UK.
ReferencesAlcamo, J. (2001) Scenarios as tools for international
environmental assessments. Environmental issue report: 24.
European Environment Agency, Copenhagen.
Alcamo, J., Vuuren, D. v., Ringler, C., Alder, J., Bennett, E.
M., Lodge, D. M., Masui, T., Morita, T., Rosegrant, M., Sala, O.
E., Schulze, K., Zurek, M., Eickhout, B., Maerker, M., & Kok, K.
(2006) 6: Methodology for Developing the MA Scenarios. In S.
1254 UK National Ecosystem Assessment: Technical Report
R. Carpenter, P. L. Pingali, E. M. Bennett, & M. B. Zurek (Eds.),
Ecosystems and Human Well-being: Scenarios (pp. 145-172).
Island Press, Washington, D.C.
Ash, N., Blanco, H., Brown, C., Garcia, K., Henrichs, T., Lucas,
N., Raudsepp-Hearne, C., Simpson, D., R., Scholes, R., Tomich, T.P.,
Vira, B. & Zurek, M. (eds) (2010) Ecosystems and human well-
being: a manual for assessment practitioners. Island Press.
Audsley, E., Pearn, K., Simota, C., Cojocaru, G., Koutsidou,
E., Rousevell, M., Trnka, M. & Alexandrov, V. (2006) What
can scenario modelling tell us about future European scale
agricultural land use, and what not? Environmental Science and
Policy, 9, 148–162.
Beddington, J. (2009) Land use futures – land use policy
journal introduction. Land Use Policy, 26, S1-S1.
Bishop, P., Hines, A. & Collins, T. (2007) The current state of
scenario development: An overview of techniques. Foresight, 9,
5–25.
Börjeson, L., Höjer, M., Dreborg, K., Ekvall, T. & Finnveden,
G. (2006) Scenario types and techniques: Towards a user’s guide.
Futures, 38, 723–739.
Bradfield, R., Wright, G., Burt, G., Cairns, G. & van der
Heijden, M. (2005) The origins and evolution of scenario
techniques in long range business planning. Futures, 37, 795–812.
Carpenter, S., Pingali, P., Bennett, E., & Zurek, M., eds.
(2006b) Ecosystems and human well-being: Scenarios, volume 2,
pp 561. Island Press, London.
Cork, S., Peterson, G., Bennett, E., Petschel-Held, G. &
Zurek, M. (2006a) Synthesis of the storylines. Ecology and
Society, 11, 11.
Cork, S., Peterson, G., Petschel-Held, G., Alcamo, J., Alder,
J., Bennett, E., Carr, E., Deane, D., Nelson, G., Ribeiro, T., Butler,
C., Mendiondo, E., Oluoch-Kosura, W. & Zurek, M. (2006b) Four
Scenarios. Ecosystems and Human Well-being: Scenarios,
223–294pp. Island Press.
Creedy, J., Doran, H., Duffield, S., George, N. & Kass,
G. (2009) England’s natural environment in 2060 – issues,
implications and scenarios. Natural England, Sheffield.
Dahlstrom, K. & Salmons, R. (2005) Building Economic
and Social Information for Examining the Effects of Climate
cHange - BESEECH: Generic socio-economic scenarios. Building
Economic and Social Information for Examining the Effects of
Climate cHange. Final report. Policy Studies Institute, London,
59pp.
De Jouvenel, H. (2000) A brief methodological guide to
scenario building. Technological Forecasting and Social Change,
65, 37–48.
Environment Agency (2001) Water resources for the future:
a strategy for England and Wales. Environment Agency, London.
Environment Agency (2009) Water for people and the
environment: Water resources strategy for England and Wales.
[online]. Available at: <http://publications.environment-agency.
gov.uk/pdf/GEHO0309BPKX-E-E.pdf> [Accessed 17.03.11].
European Observation Network for Territorial
Development and Cohesion (2007) Scenarios on the
territorial future of Europe. [online]. <www.espon.eu/main/
Menu_Projects/Menu_AppliedResearch/climate.html> [Accessed
13.04.11].
FEUFAR (The Future of European Fisheries and
Aquaculture Research) (2008) Global review of horizon
scanning and foresight exercises in the marine sector. 1–42.
FLUF (Foresight Land Use Futures) (2010) Making
the most of land in the 21st century: Final project report. The
Government Office for Science, London.
Garb, Y., Pulver, S. & VanDeveer, S. (2008) Scenarios in
society, society in scenarios: Toward a social scientific analysis
of storyline-driven environmental modeling. Environmental
Research Letters, 3, 045015.
Godet, M. (2000) The art of scenarios and strategic
planning: Tools and pitfalls. Technological Forecasting and Social
Change, 65, 3–22.
Hulme, M. & Dessai, S. (2008) Predicting, deciding,
learning: Can one evaluate the ‘success’ of national climate
scenarios? Environmental Research Letters, 3, 045013.
Hulme, M., Jenkins, G.J., Lu, X., Turnpenny, J.R., Mitchell,
T.D., Jones, R.G., Lowe, J., Murphy, J.M., Hassell, D., Boorman, P.,
McDonald, R. & Hill, S. (2002) Climate Change Scenarios for the
United Kingdom: The UKCIP02 Scientific Report, Tyndall Centre
for Climate Change Research, School of Environmental Sciences,
University of East Anglia, Norwich, UK. 120pp.
Langmead, O., McQuatters-Gollop, A. & Mee, L. D. (2007)
European lifestyles and marine ecosystems: exploring challenges
for managing Europe’s seas. University of Plymouth Marine
Institute, Plymouth.
MA (Millennium Ecosystem Assessment) (2005)
Ecosystems and human well-being: Synthesis. Island Press,
London.
Milne, R. & Brown, T.A. (1997) Carbon in the Vegetation and
Soils of Great Britain. Journal of Environmental Management, 49,
413–433.
Moore, K., Haines-Young, R., Paterson, J., Potschin, M.
& Silfwerbrand, G. (2010): Assessing User Needs Of the NEA
Scenarios through Focal Questions. CEM Working Paper No 4.
Moss, R., Edmonds, J., Hibbard, K., Manning, M., Rose,
S., Vuuren, D., Carter, T., Emori, S., Kainuma, M., Kram, T.,
Meehl, G., Mitchell, J., Nakicenovic, N., Riahi, K., Smith, S.,
Stouffer, R., Thomson, A., Weyant, J. & Wilbanks, T. (2010) The
next generation of scenarios for climate change research and
assessment. Nature, 463, 747–756.
Murphy, J.M., Sexton, D.M.H., Jenkins, G.J., Booth, B.B.
B., Brown, C.C., Clark, R. T., Collins, M., Harris, G.R., Kendon,
E.J., Betts, R.A., Brown, S. J., Humphrey, K.A., McCarthy, M.P.,
McDonald, R.E., Stephens, A., Wallace, C., Warren, R., Wilby, R.,
Wood, R. (2009), UK Climate Projections Science Report: Climate
change projections. Met Office Hadley Centre, Exeter.
Nakicenovic, N., Davidson, O., Davis, G., Grubler, A., Kram,
T., Lebre La Rovere, E., Metz, B., Morita, T., Pepper, W., Pitcher,
H., Sankovski, A., Shukla, P., Swart, R., Watson, R. & Dadi, Z.
(2009) IPCC special report on emissions scenarios. Cambridge
University Press, Cambridge.
O’Neill, B., Pulver, S., VanDeveer, S. & Garb, Y. (2008)
Where next with global environmental scenarios? Environmental
Research Letters, 3, 1–4.
Office of Science & Technology (2003) Foresight Futures
2020: Revised scenarios and guidance.Office of Science &
Technology, London.
ONS (Office of National Statistics) (2010) UK national
population projections – principals and variants, 2008–2083.
[online]. Available at: <http://www.statistics.gov.uk/
nationalprojections/flash_pyramid/projections.html> [Accessed
04.04.11].
1255Plausible Futures | Chapter 25: The UK NEA Scenarios: Development of Storylines and Analysis of Outcomes
Paterson, J.S., Haines-Young, R., Potschin, M., Moore,
K. & Silfwerbrand, G. (2010) The utility of existing scenario
frameworks for the National Ecosystem Assessment. Interim
Report, May 2010, CEM Working Paper No 2, 11 pp.
Pinnegar, J., Viner, D., Hadley, D., Dye, S., Harris, M. &
Simpson, F. (2006) Alternative future scenarios for marine
ecosystems: technical report. Centre for Environment, Fisheries
and Aquaculture Science, Lowestoft.
Prime Minister’s Strategy Unit (2004) Net benefits: a
sustainable and profitable future for UK fishing. London.
Raskin P., Banuri, T., Gallopin, G., Gutman, P., Hammond,
A., Kates, R. & Swart, R. (2002) Great Transition – The Promise
and Lure of the Times Ahead. Stockholm Environment Institute,
Sweden.
Ritchey, T. (2010) General morphological analysis – a
general method for non-quantified modelling. [online]. Available
at: <http://www.swemorph.com/pdf/gma.pdf> [Accessed
17.03.11].
Rounsevell, M., Reginster, I., Araujo, M.B., Carter, T.,
Dendoncker, N., Ewert, F., House, J., Kankaanpaa, S., Leemans,
R., Metzger, M., Schmit, C., Smith, P. & Tuck, G. (2006) A coherent
set of future land use change scenarios for Europe. Agriculture,
Ecosystems and Environment, 114, 57–68.
Rounsevell, M. & Metzger, M. (2010) Developing qualitative
scenario storylines for environmental change assessment. Wiley
Interdisciplinary Reviews: Climate Change, 1(4), 606–619.
Settele, J., Hammen, V., Hulme, P., Karlson, U., Klotz, S.,
Kotarac, M., Kunin, W.E., Marion, G., O’Connor, M., Petanidou,
T., Peterson, K., Potts, m., Pritchard, H., Pysek, P., Rounsevell,
M., Spangenberg, J., Steffan-Dewenter, N., Sykes, M.T., Vighi,
A., Zobel, M. & Kuhn, I. (2010) ALARM: Assessing Large-scale
environmental Risks for biodiversity with tested Methods. Gaia-
Ecological Perspectives for Science and Society, 14, 69–72.
UKCIP (UK Climate Impacts Programme) (2001) Socio-
economic scenarios for climate change impact assessment: A
guide to their use in the UK Climate Impacts Programme. UKCIP,
Oxford.
UNEP & RIVM (United Nations Environment
Programme & National Institute of Public Health and
the Environment)(2003). Four scenarios for Europe. Based on
UNEP’s third Global Environment Outlook. UNEP/DEIA&EW/
TR.03-10 and RIVM 402001021.
van Notten, P.W.F., Rotmans, J., van Asselt, M.B.A. &
Rothman, D.S. (2003) An updated scenario typology. Futures, 35,
423–443.
Volkery, D.A. (2007) Land use scenarios for Europe –
Qualitative and quantitative analysis on a European scale.
European Environment Agency, Copenhagen.
Westhoek, H., van den Berg, M. & Bakkes, J. (2006)
Scenario development to explore the future of Europe’s rural
areas. Agriculture, Ecosystems and Environment, 114, 7–20.
Wildlife Conservation Society (2007) Futures of the Wild.
WCS, New York.
Wilkinson, A. & Eidinow, E. (2008) Evolving practices
in environmental scenarios: A new scenario typology.
Environmental Research Letters, 3, 1–11.
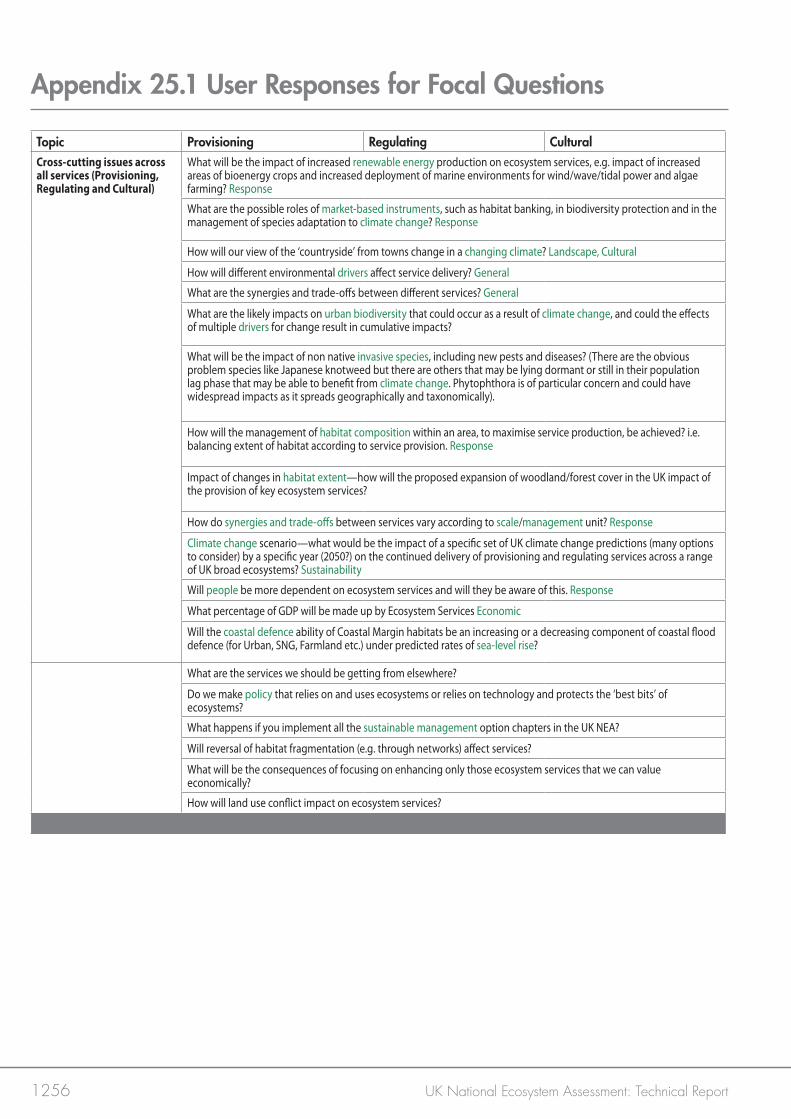
1256 UK National Ecosystem Assessment: Technical Report
Appendix 25.1 User Responses for Focal Questions
Topic Provisioning Regulating CulturalCross-cutting issues across all services (Provisioning, Regulating and Cultural)
What will be the impact of increased renewable energy production on ecosystem services, e.g. impact of increased areas of bioenergy crops and increased deployment of marine environments for wind/wave/tidal power and algae farming? Response
What are the possible roles of market-based instruments, such as habitat banking, in biodiversity protection and in the management of species adaptation to climate change? Response
How will our view of the ‘countryside’ from towns change in a changing climate? Landscape, Cultural
How will different environmental drivers affect service delivery? General
What are the synergies and trade-offs between different services? General
What are the likely impacts on urban biodiversity that could occur as a result of climate change, and could the effects of multiple drivers for change result in cumulative impacts?
What will be the impact of non native invasive species, including new pests and diseases? (There are the obvious problem species like Japanese knotweed but there are others that may be lying dormant or still in their population lag phase that may be able to benefit from climate change. Phytophthora is of particular concern and could have widespread impacts as it spreads geographically and taxonomically).
How will the management of habitat composition within an area, to maximise service production, be achieved? i.e. balancing extent of habitat according to service provision. Response
Impact of changes in habitat extent—how will the proposed expansion of woodland/forest cover in the UK impact of the provision of key ecosystem services?
How do synergies and trade-offs between services vary according to scale/management unit? Response
Climate change scenario—what would be the impact of a specific set of UK climate change predictions (many options to consider) by a specific year (2050?) on the continued delivery of provisioning and regulating services across a range of UK broad ecosystems? Sustainability
Will people be more dependent on ecosystem services and will they be aware of this. Response
What percentage of GDP will be made up by Ecosystem Services Economic
Will the coastal defence ability of Coastal Margin habitats be an increasing or a decreasing component of coastal flood defence (for Urban, SNG, Farmland etc.) under predicted rates of sea-level rise?
What are the services we should be getting from elsewhere?
Do we make policy that relies on and uses ecosystems or relies on technology and protects the ‘best bits’ of ecosystems?
What happens if you implement all the sustainable management option chapters in the UK NEA?
Will reversal of habitat fragmentation (e.g. through networks) affect services?
What will be the consequences of focusing on enhancing only those ecosystem services that we can value economically?
How will land use conflict impact on ecosystem services?
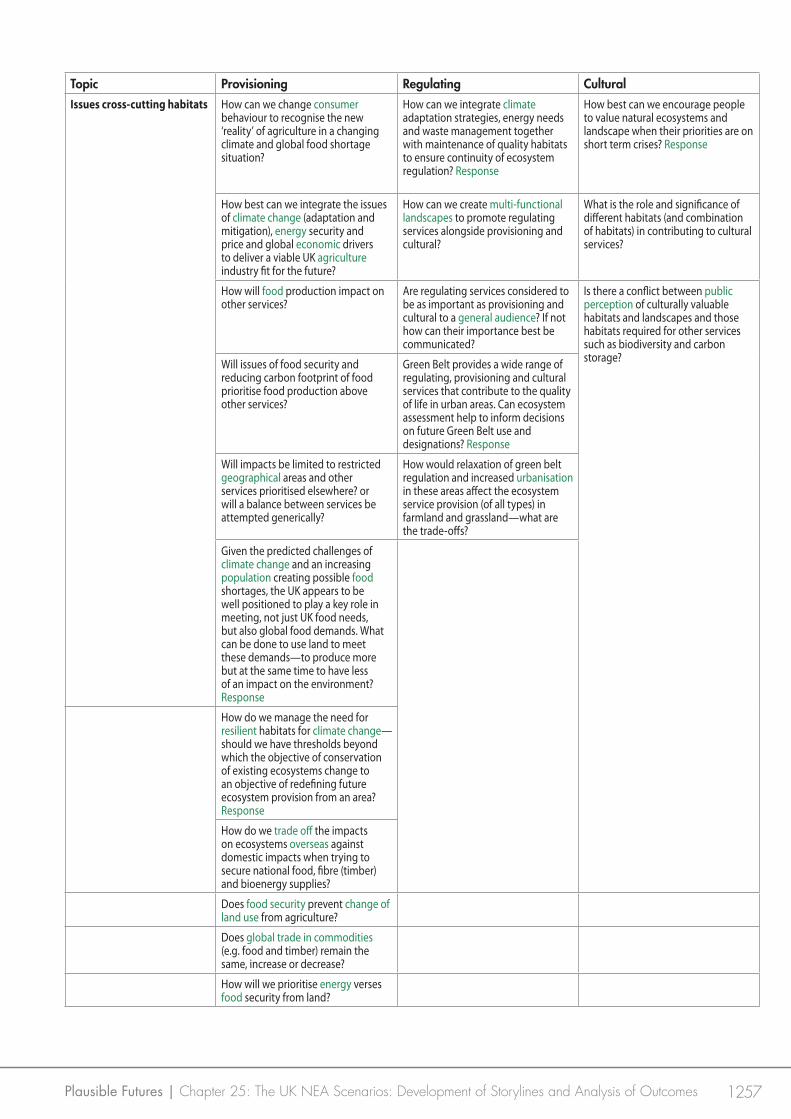
1257Plausible Futures | Chapter 25: The UK NEA Scenarios: Development of Storylines and Analysis of Outcomes
Topic Provisioning Regulating CulturalIssues cross-cutting habitats How can we change consumer
behaviour to recognise the new ‘reality’ of agriculture in a changing climate and global food shortage situation?
How can we integrate climate adaptation strategies, energy needs and waste management together with maintenance of quality habitats to ensure continuity of ecosystem regulation? Response
How best can we encourage people to value natural ecosystems and landscape when their priorities are on short term crises? Response
How best can we integrate the issues of climate change (adaptation and mitigation), energy security and price and global economic drivers to deliver a viable UK agriculture industry fit for the future?
How can we create multi-functional landscapes to promote regulating services alongside provisioning and cultural?
What is the role and significance of different habitats (and combination of habitats) in contributing to cultural services?
How will food production impact on other services?
Are regulating services considered to be as important as provisioning and cultural to a general audience? If not how can their importance best be communicated?
Is there a conflict between public perception of culturally valuable habitats and landscapes and those habitats required for other services such as biodiversity and carbon storage?Will issues of food security and
reducing carbon footprint of food prioritise food production above other services?
Green Belt provides a wide range of regulating, provisioning and cultural services that contribute to the quality of life in urban areas. Can ecosystem assessment help to inform decisions on future Green Belt use and designations? Response
Will impacts be limited to restricted geographical areas and other services prioritised elsewhere? or will a balance between services be attempted generically?
How would relaxation of green belt regulation and increased urbanisation in these areas affect the ecosystem service provision (of all types) in farmland and grassland—what are the trade-offs?
Given the predicted challenges of climate change and an increasing population creating possible food shortages, the UK appears to be well positioned to play a key role in meeting, not just UK food needs, but also global food demands. What can be done to use land to meet these demands—to produce more but at the same time to have less of an impact on the environment? Response
How do we manage the need for resilient habitats for climate change—should we have thresholds beyond which the objective of conservation of existing ecosystems change to an objective of redefining future ecosystem provision from an area? Response
How do we trade off the impacts on ecosystems overseas against domestic impacts when trying to secure national food, fibre (timber) and bioenergy supplies?
Does food security prevent change of land use from agriculture?
Does global trade in commodities (e.g. food and timber) remain the same, increase or decrease?
How will we prioritise energy verses food security from land?
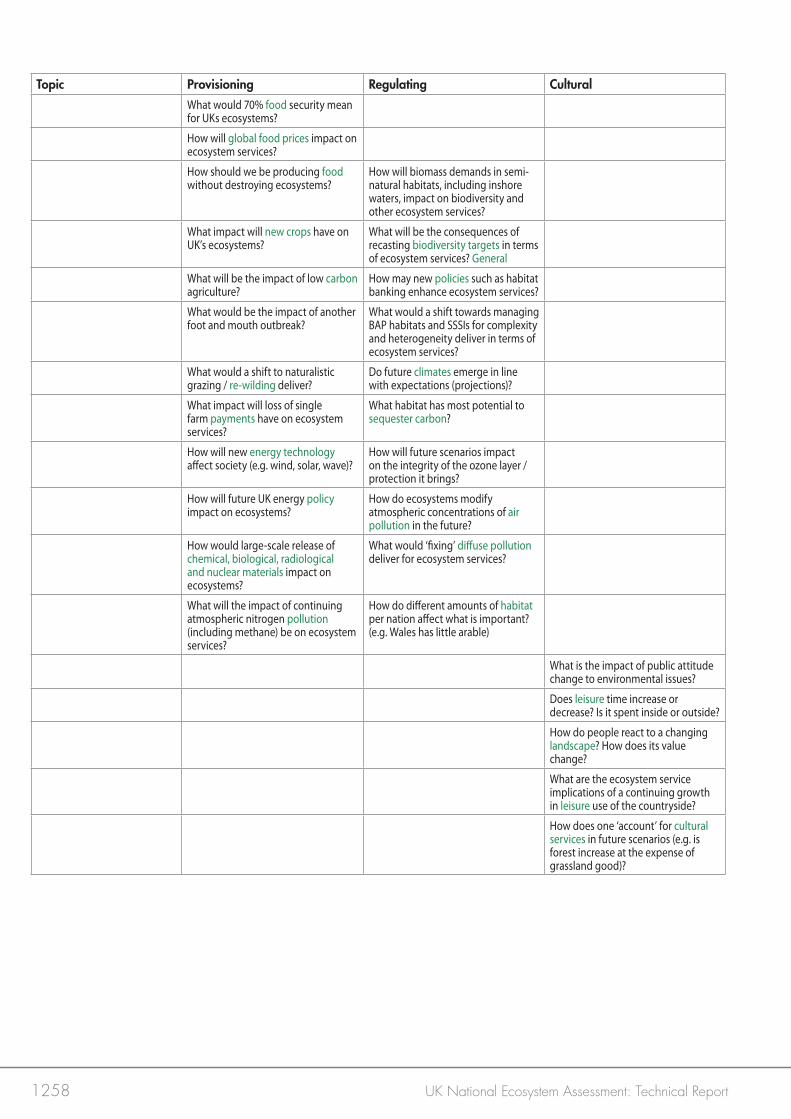
1258 UK National Ecosystem Assessment: Technical Report
Topic Provisioning Regulating CulturalWhat would 70% food security mean for UKs ecosystems?
How will global food prices impact on ecosystem services?
How should we be producing food without destroying ecosystems?
How will biomass demands in semi-natural habitats, including inshore waters, impact on biodiversity and other ecosystem services?
What impact will new crops have on UK’s ecosystems?
What will be the consequences of recasting biodiversity targets in terms of ecosystem services? General
What will be the impact of low carbon agriculture?
How may new policies such as habitat banking enhance ecosystem services?
What would be the impact of another foot and mouth outbreak?
What would a shift towards managing BAP habitats and SSSIs for complexity and heterogeneity deliver in terms of ecosystem services?
What would a shift to naturalistic grazing / re-wilding deliver?
Do future climates emerge in line with expectations (projections)?
What impact will loss of single farm payments have on ecosystem services?
What habitat has most potential to sequester carbon?
How will new energy technology affect society (e.g. wind, solar, wave)?
How will future scenarios impact on the integrity of the ozone layer / protection it brings?
How will future UK energy policy impact on ecosystems?
How do ecosystems modify atmospheric concentrations of air pollution in the future?
How would large-scale release of chemical, biological, radiological and nuclear materials impact on ecosystems?
What would ‘fixing’ diffuse pollution deliver for ecosystem services?
What will the impact of continuing atmospheric nitrogen pollution (including methane) be on ecosystem services?
How do different amounts of habitat per nation affect what is important? (e.g. Wales has little arable)
What is the impact of public attitude change to environmental issues?
Does leisure time increase or decrease? Is it spent inside or outside?
How do people react to a changing landscape? How does its value change?
What are the ecosystem service implications of a continuing growth in leisure use of the countryside?
How does one ‘account’ for cultural services in future scenarios (e.g. is forest increase at the expense of grassland good)?
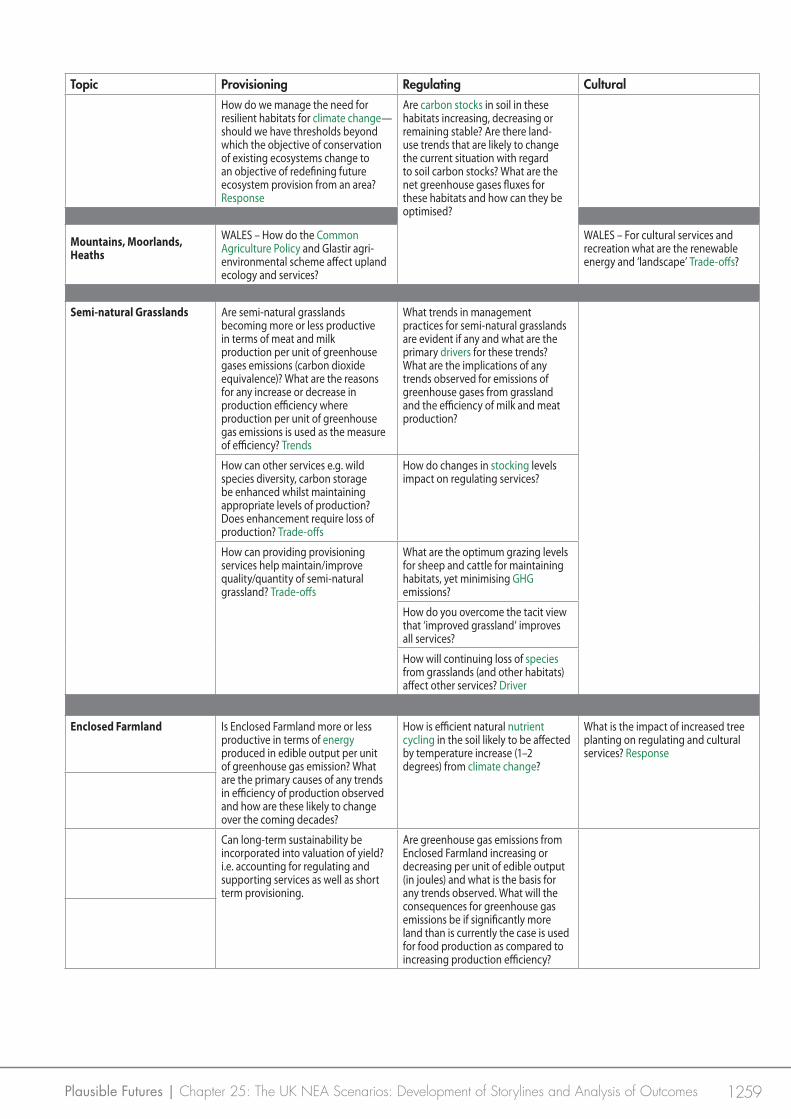
1259Plausible Futures | Chapter 25: The UK NEA Scenarios: Development of Storylines and Analysis of Outcomes
Topic Provisioning Regulating CulturalHow do we manage the need for resilient habitats for climate change—should we have thresholds beyond which the objective of conservation of existing ecosystems change to an objective of redefining future ecosystem provision from an area? Response
Are carbon stocks in soil in these habitats increasing, decreasing or remaining stable? Are there land-use trends that are likely to change the current situation with regard to soil carbon stocks? What are the net greenhouse gases fluxes for these habitats and how can they be optimised?
Mountains, Moorlands, Heaths
WALES – How do the Common Agriculture Policy and Glastir agri-environmental scheme affect upland ecology and services?
WALES – For cultural services and recreation what are the renewable energy and ‘landscape’ Trade-offs?
Semi-natural Grasslands Are semi-natural grasslands
becoming more or less productive in terms of meat and milk production per unit of greenhouse gases emissions (carbon dioxide equivalence)? What are the reasons for any increase or decrease in production efficiency where production per unit of greenhouse gas emissions is used as the measure of efficiency? Trends
What trends in management practices for semi-natural grasslands are evident if any and what are the primary drivers for these trends? What are the implications of any trends observed for emissions of greenhouse gases from grassland and the efficiency of milk and meat production?
How can other services e.g. wild species diversity, carbon storage be enhanced whilst maintaining appropriate levels of production? Does enhancement require loss of production? Trade-offs
How do changes in stocking levels impact on regulating services?
How can providing provisioning services help maintain/improve quality/quantity of semi-natural grassland? Trade-offs
What are the optimum grazing levels for sheep and cattle for maintaining habitats, yet minimising GHG emissions?
How do you overcome the tacit view that ‘improved grassland’ improves all services?
How will continuing loss of species from grasslands (and other habitats) affect other services? Driver
Enclosed Farmland Is Enclosed Farmland more or less productive in terms of energy produced in edible output per unit of greenhouse gas emission? What are the primary causes of any trends in efficiency of production observed and how are these likely to change over the coming decades?
How is efficient natural nutrient cycling in the soil likely to be affected by temperature increase (1–2 degrees) from climate change?
What is the impact of increased tree planting on regulating and cultural services? Response
Can long-term sustainability be incorporated into valuation of yield? i.e. accounting for regulating and supporting services as well as short term provisioning.
Are greenhouse gas emissions from Enclosed Farmland increasing or decreasing per unit of edible output (in joules) and what is the basis for any trends observed. What will the consequences for greenhouse gas emissions be if significantly more land than is currently the case is used for food production as compared to increasing production efficiency?
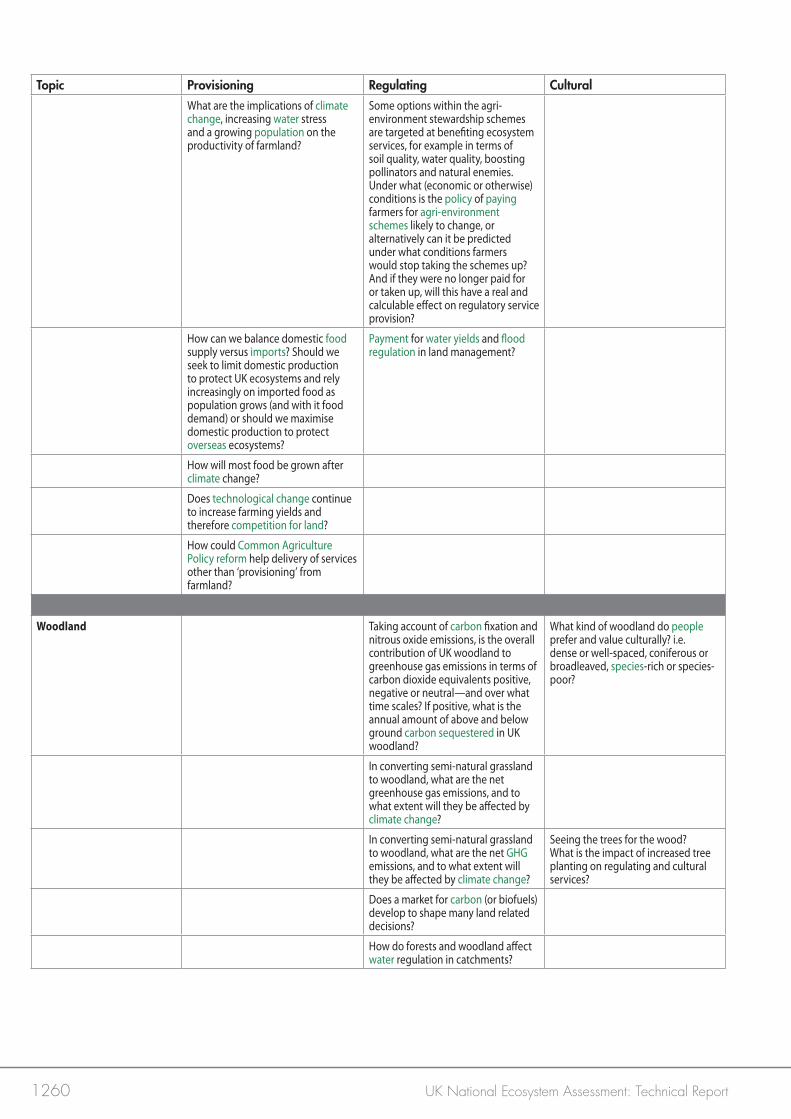
1260 UK National Ecosystem Assessment: Technical Report
Topic Provisioning Regulating CulturalWhat are the implications of climate change, increasing water stress and a growing population on the productivity of farmland?
Some options within the agri-environment stewardship schemes are targeted at benefiting ecosystem services, for example in terms of soil quality, water quality, boosting pollinators and natural enemies. Under what (economic or otherwise) conditions is the policy of paying farmers for agri-environment schemes likely to change, or alternatively can it be predicted under what conditions farmers would stop taking the schemes up? And if they were no longer paid for or taken up, will this have a real and calculable effect on regulatory service provision?
How can we balance domestic food supply versus imports? Should we seek to limit domestic production to protect UK ecosystems and rely increasingly on imported food as population grows (and with it food demand) or should we maximise domestic production to protect overseas ecosystems?
Payment for water yields and flood regulation in land management?
How will most food be grown after climate change?
Does technological change continue to increase farming yields and therefore competition for land?
How could Common Agriculture Policy reform help delivery of services other than ‘provisioning’ from farmland?
Woodland Taking account of carbon fixation and nitrous oxide emissions, is the overall contribution of UK woodland to greenhouse gas emissions in terms of carbon dioxide equivalents positive, negative or neutral—and over what time scales? If positive, what is the annual amount of above and below ground carbon sequestered in UK woodland?
What kind of woodland do people prefer and value culturally? i.e. dense or well-spaced, coniferous or broadleaved, species-rich or species-poor?
In converting semi-natural grassland to woodland, what are the net greenhouse gas emissions, and to what extent will they be affected by climate change?
In converting semi-natural grassland to woodland, what are the net GHG emissions, and to what extent will they be affected by climate change?
Seeing the trees for the wood? What is the impact of increased tree planting on regulating and cultural services?
Does a market for carbon (or biofuels) develop to shape many land related decisions?
How do forests and woodland affect water regulation in catchments?
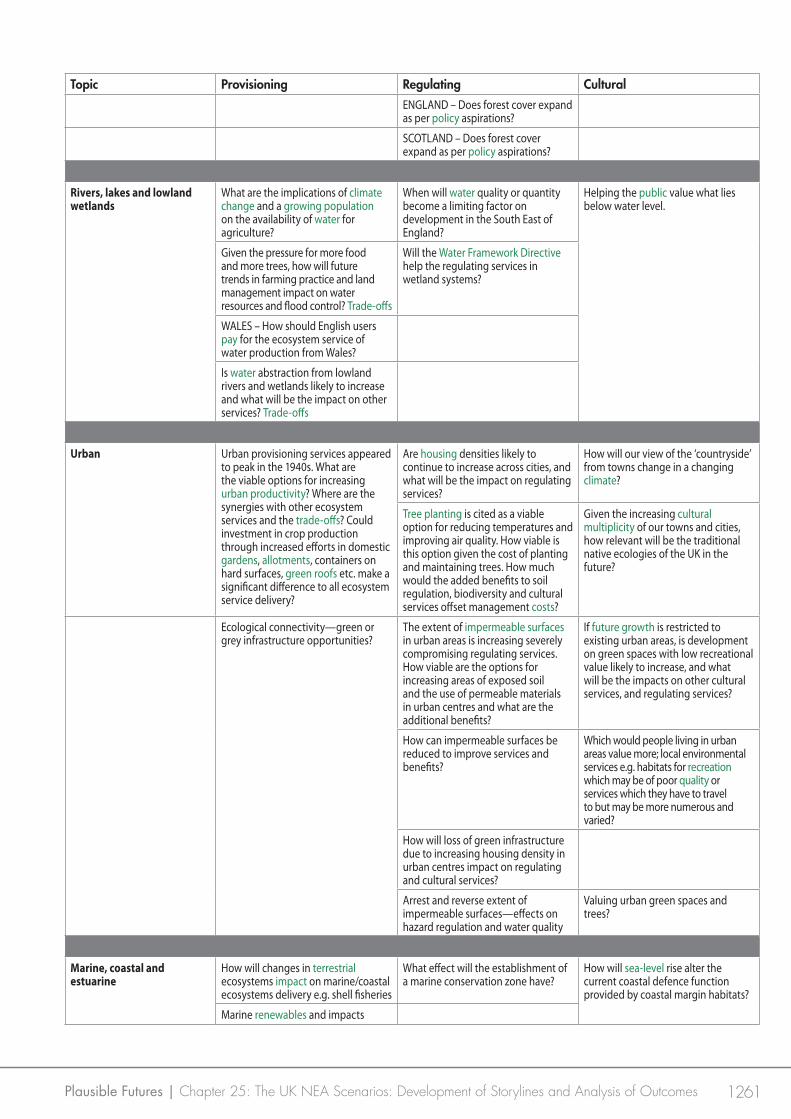
1261Plausible Futures | Chapter 25: The UK NEA Scenarios: Development of Storylines and Analysis of Outcomes
Topic Provisioning Regulating CulturalENGLAND – Does forest cover expand as per policy aspirations?
SCOTLAND – Does forest cover expand as per policy aspirations?
Rivers, lakes and lowland wetlands
What are the implications of climate change and a growing population on the availability of water for agriculture?
When will water quality or quantity become a limiting factor on development in the South East of England?
Helping the public value what lies below water level.
Given the pressure for more food and more trees, how will future trends in farming practice and land management impact on water resources and flood control? Trade-offs
Will the Water Framework Directive help the regulating services in wetland systems?
WALES – How should English users pay for the ecosystem service of water production from Wales?
Is water abstraction from lowland rivers and wetlands likely to increase and what will be the impact on other services? Trade-offs
Urban Urban provisioning services appeared to peak in the 1940s. What are the viable options for increasing urban productivity? Where are the synergies with other ecosystem services and the trade-offs? Could investment in crop production through increased efforts in domestic gardens, allotments, containers on hard surfaces, green roofs etc. make a significant difference to all ecosystem service delivery?
Are housing densities likely to continue to increase across cities, and what will be the impact on regulating services?
How will our view of the ‘countryside’ from towns change in a changing climate?
Tree planting is cited as a viable option for reducing temperatures and improving air quality. How viable is this option given the cost of planting and maintaining trees. How much would the added benefits to soil regulation, biodiversity and cultural services offset management costs?
Given the increasing cultural multiplicity of our towns and cities, how relevant will be the traditional native ecologies of the UK in the future?
Ecological connectivity—green or grey infrastructure opportunities?
The extent of impermeable surfaces in urban areas is increasing severely compromising regulating services. How viable are the options for increasing areas of exposed soil and the use of permeable materials in urban centres and what are the additional benefits?
If future growth is restricted to existing urban areas, is development on green spaces with low recreational value likely to increase, and what will be the impacts on other cultural services, and regulating services?
How can impermeable surfaces be reduced to improve services and benefits?
Which would people living in urban areas value more; local environmental services e.g. habitats for recreation which may be of poor quality or services which they have to travel to but may be more numerous and varied?
How will loss of green infrastructure due to increasing housing density in urban centres impact on regulating and cultural services?
Arrest and reverse extent of impermeable surfaces—effects on hazard regulation and water quality
Valuing urban green spaces and trees?
Marine, coastal and estuarine
How will changes in terrestrial ecosystems impact on marine/coastal ecosystems delivery e.g. shell fisheries
What effect will the establishment of a marine conservation zone have?
How will sea-level rise alter the current coastal defence function provided by coastal margin habitats?
Marine renewables and impacts
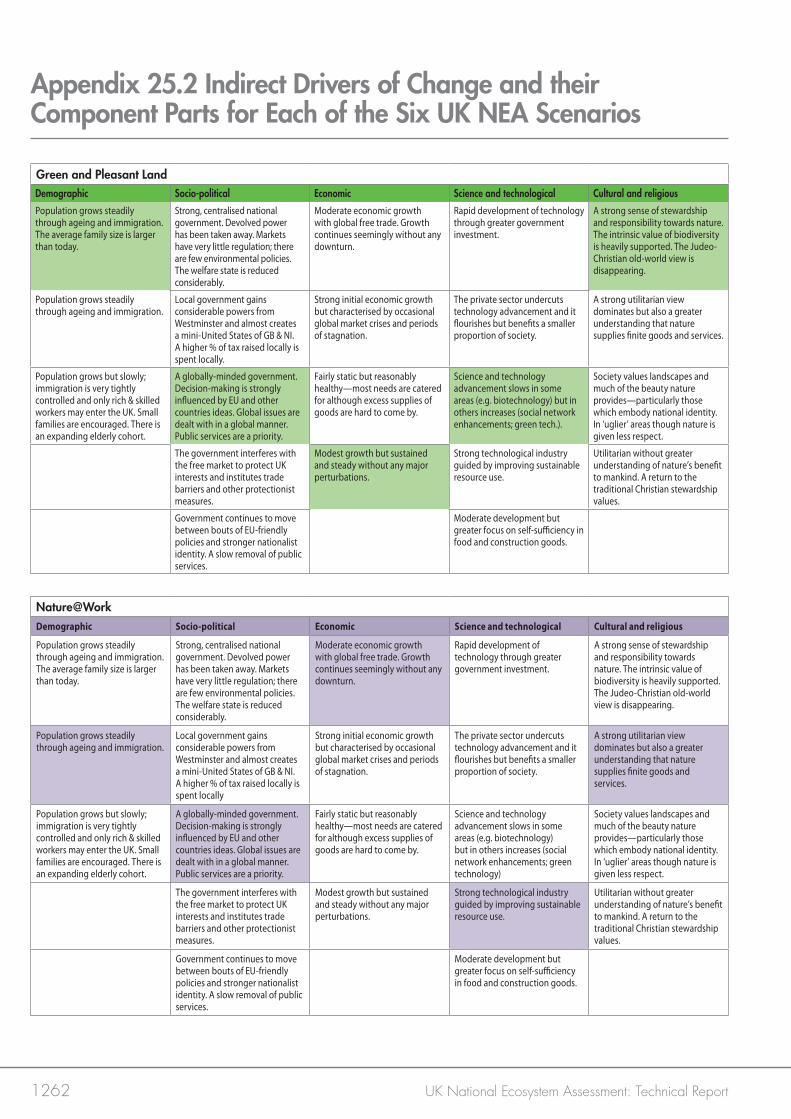
1262 UK National Ecosystem Assessment: Technical Report
Appendix 25.2 Indirect Drivers of Change and their Component Parts for Each of the Six UK NEA Scenarios
Green and Pleasant LandDemographic Socio-political Economic Science and technological Cultural and religiousPopulation grows steadily through ageing and immigration. The average family size is larger than today.
Strong, centralised national government. Devolved power has been taken away. Markets have very little regulation; there are few environmental policies. The welfare state is reduced considerably.
Moderate economic growth with global free trade. Growth continues seemingly without any downturn.
Rapid development of technology through greater government investment.
A strong sense of stewardship and responsibility towards nature. The intrinsic value of biodiversity is heavily supported. The Judeo-Christian old-world view is disappearing.
Population grows steadily through ageing and immigration.
Local government gains considerable powers from Westminster and almost creates a mini-United States of GB & NI. A higher % of tax raised locally is spent locally.
Strong initial economic growth but characterised by occasional global market crises and periods of stagnation.
The private sector undercuts technology advancement and it flourishes but benefits a smaller proportion of society.
A strong utilitarian view dominates but also a greater understanding that nature supplies finite goods and services.
Population grows but slowly; immigration is very tightly controlled and only rich & skilled workers may enter the UK. Small families are encouraged. There is an expanding elderly cohort.
A globally-minded government. Decision-making is strongly influenced by EU and other countries ideas. Global issues are dealt with in a global manner. Public services are a priority.
Fairly static but reasonably healthy—most needs are catered for although excess supplies of goods are hard to come by.
Science and technology advancement slows in some areas (e.g. biotechnology) but in others increases (social network enhancements; green tech.).
Society values landscapes and much of the beauty nature provides—particularly those which embody national identity. In ‘uglier’ areas though nature is given less respect.
The government interferes with the free market to protect UK interests and institutes trade barriers and other protectionist measures.
Modest growth but sustained and steady without any major perturbations.
Strong technological industry guided by improving sustainable resource use.
Utilitarian without greater understanding of nature’s benefit to mankind. A return to the traditional Christian stewardship values.
Government continues to move between bouts of EU-friendly policies and stronger nationalist identity. A slow removal of public services.
Moderate development but greater focus on self-sufficiency in food and construction goods.
Nature@WorkDemographic Socio-political Economic Science and technological Cultural and religious
Population grows steadily through ageing and immigration. The average family size is larger than today.
Strong, centralised national government. Devolved power has been taken away. Markets have very little regulation; there are few environmental policies. The welfare state is reduced considerably.
Moderate economic growth with global free trade. Growth continues seemingly without any downturn.
Rapid development of technology through greater government investment.
A strong sense of stewardship and responsibility towards nature. The intrinsic value of biodiversity is heavily supported. The Judeo-Christian old-world view is disappearing.
Population grows steadily through ageing and immigration.
Local government gains considerable powers from Westminster and almost creates a mini-United States of GB & NI. A higher % of tax raised locally is spent locally
Strong initial economic growth but characterised by occasional global market crises and periods of stagnation.
The private sector undercuts technology advancement and it flourishes but benefits a smaller proportion of society.
A strong utilitarian view dominates but also a greater understanding that nature supplies finite goods and services.
Population grows but slowly; immigration is very tightly controlled and only rich & skilled workers may enter the UK. Small families are encouraged. There is an expanding elderly cohort.
A globally-minded government. Decision-making is strongly influenced by EU and other countries ideas. Global issues are dealt with in a global manner. Public services are a priority.
Fairly static but reasonably healthy—most needs are catered for although excess supplies of goods are hard to come by.
Science and technology advancement slows in some areas (e.g. biotechnology) but in others increases (social network enhancements; green technology)
Society values landscapes and much of the beauty nature provides—particularly those which embody national identity. In ‘uglier’ areas though nature is given less respect.
The government interferes with the free market to protect UK interests and institutes trade barriers and other protectionist measures.
Modest growth but sustained and steady without any major perturbations.
Strong technological industry guided by improving sustainable resource use.
Utilitarian without greater understanding of nature’s benefit to mankind. A return to the traditional Christian stewardship values.
Government continues to move between bouts of EU-friendly policies and stronger nationalist identity. A slow removal of public services.
Moderate development but greater focus on self-sufficiency in food and construction goods.
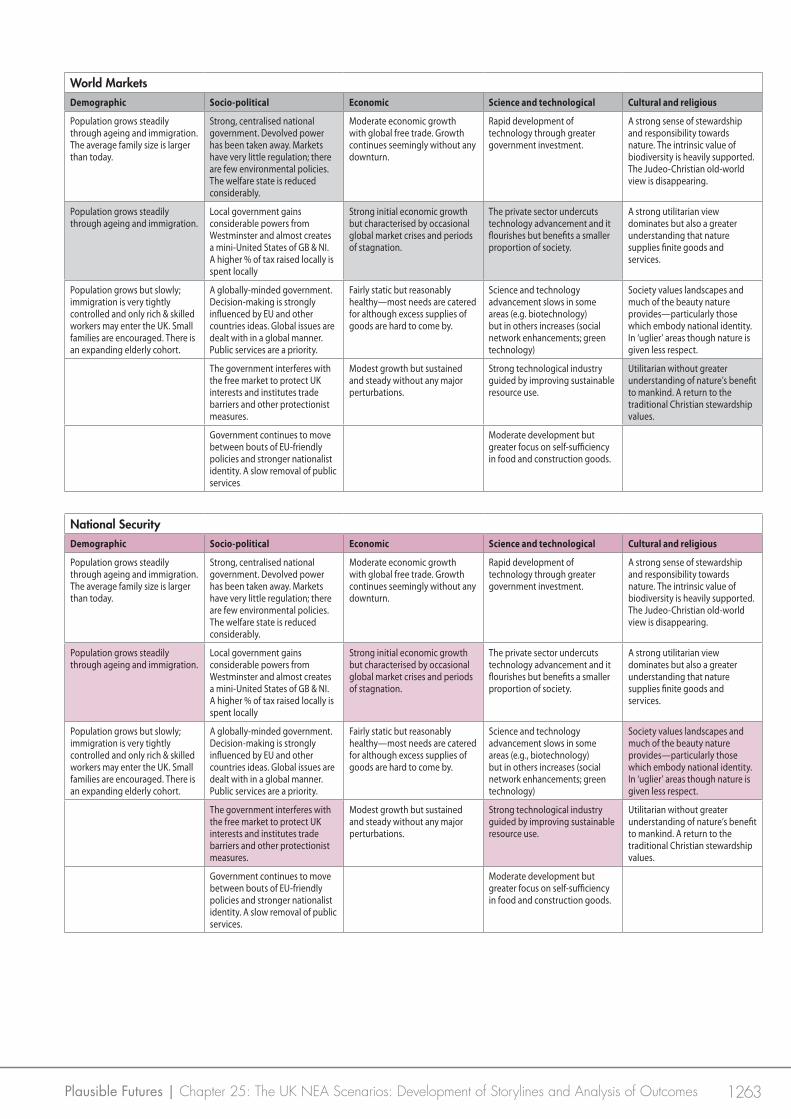
1263Plausible Futures | Chapter 25: The UK NEA Scenarios: Development of Storylines and Analysis of Outcomes
National SecurityDemographic Socio-political Economic Science and technological Cultural and religious
Population grows steadily through ageing and immigration. The average family size is larger than today.
Strong, centralised national government. Devolved power has been taken away. Markets have very little regulation; there are few environmental policies. The welfare state is reduced considerably.
Moderate economic growth with global free trade. Growth continues seemingly without any downturn.
Rapid development of technology through greater government investment.
A strong sense of stewardship and responsibility towards nature. The intrinsic value of biodiversity is heavily supported. The Judeo-Christian old-world view is disappearing.
Population grows steadily through ageing and immigration.
Local government gains considerable powers from Westminster and almost creates a mini-United States of GB & NI. A higher % of tax raised locally is spent locally
Strong initial economic growth but characterised by occasional global market crises and periods of stagnation.
The private sector undercuts technology advancement and it flourishes but benefits a smaller proportion of society.
A strong utilitarian view dominates but also a greater understanding that nature supplies finite goods and services.
Population grows but slowly; immigration is very tightly controlled and only rich & skilled workers may enter the UK. Small families are encouraged. There is an expanding elderly cohort.
A globally-minded government. Decision-making is strongly influenced by EU and other countries ideas. Global issues are dealt with in a global manner. Public services are a priority.
Fairly static but reasonably healthy—most needs are catered for although excess supplies of goods are hard to come by.
Science and technology advancement slows in some areas (e.g., biotechnology) but in others increases (social network enhancements; green technology)
Society values landscapes and much of the beauty nature provides—particularly those which embody national identity. In ‘uglier’ areas though nature is given less respect.
The government interferes with the free market to protect UK interests and institutes trade barriers and other protectionist measures.
Modest growth but sustained and steady without any major perturbations.
Strong technological industry guided by improving sustainable resource use.
Utilitarian without greater understanding of nature’s benefit to mankind. A return to the traditional Christian stewardship values.
Government continues to move between bouts of EU-friendly policies and stronger nationalist identity. A slow removal of public services.
Moderate development but greater focus on self-sufficiency in food and construction goods.
World MarketsDemographic Socio-political Economic Science and technological Cultural and religious
Population grows steadily through ageing and immigration. The average family size is larger than today.
Strong, centralised national government. Devolved power has been taken away. Markets have very little regulation; there are few environmental policies. The welfare state is reduced considerably.
Moderate economic growth with global free trade. Growth continues seemingly without any downturn.
Rapid development of technology through greater government investment.
A strong sense of stewardship and responsibility towards nature. The intrinsic value of biodiversity is heavily supported. The Judeo-Christian old-world view is disappearing.
Population grows steadily through ageing and immigration.
Local government gains considerable powers from Westminster and almost creates a mini-United States of GB & NI. A higher % of tax raised locally is spent locally
Strong initial economic growth but characterised by occasional global market crises and periods of stagnation.
The private sector undercuts technology advancement and it flourishes but benefits a smaller proportion of society.
A strong utilitarian view dominates but also a greater understanding that nature supplies finite goods and services.
Population grows but slowly; immigration is very tightly controlled and only rich & skilled workers may enter the UK. Small families are encouraged. There is an expanding elderly cohort.
A globally-minded government. Decision-making is strongly influenced by EU and other countries ideas. Global issues are dealt with in a global manner. Public services are a priority.
Fairly static but reasonably healthy—most needs are catered for although excess supplies of goods are hard to come by.
Science and technology advancement slows in some areas (e.g. biotechnology) but in others increases (social network enhancements; green technology)
Society values landscapes and much of the beauty nature provides—particularly those which embody national identity. In ‘uglier’ areas though nature is given less respect.
The government interferes with the free market to protect UK interests and institutes trade barriers and other protectionist measures.
Modest growth but sustained and steady without any major perturbations.
Strong technological industry guided by improving sustainable resource use.
Utilitarian without greater understanding of nature’s benefit to mankind. A return to the traditional Christian stewardship values.
Government continues to move between bouts of EU-friendly policies and stronger nationalist identity. A slow removal of public services.
Moderate development but greater focus on self-sufficiency in food and construction goods.
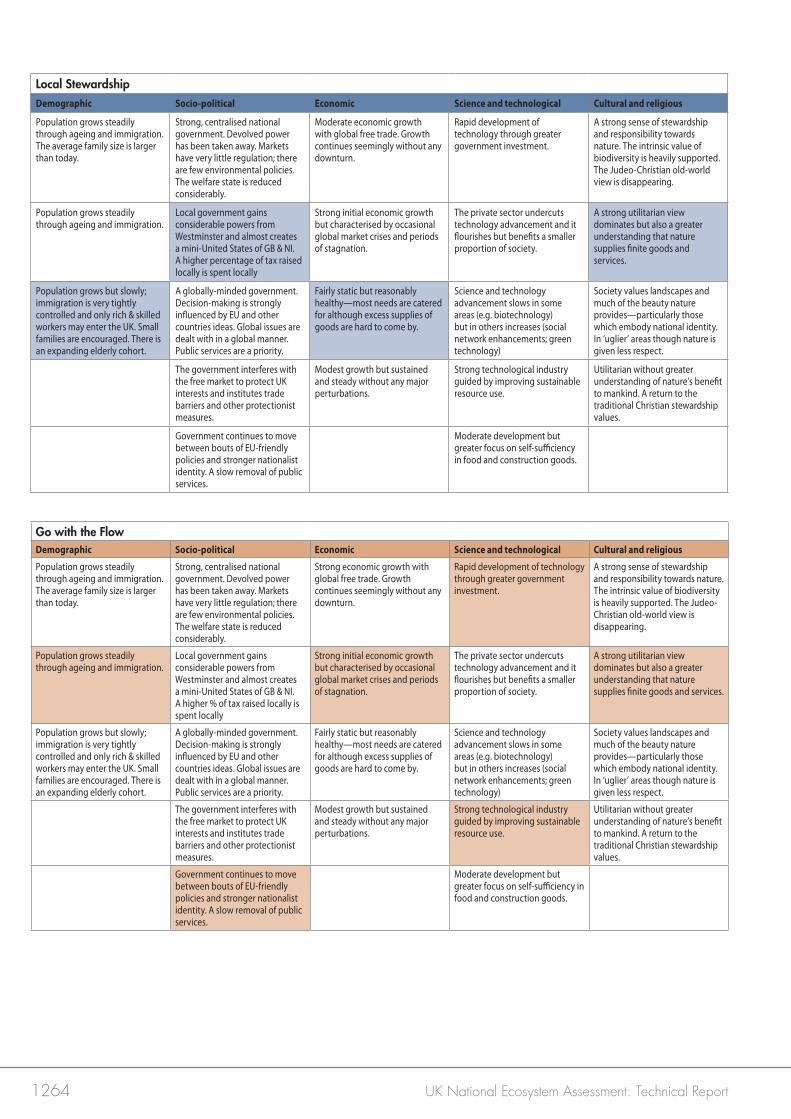
1264 UK National Ecosystem Assessment: Technical Report
Local StewardshipDemographic Socio-political Economic Science and technological Cultural and religious
Population grows steadily through ageing and immigration. The average family size is larger than today.
Strong, centralised national government. Devolved power has been taken away. Markets have very little regulation; there are few environmental policies. The welfare state is reduced considerably.
Moderate economic growth with global free trade. Growth continues seemingly without any downturn.
Rapid development of technology through greater government investment.
A strong sense of stewardship and responsibility towards nature. The intrinsic value of biodiversity is heavily supported. The Judeo-Christian old-world view is disappearing.
Population grows steadily through ageing and immigration.
Local government gains considerable powers from Westminster and almost creates a mini-United States of GB & NI. A higher percentage of tax raised locally is spent locally
Strong initial economic growth but characterised by occasional global market crises and periods of stagnation.
The private sector undercuts technology advancement and it flourishes but benefits a smaller proportion of society.
A strong utilitarian view dominates but also a greater understanding that nature supplies finite goods and services.
Population grows but slowly; immigration is very tightly controlled and only rich & skilled workers may enter the UK. Small families are encouraged. There is an expanding elderly cohort.
A globally-minded government. Decision-making is strongly influenced by EU and other countries ideas. Global issues are dealt with in a global manner. Public services are a priority.
Fairly static but reasonably healthy—most needs are catered for although excess supplies of goods are hard to come by.
Science and technology advancement slows in some areas (e.g. biotechnology) but in others increases (social network enhancements; green technology)
Society values landscapes and much of the beauty nature provides—particularly those which embody national identity. In ‘uglier’ areas though nature is given less respect.
The government interferes with the free market to protect UK interests and institutes trade barriers and other protectionist measures.
Modest growth but sustained and steady without any major perturbations.
Strong technological industry guided by improving sustainable resource use.
Utilitarian without greater understanding of nature’s benefit to mankind. A return to the traditional Christian stewardship values.
Government continues to move between bouts of EU-friendly policies and stronger nationalist identity. A slow removal of public services.
Moderate development but greater focus on self-sufficiency in food and construction goods.
Go with the FlowDemographic Socio-political Economic Science and technological Cultural and religious
Population grows steadily through ageing and immigration. The average family size is larger than today.
Strong, centralised national government. Devolved power has been taken away. Markets have very little regulation; there are few environmental policies. The welfare state is reduced considerably.
Strong economic growth with global free trade. Growth continues seemingly without any downturn.
Rapid development of technology through greater government investment.
A strong sense of stewardship and responsibility towards nature. The intrinsic value of biodiversity is heavily supported. The Judeo-Christian old-world view is disappearing.
Population grows steadily through ageing and immigration.
Local government gains considerable powers from Westminster and almost creates a mini-United States of GB & NI. A higher % of tax raised locally is spent locally
Strong initial economic growth but characterised by occasional global market crises and periods of stagnation.
The private sector undercuts technology advancement and it flourishes but benefits a smaller proportion of society.
A strong utilitarian view dominates but also a greater understanding that nature supplies finite goods and services.
Population grows but slowly; immigration is very tightly controlled and only rich & skilled workers may enter the UK. Small families are encouraged. There is an expanding elderly cohort.
A globally-minded government. Decision-making is strongly influenced by EU and other countries ideas. Global issues are dealt with in a global manner. Public services are a priority.
Fairly static but reasonably healthy—most needs are catered for although excess supplies of goods are hard to come by.
Science and technology advancement slows in some areas (e.g. biotechnology) but in others increases (social network enhancements; green technology)
Society values landscapes and much of the beauty nature provides—particularly those which embody national identity. In ‘uglier’ areas though nature is given less respect.
The government interferes with the free market to protect UK interests and institutes trade barriers and other protectionist measures.
Modest growth but sustained and steady without any major perturbations.
Strong technological industry guided by improving sustainable resource use.
Utilitarian without greater understanding of nature’s benefit to mankind. A return to the traditional Christian stewardship values.
Government continues to move between bouts of EU-friendly policies and stronger nationalist identity. A slow removal of public services.
Moderate development but greater focus on self-sufficiency in food and construction goods.