Embed Size (px)
DESCRIPTION
Chapter 23. Aggregate Supply and Aggregate Demand in the Short Run. In this chapter you will learn to. 1. Explain why an exogenous change in the price level shifts the AE curve and changes the equilibrium level of real GDP. - PowerPoint PPT Presentation
Citation preview
Copyright © 2008 Pearson Addison-Wesley. All rights reserved.
Chapter 23
Aggregate Supply and Aggregate Demand in the Short Run
23-2Copyright © 2008 Pearson Addison-Wesley. All rights reserved.
In this chapter you will learn to
1. Explain why an exogenous change in the price level shifts the AE curve and changes the equilibrium level of real GDP.
3. Explain the meaning of the aggregate supply (AS) curve and why it shifts when technology or factor prices change.
4. Describe and define macroeconomic equilibrium.
5. Analyze the impacts of aggregate demand and aggregate supply shocks on real GDP and the price level.
2. Derive the aggregate demand (AD) curve and what causes it to shift.
23-3Copyright © 2008 Pearson Addison-Wesley. All rights reserved.
Exogenous Changes in the Price Level
Changes in P also affect the wealth of bondholders and bond issuers
- but there is no change in aggregate wealth
An increase in P reduces the real value of money holdings.
A fall in P raises the real value of money holdings.
The Demand Side of the Economy
23-4Copyright © 2008 Pearson Addison-Wesley. All rights reserved.
Changes in Consumption
An increase in P thus reduces private-sector wealth:
- reduction in desired consumption
- downward shift in AE curve
Changes in Net Exports
There is also an effect on net exports:
- the NX function shifts downward
- further downward shift in AE curve
The Demand Side of the Economy
23-5Copyright © 2008 Pearson Addison-Wesley. All rights reserved.
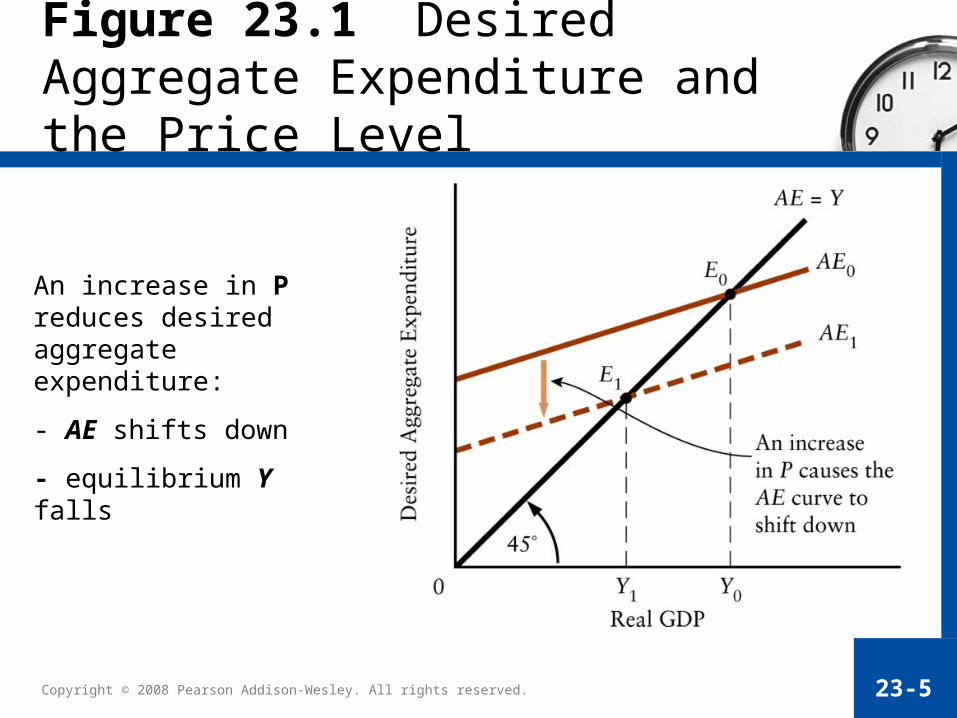
Figure 23.1 Desired Aggregate Expenditure and the Price Level
An increase in P reduces desired aggregate expenditure:
- AE shifts down
- equilibrium Y falls
23-6Copyright © 2008 Pearson Addison-Wesley. All rights reserved.
The Aggregate Demand Curve
The aggregate demand (AD) curve relates equilibrium real GDP to the price level.
For any given P, the AD curve shows the level of real GDP for which desired aggregate expenditure equals actual GDP.
Changes in the price level cause movements along the AD curve.
23-7Copyright © 2008 Pearson Addison-Wesley. All rights reserved.
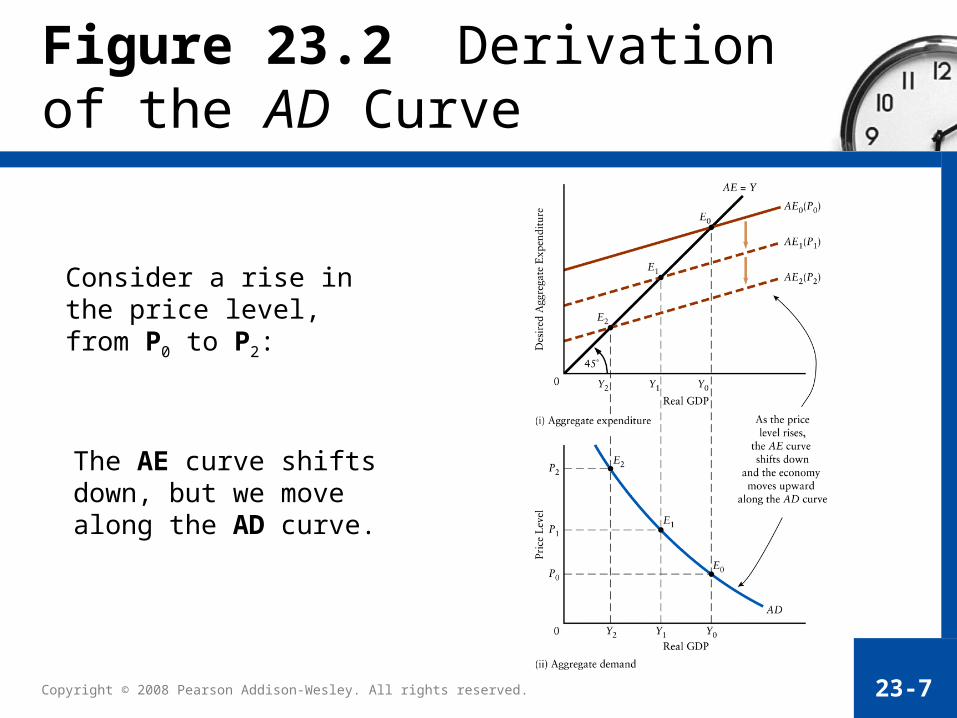
Figure 23.2 Derivation of the AD Curve
Consider a rise in the price level, from P0 to P2:
The AE curve shifts down, but we move along the AD curve.
23-8Copyright © 2008 Pearson Addison-Wesley. All rights reserved.
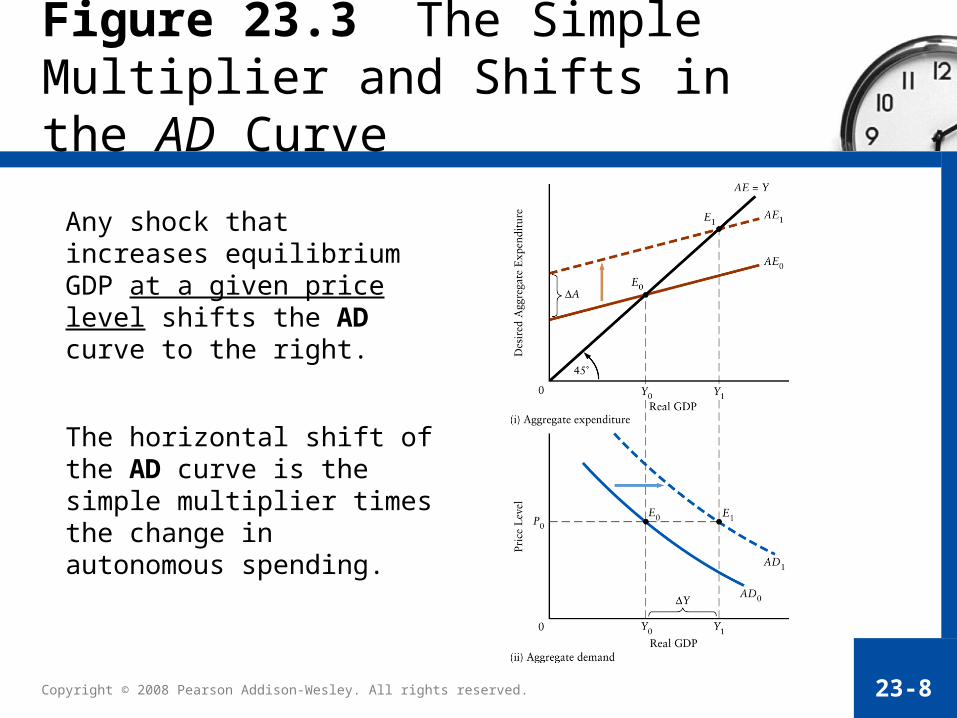
Figure 23.3 The Simple Multiplier and Shifts in the AD Curve
Any shock that increases equilibrium GDP at a given price level shifts the AD curve to the right.
The horizontal shift of the AD curve is the simple multiplier times the change in autonomous spending.
23-9Copyright © 2008 Pearson Addison-Wesley. All rights reserved.
The Simple Multiplier and the AD Curve
The simple multiplier measures the horizontal shift in the AD curve in response to a change in autonomous desired expenditure.
If the price level is constant and producers are willing to supply everything that is demanded at that price level, then the simple multiplier will also show the change in equilibrium income that will occur in response to a change in the autonomous expenditure.
23-10Copyright © 2008 Pearson Addison-Wesley. All rights reserved.
The Supply Side of the Economy
The Aggregate Supply Curve
The AS curve relates the price level to the quantity of output that firms would like to produce and sell.
The AS curve is drawn for a given
- level of technology
- set of factor prices.
23-11Copyright © 2008 Pearson Addison-Wesley. All rights reserved.
The Slope of the AS Curve
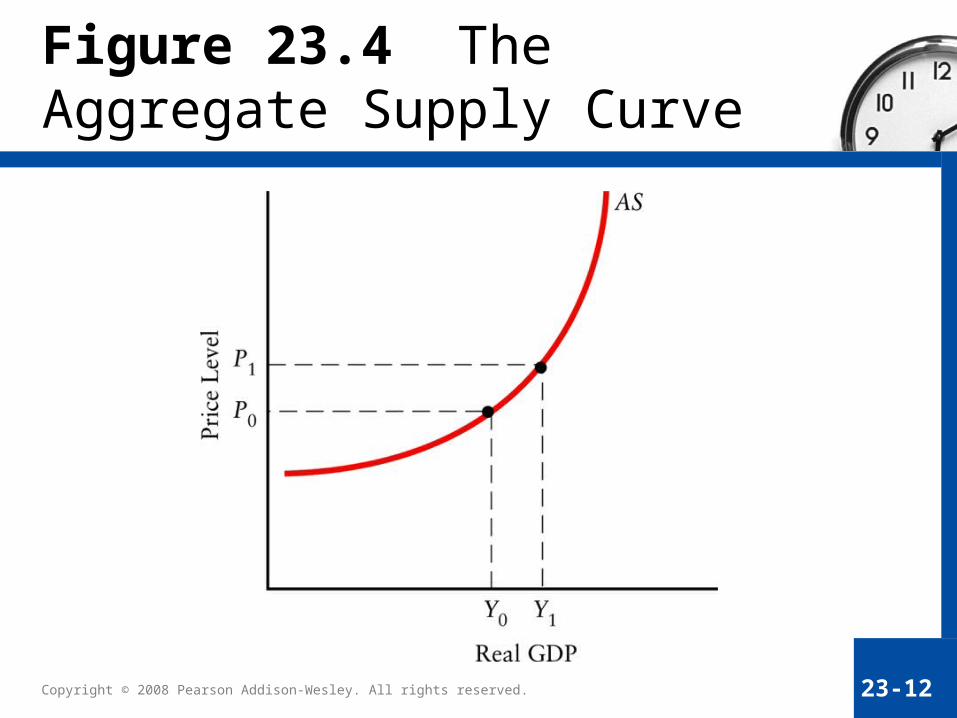
As unit costs rise with output, firms will produce more output only if prices increase.
AS curve is upward sloping
The slope of the AS Curve has an increasing slope:
– Low output: firms have excess capacity
– High output (above normal capacity): unit costs rise more rapidly.
23-12Copyright © 2008 Pearson Addison-Wesley. All rights reserved.
Figure 23.4 The Aggregate Supply Curve
23-13Copyright © 2008 Pearson Addison-Wesley. All rights reserved.
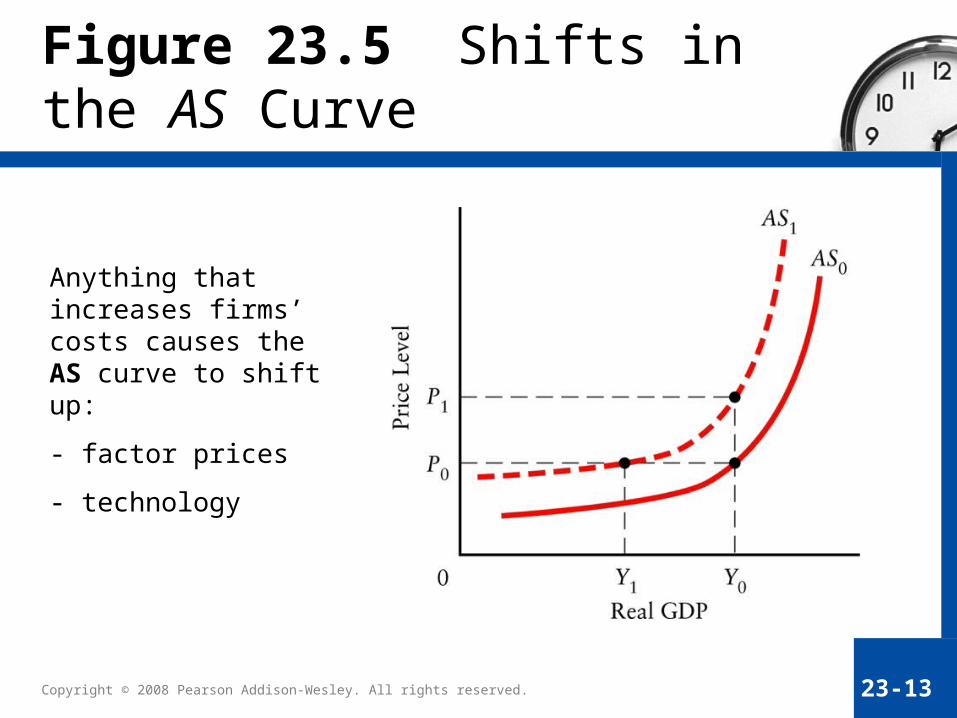
Figure 23.5 Shifts in the AS Curve
Anything that increases firms’ costs causes the AS curve to shift up:
- factor prices
- technology
23-14Copyright © 2008 Pearson Addison-Wesley. All rights reserved.
The slope of the AS curve is increasing as output rises:
- when output is low, firms have excess capacity costs do not rise quickly
- when output is nearer Y*, costs rise as output rises
firms need higher prices
The Slope of the AS Curve
23-15Copyright © 2008 Pearson Addison-Wesley. All rights reserved.
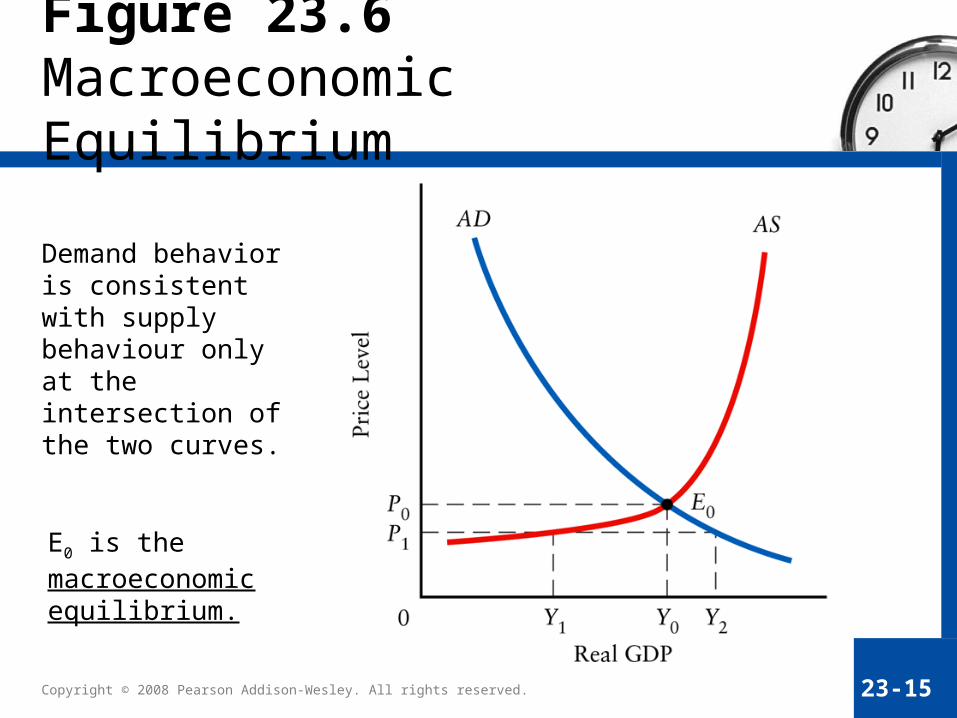
Figure 23.6 Macroeconomic Equilibrium
Demand behavior is consistent with supply behaviour only at the intersection of the two curves.
E0 is the macroeconomic equilibrium.
23-16Copyright © 2008 Pearson Addison-Wesley. All rights reserved.
Changes in the Macroeconomic Equilibrium
In both cases, “expansionary” or “contractionary” refers to the effect on equilibrium output.
Demand shocks can either be expansionary or contractionary
- direction of AD shift
Supply shocks can either be expansionary or contractionary
- direction of the AS shift
23-17Copyright © 2008 Pearson Addison-Wesley. All rights reserved.
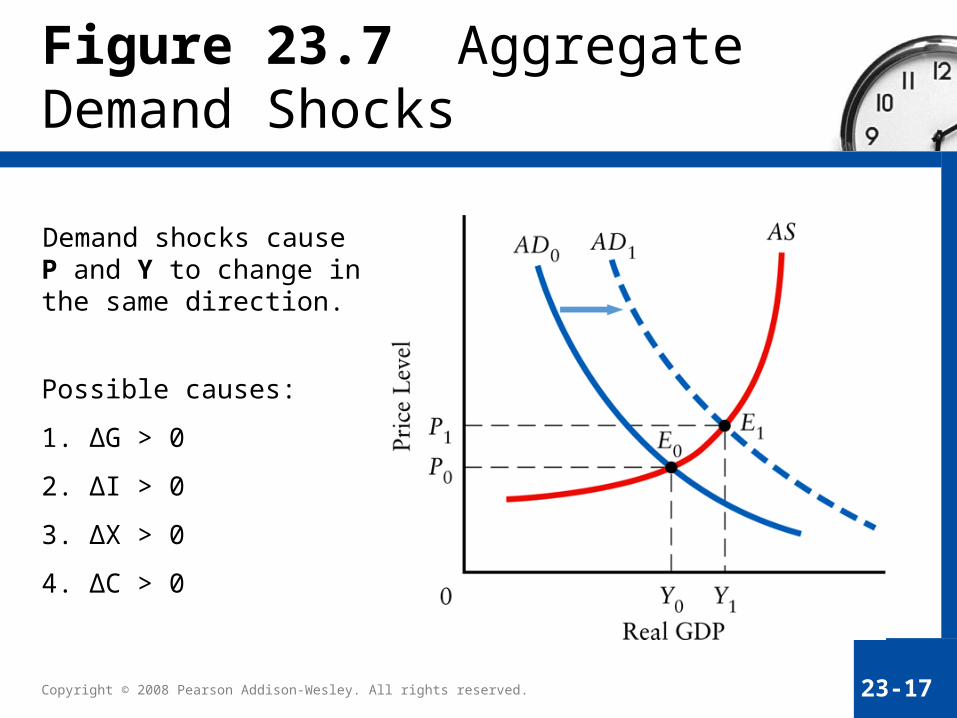
Figure 23.7 Aggregate Demand Shocks
Demand shocks cause P and Y to change in the same direction.
Possible causes:
1. ΔG > 0
2. ΔI > 0
3. ΔX > 0
4. ΔC > 0
23-18Copyright © 2008 Pearson Addison-Wesley. All rights reserved.
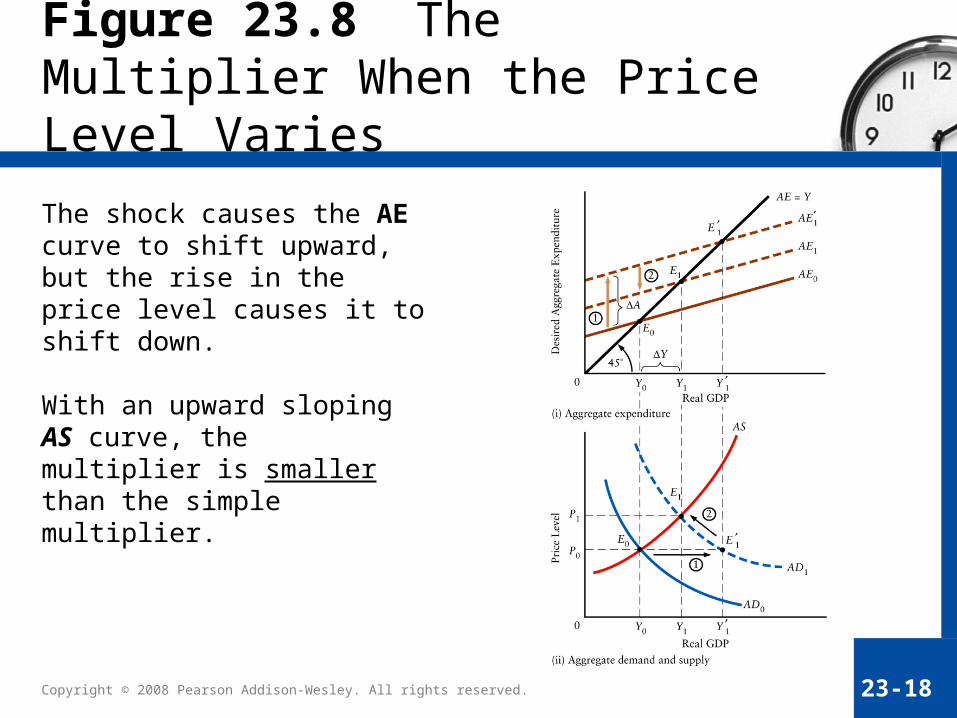
Figure 23.8 The Multiplier When the Price Level Varies
The shock causes the AE curve to shift upward, but the rise in the price level causes it to shift down.
With an upward sloping AS curve, the multiplier is smaller than the simple multiplier.
23-19Copyright © 2008 Pearson Addison-Wesley. All rights reserved.
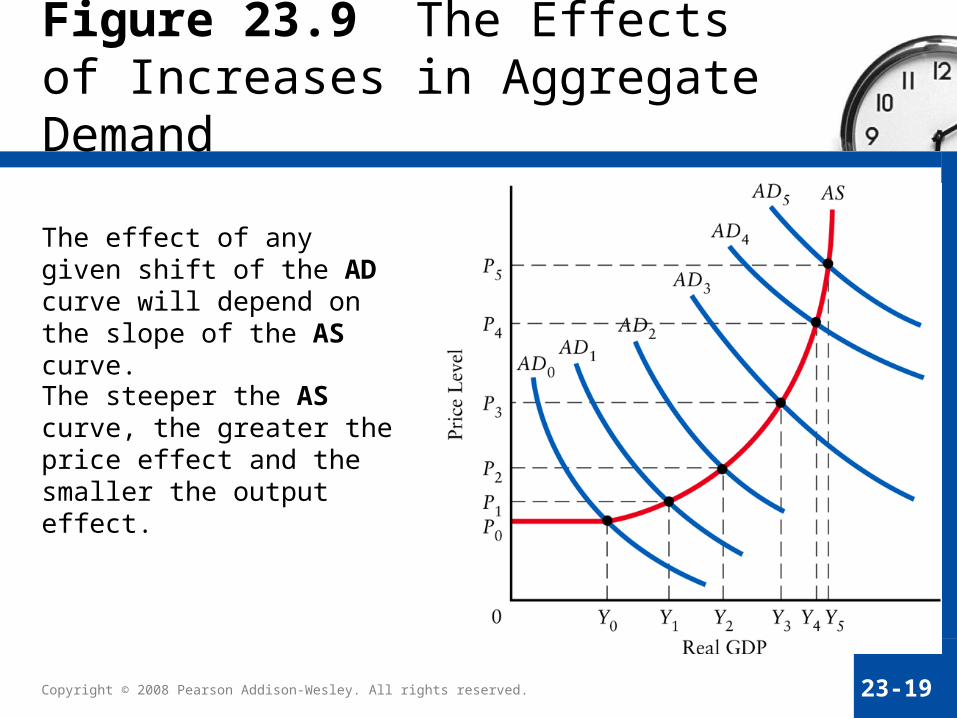
Figure 23.9 The Effects of Increases in Aggregate Demand
The effect of any given shift of the AD curve will depend on the slope of the AS curve.
The steeper the AS curve, the greater the price effect and the smaller the output effect.
23-20Copyright © 2008 Pearson Addison-Wesley. All rights reserved.
The Importance of the Shape of the AS Curve
We have now seen that the shape of the AS curve has important implications for how the effects of an AD shock are divided between changes in real GDP and changes in the price level. For any change in AD:
• Flat range of AS: no change in prices but a change in output
• Positively sloped AS : changes in both the price level and output
• Steep range of AS : little change in output but more change in the price level
23-21Copyright © 2008 Pearson Addison-Wesley. All rights reserved.
EXTENSIONS IN THEORY 23.1
The Keynesian AS Curve
The Keynesian AS Curve
23-22Copyright © 2008 Pearson Addison-Wesley. All rights reserved.
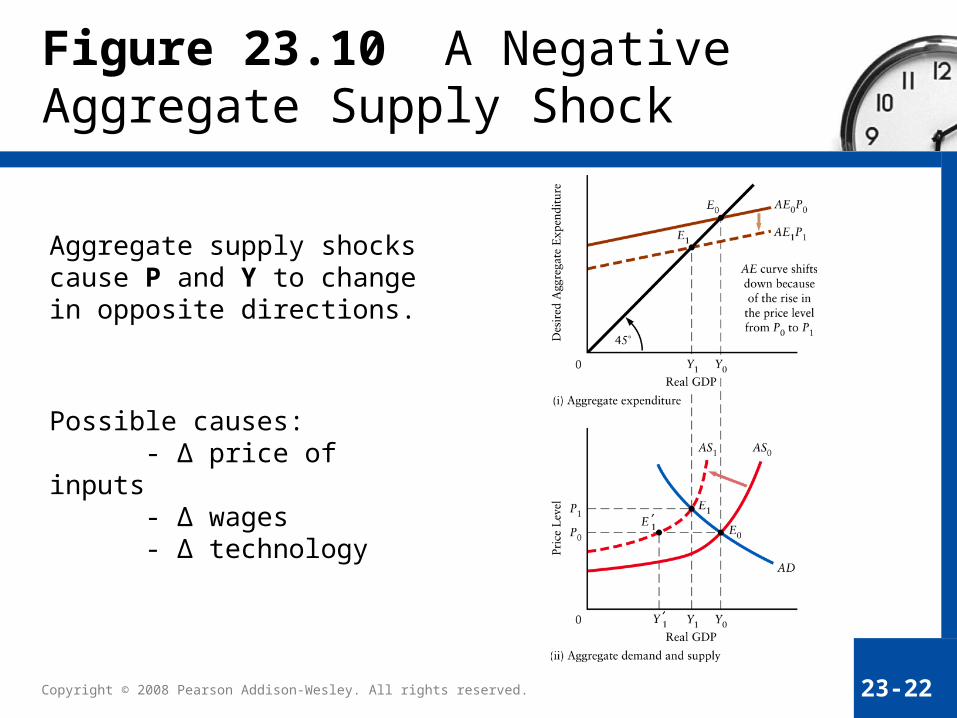
Figure 23.10 A Negative Aggregate Supply Shock
Aggregate supply shocks cause P and Y to change in opposite directions.
Possible causes:- Δ price of inputs- Δ wages- Δ technology
23-23Copyright © 2008 Pearson Addison-Wesley. All rights reserved.
A Word of Warning
Many economic events (especially changes in the world prices of raw materials) cause both aggregate demand and aggregate supply shocks.
The overall effect on the economy depends on the relative importance of the two separate effects.
APPLYING ECONOMIC CONCEPTS 23.1
Hurricane Katrina and the U.S. Economy