Embed Size (px)
Citation preview

Evaluation of San Joaquin River Flow and Southern Delta Water Quality Objectives and Implementation
20-1 September 2016
ICF 00427.11
Chapter 20 Economic Analyses
20.1 Introduction As described in Chapter 1, Introduction, the purpose of this recirculated substitute environmental
document (SED) is to present the State Water Resources Control Board’s (State Water Board)
analysis for potential changes to the Lower San Joaquin River (LSJR) flow and southern Delta water
quality (SDWQ) objectives, as well as updates to the program of implementation included in the
2006 Water Quality Control Plan for the San Francisco Bay/Sacramento–San Joaquin Delta Estuary
(2006 Bay-Delta Plan). This SED, although not an environmental impact report (EIR), fulfills the
requirements of the California Environmental Quality Act (CEQA) to analyze the environmental
effects of a proposed regulatory activity and its alternatives. The State Water Board must also
comply with Section 13141 and Section 13241 of the Porter-Cologne Act when developing and
adopting new water quality objectives.
Project-related social or economic effects are not, as a general rule, required to be analyzed in CEQA
documents; however, a lead agency may decide to include an assessment of economic or social
effects in an EIR (or, by extension, an SED), particularly if these effects are perceived as being
important or substantial. As discussed in Section 15131 of the State CEQA Guidelines, economic or
social information may be included in an EIR in whatever form a lead agency desires. The State
CEQA Guidelines also indicate that social and economic issues may be discussed in an EIR when they
are linked to physical change. (§ 15131, subd. (a).) The intermediate economic or social changes that
cause the physical change, however, need not be analyzed in any detail greater than necessary to
trace the chain of cause and effect. The focus of the analysis should be on the physical changes. If, for
example, a construction project would severely limit access to a business area, and the resultant loss
of taxes would reduce an agency’s ability to maintain infrastructure and public services, then the
fiscal (economic) impacts should be discussed. California courts have held that potential economic
and social consequences of a program or project that would cause urban decay or blight (e.g., effects
on downtown businesses from developing a suburban shopping center) should be discussed in an
EIR (e.g., Bakersfield Citizens for Local Control v. City of Bakersfield).
Under the California Water Code, the need for economic analysis associated with State Water Board
actions is required by two sections. Water Code Section 13141 states:
. . . prior to implementation of any agricultural water quality control program, an estimate of the total cost of such a program, together with an identification of potential sources of financing, shall be indicated in any regional water quality control plan.
Water Code Section 13241 states that “economic considerations” should be considered in
establishing water quality objectives. In practice, compliance with these statutory provisions
typically involves quantifying the costs to affected parties (e.g., farmers and water districts), and
assessing potential impacts on local and regional economies affected by changes in economic
activity. Evaluation of other potential economic effects, such as water quality benefits, typically is
conducted more qualitatively.

State Water Resources Control Board California Environmental Protection Agency
Economic Analyses
Evaluation of San Joaquin River Flow and Southern Delta Water Quality Objectives and Implementation
20-2 September 2016
ICF 00427.11
To address the dual objectives of the proposed plan amendments,1 this chapter is separated into the
following two geographic parts: Section 20.3, Lower San Joaquin River and Tributaries, and Section
20.4, Southern Delta.
The resources addressed in the Lower San Joaquin River and Tributaries section are as follows:
20.3.1, Changes in Hydrologic Conditions
20.3.2, Agricultural Production and Related Effects on Economic and Local Fiscal Conditions
20.3.3, Effects on Municipal and Industrial Water Supplies and Affected Regional Economies
20.3.4, Effects on Hydropower Generation, Revenues and the Regional Economy
20.3.5, Effects on Fisheries and Associated Regional Economies
20.3.6, Effects on Recreational Opportunities, Activity, and the Regional Economy
In addition to evaluating the economic effects on these resources, Section 20.3.7, Non-Flow Measures,
identifies the costs associated with other potential compliance actions that could be taken to inform
the body of scientific literature and assist with adaptive implementation.
Section 20.4, Southern Delta, evaluates the potential costs of complying with salinity water quality
objectives in the southern Delta, consistent with requirements in Water Code Section 13241. This
section presents the potential effects that higher water treatment costs could have on ratepayers
and the regional economy.
The geographic locations or study areas discussed in this chapter vary by topic, depending on the
resource being evaluated, the temporal and geographic distribution of that resource, and the
geographic extent of potential effects on local and regional economies. As such, evaluations may
extend beyond the defined plan area described in Chapter 1, Introduction. For example, the
evaluation of recreation and commercial fisheries includes the Pacific Ocean marine waters and
corresponding coastal areas. This is necessary because anadromous fish migrate to the ocean and
develop there for usually 3–4 years before they can be harvested in commercial and recreational
fisheries as they return to spawn in the freshwater rivers of their origin. The evaluation of
recreational activities related to rivers and reservoirs is generally confined to the Stanislaus,
Tuolumne, and Merced Rivers and their respective rim reservoirs, New Melones, New Don Pedro,
and Lake McClure. Given the spatial variability among topics discussed in the analyses, each
subsection in this chapter describes the geography in which the analysis focuses.
Several important considerations need to be noted concerning the analyses contained in this
chapter. The purposes of and the analytical framework for these analyses are (1) to compare
potential changes in surface water diversion-related economic effects of the LSJR alternatives, and
(2) to describe the potential costs of compliance with updated water quality objectives for the
southern Delta. Although the analyses conducted to address these two purposes are presented
together in this chapter, this should not be interpreted as an attempt to compare relevant costs and
benefits of the LSJR alternatives or of the SDWQ alternatives. While the topic-specific analyses
include certain analytical components common to each discussion (e.g., evaluation of potential
effects on the regional economy), the reader is strongly discouraged from trying to draw conclusions
across topics concerning the overall net benefits of a particular alternative. The study areas often
differ among the analyses, and information available to conduct the different analyses (such as
1 These plan amendments are the project as defined in State CEQA Guidelines, Section 15378.

State Water Resources Control Board California Environmental Protection Agency
Economic Analyses
Evaluation of San Joaquin River Flow and Southern Delta Water Quality Objectives and Implementation
20-3 September 2016
ICF 00427.11
estimates of physical impacts on a corresponding resource topic) is highly variable, thereby
precluding the conduct of a net benefit-type analysis.
The economic analysis presented in this SED will help inform the State Water Board’s consideration
of potential changes to the 2006 Bay-Delta Plan related to LSJR flow and southern Delta water
quality objectives. Any project-level changes to water rights or other measures that may be needed
to implement any approved updates to the 2006 Bay-Delta Plan will be considered in subsequent
proceedings and would require project-level analysis, as appropriate. Therefore, the economic
analyses presented in this chapter, which also summarize results from resource analyses presented
elsewhere in this SED and its appendices, are limited by the programmatic nature of this document.
20.2 Summary of Results The economic analyses in this chapter assess the potential economic effects of LSJR Alternatives 2, 3,
and 4 and SDWQ Alternatives 2 and 3 based on how the use of certain resources may change. The
economic analyses mostly rely on impacts presented in corresponding chapters and appendices in
this SED.
Under the LSJR alternatives, reductions in diversions would result both in potential cost effects (e.g.,
from reduced agricultural production) and potential beneficial effects (e.g., from enhanced
conditions for salmon and other native fisheries) in the three eastside tributary2 watersheds and the
San Joaquin River (SJR) Basin, relative to baseline conditions. Where appropriate in this chapter,
baseline conditions are described using modeled results; in cases where modeled results are not
available (e.g., fisheries), historical conditions and general trends are used to establish a point of
reference. As described in Chapter 3, Alternatives Description, baseline conditions are not
representative of the No Project Alternative. The No Project Alternative represents continuation of
the existing Bay-Delta Plan, with full implementation of the plan through D-1641 requirements. The
anticipated economic effects of LSJR Alternatives 2, 3, and 4, which represent unimpaired flow3
requirements of 20 percent, 40 percent, and 60 percent, respectively, on the three eastside
tributaries, are summarized in Tables 20.2-1 through 20.2-5.
2 In this document, the term three eastside tributaries refers to the Stanislaus, Tuolumne, and Merced Rivers. 3 Unimpaired flow represents the water production of a river basin, unaltered by upstream diversions, storage, or by export or import of water to or from other watersheds. It differs from natural flow because unimpaired flow is the flow that occurs at a specific location under the current configuration of channels, levees, floodplain, wetlands, deforestation and urbanization.
State Water Resources Control Board California Environmental Protection Agency
Economic Analyses
Evaluation of San Joaquin River Flow and Southern Delta Water Quality Objectives and Implementation
20-4 September 2016
ICF 00427.11
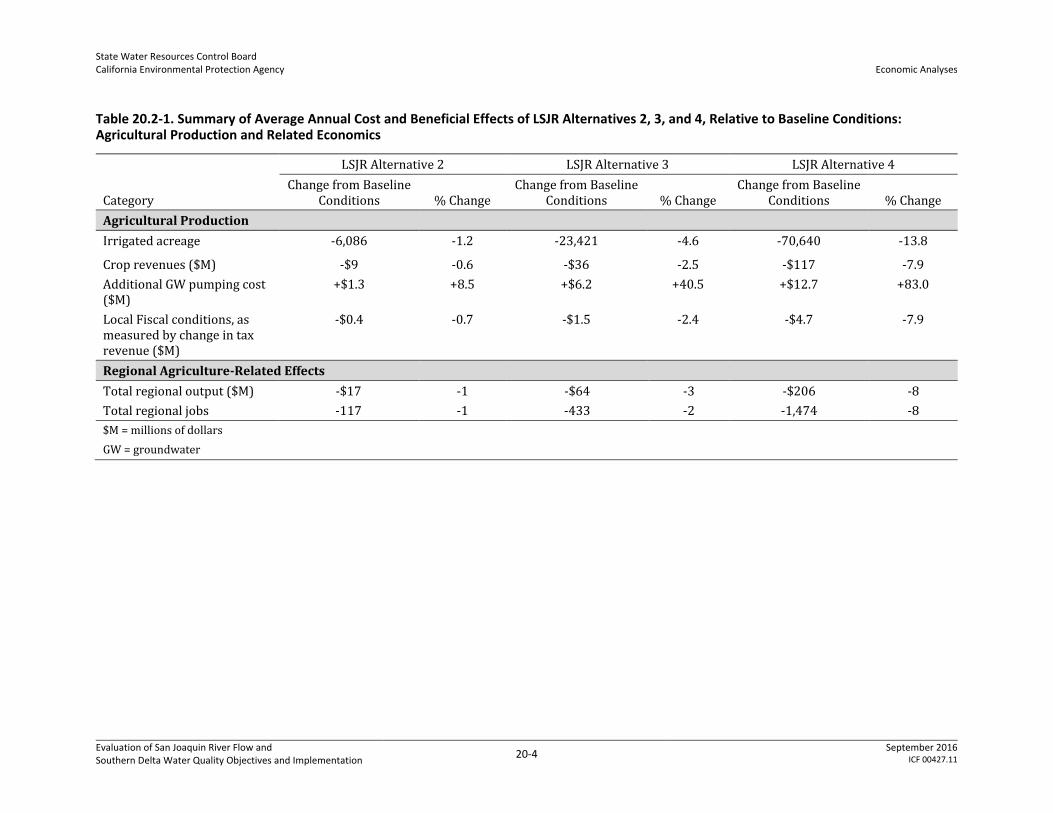
Table 20.2-1. Summary of Average Annual Cost and Beneficial Effects of LSJR Alternatives 2, 3, and 4, Relative to Baseline Conditions: Agricultural Production and Related Economics
Category
LSJR Alternative 2 LSJR Alternative 3 LSJR Alternative 4
Change from Baseline Conditions % Change
Change from Baseline Conditions % Change
Change from Baseline Conditions % Change
Agricultural Production
Irrigated acreage -6,086 -1.2 -23,421 -4.6 -70,640 -13.8
Crop revenues ($M) -$9 -0.6 -$36 -2.5 -$117 -7.9
Additional GW pumping cost ($M)
+$1.3 +8.5 +$6.2 +40.5 +$12.7 +83.0
Local Fiscal conditions, as measured by change in tax revenue ($M)
-$0.4 -0.7 -$1.5 -2.4 -$4.7 -7.9
Regional Agriculture-Related Effects
Total regional output ($M) -$17 -1 -$64 -3 -$206 -8
Total regional jobs -117 -1 -433 -2 -1,474 -8
$M = millions of dollars
GW = groundwater

State Water Resources Control Board California Environmental Protection Agency
Economic Analyses
Evaluation of San Joaquin River Flow and Southern Delta Water Quality Objectives and Implementation
20-5 September 2016
ICF 00427.11
Table 20.2-2. Summary of Average Annual Cost and Beneficial Effects of LSJR Alternatives 2, 3, and 4, Relative to Baseline Conditions: Municipal and Industrial Water Supply and Related Economics
Category
LSJR Alternative 2 LSJR Alternative 3 LSJR Alternative 4
Change from Baseline Conditions % Change
Change from Baseline Conditions % Change
Change from Baseline Conditions % Change
M&I Water Supply
Plan Area Change in average annual water supply due to reduced diversions would be 2% on the Stanislaus and Tuolumne Rivers and 6% on the Merced River; reduction in deliveries by irrigation and water districts would be district-specific and would depend on consideration of established water rights or contracts, types of planned uses for the water, and district (and other) policies concerning distribution of water supplies
Change in average annual water supply due to reduced diversions would be 12% on the Stanislaus, 14% on the Tuolumne River, and 16% on the Merced River; reductions in deliveries by irrigation and water districts would be district-specific, and would depend on consideration of established water rights or contracts, types of planned uses for the water, and district (and other) policies concerning distribution of water supplies. Costs would be more than under LSJR Alternative 2 because of less surface water supply
Change in average annual water supply due to reduced diversions would be 32% on the Stanislaus, 35% on the Tuolumne River, and 32% on the Merced River; reductions in deliveries by irrigation and water districts would be district-specific, and would depend on consideration of established water rights or contracts, types of planned uses for the water, and district (and other) policies concerning distribution of water supplies. Costs would be more than under LSJR Alternative 3 because of less surface water supply
SFPUC Service Area: Additional water supply cost ($M)a
+$14 to +$35, depending on Fourth Agreement interpretation scenario
+2.9 to +7.2 +$27 to +$119, depending on Fourth Agreement interpretation scenario
+5.6 to +24.6 +$30 to +$208, depending on Fourth Agreement interpretation scenario
+6.2 to +43.1

State Water Resources Control Board California Environmental Protection Agency
Economic Analyses
Evaluation of San Joaquin River Flow and Southern Delta Water Quality Objectives and Implementation
20-6 September 2016
ICF 00427.11
Category
LSJR Alternative 2 LSJR Alternative 3 LSJR Alternative 4
Change from Baseline Conditions % Change
Change from Baseline Conditions % Change
Change from Baseline Conditions % Change
Regional M&I Water Supply-Related Effects
Plan Area Regional effects not evaluated specifically but anticipated to be relatively minor.
Regional effects not evaluated specifically but anticipated to be relatively minor.
Regional effects not evaluated specifically but anticipated to be relatively minor.
SFPUC Service Area: Total Regional Output ($M)a
-$16 to -$40, depending on Fourth Agreement interpretation scenario
-0.03 to
-0.06
-$31 to -$140, depending on Fourth Agreement interpretation scenario
-0.05 to -0.22
-$35 to -$244, depending on Fourth Agreement interpretation scenario
-0.05 to -0.38
SFPUC Service Area: Total Regional Jobsa
-117 to -292, depending on Fourth Agreement interpretation scenario
<-0.01 to -0.01 -226 to -1005, depending on Fourth Agreement interpretation scenario
<-0.01 to -0.03 -254 to -1,756, depending on Fourth Agreement interpretation scenario
<-0.01 to
-0.06
M&I = municipal and industrial
SFPUC = San Francisco Public Utilities Commission
$M = millions of dollars
a SFPUC Service Area Water Supply Cost, Total Regional Output, and Total Regional Jobs in this table have been calculated on an annual average basis within the
most severe 6-year drought period (1987–1992), rather than over the longer-term period of record. Longer-term average costs are shown in Table 20.3.3-9b,
Table 20.3.3-14b, and Table 20.3.3-14b, and Table 20.3.3-15b.

State Water Resources Control Board California Environmental Protection Agency
Economic Analyses
Evaluation of San Joaquin River Flow and Southern Delta Water Quality Objectives and Implementation
20-7 September 2016
ICF 00427.11
Table 20.2-3. Summary of Average Annual Cost and Beneficial Effects of LSJR Alternatives 2, 3, and 4, Relative to Baseline Conditions: Hydropower Generation and Related Economics
Category
LSJR Alternative 2 LSJR Alternative 3 LSJR Alternative 4
Change from Baseline Conditions % Change
Change from Baseline Conditions % Change
Change from Baseline Conditions % Change
Hydropower Production
Generation (GWh) +29 +2 -4 0 -87 -5
Hydropower revenue ($M) +$1.68 +2 -$0.67 -1 -$6.55 -7
Regional Hydropower-Related Effects
Regional effects not quantified but would be very minimal
Regional effects not quantified but would be minimal but greater than LSJR Alternative 2
Regional effects not quantified but would be minimal but greater than LSJR Alternative 3
GWh = gigawatt hour
$M= millions of dollars

State Water Resources Control Board California Environmental Protection Agency
Economic Analyses
Evaluation of San Joaquin River Flow and Southern Delta Water Quality Objectives and Implementation
20-8 September 2016
ICF 00427.11
Table 20.2-4. Summary of Average Annual Cost and Beneficial Effects of LSJR Alternatives 2, 3, and 4, Relative to Baseline Conditions: Fisheries and Related Economics
Category
LSJR Alternative 2 LSJR Alternative 3 LSJR Alternative 4
Change from Baseline Conditions Change from Baseline Conditions Change from Baseline Conditions
Fisheries
Commercial and Sport Harvest
Effects cannot be quantified but would be expected to be beneficial; extent depends on program success, primarily concerning restoration of salmon populations available for harvest. During closures of the ocean commercial and sport fisheries in 2008 and 2009, the annual value of both the commercial and sport salmon fisheries in marine waters in California was estimated at between $255 and $290 million, and supported an estimated 1,823 to 2,263 jobs annually
Effects cannot be quantified but would be expected to be beneficial; extent depends on program success, primarily concerning restoration of salmon populations available for harvest. The value of the commercial and sport salmon fisheries in California marine water would be similar to that described under LSJR Alternative 2, but these effects would be more probable to occur than under LSJR Alternative 2.
Effects cannot be quantified but would be expected to be beneficial; extent depends on program success, primarily concerning restoration of salmon populations available for harvest. The value of the commercial and sport salmon fisheries in California marine water would be similar to that described under LSJR
Alternative 2, but these effects would be more probable to occur than under LSJR Alternative 3.
Non-Use Values Associated with Salmon Restoration
Effects cannot be reliably quantified but would be expected to be beneficial and substantial (based on study results from the literature); extent depends on program success, primarily concerning restoration of salmon populations
Effects cannot be reliably quantified but would be expected to be beneficial and substantial (based on study results from the literature); extent depends on program success, primarily concerning restoration of salmon populations, but these effects would be more probable to occur than under LSJR Alternative 2.
Effects cannot be reliably quantified but would be expected to be beneficial and substantial (based on study results from the literature); extent depends on program success, primarily concerning restoration of salmon populations, but these effects would be more probable to occur than under LSJR Alternative 3.

State Water Resources Control Board California Environmental Protection Agency
Economic Analyses
Evaluation of San Joaquin River Flow and Southern Delta Water Quality Objectives and Implementation
20-9 September 2016
ICF 00427.11
Category
LSJR Alternative 2 LSJR Alternative 3 LSJR Alternative 4
Change from Baseline Conditions Change from Baseline Conditions Change from Baseline Conditions
Regional Fisheries-Related Effects
Commercial & Sport Regional effects not quantified but would be beneficial; extent depends on program success, primarily concerning restoration of salmon populations
Regional effects not quantified but would be beneficial; extent depends on program success, primarily concerning restoration of salmon populations, but these effects would be more probable to occur than under LSJR Alternative 2.
Regional effects not quantified but would be beneficial; extent depends on program success, primarily concerning restoration of salmon populations but these effects would be more probable to occur than under LSJR Alternative 3.
Table 20.2-5. Summary of Average Annual Cost and Beneficial Effects of LSJR Alternatives 2, 3, and 4, Relative to Baseline Conditions: Recreation Activity-Related Economics
LSJR Alternative 2 LSJR Alternative 3 LSJR Alternative 4
Change from Baseline Conditions Change from Baseline Conditions Change from Baseline Conditions
Recreation: Tributary Rivers
Effects on river activity not quantified but expected to be generally unchanged
Effects on river activity not quantified but expected to be minor or even unchanged
Effects on river activity not quantified but expected to be minor
Recreation: Reservoirs
Effects on reservoir activity not quantified but expected to be generally unchanged
Effects on reservoir activity not quantified but expected to be minor or even unchanged
Effects on reservoir activity not quantified but expected to be minor
Regional Recreation-Related Effects
Not quantified but would be minor Not quantified but would be minor, and slightly greater than LSJR Alternative 2
Not quantified but would be minor, and slightly greater than LSJR Alternative 3

State Water Resources Control Board California Environmental Protection Agency
Economic Analyses
Evaluation of San Joaquin River Flow and Southern Delta Water Quality Objectives and Implementation
20-10 September 2016
ICF 00427.11
As described in Chapter 3, Alternatives Description, LSJR Alternatives 2, 3, and 4 include adaptive
implementation. Four different methods of adaptive implementation are analyzed under each LSJR
alternative. These are described in detail in Chapter 3 (Section 3.3.3, Adaptive Implementation) and
allow instream flow requirements under LSJR Alternatives 2, 3, and 4 to be adjusted. In general, the
methods are as follows.
Method 1, increasing or decreasing the percent of unimpaired flow required by up to 10 percent
depending on the LSJR alternative selected
Method 2, adjusting the timing of the unimpaired flow releases within the period of February–
June
Method 3, allowing some of the required unimpaired flow volume to be shifted outside of
February–June, depending on the LSJR alternative selected
Method 4, maintaining a certain base flow in the SJR at Vernalis.
The operational changes made using the adaptive implementation methods above may take place on
either a short-term (e.g., monthly or annually) or a longer-term basis. Where appropriate, this
chapter presents a qualitative discussion of adaptive implementation for each of the LSJR
alternatives.
The SDWQ alternatives would establish a revised salinity objective to protect the beneficial uses of
agriculture in the southern Delta. Revising the objective could involve costs to dischargers
complying with a new National Pollution Discharge Elimination System (NPDES) discharge permit,
new waste discharge requirements, or complying with a new total maximum daily load (TMDL) that
is established for protecting agricultural beneficial uses. New or updated requirements would be
established through subsequent actions of the Central Valley Regional Water Quality Control Board
(Central Valley Water Board). Potential compliance costs would be expected mostly from increased
wastewater treatment costs in various wastewater treatment districts, although costs also could be
incurred by agricultural operators for return flow salinity controls. Potential ratepayer effects and
regional economic effects resulting from higher treatment costs would also be possible. Because the
actual methods of compliance that would ultimately be used are necessarily site- and discharge-
specific, only general costs of compliance for agencies could be developed, as described below.
Reduce salinity discharges by developing new, higher-quality water supplies. Based on
purchases (i.e., water transfers) of substantial quantities of water in the southern Delta between
1997 and 2005, a reasonable cost for a long-term transfer would be about $310 per acre-foot
(AF), whereas the purchase cost for a permanent transfer would have been about $1,716 per AF
based on environmental water account (EWA) contract sales between 2002 and 2004. (Note
that these are examples of unit costs ($/AF) for developing new water supplies and do not
represent potential total costs if all water purveyors in the southern Delta portion of the plan
area decide to develop new, higher-quality water supplies.) These cost estimates are based
solely on the estimated cost of surface water and do not include capital costs (e.g., conveyance of
water from source to point of use), administrative, engineering, or legal costs related to securing
the water supply and building the infrastructure. Because water supply, demand, and price
conditions have changed substantially since the late 1990s and early 2000s, when these unit
cost estimates were developed, further research should be conducted to determine the
appropriateness of these unit costs for representing current costs.

State Water Resources Control Board California Environmental Protection Agency
Economic Analyses
Evaluation of San Joaquin River Flow and Southern Delta Water Quality Objectives and Implementation
20-11 September 2016
ICF 00427.11
Based on examples of more recent and comprehensive cost information for relatively large-scale
water supply projects, water supply costs could range from $235 to $337 million to develop
between 33,600 and 45,000 AF per year (AF/y) of new surface water resources (see Table 16-
24). Higher quality water would be used by water purveyors to reduce reliance on groundwater,
which is typically more saline than surface water supplies.
Implement salinity pretreatment programs. A wastewater treatment agency could
implement a program that involves, for example, replacing 2,000 salt-regenerating water
softeners over 5 years. Under such a program, the wastewater treatment agency could
reasonably be expected to pay between $929,000 and $9,000,000 over the life of the program
($185,700 to $1,803,100 per year). In the case when a commercial, industrial, or institutional
discharger decides to install a desalination device, costs vary based on what is being discharged,
the volume, and the desired water quality entering the wastewater collection system. Costs can
range considerably; relatively small systems can cost as little as $1,000 to install and $200 per
year to operate, whereas larger systems can cost millions of dollars to install and tens of
thousands of dollars to operate annually.
Develop desalination processes at the wastewater treatment plant. Assuming a 10 million
gallons per day (mgd) discharger, a wastewater treatment agency could be expected to pay
between $5 million and $22 million to construct a reverse osmosis system at a wastewater
treatment plant (WWTP).
Implement agricultural return flow salinity controls. Control options include real-time
management (e.g., changing the timing of the release of agricultural discharge to receiving
waters). Assuming 11 real-time management systems to effectively cover the major water users
in the plan area, estimated construction costs could total $4.7 million, with an operations and
maintenance budget of $1.1 million per year (excluding costs to construct and operate
temporary detention ponds).
Continue operating the South Delta Temporary Barriers Program. Implementation for the
SDWQ alternatives requires the continued operation (construction and removal) of the
temporary barriers in the southern Delta. A recent DWR contract was awarded to build and then
remove the temporary rock barriers for approximately $7.5 million, which accounts for other
related construction activities but no environmental studies.
Provide additional low lift pumping stations at existing south Delta temporary barriers.
Assuming a two-pumping site alternative with 1,000 cubic feet per second (cfs) pumping
capacity and combined pumping at Middle and Old River barriers, estimated construction costs
could range from $55.5 to $540.7 million, with annual operating costs ranging from $4.5 to
$62.7 million.
Under the SDWQ alternatives, costs for complying with salinity objectives could result in rate
increases for ratepayers in wastewater treatment districts that do not currently meet salinity
objectives set by the alternatives. Assessing how sewer utility rates could be affected by complying
with salinity objectives under the SDWQ alternatives is complicated because of several uncertainties
that make it infeasible to estimate rate effects as part of this SED’s program-level assessment.
However, the following wastewater treatment agencies could face increased compliance costs,
potentially resulting in higher costs for ratepayers to offset compliance-related expenditures for
development and operation of programs and/or facilities.

State Water Resources Control Board California Environmental Protection Agency
Economic Analyses
Evaluation of San Joaquin River Flow and Southern Delta Water Quality Objectives and Implementation
20-12 September 2016
ICF 00427.11
No Project Alternative (LSJR Alternative 1 and SDWQ Alternative 1)— none, or the City of Tracy,
City of Stockton, City of Manteca, and Mountain House Community Services District (CSD)
depending on the status of NPDES permits.
SDWQ Alternative 2: 1.0 dS/m salinity—City of Tracy, the City of Stockton, and Mountain House
CSD.
SDWQ Alternative 3: 1.4 dS/m salinity—none.
From the perspective of the regional economy in the southern Delta area, rate increases could shift a
portion of the spending by residential, commercial, and industrial ratepayers from consumer goods
and services, business employee wages, and business supplies and services to monthly sewer utility
bills. This shift, although somewhat speculative, would not be anticipated to affect a large
percentage of overall consumer and business spending in the region, but could cause relatively small
reduction in sales, employment, and income in several sectors of the regional economy. To some
extent, these adverse regional economic effects would be offset by increased spending by
wastewater treatment agencies to construct and operate new and expanded facilities and establish
and operate programs to achieve updated salinity objectives established by their NPDES permits.
20.3 Lower San Joaquin River and Tributaries This section describes the potential economic effects of LSJR Alternatives 2, 3, and 4 based on
modeling results from the State Water Board’s Water Supply Effects (WSE) model and the
interpretation of those results. Potential economic effects of adaptive implementation are also
addressed. The LSJR alternatives represent new instream flow requirements on the eastside
tributaries to the LSJR (Stanislaus, Tuolumne, and Merced Rivers) that are defined as a percent of
each rivers unimpaired flow from February–June. Specific requirements of the LSJR alternatives are
presented in Chapter 3, Alternatives Description. Changes in flows would result both in potential
costs (e.g., reduction in agricultural production due to reduced diversions) and potential benefits
(e.g., improved fisheries and the enhancement of river recreation opportunities); however, the
analyses in this section focus on presenting the pertinent economic effects of LSJR Alternatives 2, 3,
and 4 without attempting to sum values across resource topics. The dollar values reported in each
subsection that follows, with the exception of certain costs reported in Section 20.3.3, Effects on
Municipal and Industrial Water Supplies and Affected Regional Economies, are presented in constant
2008 dollars.
20.3.1 Changes in Hydrologic Conditions
As discussed in Appendix G, Agricultural Economic Effects of Lower San Joaquin River Flow
Alternatives: Methodology and Modeling Results, allowable monthly diversions under LSJR
Alternatives 2, 3, and 4 were estimated using the WSE model. The WSE model is a monthly water
balance spreadsheet model that estimates allowable surface water diversions and reservoir
operations needed to achieve the target flow requirements of LSJR Alternatives 2, 3, and 4 on the
three eastside tributaries. For the purposes of this analysis, the monthly diversions were added
together for a given year and presented as annual allowable diversions in thousand-acre-foot (TAF)
increments. The annual diversion estimates were then used to inform the economic analysis of
agricultural production effects, municipal and industrial water supply effects, hydropower
generation effects, and recreation effects presented later in this chapter. The CALSIM II model run

State Water Resources Control Board California Environmental Protection Agency
Economic Analyses
Evaluation of San Joaquin River Flow and Southern Delta Water Quality Objectives and Implementation
20-13 September 2016
ICF 00427.11
that was used as a source of information for the WSE model is the CALSIM II “Current Conditions”
case used in the California Department of Water Resources (DWR) 2009 Delivery Reliability Report
(DWR 2010).
Table 20.3.1-1 summarizes how the LSJR alternatives may impact surface water diversions on the
three eastside tributaries and the plan area as a whole. This table presents the average annual
allowable surface water diversions under baseline conditions and the potential change of those
diversions for each of the LSJR alternative, in total TAF values and as a percent of baseline
diversions. Table 20.3.1-1 also includes results for adaptive implementation method 1 under each of
the LSJR alternatives for illustrative purposes. Although the adaptive implementation conditions are
not quantitatively analyzed for each economic resource topic addressed in this chapter, these
adaptive implementation conditions are considered in assessing the likely direction and/or
magnitude of impacts associated with a particular LSJR alternative.
As shown in Table 20.3.1-1, the annual average reductions in surface water diversions for the LSJR
alternative without adaptive implementation ranges from 2 to 32 percent on the Stanislaus River, 2
to 35 percent on the Tuolumne River, and 6 to 32 percent on the Merced River. For the entire plan
area the annual average reduction in surface water diversions for the LSJR alternatives ranges from
3 to 33 percent. In general, average annual diversions are reduced more, relative to baseline, as the
unimpaired flow requirement increases (i.e., the least reduction occurs in LSJR Alternative 2 and the
greatest reduction occurs in LSJR Alternative 4, both without adaptive implementation.)
The values presented in Table 20.3.1-1 are averaged over the 82-year time period of modeling
results for simple reporting. However, because water supplies and related conditions in the
watersheds of the Stanislaus, Tuolumne, and Merced Rivers are highly variable over time, diversion
reductions could be higher or lower for a specific year than the value reported in the table,
depending on the hydrologic conditions. Diversions would likely receive greater cuts in drier years,
while diversions may not be reduced at all in wet years, even under LSJR Alternative 4.
Table 20.3.1-1. Average Annual Baseline Water Supply and Differences from Baseline (Changes in Diversions) in the Eastside Tributaries and Plan Area for LSJR Alternatives 2, 3, and 4 (1922–2003)
Stanislaus (TAF)/(%)
Tuolumne (TAF)/(%)
Merced (TAF)/(%)
Plan Area (TAF)/(%)
Baseline 637/100% 851/100% 580/100% 2,068/100%
LSJR Alternative 2
Without Adaptive Implementation -12/-2 -20/-2 -33/-6 -65/-3
With Adaptive Implementation (30%)a -33/-5 -56/-7 -60/-10 -149/-7
LSJR Alternative 3
Without Adaptive Implementation -79/-12 -119 /-14 -95/-16 -293/-14
With Adaptive Implementation (30%)a -33/-5 -56/-7 -60/-10 -149/-7
With Adaptive Implementation (50%)a -136 / -21 -193/-23 -136/ -23 -465/-23

State Water Resources Control Board California Environmental Protection Agency
Economic Analyses
Evaluation of San Joaquin River Flow and Southern Delta Water Quality Objectives and Implementation
20-14 September 2016
ICF 00427.11
Stanislaus (TAF)/(%)
Tuolumne (TAF)/(%)
Merced (TAF)/(%)
Plan Area (TAF)/(%)
Baseline 637/100% 851/100% 580/100% 2,068/100%
LSJR Alternative 4
Without Adaptive Implementation -206/-32 -298/-35 -185/-32 -689/-33
With Adaptive Implementation (50%)a -136 /-21 -193/-23 -136/-23 -465/-23
TAF = thousand acre-feet
TAF/y = thousand acre-feet per year
a LSJR Alternatives 2, 3, and 4 include adaptive implementation. The four methods of adaptive implementation are
described in Chapter 3, Alternatives Description. Results are presented here for method 1, which could result in an
increase or decrease of up to 10 percent of the unimpaired flow, depending on the LSJR alternative. The adaptive
implementation conditions are not quantitatively analyzed for each economic resource topic addressed in this
chapter; however, reference is made to these adaptive implementation conditions in assessing the likely direction
and/or magnitude of impacts associated with a particular LSJR alternative.
20.3.2 Agricultural Production and Related Effects on Economic and Local Fiscal Conditions
20.3.2.1 Introduction
The analysis in this section focuses on the potential economic effects that could result from changes
in agricultural production caused by reduced surface water diversions under the LSJR alternatives.
The economic variables examined include agricultural production and revenues, including
groundwater pumping costs, regional economic output, regional economic jobs, and local fiscal
conditions. Agricultural production in the tributary watersheds is dependent on irrigation water
supply from various sources, including surface water diversions, groundwater pumping, and
deliveries from the State Water Project (SWP) and the federal Central Valley Project (CVP).
Implementation of LSJR Alternatives 2, 3, and 4 is expected to affect the amount of allowable surface
water diversions and, therefore, the agricultural production dependent on those diversions.
The study area for this evaluation includes the San Joaquin, Stanislaus, and Merced Counties (three-
county region). Within the three-county region, there are multiple diverters that regularly receive
surface water from the Stanislaus, Tuolumne, or Merced Rivers. The primary water providers within
this area are collectively referred to as irrigation districts and include: South San Joaquin Irrigation
District (SSJID), Oakdale Irrigation District (OID), Stockton East Water District (SEWD), Central San
Joaquin Water Conservation District (CSJWCD), Turlock Irrigation District (TID), Modesto Irrigation
District (MID), and Merced Irrigation District (Merced ID). SEWD and CSJWCD are also sometimes
referred to as CVP contractors. Many residents and businesses also rely on water from one of the
four groundwater subbasins that underlie the three-county region: the Eastern San Joaquin,
Modesto, Turlock, and Merced Subbasins4. Irrigation district boundaries, counties in which the
districts are located, and key municipalities in this region are identified in Figures ES-2 of the
Executive Summary, Figures 2-1a, 2-1b, and 2-4 of Chapter 2, Water Resources, and Figure G.1-1 of
Appendix G, Agricultural Economic Effects of Lower San Joaquin River Flow Alternatives: Methodology
and Modeling Results.
4 As described in Chapter 9, Groundwater Resources, the Merced Subbasin was extended for the analysis to include a part of the Chowchilla Subbasin.

State Water Resources Control Board California Environmental Protection Agency
Economic Analyses
Evaluation of San Joaquin River Flow and Southern Delta Water Quality Objectives and Implementation
20-15 September 2016
ICF 00427.11
As described in Sections G.2, G.4, and G.5 in Appendix G, the analysis of agricultural production and
related economic effects follows three primary steps. First, total agricultural applied water for the
irrigation districts is estimated based on the allowable surface water diversions calculated by the
WSE model and the available groundwater pumping capacities of the irrigation districts. Second, the
Statewide Agricultural Production (SWAP) model is used to estimate how changes in applied water
directly affect agricultural production and associated revenues. Finally, the Impact Analysis for
Planning (IMPLAN) input-output model is used to estimate how changes in agricultural production
revenues, predicted by SWAP for the study area, could impact regional economic output and jobs.
The IMPLAN analysis considers the effects on all interconnected sectors of the regional economy to
estimate the total economic effect, including direct, indirect, and induced effects.
If surface water supplies are reduced, diverters would likely increase groundwater pumping to help
mitigate shortage and to meet their demands. Therefore, implementation of LSJR Alternatives 2, 3,
and 4 also would be expected to affect the need for and costs of additional groundwater pumping by
farm operators. Appendix G describes the groundwater pumping calculations in section G.2.1, Inputs
from the WSE Model, and G.2.2, Methodology for Calculating Applied Water, and summarizes the
groundwater pumping results in Tables G.3-3 and G.4-11. Potential economic impacts related to the
costs of additional groundwater pumping are summarized below.
This section focuses on three related topics: agricultural production and revenues, including the
potential impacts of additional groundwater pumping on farm operators, regional economic effects
(total economic output and jobs) in the study area, and effects on local fiscal conditions. For each
topic, the modeled baseline conditions are compared to modeled results for LSJR Alternatives 2, 3,
and 4 to determine the economic effects.
Baseline Agricultural Production and Revenues and Potential Farmer Effects
Assessment Methods
This section describes application of the SWAP model, including a description of the model inputs.
The SWAP model is a widely used agricultural production model for estimating the response of
agricultural production and associated revenues to changes in water supply. SWAP uses estimates of
applied water (described in Appendix G, Section G.2.4, Estimates of Total Applied Water) along with
crop distribution information (described in Appendix G, Section G.4.2, Crop Distribution and Applied
Water for SWAP) to estimate agricultural production and associated revenues under baseline
conditions and for LSJR Alternatives 2, 3, and 4. For more detailed description of the SWAP model,
see Appendix G, Section G.4.1, Description of the Statewide Agricultural Production Model.
The SWAP model optimizes available land and water such that net returns to farmers are
maximized. As water becomes more scarce, the crops most affected, in general, are Pasture, Alfalfa,
Rice, and Other Field Crops. These crops are affected more because they require relatively high
water use and/or generate lower net revenue per acre when compared to annual crops, such as
Almonds and Pistachios. In this analysis, the lower net-revenue crops cover large portions of the
study area; consequently, the acreages of these crop groups are substantially reduced as a result of
the LSJR alternatives, particularly for LSJR Alternative 4.
Agricultural Production and Revenues
Table 20.3.2-1 presents the average annual acreage of irrigated crops under baseline conditions and
the average difference (in acres and percent) between LSJR Alternatives 2, 3, and 4 and these

State Water Resources Control Board California Environmental Protection Agency
Economic Analyses
Evaluation of San Joaquin River Flow and Southern Delta Water Quality Objectives and Implementation
20-16 September 2016
ICF 00427.11
baseline conditions, by crop group. As shown, total acreage is reduced by about 6,100 acres (1.2
percent) under LSJR Alternative 2, by about 23,700 acres (4.6 percent) under LSJR Alternative 3, and
by about 70,600 acres (13.8 percent) under LSJR Alternative 4.
Table 20.3.2-1. Average Annual Acreage of Irrigated Crops for Baseline and Average Difference (in Acres and Percent) between LSJR Alternatives 2, 3, and 4 and Baseline, by Crop Group
Crop Group
Baseline LSJR Alternative 2 LSJR Alternative 3 LSJR Alternative 4
Acreage Change % Change Change % Change Change % Change
Alfalfa 33,311 -716 11.8 -4,584 19.4 -10,528 14.9
Almonds/Pistachios 115,054 -151 2.5 -528 2.2 -1,588 2.2
Corn 107,051 -1,194 19.6 -3,332 14.1 -18,798 26.6
Cotton 2,482 0 0.0 -11 0.0 -38 0.1
Cucurbits 2,652 -29 0.5 -64 0.3 -230 0.3
Dry Bean 2,475 -55 0.9 -149 0.6 -610 0.9
Grain 14,226 -24 0.4 -79 0.3 -409 0.6
Onion and Garlic 781 -1 0.0 -2 0.0 -5 0.0
Orchards 77,773 -59 1.0 -202 0.9 -602 0.9
Other Field Crops 53,438 -2,430 39.9 -7,345 31.0 -20,137 28.5
Other Truck Crops 27,883 -103 1.7 -358 1.5 -1,896 2.7
Pasture 31,680 -1,024 16.8 -6,148 26.0 -13,353 18.9
Rice 6,067 -246 4.0 -708 3.0 -1,973 2.8
Safflower 158 -9 0.1 -23 0.1 -64 0.1
Subtropical 1,985 -7 0.1 -25 0.1 -56 0.1
Sugarbeet 277 0 0.0 -1 0.0 -2 0.0
Tomato (fresh) 10,360 -2 0.0 -6 0.0 -20 0.0
Tomato (processing) 1,828 -23 0.4 -67 0.3 -190 0.3
Vine 22,749 -13 0.2 -47 0.2 -141 0.2
TOTAL 512,229 -6,086 -1.2 -23,679 -4.6 -70,640 -13.8
Source: Derived from Appendix G, Agricultural Economic Effects of Lower San Joaquin River Flow Alternatives:
Methodology and Modeling Results, Table G.4-6a to Table G.4-6f.
Note: SWAP results presented in this table assume groundwater pumping similar to what occurred in 2009. If
groundwater pumping capacity for 2014 is used instead, the results show an overall decrease in the reduction of
average annual crop acreage within all irrigation districts, but particularly MID. See Appendix G for more information
related to 2009 versus 2014 groundwater pumping information.
As discussed in Appendix G, Agricultural Economic Effects of Lower San Joaquin River Flow
Alternatives: Methodology and Modeling Results, the SWAP modeling predicts that pasture and field
crops could be nearly eliminated from production in some years of extreme drought, particularly
under LSJR Alternatives 3 and 4. On the other hand, higher-value crops, such as Vines, remain
unaffected under LSJR Alternatives 2 and 3. The modeling results predict that higher-value crops,
such as Tomatoes, are less affected by reduced surface water diversion than lower-value crops
because farmers would be expected to fallow lower-value crops first. Perennial crops such as Vines,
Almonds, Pistachios, and Sub-Tropical crop groups, are predicted to experience decreases in
production only during prolonged extreme droughts, such as occurred in the early 1990s.

State Water Resources Control Board California Environmental Protection Agency
Economic Analyses
Evaluation of San Joaquin River Flow and Southern Delta Water Quality Objectives and Implementation
20-17 September 2016
ICF 00427.11
Similar to changes in crop acreages, when compared to baseline conditions, average annual crop
revenues generated across all irrigation districts are predicted to slightly decrease under LSJR
Alternative 2 and to decline more substantially as irrigation water becomes less available under
LSJR Alternatives 3 and 4. As shown in Table 20.3.2-2, total average annual crop revenues in the
entire region would decrease by an estimated $9 million, or about 0.3 percent, under LSJR
Alternative 2, as compared to baseline revenues. Under LSJR Alternatives 3 and 4, crop production
revenues are estimated to decline by $36 million (2.4 percent) and $117 million (7.9 percent),
respectively, as compared to baseline revenues.
Table 20.3.2-2. Estimates of Annual Average Agricultural Revenues under Baseline Conditions and the Change in Revenues for LSJR Alternatives 2, 3, and 4, by Irrigation District
Baseline
LSJR Alternative 2
Difference from Baseline
LSJR Alternative 3
Difference from Baseline
LSJR Alternative 4
Difference from Baseline
Irrigation District
$Million/y, 2008
$Million/y, 2008
% Change $Million/y,
2008 % Change
$ Million/y, 2008
% Change
SSJID 229 -2 -1.0 -6 -2.6 -19 -8.1
OID 129 -2 -1.4 -5 -3.9 -14 -11.1
SEWD/CSJWCD 334 0 0.0 0 0.0 0 0.0
MID 148 -2 -1.2 -7 -5.0 -29 -19.5
TID 341 -3 -1.0 -16 -4.8 -50 -14.7
Merced ID 296 0 <1.0 -2 <1.0 -5 -1.7
TOTAL 1,477 -9 <1.0 -36 -2.4 -117 -7.9
Source: Appendix G, Agricultural Economic Effects of Lower San Joaquin River Flow Alternatives: Methodology and Modeling
Results, Table G.4-9.
Because water supplies and other conditions important to agricultural production are highly
variable over time, effects associated with LSJR Alternatives 2, 3, and 4 on crop revenues also vary.
These trends are characterized in Appendix G (Figure G.4-1) by an exceedance plot that shows the
magnitude and variability of estimated revenues across the 82 years of model simulation (1922–
2003) for LSJR Alternatives 2, 3, and 4 and baseline.
Groundwater Pumping Costs and Potential Impacts on Farmers
As discussed in Appendix G, Agricultural Economic Effects of the Lower San Joaquin River Flow
Alternatives: Methodology and Modeling Results, additional groundwater pumping needed to offset
the loss of surface water supplies could affect the profitability of farming operations. These potential
impacts, which are discussed in detail in Appendix G, are summarized below.
Factors affecting the costs of drilling and operating new groundwater wells, or to increase the
production of existing wells, include pump efficiency, depth of the well, cost of electricity, volumetric
flow, cost of materials for maintenance (lubrication, replacement parts, etc.), proximity to water
distribution system, and the staff needed to maintain equipment and facilities. For this analysis, an
average energy price of $0.189/kilowatt hour (kWh) over the entire irrigation season was assumed
based on information contained in the SWAP model (CH2M Hill 2012). The cost effects of additional
groundwater pumping on farming operations are presented in Table 20.3.2-3. The average price
used for this analysis is considered a conservative assumption because some of the affected
State Water Resources Control Board California Environmental Protection Agency
Economic Analyses
Evaluation of San Joaquin River Flow and Southern Delta Water Quality Objectives and Implementation
20-18 September 2016
ICF 00427.11
irrigation districts have hydropower projects and/or receive discounted power that would be less
expensive than this average price,
The estimated increase in groundwater pumping costs would range from $1.3 million per year
under LSJR Alternative 2 to $12.7 million per year under LSJR Alternative 4, when compared to
baseline conditions (Table 20.3.2-3). In addition to estimating the cost of additional groundwater
pumping on farming operations, an IMPLAN-based analysis of the induced effects on proprietary
income (presented in Table 20.3.2-3 as Induced Economic Impact) from additional groundwater
pumping are estimated to range from about $1 million per year (LSJR Alternative 2) to about $9.8
million per year (LSJR Alternative 4). Loss in proprietor income also may result in some reductions
in employment in the study area, ranging from 7 jobs in in LSJR Alternative 2 to about 74 per year in
LSJR Alternative 4, when compared to baseline conditions.
One of the effects of increased pumping costs would be to transfer income from farming to mostly
power utilities. Because operations of the power utility entities that serve the area are mostly
located outside the plan area, most of the benefits in employment and economic output from this
transfer would be expected to occur outside the study area.
Adaptive Implementation
Adaptive implementation would take place based on required evaluation of current scientific
information and would need to be approved as described in Appendix K, Revised Water Quality
Control Plan. Accordingly, the frequency and duration for any use of adaptive implementation
methods 1, 2, 3, and 4 cannot be determined at this time. Adaptive implementation method 1
potentially has the greatest likelihood to change economic effects as it would allow the unimpaired
flow requirement to be increased or decreased by up to 10 percent from the objective unimpaired
flow (with a minimum requirement of 20 percent and a maximum of 60 percent unimpaired flow).
For LSJR Alternative 2 an increase from 20 percent to 30 percent of the unimpaired flow would
likely result in different effects as compared to those shown above for LSJR Alternative 2, depending
upon flow conditions and frequency of the adjustment. As such, under LSJR Alternatives 2 or 3, if the
percentage of unimpaired flow is increased with adaptive implementation method 1, crop
production would likely shift more toward higher-value crops and away from lower value crops
(e.g., Pasture, Row Crops) than is predicted without adaptive implementation. On the other hand,
under LSJR Alternatives 3 and 4, if the percent of unimpaired flow is reduced with adaptive
implementation method 1, the shift toward higher value crops would not be as great and revenue
losses for lower value crops would be smaller than those predicted without adaptive
implementation.
Baseline Regional Economic Conditions and Potential Regional Effects
This section addresses potential regional economic effects associated with changes in agricultural
production and revenues. Estimates of the total economic output and total employment within the
three-county region under baseline conditions and under LSJR Alternatives 2, 3, and 4 are
presented. As discussed in Appendix G, Agricultural Economic Effects of the Lower San Joaquin River
Flow Alternatives: Methodology and Modeling Results, IMPLAN-derived multipliers were applied to
the estimated changes in crop production revenues as predicted by SWAP to determine these
effects.

State Water Resources Control Board California Environmental Protection Agency Economic Analyses
Evaluation of San Joaquin River Flow and Southern Delta Water Quality Objectives and Implementation
20-19 September 2016
ICF 00427.11
Table 20.3.2-3. The Average Annual Cost of Groundwater Pumping in the Irrigation Districts, and its Associated Induced Effects on Total Economic Output and Employment under Baseline Conditions and for LSJR Alternatives 2, 3, and 4
Baselinea
Change from Baseline
LSJR Alternative 2 LSJR Alternative 3 LSJR Alternative 4
Average Annual GW Pumping TAF/y 258 21 104 216
Average Annual Cost of GW Pumping $Millions/y, 2008 15.3 1.3 6.2 12.7
Induced Economic Effect $ Millions/y, 2008 11.9 1.0 4.8 9.8
Induced Employment Effect Jobs/y 89 7 36 74
Source: Appendix G, Agricultural Economic Effects of Lower San Joaquin River Flow Alternatives: Methodology and Modeling Results, Table G.4-11.
GW = groundwater
TAF/y = thousand acre-feet per year
a The baseline induced effects are approximated using marginal impact multipliers, so these values likely differ to some extent from the actual values.

State Water Resources Control Board California Environmental Protection Agency
Economic Analyses
Evaluation of San Joaquin River Flow and Southern Delta Water Quality Objectives and Implementation
20-20 September 2016
ICF 00427.11
Assessment Methods
To estimate the regional economic effects of agricultural production under baseline conditions and
for LSJR Alternatives 2, 3, and 4, this assessment used multipliers developed from the 2010 IMPLAN
database. The IMPLAN model relies on a snapshot of the interrelationships among sectors and
institutions in a regional economy; it is widely used to assess the regional economic effects resulting
from changes in the availability and use of resources.
For the IMPLAN analysis, direct agricultural revenues from the SWAP model, described above, were
“mapped” from the SWAP categories to different IMPLAN crop groups. The economic effect of each
LSJR alternative was then estimated in terms of the total annual economic output less estimates of
the direct annual revenues under baseline conditions. As described in Appendix G, the majority of
the irrigation district areas modeled using IMPLAN is contained within San Joaquin, Merced, and
Stanislaus Counties.
Potential effects on economic activity can extend beyond the three-county region used to analyze
predicted changes in agricultural production. These changes could affect residents and businesses
throughout the state, and beyond. In general, even when a change in agricultural production occurs
in a particular region, change in economic activity (sales and purchases) typically extends beyond
that area, both directly and indirectly. For example, agricultural inputs, such as seed, fertilizer,
insurance services, and fuel and transportation, often originate outside the region where they are
used. After accounting for direct sales and purchases, the indirect and induced transactions that
result from income changes and secondary effects broaden the boundaries of the originally-affected
area.
These potential effects outside of the three-county region, however, are not quantified for this
analysis; the analysis focuses on the three-county region where the irrigation districts are located
and where the direct effects on agricultural production and associated revenues would occur. Effects
on areas outside of this region would be more dispersed, thereby incurring an increasingly smaller
effect.
Results
Overview of Regional Economic Effects
Under LSJR Alternatives 2, 3, and 4, reductions in water deliveries to agricultural users would affect
several sectors of the economy, in addition to agriculture. When farm production decreases as a
result of reduced water availability, farmers often would hire fewer seasonal workers and may lay
off some year-round workers. Without jobs, household spending by these workers is likely to
decrease, affecting retailers and other businesses in the area. In addition, farmers would likely
reduce purchases of equipment, materials, and services from local businesses, reducing jobs and
income for these suppliers. The total regional economic effect is the sum of the direct effects on
agriculture and the associated indirect and induced effects.
Effects on Total Economic Output in the Study Area
Table 20.3.2-4, presents estimates of average annual effects on total economic output (including
direct, indirect, and induced effects) related to agricultural production in the irrigation districts
under baseline conditions. Table 20.3.2-4 also presents differences from baseline conditions, both in
State Water Resources Control Board California Environmental Protection Agency
Economic Analyses
Evaluation of San Joaquin River Flow and Southern Delta Water Quality Objectives and Implementation
20-21 September 2016
ICF 00427.11
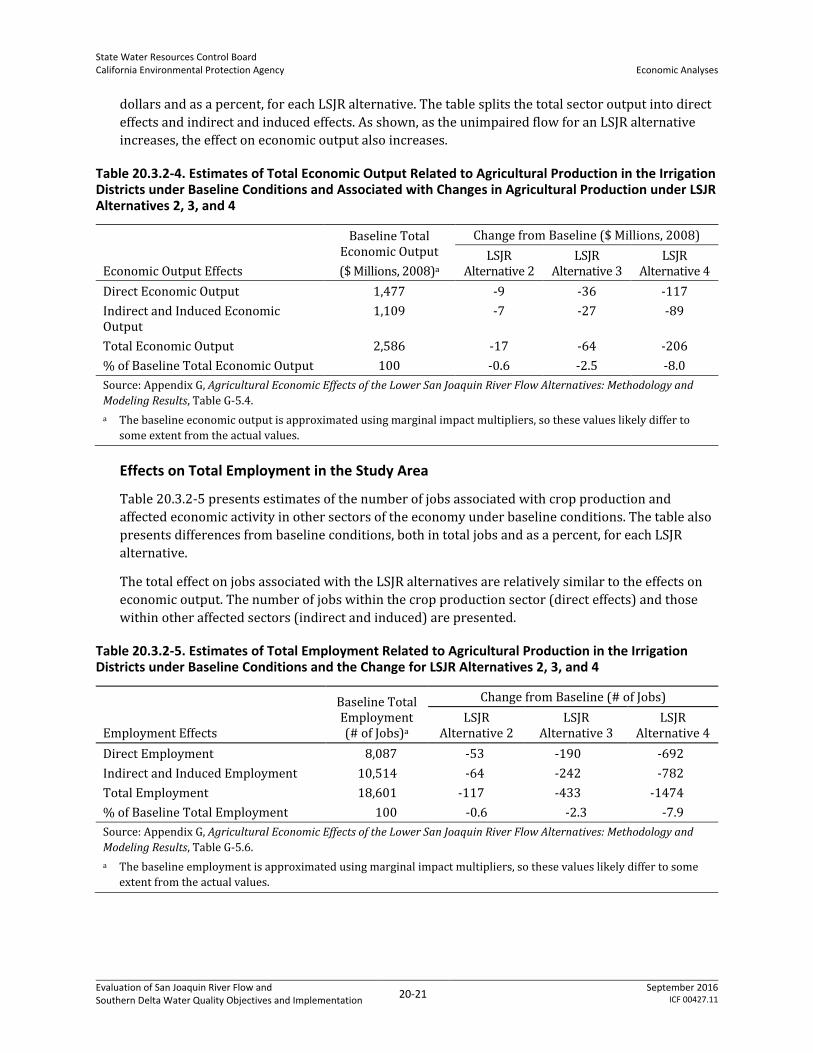
dollars and as a percent, for each LSJR alternative. The table splits the total sector output into direct
effects and indirect and induced effects. As shown, as the unimpaired flow for an LSJR alternative
increases, the effect on economic output also increases.
Table 20.3.2-4. Estimates of Total Economic Output Related to Agricultural Production in the Irrigation Districts under Baseline Conditions and Associated with Changes in Agricultural Production under LSJR Alternatives 2, 3, and 4
Economic Output Effects
Baseline Total Economic Output
($ Millions, 2008)a
Change from Baseline ($ Millions, 2008)
LSJR Alternative 2
LSJR Alternative 3
LSJR Alternative 4
Direct Economic Output 1,477 -9 -36 -117
Indirect and Induced Economic Output
1,109 -7 -27 -89
Total Economic Output 2,586 -17 -64 -206
% of Baseline Total Economic Output 100 -0.6 -2.5 -8.0
Source: Appendix G, Agricultural Economic Effects of the Lower San Joaquin River Flow Alternatives: Methodology and
Modeling Results, Table G-5.4.
a The baseline economic output is approximated using marginal impact multipliers, so these values likely differ to
some extent from the actual values.
Effects on Total Employment in the Study Area
Table 20.3.2-5 presents estimates of the number of jobs associated with crop production and
affected economic activity in other sectors of the economy under baseline conditions. The table also
presents differences from baseline conditions, both in total jobs and as a percent, for each LSJR
alternative.
The total effect on jobs associated with the LSJR alternatives are relatively similar to the effects on
economic output. The number of jobs within the crop production sector (direct effects) and those
within other affected sectors (indirect and induced) are presented.
Table 20.3.2-5. Estimates of Total Employment Related to Agricultural Production in the Irrigation Districts under Baseline Conditions and the Change for LSJR Alternatives 2, 3, and 4
Employment Effects
Baseline Total Employment (# of Jobs)a
Change from Baseline (# of Jobs)
LSJR Alternative 2
LSJR Alternative 3
LSJR Alternative 4
Direct Employment 8,087 -53 -190 -692
Indirect and Induced Employment 10,514 -64 -242 -782
Total Employment 18,601 -117 -433 -1474
% of Baseline Total Employment 100 -0.6 -2.3 -7.9
Source: Appendix G, Agricultural Economic Effects of the Lower San Joaquin River Flow Alternatives: Methodology and
Modeling Results, Table G-5.6.
a The baseline employment is approximated using marginal impact multipliers, so these values likely differ to some
extent from the actual values.

State Water Resources Control Board California Environmental Protection Agency
Economic Analyses
Evaluation of San Joaquin River Flow and Southern Delta Water Quality Objectives and Implementation
20-22 September 2016
ICF 00427.11
Other Regional Considerations
As described in Appendix L, City and County of San Francisco Analyses, and summarized in Section
20.3.3, Effects on Municipal and Industrial Water Supplies and Affected Regional Economies, the
analysis of potential economic effects on water districts and ratepayers in the San Francisco Public
Utilities Commission (SFPUC) service area assumes that water districts and farm operators in the
plan area would be willing to sell water to the SFPUC for $1,000 per AF and that existing Tuolumne
River water supply infrastructure would be used to transfer this water to the San Francisco Bay
Area. These assumed agreements would result in a stream of income from the SFPUC to the willing
irrigation districts. As shown in Tables 20.3.3-9a and 20.3.3-9b (Section 20.3.3, Effects on Municipal
and Industrial Water Supplies and Affected Regional Economies), the income that would be paid in
severe drought years to the irrigation districts is estimated to be $14 million or $25 million under
LSJR Alternative 2, $27 million or $119 million under LSJR Alternative 3, and $30 million or $208
million under LSJR Alternative 4, depending on which scenario under the Fourth Agreement
between CCSF and the irrigation districts is agreed upon. (For more information regarding the
Fourth Agreement, see Section 20.3.3.4, M&I Water Supply Conditions in the SFPUC Service Area and
Potential Effects.) This income would be expected to offset, to some extent, the economic effects in
the three-county region caused by reduced agricultural production.
Adaptive Implementation
Adaptive implementation would take place based on required evaluation of current scientific
information and would need to be approved as described in Appendix K, Revised Water Quality
Control Plan. Accordingly, the frequency and duration for any use of adaptive implementation
methods 1, 2, 3, and 4 cannot be determined at this time. Adaptive implementation method 1
potentially has the greatest likelihood of changing economic effects as it would allow the unimpaired
flow requirements to be increased or decreased by up to 10 percent from the objective unimpaired
flow (with a minimum requirement of 20 percent and a maximum of 60 percent unimpaired flow).
For LSJR Alternative 2, an increase from 20 percent to 30 percent of the unimpaired flow would
likely result in different effects as compared to those shown above for LSJR Alternative 2, depending
upon flow conditions and frequency of the adjustment. As such, under LSJR Alternatives 2 or 3, if the
percentage of unimpaired flow is increased with adaptive implementation method 1, the regional
economic and employment effects could be greater than those predicted without adaptive
implementation. On the other hand, under LSJR Alternatives 3 and 4, if the percent of unimpaired
flow is reduced with adaptive implementation method 1, the regional economic and employment
effects could be less than those predicted without adaptive implementation.
Baseline Local Fiscal Conditions and Potential Fiscal Effects
This section describes how changes in agricultural production could affect local fiscal conditions in
the three-county study region. Agricultural production encourages economic activity throughout
local economies, generating millions of dollars in revenue for farmers and related industries.
Federal, state, and local governments also collect a portion of this income by imposing various taxes.
Potential fiscal effects at the state and federal level are described in Appendix G, Agricultural
Economic Effects of the Lower San Joaquin River Flow Alternatives: Methodology and Modeling Results,
along with details of the following assessment on local fiscal conditions.
State Water Resources Control Board California Environmental Protection Agency
Economic Analyses
Evaluation of San Joaquin River Flow and Southern Delta Water Quality Objectives and Implementation
20-23 September 2016
ICF 00427.11
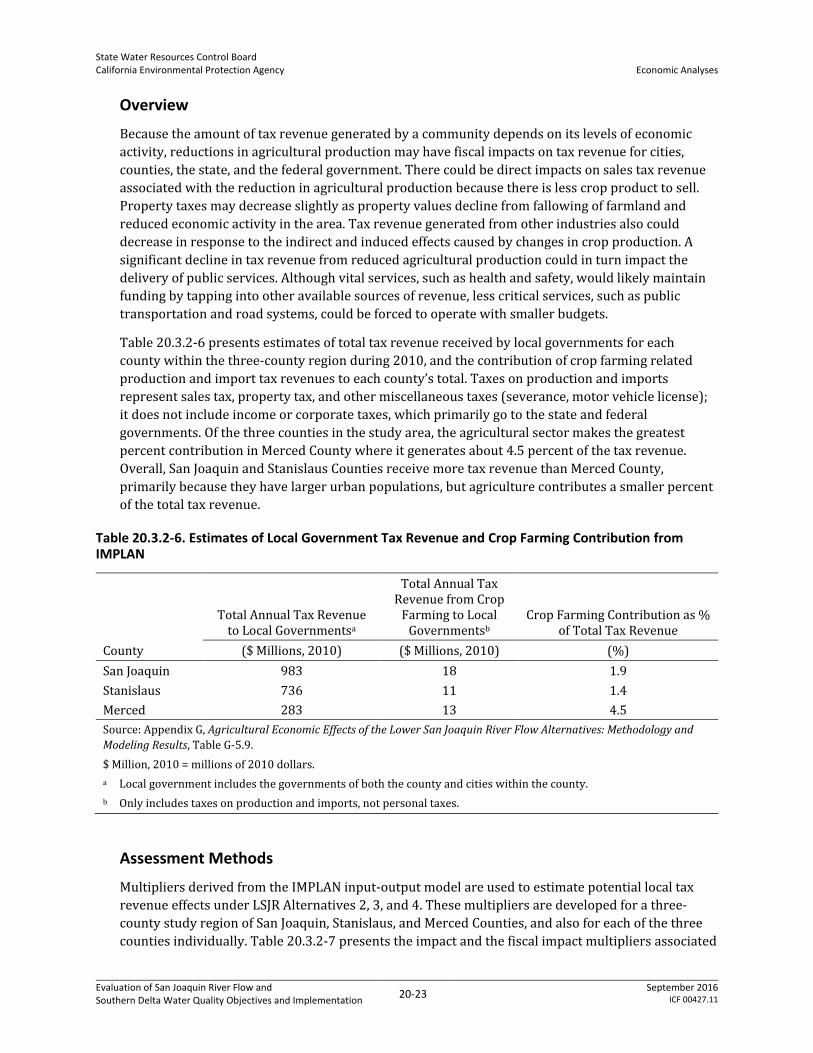
Overview
Because the amount of tax revenue generated by a community depends on its levels of economic
activity, reductions in agricultural production may have fiscal impacts on tax revenue for cities,
counties, the state, and the federal government. There could be direct impacts on sales tax revenue
associated with the reduction in agricultural production because there is less crop product to sell.
Property taxes may decrease slightly as property values decline from fallowing of farmland and
reduced economic activity in the area. Tax revenue generated from other industries also could
decrease in response to the indirect and induced effects caused by changes in crop production. A
significant decline in tax revenue from reduced agricultural production could in turn impact the
delivery of public services. Although vital services, such as health and safety, would likely maintain
funding by tapping into other available sources of revenue, less critical services, such as public
transportation and road systems, could be forced to operate with smaller budgets.
Table 20.3.2-6 presents estimates of total tax revenue received by local governments for each
county within the three-county region during 2010, and the contribution of crop farming related
production and import tax revenues to each county’s total. Taxes on production and imports
represent sales tax, property tax, and other miscellaneous taxes (severance, motor vehicle license);
it does not include income or corporate taxes, which primarily go to the state and federal
governments. Of the three counties in the study area, the agricultural sector makes the greatest
percent contribution in Merced County where it generates about 4.5 percent of the tax revenue.
Overall, San Joaquin and Stanislaus Counties receive more tax revenue than Merced County,
primarily because they have larger urban populations, but agriculture contributes a smaller percent
of the total tax revenue.
Table 20.3.2-6. Estimates of Local Government Tax Revenue and Crop Farming Contribution from IMPLAN
County
Total Annual Tax Revenue to Local Governmentsa
Total Annual Tax Revenue from Crop
Farming to Local Governmentsb
Crop Farming Contribution as % of Total Tax Revenue
($ Millions, 2010) ($ Millions, 2010) (%)
San Joaquin 983 18 1.9
Stanislaus 736 11 1.4
Merced 283 13 4.5
Source: Appendix G, Agricultural Economic Effects of the Lower San Joaquin River Flow Alternatives: Methodology and
Modeling Results, Table G-5.9.
$ Million, 2010 = millions of 2010 dollars.
a Local government includes the governments of both the county and cities within the county.
b Only includes taxes on production and imports, not personal taxes.
Assessment Methods
Multipliers derived from the IMPLAN input-output model are used to estimate potential local tax
revenue effects under LSJR Alternatives 2, 3, and 4. These multipliers are developed for a three-
county study region of San Joaquin, Stanislaus, and Merced Counties, and also for each of the three
counties individually. Table 20.3.2-7 presents the impact and the fiscal impact multipliers associated

State Water Resources Control Board California Environmental Protection Agency
Economic Analyses
Evaluation of San Joaquin River Flow and Southern Delta Water Quality Objectives and Implementation
20-24 September 2016
ICF 00427.11
with an agricultural revenue loss of $1 million in each county. For example, a 1 million dollar loss in
agricultural revenue in San Joaquin County would have a direct loss of $15,691 in tax revenue for
local governments. Accounting for the indirect and induced effects of the 1 million dollar loss would
increase the tax revenue losses to $44,731. To create fiscal impact multipliers for the different levels
of government, the total loss at each level of government is divided by $1 million. In other words, the
total federal tax impact is 15.4 percent of the agricultural revenue loss, the total state tax impact is
6.1 percent of the loss, and the total local tax impact is 4.5 percent of the loss.
The county fiscal impact multipliers in Table 20.3.2-7 are used with the SWAP results for crop
revenue as described in Appendix G, Section G.4.3, SWAP Modeling Results, to estimate the tax
revenue losses. Before applying the multipliers, SWAP results for crop revenue in each of the
irrigation districts are first totaled by county. For OID and TID, which each overlap portions of two
counties, the revenue is divided between the counties based on the relative area of the irrigation
districts in each county. According the OID AWMP (2012) 20 percent of OID falls in San Joaquin
County and 80 percent falls in Stanislaus County. TID is estimated to have 74 percent of its area in
Stanislaus County and 26 percent of it area in Merced County, based on GIS analysis.
Table 20.3.2-7. Fiscal Impacts by County of a Hypothetical $1 Million Crop Revenue Loss
Level of Government
Tax Revenue Impact ($ Million, 2010) Fiscal Impact Multipliers
Direct Totala Direct Total
San Joaquin
Federal -75,482 -154,003 0.075 0.154
State -27,156 -61,415 0.027 0.061
Local -15,691 -44,731 0.016 0.045
Stanislaus
Federal -83,268 -153,658 0.083 0.154
State -28,707 -60,647 0.029 0.061
Local -15,998 -40,519 0.016 0.041
Merced
Federal -70,966 -108,684 0.071 0.109
State -26,757 -47,082 0.027 0.047
Local -15,404 -32,610 0.015 0.033
Source: Appendix G, Agricultural Economic Effects of Lower San Joaquin River Flow Alternatives: Methodology and
Modeling Results, Table G-5.12.
$ Million, 2010 = millions of 2010 dollars.
a Includes direct, indirect, and induced effects of a $1 million (in 2010 dollars) loss in agricultural revenue.
Results
This section focuses on potential effects for local tax revenues under each of the LSJR alternatives,
although results for state and federal tax revenues also are addressed. Table 20.3.2-8 shows the
annual average tax revenue related to changes (decreases) in agricultural production for each level
of government in the three counties individually and in the three-county region as a whole. Under
baseline, the federal government receives about $210 million and the state receives about $85
million in tax revenue from agricultural production over all three counties, which is only 0.01

State Water Resources Control Board California Environmental Protection Agency
Economic Analyses
Evaluation of San Joaquin River Flow and Southern Delta Water Quality Objectives and Implementation
20-25 September 2016
ICF 00427.11
percent and 0.09 percent of their total tax revenue for 2010, respectively. Both federal and state tax
revenues from agricultural production in the three counties decrease by an estimated 0.7 percent
under LSJR Alternative 2, up to about 8.1 percent under LSJR Alternative 4; however, these changes
are minor compared to the total revenue for 2010.
Table 20.3.2-8. Estimated Change in Tax Revenue Associated with Predicted Changes in Annual Agricultural Production for LSJR Alternatives 2, 3, and 4 Relative to Baseline Conditions
County Level of Government
Tax Revenue Effects of Agricultural Production
Baseline ($ Millions,
2008)a
Change Relative to Baseline ($ Millions, 2008)
LSJR Alternative 2
LSJR Alternative 3
LSJR Alternative 4
San Joaquin
Federal 91 -0.41 -1.08 -3.29
State 36 -0.16 -0.43 -1.31
Local 26 -0.12 -0.31 -0.96
Stanislaus
Federal 77 -0.89 -3.60 -11.88
State 31 -0.35 -1.42 -4.69
Local 20 -0.23 -0.95 -3.13
Merced
Federal 42 -0.12 -0.63 -1.98
State 18 -0.05 -0.27 -0.86
Local 13 -0.03 -0.19 -0.59
Total, All Counties
Federal 210 -1.41 -5.31 -17.15
State 85 -0.56 -2.12 -6.86
Local 59 -0.39 -1.45 -4.68
Source: Appendix G, Agricultural Economic Effects of Lower San Joaquin River Flow Alternatives: Methodology and
Modeling Results, Table G-5.13.
$ Millions, 2008 = millions of 2008 dollars.
a The baseline tax revenue is approximated using marginal impact multipliers, so these values likely differ to some
extent from the actual values.
Table 20.3.2-9 summarizes the effect of the LSJR alternatives on local governments and how it
compares to the total annual tax revenue from Table 20.3.2-6. Under baseline, local governments in
San Joaquin, Stanislaus, and Merced Counties receive an estimated $26, $20, and $13 million in tax
revenue from annual agricultural production, respectively. These revenues represent about 2.7 to
4.5 percent of the total annual tax revenue for local governments in each of the three counties (Table
20.3.2-9). For the LSJR alternatives, the resulting impact on tax revenue is small compared to the
total annual tax revenue. Stanislaus County has the largest reduction in tax revenue of the three
counties, but its losses would not exceed an estimated 0.4 percent of the total annual tax revenue
under any of the LSJR alternatives.

State Water Resources Control Board California Environmental Protection Agency
Economic Analyses
Evaluation of San Joaquin River Flow and Southern Delta Water Quality Objectives and Implementation
20-26 September 2016
ICF 00427.11
Table 20.3.2-9. Estimates of Local Tax Revenue Associated with Predicted Changes in Annual Agricultural Production, as a Percent of Total Tax Revenue
County
Estimates of Total Annual Tax Revenue to Local
Governmentsa,b
($ Millions, 2008)
Tax Revenue Related to Predicted Annual Agricultural Production, by County
Baseline Value as % of Estimated Total
Annual Tax Revenuec
Change Relative to Baseline as % of Estimated Total Annual Tax Revenue
LSJR Alternative 2
LSJR Alternative 3
LSJR Alternative 4
San Joaquin 963 2.7 <0.01 <0.01 -0.1
Stanislaus 722 2.8 <0.01 -0.1 -0.4
Merced 278 4.5 <0.01 -0.1 -0.2
Source: Appendix G, Agricultural Economic Effects of Lower San Joaquin River Flow Alternatives: Methodology and
Modeling Results, Table G-5.14.
$ Million, 2008 = millions of 2008 dollars.
a Local government includes the governments of both the county and cities within the county.
b Dollar values from IMPLAN are in $2010 and had to be converted to $2008 with a conversion factor of 0.980
derived from BEA data (BEA 2016).
c The baseline tax revenue is approximated using marginal impact multipliers, so these values likely differ to some
extent from the actual values.
Given the results presented above (and in Appendix G), LSJR Alternatives 2, 3, and 4 would have a
minor effect on tax revenue for all levels of government relative to the total tax revenue collected by
each level of government. Tax revenue from agricultural production is a larger percentage of income
for local governments than for the federal or state government, but it is still relatively small
compared to tax revenue from other sources. Although the three counties in the study area account
for some of the largest agricultural producing counties in the state5, the contribution to tax revenue
from agriculture is relatively small for most local governments. A recent report similarly concluded
that lost agricultural production over the drought from 2012–2014 did not substantially impact the
finances of most local governments (MIS 2014). While there could be localized impacts on small
towns that primarily rely on agriculture, most cities within the three-county region would not be
expected to experience substantial budgetary changes or impacts on public services.
Adaptive Implementation
Adaptive implementation would take place based on required evaluation of current scientific
information and would need to be approved as described in Appendix K, Revised Water Quality
Control Plan. Accordingly, the frequency and duration for any use of adaptive implementation
methods 1, 2, 3, and 4 cannot be determined at this time. Adaptive implementation method 1
potentially has the greatest likelihood of changing fiscal effects as it would allow the unimpaired
flow requirements to be increased or decreased by up to 10 percent from the objective unimpaired
flow (with a minimum requirement of 20 percent and a maximum of 60 percent unimpaired flow).
For LSJR Alternative 2, an increase from 20 percent to 30 percent of the unimpaired flow would
likely result in different effects as compared to those shown above for LSJR Alternative 2, depending
5 See information in the 2012 Census of Agriculture for California – county data. Can be accessed at: https://www.nass.usda.gov/Statistics_by_State/California/Publications/

State Water Resources Control Board California Environmental Protection Agency
Economic Analyses
Evaluation of San Joaquin River Flow and Southern Delta Water Quality Objectives and Implementation
20-27 September 2016
ICF 00427.11
upon flow conditions and frequency of the adjustment. As such, under LSJR Alternatives 2 or 3, if the
percentage of unimpaired flow is increased with adaptive implementation method 1, tax revenue
related to agricultural production would likely decrease slightly more than is predicted without
adaptive implementation. On the other hand, under LSJR Alternatives 3 and 4, if the percent of
unimpaired flow is reduced with adaptive implementation method 1, tax revenue related to
agricultural production would be slightly larger than predicted without adaptive implementation.
Overall, given the very small estimated changes in agricultural-related tax revenue, it is not expected
that adaptive implementation would substantially change the effects presented above.
20.3.3 Effects on Municipal and Industrial Water Supplies and Affected Regional Economies
Implementation of LSJR Alternatives 2, 3, and 4 could result in surface and groundwater water
supply reductions to municipal and industrial (M&I) service providers in the plan area, as described
in Chapter 13, Service Providers, and Chapter 22, Integrated Discussion of Potential Municipal and
Domestic Water Supply Management Options. Specifically, M&I service providers that rely on surface
water contracts with irrigation districts within the plan area or rely solely on groundwater from the
four primary groundwater subbasins under the plan area could be particularly affected if they do
not have ready access to alternative supplies (Tables 13-3a and 13-3b).
This section discusses potential costs to municipal and industrial service providers, identified in
Chapter 13, concerning different activities they may undertake to secure reliable water supplies.
Potential effects on ratepayers in affected irrigation districts within the plan area also are evaluated.
In addition to potential effects within the plan area, implementation of the LSJR alternatives under
drought conditions could result in water supply reductions within the SFPUC retail service area, and
within the service areas of the 27 agencies in Alameda, San Mateo, and Santa Clara Counties that
purchase wholesale water from SFPUC. The analysis presented in this section (and described in
greater detail in Appendix L, City and County of San Francisco Analyses) assumes that under LSJR
Alternatives 2, 3, and 4, during drought periods, SFPUC could meet its potential water supply
shortage by buying water from MID and TID. However, due to the uncertainties of this type of water
transfer (i.e., price of water, quantity of water available, willingness of parties to enter into an
agreement), other actions that SFPUC might undertake to ensure a reliable supply of water for its
service area also are considered (primarily in Chapter 16, Evaluation of Other Indirect and Additional
Actions, and summarized in Appendix L).
This section first describes M&I water supply conditions in the plan area and addresses potential
effects that the LSJR alternatives may have on these water districts and their ratepayers. The section
then describes M&I water supply conditions in the SFPUC service area and assesses potential
indirect effects of the LSJR alternatives on water supply costs and the regional economy within that
service area. Additional details of the assessment for potential M&I water supply effects in the
SFPUC service area are included in Appendix L.
M&I Water Supply Conditions in the Plan Area and Potential Water District and Ratepayer Effects
This section addresses potential economic effects of reduced surface water diversions on affected
water districts and ratepayers within the plan area under LSJR Alternatives 2, 3, and 4. The
following assessment uses three of the service providers in the plan area as examples: SSJID, SEWD,

State Water Resources Control Board California Environmental Protection Agency
Economic Analyses
Evaluation of San Joaquin River Flow and Southern Delta Water Quality Objectives and Implementation
20-28 September 2016
ICF 00427.11
and MID. The discussion first presents information on water usage, types of uses served, rate
structures, and facility improvement plans for each district, followed by a qualitative assessment of
the potential economic effects on these and other districts (and ratepayers) in the plan area using
information presented in Chapter 13, Service Providers, and Chapter 16, Evaluation of Other Indirect
and Additional Actions. These districts exhibit certain characteristics that are important to assessing
potential economic effects, as they rely on surface water to meet some or all of their demand and
they have agreements to either provide surface water to other water users or receive surface water.
Affected Water Districts
Water service providers in the plan area obtain their water supplies by either diverting surface
water from one or more of the three eastside tributaries (see Table 13-2) or by pumping
groundwater from aquifers (see Tables 13-3a and 13-3b). Some irrigation districts also have
contracts or agreements to obtain water supplies from other water users, including water districts
or conservation districts. Irrigation districts within the plan area obtain most of their water supply
from surface water diversions; other water users primarily rely on groundwater, or a combination
of groundwater and surface water, for their water (see Tables 13-3a and 13-3b). As identified in
Chapter 13, Service Providers (see Table 13-2), five irrigation districts receive surface water from the
Stanislaus, Tuolumne, and Merced Rivers, and 13 other water users, including water districts and
conservation districts, obtain some of its water from one of the primary surface water diverters.
South San Joaquin Irrigation District
SSJID, together with OID, holds contract rights with the U.S. Bureau of Reclamation (USBR) to divert
600 thousand acre-feet (TAF) of water from the Stanislaus River. Water usage by type of use within
the SSJID is identified in Table 20.3.3-1.
Table 20.3.3-1. South San Joaquin Irrigation District Water Usage by Type of Use
Type of Use Usage (acre-feet)
Treated Water for Cities of Lathrop, Manteca, and Tracy 19,263 (2014)
Groundwater Recharge from Distribution Seepage and Applied Irrigation Water
132,513 (2014)
SSJID Water Transfers 325 (40,150 to San Luis & Delta-Mendota
Water Authority in 2013)
Supplemental Water to Improve Flow for Chinook Salmon (Average of 3,529 from 2000–2010)
Source: SSJID 2015a.
SSJID charges a flat rate of $24 per acre for water service to each parcel performing irrigation, with a
$50 minimum charge. In addition, SSJID charges a groundwater recharge fee of $12 per acre for
parcels of more than 10 acres with a $25 minimum charge, as long as the parcel is subject to an
Irrigation Service Abandonment Agreement (ISAA). In 2013, the district enacted a $3 per AF
volumetric charge for water. However, starting in 2016, the district plans to have a two-tier
volumetric charge, where it increases to $10 per AF if water use exceeds 48 inches per year (Table
20.3.3-2). Finally, since 2010, the district also has imposed a pressurized water charge of $30/AF for

State Water Resources Control Board California Environmental Protection Agency
Economic Analyses
Evaluation of San Joaquin River Flow and Southern Delta Water Quality Objectives and Implementation
20-29 September 2016
ICF 00427.11
the first 3 AF/y and $40/AF in excess of 3 AF/y for customers served with pressurized water by the
District’s Irrigation System Improvement Project
Table 20.3.3-2. South San Joaquin Irrigation District2016 Water Rate Structure
Category of Charge Cost in $/Acre (AC) or $/Acre-Foot (AF)
Fixed Charge None
Flat Rate $24/AC (with a $50 minimum)
Groundwater Recharge Fee (for parcels of 10+ acres, subject to an ISAA)
$12/AC (with a $25 minimum)
Volumetric—Tier 1 (water use ≤ 48"/y) $3/AF
Volumetric—Tier 2 (water use > 58"/y) $10/AF
Pressurized Water Charge (first 3 AF/y) $30/AF
Pressurized Water Charge (above 3 AF/y) $40/AF
Source: SSJID 2015b.
Although the district does not have a fixed capital cost fee, it is allowed by district law to levy
assessments for maintenance projects. The district may also collect charges for any services
furnished. The second tier volumetric charges (Table 20.3.3-2) were recently enacted to pay for the
increased costs of ongoing maintenance and other pipeline costs.
The SSJID’s 2011 capital improvement plan includes the following highlights.
Expanding the Nick C. DeGroot Water Treatment Plant to increase the total output of the plant to
43,000 AF/y of water, which would provide sufficient capacity to supply Escalon with treated
water.
Constructing a new pipeline to Escalon.
Constructing a 10-mile-long pressurized water delivery system to areas west of Ripon.
Using newly installed electronic controllers on district groundwater pumps to measure
groundwater salinity.
Implementing a 2011 plan to provide drinking water to Ripon, which requires constructing a
new pipeline.
Supplying a new 80-acre annexation area with irrigation water from existing irrigation facilities.
Stockton East Water District
SEWD provides water to the CalWater Services Company, the Stockton Municipal Utility District, and
very small amounts of water to the County of San Joaquin. District surface water is diverted from the
Stanislaus River and the Calaveras River. Surface water is stored in two reservoirs and treated at the
Dr. Joe Waidhofer water treatment plant. The district provides about 12,400 AF/y of water for urban
uses, and about 117,400 AF/y for agricultural uses (SEWD 2014).
As of January 2015, SEWD’s rate structure for water included both fixed charges and volumetric
charges (Table 20.3.3-3). Also included is a base monthly charge that allocates costs of the
Treatment Plant Budget (SEWD 2014). Groundwater production costs are estimated during each
update of the water management plan.

State Water Resources Control Board California Environmental Protection Agency
Economic Analyses
Evaluation of San Joaquin River Flow and Southern Delta Water Quality Objectives and Implementation
20-30 September 2016
ICF 00427.11
Table 20.3.3-3. Stockton East Water District Rate Structure and Units Billed, by Type of Use
Charges Charge Units Units Billed During Year Collected
Fixed Charges
Urban
Domestic Groundwater $37.50/Well 5,042 Wells $218, 549
Agricultural
Surface water $20/AF 4,150 AF $83,008
Agricultural Groundwater $4.58/AF 117,434 AF $537,806
Volumetric Charges
Urban
Municipal Groundwater $164.31/AF 16,122 AF $2,506,012
Agricultural
Metered Surface Water $20/AF 18,965 AF $379,304
Source: SEWD 2014.
AF = acre-feet
According to the 2014 SEWD Water Management Plan, no new treatment facilities or reservoirs are
planned; however, the district has expressed interest in securing additional supplemental supplies
from the Calaveras River (SEWD 2014).
Modesto Irrigation District
Water usage by type of use within the MID service area is shown in Table 20.3.3-4. As shown,
irrigation water accounts for the largest share (65 percent) of the total water usage in the district.
Table 20.3.3-4. Modesto Irrigation District Water Usage in 2012, by Type of Use
Type of Use Usage (2012) (acre-feet)
Surface Water—Irrigation 278,800
M&I Treated Surface Water 32,661
Groundwater Pumping—Irrigation (agency wells) 17,300
Groundwater Pumping—M&I (agency wells) 28,700
Groundwater Pumping—Irrigation (private wells) 81,200
Source: MID 2015a.
As of March 2015, MID’s water rate structure included both a fixed charge and a four-tier volumetric
charge (Table 20.3.3-5). If a customer takes no surface water, the landowner is charged a facilities
maintenance fee that is half of the fixed charge, or $20 per acre. Provisions of the Amended and
Restated Treatment and Delivery Agreement (ARTDA) reached between MID and the City of
Modesto in 2005 allow MID the option to pass higher costs on to water customers, including the City
of Modesto, if the state of California levies fees or other charges on MID.

State Water Resources Control Board California Environmental Protection Agency
Economic Analyses
Evaluation of San Joaquin River Flow and Southern Delta Water Quality Objectives and Implementation
20-31 September 2016
ICF 00427.11
Table 20.3.3-5. Modesto Irrigation District Water Rate Structure
Category Cost $/Acre (AC) or $/Acre Foot (AF)
Fixed Charge $40.00/AC
Volumetric—Tier 1 (water use ≤ 24"/y) $1.00/AF
Volumetric —Tier 2 (24"/y < water use ≤ 36"/y) $2.00/AF
Volumetric—Tier 3 (36"/y < water use ≤ 42"/y) $3.00/AF
Volumetric—Tier 4 (42"/y < water use) $10.00/AF
Source: MID 2015b.
MID is presently moving forward on Phase Two of its Modesto Regional Wastewater Treatment
Plant (MRWTP) project, which would expand water treatment capacity to 67,000 AF. As part of the
project, new storage tanks and pipelines are expected to be built. During Phase One, MID and the
City of Modesto developed a long-term water management plan, which included combining well
water with surface water supplies from the Tuolumne River. In addition to water supply, MID also
operates an extensive power grid, and the capital costs associated with the power grid are allocated
jointly with the water infrastructure costs as part of the Capital Infrastructure Budget (MID 2013).
Potential Effects of the LSJR Alternatives
The LSJR alternatives are expected to result in reduced surface water diversions on the Stanislaus,
Tuolumne, and Merced Rivers. The reduced surface water diversion could increase the cost of
operations for irrigation and water districts in the plan area. This effect, in turn, could also indirectly
affect the customers of the affected water service providers. This section presents an evaluation of
these potential effects, including a qualitative assessment on how affected service providers can
recover the investment costs of securing other reliable water supplies.
Potential Changes in Water Supply Costs
As discussed in Chapter 13, Service Providers, the extent of reduced surface water diversions on the
amount of water in the eastside tributaries would vary by alternative. The average percent
reduction in water supply on the Stanislaus, Tuolumne, and Merced Rivers is between 2 and 6
percent for LSJR Alternative 2, between 12 and 16 percent for LSJR Alternative 3, and between 32
and 35 percent for LSJR Alternative 4. The extent to which these reductions in surface water
diversions would affect water supplies delivered by irrigation and water districts in the plan area
would, however, be largely determined based on a number of factors that underlie how each
affected service provider obtains its respective water supplies. These factors include a district’s
established water rights or contracts, the types of uses that water service providers supply, existing
(district and others) policies affecting the distribution of water supplies, and local and state
regulations. As described in Chapter 13 some water supply contracts include provisions that dictate
when and how much surface water can be received by other water users from irrigation districts.
Other important considerations in assessing the extent of potential effects of reduced surface water
supplies include a district’s ability to expand water production, as needed, from current water
sources (e.g., groundwater), its ability to potentially develop alternative water supplies, and the
effectiveness of implementing demand-side management measures. As an example, service
providers that currently rely on groundwater as their primary source of water (e.g., Central San
Joaquin Water Conservation District, Manteca, Ripon, and Escalon) could potentially expand use of

State Water Resources Control Board California Environmental Protection Agency
Economic Analyses
Evaluation of San Joaquin River Flow and Southern Delta Water Quality Objectives and Implementation
20-32 September 2016
ICF 00427.11
groundwater, assuming that additional pumping of groundwater is economically feasible. This
situation would be expected to minimize potential cost effects of LSJR Alternatives 2, 3, and 4.
Service providers that rely substantially on surface water diversions from the eastside tributaries
(e.g., Cities of Modesto and Tracy), however, could experience more substantial cost effects,
depending on the factors identified above.
As indicated in Chapter 13, some service providers that cannot expand production from current
water sources may need to construct new water supply infrastructure or modify existing
infrastructure to obtain water supplies from other sources. Alternatively, water conservation efforts
may be effective in offsetting some of the cost effects associated with developing new supplies.
According to information recently published by the State Water Board (2016), statewide cumulative
water conservation savings in response to Executive Order (EO) B-29-15, State of Emergency Due to
Severe Drought Conditions, totaled 23.9 percent between June 2015 and February 2016, compared
with the same months in 2013. Ultimately, affected water districts would need to consider the
capital and operating costs of acquiring alternative water supplies, including conservation actions,
and how these costs could affect the structure of water rates. Estimated costs of developing some
presumably feasible alternative water supplies, which are discussed in Chapter 16, Evaluation of
Other Indirect and Additional Actions, are summarized in Table 20.3.3-6.
Table 20.3.3-6. Cost Estimates for Developing Alternative Water Supplies
Source Cost Estimate
Water Transfers $1,716 per AF for an Environmental Water Account contract sale or $310 per AF for a long-term transfera
Substitution of Surface Water with Groundwater
$57–$76 per AF for groundwater pumping electrical costs; $102–$153 per AF annually for total operations and maintenance cost of a groundwater project; $1,938 per AF based on entire operating budget and total groundwater production
Aquifer Storage and Recovery $158–$238 per AF annually (20-year amortized cost)
Recycled Water Sources: $400–$2,100/AF for landscape and agricultural irrigation (including capital, operations, and maintenance); $700–$1,200/AF for direct potable reuse (including capital, operations, and maintenance)
Source: Chapter 16, Evaluation of Other Indirect and Additional Actions, Section 16.2.
AF = acre-foot
a The section below titled M&I Water Supply Conditions in the SFPUC Service Area and Potential Cost, Ratepayer, and
Regional Economic Effects of the LSJR alternatives discusses the costs associated with a water transfer specific to
SFPUC.
Potential Ratepayer Effects
Ratepayers in districts that substantially rely on surface water diversions from the eastside
tributaries, and where current rates do not account for unexpected capital costs, would likely be the
service providers most affected by the additional costs of replacing lost surface water supplies. Over
the long term, most districts would be expected to recover most, if not all, capital costs through rate
adjustments. Certain water service provider may consider temporarily halting construction for new
treatment facilities, as a project could become less economically viable as a result of reduced surface
water diversions; however, over time, districts would be expected to re-spread the fixed costs of its

State Water Resources Control Board California Environmental Protection Agency
Economic Analyses
Evaluation of San Joaquin River Flow and Southern Delta Water Quality Objectives and Implementation
20-33 September 2016
ICF 00427.11
projects, whether completed or not, among their ratepayers to achieve the revenue needed to
remain economically viable. The potential impacts of reduced surface water supplies could be
largely offset if cost-effective alternative supplies are available, similar to those described in Table
20.3.3-6.
A recent economic analysis of implementing EO B-29-15 (M-Cubed et al. 2015) provides additional
insight on the potential economic effects from LSJR Alternatives 2, 3, and 4. Although there are
fundamental differences in the actions being taken under the plan amendments and EO B-29-15
(implementation of the EO would result in a substantial reduction in the demand for water by
essentially restricting water use, whereas the LSJR alternatives would result in reduced surface
water supplies), both actions would not only affect water service providers, but also their
ratepayers. Over the long term, any additional net costs to affected water service providers would
likely be passed on to the ratepayers, unless specific provisions restrict this action. As presented in
the M-Cubed economic impact analysis of EO B-29-15, impacts of restricted water use would
principally consist of reduced net revenue for urban water districts and lost benefits for businesses
and ratepayers who could have used the water productively. Both types of costs ultimately would be
borne by water users, since water utilities would have to adjust their service charges and rates over
time to recover the forgone net revenue from ratepayers. Similar actions and ratepayer
consequences would be expected from implementing LSJR Alternatives 2, 3, and 4. However, these
impacts are expected to vary significantly by district as a result of water use differences, established
institutional/legal measures, water rates, and opportunities for obtaining water supplies from other
sources.
As highlighted by the differences in sources of water, types of uses and water rates for the three
example water providers characterized above, each service provider in the plan area has its own
unique set of circumstances (e.g., institutional constraints affected by user types, rate structures,
need for new facilities) within which it can react to reduced surface water supplies. As established
by state law, the intent of regularly updating water management plans is to provide districts with an
opportunity to consider how changes in supply and demand conditions potentially affect each
district and its ratepayers. Although water service providers (both primary diverters and other
water users) that rely less on surface water would appear to be less vulnerable than other service
providers, this is not necessarily the case given the many factors that must be considered. However,
service providers with cost effective opportunities to tap alternative sources of water, such as
groundwater or water transfers, would be best positioned to minimize potential costs effects of a
reduced surface water supply.
Adaptive Implementation
Adaptive implementation would take place based on required evaluation of current scientific
information and would need to be approved as described in Appendix K, Revised Water Quality
Control Plan. Accordingly, the frequency and duration for any use of adaptive implementation
methods 1, 2, 3, and 4 cannot be determined at this time. Adaptive implementation method 1
potentially has the greatest likelihood to change economic effects as it would allow the unimpaired
flow requirement to be increased or decreased by up to 10 percent from the objective unimpaired
flow (with a minimum requirement of 20 percent and a maximum of 60 percent unimpaired flow).
For LSJR Alternative 2 an increase from 20 percent to 30 percent of the unimpaired flow would
likely result in different effects as compared to those shown above for LSJR Alternative 2, depending
upon flow conditions and frequency of the adjustment. As such, under LSJR Alternatives 2 or 3, if the
percentage of unimpaired flow is increased with adaptive implementation method 1, water supply

State Water Resources Control Board California Environmental Protection Agency
Economic Analyses
Evaluation of San Joaquin River Flow and Southern Delta Water Quality Objectives and Implementation
20-34 September 2016
ICF 00427.11
costs to affected water districts also would likely increase as these districts would need to develop
more costly sources of water supply than those developed without adaptive implementation. On the
other hand, under LSJR Alternatives 3 and 4, if the percent of unimpaired flow is reduced with
adaptive implementation method 1, water supply costs to affected water districts would be expected
to be somewhat less than without adaptive implementation.
M&I Water Supply Conditions in the SFPUC Service Area and Potential Cost, Ratepayer, and Regional Economic Effects
Introduction
SFPUC is a department of CCSF that provides retail drinking water and wastewater services to San
Francisco, wholesale water to three Bay Area counties, and green hydroelectric and solar power to
San Francisco's municipal departments. The amount of water SFPUC delivers to its service area is
largely dependent on water delivered from the Tuolumne River Watershed. LSJR Alternatives 2, 3,
and 4 may affect the amount of surface water diversions to the SFPUC service area.
This discussion presents background information on SFPUC’s service area and ratepayers. It is
followed by an analysis of how the LSJR alternatives could potentially affect water supply costs, the
regional economy, and ratepayers in the service area. In addition, the potential economic effects of
purchasing water (i.e., water transfers) by SFPUC from willing sellers in the Central Valley are
analyzed. Cost information for other actions that SFPUC could take instead of purchasing water can
be found in Chapter 16, Evaluation of Other Indirect and Additional Actions and summarized in
Appendix L, City and County of San Francisco Analyses. Where appropriate, sections, tables, and
figures from Chapter 16 and Appendix L are cited in this discussion.
Service Area Conditions
CCSF, through the SFPUC, owns and operates a regional water system that provides retail water
directly to customers in San Francisco and wholesale water to 27 water agencies and water
companies in three Bay Area counties, including those serving parts of Alameda, San Mateo, and
Santa Clara Counties. CCSF also delivers water to a small number of isolated retail and wholesale
customers along the water system, including customers in Tuolumne County. In 2010, the SFPUC
retail and wholesale service areas included service to about 2.6 million residents.
The SFPUC water system has the capacity to deliver about 265 mgd (296,800 AF/y) on average, of
which about 85 percent is from the Tuolumne River Watershed through SFPUC’s Hetch Hetchy
Project, and about 15 percent is from the combined Alameda and Peninsula Watersheds. During
drought periods, the water provided by the Hetch Hetchy Project can amount to more than 93
percent of the total water delivered within SFPUC’s retail and wholesale service areas.
As Table 20.3.3-7 shows, individual water agencies rely on SFPUC supplies to varying extents. Based
on fiscal year 2010–2011 water demands and deliveries, SFPUC provided at least 90 percent of the
water used by 19 of the 27 wholesale agencies it served that year. An additional five agencies
received at least half their water supply from SFPUC. Water use by customer class also varies widely
among the wholesale agencies, as shown in Table 20.3.3-8. Across the entire wholesale service area,
about 59 percent was delivered to residential customers, 21 percent to commercial and industrial
customers, 11 percent to government and other users, and 9 percent to dedicated irrigation users.

State Water Resources Control Board California Environmental Protection Agency
Economic Analyses
Evaluation of San Joaquin River Flow and Southern Delta Water Quality Objectives and Implementation
20-35 September 2016
ICF 00427.11
Table 20.3.3-7. SFPUC Water Deliveries to Retail and Wholesale Agencies and Reliance of Agencies on San Francisco Public Utilities Commission Water, 2010
County/Agency SFPUC Water
Deliveries (mgd)
Percent of Total SFPUC Water
Deliveries
Percent of Total Demand Met by SFPUC Regional Water Systema
Retail Agency
San Francisco City/County San Francisco Retail Area
76.50b 33.9 100.0
Wholesale Agencies
Alameda County
Alameda County Water District 10.81 4.8 18.3
City of Hayward 17.25 7.6 100.0
County subtotal 28.06 12.4 41.5
San Mateo County
City of Brisbane/Guadalupe Valley Municipal Improvement Districtc
0.58 0.3 100.0
City of Burlingame 3.93 1.7 93.1
California Water Service Companyd 32.57 14.4 95.1
Coastside County Water District 1.82 0.8 90.2
Cordilleras Mutual Water Association 0.01 0.0 100.0
City of Daly City 3.21 1.4 69.2
City of East Palo Alto 1.81 0.8 100.0
Estero Municipal Improvement District 4.90 2.2 100.0
Town of Hillsborough 2.97 1.3 100.0
City of Menlo Park 3.04 1.3 100.0
Mid-Peninsula Water District 2.87 1.3 100.0
City of Millbrae 2.24 1.0 99.1
North Coast County Water District 3.02 1.3 100.0
City of Redwood City 9.61 4.3 94.3
City of San Bruno 1.46 0.6 42.7
Westborough Water District 0.84 0.4 100.0
County subtotal 74.88 33.1 92.4
Santa Clara County
City of Milpitas 6.28 2.8 61.0
City of Mountain View 8.95 4.0 82.8
City of Palo Alto 10.99 4.9 93.6
Purissima Hills Water District 1.75 0.8 100.0
City of San Jose (north) 4.13 1.8 90.8
City of Santa Clara 2.35 1.0 10.3
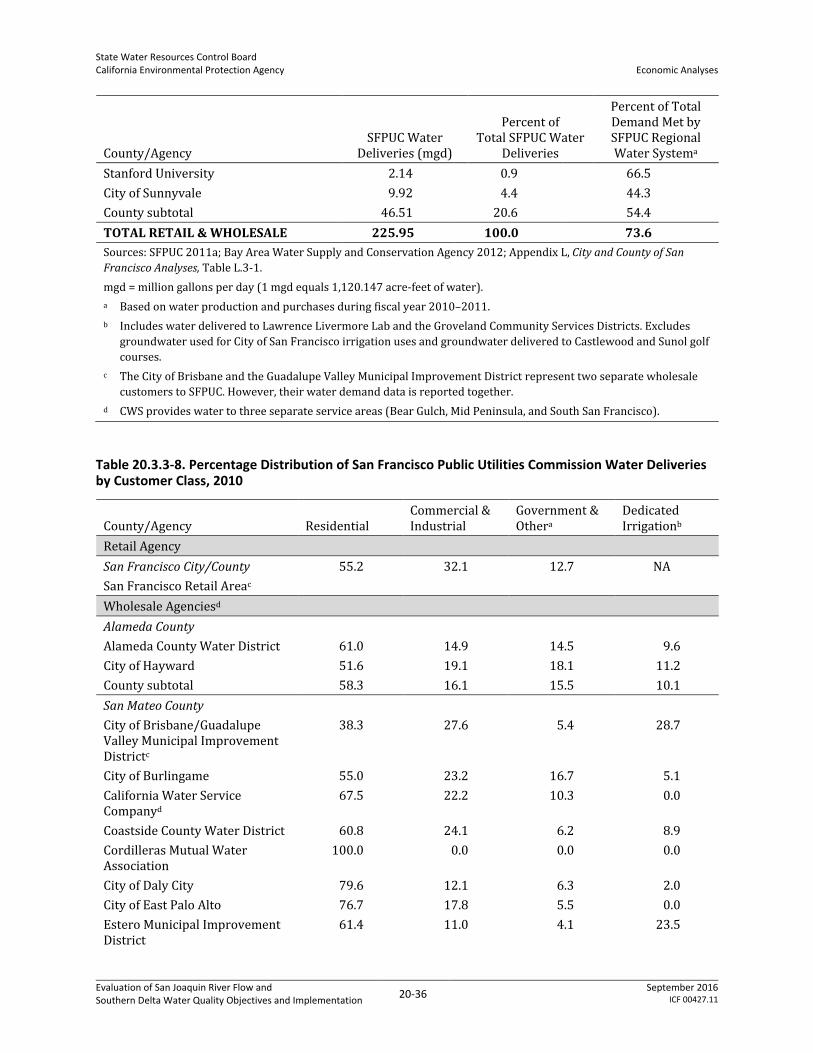
State Water Resources Control Board California Environmental Protection Agency
Economic Analyses
Evaluation of San Joaquin River Flow and Southern Delta Water Quality Objectives and Implementation
20-36 September 2016
ICF 00427.11
County/Agency SFPUC Water
Deliveries (mgd)
Percent of Total SFPUC Water
Deliveries
Percent of Total Demand Met by SFPUC Regional Water Systema
Stanford University 2.14 0.9 66.5
City of Sunnyvale 9.92 4.4 44.3
County subtotal 46.51 20.6 54.4
TOTAL RETAIL & WHOLESALE 225.95 100.0 73.6
Sources: SFPUC 2011a; Bay Area Water Supply and Conservation Agency 2012; Appendix L, City and County of San
Francisco Analyses, Table L.3-1.
mgd = million gallons per day (1 mgd equals 1,120.147 acre-feet of water).
a Based on water production and purchases during fiscal year 2010–2011.
b Includes water delivered to Lawrence Livermore Lab and the Groveland Community Services Districts. Excludes
groundwater used for City of San Francisco irrigation uses and groundwater delivered to Castlewood and Sunol golf
courses.
c The City of Brisbane and the Guadalupe Valley Municipal Improvement District represent two separate wholesale
customers to SFPUC. However, their water demand data is reported together.
d CWS provides water to three separate service areas (Bear Gulch, Mid Peninsula, and South San Francisco).
Table 20.3.3-8. Percentage Distribution of San Francisco Public Utilities Commission Water Deliveries by Customer Class, 2010
County/Agency Residential Commercial & Industrial
Government & Othera
Dedicated Irrigationb
Retail Agency
San Francisco City/County
San Francisco Retail Areac
55.2 32.1 12.7 NA
Wholesale Agenciesd
Alameda County
Alameda County Water District 61.0 14.9 14.5 9.6
City of Hayward 51.6 19.1 18.1 11.2
County subtotal 58.3 16.1 15.5 10.1
San Mateo County
City of Brisbane/Guadalupe Valley Municipal Improvement Districtc
38.3 27.6 5.4 28.7
City of Burlingame 55.0 23.2 16.7 5.1
California Water Service Companyd
67.5 22.2 10.3 0.0
Coastside County Water District 60.8 24.1 6.2 8.9
Cordilleras Mutual Water Association
100.0 0.0 0.0 0.0
City of Daly City 79.6 12.1 6.3 2.0
City of East Palo Alto 76.7 17.8 5.5 0.0
Estero Municipal Improvement District
61.4 11.0 4.1 23.5

State Water Resources Control Board California Environmental Protection Agency
Economic Analyses
Evaluation of San Joaquin River Flow and Southern Delta Water Quality Objectives and Implementation
20-37 September 2016
ICF 00427.11
County/Agency Residential Commercial & Industrial
Government & Othera
Dedicated Irrigationb
Town of Hillsborough 94.7 0.2 3.7 1.4
City of Menlo Park 44.3 33.8 11.3 10.6
Mid-Peninsula Water District 60.7 14.8 24.5 0.0
City of Millbrae 66.4 16.1 10.1 7.4
North Coast County Water District
82.8 7.4 7.6 2.2
City of Redwood City 64.8 17.2 5.7 12.3
City of San Bruno 68.2 18.2 13.6 0.0
Westborough Water District 68.8 16.7 3.7 10.8
County subtotal 67.5 18.6 9.4 4.5
Santa Clara County
City of Milpitas 43.0 24.5 13.6 18.9
City of Mountain View 53.2 18.8 4.2 23.8
City of Palo Alto 53.9 19.8 19.1 7.2
Purissima Hills Water District 93.6 0.0 5.8 0.6
City of San Jose (north) 22.9 43.2 4.5 29.4
City of Santa Clara 43.4 40.6 9.7 6.3
Stanford University 29.1 18.3 19.0 33.6
City of Sunnyvale 61.6 19.9 7.6 10.9
County subtotal 49.6 26.5 10.4 13.5
TOTAL WHOLESALE 58.5 20.8 11.4 9.3
Sources: SFPUC 2011a; Bay Area Water Supply and Conservation Agency 2012; Appendix L, City and County of San
Francisco Analyses, Table L.3-2.
NA = not available.
a Includes government uses, recycled water uses, unaccounted-for uses, meter under-registration loses, and other
system losses.
b Includes dedicated irrigation uses for both private and government customers.
c Based on 2010 demands. Does not included city irrigation uses and golf course uses served by groundwater.
d Based on fiscal year 2010–2011 demands.
Baseline Ratepayer Conditions
SFPUC funds its water system through two separate budgets, its Hetch Hetchy Water and Power
Budget and its Water Enterprise Budget. The Hetch Hetchy Water and Power Budget operates the
collection and conveyance of approximately 85 percent of SFPUC’s total water supply, employing a
system of reservoirs, hydroelectric power plants, aqueducts, pipelines, and transmission lines that
carry water and power from Hetch Hetchy to customers in San Francisco and to SFPUC’s wholesale
customers elsewhere in the Bay Area. The Water Enterprise is responsible for collecting, treating,
and distributing SFPUC’s water supply to its retail and wholesale customers, as well as operating
and maintaining pipelines in San Francisco and throughout the region, 27 pump stations, 28 dams
and reservoirs, 9 water tanks, and 3 water treatment plants. An overview of recent budget
expenditures under the Water Enterprise Budget and the water portion of the Hetch Hetchy Water
and Power Budget are shown in Table L.3-3 in Appendix L, City and County of San Francisco Analyses.

State Water Resources Control Board California Environmental Protection Agency
Economic Analyses
Evaluation of San Joaquin River Flow and Southern Delta Water Quality Objectives and Implementation
20-38 September 2016
ICF 00427.11
SFPUC sets its retail water rates based on an independent rate study conducted at least once every 5
years. Retail water rates consist of a monthly service charge based on meter size and a commodity
charge based on usage volumes. Annual rate increases for retail customers are set to meet project
costs and debt coverage requirements. SFPUC’s water rates for its 27 wholesale customers are based
on the Water Supply Agreement established in 2009. In general, costs are apportioned to wholesale
customers based on proportionate water use, and rates are reset annually to cover costs as
mandated by the Water Supply Agreement. See Table L.3-4 for actual retail and wholesale water
rates between 2008 and 2014.
Effects on M&I Water Supply in the SFPUC Service Area
This section addresses how the LSJR alternatives could potentially affect water supply costs, the
regional economy, and ratepayers in the SFPUC service area. Regional economic effects are
presented within each county in the four-county Bay Area region in which the SFPUC serves retail
and wholesale customers. Additional details of the methods and assumptions can be found in
Appendix L, City and County of San Francisco Analyses.
Potential Change in Water Supply Costs
As discussed in Section L.6 of Appendix L, City and County of San Francisco Analyses, LSJR
Alternatives 2, 3, and 4 may affect the ability of SFPUC to supply water to its retail and wholesale
customers under drought conditions. The magnitude of the effect under drought conditions depends
on how the parties involved interpret the Fourth Agreement between CCSF and MID and TID, which
currently governs the New Don Pedro Reservoir water bank account on the Tuolumne River. There
are two possible scenarios,6 which are described in Table 20.3.3-9a and referred to throughout the
remainder of this evaluation. To assess the effects of additional water supply costs on the four-
county Bay Area regional economy, it is assumed that the SFPUC would meet its water demands
during severe drought periods (such as within the 6-year drought 1987–1992) by purchasing water
from MID and TID. Under this assumption, water costs for SFPUC are estimated based on the
predicted annual average water shortage during severe drought years under each of the LSJR
alternatives, relative to baseline conditions. The annual average cost for SFPUC to replace lost
surface water supplies was then calculated based on the following assumptions.
During severe drought periods, SFPUC would replace reductions in water supplies by
purchasing water at $1,000 per AF.
No other costs to SFPUC would be required to wheel, treat, or distribute the purchased water
beyond existing costs for Hetch Hetchy water. (Note that if the transferred water comes from
Cherry or Eleanor Reservoirs instead of passing through Hetch Hetchy Reservoir, the water
would need to be filtered, potentially resulting in additional cost.)
SFPUC operations and maintenance costs to provide water from the Hetch Hetchy water system
do not vary based on the amount of water annually delivered by the system. As a result, SFPUC
6 It cannot be predicted whether and how CCSF and the irrigation districts would agree to apportion responsiblity for meeting future flow requirements. In the past, the parties have agreed to either an allocation of storage credits or payments. Nonetheless, Appendix L, City and County of San Francisco Analyses, analyzes the potential water supply effects associated with the allocation of responsibility under paragraph (b) of Article 8 of the Fourth Agreement. Under Scenario 1, storage credits would be reallocated only if CCSF has a positive credit balance in the water bank account. Under Scenario 2, storage credits would be reallocated even if CCSF has a negative balance in the water bank account. See Appendix L for more information.

State Water Resources Control Board California Environmental Protection Agency
Economic Analyses
Evaluation of San Joaquin River Flow and Southern Delta Water Quality Objectives and Implementation
20-39 September 2016
ICF 00427.11
water-production costs do not appreciably decline when less water is delivered during drought
conditions. (System facilities still need to be operated and maintained regardless of the amount
of water delivered through the system.) As a result, 100 percent of the $1,000 per AF purchase
price for water transfers would be added to overall SFPUC costs to provide water from the
Hetch Hetchy system.
Based on these assumptions, average annual water-shortage replacement costs for SFPUC are
estimated in Table 20.3.3-9a. For the LSJR alternatives, SFPUC’s annual severe-drought-period
(1987–1992) water transfer costs are estimated to range from about $14 million to $30 million
under Scenario 1 and from about $35 million to $208 million under Scenario 2.
Table 20.3.3-9a. Estimated San Francisco Public Utilities Commission Replacement Water Purchase Costs in Severe Drought Years (1987–1992) under the LSJR Alternatives
Alternative
Scenario 1a Scenario 2b
Required Water Transfer (TAF)
Estimated Purchase Cost
Required Water Transfer (TAF)
Estimated Purchase Cost
LSJR Alternative 2 14 $14,000,000 35 $35,000,000
LSJR Alternative 3 27 $27,000,000 119 $119,000,000
LSJR Alternative 4 30 $30,000,000 208 $208,000,000
Source: Appendix L, City and County of San Francisco Analyses, Table L.6-1a.
TAF = thousand acre-feet.
a Scenario 1 is defined in Appendix L as: storage credits would be reallocated only if CCSF has a positive credit
balance in the water bank account.
b Scenario 2 is defined in Appendix L as: storage credits would be reallocated even if CCSF has a negative balance in
the water bank account.
Assuming a ”worst-case” return period of one severe 6-year drought every 21 years, the mean
annual costs to purchase water in drought years shown in Table 20.3.3-9a would be spread over 21
years, instead of over only 6 drought years. The mean annual reduction in water supply compared to
baseline would range from 4–9 TAF per year under scenario 1 to 10–71 TAF per year under scenario
2 (Table 20.3.3-9b). The distributed costs would be similarly reduced—long-term annual average
costs for the LSJR alternatives are estimated to range from about $4–$9 million under Scenario 1
and from about $10–$71 million under scenario 2.
It should be noted, however, that these estimated costs to be incurred by SFPUC and its wholesale
agencies due to a water supply reduction during a severe drought would not be expected to occur
evenly over a defined period, either 6 years or 21 years, as suggested by the calculation of an
average annual value, based either on the example 1987–1992 drought or on the available 21-year
period of record used for assessing water bank deficits. Consequently, while the calculation of an
average annual cost is useful for evaluating potential effects (both cost and regional economic
effects) relative to ongoing budgetary conditions, the temporal accuracy of calculating an average
annual cost is somewhat uncertain. Appendix L, City and County of San Francisco Analyses, briefly
provides additional consideration of the return interval of such a severe drought.
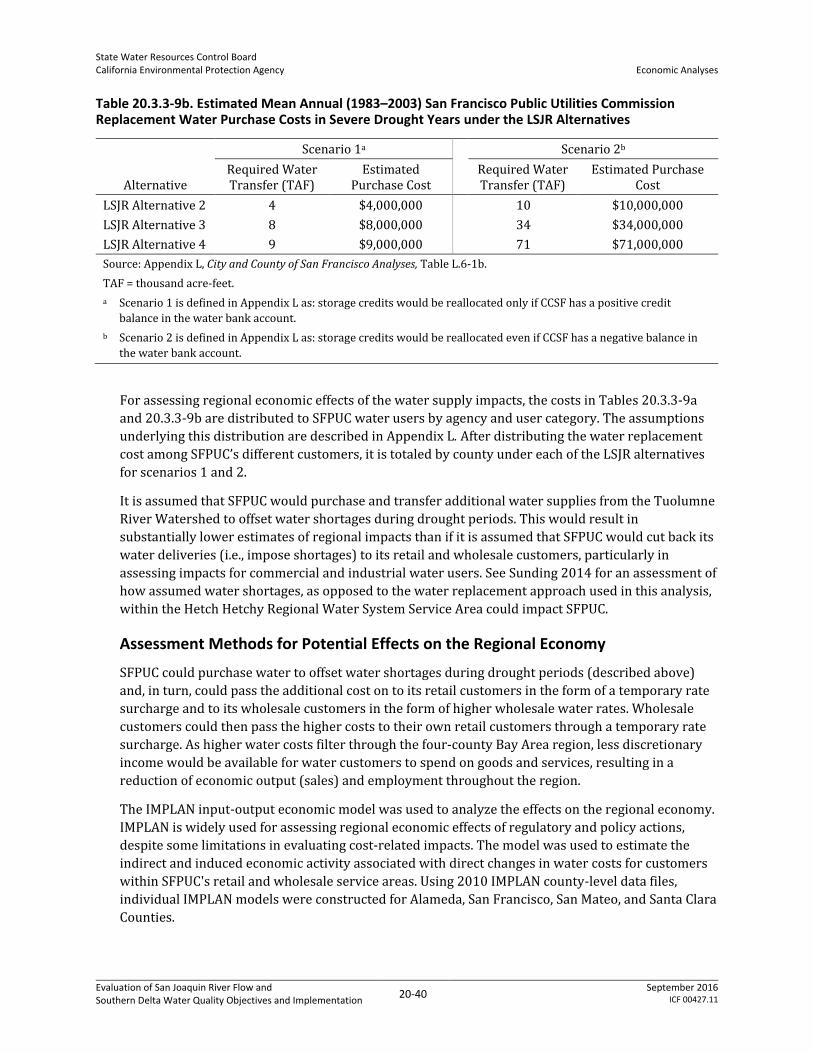
State Water Resources Control Board California Environmental Protection Agency
Economic Analyses
Evaluation of San Joaquin River Flow and Southern Delta Water Quality Objectives and Implementation
20-40 September 2016
ICF 00427.11
Table 20.3.3-9b. Estimated Mean Annual (1983–2003) San Francisco Public Utilities Commission Replacement Water Purchase Costs in Severe Drought Years under the LSJR Alternatives
Alternative
Scenario 1a Scenario 2b
Required Water Transfer (TAF)
Estimated Purchase Cost
Required Water Transfer (TAF)
Estimated Purchase Cost
LSJR Alternative 2 4 $4,000,000 10 $10,000,000
LSJR Alternative 3 8 $8,000,000 34 $34,000,000
LSJR Alternative 4 9 $9,000,000 71 $71,000,000
Source: Appendix L, City and County of San Francisco Analyses, Table L.6-1b.
TAF = thousand acre-feet.
a Scenario 1 is defined in Appendix L as: storage credits would be reallocated only if CCSF has a positive credit
balance in the water bank account.
b Scenario 2 is defined in Appendix L as: storage credits would be reallocated even if CCSF has a negative balance in
the water bank account.
For assessing regional economic effects of the water supply impacts, the costs in Tables 20.3.3-9a
and 20.3.3-9b are distributed to SFPUC water users by agency and user category. The assumptions
underlying this distribution are described in Appendix L. After distributing the water replacement
cost among SFPUC’s different customers, it is totaled by county under each of the LSJR alternatives
for scenarios 1 and 2.
It is assumed that SFPUC would purchase and transfer additional water supplies from the Tuolumne
River Watershed to offset water shortages during drought periods. This would result in
substantially lower estimates of regional impacts than if it is assumed that SFPUC would cut back its
water deliveries (i.e., impose shortages) to its retail and wholesale customers, particularly in
assessing impacts for commercial and industrial water users. See Sunding 2014 for an assessment of
how assumed water shortages, as opposed to the water replacement approach used in this analysis,
within the Hetch Hetchy Regional Water System Service Area could impact SFPUC.
Assessment Methods for Potential Effects on the Regional Economy
SFPUC could purchase water to offset water shortages during drought periods (described above)
and, in turn, could pass the additional cost on to its retail customers in the form of a temporary rate
surcharge and to its wholesale customers in the form of higher wholesale water rates. Wholesale
customers could then pass the higher costs to their own retail customers through a temporary rate
surcharge. As higher water costs filter through the four-county Bay Area region, less discretionary
income would be available for water customers to spend on goods and services, resulting in a
reduction of economic output (sales) and employment throughout the region.
The IMPLAN input-output economic model was used to analyze the effects on the regional economy.
IMPLAN is widely used for assessing regional economic effects of regulatory and policy actions,
despite some limitations in evaluating cost-related impacts. The model was used to estimate the
indirect and induced economic activity associated with direct changes in water costs for customers
within SFPUC's retail and wholesale service areas. Using 2010 IMPLAN county-level data files,
individual IMPLAN models were constructed for Alameda, San Francisco, San Mateo, and Santa Clara
Counties.

State Water Resources Control Board California Environmental Protection Agency
Economic Analyses
Evaluation of San Joaquin River Flow and Southern Delta Water Quality Objectives and Implementation
20-41 September 2016
ICF 00427.11
The regional economic effects of rate surcharges would largely be determined by the reactions of
end-use customers to temporarily higher water rates, which includes actions taken by residential
customers, commercial and industrial customers, government water users, and dedicated irrigation
water users. Predicting how the various classes of water customers would react to temporarily
higher water rates is complex. Faced with higher water costs during drought years, residential
customers could decrease their water use or they could decrease their spending on other goods and
services to compensate for higher water utility bills. If rate increases are relatively small, however,
households may not change their spending habits at all by reducing savings and/or investments, by
charging purchases using credit cards, or by borrowing money. Commercial and industrial water
customers could account for the additional cost of water by reducing profits, purchasing less water
and/or decreasing production levels, raising product/service prices, or changing their mix of
production inputs to reduce non-water-related costs. For institutional water users responding to
temporarily higher water costs, government agencies could lay off staff or reduce spending on other
operational inputs. However, the need for agencies to maintain staffing and service levels set
through agency budgeting suggests that temporary economic effects of higher water costs would be
limited. For the SFPUC retail service area, dedicated city irrigation demands are met using
groundwater supplies, which have been excluded from this assessment.
Several assumptions are made to simplify the modeling approach for assessing the regional
economic effects of the LSJR alternatives. These assumptions are presented in Appendix L, City and
County of San Francisco Analyses.
Results for Potential Effects on the Regional Economy
Under Scenario 1 (storage credits would be reallocated only if CCSF has a positive credit balance in
the water bank account), decreased spending on goods and services resulting from increased water
costs for residential, commercial, industrial, and institutional water users could cause industrial
output to decline throughout the Bay Area region during drought periods. The reduction in
economic output is estimated to range from $16.2 million under LSJR Alternative 2 to $35.3 million
under LSJR Alternative 4 (Table 20.3.3-10). While large, these reductions during severe drought
periods (e.g., 1987–1992) would be relatively small in the context of the regional economy, ranging
from 0.03 to 0.05 percent of total output.

State Water Resources Control Board California Environmental Protection Agency
Economic Analyses
Evaluation of San Joaquin River Flow and Southern Delta Water Quality Objectives and Implementation
20-42 September 2016
ICF 00427.11
Table 20.3.3-10. Estimated Average Annual Water Supply Effects (Direct, Indirect, and Induced) during Severe Drought Years on Economic Output in the Bay Area Region Associated with LSJR Alternatives 2, 3, and 4: Scenario 1a
Economic Effects (2010 Dollars)
2010
Baseline
Change from Baseline by LSJR Alternative
LSJR Alternative 2 LSJR Alternative 3 LSJR Alternative 4
Alameda County
Total County Output ($ Millions) 143,450.6 -2.8 -5.5 -6.2
% of Output 100 -0.02 -0.04 -0.04
San Francisco County
Total County Output ($ Millions) 124,678.1 -5.6 -10.9 -12.2
% of Output 100 -0.04 -0.09 -0.10
San Mateo County
Total County Output ($ Millions) 99,088.3 -4.4 -8.5 -9.5
% of Output 100 -0.04 -0.09 -0.10
Santa Clara County
Total County Output ($ Millions) 278,082.8 -3.4 -6.6 -7.4
% of Output 100 -0.01 -0.02 -0.03
Bay Area Region
Total Region Output ($ Millions) 645,299.8 -16.2 -31.4 -35.3
% of Output 100 -0.03 -0.05 -0.05
Sources: 2010 IMPLAN county data files and IMPLAN model runs for LSJR alternatives; Appendix L, City and County of
San Francisco Analyses, Table L.6-2.
a Scenario 1 is defined in Appendix L as: storage credits would be reallocated only if CCSF has a positive credit
balance in the water bank account.
The total regional effects of the LSJR alternatives on employment under Scenario 1 are similar, in
relative terms, to the effects on economic output. During drought periods, the average annual
number of jobs within the region are predicted to decrease by 117 (0.01 percent) under LSJR
Alternative 2, 226 (0.01 percent) under LSJR Alternative 3, 254 (0.01 percent) under LSJR
Alternative 4 (Table 20.3.3-11). Job losses under LSJR Alternative 4 are predicted to be largest in San
Francisco County (84 jobs) and San Mateo County (71 jobs).

State Water Resources Control Board California Environmental Protection Agency
Economic Analyses
Evaluation of San Joaquin River Flow and Southern Delta Water Quality Objectives and Implementation
20-43 September 2016
ICF 00427.11
Table 20.3.3-11. Estimated Average Annual Water Supply Effects (Direct, Indirect, and Induced) during Severe Drought Years on Jobs in the Bay Area Region Associated with LSJR Alternatives 2, 3, and 4: Scenario 1a
Economic Effects 2010
Baseline
Change from Baseline by LSJR Alternative
LSJR Alternative 2 LSJR Alternative 3 LSJR Alternative 4
Alameda County
Total County Jobs 872,636 -21 -41 -46
% of Jobs 100 <-0.01 <-0.01 -0.01
San Francisco County
Total County Jobs 734,063 -39 -75 -84
% of Jobs 100 -0.01 -0.01 -0.01
San Mateo County
Total County Jobs 464,194 -33 -64 -71
% of Jobs 100 -0.01 -0.01 -0.02
Santa Clara County
Total County Jobs 1,112,308 -24 -47 -53
% of Jobs 100 <-0.01 <-0.01 <-0.01
Bay Area Region
Total Region Jobs 3,183,201 -117 -226 -254
% of Jobs 100 <-0.01 <-0.01 <-0.01
Sources: 2010 IMPLAN county data file, and IMPLAN model runs for LSJR alternatives; Appendix L, City and County of
San Francisco Analyses, Table L.6-3.
a Scenario 1 is defined in Appendix L as: storage credits would be reallocated only if CCSF has a positive credit
balance in the water bank account.
Under Scenario 2 (storage credits would be reallocated even if CCSF has a negative balance in the
water bank account) output and job losses during drought periods are predicted to be substantially
higher than under Scenario 1 because replacement water needs and related costs to customers
would be much larger. Annual output reductions in the Bay Area region are estimated to range from
$40.5 million to $243.6 million under LSJR Alternatives 2, 3, and 4 (Table 20.3.3-12). In the context
of the overall Bay Area region economy, these reductions would represent 0.06 and 0.38 percent of
total output, respectively. Similarly, job losses would be relatively small, ranging from 292 to 1,756
jobs across LSJR Alternatives 2, 3, and 4, which represent 0.01 and 0.06 percent of all regional jobs,
respectively (Table 20.3.3-13).

State Water Resources Control Board California Environmental Protection Agency
Economic Analyses
Evaluation of San Joaquin River Flow and Southern Delta Water Quality Objectives and Implementation
20-44 September 2016
ICF 00427.11
Table 20.3.3-12. Estimated Average Annual Water Supply Effects (Direct, Indirect, and Induced) during Severe Drought Years on Economic Output in the Bay Area Region Associated with the LSJR Alternatives 2, 3, and 4: Scenario 2a
Economic Effects (2010 Dollars)
2010 Baseline
Change from Baseline by LSJR Alternative
LSJR Alternative 2
LSJR Alternative 3
LSJR Alternative 4
Alameda County
Total County Output ($ Millions) 143,450.6 -7.1 -24.5 -43.0
% of Output 100 -0.05 -0.17 -0.30
San Francisco County
Total County Output ($ Millions) 124,678.1 -14.0 -48.2 -84.2
% of Output 100 -0.11 -0.39 -0.68
San Mateo County
Total County Output ($ Millions) 99,088.3 -10.9 -37.6 -65.5
% of Output 100 -0.11 -0.38 -0.66
Santa Clara County
Total County Output ($ Millions) 278,082.8 -8.5 -29.2 -51.0
% of Output 100 -0.03 -0.11 -0.18
Bay Area Region
Total Region Output ($ Millions) 645,299.8 -40.5 -139.5 -243.6
% of Output 100 -0.06 -0.22 -0.38
Sources: 2010 IMPLAN county data files and IMPLAN model runs for LSJR alternatives; Appendix L, City and County of
San Francisco Analyses, Table L.6-4.
a Scenario 2 is defined in Appendix L as: storage credits would be reallocated even if CCSF has a negative balance in
the water bank account.

State Water Resources Control Board California Environmental Protection Agency
Economic Analyses
Evaluation of San Joaquin River Flow and Southern Delta Water Quality Objectives and Implementation
20-45 September 2016
ICF 00427.11
Table 20.3.3-13. Estimated Average Annual Water Supply Effects (Direct, Indirect, and Induced) during Severe Drought Years on Jobs in the Bay Area Region Associated with LSJR Alternatives 2, 3, and 4: Scenario 2a
Economic Effects 2010
Baseline
Change from Baseline by LSJR Alternative
LSJR Alternative 2
LSJR Alternative 3
LSJR Alternative 4
Alameda County
Total County Jobs 872,636 -53 -181 -318
% of Jobs 100 -0.01 -0.02 -0.04
San Francisco County
Total County Jobs 734,063 -97 -334 -583
% of Jobs 100 -0.01 -0.05 -0.08
San Mateo County
Total County Jobs 464,194 -82 -282 -491
% of Jobs 100 -0.02 -0.06 -0.11
Santa Clara County
Total County Jobs 1,112,308 -61 -209 -364
% of Jobs 100 -0.01 -0.02 -0.03
Bay Area Region
Total Region Jobs 3,183,201 -292 -1,005 -1,756
% of Jobs 100 -0.01 -0.03 -0.06
Sources: 2010 IMPLAN county data files and IMPLAN model runs for LSJR alternatives; Appendix L, City and County of
San Francisco Analyses, Table L.6-5.
a Scenario 2 is defined in Appendix L as: storage credits would be reallocated even if CCSF has a negative balance in
the water bank account.
Assessment Methods for Potential Ratepayer Effects
Effects of SFPUC water purchases on water rates are evaluated based on the relative increase in
overall SFPUC budget costs attributable to replacement water purchases under each alternative.
Existing water rates that are annually established for both the retail and wholesale service areas
reflect operating costs, debt service costs, capital costs, programmatic project costs, and reserve
considerations. This ratepayer assessment uses the total SFPUC Water Enterprise and Hetch Hetchy
Water budgets for fiscal year 2013–2014 as baselines for the assessment. The adopted fiscal year
2013–2014 budgets totaled $483.2 million, as shown in Appendix L, City and County of San Francisco
Analyses, (Table L.3-3). These budgets account for the cost of producing, conveying, filtering,
treating, and distributing water within the SFPUC service areas, as well as to defray the costs of past,
current, and future projects. Existing water rates for SFPUC's retail and wholesale customers, which
are largely driven by these budget costs, also are shown in Appendix L (Table L.3-4). For purposes of
evaluating ratepayer effects, budgetary cost increases for SFPUC to replace water during drought
conditions are assumed to result in proportional rate increases in SFPUC's retail and wholesale
water rates, relative to the existing rates.

State Water Resources Control Board California Environmental Protection Agency
Economic Analyses
Evaluation of San Joaquin River Flow and Southern Delta Water Quality Objectives and Implementation
20-46 September 2016
ICF 00427.11
Results for Potential Ratepayer Effects
The budget effects of purchasing replacement water during severe drought periods (e.g. 1987–
1992) under the LSJR alternatives are shown in Tables 20.3.3-14a and 20.3.3-14b and 20.3.3-15a
and 20.3.3-15b. Compared to adopted fiscal year 2013–2014 SFPUC budget costs of $483.12million,
water replacement costs in severe drought years under Scenario 1 would represent an increase in
overall costs ranging from about 3 to 6 percent (Table 20.3.3-14a). These additional drought-period
costs would presumably result in rate surcharges within the retail and wholesale service areas of
about the same percentages, relative to existing water rates. For example, the drought-period rate
surcharge in the SFPUC retail service area could cause existing rates for a single-family residential
customer to rise by about 3 percent under LSJR Alternative 2, and by about 6 percent under LSJR
Alternatives 3 and 4. Existing rates charged by SFPUC to its wholesale customers could increase by
similar percentages.
Table 20.3.3-14a. Estimated SFPUC Budget Effects of Purchasing Replacement Water Supplies during Severe Drought Periods Associated with LSJR Alternatives 2, 3, and 4: Scenario 1a
Baselineb LSJR Alternative 2 LSJR Alternative 3 LSJR Alternative 4
Average Annual Water Replacement Costs ($ Millions)
-- 14 27 30
Water Budget with Replacement Costs ($ Millions)
483.2 497.2 510.2 513.2
Percentage Change in Water Budget Expenditures
-- 2.9% 5.6% 6.2%
Source: Appendix L, City and County of San Francisco Analyses, Table L.6-6.
a Scenario 1 is defined in Appendix L as: storage credits would be reallocated only if CCSF has a positive credit
balance in the water bank account.
b Represents combined Adopted Water Enterprise and Hetch Hetchy Water budgets for fiscal year 2013–2014.
Using a longer-term period of record (1983 to 2003), the annual average water replacement costs
(as derived in Table 20.3.3-9b) are much less than the costs within the severe drought period (1987
to 1992) described above. Under Scenario 1, estimated longer-term increases in budget
expenditures range from 0.8 to 1.9 percent (Table 20.3.3-14b).

State Water Resources Control Board California Environmental Protection Agency
Economic Analyses
Evaluation of San Joaquin River Flow and Southern Delta Water Quality Objectives and Implementation
20-47 September 2016
ICF 00427.11
Table 20.3.3-14b. Estimated Longer-Term SFPUC Budget Effects of Purchasing Replacement Water Supplies during Severe Drought Periods Associated with LSJR Alternatives 2, 3, and 4: Scenario 1a
Baselineb LSJR Alternative 2 LSJR Alternative 3 LSJR Alternative 4
Average Annual Water Replacement Costs ($ Millions)
-- 4 8 9
Water Budget with Replacement Costs ($ Millions)
483.2 487.2 491.2 492.2
Percentage Change in Water Budget Expenditures
-- 0.8% 1.7% 1.9%
Source: Appendix L, City and County of San Francisco Analyses, Table L.6-8.
a Scenario 1 is defined in Appendix L as: storage credits would be reallocated only if CCSF has a positive credit
balance in the water bank account.
b Represents combined Adopted Water Enterprise and Hetch Hetchy Water budgets for fiscal year 2013–2014.
For Scenario 2, the additional expenditures to purchase and transfer water during severe drought
periods (e.g. 1987–1992) under the LSJR alternatives would be much higher than in Scenario 1, with
cost increases ranging from about 7 to 43 percent of the baseline water budget (Table 20.3.3-15a).
As a result, water rate increases during drought periods would be substantially higher than under
Scenario 1. Drought-period rate surcharges in the SFPUC retail service area could raise existing rates
for a single-family residential customers by about 7 percent under LSJR Alternative 2, by about 25
percent under LSJR Alternative 3, and by about 43 percent under LSJR Alternative 4. Existing rates
charged by SFPUC to its wholesale customers could increase by similar percentages. Under Scenario
2, estimated longer-term increases in budget expenditures range from 2.1 to 14.7 percent (Table
20.3.3-15b).
Table 20.3.3-15a. Estimated SFPUC Budget Effects of Purchasing Replacement Water Supplies during Severe Drought Periods Associated with LSJR Alternatives 2, 3, and 4: Scenario 2a
Baselineb LSJR Alternative 2 LSJR Alternative 3 LSJR Alternative 4
Average Annual Water Replacement Costs ($ Millions)
-- 35 119 208
Water Budget with Replacement Costs ($ Millions)
483.2 518.2 602.2 691.2
Percentage Change in Water Budget Expenditures
-- 7.2% 24.6% 43.1%
Source: Appendix L, City and County of San Francisco Analyses, Table L.6-7.
a Scenario 2 is defined in Appendix L as: storage credits would be reallocated even if CCSF has a negative balance in
the water bank account.
b Represents combined Adopted Water Enterprise and Hetch Hetchy Water budgets for fiscal year 2013–2014.
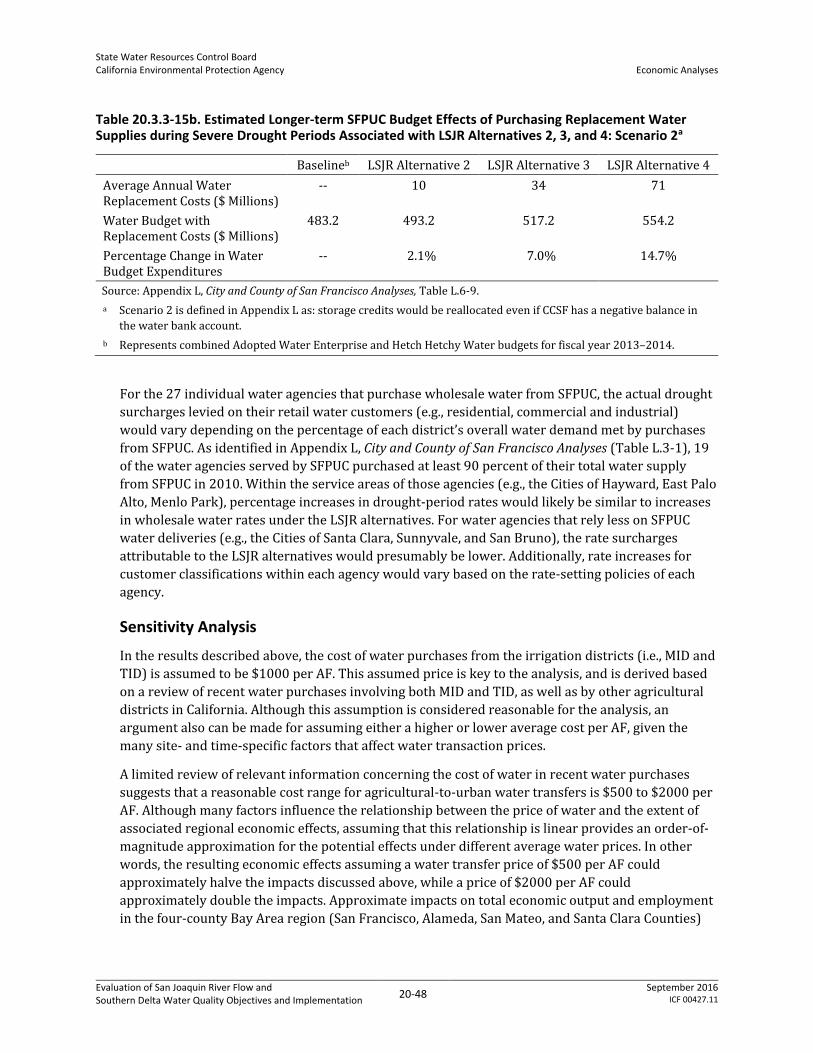
State Water Resources Control Board California Environmental Protection Agency
Economic Analyses
Evaluation of San Joaquin River Flow and Southern Delta Water Quality Objectives and Implementation
20-48 September 2016
ICF 00427.11
Table 20.3.3-15b. Estimated Longer-term SFPUC Budget Effects of Purchasing Replacement Water Supplies during Severe Drought Periods Associated with LSJR Alternatives 2, 3, and 4: Scenario 2a
Baselineb LSJR Alternative 2 LSJR Alternative 3 LSJR Alternative 4
Average Annual Water Replacement Costs ($ Millions)
-- 10 34 71
Water Budget with Replacement Costs ($ Millions)
483.2 493.2 517.2 554.2
Percentage Change in Water Budget Expenditures
-- 2.1% 7.0% 14.7%
Source: Appendix L, City and County of San Francisco Analyses, Table L.6-9.
a Scenario 2 is defined in Appendix L as: storage credits would be reallocated even if CCSF has a negative balance in
the water bank account.
b Represents combined Adopted Water Enterprise and Hetch Hetchy Water budgets for fiscal year 2013–2014.
For the 27 individual water agencies that purchase wholesale water from SFPUC, the actual drought
surcharges levied on their retail water customers (e.g., residential, commercial and industrial)
would vary depending on the percentage of each district’s overall water demand met by purchases
from SFPUC. As identified in Appendix L, City and County of San Francisco Analyses (Table L.3-1), 19
of the water agencies served by SFPUC purchased at least 90 percent of their total water supply
from SFPUC in 2010. Within the service areas of those agencies (e.g., the Cities of Hayward, East Palo
Alto, Menlo Park), percentage increases in drought-period rates would likely be similar to increases
in wholesale water rates under the LSJR alternatives. For water agencies that rely less on SFPUC
water deliveries (e.g., the Cities of Santa Clara, Sunnyvale, and San Bruno), the rate surcharges
attributable to the LSJR alternatives would presumably be lower. Additionally, rate increases for
customer classifications within each agency would vary based on the rate-setting policies of each
agency.
Sensitivity Analysis
In the results described above, the cost of water purchases from the irrigation districts (i.e., MID and
TID) is assumed to be $1000 per AF. This assumed price is key to the analysis, and is derived based
on a review of recent water purchases involving both MID and TID, as well as by other agricultural
districts in California. Although this assumption is considered reasonable for the analysis, an
argument also can be made for assuming either a higher or lower average cost per AF, given the
many site- and time-specific factors that affect water transaction prices.
A limited review of relevant information concerning the cost of water in recent water purchases
suggests that a reasonable cost range for agricultural-to-urban water transfers is $500 to $2000 per
AF. Although many factors influence the relationship between the price of water and the extent of
associated regional economic effects, assuming that this relationship is linear provides an order-of-
magnitude approximation for the potential effects under different average water prices. In other
words, the resulting economic effects assuming a water transfer price of $500 per AF could
approximately halve the impacts discussed above, while a price of $2000 per AF could
approximately double the impacts. Approximate impacts on total economic output and employment
in the four-county Bay Area region (San Francisco, Alameda, San Mateo, and Santa Clara Counties)

State Water Resources Control Board California Environmental Protection Agency
Economic Analyses
Evaluation of San Joaquin River Flow and Southern Delta Water Quality Objectives and Implementation
20-49 September 2016
ICF 00427.11
using water transfer prices of $500, $1000, and $2000 per AF are shown in Tables 20.3.3-16 and
20.3.3-17 under Scenarios 1 and 2 for the LSJR alternatives.
Table 20.3.3-16. Estimated Average Annual Water Supply Effects on Economic Output in the Four-County Bay Area Region during Severe Drought Years under LSJR Alternatives 2, 3, and 4 for Different Water Transfer Prices
Scenario Water Transfer Price ($/AF)
Total Region Output ($ Millions)c
2010 Baseline
Change from Baseline under LSJR Alternative
LSJR Alternative 2
LSJR Alternative 3
LSJR Alternative 4
Scenario 1a
500 645,300 -8.1 -15.7 -17.7
1000 645,300 -16.2 -31.4 -35.3
2000 645,300 -32.4 -62.8 -70.6
Scenario 2b
500 645,300 -20.3 -69.8 -121.8
1000 645,300 -40.5 -139.5 -243.6
2000 645,300 -81 -279 -487.2
Source: 2010 IMPLAN county data files and IMPLAN model runs for LSJR alternatives; Appendix L, City and County of
San Francisco Analyses, Table L.6-2 and L.6-4.
$/AF = dollars per acre-foot.
a Scenario 1 is defined in Appendix L as: storage credits would be reallocated only if CCSF has a positive credit
balance in the water bank account.
b Scenario 2 is defined in Appendix L as: storage credits would be reallocated even if CCSF has a negative balance in
the water bank account.
c Region consists of the four Bay Area counties: San Francisco, Alameda, San Mateo, and Santa Clara.

State Water Resources Control Board California Environmental Protection Agency
Economic Analyses
Evaluation of San Joaquin River Flow and Southern Delta Water Quality Objectives and Implementation
20-50 September 2016
ICF 00427.11
Table 20.3.3-17. Estimated Average Annual Water Supply Effects on Employment in the Four-County Bay Area Region during Severe Drought Years under LSJR Alternatives 2, 3, and 4 for Different Water Transfer Prices
Scenario Water Transfer Price ($/AF)
Total Region Employment (# of Jobs)c
2010 Baseline
Change from Baseline under LSJR Alternative
LSJR Alternative 2
LSJR Alternative 3
LSJR Alternative 4
Scenario 1a
500 3,183,201 -58.5 -113 -127
1000 3,183,201 -117 -226 -254
2000 3,183,201 -234 -452 -508
Scenario 2b
500 3,183,201 -146 -502.5 -878
1000 3,183,201 -292 -1005 -1756
2000 3,183,201 -584 -2010 -3512
Source: 2010 IMPLAN county data files (baseline conditions) and IMPLAN model runs for LSJR alternatives; Appendix
L, City and County of San Francisco Analyses, Table L.6-3 and L.6-5.
$/AF = dollars per acre-foot.
a Scenario 1 is defined in Appendix L as: storage credits would be reallocated only if CCSF has a positive credit
balance in the water bank account.
b Scenario 2 is defined in Appendix L as: storage credits would be reallocated even if CCSF has a negative balance in
the water bank account.
c Region consists of the four Bay Area counties: San Francisco, Alameda, San Mateo, and Santa Clara
Adaptive Implementation
Adaptive implementation would take place based on required evaluation of current scientific
information and would need to be approved as described in Appendix K, Revised Water Quality
Control Plan. Accordingly, the frequency and duration for any use of adaptive implementation
methods 1, 2, 3, and 4 cannot be determined at this time. Adaptive implementation method 1
potentially has the greatest likelihood to change economic effects as it would allow the unimpaired
flow requirement to be increased or decreased by up to 10 percent from the objective unimpaired
flow (with a minimum requirement of 20 percent and a maximum of 60 percent unimpaired flow).
For LSJR Alternative 2 an increase from 20 percent to 30 percent of the unimpaired flow would
likely result in different effects as compared to those shown above for LSJR Alternative 2, depending
upon flow conditions and frequency of the adjustment. As such, under LSJR Alternatives 2 or 3, if the
percentage of unimpaired flow is increased with adaptive implementation method 1, water supply
costs to water districts served by the SFPUC also would likely increase as these districts develop
more costly water supply options than those developed without adaptive implementation. On the
other hand, under LSJR Alternatives 3 and 4, if the percent of unimpaired flow is reduced with
adaptive implementation method 1, water supply costs to SFPUC and affected water districts would
be somewhat less than expected without adaptive implementation. Overall, the costs to the SFPUC
associated with replacing reduced water supplies from the Tuolumne River Watershed would be
expected to increase as the deliveries are reduced.

State Water Resources Control Board California Environmental Protection Agency
Economic Analyses
Evaluation of San Joaquin River Flow and Southern Delta Water Quality Objectives and Implementation
20-51 September 2016
ICF 00427.11
20.3.4 Effects on Hydropower Generation, Revenues and the Regional Economy
Introduction
The analysis in this section, as explained in Appendix J, Hydropower and Electric Grid Analysis of
Lower San Joaquin River Flow Alternatives, discusses the potential effects of LSJR Alternatives 2, 3,
and 4 for hydropower generation on the three eastside tributaries and the corresponding effects on
revenue generation. Implementation of the LSJR alternatives could change reservoir operations,
which, in turn, could alter the associated timing of water releases and amount of hydropower
generated from hydroelectric facilities on the eastside tributaries. The study area for analyzing
hydropower generation includes the three rim dams7 on the eastside tributaries: New Melones on
the Stanislaus River, New Don Pedro on the Tuolumne River, and New Exchequer on the Merced
River. The study area also includes areas where connecting transmission systems are located and
areas where the balancing authorities for the three hydropower plants—New Melones, New Don
Pedro, and New Exchequer—are located, as described in Appendix J, Section J.1 and J.3.
The remaining discussion is organized around a description of baseline conditions and potential
effects of each LSJR alternative. The analysis focuses on three related topics: the amount of
hydropower generated, generation-related revenues, and effects on regional economic conditions,
including ratepayers. Information on hydropower generation and related revenues is presented by
tributary area and by hydropower facility. The methods used to assess these related topics are
described first.
Assessment Methods
Results from the WSE model provides estimates of the effects of LSJR Alternatives 2, 3, and 4 on
reservoir releases and storage (elevations head) and on allowable diversions to off-stream
generation facilities; these results are used in this analysis to estimate changes in the generation of
monthly and annual amounts of hydropower associated with LSJR Alternatives 2, 3, and 4. It should
be noted that changes in hydropower generation at each rim dam differ from changes in total
hydropower generation by tributary because other hydroelectric facilities on the tributaries may
also contribute to the amount of hydropower generated.
In addition to changes in hydropower generation under LSJR Alternatives 2, 3, and 4, revenues
associated with these changes in hydropower generation also are estimated. To derive the effects of
LSJR Alternatives 2, 3, and 4 on hydropower revenue, the estimated change in monthly power
generated over the 82-year simulation period is multiplied by an assumed monthly price of
hydropower.
The monthly price of power used in the assessment is the value at the 80th percentile of average
hourly power prices (i.e., the value at which 80 percent of the hourly prices were lower); monthly
values available from the California Independent System Operators (ISO) during the 2006 calendar
year were used in the assessment. Prices for 2006 were used because, as shown in Figure 20.3.4-1
below, these prices most closely match the median price during years in which price data are
7 In this document, the term rim dams is used when referencing the three major dams and reservoirs on each of the eastside tributaries: New Melones Dam and Reservoir on the Stanislaus River; New Don Pedro Dam and Reservoir on the Tuolumne River; and New Exchequer Dam and Lake McClure on the Merced River.

State Water Resources Control Board California Environmental Protection Agency
Economic Analyses
Evaluation of San Joaquin River Flow and Southern Delta Water Quality Objectives and Implementation
20-52 September 2016
ICF 00427.11
available (1998 to 2008.) The 2006 monthly prices (Table 20.3.4-1) were adjusted to 2008 dollars
using Engineering News-Record (ENR) Building Cost Indices.8 Note that the use of monthly power
prices at the 80th percentile of hourly prices is considered a conservative approach to estimating
hydropower revenue impacts because historical power prices have been generally lower than this
80th percentile value. As a result, the estimated revenue impacts of LSJR Alternatives 2, 3, and 4
likely overstate, to some limited extent, the actual effects on hydropower generation revenue.
0.00
10.00
20.00
30.00
40.00
50.00
60.00
70.00
80.00
90.00
100.00
1 2 3 4 5 6 7 8 9 10 11 12
Ho
url
y A
vera
ge P
rice
of
Po
we
r ($
pe
r M
W-h
r)
Calendar Month
Hourly Average Price of Power by Month and Calendar Year
Median
1998
1999
2000
2001
2002
2003
2004
2005
2007
2008
2009
2006
Figure 20.3.4-1. Monthly Average Price and Median Monthly Average Price of Power 1998–2008
8 The ENR Building Cost Index, which has been issued since 1915, is widely used throughout the U.S. construction industry as a benchmark for measuring inflation.

State Water Resources Control Board California Environmental Protection Agency
Economic Analyses
Evaluation of San Joaquin River Flow and Southern Delta Water Quality Objectives and Implementation
20-53 September 2016
ICF 00427.11
Table 20.3.4-1. Selected 80th Percentile of Hourly Prices from 2006 and Factors used to Escalate to 2008 Dollars
Calendar Month
2006 ISO Power Price
Building Cost Index
Adjustment Factor
ISO Power Price
Adjusted by Building Cost Index Factor
$/MWh ($2006) $/MWh ($2008)
1 56.46 1.0900 61.54
2 47.86 1.0886 52.11
3 43.81 1.0927 47.87
4 47.48 1.0934 51.92
5 51.83 1.0938 56.69
6 54.31 1.0949 59.46
7 61.49 1.0912 67.10
8 61.22 1.0896 66.70
9 51.25 1.0891 55.82
10 58.63 1.0456 61.30
11 63.76 1.0404 66.34
12 64.31 1.0435 67.11
Note: The 2006 ISO power price is the 80th percentile of hourly prices within each month during the 2006 calendar
year. The 2006 prices were adjusted to 2008 dollars using the Engineering News-Record Building Cost Index.
ISO = Independent System Operators
$/MWh ($2006) = dollars per megawatt hour in 2006 dollars$/MWh ($2008) = dollars per megawatt hour in 2008
dollars
Hydropower Generation
Table 20.3.4-2 shows the average annual hydropower generation on the three eastside tributaries
under baseline conditions and the relative change associated with each of the LSJR alternatives.
Under baseline conditions, hydropower generation plants on the tributaries are estimated to
produce 1,650 gigawatt hours (GWh) of energy per year, with 35 percent from facilities on the
Stanislaus River, 40 percent from facilities on the Tuolumne River, and 25 percent from facilities on
the Merced River. Under LSJR Alternative 2, energy production increases relative to baseline for all
three tributaries, but as the unimpaired flow requirements increase under LSJR Alternatives 3 and 4,
the amount of power generated annually is reduced. Relative to baseline, total annual hydropower
generation on the tributaries increases by 29 GWh under LSJR Alternative 2, decreases by 4 GWh
under LSJR Alternative 3, and decreases by 87 GWh under LSJR Alternative 4.
The analysis presented in Appendix J, Hydropower and Electric Grid Analysis of Lower San Joaquin
River Flow Alternatives, and summarized here, also estimates the amount of hydropower that would
be generated at the major rim dam facilities on each of the three eastside tributaries. Table 20.3.4-3
shows the average annual hydropower generation at each of the three rim dam facilities under
baseline conditions and the relative change associated with each of the LSJR alternatives. Under
baseline conditions, hydropower facilities at the three rim dams are estimated to produce 1,318
GWH per year. New Don Pedro on the Tuolumne River generates the most energy at about 604 GWh
annually (46 percent of the total), while New Melones and New Exchequer generate 419 GWh (32

State Water Resources Control Board California Environmental Protection Agency
Economic Analyses
Evaluation of San Joaquin River Flow and Southern Delta Water Quality Objectives and Implementation
20-54 September 2016
ICF 00427.11
percent of the total) and 295 GWh (22 percent of the total), respectively. Overall energy production
at the three rim dams increases relative to baseline under LSJR Alternatives 2 and 3, but the increase
diminishes as the unimpaired flow requirement gets larger under LSJR Alternative 3. Under LSJR
Alternative 4, hydropower facilities at the three rim dams generate less total power than under
baseline conditions, but facilities at New Melones generate slightly more. Relative to baseline, total
annual hydropower generation at the rim dams increases by 38 GWh under LSJR Alternative 2 and
by 18 GWh under LSJR Alternative 3, but decreases by 33 GWh under LSJR Alternative 4.
Table 20.3.4-2. Average Annual Baseline Hydropower Generation and Difference from Baseline, by Tributary
Alternative
Stanislaus
(GWh)
Tuolumne
(GWh)
Merced
(GWh)
All Tributaries
(GWh)
Baseline 586 656 408 1,650
LSJR Alternative 2 18 2 8 29
LSJR Alternative 3 4 -6 -3 -4
LSJR Alternative 4 -23 -41 -23 -87
Note: Numbers are rounded.
GWh = gigawatt hours
Table 20.3.4-3. Average Annual Baseline Hydropower Generation in New Melones, New Don Pedro, and New Exchequer Hydropower Facilities and Difference from Baseline, by Facility
Alternative
New Melones
(GWh)
New Don Pedro
(GWh)
New Exchequer
(GWh)
Three Facilities
(GWh)
Baseline 419 604 295 1,318
LSJR Alternative 2 +22 +2 +13 +38
LSJR Alternative 3 +14 -4 +8 +18
LSJR Alternative 4 +2 -33 -2 -33
Note: Numbers are rounded.
GWh = gigawatt hours
Hydropower Generation-Related Revenue
Table 20.3.4-4 shows the average annual hydropower revenue on each of the three tributaries under
baseline conditions and the relative change associated with each of the LSJR alternatives. Under
baseline conditions, total revenue from energy production on the three tributaries is estimated to be
$97.5 million per year, with 36 percent from facilities on the Stanislaus River, 39 percent from
facilities on the Tuolumne River, and 25 percent from facilities on the Merced River. Under the LSJR
Alternatives 2, 3, and 4, the change in revenue from hydropower generation on each of the
tributaries is proportional to the change in hydropower generation. Relative to baseline, total annual
hydropower revenue over all there tributaries increases by $1.7 million under LSJR Alternative 2,
decreases by $0.67 million under LSJR Alternative 3, and decreases by $6.5 million under LSJR
Alternative 4. Under LSJR Alternative 2, facilities on the Tuolumne River have the smallest revenue
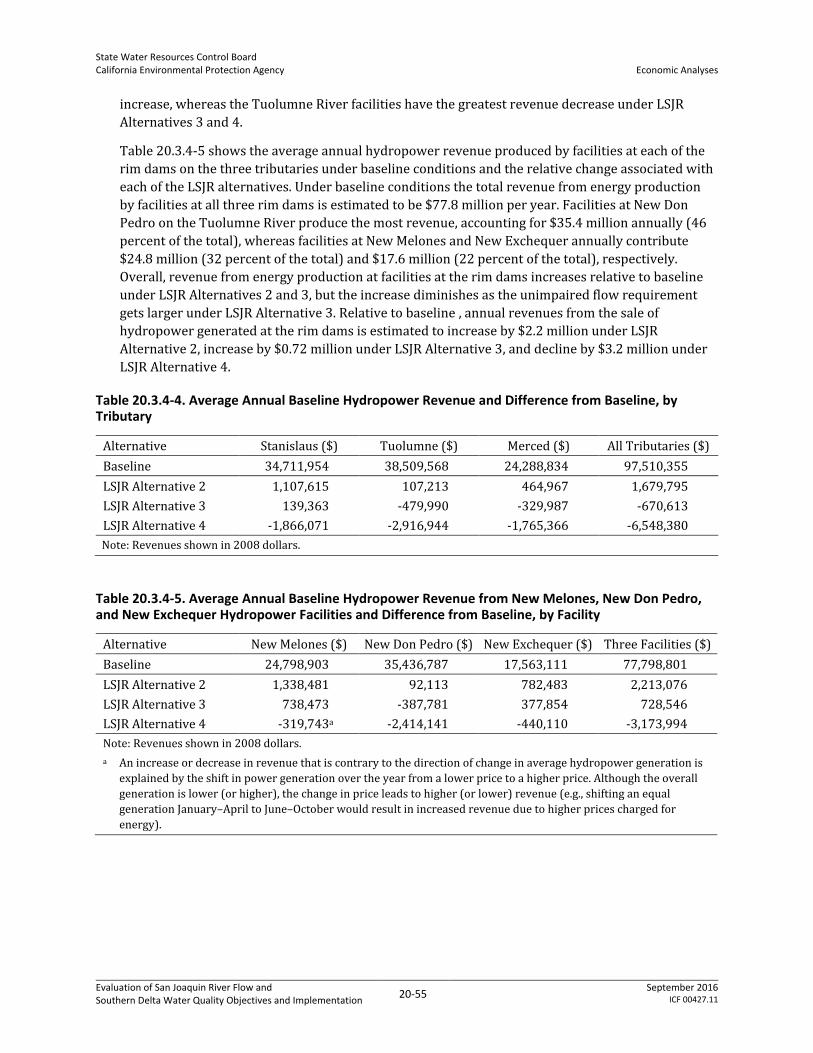
State Water Resources Control Board California Environmental Protection Agency
Economic Analyses
Evaluation of San Joaquin River Flow and Southern Delta Water Quality Objectives and Implementation
20-55 September 2016
ICF 00427.11
increase, whereas the Tuolumne River facilities have the greatest revenue decrease under LSJR
Alternatives 3 and 4.
Table 20.3.4-5 shows the average annual hydropower revenue produced by facilities at each of the
rim dams on the three tributaries under baseline conditions and the relative change associated with
each of the LSJR alternatives. Under baseline conditions the total revenue from energy production
by facilities at all three rim dams is estimated to be $77.8 million per year. Facilities at New Don
Pedro on the Tuolumne River produce the most revenue, accounting for $35.4 million annually (46
percent of the total), whereas facilities at New Melones and New Exchequer annually contribute
$24.8 million (32 percent of the total) and $17.6 million (22 percent of the total), respectively.
Overall, revenue from energy production at facilities at the rim dams increases relative to baseline
under LSJR Alternatives 2 and 3, but the increase diminishes as the unimpaired flow requirement
gets larger under LSJR Alternative 3. Relative to baseline , annual revenues from the sale of
hydropower generated at the rim dams is estimated to increase by $2.2 million under LSJR
Alternative 2, increase by $0.72 million under LSJR Alternative 3, and decline by $3.2 million under
LSJR Alternative 4.
Table 20.3.4-4. Average Annual Baseline Hydropower Revenue and Difference from Baseline, by Tributary
Alternative Stanislaus ($) Tuolumne ($) Merced ($) All Tributaries ($)
Baseline 34,711,954 38,509,568 24,288,834 97,510,355
LSJR Alternative 2 1,107,615 107,213 464,967 1,679,795
LSJR Alternative 3 139,363 -479,990 -329,987 -670,613
LSJR Alternative 4 -1,866,071 -2,916,944 -1,765,366 -6,548,380
Note: Revenues shown in 2008 dollars.
Table 20.3.4-5. Average Annual Baseline Hydropower Revenue from New Melones, New Don Pedro, and New Exchequer Hydropower Facilities and Difference from Baseline, by Facility
Alternative New Melones ($) New Don Pedro ($) New Exchequer ($) Three Facilities ($)
Baseline 24,798,903 35,436,787 17,563,111 77,798,801
LSJR Alternative 2 1,338,481 92,113 782,483 2,213,076
LSJR Alternative 3 738,473 -387,781 377,854 728,546
LSJR Alternative 4 -319,743a -2,414,141 -440,110 -3,173,994
Note: Revenues shown in 2008 dollars.
a An increase or decrease in revenue that is contrary to the direction of change in average hydropower generation is
explained by the shift in power generation over the year from a lower price to a higher price. Although the overall
generation is lower (or higher), the change in price leads to higher (or lower) revenue (e.g., shifting an equal
generation January–April to June–October would result in increased revenue due to higher prices charged for
energy).

State Water Resources Control Board California Environmental Protection Agency
Economic Analyses
Evaluation of San Joaquin River Flow and Southern Delta Water Quality Objectives and Implementation
20-56 September 2016
ICF 00427.11
Adaptive Implementation
Adaptive implementation would take place based on required evaluation of current scientific
information and would need to be approved as described in Appendix K, Revised Water Quality
Control Plan. Accordingly, the frequency and duration for any use of adaptive implementation
methods 1, 2, 3, and 4 cannot be determined at this time. Adaptive implementation method 1
potentially has the greatest likelihood of changing economic effects as it would allow the unimpaired
flow requirements to be increased or decreased by up to 10 percent from the objective unimpaired
flow (with a minimum requirement of 20 percent and a maximum of 60 percent unimpaired flow).
For LSJR Alternative 2 an increase from 20 percent to 30 percent of the unimpaired flow would
likely result in different effects as compared to those shown above for LSJR Alternative 2, depending
upon flow conditions and frequency of the adjustment. As such, under LSJR Alternatives 2 or 3, if the
percentage of unimpaired flow is increased with adaptive implementation method 1, hydropower
revenue could be slightly less than is predicted without adaptive implementation. On the other hand,
under LSJR Alternatives 3 and 4, if the percent of unimpaired flow is reduced with adaptive
implementation method 1, hydropower revenue could be slightly higher than predicted without
adaptive implementation.
In addition, adaptive implementation methods 2 and 3 could also affect hydropower generation,
given that hydropower generation is affected by the timing of reservoir releases. Method 2 involves
shifting flow between months within the February–June period to improve conditions for fish and
wildlife, whereas method 3 involves shifting flow from February–June to later in the year to prevent
negative impacts for fisheries. Under both methods for all LSJR alternatives, shifting the timing of
reservoir releases could produce small changes in revenue as a result of the fluctuating value of
power generation. Changes in reservoir storage levels as a result of adaptive implementation could
also affect hydropower generation. For example, retaining water until later in the February – June
time frame or until fall, will keep reservoir storage higher for a longer amount of time and thereby
increase hydropower generation. However, adaptive implementation is not expected to
substantially affect revenues related to hydropower generation.
Baseline Regional Economy Conditions and Potential Regional Effects Related to Hydropower
This section qualitatively evaluates potential regional economic effects associated with predicted
changes in hydropower generation and associated revenues under LSJR Alternatives 2, 3, and 4.
Predicted changes in hydroelectric power generation could potentially affect residents statewide in
terms of electricity rates; however, modeling results presented in Tables 20.3.4-2 and 20.3.4-3
above suggest that the changes in energy generation would be virtually imperceptible at the
statewide level.
Potential impacts on the regional economy caused by changes in hydropower generation can be
evaluated by describing the underlying relationship between changes in hydropower production
and regional economic conditions. From the perspective of the statewide electricity grid, power lost
as a result of implementing one of the LSJR alternatives would need to be replaced to meet statewide
electricity demand, especially during peak summer months. Presumably, purchasing replacement
power from other sources would be more costly to power utilities than purchasing power from
hydropower facilities on the three tributaries. Electricity providers could offset the cost of
purchasing replacement power by raising utility rates for residential, commercial, and industrial

State Water Resources Control Board California Environmental Protection Agency
Economic Analyses
Evaluation of San Joaquin River Flow and Southern Delta Water Quality Objectives and Implementation
20-57 September 2016
ICF 00427.11
users. For these users, increased spending on higher electricity bills could cause reduced spending
on other goods and services, in turn, causing some employment and revenue losses for certain
sectors of the state’s economy. The extent of these effects would depend on the size of the
hydropower losses relative to California’s overall supply of electricity.
Hydropower generation on the eastside tributaries under LSJR Alternatives 2, 3, and 4 is estimated
to increase by 29 GWh under LSJR Alternative 2, decrease by 4 GWh under LSJR Alternative 3, and
decrease by 87 GWh under LSJR Alternative 4 (Table 20.3.4-2). According to the California Energy
Commission (2012), California’s electricity generating system annually produces more than 296,000
GWh, accounting for 69 percent of the electricity the state uses. Compared to annual statewide
electricity production, the hydropower changes potentially caused by one of the LSJR alternatives
would range from an increase of less than 0.0001 percent under LSJR Alternative 2 to a reduction of
about 0.0003 percent under LSJR Alternative 4. Thus, the impacts of the LSJR alternatives on
hydropower related revenues are relatively small and would not likely affect ratepayers in any
substantial way. In addition, given the virtually imperceptible effects at a regional and statewide
level under each of the LSJR alternatives, adaptive implementation is not expected to have an effect
on regional hydropower generation or revenue.
20.3.5 Effects on Fisheries and Associated Regional Economies
Introduction
This section addresses potential economic effects concerning commercial and sport fisheries, with a
specific emphasis on Chinook salmon, which could be affected by implementation of the LSJR
alternatives. Because biological impacts on fishery resources, such as expected population shifts for
key fish species (e.g., Chinook salmon), are highly uncertain and difficult to quantify, the
corresponding economic effects also are difficult to evaluate. As a result, this analysis of fisheries-
related economic effects is necessarily qualitative.
The study area for this analysis includes areas where there is commercial and sport fishing activity
for species that could be affected by the LSJR alternatives. This not only includes the rim reservoirs
and three eastside tributaries, but also the greater Bay-Delta region and the more expansive Pacific
Ocean, plus coastal fishing areas along the western United States.
As discussed in Chapter 7, Aquatic Biological Resources, improving flow conditions in the SJR
Watershed to the Delta at Vernalis can be expected to benefit many native fishes. However, relevant
information on potential effects on native species is too limited to estimate exact population
responses to habitat improvements. It is likely, however, that LSJR Alternatives 2, 3, and 4 would
benefit many native plant and animal species (Merz and Moyle 2006) that exist in and adjacent to
the Stanislaus, Tuolumne, and Merced Rivers through increased availability of marine derived
nutrients and through improved habitat (e.g., riparian and floodplain) conditions. Information is too
limited, however, to predict the exact expected positive biological responses and then to assign an
appropriate economic value to those responses.
Because information on potential effects on native fish species is limited, a case study approach that
focuses on Chinook salmon, a key fish species expected to benefit substantially from LSJR
Alternatives 2, 3, and 4, is instructively used to examine potential economic effects associated with
aquatic habitat improvements. Although results from evaluating the biological impacts of LSJR
Alternatives 2, 3, and 4 on Chinook salmon populations also are limited, historical population and

State Water Resources Control Board California Environmental Protection Agency
Economic Analyses
Evaluation of San Joaquin River Flow and Southern Delta Water Quality Objectives and Implementation
20-58 September 2016
ICF 00427.11
harvest information concerning Chinook salmon are available; this information is used to provide
some insight into potential monetary values associated with improving salmon habitat in the three
eastside tributaries.
Potential benefits to native fish populations such as Chinook salmon would be expected at spatial
scales that extend beyond the plan area. For example, there is the potential to improve the
population resiliency and stability to Central Valley fish populations by improving SJR fish
populations (Carlson and Satterthwaite 2011).
This section is organized by first presenting relevant background information, including information
on game species and associated sport fishing activity, on salmon management and harvest in the
study area, and on recent salmon fishery closures in California. This discussion is followed by an
assessment of the effects of LSJR Alternatives 2, 3, and 4 on commercial and sport fisheries, focusing
on Chinook salmon. The section describes the potential economic effects on use and non-use
(passive use) values associated with improving habitat conditions and sustaining salmon
populations, and addresses potential effects on the regional economies affected by commercial and
sport fishing activity.
Background Fishery Conditions
This section describes historical and recent information on commercial and sport fisheries that
could be affected by the plan amendments. Unlike other topics covered in this chapter, the
information presented here is not referred to as a baseline, primarily because these conditions
characterize historical information, trends, and other dynamic factors that do not serve as an
specific point of reference. Overall, there is too much uncertainty concerning the many factors that
affect fishery conditions (e.g., population conditions, management actions, harvest rates) to
establish a point of reference (or baseline) for evaluating potential effects. This background section
describes game and sport fishing activities, salmon management actions, commercial harvest levels,
and recent salmon fishery closures within the study area.
Game Species and Sport Fishing Activity
Fishing is a common recreational activity on the rivers and reservoirs of the plan area. As discussed
in greater detail in Chapter 7, Aquatic Biological Resources, the mainstem LSJR and three eastside
tributaries support several warmwater game fish populations, such as smallmouth and largemouth
bass, sunfish, and catfish, as well as a variety of native fishes, such as hardhead, Sacramento
pikeminnow, Sacramento sucker, sculpin, and lamprey. The mainstem LSJR and the three eastside
tributaries also provide habitat for coldwater species, such as trout and Chinook salmon.
Historically, the Upper SJR supported abundant populations of spring- and fall-run Chinook salmon
and steelhead. Today, however, only small populations of fall-run Chinook salmon and steelhead are
found in the three eastside tributaries.
Among the many game fish in the mainstem LSJR and its tributaries (refer to Chapter 7, Aquatic
Biological Resources), the most commonly caught by sport anglers are as follows.
LSJR: largemouth bass, striped bass, catfish, and sunfish.
Stanislaus River: striped bass, largemouth bass, smallmouth bass, American shad, and rainbow
trout.
Tuolumne River: American shad, largemouth bass, smallmouth bass, striped bass, catfish, and
sunfish.

State Water Resources Control Board California Environmental Protection Agency
Economic Analyses
Evaluation of San Joaquin River Flow and Southern Delta Water Quality Objectives and Implementation
20-59 September 2016
ICF 00427.11
Merced River: largemouth bass, smallmouth bass, American shad, catfish, and sunfish.
The tributary reservoirs support a variety of fish species, including rainbow trout, brown trout,
largemouth bass, smallmouth bass, kokanee, catfish, and sunfish. Sport anglers typically fish from
the shore or boats for the following species in tributary reservoirs.
New Don Pedro Reservoir: kokanee, Chinook salmon, brown trout, brook trout, rainbow trout,
largemouth bass, smallmouth bass, spotted bass, catfish, and sunfish.
New Melones Reservoir: rainbow trout, brown trout, kokanee, largemouth bass, smallmouth
bass, catfish, and sunfish.
Lake McClure: kokanee, rainbow trout, Chinook salmon, largemouth bass, spotted bass, catfish,
and sunfish.
Historical (1990s and early 2000s) estimates of fishing activity at major recreation areas (rivers and
reservoirs) within tributary Watersheds are identified in Section 20.3.6, Effects on Recreational
Oportunities, Activity, and the Regional Economy (Table 20.3.6-1). As shown, sport fishing activity on
the tributaries are approximated to be 5,200 angler days annually along the Lower Stanislaus River
and 34,900 angler days annually along the Lower Tuolumne River; no fishing-specific estimates are
available for the Merced River. Annual sport fishing activity on the LSJR is approximated at 57,500
angler days.
Salmon Management and Harvest in the Study Area
This section describes salmon management and harvest conditions in the study area. As noted above,
the study area includes geographic areas where commercial and sport fishing activity occurs that
could be affected by salmon production in the three eastside tributaries.
Ocean Salmon Fisheries in the Pacific Region
Ocean commercial and recreational fishing for salmon originating from Central Valley rivers occurs
along the California coast, primarily from Monterey north to central Oregon. Salmon harvest levels for
ocean and river fisheries are managed by federal and state agencies. The Pacific Fisheries Management
Commission (PFMC) coordinates this process and annually assesses salmon populations to establish
sustainable salmon harvest levels for the Pacific Region (California, Oregon, and Washington). The
PFMC also sets ocean commercial and recreational fishing seasons for harvesting of salmon in federal
waters. Each year, the PFMC recommends ocean fishing regulations designed to meet constraints
established by escapement goals and jeopardy opinions for federally listed species. California fisheries
are managed, in part, to meet escapement, allocation, and rebuilding goals for Klamath River fall-run
Chinook salmon, coastal natural spawning coho salmon, and Sacramento River spring-, fall-, and
winter-run Chinook salmon (Boydstun 2001).
In the Pacific region, salmon fisheries are subject to weak stock management, where access to the
harvestable surplus of healthier stocks is often restricted to protect weaker stocks with which they
co-mingle in the ocean. This makes establishing regulations difficult. For example, in 2008 and 2009
(see Recent Salmon Fishery Closures in California section below), virtually all fishing in the ocean off
California was closed to protect Central Valley fall-run Chinook, even though Klamath fall-run
Chinook salmon returns were large enough to support limited ocean angling (Morse and Manji
2009). Salmon management is further complicated by the need to ensure equitable allocation of
harvest among diverse user groups and the need to coordinate with the entities that have
State Water Resources Control Board California Environmental Protection Agency
Economic Analyses
Evaluation of San Joaquin River Flow and Southern Delta Water Quality Objectives and Implementation
20-60 September 2016
ICF 00427.11
jurisdiction over other aspects of salmon management. The PFMC also develops a catch-sharing plan
for tribal and non-tribal fisheries conducted in federal waters (NMFS 2014).
Historically, Native American tribes along the West Coast relied on natural resources as a source of
food, nutrients, and trading commodities. Over time, the opportunity to engage in traditional use
fisheries has been dramatically limited by political forces and human population expansion. Native
American natural resource initiatives along the West Coast have resulted in an array of
contemporary outcomes, including the sometimes controversial Boldt Decision in the Pacific
Northwest (Norman et al. 2007). For California state-managed waters (i.e., those extending 3
nautical miles offshore), the California Fish and Game Commission (Commission) establishes salmon
fishing regulations to ensure that California’s non-tribal harvest allowances are not exceeded by
commercial fishers and recreational anglers.
The California Department of Fish and Wildlife (CDFW), as the state fishery management agency,
manages fishery regulations, implements management plans, provides technical expertise, and
coordinates the implementation of policy throughout California. CDFW is responsible for providing
recommendations to the Commission and for carrying out research that informs these
recommendations or other management decisions to be made by the California State Legislature. All
of these regulations affect recreational and commercial fishing opportunities and, therefore, the
economic value of these fisheries in California (Morse and Manji 2009).
Historical Harvest of Ocean Commercial and Sport Salmon in California
Ocean commercial harvest levels for Chinook salmon in California have varied considerably over the
last four decades, as shown in Table 20.3.5-1. Excluding the fishery closure years of 2008 and 2009
(see Recent Salmon Fishery Closures in California section below), statewide commercial salmon catch
between 1976 and 2013 varied from about 1,317,200 salmon in 1988 down to 15,100 salmon in
2010. During this period, catches could change substantially from year to year. The best 5-year
period occurred from 1986–1990, with an average of 794,700 fish caught per year.
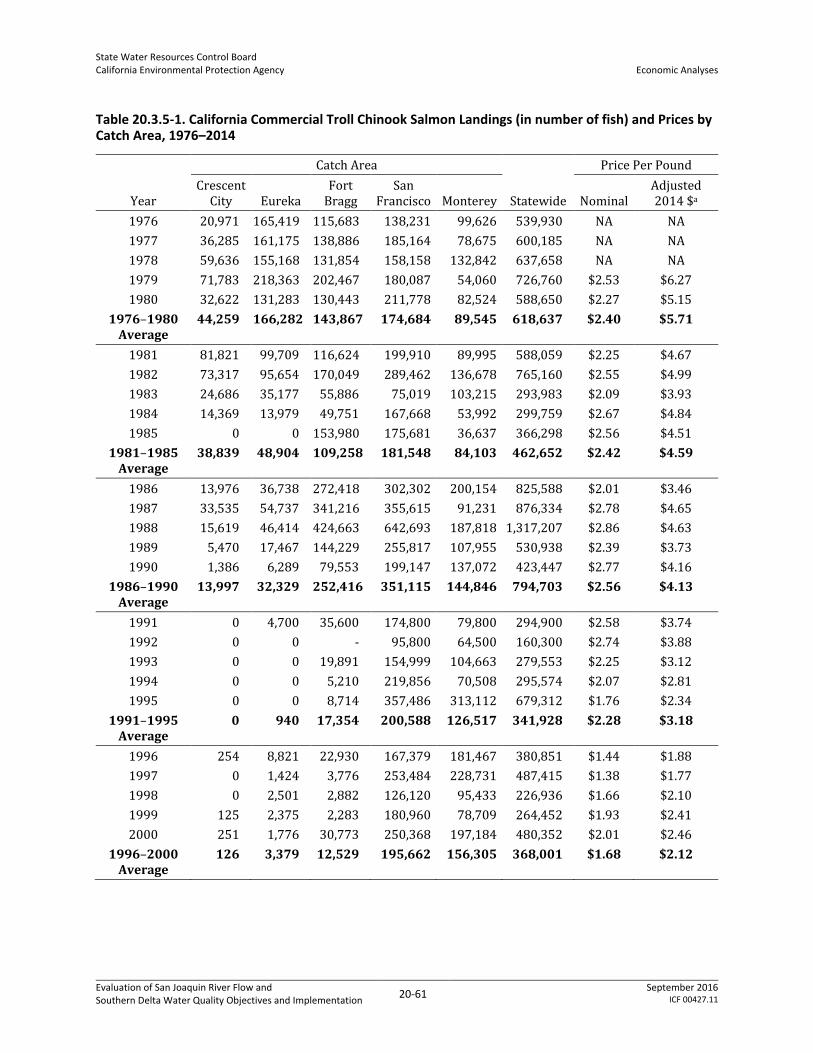
State Water Resources Control Board California Environmental Protection Agency
Economic Analyses
Evaluation of San Joaquin River Flow and Southern Delta Water Quality Objectives and Implementation
20-61 September 2016
ICF 00427.11
Table 20.3.5-1. California Commercial Troll Chinook Salmon Landings (in number of fish) and Prices by Catch Area, 1976–2014
Year
Catch Area
Statewide
Price Per Pound
Crescent City Eureka
Fort Bragg
San Francisco Monterey Nominal
Adjusted 2014 $a
1976 20,971 165,419 115,683 138,231 99,626 539,930 NA NA
1977 36,285 161,175 138,886 185,164 78,675 600,185 NA NA
1978 59,636 155,168 131,854 158,158 132,842 637,658 NA NA
1979 71,783 218,363 202,467 180,087 54,060 726,760 $2.53 $6.27
1980 32,622 131,283 130,443 211,778 82,524 588,650 $2.27 $5.15
1976–1980 Average
44,259 166,282 143,867 174,684 89,545 618,637 $2.40 $5.71
1981 81,821 99,709 116,624 199,910 89,995 588,059 $2.25 $4.67
1982 73,317 95,654 170,049 289,462 136,678 765,160 $2.55 $4.99
1983 24,686 35,177 55,886 75,019 103,215 293,983 $2.09 $3.93
1984 14,369 13,979 49,751 167,668 53,992 299,759 $2.67 $4.84
1985 0 0 153,980 175,681 36,637 366,298 $2.56 $4.51
1981–1985 Average
38,839 48,904 109,258 181,548 84,103 462,652 $2.42 $4.59
1986 13,976 36,738 272,418 302,302 200,154 825,588 $2.01 $3.46
1987 33,535 54,737 341,216 355,615 91,231 876,334 $2.78 $4.65
1988 15,619 46,414 424,663 642,693 187,818 1,317,207 $2.86 $4.63
1989 5,470 17,467 144,229 255,817 107,955 530,938 $2.39 $3.73
1990 1,386 6,289 79,553 199,147 137,072 423,447 $2.77 $4.16
1986–1990 Average
13,997 32,329 252,416 351,115 144,846 794,703 $2.56 $4.13
1991 0 4,700 35,600 174,800 79,800 294,900 $2.58 $3.74
1992 0 0 - 95,800 64,500 160,300 $2.74 $3.88
1993 0 0 19,891 154,999 104,663 279,553 $2.25 $3.12
1994 0 0 5,210 219,856 70,508 295,574 $2.07 $2.81
1995 0 0 8,714 357,486 313,112 679,312 $1.76 $2.34
1991–1995 Average
0 940 17,354 200,588 126,517 341,928 $2.28 $3.18
1996 254 8,821 22,930 167,379 181,467 380,851 $1.44 $1.88
1997 0 1,424 3,776 253,484 228,731 487,415 $1.38 $1.77
1998 0 2,501 2,882 126,120 95,433 226,936 $1.66 $2.10
1999 125 2,375 2,283 180,960 78,709 264,452 $1.93 $2.41
2000 251 1,776 30,773 250,368 197,184 480,352 $2.01 $2.46
1996–2000 Average
126 3,379 12,529 195,662 156,305 368,001 $1.68 $2.12
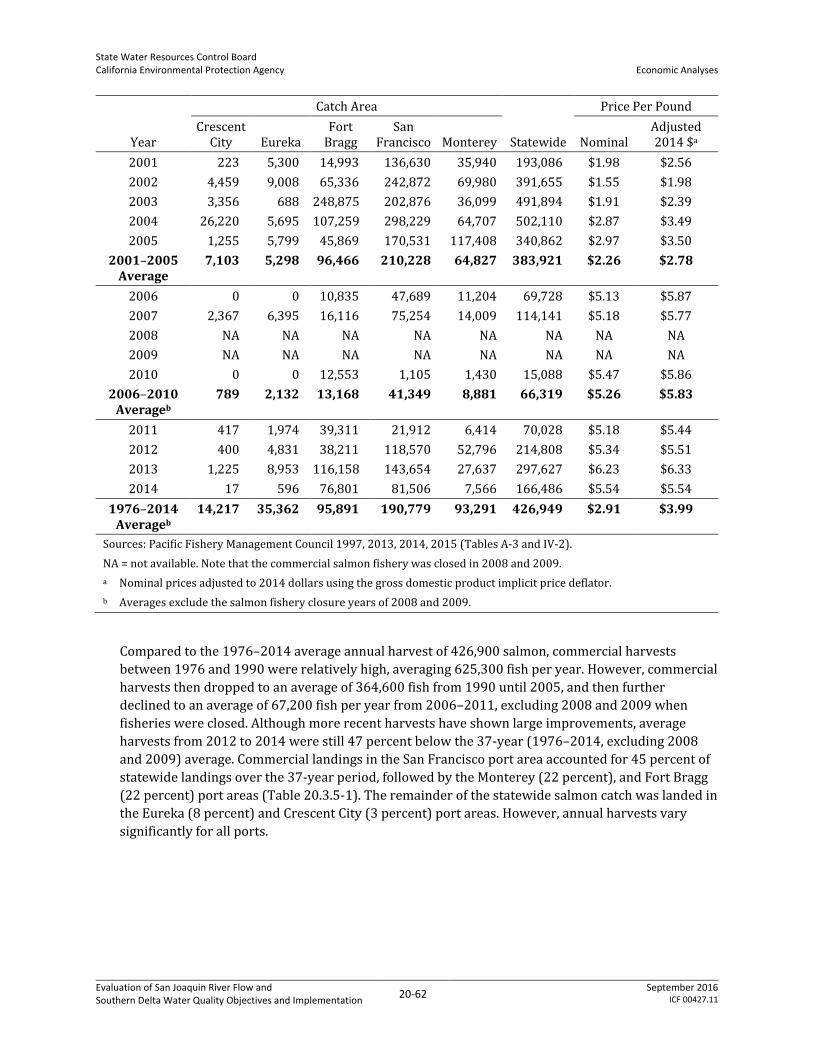
State Water Resources Control Board California Environmental Protection Agency
Economic Analyses
Evaluation of San Joaquin River Flow and Southern Delta Water Quality Objectives and Implementation
20-62 September 2016
ICF 00427.11
Year
Catch Area
Statewide
Price Per Pound
Crescent City Eureka
Fort Bragg
San Francisco Monterey Nominal
Adjusted 2014 $a
2001 223 5,300 14,993 136,630 35,940 193,086 $1.98 $2.56
2002 4,459 9,008 65,336 242,872 69,980 391,655 $1.55 $1.98
2003 3,356 688 248,875 202,876 36,099 491,894 $1.91 $2.39
2004 26,220 5,695 107,259 298,229 64,707 502,110 $2.87 $3.49
2005 1,255 5,799 45,869 170,531 117,408 340,862 $2.97 $3.50
2001–2005 Average
7,103 5,298 96,466 210,228 64,827 383,921 $2.26 $2.78
2006 0 0 10,835 47,689 11,204 69,728 $5.13 $5.87
2007 2,367 6,395 16,116 75,254 14,009 114,141 $5.18 $5.77
2008 NA NA NA NA NA NA NA NA
2009 NA NA NA NA NA NA NA NA
2010 0 0 12,553 1,105 1,430 15,088 $5.47 $5.86
2006–2010 Averageb
789 2,132 13,168 41,349 8,881 66,319 $5.26 $5.83
2011 417 1,974 39,311 21,912 6,414 70,028 $5.18 $5.44
2012 400 4,831 38,211 118,570 52,796 214,808 $5.34 $5.51
2013 1,225 8,953 116,158 143,654 27,637 297,627 $6.23 $6.33
2014 17 596 76,801 81,506 7,566 166,486 $5.54 $5.54
1976–2014 Averageb
14,217 35,362 95,891 190,779 93,291 426,949 $2.91 $3.99
Sources: Pacific Fishery Management Council 1997, 2013, 2014, 2015 (Tables A-3 and IV-2).
NA = not available. Note that the commercial salmon fishery was closed in 2008 and 2009.
a Nominal prices adjusted to 2014 dollars using the gross domestic product implicit price deflator.
b Averages exclude the salmon fishery closure years of 2008 and 2009.
Compared to the 1976–2014 average annual harvest of 426,900 salmon, commercial harvests
between 1976 and 1990 were relatively high, averaging 625,300 fish per year. However, commercial
harvests then dropped to an average of 364,600 fish from 1990 until 2005, and then further
declined to an average of 67,200 fish per year from 2006–2011, excluding 2008 and 2009 when
fisheries were closed. Although more recent harvests have shown large improvements, average
harvests from 2012 to 2014 were still 47 percent below the 37-year (1976–2014, excluding 2008
and 2009) average. Commercial landings in the San Francisco port area accounted for 45 percent of
statewide landings over the 37-year period, followed by the Monterey (22 percent), and Fort Bragg
(22 percent) port areas (Table 20.3.5-1). The remainder of the statewide salmon catch was landed in
the Eureka (8 percent) and Crescent City (3 percent) port areas. However, annual harvests vary
significantly for all ports.

State Water Resources Control Board California Environmental Protection Agency
Economic Analyses
Evaluation of San Joaquin River Flow and Southern Delta Water Quality Objectives and Implementation
20-63 September 2016
ICF 00427.11
As can be seen by reviewing the harvest data in Table 20.3.5-1, Chinook salmon harvests in the
Crescent City and Eureka port areas, and to a lesser extent in the Fort Bragg port area, were
eliminated or greatly reduced from 1991–2001. For these port areas, stringent commercial fishing
regulations have been imposed in some years to protect Klamath River fall-run Chinook in the
PFMC’s Klamath Management Zone (KMZ) (encompassing Curry County in Oregon and Humboldt
and Del Norte counties in California). By severely constraining harvest in the KMZ, the PFMC is able
to maintain fishing opportunities in other areas farther from the KMZ (e.g., San Francisco, Monterey)
that have lesser impacts on this stock (Pomeroy et al. 2010). Additionally, the California portion of
the KMZ was closed to commercial salmon fishing from 1992–1995 due to several localized factors.
These factors include the need to protect Oregon Coastal Natural coho, a determination that the
Klamath fall-run Chinook had been overfished, and a court decision allocating 50 percent of
Klamath-Trinity River salmon to the Yurok and Hoopa tribes (Pomeroy et al. 2010). Finally, in 2006,
failure of Klamath fall-run Chinook to achieve established escapement minimums for the third
consecutive year prompted the PFMC to close the commercial fishery in the California KMZ and
curtail the season in other areas (Pomeroy et al. 2011). Until recently, Klamath River fall-run
Chinook was the constraining stock in the ocean fishery, prompting the restrictive regulations. Since
2007, however, conservation concerns regarding Sacramento River fall-run Chinook have prompted
unprecedented recreational season reductions and closures statewide (see Recent Salmon Fishery
Closures in California section below [Pomeroy et al. 2010]).
In inflation-adjusted 2014 dollars, ex-vessel prices9 for Chinook salmon averaged $3.99 per pound
between 1979 and 2014 (Table 20.3.5-1). Annual inflation-adjusted salmon prices were above $3.00
every year through 1993. From 1994 through 2003, however, average prices did not exceed the
1994 value of $2.81. After 2003, prices rebounded and have not fallen below an inflation-adjusted
$3.49 through 2014. The 1979–2014 overall inflation-adjusted average price of $3.99 was exceeded
in every year since 2005 (excluding 2008 and 2009 when the California commercial salmon fishery
was closed). The 2014 average inflation-adjusted price of $5.54 was 39 percent above the average
between 1979 and 2014.
Similar to commercial harvests, ocean sport (or recreational) catch has varied substantially from
year to year. Excluding the complete or partial closure years of 2008 and 2009 (see Recent Salmon
Fishery Closures in California section below), statewide ocean sport catch of Chinook salmon
between 1976 and 2014 ranged from 397,200 fish in 1995 to 14,800 fish in 2010, averaging about
128,200 fish per year over the entire period (Table 20.3.5-2). During that time, the best 5-year
period for sport catch occurred from 1991–1995, with an average catch of approximately 170,300
salmon per year.
9 The ex-vessel price is a measure of the dollar value of commercial landings, usually calculated as the price per pound at first purchase of the commercial landings multiplied by the total pounds landed.

State Water Resources Control Board California Environmental Protection Agency
Economic Analyses
Evaluation of San Joaquin River Flow and Southern Delta Water Quality Objectives and Implementation
20-64 September 2016
ICF 00427.11
Table 20.3.5-2. California Ocean Recreational Chinook Salmon Landings (in number of fish) by Catch Area, 1976–2014
Year
Catch Area
Statewide Crescent
City Eureka Fort
Bragg San
Francisco Monterey
1976 2,991 7,111 2,324 63,760 4,807 80,993
1977 7,400 13,261 6,323 72,594 4,006 103,584
1978 1,986 2,308 2,534 64,085 1,809 72,722
1979 2,879 3,647 4,626 102,547 5,929 119,628
1980 2,718 4,046 1,308 73,093 4,020 85,185
1976–1980 Average 3,595 6,075 3,423 75,216 4,114 92,422
1981 4,007 4,406 1,787 70,084 3,743 84,027
1982 6,196 7,084 2,948 116,910 5,586 138,724
1983 3,445 5,484 1,933 49,717 3,243 63,822
1984 3,523 4,611 999 73,233 5,437 87,803
1985 17,989 26,384 4,985 112,475 9,276 171,109
1981–1985 Average 7,032 9,594 2,530 84,484 5,457 109,097
1986 5,760 10,459 10,584 86,255 28,558 141,616
1987 12,060 18,436 9,201 119,526 33,320 192,543
1988 17,236 14,345 9,406 114,455 15,919 171,361
1989 25,275 24,642 5,803 93,659 37,248 186,627
1990 12,717 11,109 3,388 77,562 35,053 139,829
1986–1990 Average 14,610 15,798 7,676 98,291 30,020 166,395
1991 3,367 9,508 5,854 37,274 24,830 80,833
1992 889 1,706 4,263 47,193 19,526 73,577
1993 1,272 3,614 5,821 78,733 20,584 110,024
1994 6,321 3,664 14,018 140,977 24,835 189,815
1995 5,556 8,075 29,048 155,677 198,875 397,231
1991–1995 Average 3,481 5,313 11,801 91,971 57,730 170,296
1996 3,828 6,919 24,002 84,471 44,812 164,032
1997 2,527 6,456 11,584 123,974 84,427 228,968
1998 1,123 1,790 4,663 70,969 43,468 122,013
1999 1,016 5,175 5,263 69,251 7,140 87,845
2000 3,571 9,903 25,942 64,653 81,782 185,851
1996–2000 Average 2,413 6,049 14,291 82,664 52,326 157,742
2001 2,236 10,588 26,064 39,856 20,039 98,783
2002 1,107 15,024 31,202 87,008 47,703 182,044
2003 391 8,361 16,180 56,616 13,126 94,674
2004 1,290 21,554 23,205 130,220 44,845 221,114
2005 1,498 16,046 22,183 72,824 30,706 143,257
2001–2005 Average 1,304 14,315 23,767 77,305 31,284 147,974

State Water Resources Control Board California Environmental Protection Agency
Economic Analyses
Evaluation of San Joaquin River Flow and Southern Delta Water Quality Objectives and Implementation
20-65 September 2016
ICF 00427.11
Year
Catch Area
Statewide Crescent
City Eureka Fort
Bragg San
Francisco Monterey
2006 756 15,647 13,993 54,926 10,970 96,292
2007 871 18,025 5,751 16,796 6,261 47,704
2008 - - 6 - - 6
2009 147 525 - - - 672
2010 0 720 1,678 6,116 6,295 14,809
2006–2010 Averagea 542 11,464 7,141 25,946 7,842 52,935
2011 113 9,874 7,398 19,734 12,703 49,822
2012 7,432 32,012 7,929 46,189 30,364 123,926
2013 6,063 27,918 10,168 61,291 10,634 116,074
2014 3233 12,594 12,540 32,359 14,020 74,746
1976–2014 Averagea 4,882 10,879 10,186 75,326 26,916 128,189
Sources: Pacific Fishery Management Council 2013, 2014, 2015 (Table A-5).
a Averages exclude the salmon fishery closure years of 2008 and 2009.
Sport landings from the San Francisco catch area accounted for almost 60 percent of statewide
ocean sport landings over the 37-year period (i.e., excluding 2008 and 2009), followed by the
Monterey area (21 percent) (Table 20.3.5-2). Sport landings in the Crescent City, Eureka, and Fort
Bragg areas, which accounted for 19 percent of statewide ocean sport landings over the period, have
been affected by many of the same management considerations that have restricted commercial
salmon harvests.
According to historical data maintained by the U.S. Fish and Wildlife Service’s (USFWS’s)
Anadromous Fish Restoration Program (AFRP) (USFWS 2015), between 1967 and 2010, the in-river
catch of Chinook salmon in the Central Valley by sport anglers averaged 57,611 fish. Average annual
in-river catch has been higher over the past two decades than in the preceding 25 years, with
catches from 1992–2010 averaging about 64,900 salmon, compared to an average of 51,200 from
1967–1991.
In addition to commercial and sport fishing, California has approximately 100 recognized tribes,
some of which engage in traditional uses of fish (Shilling et al. 2014). Currently, CDFW uses the term
“recreational” for fishermen who do not earn revenue from their catch, but fish for pleasure or for
personal consumption. Information on subsistence fishing by tribal members in California is
captured within the broader scope of sport fishing data (Norman et al. 2007; Shilling et al. 2014).
Contribution of Central Valley Salmon to Ocean and Inland Fisheries
Located within California’s Central Valley, the Sacramento-San Joaquin River system is the principal
producer of Chinook salmon caught in California's ocean fisheries. Its salmon runs also contribute to
the ocean fisheries of Oregon and Washington (CDFW 2014). Historically, the rivers in the SJR
Watershed supported abundant populations of spring- and fall-run Chinook salmon and steelhead
(discussed in greater detail in Chapter 7, Aquatic Biological Resources). However, degradation of
habitat and increasing pressures from the human expansion has negatively affected those populations.
Today, only a relatively small population of fall-run Chinook salmon remain in the three eastside

State Water Resources Control Board California Environmental Protection Agency
Economic Analyses
Evaluation of San Joaquin River Flow and Southern Delta Water Quality Objectives and Implementation
20-66 September 2016
ICF 00427.11
tributaries to the LSJR. These fish pass through the LSJR during their migrations to and from the Delta
and Pacific Ocean, where they contribute to the commercial and sport ocean salmon fisheries.
According to historical data maintained by the AFRP, 1967–2010, the average annual ocean catch of
Central Valley Chinook salmon by San Francisco and Monterey port area-based boats was 382,070 fish
per year. Of this total, 71 percent of the landings were by commercial fishermen and 29 percent were
by sport anglers. Furthermore, based on the historical data, it was estimated that 95 percent of the
catch originated from the Sacramento River Watershed, with the remaining 5 percent originating from
the SJR Watershed. Based on these estimates, the average annual commercial and sport ocean catch of
Chinook salmon originating from the SJR totaled about 13,560 and 5,540 fish, respectively, between
1967 and 2010. Catch data for boats based in the Fort Bragg, Eureka, and Crescent City port areas
were not available; however, data from recent years suggest that a large proportion of the commercial
and sport salmon harvest in these areas originates from Central Valley watersheds (CDFW 2012, 2013,
2015).
Recent Salmon Fishery Closures in California
As discussed above, in 2008 and 2009 the sudden decline of the Sacramento River Basin fall-run
Chinook salmon population led the PFMC to almost completely close salmon fishing seasons for the
first time in California’s history. In both years, the ocean commercial salmon fishery was completely
closed. The ocean recreational salmon fishery also was closed in 2008, but was opened for a 10-day
period in 2009 (August 29–September 7) from Horse Mountain (near Shelter Cove) to the Oregon
border, allowing fishing along the northernmost portion of the California coast (PFMC 2010).
Fishing rebounded beginning in 2010, but still remains below the levels prior to the closures (NMFS
2014.)
Recreational fishing for salmon in Central Valley rivers was also highly restricted in 2008 and 2009
relative to recent years. In 2008, an estimated 650 Sacramento River fall-run Chinook salmon were
harvested during a 2-month season lasting from November 1 through December 31, which was only
1 percent of the river run. Angler surveys conducted in the Sacramento River Basin for 9 years
between 1991 and 2007, during which harvest regulations were much less restrictive than in 2008,
suggested a mean harvest rate of 14 percent of the river run (PFMC 2009). In 2009, the Upper
Sacramento River late fall-run fishery was the only Central Valley fishery open to Chinook retention,
and in an attempt to decrease harvest and protect Sacramento River fall-run Chinook, the fishery
was not opened until November 16, 2009. Preliminary estimates indicated that no Sacramento River
fall-run Chinook salmon were harvested by recreational anglers in the 2009 late-fall fishery (PFMC
2010).
The prohibition of commercial and recreational salmon fishing in 2008 and 2009 caused substantial
economic effects on California’s fishing industry, including direct employment and income losses in
the fishing industry and secondary employment and income losses in dependent industries.
Additionally, the populations of Columbia River Chinook and coho salmon from Oregon and
Washington also declined to near record-low levels. In April of 2008, the Governors of all three
states (California, Oregon, and Washington) wrote the Speaker of the House requesting assistance in
obtaining emergency appropriations to help mitigate the economic impact, which at the time totaled
$290 million and included the loss of more than 4,200 jobs (Schwarzenegger et al. 2008).
Two subsequent studies estimated similar impacts on industrial output and employment in
California caused by the closures of the ocean salmon fisheries. The first study as reported in

State Water Resources Control Board California Environmental Protection Agency
Economic Analyses
Evaluation of San Joaquin River Flow and Southern Delta Water Quality Objectives and Implementation
20-67 September 2016
ICF 00427.11
CDFW’s Outdoor California10 magazine (Morse and Manji 2009), estimated that the 2008 closure cost
the California economy $255 million in industrial output and 2,263 jobs. The publication also
estimated that the 2009 closure resulted in a loss of $279 million in output and 2,690 jobs. The
closures put some boat owners and commercial salmon fishermen out of business, causing economic
hardships for tackle shops, bait and boat dealers, motels and restaurant owners, and other related
businesses during those years (Morse and Manji 2009).
This assessment was corroborated to some extent by a second study of the fishery closure effects
conducted by the University of the Pacific Business Forecasting Center (Michael 2010).11 This study
assessed effects relative to 2004 and 2005 salmon fishery production, when annual commercial
harvests in California averaged 421,500 salmon. For commercial salmon fishing, the Michael study
estimated economic effects for only those directly and indirectly related to salmon harvesting and
processing, assuming that no effects would occur at the wholesale, distribution, or retail levels
because consumers could switch to substitute products. The Michael study estimated that the
fishery closure cost $21.3 million in revenue for the commercial salmon fishing industry, $47.9
million in total income, and 961 total jobs. For recreational salmon fishing, estimated impacts
included the loss of $70.5 million in total income and 862 jobs.12 Combined, the closures of
California’s commercial and recreational salmon fisheries cost the economy $118.4 million in annual
income and 1,823 jobs compared to the income and employment for 2004 and 2005.
The Michael study noted that salmon abundance was much higher in recent decades and that
recovery to these levels would generate even larger economic impacts. Additionally, it noted the role
of seasonality and dispersion in interpreting the results of its study. For example, the study’s
employment impacts represent annual averages, whereas an industry with highly seasonal
employment patterns such as fishing would have employment impacts at some point during the year
higher than those represented by the annual average employment losses. On the other hand,
economic effects of salmon fishing are dispersed across hundreds of miles of coastline and inland
waterways, somewhat diluting the concentration of effects. However, relatively small fishing
communities may feel the effects more acutely than would a larger port area such as San Francisco.
These smaller, more-isolated communities, considered somewhat dependent on commercial and
recreational fishing, include Crescent City in Del Norte County; Eureka, Trinidad, and Fields Landing
in Humboldt County; Fort Bragg, Albion, and Point Arena in Mendocino County; Bodega Bay in
Sonoma County; Point Reyes, Marshall, and Bolinas in Marin County; Princeton and Half Moon Bay in
San Mateo County; and Moss Landing in Monterey County (Langdon-Pollock 2004; Norman et al.
2007).
The studies above (i.e. Morse and Manji 2009; Michael 2010) did not estimate the potential
economic effects caused by curtailment of inland sport fishing for Central Valley Chinook salmon.
Although sport anglers can shift their effort to other species when salmon are not available, the
10 Outdoor California is an official California fish, wildlife, and habitat magazine published by CDFW that describes noteworthy stories on California’s native species and habitat. 11 A third salmon closure study, conducted by Southwick Associates, produced much higher estimates of economic impacts than did CDFW and Michael studies. However, Michael (2010) concluded that several methodological flaws led to highly exaggerated estimates of commercial fishing-related impacts, particularly for effects in California's retail and salmon distribution sectors. 12 Note that the modeling of recreational salmon fishing effects used only the expenditures of out-of-state anglers based on the premise that recreational spending by in-state anglers may simply be transferred to fishing effort for different species or entirely out of fishing and directed towards other recreational pursuits in the area, offsetting the effects attributable to decreased salmon fishing.

State Water Resources Control Board California Environmental Protection Agency
Economic Analyses
Evaluation of San Joaquin River Flow and Southern Delta Water Quality Objectives and Implementation
20-68 September 2016
ICF 00427.11
reduction of salmon fishing opportunities in Central Valley rivers likely adds to the economic effects
estimated by the two ocean closure studies.
In 2006, a federal socioeconomic study conducted by PFMC and the National Marine Fisheries
Service (NMFS) evaluated the needs of fishing communities. The study identified several Northern
California counties and port communities as “most vulnerable” and “vulnerable” with high levels of
dependence on commercial fishing and low levels of resilience. For example, the county of Del Norte
was classified as "vulnerable," and the counties of Humboldt, and Mendocino were classified as
“most vulnerable.” Additionally, the communities of Crescent City, Eureka, Fort Bragg, Point Arena,
and Bodega Bay were classified as “vulnerable." These areas may be particularly susceptible to
fishery closures and the associated economic losses that occur.
Effects on Commercial and Sport Fisheries
Expected Effects on Salmon in the San Joaquin River Watershed
The impacts of LSJR Alternatives 2, 3, and 4 on aquatic resources are detailed in Chapter 7, Aquatic
Biological Resources, and summarized in Table 7-1. Reservoirs releases on the LSJR tributaries are
made in response to multiple operational objectives, including flood management, downstream
diversions, instream flow requirements for fisheries, instream water quality requirements, and
water quality and flow objectives at Vernalis. Under LSJR Alternatives 2, 3, and 4, increased flows
would largely be confined within existing channels, preventing an increase in flood frequency, and
would have similar timing and magnitude compared to historical flows. As a result, increased flows
from LSJR Alternatives 2, 3, and 4, with and without adaptive implementation, are not anticipated to
have substantial adverse impacts on fish species in the tributary watersheds and LSJR. Specifically,
flow alterations would not be sufficient to substantially impact aquatic resources in the tributary
rivers or watershed reservoirs. As a result, impacts on fish species in the tributary rivers and
reservoirs, and consequently on recreational fisheries, would be less than significant.
The potential benefits of the LSJR alternatives on aquatic resources are detailed in Chapter 19,
Analyses of Benefits to Native Fish Populations from Increased Flow Between February 1 and June 30,
and Chapter 3 of Appendix C, Technical Report on the Scientific Basis of Alternative San Joaquin River
Flow and Southern Delta Salinity Objectives. The following information is largely taken from those
sources and repeated here for ease of reference.
The results shown in Chapter 19 indicate that there would be significant temperature benefits for
Central Valley fall-run Chinook salmon and Central Valley steelhead on the eastside tributaries and
the mainstem LSJR under some of the alternatives. These fish evolved to spawn and develop at
higher elevations where the water temperatures are colder. However, with the construction of the
rim dams they can no longer reach these elevations and must spawn in the lower, warmer reaches of
the tributaries. Increasing flow in tributaries at the right times can help buffer streamflow
temperatures against hotter air temperatures in the late spring and early summer, when young
salmon are developing and migrating. Significant temperature improvements are expected on the
Stanislaus and Merced Rivers, primarily under LSJR Alternatives 3 and 4, with and without adaptive
implementation (i.e., requirements of 40–60 percent unimpaired flow). On the Tuolumne River,
significant temperature improvements are expected under all LSJR alternatives, with the least
benefit under LSJR Alternative 2, and the most benefit under LSJR Alternative 4, both without
adaptive implementation.

State Water Resources Control Board California Environmental Protection Agency
Economic Analyses
Evaluation of San Joaquin River Flow and Southern Delta Water Quality Objectives and Implementation
20-69 September 2016
ICF 00427.11
In addition to temperature benefits, results indicate that providing more flow of a more natural
regime during the February–June time period would significantly increase the amount of floodplain
habitat that is available to native fish. Increasing the floodplain area or duration could provide
several benefits for young salmon, including cover from predators, greater access to food resources,
and low flow zones to rest in. Higher unimpaired flow requirements will produce greater benefit, in
terms of floodplain frequency and magnitude (and presumably duration), compared to lower
unimpaired flow requirements or baseline conditions. In general, flood inundation will increase the
most (compared to baseline) during the months of April, May, and June under the LSJR alternatives.
Potential Effects on Use and Non-Use Values Resulting from Improved Salmon Production
The following assessment focuses on potential use and non-use benefits associated with supporting
and maintaining sustainable Chinook salmon populations in the Stanislaus, Tuolumne, and Merced
Rivers. The assessment of use benefits focuses on potential commercial and recreational13 fishing-
related economic effects. Information collected by CDFW, PFMC, USFWS, AFRP, and others is used to
characterize the economic values of existing commercial and sport fisheries that could be affected
by LSJR Alternatives 2, 3, and 4.
Potential non-use benefits (i.e., monetary values associated with just protecting fish resources
rather than from directly using fish resources) also are considered in this section. Although this
assessment is necessarily more qualitative because of the lack of specific information on potential
effects on salmon populations and other native species, estimates of non-use monetary values, as
measured in terms of the public’s willingness to pay (WTP) for programs or actions designed to
restore or enhance fish populations, are presented for context. For this assessment, non-use values
(passive use values) are defined as the non-fishing public’s perceived values associated were merely
knowing that salmon are being protected, even if these individuals have no intention to ever use the
resources.
Improving salmon production in the Stanislaus, Tuolumne, and Merced Rivers would improve
Central Valley adult escapement rates for salmon and could help avoid salmon fishery closures in
the future. Healthier populations and more viable fisheries could have economic benefits for
California residents and businesses, as well as for out-of-state visitors or those who reside out of the
state but place value on maintaining and improving Central Valley fish species. As discussed above
under Recent Salmon Fishery Closures in California, the closures of the ocean commercial and sport
fisheries in 2008 and 2009 cost the California economy an estimated $255–$275 million in
industrial output (sales), $118 million in personal income, and 1,800–2,700 jobs during each year of
the closure. If economic effects from curtailment of the freshwater sport salmon fishery also are
considered, the total economic impact would be substantially greater. There is also a direct
relationship between the prosperity of fishing-dependent communities in the Central Valley and
along the Pacific Coast and the viability of commercial and recreational fisheries that contribute
economic activity to these communities. Additionally, there is a direct benefit for residents of
California and other regions to avoid further extinctions of California’s salmon and other native
fishes.
13 Recreational and sport fishing refer to the same activity; the term sport fisheries is used in this section to refer to marine and freshwater areas where sport fishing activities are managed. This terminology is intended to differentiate fishing activity from more general recreational activities discussed in Section 20.3.6, Effects on Recreational Opportunities, Activity, and the Regional Economy.

State Water Resources Control Board California Environmental Protection Agency
Economic Analyses
Evaluation of San Joaquin River Flow and Southern Delta Water Quality Objectives and Implementation
20-70 September 2016
ICF 00427.11
Non-use values are considered public goods that can be simultaneously enjoyed by millions of
people across a region and the country (Loomis 1996). Existence value is a non-use value defined as
the benefit received from simply knowing that a resource exists even if no use is made of it.
Increasing stocks of Chinook salmon and steelhead in the SJR Watershed to sustainable levels would
have associated existence values as it provides assurance that the resource will continue to exist.
Although data on salmon recovery rates and associated population levels is too limited to reliably
estimate non-use values associated with recovering Chinook salmon in the SJR Watershed, these
values are conceptually measurable and would likely differ to some extent among LSJR Alternatives
2, 3, and 4.
Table 20.3.5-3 identifies four salmon restoration programs with studies conducted to estimate non-
use values associated with the restoration programs. Typically, non-use values can only be
measured reliably by designing and implementing program-specific public surveys; however, the
number of such studies is very limited due to the time and costs associated with conducting public
surveys of this nature. Although the underlying reason for conducting the four studies referenced in
Table 20.3.5-3 was similar (i.e., to estimate the monetary value that the public would place on
restoring salmon habitat and populations), each study embodied different actions for achieving the
salmon restoration goals of the programs. In the case of the Elwha River and the Klamath River,
removing dams that blocked access to habitat important for salmon was central to the program. In
the case of the Columbia River, interest in substantially increasing (doubling) salmon runs was the
overriding goal. Lastly, the Upper SJR study was part of a broader federal and state program to
improve deteriorating habitat conditions for fish and wildlife resources in the San Joaquin Valley.
Acknowledging non-use values similar to those in Table 20.3.5-3 is important to a comprehensive
assessment of costs and benefits for LSJR Alternatives 2, 3, and 4. Although difficult to accurately
measure without conducting a public survey tailored to the outcomes of specific physical and
biological program objectives, the importance of relevant non-use values in an economic assessment
of the plan amendments should not be overlooked. Oftentimes, estimates of non-use values can total
in the hundreds of millions of dollars or more. However, thoroughly understanding important causal
relationships between restoration (e.g., enhanced flows) and the resulting physical and biological
outcomes is challenging. As such, the best result that typically can be expected from a review of
values similar to those studies identified in Table 20.3.5-3 is to develop a contextual foundation for
these values. This foundation provides an understanding about the general magnitude of non-use
values and their contribution to the economic calculus.
The evaluation described above is limited to potential use and non-use benefits associated with
supporting and maintaining sustainable populations of Chinook salmon in the three eastside
tributaries. As noted, improving salmon production in the Stanislaus, Tuolumne, and Merced Rivers
would be expected to improve Central Valley adult escapement rates and could help avoid salmon
fishery closures in the future, resulting in direct economic benefits to California businesses and
residents. There also may be additional benefits to other native fish species and other plant and
animal species at spatial scales that extend beyond the scope of the plan amendments; however,
uncertainty and lack of information on the potential biological effects preclude a more quantitative
evaluation of these benefits.

State Water Resources Control Board California Environmental Protection Agency
Economic Analyses
Evaluation of San Joaquin River Flow and Southern Delta Water Quality Objectives and Implementation
20-71 September 2016
ICF 00427.11
Table 20.3.5-3. Existing Studies that Estimate the Non-Use Monetary Benefits Associated with Restoring Salmon Populations, as Measured by the Public’s Willingness to Pay
Upper San Joaquin River Study (1990)a
Columbia River Study (1989)b Elwha River Study (1996)c
Klamath River Study (2012)d
Description of Salmon Program Benefits
Increase annual populations of Chinook salmon in the Upper SJR from less than 100 fish to about 15,000 fish as a result of increasing flows in the river
Restore (double) annual salmon and steelhead runs (increase of 2.5 million fish annually) as a result of habitat restoration efforts
Increase pink salmon runs by 200,000 fish annually and chum, steelhead, and Chinook runs by 100,000 fish annually as a result of dam removal/habitat restoration
Increase populations of wild salmonids (Chinook salmon and steelhead), with increases ranging from 30% to 150%; changes in extinction rates for the shortnose and Lost River suckers, and for coho salmon as a result of dam removal/habitat restoration
Estimates of Annual Willingness to Pay (WTP) per Household
Annual WTP benefits ranged from $103 per household (out-of-state residents) to $202 per household (residents of the San Joaquin Valley) (in 1990 dollars)
Monthly WTP benefits range from $2.21 per respondent to $4.88 per respondent (in 1989 dollars), depending on the probability of future use of the river for salmon fishing
Annual WTP benefits vary by location of respondent, ranging from $59 per household for residents of Clallam County, to $73 per household for residents elsewhere in Washington State; out of state residents indicated an average (mean) WTP benefit of $68 annually (in 1996 dollars)
WTP benefits vary by program characteristics; annualized values (discounted) range from $65.82 to $112.28 per household (in 2012 dollars)
Sources:
a Jones & Stokes Associates, Inc. 1990.
b Olsen et al. 1991.
c Loomis 1996.
d RTI International 2012.

State Water Resources Control Board California Environmental Protection Agency
Economic Analyses
Evaluation of San Joaquin River Flow and Southern Delta Water Quality Objectives and Implementation
20-72 September 2016
ICF 00427.11
Effects of Commercial and Sport Fisheries on Regional Economies
This section addresses potential effects on fishery-dependent regional economies from flow-related
effects on recreational and commercial fisheries. The analysis considers potential changes in
fisheries associated with improved conditions for native fisheries affected by LSJR Alternatives 2, 3,
and 4.
Potential effects on regional economic conditions caused by changes in fishery conditions in the
three tributaries and the LSJR can be viewed by tracing the underlying relationship between fishing
activity (both commercial and sport fishing activity) and regional economies affected by this activity.
Conceptually, local and regional economic activity generated by the use of fishery resources can be
followed from the availability of (and changes to) the resources to the generation of employment
and income within a region. Management of commercial and sport fishery resources in marine
waters, as well as those at freshwater reservoirs and rivers, affects the amount and type of
commercial and sport fishing activity at different fishing areas. Changes in the availability and
management of fishing facilities result in changes in sport fishing activity, which, in turn, typically
alters the location and level of fishing-related spending. For example, a highly developed facility,
such as a marina with a resort and restaurants, boat slips, and boat launching facilities, may attract
large numbers of anglers from outside the region who spend money on accommodations, restaurant
meals, boat rentals, and fuel in the vicinity of the facility. Alternatively, an undeveloped campground
on a reservoir may attract relatively few anglers from outside the local area, resulting in fishing-
related spending that largely consists of food and gasoline purchases made at home or en route to
the site.
As discussed previously in this section, fisheries-related activities in the study area would likely
increase under LSJR Alternatives 2, 3, and 4 in response to enhanced populations of salmon and
other native fish species. LSJR Alternative 2 would likely have a relatively minor impact on fisheries-
related economic activity, but the economic benefits would grow under Alternatives 3 and 4 as
salmon populations further increase. However, the overall economic and employment effects for
most businesses directly and indirectly linked to fishing activity in the study area would likely not be
substantial. Some small, fishing-dependent communities, where fishing-related activity contributes
more than just minimally to local economic activity, may see greater economic benefits.
As discussed in Section 20.3.5, Effects on Fisheries and Associated Regional Economies,
implementation of the San Joaquin River Restoration Program14 (SJRRP) is expected to have fishery-
related benefits, which, in turn, would benefit fishery-dependent communities within the study area.
When considered in conjunction with the SJRRP, the plan amendments may have a more substantial
effect on economic activity for fishery-dependent communities in the study area. In addition, greater
economic activity could also bring additional economic opportunities (i.e., jobs, income) to these
areas.
Adaptive Implementation
Adaptive implementation would take place based on required evaluation of current scientific
information and would need to be approved as described in Appendix K, Revised Water Quality
Control Plan. Accordingly, the frequency and duration for any use of adaptive implementation
14 Implementation of the settlement and the Friant Dam release flows required by the San Joaquin River Restoration Program are expected to increase the existing SJR flows at Stevinson in the near future

State Water Resources Control Board California Environmental Protection Agency
Economic Analyses
Evaluation of San Joaquin River Flow and Southern Delta Water Quality Objectives and Implementation
20-73 September 2016
ICF 00427.11
methods 1, 2, 3, and 4 cannot be determined at this time. Adaptive implementation method 1
potentially has the greatest likelihood of changing economic effects as it would allow the unimpaired
flow requirements to be increased or decreased by up to 10 percent from the objective unimpaired
flow (with a minimum requirement of 20 percent and a maximum of 60 percent unimpaired flow).
For LSJR Alternative 2, an increase from 20 percent to 30 percent of the unimpaired flow would
likely result in different effects as compared to those shown above for LSJR Alternative 2, depending
upon flow conditions and frequency of the adjustment. As such, under LSJR Alternatives 2 or 3, if the
percentage of unimpaired flow is increased with adaptive implementation method 1, regional
economic effects related to enhanced fisheries could increase more than conditions without
adaptive implementation. Under LSJR Alternatives 3 and 4, if the percent of unimpaired flow could
be reduced with adaptive implementation method 1, if there were no effect on fish, and as such, use
and non-use benefits and regional economic conditions would not be expected to change much
compared to conditions without adaptive implementation.
20.3.6 Effects on Recreational Opportunities, Activity, and the Regional Economy
Introduction
As described in Chapter 10, Recreational Resources and Aesthetics, changing flow regimes and
reservoir-storage levels may potentially affect the timing, duration, and quality of recreational
opportunities. Therefore, implementation of LSJR Alternatives 2, 3, and 4 may affect recreational
activities through adoption of new and updated water management practices that could alter
reservoir-storage levels and downstream releases.
Changes in reservoir-storage levels could affect recreational activities primarily by reducing access
to boat ramps, marinas, and boat-in campgrounds; reducing water surface area for boaters; and
exposing large areas of shoreline, negatively affecting aesthetic quality and access for picnickers,
swimmers, and shore side users. Changes in downstream flows could affect both water-dependent
and water-enhanced recreation in the Stanislaus, Tuolumne, and Merced Rivers and potentially
along the LSJR. Furthermore, altering the timing, duration, and quality of recreational opportunities
could affect the value that recreationists place on the activities and, in turn, change the frequency
with which these recreational resources are used.
As described in Gallo (2002), recreational opportunities can generate economic benefits through
two pathways. The first pathway is the value (net benefit) to those participating in the activities, as
indicated by their willingness to pay over and above trip expenditures (i.e., transportation and
parking fee costs) for these recreational opportunities. This measure of value depends, to a large
extent, on the quality of the recreation environment. For example, wildlife watching is more
rewarding when there is more viewable wildlife, creating greater value in that environment.
Improving the quality of the environment can augment recreational benefits, which is typically
measured by the increase in willingness to pay (i.e., monetary value over and above trip-related
expenditures) for the recreational activities.
The second pathway to assess the economic contribution of recreational opportunities is the
beneficial impacts that recreation-related spending by nonresidents of a region brings to a local
economy where the nonresidents are visiting. Nonresidents are particularly important in this regard
because their economic activities may not otherwise occur within the region. More frequent trips by

State Water Resources Control Board California Environmental Protection Agency
Economic Analyses
Evaluation of San Joaquin River Flow and Southern Delta Water Quality Objectives and Implementation
20-74 September 2016
ICF 00427.11
visitors means additional spending in the region. These types of economic effects are typically
referred to as regional economic impacts, where a region can range from a small geographic area
(e.g., a county or city) to a large multi-county area. While these effects do not directly affect
residents, increased visitor spending does support local economic activity. Although not considered
here, those who do not directly use the improved environment for recreational activities may still
benefit just from knowing that biodiversity is enhanced and from other environmental
enhancements that contribute to amenity values (i.e., non-use value).
The study area for evaluating recreation-related economic effects in this analysis includes the
reservoirs (i.e., New Melones, New Don Pedro, and Lake McClure) and the three eastside tributaries
(Stanislaus, Tuolumne, and Merced Rivers) extending from the reservoirs, downstream, to the LSJR.
(Potential economic effects of LSJR Alternatives 2, 3, and 4 on fishing are discussed in Section 20.3.5,
Effects on Fisheries and Associated Regional Economies.) This section begins by presenting a
description of baseline conditions, including information on recreational activity in the study area
and its relationship to river flows and reservoir levels. Then, potential effects of the LSJR
alternatives on recreational opportunities, participant benefits and recreation-related spending are
assessed. This assessment is followed by a qualitative assessment of potential recreation-related
regional economic impacts on the regional economy.
Description of Baseline Conditions
In this analysis, estimates of existing recreational use help establish a baseline of potentially affected
recreational activity and associated spending in the study area. Table 20.3.6-1 presents estimates of
baseline recreational use, in terms of annual visitor days, at recreation areas in the study area.
Approximating recreation activity at the specific locations identified in Table 20.3.6-1 is useful for
evaluating the relative economic importance of these recreational areas within the surrounding
region. Although some of the values in Table 20.3.6-1 are somewhat dated, these estimates are
considered to reasonably characterize existing recreational activity because of the many factors
affecting recreational use levels over time, both positively and negatively.
As shown in Table 20.3.6-1, annual recreational use at New Melones Reservoir, Don Pedro
Reservoir, and Lake McClure totals about 2.4 million visitor days, of which it is assumed that
residents and non-residents each account for about 50 percent of the total. Annual recreational
activity along the Stanislaus, Tuolumne, and Merced Rivers and the LSJR totals an estimated 710,200
visitor days. Although the proportion of visitor days to the eastside tributaries made by residents or
nonresidents is unknown, it is assumed to be similar to the proportions at the reservoirs (50
percent made by residents and 50 percent made by non-residents of the study area).
For this analysis, recreational activities are grouped according to flow ranges developed by
Whittaker and Shelby (2003) to support different types of river recreation activities. Based on this
study, low-range flow activities, like swimming, account for about 25 percent of all use; that mid-
range flow activities, including motorized boating, rafting, and kayaking, account for about 60
percent of all activities; and that high-range flow activities, such as advanced kayaking and rafting,
account for about 15 percent of all activities.

State Water Resources Control Board California Environmental Protection Agency
Economic Analyses
Evaluation of San Joaquin River Flow and Southern Delta Water Quality Objectives and Implementation
20-75 September 2016
ICF 00427.11
Table 20.3.6-1. Estimated Use (in Visitor Days) of Affected Recreation Areas, by Watershed
Watershed/Recreation Area Counties
Estimated Visitor Days (Year) Type of Activities
Stanislaus San Joaquin, Calaveras, Tuolumne, Stanislaus
New Melones Reservoir
800,000 (2011)a All activities
Stanislaus River 330,200 (1999)b Fishing, camping, swimming, whitewater boating, water-enhanced activities
5,200 (average of 1999/2000)c
Fishing only
Tuolumne Tuolumne, Stanislaus
Don Pedro Reservoir 244,000 (peak season, April through
September - 2012)d
All activities
Tuolumne River 150,000 (1992)e Boating, fishing, swimming, rafting, wildlife viewing
34,900 (2000)f Fishing only
Merced Mariposa, Merced
Lake McClure 1,400,000 [2010]g All activities (camping, boating, swimming, hiking, bicycling, house boating, fishing)
Merced River 73,000 [1999]h Kayaking, rafting, canoeing, water-enhanced activities
Lower San Joaquin River San Joaquin, Stanislaus, Merced
157,000 [2001]i Boating and fishing
57,500 [2000]j Fishing only
Sources:
a USBR 2011; use is measured in 12-hour recreation visitor days (RVDs).
b MacAfee 2000.
c Derived based on information from CDFG 2001a and 2001b; includes reach of the river from Goodwin Dam (Tulloch
Reservoir) downstream to the McHenry Avenue bridge near Meyers.
d TID & MID 2013.
e USBR 1999; use is measured in 6-hour RVDs.
f Derived based on information from Gallo 2002. Note that estimates in Table 20 of the Gallo report were adjusted to
account for all visitors; as stated in the referenced report, county residents account for an estimated 51 percent of
all recreation days.
g As cited in Merced ID 2014.
h As cited in USBR 1999; use is measured in 6-hour RVDs.
i As cited in USBR 2001; use is measured in 6-hour RVDs.
j Derived based on information from Gallo 2002. Note that estimates in Table 20 of the Gallo report were adjusted to
account for all visitors; as stated in the referenced report, county residents account for an estimated 51 percent of
all recreation days.

State Water Resources Control Board California Environmental Protection Agency
Economic Analyses
Evaluation of San Joaquin River Flow and Southern Delta Water Quality Objectives and Implementation
20-76 September 2016
ICF 00427.11
Residents of the study area who use the rivers and reservoirs for recreational activity are estimated
to receive, on average, $25 (in 2007 dollars) per visitor day in net benefits, as measured by their
willingness to pay for these recreational opportunities over and above their trip-related
expenditures (Hanemann 2005). Non-residents of the region who use the rivers and reservoirs for
recreational activity are estimated to spend, on average, $30 (in 2007 dollars) per visitor day
(Hanemann 2005). Based on information presented in Table 20.3.6-1, the three eastside tributaries
and their upstream rim reservoirs account for about 3.5 million visitor days per year. Assuming that
half of the visitors to the region are residents of the region and the other half are non-residents, the
residents spend an estimated $43.7 million per year and the non-residents spend about $52.5
million per year, which have additional benefits for residents in terms of generating local economic
activity.
Effects of the LSJR Alternatives
This section describes the potential effects on recreational activity and associated economic effects
from changes in recreational opportunities in the study area under the LSJR Alternatives 2, 3, and 4.
The assessment is based primarily on predicted flow differences between modeled baseline
conditions and the LSJR alternatives, as presented in Chapter 10, Recreational Resources and
Aesthetics (Tables 10-4 through 10-6), and on how changes to reservoir storage levels could impact
recreational opportunities and the use of recreational facilities at affected reservoirs (Tables 10-8
through 10-13).
Effects on River Recreational Activities
This analysis uses hydrology modeling results for the LSJR alternatives to measure the frequency of flows within particular ranges that support different types of river recreational activities, as
presented in Chapter 10, Recreational Resources and Aesthetics, (see Tables 10-4 through 10-6).
Although optimal flows vary for each river due to hydrologic and geomorphic conditions, flows can
generally be classified into the following flow ranges for purposes of evaluating potential effects on
certain types of recreational activities.
Low-range flows (less than 500 cfs) for supporting swimming, floating, canoeing and kayaking.
Moderate-range flows (between 500 and 1,500 cfs) for supporting motorized boating, rafting,
and kayaking (but may still support swimming, wading, and floating, particularly in certain
locations).
High-range flows (between 1,500 and 2,500 cfs) for supporting advanced rafting or kayaking.
A flow above 2,500 cfs is generally considered unsafe for recreational activities, although advanced
whitewater rafting and kayaking often still take place.
Although impacts on recreational opportunities and activities, and associated economic effects,
would be relatively minor under all LSJR alternatives, these effects would vary by alternative and
river.
Under LSJR Alternative 2, the frequency of low-range, moderate-range, and high-range flows on the
Stanislaus, Tuolumne, and Merced Rivers would not substantially change. The Merced and
Tuolumne Rivers would experience a slight decrease in the frequency of low-range flows when
compared with modeled baseline conditions (see Tables 10-4 and 10-5); however, a slight increase
in the frequency of moderate flows could offset the impact of changes in the frequency of low-range

State Water Resources Control Board California Environmental Protection Agency
Economic Analyses
Evaluation of San Joaquin River Flow and Southern Delta Water Quality Objectives and Implementation
20-77 September 2016
ICF 00427.11
flows on recreation activity on these rivers. The Stanislaus River would experience even less change
in the frequency of low-range, moderate-range, and high-range flows (see Table 10-6). Overall,
changes in flows under LSJR Alternative 2 would not be expected to substantially impact
recreational activities on these rivers.
Under LSJR Alternative 3, the frequency of low-range flows on the Merced River would likely
decrease, while the frequency of moderate-range and high-range flows would be expected to
increase. Overall, recreational opportunities could be slightly greater, primarily because activities
associated with the more frequent moderate-range (500–1500 cfs) and high-range (1,500–2,500
cfs) flows could more than offset the expected decrease in recreation activity supported by low-
range (<500 cfs) flows (see Table 10-4). Conversely, the frequency of low-range and moderate-range
flows on the Tuolumne River would likely decrease, whereas the frequency of high-range flows
would be expected to increase. There would also be an increased frequency of flows over 2500 cfs
that do not support most recreational activities. Overall, recreational opportunities on the Tuolumne
River could slightly decrease as recreation activity supported by low-range and mid-range flows
could more than offset the increased activity supported by high-range flows (see Table 10-5).
Finally, on the Stanislaus River there would be minor shifts in the frequency of low-range, moderate-
range, and high-range flows and, therefore, recreation activity would be more or less unchanged
under LSJR Alternative 3 (see Table 10-6).
Under LSJR Alternative 4, flow frequency impacts would be similar to those under LSJR Alternative
3. On the Merced River, the frequency of low-range flows would likely decrease while the frequency
of moderate-range and high-range flows would increase, resulting in slightly greater recreational
opportunities and activity (see Table 10-4). On the Tuolumne River, the frequency of low-range and
moderate-range flows would likely decrease slightly, while the frequency of flows over 2500 cfs
would increase. In response, recreational opportunities and activities could slightly decrease on the
Tuolumne River because activities that rely on low-range and moderate-range flows could not be
performed as often (see Table 10-5). Finally, on the Stanislaus River the frequency of low-range and
moderate-range flows would slightly decrease, whereas the frequency of flows over 2500 cfs would
increase. As a result, recreational opportunities on the Stanislaus River may slightly decrease, as
activities that rely on low-range and moderate-range flows could not be performed as often (see
Table 10-6).
In summary, flow changes associated with LSJR Alternatives 2, 3, and 4 would be expected to result
in minor increases or decreases in recreational opportunities and activities in the three eastside
tributaries. Low-range flows would likely occur less frequently under the LSJR alternatives, while
high-range flows would likely occur more frequently. In turn, there may be slight shifts in the types
of recreational activities performed, depending on historical use of each river. As flows shift higher
more people may participate in boating rather than wading, but overall recreational opportunities
should remain more or less unchanged. Consequently, benefits to local residents and potential
effects on visitor spending in the region associated with recreational activity on the tributaries
would be relatively unchanged under LSJR Alternatives 2, 3, and 4.
Effects on Reservoir Recreational Activities
As discussed in Chapter 10, Recreation Resources and Aesthetics, operational changes at the three
rim reservoirs (New Melones Reservoir, Don Pedro Reservoir, and Lake McClure) under LSJR
Alternatives 2, 3, and 4 would be expected to have less than significant (and presumably slight)
effects on recreational opportunities and associated activity. Overall, recreational opportunities and

State Water Resources Control Board California Environmental Protection Agency
Economic Analyses
Evaluation of San Joaquin River Flow and Southern Delta Water Quality Objectives and Implementation
20-78 September 2016
ICF 00427.11
use at all three reservoirs would be expected to decrease slightly or remain generally unchanged
under LSJR Alternatives 2, 3, and 4 (see Tables 10-8 through 10-13). Under LSJR Alternative 2, the
relatively small changes in reservoir elevations would not be expected to affect levels of recreational
activity at any of the reservoirs. Under LSJR Alternative 3, the predicted changes in reservoir
elevations would not be expected to substantially affect recreational use levels at any of the three
rim reservoirs; however, elevation shifts at New Don Pedro Reservoir would be more noticeable
than at the other two reservoirs, although recreation opportunities and associated activities still
would not be expected to decrease substantially (see Tables 10-10 and 10-11). Finally, under LSJR
Alternative 4, predicted changes in reservoir elevations would still not be expected to substantially
affect recreational use levels at any of the three rim reservoirs.
Because water levels in all three reservoirs would not change significantly under the LSJR
alternatives, the impacts on recreational opportunities at the reservoirs would likely be small.
Consequently, benefits to local residents and effects on visitor spending in the region associated
with reservoir recreation activity would be relatively unchanged under LSJR Alternatives 2, 3, and 4.
Potential Effects on the Regional Economy
Management of recreational resources in the plan area, including reservoir-elevation levels and
river flows, affects recreational opportunities and the number of visitors and types of activities that
they take part in. For example, a highly developed recreation area, such as a reservoir that includes a
resort with restaurants, boat slips, and boat launching facilities, may attract a large number of
visitors from outside the region who spend money in the vicinity of the recreation area.
Alternatively, an undeveloped campground may attract relatively few visitors from outside the local
area, while local visitors will primarily purchase food and gasoline at home or en route to the site.
Conceptually, local and regional economic activity generated by recreational spending can be traced
from the use of recreational resources to the generation of employment and income by recreational
activities within the region.
Although not quantified for this analysis, potential regional economic effects associated with
changes in recreational activity on the three tributaries and rim reservoirs are expected to be minor.
LSJR Alternatives 2, 3, and 4 would likely have only minor effects on recreational activity and
spending at the eastside tributaries and their associated rim reservoirs. The greatest potential
effects would be associated with recreational activity on the Tuolumne and Merced Rivers where
implementation of the LSJR alternatives could reduce the frequency of low range flows (<500 cfs),
which are optimal for relatively calm water activities such as swimming and wading. In turn, LSJR
Alternatives 2, 3, and 4 could also have relatively minor impacts on regional economic activity, as
the number of non-local visitors may slightly decrease.
As identified in Section 20.3.5, Effects on Fisheries and Associated Regional Economies,
implementation of the SJRRP is expected to provide additional recreational opportunities in the SJR
Watershed that would benefit the local and regional economy. It has been estimated that the
additional recreational activity (including fishing) provided by the SJRRP could support 475
recreation industry jobs annually by 2025 (Kantor 2012). The stimulus of economic activity from
the SJRRP would result in a cumulative economic benefit to the local and regional economy within
the SJR Watershed.

State Water Resources Control Board California Environmental Protection Agency
Economic Analyses
Evaluation of San Joaquin River Flow and Southern Delta Water Quality Objectives and Implementation
20-79 September 2016
ICF 00427.11
Adaptive Implementation
Adaptive implementation would take place based on required evaluation of current scientific
information and would need to be approved as described in Appendix K, Revised Water Quality
Control Plan. Accordingly, the frequency and duration for any use of adaptive implementation
methods 1, 2, 3, and 4 cannot be determined at this time. Adaptive implementation method 1
potentially has the greatest likelihood of changing economic effects as it would allow the unimpaired
flow requirements to be increased or decreased by up to 10 percent from the objective unimpaired
flow (with a minimum requirement of 20 percent and a maximum of 60 percent unimpaired flow);
however, this would likely result in tradeoffs between river and reservoir recreation economic
effects. Methods 2 and 3 could change the timing of the flows and if more water is held in the
reservoirs for later release, this might help reservoir and maybe river recreation. Overall, given the
very small changes in recreational opportunities, it is not expected that adaptive implementation
would substantially change the effects presented above.
20.3.7 Non-Flow Measures
This section provides cost estimates associated with implementing non-flow measures that affected
entities or resource agencies (e.g., CDFW) may undertake between the rim dams on the Stanislaus,
Tuolumne, and Merced Rivers and the confluence of the LSJR. These measures would inform the
body of scientific information potentially used to make adaptive implementation decisions under
LSJR Alternatives 2, 3, and 4. The costs described are based on reference projects and incorporate
standard assumptions regarding the type and potential location of non-flow measures. These
measures, which are grouped into habitat restoration, fish passage improvements, and other
actions, include the following.
Habitat Restoration
Floodplain and riparian habitat restoration.
Gravel augmentation.
Enhanced in-channel complexity.
Improve temperature conditions.
Fish Passage Improvements
Fish screens (screen unscreened diversions in tributaries and LSJR).
Permanent physical barrier in the southern Delta.
Other
Predatory fish control.
Invasive species control (i.e., plant control).
The cost information described below is summarized from information presented in Chapter 16,
Evaluation of Other Indirect and Additional Actions. The availability of information pertaining to the
costs associated with several of the non-flow measures identified in Chapter 16 is very limited as
such is not presented here. This includes reduction of vegetation disturbing activities and removal of
human-made barriers to fish migration. In particular, the costs associated with the removal or

State Water Resources Control Board California Environmental Protection Agency
Economic Analyses
Evaluation of San Joaquin River Flow and Southern Delta Water Quality Objectives and Implementation
20-80 September 2016
ICF 00427.11
modification of human-made barriers to fish migration are not presented below because the
feasibility of this non-flow measure is unknown, as discussed in Chapter 16.
Floodplain and Riparian Habitat Restoration
Floodplain and riparian habitat restoration can be achieved through different approaches. While site
specific conditions influence the cost of each approach, removal of riprap or other bank protection
and active plantings are considered generally lower cost approaches, as compared to creating or
expanding natural or engineered floodways, modifying river and floodplain geometry, or hydrologic
reconnection of historical floodplains through levee breaches and/or setbacks. Removal of riprap
and active plantings typically require fewer feasibility and design studies, fewer permits, and the
involvement of fewer responsible agencies, and require limited adaptive management and
mitigation monitoring plans to evaluate the effectiveness of the projects. In addition, removal of
riprap and active plantings are less likely to require the purchase of property, which can be a
substantial cost associated with floodplain and riparian habitat restoration.
Examples of floodplain and habitat restoration projects include the following.
The Lower San Joaquin River Floodplain Protection and Restoration Project that acquired a total
of 223.54 acres of wildlife habitat adjacent to the SJR and eastside tributaries for preservation
and future enhancement of riparian and wetland habitats for an estimated cost of $1.1 million.
The Basso Bridge Ecological Reserve and Merced River Ranch Land Acquisitions on the Merced
River were purchased for approximately $830,000 in 1997 to protect spawning riffles and
enhance riparian species. At the time, the purchase was simply to secure the land, with no active
restoration planned. Depending on the size, scale, and location of a project, levee breaches can
be very costly.
The Cosumnes River floodplain restoration project where the U.S. Army Corps of Engineers
breached and abandoned 5.5 miles of levees to allow the river to flow into the floodplain as a
result of the 1997 floods. This project cost an estimated $1.55 million.
Gravel Augmentation
The cost of gravel augmentation is substantially influenced by site specific conditions. Generally,
gravel injection is a low cost approach, whereas hydraulic structure installation is a higher cost
approach. The costs associated with gravel injection primarily relate to fuel costs for gravel delivery.
These costs are estimated at $15–$20 per ton, plus $0.16–$0.20 per mile to transport. Gravel
injection is typically used where flows are high enough to mobilize the material, such as
downstream of a reservoir or at locations with easy access to the river for gravel placement.
Spawning bed enhancement is more expensive than gravel injection as it typically requires
engineering design. The cost of spawning bed enhancement, which does not include engineering
design, is estimated at $25–$33 per ton ($19–$25 per cubic yard). Choosing an appropriate location
and gravel mix is crucial for successful augmentation.
Hydraulic structure installation is generally the most expensive gravel augmentation approaches
because it requires engineering analysis and in-stream work with heavy equipment that requires
permits from different agencies that can take 6–18 months to obtain. Project costs for this approach
can range from $1,500 to $100,000 depending on the complexity of the project, project length and
materials.

State Water Resources Control Board California Environmental Protection Agency
Economic Analyses
Evaluation of San Joaquin River Flow and Southern Delta Water Quality Objectives and Implementation
20-81 September 2016
ICF 00427.11
The costs associated with the gravel augmentation approaches described above do not include
maintenance and monitoring costs, which depend on the approach selected. Examples of gravel
augmentation projects are shown in Table 20.3.7-1.
Table 20.3.7-1. Central Valley Project Improvement Acta Spawning and Rearing Habitat Restoration Projects
Project Description
Construction/
Implementationb
Monitoring + Adaptive Managementc
Sacramento River Project
Annual placement of 10,000 tons of gravel for spawning and rearing habitat restoration – between Clear Creek & Keswick Dam
$795,000 $120,000
American River Project
Annual placement of 7,000 tons of gravel at Nimbus Basin on the American River
$745,000 $6,000 + $100,000
Stanislaus River Project
Annual placement of 3,000 tons of gravel at the Two Mile Bar or Upper Honolulu Bar along the Stanislaus River
$670,000 $15,000
Program Management & Support (for three projects over 2 fiscal years)
$450,000
Source: Hannon et al 2013.
a The Central Valley Project Improvement Act of 1992 (CVPIA) created a collaboration of agencies, including the
Department of the Interior, USBR, and U.S. Fish and Wildlife Service in collaboration with state and local
governments, tribes and stakeholders.
b Costs provided represent the requested funding for fiscal year 2015–2016. Costs represent the amount being cost-
shared between the state and federal agencies involved in implementing the CVPIA.
c The adaptive management cost is intended for building a model and assembling information to develop model
parameters for identifying restoration actions and monitoring priorities for the American River Project.
Enhanced In-Channel Complexity
The costs for enhancing in-channel complexity through the installation of cover structures, boulder
structures and log structures depend primarily on the size of the stream, channel hydrology,
complexity of the design, site accessibility, cost of materials, and equipment needed to transport and
install the material. One of the primary costs associated with enhancing in-channel complexity is
that cost for large woody materials (e.g., logs), which is highly dependent on the type of tree
selected. For example, Washington Douglas Fir is $100 per 1,000 board feet (ft), whereas the cost for
California Redwood is about $510 for the same amount. The National Resources Conservation
Services cost share practice standard estimates that the material cost for large woody material
ranges between approximately $1,900 per acre and $924 per acre (Guhin and Hayes 2015). The
range in approximate costs (low–high) based on stream size is shown in Table 20.3.7-2.

State Water Resources Control Board California Environmental Protection Agency
Economic Analyses
Evaluation of San Joaquin River Flow and Southern Delta Water Quality Objectives and Implementation
20-82 September 2016
ICF 00427.11
Table 20.3.7-2. Engineered Log Structures and Large Woody Debris—Cost Estimates
Stream Size (cfs) Costa ($ Thousands) (Low–High)
Small stream (1–100) 10–40
Medium stream (101–2000) 20–70
Large stream (2000+) 10–80
Source: Thomson and Pinkerton 2008.
cfs = cubic feet per second
a Estimates identified above include construction, design, permitting, basic monitoring and routine maintenance (up
to 2 years), reestablishing site to prior conditions and project management costs. These estimates assume
purchased materials.
As part of the Lower Mokelumne River Joint Settlement Agreement (JSA) between East Bay
Municipal Utilities District, the USFWS and CDFW, $25,663 in funding to the University of California,
Davis was approved in 2008 to conduct a study along the Lower Mokelumne River to determine the
effectiveness of large woody materials in aiding fish habitat. The project consisted of placing 542
large wood pieces along 4.8 miles on the Lower Mokelumne River directly below the Camanche Dam
where the flows averaged 350 cfs.
Improve Temperature Conditions
Cost information concerning actions to improve temperature conditions, such as installation or
modification of selective withdrawal structures, is limited. One factor that substantially affects the
cost is construction. Examples of the costs of temperature improvement projects include the
following.
The Lake Natoma Temperature Curtains Pilot Project estimated the cost to be $1,960,196 for a
3-year study that included the installation of 2 curtains (one 700-ft long with a depth of 15-20 ft,
second curtain 600-ft long with a depth of 20–25 ft). The costs associated with this pilot project
included: design, permitting and environmental review, project management, temperature
monitoring, project installation and removal, and project analysis and reporting.
A temperature curtain was installed at Whiskeytown Lake in 2011 for a cost of $3 million. The
new temperature curtain replaced a curtain from 1993 that had deteriorated and was no longer
functional. The temperature curtain is 2,400 ft long and drops into the lake 110-ft and is
anticipated to achieve a 2–4 degree drop in water temperature.
Fish Screens (Screen Unscreened Diversions in Tributaries and Lower San Joaquin River)
The costs for fish screens vary considerably depending on the size of the existing intake. Typically,
screening smaller or private intakes that primarily serve agricultural uses are less costly as
compared to the costs for screening large intake projects that primarily serve municipal and
industrial uses. Agricultural diversions (with an average diversion rate of 10 cfs) have an estimated
cost of $75,000 per diversion (unit cost of $7,500/cfs). Capital costs for agricultural diversion
screens in the western United States can range between $3,000 and $20,000 per cfs, with
maintenance and operations costs ranging between $3,000 and $5,000 per year.

State Water Resources Control Board California Environmental Protection Agency
Economic Analyses
Evaluation of San Joaquin River Flow and Southern Delta Water Quality Objectives and Implementation
20-83 September 2016
ICF 00427.11
The Anadromous Fish Screen Program (AFSP) established under the CVPIA has funded several fish
screen projects in California. Recent projects include the following.
Natomas Mutual Sankey Fish Screen Project (total cost of about $46.0 million) located off the left
bank of the Sacramento River replaced existing unscreened diversions with a consolidated 434
cfs fish screen and intake facility.
RD2035/Woodland Davis Clean Water Agency Joint Intake and Fish Screen (estimated cost of
$44 Million) located off the right bank of the Sacramento River replacing unscreened diversion
with a consolidated 400 cfs fish screen and intake facility to provide water to irrigate
approximately 15,000 acres of crops and serve the cities of Davis, Woodland, and the University
of California, Davis campus.
Another large municipal intake in the Central Valley that has been screened is the Davis Ranches
Fish Screen Project, located in Colusa County at river mile 132.5. This fish screen consists of
installing a self-cleaning, cylindrical, brushed intake fish screen with a retrieving system. The cost
for this project is an estimated $414,900, which includes planning, design, project management,
construction, installation, and monitoring. Table 20.3.7-3 provides a more detailed breakdown of
the costs for the Davis Ranches Fish Screen Project.
Table 20.3.7-3. Design and Construction Costs for Davis Ranches Site 2, Pumps 4 & 5 Project
Cost Category Davis Ranches Site 2, Pumps 4 & 5a ($)
Design & Construction of fish screen 310,964
Eng. Review, Inspection & documentation, permit costs 24,000
Accounting & project management & monitoring 79,940
Total 414,904
Source: Griffith 2001.
a Costs represent the total costs over 2 years.
Physical Barrier in the Southern Delta
A permanent operable barrier (gate) at the Head of Old River (HOR) is currently proposed as part of
the California WaterFix to prevent out-migrating salmonids from entering Old River in the spring
and improve adult passage conditions and water quality (dissolved oxygen) in the SJR (particularly
the Stockton Deep Water Ship Channel) in the fall. DWR (2015) produced a report in response to
requirements of the NMFS 2009 Biological Opinion on the long-term operations of the CVP and SWP,
discussing engineering solutions to reduce diversion of emigrating salmonids. This report discusses
the potential engineering solutions for HOR and four other areas in the Delta. The permanent,
operable HOR gate is estimated to cost $43,200,000 for construction and $200,000 for operation and
maintenance.
Predatory Fish Control
Predatory fish control can be accomplished through direct removal, or by the
elimination/modification of habitat conducive to predators. Direct removal of predators is generally
less expensive than the elimination/modification of habitat, as described below.

State Water Resources Control Board California Environmental Protection Agency
Economic Analyses
Evaluation of San Joaquin River Flow and Southern Delta Water Quality Objectives and Implementation
20-84 September 2016
ICF 00427.11
No long-term predator removal programs are in effect in the Delta; however, such programs have
been implemented in rivers located in the western U.S. One example is the Upper Colorado
Endangered Fish Recovery Program (Recovery Program), which was established in 1988 and is a
partnership of local, state, and federal agencies, water and power interests, and environmental
groups working to recover endangered fish in the Upper Colorado River. The Recovery Program
implements long-term nonnative fish management by removing the most problematic nonnative
fish predators from rivers. Among the nonnative fish management projects funded within the
Recovery Program are the middle Yampa River northern pike and smallmouth bass removal and
evaluation project; and the removal of smallmouth bass in the Upper Colorado River between Price-
Stubb Dam near Palisade, Colorado and Westwater, Utah project. The total annual cost of each
project from 2010 to 2015 ranged between $157,000 and $214,000.
The costs of habitat modification projects designed to reduce predator habitat in the Delta and
upstream tributaries have been estimated as part of several recovery programs including: the
Golden Gate Salmon Association Salmon Rebuilding Plan, the NMFS Final Recovery Plan (Recovery
Plan), the Tuolumne River Corridor Restoration Plan, and the San Francisco Estuary Project 2007
Comprehensive Conservation and Management Plan. The costs of these projects are influenced by
site-specific conditions and depend on the extent of modifications needed. Costs can vary from
$100,000–$300,000 per site for reducing predator habitat at large screen structures, to more than
$4.6 million for filling a gravel pit to reduce/eliminate habitat favored by predatory bass species,
and replacing with high quality chinook salmon habitat. On a broader scale, the costs associated
with Recovery Plan implementation projects designed to minimize predation at weirs, diversions,
and related structures in the Delta are about $50 million over a period of 50 years.
Invasive Aquatic Vegetation Species Control
The California Department of Boating and Waterways (DBW) implements an Aquatic Weed Control
Program, which includes a program to control water hyacinth. Established in 1982, the California
state legislature designated DBW as the lead state agency to cooperate with other state, local, and
federal agencies in controlling water hyacinth in the Delta, its tributaries, and Suisun Marsh. The
total annual cost of DBW’s Aquatic Weed Control Program for the years of 2001 through 2007 was
between $6.2 and $7.9 million.
20.4 Southern Delta Consistent with requirements in Water Code Section 13241, this section presents results from
evaluating potential costs of compliance with salinity water quality objectives in the southern Delta.
Potential effects on ratepayers and the regional economy resulting from higher treatment costs also
are considered.
20.4.1 Costs of Methods of Compliance
This section includes a summary of information presented in Chapter 16, Evaluation of Other
Indirect and Additional Actions, on the costs for WWTPs to comply with salinity objectives in the
southern Delta. Because the actual methods of compliance ultimately used are necessarily site- and
discharge-specific, only general estimates of compliance costs can be developed for this assessment;
as such, this section presents cost ranges. A more precise evaluation of the actual costs is neither

State Water Resources Control Board California Environmental Protection Agency
Economic Analyses
Evaluation of San Joaquin River Flow and Southern Delta Water Quality Objectives and Implementation
20-85 September 2016
ICF 00427.11
required in this plan-level analysis, nor is it feasible without specific information about projects that
would be selected by project proponents as they move toward compliance.
As discussed in Chapter 16 and in Chapter 13, Service Providers, compliance costs in the southern
Delta would be attributable to complying with NPDES based on salinity objectives that could be
developed and applied to WWTP dischargers as a result of implementing the southern Delta water
quality (SDWQ) alternatives. The Cities of Tracy and Stockton and Mountain House CSD may need to
modify wastewater treatment processes or domestic water supply cycles to comply with SDWQ
Alternative 2 and those service providers, plus the City of Manteca, may need to modify treatment
processes to comply with the No Project Alternative (LSJR Alternative 1 and SDWQ Alternative 1).
The following three methods of compliance, which are not intended to be limiting but rather as a
sampling of methods available during different stages of the domestic water supply cycle or
wastewater treatment cycle, are considered the most likely methods to be implemented by WWTPs
to comply with potential NPDES.
Developing new source water supplies. By reducing reliance on highly saline groundwater for
potable water demand, salinity discharged to the southern Delta would decrease.
Implement salinity pretreatment programs. Target salinity loading in the sewer collection
systems by removing water softeners and reducing salinity discharged to the sewer collection
system from commercial, industrial, or institutional dischargers.
Desalination at the WWTP. Remove salts at the WWTP to improve treated water quality and
meet waste discharge permit limits.
Additionally, under the program of implementation for SDWQ Alternatives 2 or 3, agricultural
dischargers may implement agricultural return flow salinity controls, such as changing the timing of
current releases of discharges into the southern Delta. Furthermore, SDWQ Alternatives 2 or 3 could
require additional studies of circulation and monitoring of water levels in the southern Delta.
Additional studies and monitoring may indicate the continued need for modifying the temporary
barriers in the southern Delta. Alternatively, under the program of implementation for SDWQ
Alternatives 2 or 3, the State Water Board may determine that installing low-lift pumping stations at
the temporary barriers is feasible. These potential costs of these additional methods of compliance
are described below.
New Source Water Supplies
Water supplies with high salinity content can contribute to elevated salinity discharges to the
southern Delta. Generally, water purveyors in the plan area (e.g., the Cities of Stockton, Tracy,
Manteca, and Modesto) rely on a combination of surface water and groundwater to meet potable
water demand. Groundwater is typically more saline than surface water in the SJR Basin.
One method to reduce salinity discharges is to use more high quality water (i.e., surface water) to
meet water demands. To obtain more surface water, a water purveyor may need to enlarge existing
structures (water intake, treatment facility, and pipelines and pumps), or build new structures.
One comparable project is the Davis-Woodland Water Supply Project (DWWSP). The DWWSP will
construct a surface water intake, water treatment plant, pump stations, storage tanks, and
associated transmission lines to develop 45,000 AF/y of new, high quality water resources on the
Sacramento River. The DWWSP is in the construction phase, which began in April 2014, and is

State Water Resources Control Board California Environmental Protection Agency
Economic Analyses
Evaluation of San Joaquin River Flow and Southern Delta Water Quality Objectives and Implementation
20-86 September 2016
ICF 00427.11
estimated to be completed in September 2016. The estimated project costs are detailed in Table
20.4.1-1.
A second comparable project is the Delta Water Supply Project (DWSP), which is being completed by
the City of Stockton and will divert water pursuant to Water Code, Section 1485. Water Code,
Section 1485 allows any municipality disposing of treated wastewater into the SJR to seek a water
right to divert a like amount of water, less losses, from the river downstream of the point of its
wastewater discharge. The DWSP will develop 33,600 AF/y of new water resources in the Delta. A
new surface water intake, water treatment plant, pump stations, and pipelines have been
constructed. The estimated costs for this project are also detailed in Table 20.4.1-1.
Table 20.4.1-1. Design and Construction Costs for the Davis-Woodland Water Supply Project and Delta Water Supply Project
Cost Category DWWSP (millions) DWSP (millions)
Design and Construct Intake $15.6 $22.3
Design and Construct Treatment Facilities and Pipelines
$236.9 $176.6
Project Administrationa $33.1 $14.2
Other Local Costsb $51.4 $21.6
Total $337 $234.7
Source: Price pers. comm.
Note: All costs in 2010 dollars.
DWWSP = Davis-Woodland Water Supply Project
DWSP = Delta Water Supply Project
a Project Administration includes environmental and construction permitting, land acquisitions, rights of way, pre-
design, agency administration and contingency, program management, water rights permits, and water supply
acquisition.
b Other Local Costs includes costs to the water purveyor not included in the project, but necessary to integrate the
project into the existing infrastructure.
Based on the estimated costs of these two projects, the planning, design, management, and
construction of facilities needed to develop 33,600 AF/y (DWSP) and 45,000 AF/y (DWWSP) of new
surface water resources in the Delta would be an estimated $337 million and $234.7 million,
respectively. These examples of costs for developing new water supplies do not represent potential
total costs if all water purveyors in the southern Delta portion of the plan area were to develop new,
higher-quality water supplies. To potentially offset or reduce total project costs, the regional water
boards (e.g., Central Valley Regional Water Board) and the California Department of Public Health
offer grants and low-interest financing.
Salinity Pretreatment Programs
A salinity pretreatment program would target salinity loading from domestic (residential) and
industrial and commercial sources in a wastewater service provider’s wastewater collection system.
It would provide salinity source controls at different locations within a service district to reduce the
overall salt loading into the sewer system.

State Water Resources Control Board California Environmental Protection Agency
Economic Analyses
Evaluation of San Joaquin River Flow and Southern Delta Water Quality Objectives and Implementation
20-87 September 2016
ICF 00427.11
Domestic water similar to that found in the southern Delta may have a high concentration of
minerals (typically magnesium and calcium). Water softeners are frequently used in residences to
remove these minerals. During a water softener’s recharge cycle, brine is used to clean the system
and remove magnesium and calcium that accumulate in the mineral exchange tank. The recharge
water, with suspended minerals, is then discharged to the wastewater collection system. This
brine15 and mineral solution is rarely treated at a wastewater treatment facility. By removing self-
regenerating (or “automatic”) water softeners and reducing salinity discharged to the wastewater
collection system, salinity in the southern Delta would be expected to be reduced. Many wastewater
treatment agencies operate a water softener buy-back program to remove water softeners from
domestic use.
Salts also can enter the wastewater collection system as a byproduct of commercial activities,
industrial processes, and food preparation activities, which can contribute to elevated salt loads
entering the wastewater collection system and discharging into the southern Delta. Some
commercial and industrial sources of salinity are commercial laundry facilities, food processing
operations, and industrial fabrication shops. To address salinity loading by commercial and
industrial dischargers, many wastewater treatment agencies prohibit commercial and industrial
users from discharging to the wastewater collection system or strictly regulate the quality of
wastewater entering the wastewater collection system. To improve the water quality of commercial
and industrial dischargers, a variety of pollution-control methods can be used, such as best
management practices (BMPs) and desalination devices, depending on the activities conducted by
the commercial and industrial discharger. These methods are typically applied at the industrial or
commercial business generating the wastewater.
Many wastewater treatment agencies offer rebate programs for removal of water softeners.
Currently, the Inland Empire Utilities Agency (IEUA), and the Los Angeles County Sanitation
Districts (LACSD) offer $206–$2,000 to homeowners to remove water softeners. Rules for each
agency’s programs differ, but in general, once a homeowner certifies that the water softener is
removed (and it is later verified by the wastewater treatment agency), the wastewater treatment
agency will reimburse the homeowner for the cost of removal.
If a wastewater treatment agency anticipates replacing 2,000 water softeners over 5 years, the
agency can reasonably expect to pay between $928,600 and $9,015,400 over a period of 5 years
($185,720–$1,803,080 per year). If a commercial and industrial discharger decides to install a
desalination device, costs would vary based on what is being discharged, the volume, and the
desired water quality entering the wastewater collection system. For example, some light
commercial reverse osmosis (RO) filtration systems cost as little as $1,000 to install and $200 per
year to operate.
Desalination
Some wastewater treatment agencies may opt to remove salts at the WWTP before treated effluent
is discharged to the southern Delta. Conventional wastewater treatment processes do not
significantly remove salts from the wastewater treatment stream. To remove salts, a discharger
must desalinate treated wastewater effluent. Methods to desalinate water at WWTPs include
thermal separation, electro-dialysis, and RO. RO is analyzed here because it is the most common
15 Brine is the saline solution prevented from traveling through an RO filter.

State Water Resources Control Board California Environmental Protection Agency
Economic Analyses
Evaluation of San Joaquin River Flow and Southern Delta Water Quality Objectives and Implementation
20-88 September 2016
ICF 00427.11
desalination technology in California and is comparable or less expensive than other desalination
methods (e.g., ion exchange, distillation).
The costs of RO include the costs associated with constructing the RO facilities and operating and
maintaining facilities associated with energy and brine disposal. Brine’s salinity is a function of the
quality and volume of the influent into the RO filter and the efficiency of the RO filter. For example, if
the influent water had 75,000 pounds of salt per 10 million gallons per day, and the RO filter was 85
percent efficient, the brine would contain 75,000 pounds of salt per 1.5 million gallons of RO filter
reject water (or a 5 percent saline brine solution).
The cost to install a desalination system at a WWTP is highly variable. Important factors include: the
quality and quantity of water entering the desalination system, the desired water quality leaving the
desalination system, energy costs, the chosen method of desalination, and the brine disposal
method. Some WWTPs only would need to treat a portion of the influent wastewater to achieve
effluent limitations for salinity, which would reduce costs.
DWR’s California Water Plan Update 2009 discusses the costs of desalination, which are
summarized in Table 20.4.1-2.
Table 20.4.1-2. California Water Plan Update 2009 Unit Cost of Desalination
Type of Desalting
Total Water Cost ($/AF)
Low High
Groundwater 500 900
Wastewater 500 2,000
Seawater 1,000 2,500
Source: Chapter 16, Evaluation of Other Indirect and Additional Actions, Table 16-29.
AF = acre-feet.
Using the unit cost approximations in Table 20.4.1-2, a 10 million-gallon-per-day discharger could
expect to pay between $5 and $22 million to construct an RO system at a WWTP. The unit cost for
constructing and operating different desalination systems are not linear, however, because the
associated administrative, engineering, and legal costs do not generally decrease for smaller
projects. Larger RO facilities cost more, but the typical unit price of water produced decreases due to
the scale of construction costs compared to administrative, engineering, and legal costs.
Agricultural Return Flow Salinity Control
Real-time management of agricultural return flow, such as changing the timing of the release of
agricultural discharge to receiving waters, is the potential method of compliance for agricultural
water users that must comply with numeric salinity objectives. This method may reduce salinity
entering the southern Delta.
Agricultural dischargers could monitor receiving water’s assimilative capacity on a real-time basis,
and time discharges to coincide with periods of high flow (i.e., more assimilative capacity). This
potential method of compliance with proposed salinity standards would require dischargers to
establish a network of monitoring stations and a discharge schedule. When there is no assimilative
capacity, irrigators would either recycle water that would otherwise be discharged or would
discharge to a detention pond until discharges to the receiving waters are permitted. This method of

State Water Resources Control Board California Environmental Protection Agency
Economic Analyses
Evaluation of San Joaquin River Flow and Southern Delta Water Quality Objectives and Implementation
20-89 September 2016
ICF 00427.11
compliance could be integrated with other BMPs (such as water recycling or use of evaporation
ponds) to reduce salinity entering the plan area.
Enhanced monitoring equipment, modeling, and forecasting capability would be needed to forecast
assimilative capacity in the LSJR. Control gates and conveyance systems would also be needed to
divert drainage from river discharge to permanent treatment structures when assimilative capacity
is not available. Personnel would be needed to manage real-time systems and coordinate discharges
from multiple subareas in the LSJR Watershed. It is assumed that there would be multiple subareas
within the plan area that would manage discharges in real time, creating a real-time monitoring
system. Table 20.4.1-3 estimates the components needed and costs associated with constructing a
real-time management system.
Table 20.4.1-3. Costs and Components of a Real-Time Management System
Construction
Computer and Software $5,000
Control Gates (10) $100,000
Floats, Weirs, and EC Monitoring Equipment $50,000
Installation of Monitoring Components $75,000
Conveyance to River $100,000
Subtotal $330,000
Contingency (30%) $99,000
Total Construction Cost $429,000
Operations and Maintenance
Operations and Maintenance (Including Coordinating Discharges)
$100,000 per year
Source: Chapter 16, Evaluation of Other Indirect and Additional Actions, Table 16-31.
EC = electrical conductivity (salinity).
In this document, EC is electrical conductivity, which is generally expressed in deciSiemens per meter
(dS/m). Measurement of EC is a widely accepted indirect method to determine the salinity of water, which
is the concentration of dissolved salts (often expressed in parts per thousand or parts per million).
Based on the costs identified in Table 20.4.1-3, the total estimated construction cost for 11 systems
to cover the plan area is $4,719,000, with an operations and maintenance budget of $1,100,000 per
year. This cost is in addition to the costs to construct and operate temporary detention ponds.
Southern Delta Temporary Barriers
The program of implementation for the SDWQ alternatives requires continued operations of the
agricultural barriers at Grant Line Canal, Middle River, and Old River at Tracy, or other reasonable
measures, to address the impacts of the CVP or SWP export operations on water levels and flow
conditions that might affect salinity. The existing temporary barriers would likely to continue to
operate in the southern Delta under the program of implementation. The purpose of operating the
temporary barriers is to protect salmon migrating through the Delta and provide an adequate
agricultural water supply in terms of quantity, quality and channel water levels to meet the
reasonable and beneficial needs of water users in the southern Delta area. The program is operated
by DWR, which also takes actions to protect agricultural diversions that do not benefit from the

State Water Resources Control Board California Environmental Protection Agency
Economic Analyses
Evaluation of San Joaquin River Flow and Southern Delta Water Quality Objectives and Implementation
20-90 September 2016
ICF 00427.11
adverse effects of operations of the barriers. As described in Chapter 16, Evaluation of Other Indirect
and Additional Actions, the program consists of four rock barriers across southern Delta channels
that primarily benefit migrating fish or agricultural water users. DWR posts a standing schedule for
the operation of the barriers.
According to DWR, water levels and water circulation in the southern Delta have improved since
installation of the agricultural barriers. Migration conditions for salmon have improved since the
HOR barrier was installed. As such, DWR determined it is essential to continue barrier installations.
As indicated in Chapter 16, DWR recently awarded a contract to construct and remove the
temporary rock barriers, including other related construction activities for approximately $7.5
million; this cost does not include preparation of environmental studies.
Low-Lift Pumping Stations
The program of implementation for the SDWQ alternatives requires additional studies and
monitoring of the southern Delta circulation and water levels. It is possible that additional study and
monitoring would determine the need for modifying the existing South Delta Temporary Barriers
Project. If this determination is made by the State Water Board, DWR may be required to install low
lift pumping stations at the temporary barriers as a method of compliance.
As described in Chapter 16, Evaluation of Other Indirect and Additional Actions, a cost and
environmental evaluation was prepared by DWR in 2011 for the Low-Head Pumping Conceptual
Plan that identifies installation of either permanent or temporary pumps at the southern Delta
temporary barriers. Estimated cost ranges were based on different site layout configurations. The
site layout that would provide the greatest reduction in water quality violations is a two-pumping
site alternative with 1,000 cfs combined pumping capacity at Middle and Old River barriers. The
capital cost of this layout is estimated to range from $55.5–$540.7 million, and annual operation and
maintenance costs are estimated to range from $4.5–$62.7 million.
20.4.2 Effects on Ratepayers and the Regional Economy
As discussed more fully in Chapter 13, Service Providers, existing WWTPs are point source
dischargers of salt into the southern Delta, influencing the southern Delta salinity. The following
WWTPs,16 all of which are required to comply with effluent limitations established by the NPDES
permits, discharge into the southern Delta. These WWTPs, their NPDES wastewater discharge
permit order numbers, and their receiving water bodies are identified in Table 13-7 in Chapter 13.
City of Tracy WWTP: 16 mgd permitted discharge.
Manteca Wastewater Quality Control Facility: 17.5 mgd permitted discharge.
16 As discussed in Chapter 13, Service Providers, while Discovery Bay Community Services District (CSD) is very close to the southern Delta, it is not expected to result in any modifications or new construction to its facility. This is because of the large dilution in Old River and the good quality water in Old River coming down from the Sacramento River (Marshall pers. comm. 2012). Therefore, the Central Valley Water Board has determined the discharge from Discovery Bay CSD does not have reasonable potential to cause or contribute to an exceedance of the Bay-Delta water quality objectives in Old River (Marshall pers. comm. 2012). Thus, they can comply with the water quality objectives and do not need effluent limits based on the Bay-Delta water quality objectives (Marshall pers. comm. 2012). Accordingly, Discovery Bay CSD is not further included in the analysis.

State Water Resources Control Board California Environmental Protection Agency
Economic Analyses
Evaluation of San Joaquin River Flow and Southern Delta Water Quality Objectives and Implementation
20-91 September 2016
ICF 00427.11
Stockton Regional Wastewater Control Facility: 55 mgd permitted discharge.
Mountain House CSD WWTP: 5.4 mgd permitted discharge.
Ratepayer Effects
Costs to WWTP operators to comply with NPDES permit discharge limitations could result in rate
increases for utility ratepayers. Assessing how sewer utility rates could be affected by compliance
with salinity objectives is complicated by several uncertainties. To assess potential ratepayer
impacts, the specific actions to be taken by each wastewater treatment agency to meet salinity
objectives must be determined. As discussed previously, the decision that each discharger might
make could include some or all of the following actions: (1) developing new surface water supplies,
(2) developing and enforcing a salinity pretreatment program, and/or (3) developing desalination
processes at WWTPs. These decisions, which have different cost implications, would be made by
individual wastewater treatment agencies based on numerous considerations, including the needs
of their service districts, availability of surface water and land, and specific operation of their
wastewater facilities. Regional Water Boards are precluded from specifying the manner of
compliance under Water Code Section 13360, so each wastewater treatment agency must choose for
itself the appropriate mix of actions to meet its discharge requirements.
Once individual wastewater treatment agencies have decided on the proper combination of salinity
control measures and the design and scale of the actions, the costs to implement an agency’s
compliance program to address salinity objectives under each SDWQ alternative would become
apparent. Without knowing which actions an agency would take as part of its compliance strategy,
estimating compliance costs is not feasible. However, once total costs associated with the
compliance actions have been estimated, each individual agency would need to determine how these
costs would be recovered (e.g., increasing utility rates for customers)
For example, as described in the City of Manteca’s Draft Sewer Rate Study (2008), sewer rates for
ratepayers are determined based on a systematic analysis of the contribution of sewerage made by
different land uses and of the costs required to collect and treat sewer influent. The allocation of
collection and treatment costs between customer categories is based on a combination of estimated
usage and actual sewer influent. Sewer expenditures generally include the following categories.
Collection operating and maintenance costs.
Treatment operating and maintenance costs.
Debt service (existing and projected).
Capital replacement.
Depreciation.
Operating reserves/contingency.
Once the collection and treatment costs are allocated to the different customer categories, rates are
determined by dividing the allocated costs by the number of users in each category. Customer
categories generally include residential, commercial, industrial, and public users.
The southern Delta dischargers that could be affected by the SDWQ salinity alternatives are
communities that, to varying extents, serve a mix of residential, commercial, and industrial users,
with service area populations ranging from the relatively small residential community of Mountain

State Water Resources Control Board California Environmental Protection Agency
Economic Analyses
Evaluation of San Joaquin River Flow and Southern Delta Water Quality Objectives and Implementation
20-92 September 2016
ICF 00427.11
House (population 10,000) to the relatively large urban service area of the Stockton Regional
Wastewater Control Facility (population 280,000). For each wastewater treatment agency, potential
rate increases attributable to compliance with salinity objectives would be spread among user
groups depending on each group’s contribution to sewer system influent. Generally, rates for each
user group could be expected to increase similar to the percentage increase in wastewater
treatment agency budgets to achieve salinity objectives under the SDWQ alternatives, as described
below.
No Project Alternative (LSJR/SDWQ Alternative 1)
Under existing conditions, the following existing wastewater treatment plant dischargers (service
providers), meet amended NPDES permit requirements or are currently exempted from
requirements, as described in Section 13.2.3, Southern Delta, of Chapter 13, Service Providers: the
City of Tracy, the City of Stockton, the City of Manteca and Mountain House CSD. Two possible
scenarios could occur under the No Project Alternative for these providers: no change to NPDES
permits or a change. If, under the No Project, there would be no change to the NPDES permits the No
Project Alternative would not cause the need for expansion of existing facilities or infrastructure and
would not cause significant environmental effects. However, if the litigation in City of Tracy v.
California State Water Resources Control Board is resolved in a manner that allows for the
application of the Delta salinity objectives to municipal wastewater dischargers, existing wastewater
treatment plant dischargers, such as the City of Tracy, the City of Stockton, the City of Manteca, and
Mountain House CSD would likely be unable to meet the current 2006 Bay-Delta Plan salinity
objective of 0.7 dS/m from April to August based on current effluent discharge concentrations and
past violations (Tables 13-8, 13-9, and 13-20). City of Tracy, City of Stockton, and Mountain House
CSD would also likely not meet the current 2006 Bay-Delta Plan salinity objective of 1.0 dS/m from
September – March (Tables 13-8, 13-9, and 13-20. Therefore, it is expected that these wastewater
treatment providers would potentially exceed wastewater treatment requirements during some
parts of the year such that new wastewater treatment facilities, or expansion of existing facilities or
infrastructure could result, the construction or operation of which could result in increased costs to
ratepayers.
SDWQ Alternative 2
As discussed in Chapter 13, Service Providers, the City of Tracy, the City of Stockton, and Mountain
House CSD would not be expected to meet the salinity objectives under SDWQ Alternative 2. As such,
SDWQ Alternative 2 is anticipated to require or result in the construction of new water or
wastewater treatment facilities or expansion of existing facilities, the construction or operation of
which could result in increased costs to ratepayers.
SDWQ Alternative 3
As discussed in Chapter 13, Service Providers, all of the WWTPs would be expected to comply with
the SDWQ Alternative 3 without new or modified facilities. Consequently, there would be no effects
on ratepayers.
Regional Economic Effects
Although the amount that sewer rates could increase in response to expenditures by wastewater
treatment agencies to achieve salinity objectives under SDWQ Alternative 2 is uncertain, any

State Water Resources Control Board California Environmental Protection Agency
Economic Analyses
Evaluation of San Joaquin River Flow and Southern Delta Water Quality Objectives and Implementation
20-93 September 2016
ICF 00427.11
increase in sewer utility rates could shift a portion of the spending by residential ratepayers from
purchases of consumer goods and services to monthly sewer utility bills. From the perspective of the
regional economy of the southern Delta region, this shift, while somewhat speculative and not
anticipated to be a large percentage of overall consumer spending in the region, could result in
relatively small reductions in sales, employment, and income in consumer-serving sectors of the
regional economy, such as retail stores and consumer-service businesses. Similarly, increases in
sewer utility rates for commercial and industrial ratepayers could shift business spending from
wages, supplies, and services to expenditures on higher sewer utility bills. This shift in spending
could result in slightly higher prices for goods and services provided by commercial and industrial
businesses, and potential reductions in employment by affected businesses. In both cases,
reductions in consumer and business spending on goods and services could have ripple effects
throughout the regional economy. These effects would be concentrated within the service areas of
the City of Tracy, the City of Stockton, and Mountain House CSD, which are potentially affected by
the SDWQ Alternative 2 and the City of Tracy, the City of Stockton, the City of Manteca, and Mountain
House CSD, which could potentially be affected by the No Project Alternative.
To some extent, the adverse effects on the regional economy would be offset by increased
employment generated by wastewater treatment agencies as these agencies spend to construct and
operate facilities, and to establish and operate programs to achieve salinity objectives under the
alternatives. These agencies and its employees would contribute to economic activity in the regional
economy, directly and indirectly generating sales, employment, and income in businesses that
provide good and services in the region.
The net change in regional economic activity from potentially higher sewer utility rates and from
increased agency spending is not anticipated to be substantial because changes would largely
represent regional shifts in sales, employment, and income rather than overall reductions in
regional economic activity.
20.5 References Cited
20.5.1 Printed References
Bay Area Water Supply and Conservation Agency (BAWSCA). 2012. Annual Survey Fiscal Year 2010-
2011. May 2012.
Boydstun, L.B. 2001. Ocean Salmon Fishery Management. Contributions to the Biology of Central
Valley Salmonids 2: 183-196.
California Department of Fish and Game (CDFG). 2001a. Central Valley Salmon and Steelhead Harvest
Monitoring Project. 1999 Angler Survey. March. Prepared by Kyle Murphy, Larry Hanson, Mike
Harris, and Tom Schroyer.
———. 2001b. Central Valley Salmon and Steelhead Harvest Monitoring Project. 2000 Angler Survey.
July. Prepared by Kyle Murphy, Tom Schroyer, Mike Harris, and Duane Massa.
California Dapartment of Fish and Wildlife (CDFW). 2012. Recovery of Coded-Wire Tags from Chinook
Salmon in California’s Central Valley Escapement and Ocean Harvest in 2010. Prepared by B.
Kormos, M. Palmer-Zwahlen, and A. Low. Fisheries Branch Administrative Report 2012-02.
March 2012.

State Water Resources Control Board California Environmental Protection Agency
Economic Analyses
Evaluation of San Joaquin River Flow and Southern Delta Water Quality Objectives and Implementation
20-94 September 2016
ICF 00427.11
———. 2013. Recovery of Coded-Wire Tags from Chinook Salmon in California’s Central Valley
Escapement and Coean Harvest in 2011. Prepared by M. Palmer-Zwahlen and B. Kormos.
Fisheries Branch Administrative Report 2013-02. December 2013.
———. 2014. Central Valley Chinook Salmon Population Assessment. Available at:
<https://www.dfg.ca.gov/fish/Resources/Chinook/CValleyAssessment.asp>. Accessed: August
5, 2014.
———. 2015. Recovery of Coded-Wire Tags from Chinook Salmon in California’s Central Valley
Escapement and Coean Harvest in 2012. Prepared by M. Palmer-Zwahlen and B. Kormos.
Fisheries Administrative Report 2015-4. November 2015.
California Department of Water Resources (DWR). 2010. Final State Water Project Delivery
Reliability Report, 2009. September 27. Bay-Delta Office. Available:
http://baydeltaoffice.water.ca.gov/swpreliability/. Accessed: August 23, 2012.
———. 2011. Low Head Pump Salinity Control Study – Prepared to Meet Requirements of the State of
California State Water Resources Control Board Water Rights Order WR 2010-0002, Condition A.7.
———. 2015. Engineering Solutions to Further Reduce Diversion of Emigrating Juvenile Salmonids to
the Interior and Southern Delta and Reduce Exposure to CVP and SWP Export Facilities—Phase II
Recommended Solutions Report. March. Prepared in response to the National Marine Fisheries
Service 2009 Biological Opinion and Conference Opinion on the Long-Term Operations of the
Central Valley Project and State Water Project, Reasonable and Prudent Alternative Action
IV.1.3.
California Energy Commission. 2012. California Electricity Statistics & Data. Available:
http://energyalmanac.ca.gov/electricity/index.html. Accessed: April 16.
Carlson, M.C. and Satterthwaite, W.H. 2011. Weakened portfolio effect in a collapsed salmon
population complex. Berkeley, CA. Can. J. Fish. Aquat. Sci. 68: 1579-1589.
CH2M Hill. 2012. Draft Agricultural Economics Technical Appendix. Available:
http://www.water.ca.gov/economics/downloads/Models/SWAP_TechAppendix_080612_Draft.
pdf.
City of Manteca. 2008. Draft Sewer Rate Study. September 25. Prepared by ECO:LOGIC, Rocklin, CA.
Prepared for the City of Manteca.
Gallo, D. E. 2002. The Economic Impact on Stanislaus County of Public Land Acquisitions and
Conservation Easements on Floodplain Lands along the Lower Tuolumne and San Joaquin Rivers –
Revised Draft Report. December. U.S. Fish and Wildlife Service Project Number 1933FR02.
Griffith, Dan. 2001. Davis Ranches- Site 2 Pumps 4 & 5 Fish Screen Project. Prepared for CALFED
Anadromous Funding. Available:
https://www.google.com/url?sa=t&rct=j&q=&esrc=s&source=web&cd=3&ved=0ahUKEwiL9P_
L0bvMAhUG9WMKHRYcDfUQFggrMAI&url=https%3A%2F%2Fnrm.dfg.ca.gov%2FFileHandler.
ashx%3FDocumentID%3D5528&usg=AFQjCNHyGRd9RZ3iuEU1JXQXdtyYzfM_UA&bvm=bv.121
070826,d.cGc
Hanemann, M. W. 2005. Rebuttal Expert Report of Professor W. Michael. Case No. Civ-S-88-1658
LKK/GGH.

State Water Resources Control Board California Environmental Protection Agency
Economic Analyses
Evaluation of San Joaquin River Flow and Southern Delta Water Quality Objectives and Implementation
20-95 September 2016
ICF 00427.11
Hannon, J., J. Zimmerman, T. Kisanuki, P. Bratcher, M. Healey, and P. Brantley. 2013. Draft CVPIA
Fiscal Year 2014 Annual Work Plan – Spawning and Rearing Habitat Restoration CVPIA Section
3406 (b) (13). Available:
http://www.usbr.gov/mp/cvpia/docs_reports/awp/2014/docs/gravel_all.pdf
Jones & Stokes Associates, Inc. 1990. Environmental benefits of San Joaquin Valley’s fish and wildlife
resources. (JSA87-150) Sacramento, CA. Prepared by J.B. Loomis, W.M. Hanemann, and T.C.
Wegge.
Kantor, S. 2012. The Economic Benefits of the San Joaquin River Restoration. September 2012.
Langdon-Pollock, J. 2004. West Coast Marine Fishing Community Descriptions. Prepared for the
Pacific States Marine Fisheries Commission, Economic Fisheries Information Network, Portland,
OR. Available at: <
http://www.psmfc.org/efin/docs/communities_2004/communities_entirereport.pdf>.
Accessed: August 5, 2014.
Loomis, J. 1996. Measuring the Economic Benefits of Removing Dams and Restoring the Elwha River:
Results of a Contingent Valuation Survey. Water Resources Research. Vol. (32), pps. 441-447.
February 2006.
McAfee, K.D. 2000. Post-Audit of New Melones Dam, Central Valley Project, Stanislaus River,
California. Oakland, CA. Thesis submitted to the faculty of San Francisco State University.
M-Cubed. 2015. Economic Impact Analysis: Executive Order B-29-15. State of Emergency Due to Severe
Drought Conditions. May. Prepared for the California State Water Resources Control Board.
Merced Irrigation District (Merced ID). 2014. Merced River Hydroelectric Project, FERC Project No.
2179-043 Transmittal of Amended License Application. Merced, CA. April 2014.
Merz, J.E. and Moyle, P.B. 2006. Salmon, wildlife, and wine: marine-derived nutrients in human-
dominated ecosystems of central California.
Michael, J. 2010. Employment Impacts of California Salmon Fishery Closures in 2008 and 2009.
University of the Pacific, Business Forecasting Center. Available at:
<http://forecast.pacific.edu/BFC%20salmon%20jobs.pdf> . Accessed: December 4, 2013.
Modesto Irrigation District (MID). 2013. Budget Book. Available:
http://www.mid.org/a2bout/budget/13/2013_Budget_Book.pdf. Accessed: January 5, 2016.
———. 2015a. Draft Agricultural Water Management Plan 2015. Accessed: January 22, 2016.
Available: http://www.mid.org/water/irrigation/documents/MID2015AWMPFinal.pdf.
———. 2015b. Irrigation Rates as of March 24, 2015. Available:
http://www.mid.org/water/irrigation/allocation.html. Accessed: January 5, 2016.
Modesto Irrigation District (MID) and City of Modesto. 2005. Amended and Restated Treatment and
Delivery Agreement Between MID and City of Modesto. Available:
http://www.mid.org/water/domestic/documents/ARTDA.pdf. Accessed: January 5, 2016.
Moody’s Investors Service (MIS). 2014. California Drought Dries Up Agriculture, but Tax Revenues
Keep Flowing. May 20. Accessed February 17, 2016. Available:
http://media.bizj.us/view/img/2725581/moodys-ca-drought-agriculture-report.pdf.

State Water Resources Control Board California Environmental Protection Agency
Economic Analyses
Evaluation of San Joaquin River Flow and Southern Delta Water Quality Objectives and Implementation
20-96 September 2016
ICF 00427.11
Morse, H., and N. Manji. 2009. A Thousand Tiny Wounds. Outdoor California, July – August 2009 pps.
6-13. Available at: <https://nrm.dfg.ca.gov/FileHandler.ashx?DocumentID=16162>. Accessed:
December 4, 2013.
National Marine Fisheries Service (NMFS). 2014. Fisheries Economics of the United States, 2012. U.S.
Dept. Commerce, NOAA Tech. Memo. NMFS-F/SPO-137, 175 p. Available at:
https://www.st.nmfs.noaa.gov/st5/publication/index.html.
Norman, K., J. Sepez, H. Lazrus, N. Milne, C. Package, S. Russell, K. Grant, R.P. Lewis, J. Primo, E.
Springer, M. Styles, B. Tilt, and I. Vaccaro. 2007. Community profiles for West Coast and North
Pacific fisheries–Washington, Oregon, California, and other U.S. states. NOAA Technical
Memorandum NMFS-NWFSC-85. Prepared for the National Marine Fisheries Service. Available
at: <
http://www.nwfsc.noaa.gov/assets/25/499_01082008_153910_CommunityProfilesTM85WebF
inalSA.pdf?CFID=42276454&CFTOKEN=63301802&jsessionid=84305b35fa51a6fd47313e5427
82c415c03>. Accessed: August 5, 2014.
Olsen, D., J. Richards, and R.D. Scott. 1991. Existence and Sport Values for Doubling the Size of the
Columbia River Basin Salmon and Steelhead Runs. Rivers 2, No.1, 1991, pps. 44-56. January 1991.
Pacific Fishery Management Council. 1997. Review of 1996 Ocean Salmon Fisheries, Table IV-2.
Available at: <http://www.pcouncil.org/salmon/stock-assessment-and-fishery-evaluation-safe-
documents/review-of-1996-ocean-salmon-fisheries/>. Accessed: December 10, 2013.
———. 2009. Review of 2008 Ocean Salmon Fisheries. Available at: <
http://www.pcouncil.org/salmon/stock-assessment-and-fishery-evaluation-safe-
documents/review-of-2008-ocean-salmon-fisheries/>. Accessed: August 4, 2014.
———. 2010. Review of 2009 Ocean Salmon Fisheries. Available at: <
http://www.pcouncil.org/salmon/stock-assessment-and-fishery-evaluation-safe-
documents/review-of-2009-ocean-salmon-fisheries/>. Accessed: August 4, 2014.
———. 2013. Ocean Salmon Fishery Effort and Landings, Tables A-3 and A-5. Excel tables. Available
at: <http://www.pcouncil.org/salmon/background/document-library/historical-data-of-ocean-
salmon-fisheries/>. Accessed: December 3, 2013.
———. 2014. Review of 2013 Ocean Salmon Fisheries, Tables A-3 and A-5. Available at:
<http://www.pcouncil.org/salmon/stock-assessment-and-fishery-evaluation-safe-
documents/review-of-2013-ocean-salmon-fisheries/>. Accessed: August 4, 2014.
———. 2015. Review of 2014 Ocean Salmon Fisheries, Tables A-3 and A-5. Available at:
http://www.pcouncil.org/salmon/stock-assessment-and-fishery-evaluation-safe-
documents/review-of-2014-ocean-salmon-fisheries/. Accessed: June 22, 2016.
Pomeroy, C., C. J. Thomson, and M. M. Stevens. 2010. California's North Coast Fishing Communities
Historical Perspective and Recent Trends. Final Report to the California Coastal Conservancy,
Award 06-128. California Sea Grant Program, Scripps Institution of Oceanography, University of
California, San Diego, CA. Available at:
<http://www.psmfc.org/efin/docs/otherpublications/CA_NCoastFCP.pdf<. Accessed: August, 4,
2014.
State Water Resources Control Board California Environmental Protection Agency
Economic Analyses
Evaluation of San Joaquin River Flow and Southern Delta Water Quality Objectives and Implementation
20-97 September 2016
ICF 00427.11
RTI International. 2012. Klamath River Basin Restoration Nonuse Value Survey. Final Report. RTI
Project Number 0212485.001.010. Research Triangle Park, NC. January 19, 2012.
San Francisco Public Utilities Commission (SFPUC). 2011a. 2010 Urban Water Management Plan for
the City and County of San Francisco. San Francisco, CA. Available:
http://www.sfwater.org/index.aspx?page=75. Accessed: February 27, 2014.
Schwarzenegger, A., T. R. Kulongoski, and C. O. Gregoire. 2008 Governors Of California, Washington
And Oregon Request Emergency Appropriations To Address Economic Emergency From Salmon
Fisheries Closure. Available at: <http://gov.ca.gov/news.php?id=9383>. Accessed: December 4,
2013.
Shilling, R., A. Negrette, L. Biondini, S. Cardenas. 2014. A Report for the State Water Resources
Control Board and the US Environmental Protection Agency. Agreement # 11-146-250 between
SWRCB and UC Davis.
South San Joaquin Irrigation District (SSJID). 2015a. Agricultural Water Management Plan. Available:
http://www.ssjid.com/assets/pdf/2015-Ag-Water-Management-Plan.pdf. Accessed: January 22,
2016.
———. 2015b. Resolution 15-09-5 to Reaffirm Charges for Services Furnished by the District.
Available: http://www.ssjid.com/assets/pdf/minutes/101315.pdf. Accessed: January 5, 2016.
State Water Resources Control Board (State Water Board). 2016. Californians Save 1.19 Million
Acre-Feet of Water, Enough to Supply Nearly 6 Million People for a Year. Media Release. April 4,
2016. Available:
http://www.waterboards.ca.gov/water_issues/programs/conservation_portal/docs/2016apr/
pr4416_feb_conservation.pdf.
Stockton East Water District (SEWD). 2014. Water Management Plan. January. Available:
http://www.water.ca.gov/wateruseefficiency/sb7/docs/2014/plans/Stockton-
Eeast_WD_WMP-Final_012014.pdf. Accessed: January 5, 2016.
Sunding, David. 2014. Socioeconomic Impacts of Water Shortages within the Hetch Hetchy Regional
Water System Service Area. Draft Report. Prepared for the San Francisco Public Utilities
Commission. The Brattle Group, Inc. San Francisco, CA.
Thomson, C. J., and C. Pinkerton. 2008. Habitat Restoration Cost References For Salmon Recovery
Planning. U.S. Dep. Commer., NOAA Tech. Memo. MNFS-SWFSC-425, 75 p.
http://www.westcoast.fisheries.noaa.gov/publications/recovery_planning/salmon_steelhead/d
omains/california_central_valley/appendix_d_-_hab_restoration_costs_tech_memo_7-10-
2014.pdf
Turlock Irrigation District (TID) and Modesto Irrigation District (MID). 2013. Recreation Facility
Condition and Public Accessibility Assessment, and Recreation Use Assessment. December. Don
Pedro Project, FERC NO. 2299. Prepared by HDR Engineering, Inc. Prepared for Turlock
Irrigation District and Modesto Irrigation District.
U.S. Bureau of Reclamation (USBR). 1999. Meeting Flow Objectives for the San Joaquin River
Agreement 1999–2010 Environmental Impact Statement and Environmental Impact Report.
Final. CA. Available: http://www.sjrg.org/EIR/contents.htm. Accessed: January 12, 2012.

State Water Resources Control Board California Environmental Protection Agency
Economic Analyses
Evaluation of San Joaquin River Flow and Southern Delta Water Quality Objectives and Implementation
20-98 September 2016
ICF 00427.11
———. 2001. Additional Water for the San Joaquin River Agreement, 2001–2010 Supplemental
EIS/EIR. Final. CA. Available: http://www.sjrg.org/EIR/supplemental/sup_contents.htm.
Accessed: January 13, 2012.
———. 2011. Planning Your Visit. Last revised: March 25. Available:
http://www.usbr.gov/mp/ccao/newmelones/planning_visit.html. Accessed: December 1.
Whittaker, D., and B. Shelby. 2003. Flow Assessment for Recreation, Pit 3, 4, and 5 Hydroelectric
Project (FERC No. 233). January. Confluence Research and Consulting, Corvallis, OR.
20.5.2 Personal Communications
Price, Melissa. Project Manager. City of Stockton Delta Water Supply Project. Stockton, CA. April 23,
2012.
Marshall, Jim. Senior Water Resources Control Engineer. Central Valley Regional Water Quality
Control Board (Central Valley Water Board), CA. August 15, 2012—comments re: draft of
Chapter 13 Service Provider.