Embed Size (px)
Citation preview
Deer Creek Watershed Management Plan
Chapter 2 – Watershed Data Inventory
Page 2‐1
CHAPTER 2 – WATERSHED DATA INVENTORY
2.1 WATERSHED DESCRIPTION
Deer Creek is an urban stream in St. Louis County and western St. Louis and is a tributary to River des
Peres. Deer Creek is identified in the Missouri Use Designation Dataset as water body identification
number, or WBID, 3826. Deer Creek originates in north central Creve Coeur south of State Highway
340 and flows southeast for approximately 17.3 km (10.75 mi) before entering the River des Peres in
St. Louis. The Deer Creek watershed drains approximately 95.3 km2 (36.8 mi2).
The major
contributing streams
within the watershed
are Deer Creek,
stream order 4;
Twomile Creek,
stream order 3;
Sebago Creek, stream
order 2; Shady Grove
Creek, stream order
2; and Black Creek,
stream order 3. Black
Creek is identified in
the Missouri Use
Designation Dataset
as water body
identification (WBID)
3825. Black Creek
originates in north
Ladue and flows south for 9.0 km (5.6 mi) until it joins Deer Creek forming the municipal boundary
between the cities of Brentwood and Maplewood (Map 2‐1). For several miles above Twomile
Creek, Deer Creek is a third order stream. In a 1993 report from the Litzsinger Ecology Center (LREC),
which is located five miles upstream from the confluence with River Des Peres, Deer Creek is
described as perennial stream although in “mid‐ summer when precipitation is least and evapo‐
transpiration is highest” it may experience only intermittent pools. (Ochs, 1992).
The lower 1.6 miles of both Deer Creek and Black Creek have been identified as impaired (Map 2‐1).
Summary statistics have been developed for the Deer Creek watershed, of which Black Creek is a
subwatershed, and are presented in the TMDL report, which was approved June 26, 2019. 1
1 Appendix 2‐A Bacteria TMDL pg. 2
Map 2‐1: The Deer Creek Watershed in St. Louis County
Deer Creek Watershed Management Plan
Chapter 2 – Watershed Data Inventory
Page 2‐2
2.2 TERRAIN
2.21 GEOLOGY
Deer Creek watershed is a portion of the larger Cahokia‐Joachim subbasin, identified by the 8‐digit
hydrologic unit code, or HUC, 07140101, which in addition to Missouri, lies within portions of Illinois.
The Missouri portion of the Cahokia‐Joachim subbasin is located within the Apple/Joachim ecological
drainage unit (MoRAP 2005). Ecological drainage units are groups of watersheds that have similar
biota, geography and climate
characteristics (USGS 2009).
The characteristics of an
ecological drainage unit are
varied and are partially based
on the ecoregions that are
contained within the drainage
unit. Ecoregions are areas
with similar ecosystems and
environmental resources.7 A
level I ecoregion is a coarse,
broad category, while a level
IV is a more defined grouping.
The Deer Creek watershed is
contained entirely within the
River Hills ecoregion. This area
is a transition zone between
the Central Irregular Plains
and the Ozark Highlands. Key
characteristic features of the
River Hills are loess‐covered
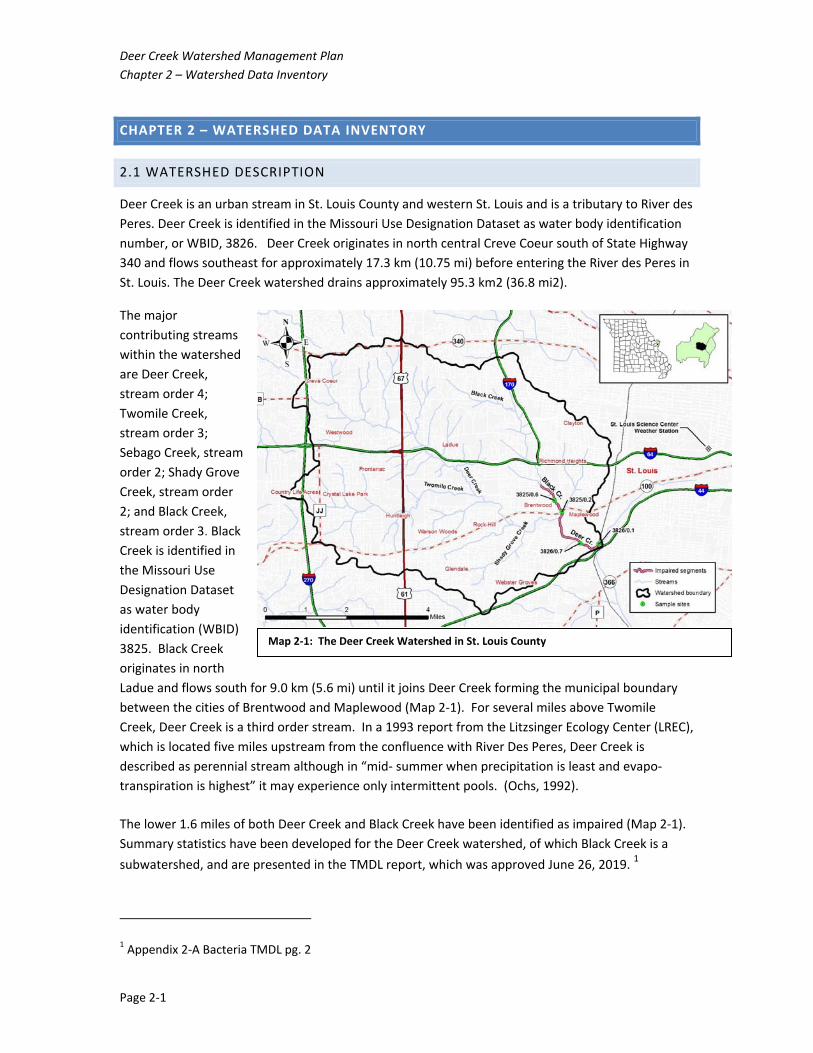
hills and numerous karst features (Chapman et al. 2002). Karst features in the Deer Creek watershed
include 147 sinkholes (MoDNR 2014 and Map 2‐2). 2
2.22 SOILS
SOIL GROUPS
Table 2‐1 provides a summary of hydrologic soil groups in the Deer Creek watershed. Hydrologic soil
groups categorize soils by their runoff potential. A soil’s hydrologic soil group relates to the rate at
which water enters the soil profile under thoroughly wetted, bare soil surface conditions. Group A
represents soils with the highest rate of infiltration and the lowest runoff potential under these
2 Appendix 2‐A Bacterial TMDL pg 3
Map 2‐2 Deer Creek Karst Areas and
Sinkholes
Deer Creek Watershed Management Plan
Chapter 2 – Watershed Data Inventory
Page 2‐3
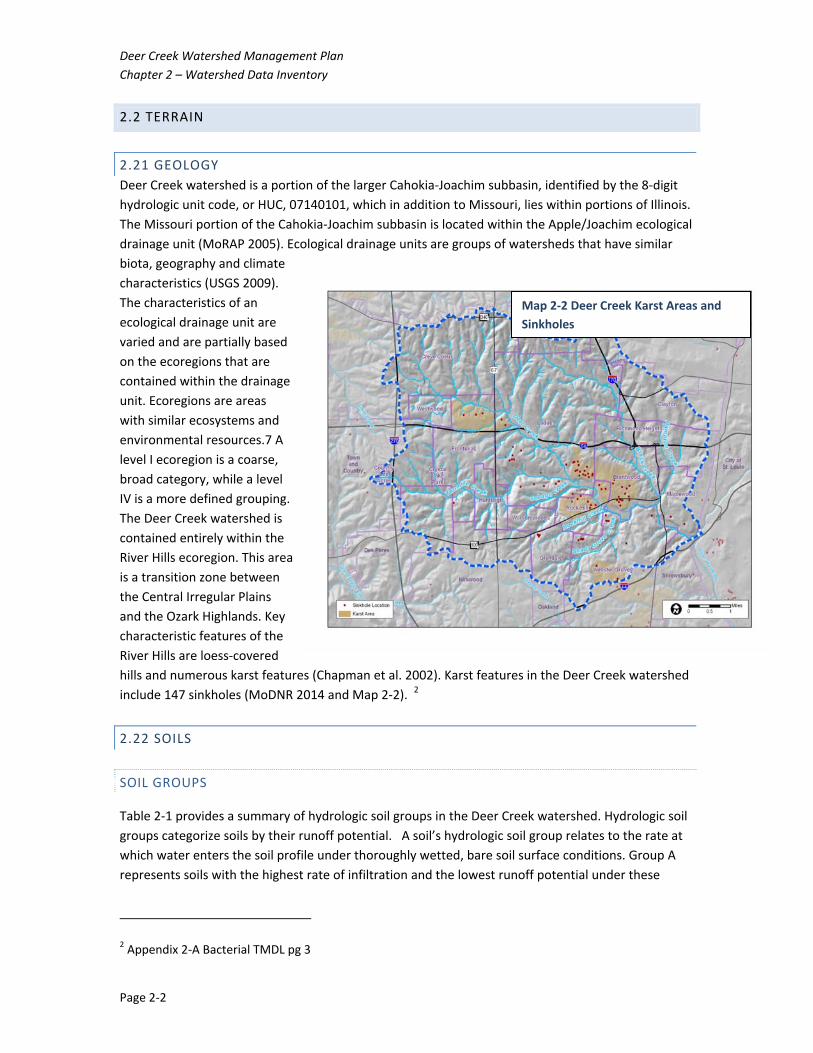
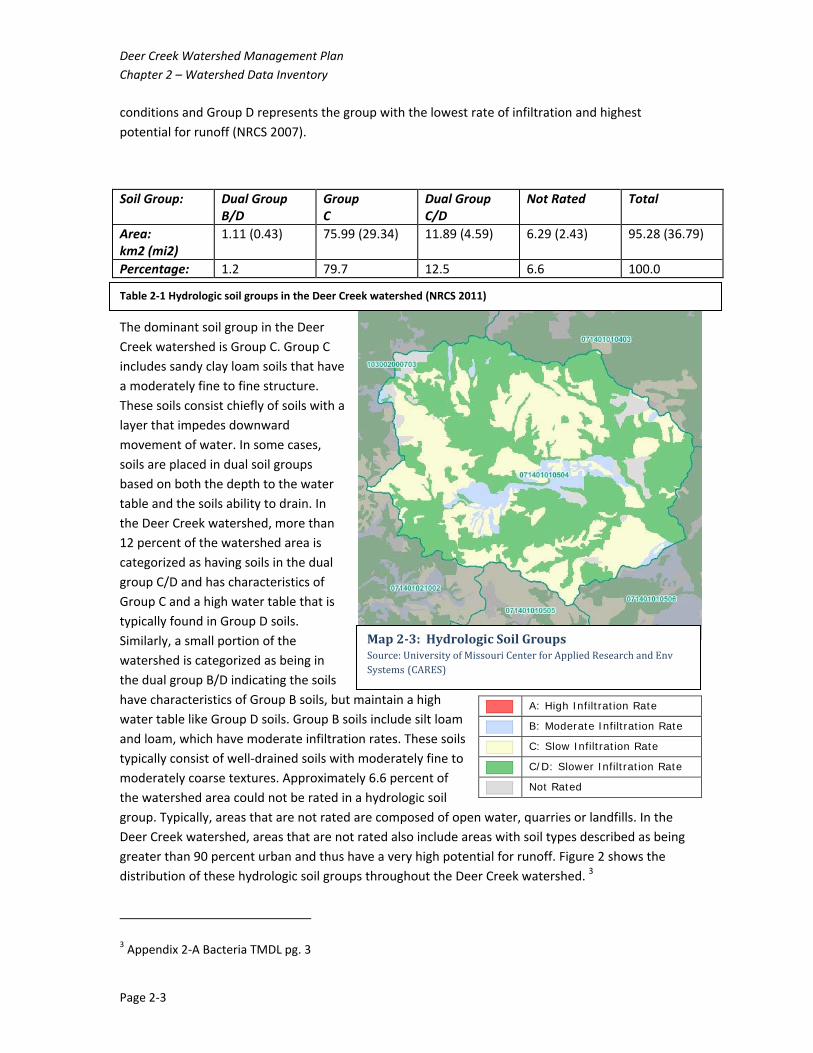
Map2‐3:HydrologicSoilGroupsSource:UniversityofMissouriCenterforAppliedResearchandEnvSystems(CARES)
Table 2‐1 Hydrologic soil groups in the Deer Creek watershed (NRCS 2011)
conditions and Group D represents the group with the lowest rate of infiltration and highest
potential for runoff (NRCS 2007).
Soil Group: Dual Group B/D
Group C
Dual Group C/D
Not Rated Total
Area: km2 (mi2)
1.11 (0.43) 75.99 (29.34) 11.89 (4.59) 6.29 (2.43) 95.28 (36.79)
Percentage: 1.2 79.7 12.5 6.6 100.0
The dominant soil group in the Deer
Creek watershed is Group C. Group C
includes sandy clay loam soils that have
a moderately fine to fine structure.
These soils consist chiefly of soils with a
layer that impedes downward
movement of water. In some cases,
soils are placed in dual soil groups
based on both the depth to the water
table and the soils ability to drain. In
the Deer Creek watershed, more than
12 percent of the watershed area is
categorized as having soils in the dual
group C/D and has characteristics of
Group C and a high water table that is
typically found in Group D soils.
Similarly, a small portion of the
watershed is categorized as being in
the dual group B/D indicating the soils
have characteristics of Group B soils, but maintain a high
water table like Group D soils. Group B soils include silt loam
and loam, which have moderate infiltration rates. These soils
typically consist of well‐drained soils with moderately fine to
moderately coarse textures. Approximately 6.6 percent of
the watershed area could not be rated in a hydrologic soil
group. Typically, areas that are not rated are composed of open water, quarries or landfills. In the
Deer Creek watershed, areas that are not rated also include areas with soil types described as being
greater than 90 percent urban and thus have a very high potential for runoff. Figure 2 shows the
distribution of these hydrologic soil groups throughout the Deer Creek watershed. 3
3 Appendix 2‐A Bacteria TMDL pg. 3
A: High Infiltration Rate
B: Moderate Infiltration Rate
C: Slow Infiltration Rate
C/D: Slower Infiltration Rate
Not Rated
Deer Creek Watershed Management Plan
Chapter 2 – Watershed Data Inventory
Page 2‐4
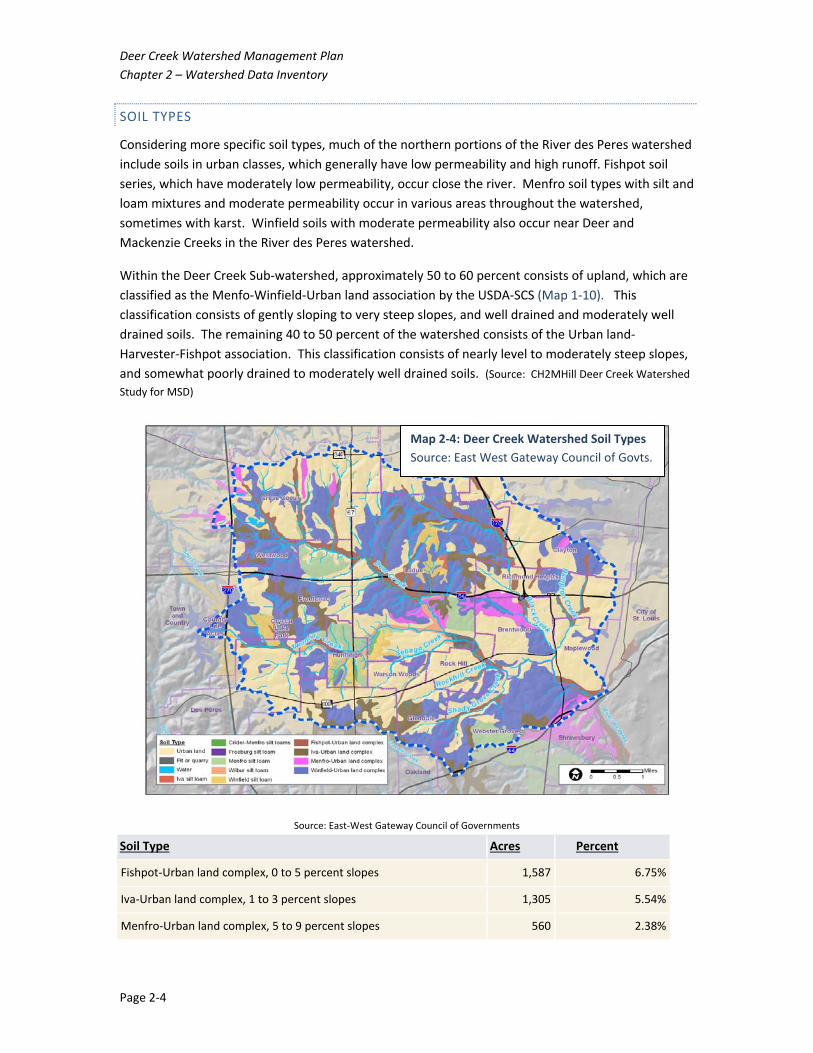
SOIL TYPES
Considering more specific soil types, much of the northern portions of the River des Peres watershed
include soils in urban classes, which generally have low permeability and high runoff. Fishpot soil
series, which have moderately low permeability, occur close the river. Menfro soil types with silt and
loam mixtures and moderate permeability occur in various areas throughout the watershed,
sometimes with karst. Winfield soils with moderate permeability also occur near Deer and
Mackenzie Creeks in the River des Peres watershed.
Within the Deer Creek Sub‐watershed, approximately 50 to 60 percent consists of upland, which are
classified as the Menfo‐Winfield‐Urban land association by the USDA‐SCS (Map 1‐10). This
classification consists of gently sloping to very steep slopes, and well drained and moderately well
drained soils. The remaining 40 to 50 percent of the watershed consists of the Urban land‐
Harvester‐Fishpot association. This classification consists of nearly level to moderately steep slopes,
and somewhat poorly drained to moderately well drained soils. (Source: CH2MHill Deer Creek Watershed
Study for MSD)
Source: East‐West Gateway Council of Governments
Soil Type Acres Percent
Fishpot‐Urban land complex, 0 to 5 percent slopes 1,587 6.75%
Iva‐Urban land complex, 1 to 3 percent slopes 1,305 5.54%
Menfro‐Urban land complex, 5 to 9 percent slopes 560 2.38%
Map 2‐4: Deer Creek Watershed Soil Types
Source: East West Gateway Council of Govts.
Deer Creek Watershed Management Plan
Chapter 2 – Watershed Data Inventory
Page 2‐5
Urban land, bottomland, 0 to 3 percent slopes 545 2.32%
Urban land, upland, 0 to 5 percent slopes 889 3.78%
Urban land‐Harvester complex, 2 to 9 percent slopes 5,394 22.92%
Urban land‐Harvester complex, 9 to 20 percent slopes 2,875 12.22%
Urban land‐Harvester complex, karst, 2 to 9 percent slopes 1,279 5.43%
Wilbur silt loam, 0 to 2 percent slopes, frequently flooded 276 1.17%
Winfield silt loam, 9 to 14 percent slopes, eroded 245 1.04%
Winfield‐Urban land complex, 2 to 5 percent slopes 1,980 8.41%
Winfield‐Urban land complex, 5 to 9 percent slopes 3,654 15.53%
Winfield‐Urban land complex, 9 to 20 percent slopes 1,509 6.41%
Other –individually less than 1.00% 1445 6.10%
Total 23,543 100%
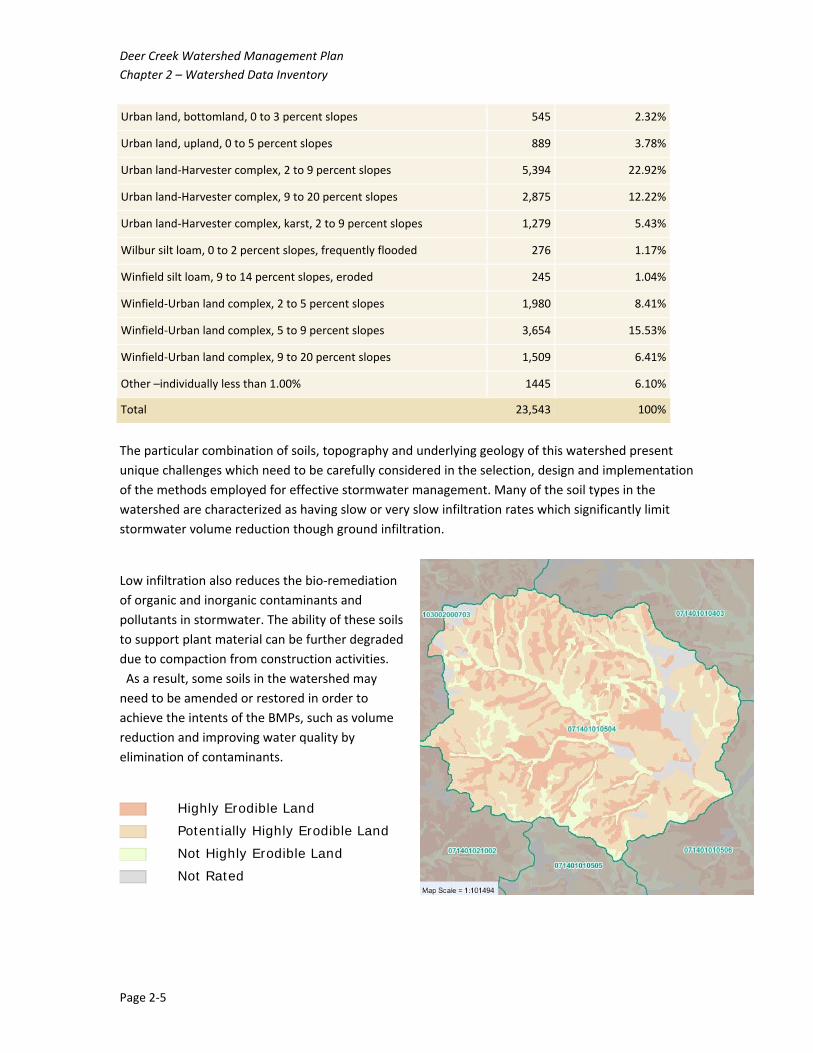
The particular combination of soils, topography and underlying geology of this watershed present
unique challenges which need to be carefully considered in the selection, design and implementation
of the methods employed for effective stormwater management. Many of the soil types in the
watershed are characterized as having slow or very slow infiltration rates which significantly limit
stormwater volume reduction though ground infiltration.
Low infiltration also reduces the bio‐remediation
of organic and inorganic contaminants and
pollutants in stormwater. The ability of these soils
to support plant material can be further degraded
due to compaction from construction activities.
As a result, some soils in the watershed may
need to be amended or restored in order to
achieve the intents of the BMPs, such as volume
reduction and improving water quality by
elimination of contaminants.
Highly Erodible Land
Potentially Highly Erodible Land
Not Highly Erodible Land
Not Rated
Deer Creek Watershed Management Plan
Chapter 2 – Watershed Data Inventory
Page 2‐6
HIGHLY ERODIBLE LANDS
Where steep slopes or pavement can convert 90% of rainfall to runoff, highly erodible land is subject
to erosion and will subsequently deposit this sediment at a point where flow velocity slows. Because
stormwater BMPs are often at a low point or sump, this will be the location where sedimentation will
occur. We need to be aware of the locations of erodible areas in the watershed so that the right
BMP is chosen for these areas. For example, BMPs that utilize infiltration and filtration will likely
require a higher level of maintenance in these areas, and this may impact our suggestion of which
BMP is appropriate for areas downgrade of highly erodible soils. Sediment deposition from soil
erosion is the primary factor in reducing the effectiveness and functionality of stormwater BMPs.
2.23 TOPOGRAPHY
Consideration of slope, infiltration rate, soil composition, erosion potential, underlying geography, contaminant, and sediment loads will influence the location and selection of stormwater BMP methods and their effectiveness, as well as the maintenance required to keep them functioning as intended.
2.24 LAND COVER
Land cover characterization was made using the 2011 National Land Cover Database published by
the U.S. Geological Survey, or USGS (Homer et al. 2015). Land cover calculations are presented in
Table 3 and a map showing the distribution of the various land coverages in the watershed is shown
in Figure 4. As can be seen from this information, the watershed is approximately 99 percent
developed. More than 58 percent of the watershed area is categorized as low intensity development.
Areas of low intensity development have from 20 to 49 percent impervious cover and are composed
primarily of single‐family housing units. Areas of medium intensity development are also composed
of single‐family housing units, but contain from 50 to 79 percent impervious cover. Approximately 8
percent of the watershed area is in the medium intensity development category. About 6 percent of
the watershed area is in high intensity development where impervious cover is 80 to 100 percent.
According to the Metropolitan St. Louis Sewer District, actual imperviousness of the watershed is
approximately 33 percent. This amount of imperviousness in the Deer Creek watershed is significant,
because stream degradation associated with imperviousness has been shown to first occur at about
10 percent imperviousness and to increase in severity as imperviousness increases (Arnold and
Gibbons 1996; Schueler 1994).
Areas of less imperviousness are also found in the watershed, but much of these areas are still
associated with some degree of development. Approximately 26 percent of the watershed area is
developed open space, which is composed primarily of lawn grasses such as those found in parks,
yards, and golf courses, or planted for erosion control and aesthetic purposes. Impervious surfaces in
these area are still common, but account for less than 20 percent of the cover. Vegetated areas that
Deer Creek Watershed Management Plan
Chapter 2 – Watershed Data Inventory
Page 2‐7
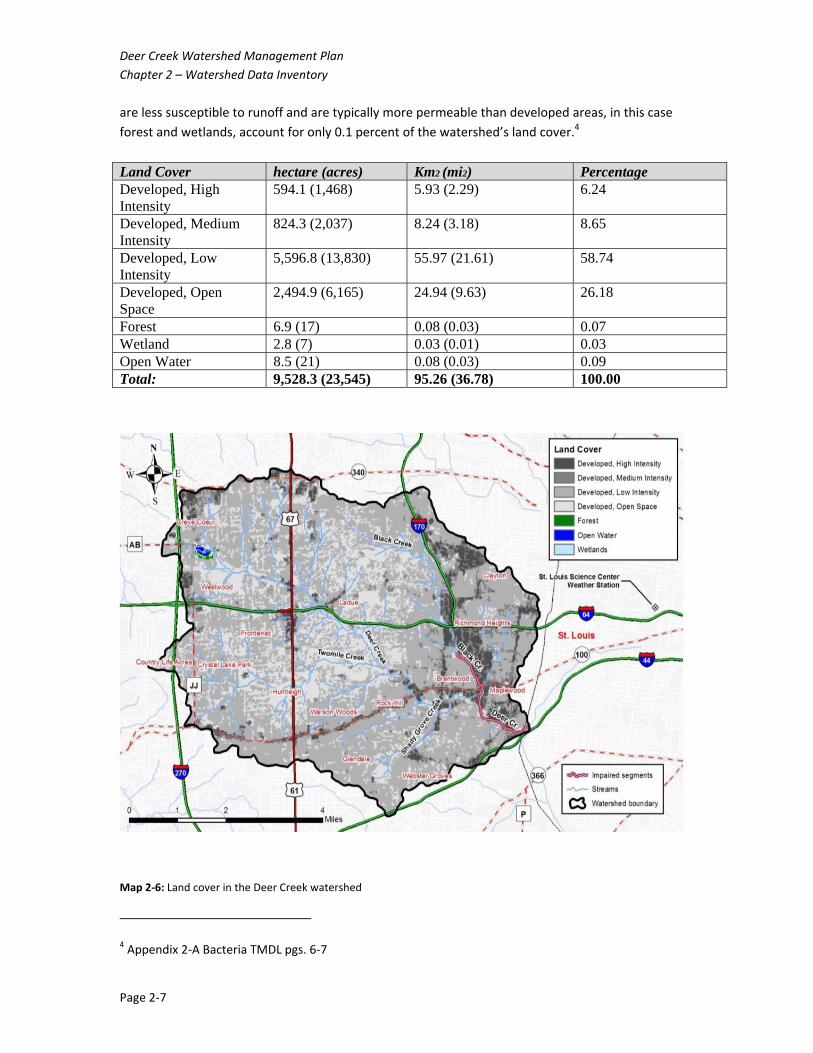
are less susceptible to runoff and are typically more permeable than developed areas, in this case
forest and wetlands, account for only 0.1 percent of the watershed’s land cover.4
Land Cover hectare (acres) Km2 (mi2) Percentage Developed, High Intensity
594.1 (1,468) 5.93 (2.29) 6.24
Developed, Medium Intensity
824.3 (2,037) 8.24 (3.18) 8.65
Developed, Low Intensity
5,596.8 (13,830) 55.97 (21.61) 58.74
Developed, Open Space
2,494.9 (6,165) 24.94 (9.63) 26.18
Forest 6.9 (17) 0.08 (0.03) 0.07 Wetland 2.8 (7) 0.03 (0.01) 0.03 Open Water 8.5 (21) 0.08 (0.03) 0.09 Total: 9,528.3 (23,545) 95.26 (36.78) 100.00
Map 2‐6: Land cover in the Deer Creek watershed
4 Appendix 2‐A Bacteria TMDL pgs. 6‐7
Deer Creek Watershed Management Plan
Chapter 2 – Watershed Data Inventory
Page 2‐8
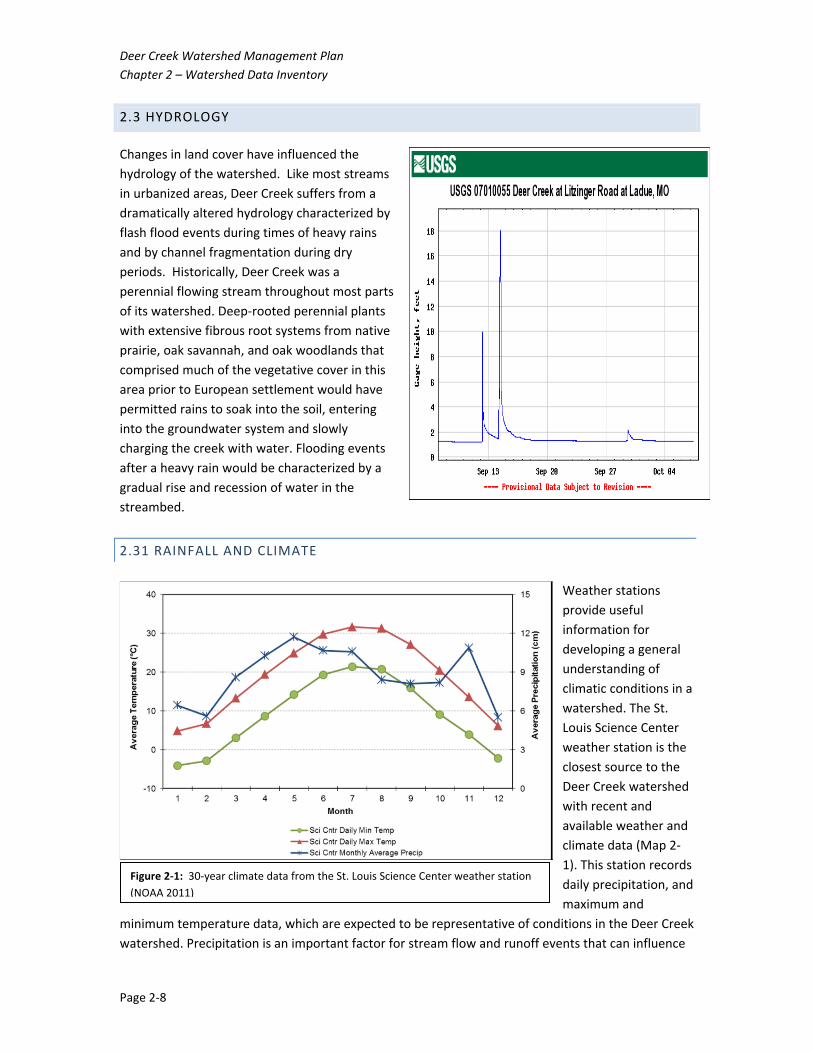
2.3 HYDROLOGY
Changes in land cover have influenced the
hydrology of the watershed. Like most streams
in urbanized areas, Deer Creek suffers from a
dramatically altered hydrology characterized by
flash flood events during times of heavy rains
and by channel fragmentation during dry
periods. Historically, Deer Creek was a
perennial flowing stream throughout most parts
of its watershed. Deep‐rooted perennial plants
with extensive fibrous root systems from native
prairie, oak savannah, and oak woodlands that
comprised much of the vegetative cover in this
area prior to European settlement would have
permitted rains to soak into the soil, entering
into the groundwater system and slowly
charging the creek with water. Flooding events
after a heavy rain would be characterized by a
gradual rise and recession of water in the
streambed.
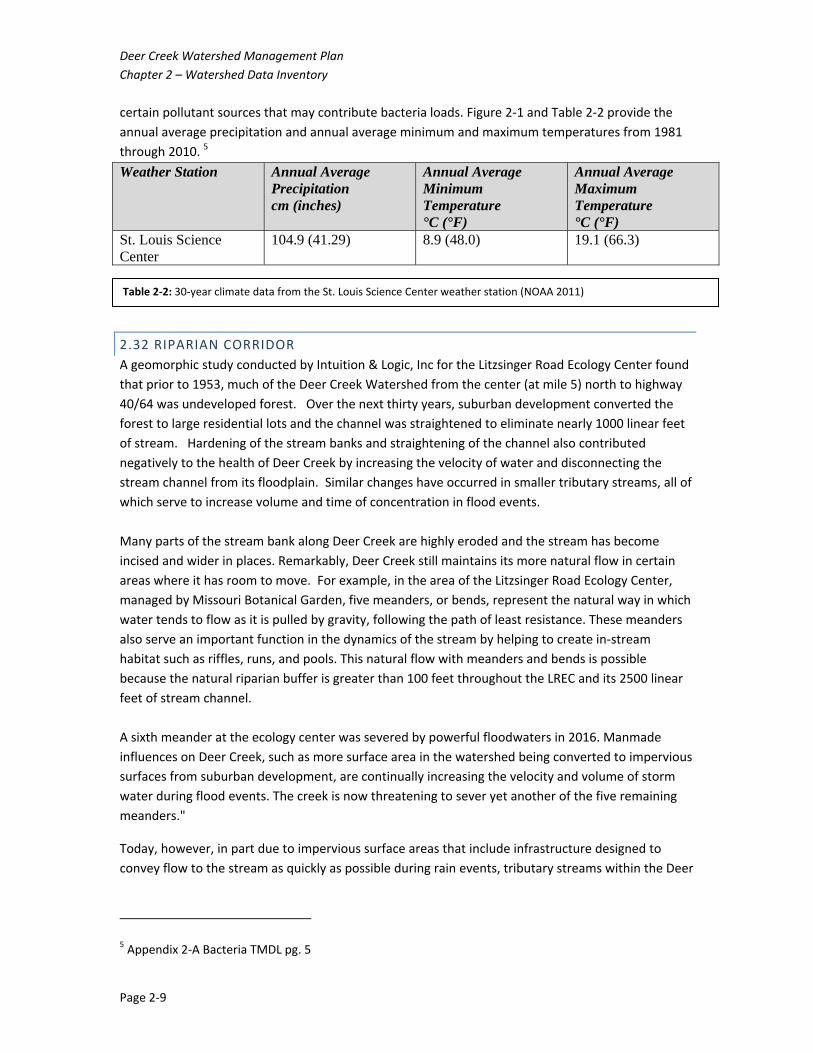
2.31 RAINFALL AND CLIMATE
Weather stations
provide useful
information for
developing a general
understanding of
climatic conditions in a
watershed. The St.
Louis Science Center
weather station is the
closest source to the
Deer Creek watershed
with recent and
available weather and
climate data (Map 2‐
1). This station records
daily precipitation, and
maximum and
minimum temperature data, which are expected to be representative of conditions in the Deer Creek
watershed. Precipitation is an important factor for stream flow and runoff events that can influence
Figure 2‐1: 30‐year climate data from the St. Louis Science Center weather station
(NOAA 2011)
Deer Creek Watershed Management Plan
Chapter 2 – Watershed Data Inventory
Page 2‐9
certain pollutant sources that may contribute bacteria loads. Figure 2‐1 and Table 2‐2 provide the
annual average precipitation and annual average minimum and maximum temperatures from 1981
through 2010. 5
Weather Station Annual Average Precipitation cm (inches)
Annual Average Minimum Temperature °C (°F)
Annual Average Maximum Temperature °C (°F)
St. Louis Science Center
104.9 (41.29) 8.9 (48.0) 19.1 (66.3)
2.32 RIPARIAN CORRIDOR
A geomorphic study conducted by Intuition & Logic, Inc for the Litzsinger Road Ecology Center found
that prior to 1953, much of the Deer Creek Watershed from the center (at mile 5) north to highway
40/64 was undeveloped forest. Over the next thirty years, suburban development converted the
forest to large residential lots and the channel was straightened to eliminate nearly 1000 linear feet
of stream. Hardening of the stream banks and straightening of the channel also contributed
negatively to the health of Deer Creek by increasing the velocity of water and disconnecting the
stream channel from its floodplain. Similar changes have occurred in smaller tributary streams, all of
which serve to increase volume and time of concentration in flood events.
Many parts of the stream bank along Deer Creek are highly eroded and the stream has become
incised and wider in places. Remarkably, Deer Creek still maintains its more natural flow in certain
areas where it has room to move. For example, in the area of the Litzsinger Road Ecology Center,
managed by Missouri Botanical Garden, five meanders, or bends, represent the natural way in which
water tends to flow as it is pulled by gravity, following the path of least resistance. These meanders
also serve an important function in the dynamics of the stream by helping to create in‐stream
habitat such as riffles, runs, and pools. This natural flow with meanders and bends is possible
because the natural riparian buffer is greater than 100 feet throughout the LREC and its 2500 linear
feet of stream channel.
A sixth meander at the ecology center was severed by powerful floodwaters in 2016. Manmade
influences on Deer Creek, such as more surface area in the watershed being converted to impervious
surfaces from suburban development, are continually increasing the velocity and volume of storm
water during flood events. The creek is now threatening to sever yet another of the five remaining
meanders."
Today, however, in part due to impervious surface areas that include infrastructure designed to
convey flow to the stream as quickly as possible during rain events, tributary streams within the Deer
5 Appendix 2‐A Bacteria TMDL pg. 5
Table 2‐2: 30‐year climate data from the St. Louis Science Center weather station (NOAA 2011)
Deer Creek Watershed Management Plan
Chapter 2 – Watershed Data Inventory
Page 2‐10
Creek watershed experience a rapid rise after even a small rain event, and tend to be flashy. The
U.S. Geological Survey stream gaging stations document this rapid rise and fall of stream level (Figure
1‐2 above and Appendix 1A). Currently the stream is forced to transport much larger amounts of
water and sediment through its banks even during small rain events. In large storms, the Creek and
its tributaries flood beyond its banks. Major floods have occurred in Deer Creek on six occasions in
the last half‐century: April 1973, April 1979, July 1991, September 2008, December 2015, and August
2016. In vulnerable areas, flooding is more frequent. For example, stormwater flooding has
inundated the area along Deer Creek between Hanley Road and South Brentwood Boulevard 26
times since 1957.
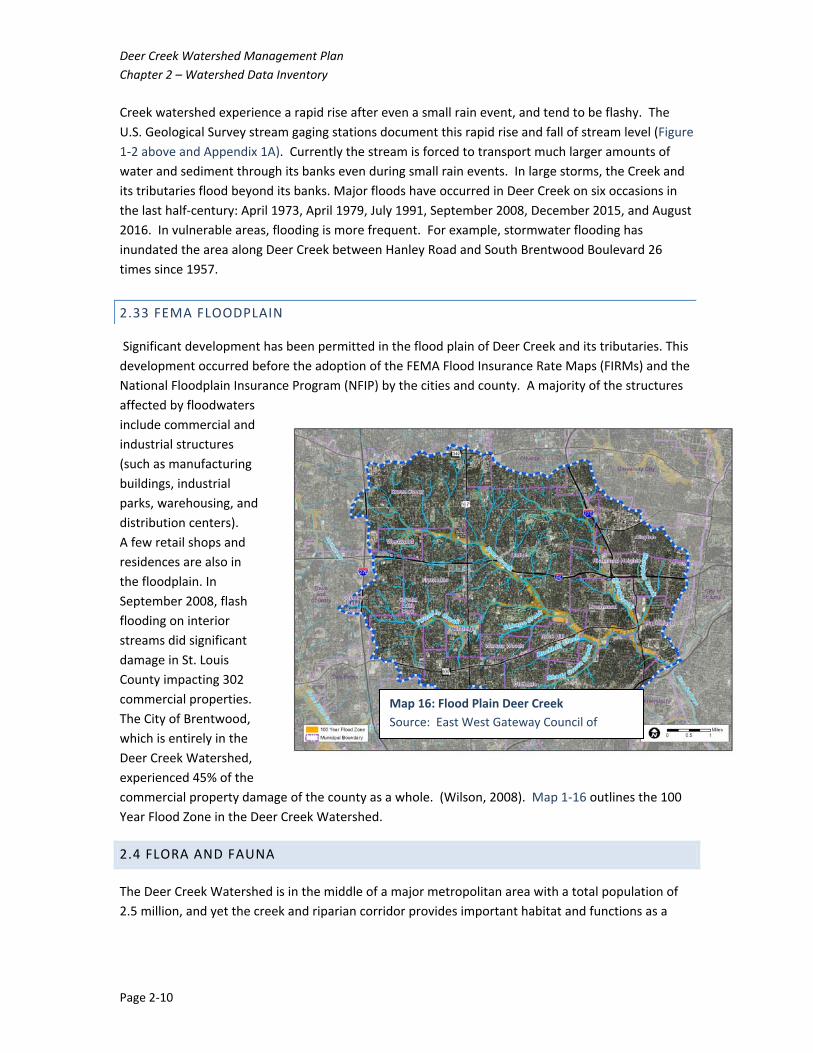
2.33 FEMA FLOODPLAIN
Significant development has been permitted in the flood plain of Deer Creek and its tributaries. This
development occurred before the adoption of the FEMA Flood Insurance Rate Maps (FIRMs) and the
National Floodplain Insurance Program (NFIP) by the cities and county. A majority of the structures
affected by floodwaters
include commercial and
industrial structures
(such as manufacturing
buildings, industrial
parks, warehousing, and
distribution centers).
A few retail shops and
residences are also in
the floodplain. In
September 2008, flash
flooding on interior
streams did significant
damage in St. Louis
County impacting 302
commercial properties.
The City of Brentwood,
which is entirely in the
Deer Creek Watershed,
experienced 45% of the
commercial property damage of the county as a whole. (Wilson, 2008). Map 1‐16 outlines the 100
Year Flood Zone in the Deer Creek Watershed.
2.4 FLORA AND FAUNA
The Deer Creek Watershed is in the middle of a major metropolitan area with a total population of
2.5 million, and yet the creek and riparian corridor provides important habitat and functions as a
Map 16: Flood Plain Deer Creek
Source: East West Gateway Council of
Deer Creek Watershed Management Plan
Chapter 2 – Watershed Data Inventory
Page 2‐11
travel corridor for an assortment of wildlife species such as deer, coyotes, fox, raccoon, mink, great
blue herons, kingfishers, various ducks, turtles, fish, frogs, and macro‐invertebrates.
Although large lots in the central portion of the watershed provide minimally disturbed habitat for
wildlife, many parts of the stream bank, backyards, and other natural areas throughout the
watershed have been overtaken by invasive species of plants, notably bush honeysuckle, which
drives out other plants and reduces the quality of the habitat for birds and mammals.
Large lots in the watershed offer an excellent opportunity for implementing rain gardens, planting
trees, removing invasive species, and other green infrastructure BMP’s to improve water quality by
holding back and removing runoff and the non‐point source pollutants it carries (including E. coli), as
well as reducing the velocity that also contributes to erosion and sedimentation problems.
2.5 DEMOGRAPHIC CHARACTERISTICS
2.51 POLITICAL DEMOGRAPHY
The Deer Creek watershed lies completely within central St. Louis County, (~2,513 persons per
square mile) and includes all or parts of 21 municipalities. The number of municipalities involved in
land management decisions in the watershed complicates watershed planning. The Metropolitan
St. Louis Sewer District (MSD), is recognized as the coordinating authority for the Phase II
stormwater permit, but each of the co‐permittees also has responsibilities under the permit. MSD
operates and maintains a storm water system and administers stormwater regulations and
oversight. The individual cities control planning, zoning, and are the floodplain administrators
among other responsibilities within their boundaries. In addition, Missouri Department of Natural
Resources, U.S. Army Corps of Engineers, Great Rivers Greenway District, East West Gateway Council
of Governments, St. Louis County and St. Louis County Municipal League each have jurisdictional or
regional planning roles in the watershed.
2.52 POPULATION
St. Louis County covers an area of 1,355 km2 (523 mi2) and, according to 2010 census data, has a
population of 999,021 people (U.S. Census Bureau 2010). The population of the Deer Creek
watershed is not directly available; however, using U.S. Census Bureau census block data from 2010,
the population of the Deer Creek watershed is estimated to be approximately 91,007. This
estimation was completed by using Geographic Information System, or GIS, software and
superimposing the watershed boundary over a map of census blocks. Where the centroid of a census
block fell within the watershed boundary, its total population was included in the total. If the
centroid of the census block was outside the watershed boundary, then the population was
excluded. This densely populated watershed is entirely contained within a U.S. Census Bureau
defined urban area. EPA defines urban areas as entities requiring stormwater regulations through
municipal separate storm sewer permits (EPA 2014a).
Deer Creek Watershed Management Plan
Chapter 2 – Watershed Data Inventory
Page 2‐12
EPA completed a separate population analysis for purposes unrelated to this watershed plan. They
used demographic and census block data and a web‐based tool called EJSCREEN to determine areas
of the state having potential Environmental Justice concerns. EPA defines Environmental Justice as
the fair treatment and meaningful involvement of all people regardless of race, color, national origin,
or income with respect to the development, implementation, and enforcement of environmental
laws, regulations and policies (EPA 2014b). Environmental Justice communities may qualify for
financial and strategic assistance for addressing environmental and public health issues (EPA 2011a).
From this analysis, EPA determined that the Deer Creek watershed has potential Environmental
Justice concerns for up to five percent of its area. 6
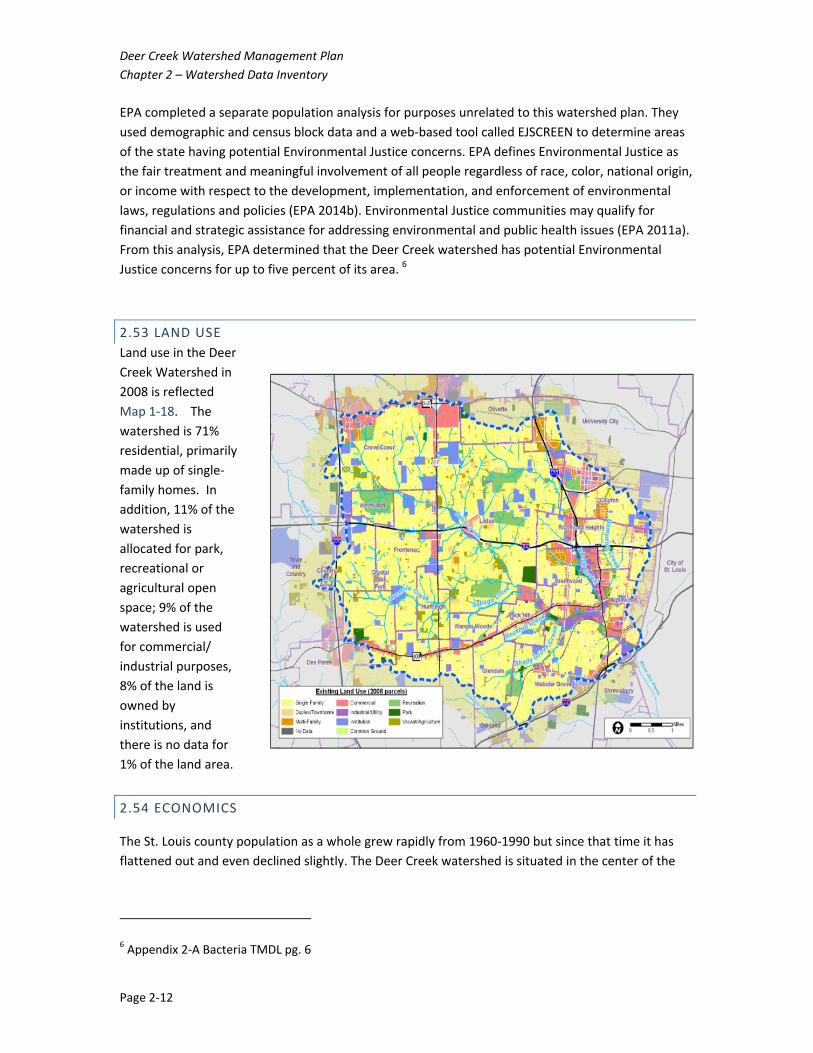
2.53 LAND USE
Land use in the Deer
Creek Watershed in
2008 is reflected
Map 1‐18. The
watershed is 71%
residential, primarily
made up of single‐
family homes. In
addition, 11% of the
watershed is
allocated for park,
recreational or
agricultural open
space; 9% of the
watershed is used
for commercial/
industrial purposes,
8% of the land is
owned by
institutions, and
there is no data for
1% of the land area.
2.54 ECONOMICS
The St. Louis county population as a whole grew rapidly from 1960‐1990 but since that time it has
flattened out and even declined slightly. The Deer Creek watershed is situated in the center of the
6 Appendix 2‐A Bacteria TMDL pg. 6
Deer Creek Watershed Management Plan
Chapter 2 – Watershed Data Inventory
Page 2‐13
county and with a diversity of cities also represents and experiences the general trends of the
county.
The Deer Creek area is predominantly residential, however the floodplain areas of Deer Creek and
Black Creek have a variety of small businesses and light industry most of which has been there for
several decades or longer.
SOURCES OF INFORMATION
Digital Flood Insurance Map Databases www.msc.fema.gov
East‐West Gateway Council of Governments www.ewgateway.org
Federal Emergency Management Agency Map Service Center
Metropolitan St. Louis Sewer District Project Clear https://msdprojectclear.org/
Missouri Department of Natural Resources Total Maximum Daily Load (TMDL) for Black Creek and Deer
Creek https://dnr.mo.gov/env/wpp/tmdl/docs/tmdl‐bacteria‐deercr‐and‐blackcr‐final.pdf
Missouri Spatial Data Information Service www.msdis.missouri.edu
St. Louis County Department of Planning GIS Service Center www.co.st‐louis.mo.us/plan/gis/
U.S. Department of Agriculture Geospatial Data Gateway http://datagateway.nrcs.usda.gov/
University of Missouri Center for Applied Research and Environmental Systems (CARES) Watershed
Evaluation and Comparison Tool www.cares.missouri.edu