Embed Size (px)
Citation preview

AMES MOBILITY 2040: AMES AREA MPO LONG RANGE TRANSPORTATION PLAN
7
Chapter 2. Transportation Vision, Goals, and Objectives
One of the first steps for Ames Mobility 2040 was to develop community-based vision themes that guides the transportation planning
and decision making process. Feedback gathered at the September 2014 stakeholder and public workshops and via the project
website, the MindMixer town hall forum, and the Community Survey was used to craft a Transportation Vision and associated goals
and objectives.
The overall vision development process went through these steps:
Collect input from the community on their vision and values for the transportation system.
Reconcile that community vision with Federal guidance on transportation policy.
Combine those perspectives into Goals and Performance Objectives that would guide development of the transportation plan.
PUBLIC AND STAKEHOLDER INPUT
Fall 2014 Workshops Vision Input
On September 30, 2014, the Ames Area MPO met with stakeholders in Ames to gather input on issues, opportunities, and vision
themes for the regional transportation system. Three workshops were held:
The Plan Management Team (PMT), with engineering and planning staff from
various jurisdictions and agencies in the Ames Area MPO.
The study Focus Group, with stakeholder representation from various civic
groups, modal interests (including bicycle, pedestrian, transit, and freight), Iowa
State University, schools, businesses, and first responders in the community.
Public Meeting, held at the Scheman Building.
The purpose of these workshops was twofold:
1. Gather input on the transportation issues and opportunities in the Ames area.

AMES MOBILITY 2040: AMES AREA MPO LONG RANGE TRANSPORTATION PLAN
8
2. Gather input on the transportation vision for the Ames area.
After small group brainstorming sessions, those in attendance at the workshops individually prioritized which vision themes were most
important. The vision themes were generated by those in attendance. Vision themes that received prioritization votes are shown in
FIGURE 5.
Website Vision Input
The public website for the Ames Mobility 2040 study (AmesMobility2040.com) offered multiple ways for the public to provide input
on the plan. Approximately 30 comments were received via the study website through December 7, 2014, and were summarized by
Vision Theme categories. Some comments covered multiple categories and have up to 3 associated themes.
The themes covered by these comments include:
Bicycling improvement (11 comments)
Safety improvement (9 comments)
Pedestrian improvement (5 comments)
Mobility improvement (4 comments)
Connectivity improvement (3 comments)
Transit improvement (3 comments)
System user education (1 comment)
Multimodal system improvement (1 comment)
Preserve and enhance neighborhood character (1 comment)

AMES MOBILITY 2040: AMES AREA MPO LONG RANGE TRANSPORTATION PLAN
9
Figure 5. Ames Mobility Vision Themes Receiving Votes and Number of Votes Received (Fall 2014 Workshops)
0 2 4 6 8 10 12 14 16
Adaptable
Balanced
Calmer Streets
Family-Friendly (Modes for All Ages)
Health Focused
Regional Coordination / Connection
State of Good Repair
Comprehensive
Efficient
Learn from Other Communities
User-Focused Design
Simple / Ease of Use for All Modes
Educated Users
Affordable
Encourages Living & Working in Ames
Human-Scale Nodes / Placemaking
Sustainable
Accessible / Convenient
Environmentally Aware / Friendly
Forward Thinking / Innovative
Multi-modal / Equal Utility by Mode
Bicycles and Pedestrians
Safe
Connected
1
1
1
1
1
1
1
2
2
2
2
3
3
4
4
4
4
6
7
7
8
9
14
15
Votes Received
Vis
ion
Th
em
e

AMES MOBILITY 2040: AMES AREA MPO LONG RANGE TRANSPORTATION PLAN
10
Town Hall Forum and MindMixer Vision Input
The virtual town hall forum for the Ames Mobility 2040 study is a MindMixer website dedicated to a collaborative discussion of
community transportation issues. This website forum had several vision-related poll questions that were posted to the site over the
course of a month. The poll questions were developed based on the top vision themes identified by attendees at the fall public
workshops. There was an open-ended question that asked virtual participants for input on vision.
Poll questions were provided for seven topics that received the most votes in the Fall public workshops. The topics included in the
voting process each contained a detailed description of how the list of vision theme topics was developed, and summarized the other
lower-vote themes. The seven vision theme poll topics included:
'Bicycles & Pedestrians' is one of the top themes we heard for the Plan Vision. Tell us what you think and rate it!
'Connected' is one of the top themes we heard for the Plan Vision. Tell us what you think and rate it!
'Forward Thinking/Innovative' is one of the top themes we heard for the Plan Vision. Tell us what you think and rate it!
'Safe' is one of the top themes we heard for the Plan Vision. Tell us what you think and rate it!
'Accessible/Convenient' is one of the top themes we heard for the Plan Vision. Tell us what you think and rate it!
'Environmentally Aware' is one of the top themes we heard for the
Plan Vision. Tell us what you think and rate it!
'Multimodal' is one of the top themes we heard for the Plan Vision.
Tell us what you think and rate it!
A full summary of the results of the poll questions is provided in APPENDIX A,
which summarizes all feedback received through the website, email, and
MindMixer town hall forum site. All 7 topics were generally viewed favorably
by those that responded. The topics are generally consistent with input
received at the Fall 2014 workshops and in the comments received via the
website and email.
One of the central features of the MindMixer website was the ability for
public users to start their own topics, offer their own ideas, and collaborate

AMES MOBILITY 2040: AMES AREA MPO LONG RANGE TRANSPORTATION PLAN
11
on other user’s ideas in a discussion topic format. Users started several additional topics not related to the vision theme poll questions
or the “what three words describe your vision…” question. Study team members reviewed these additional topics and identified what
general vision theme areas those discussion topics related to. The themes covered by those additional MindMixer topics include:
Bicycling (discussed in 53 comments)
Connectivity (discussed in 35 comments)
Safety (discussed in 32 comments)
Pedestrians (discussed in 30 comments)
Infrastructure improvement (discussed in 26 comments)
Transit (discussed in 20 comments)
Innovation (discussed in 17 comments)
Traffic signals (discussed in 13 comments)
System user education (discussed in 6 comments)
Community health (discussed in 4 comments)
System efficiency (discussed in 2 comments)
Multimodal (discussed in 2 comments)
Collaboration (discussed in 1 comment)
Coordination (discussed in 1 comment)
Environment (discussed in 1 comment)
Simple (discussed in 1 comment)

AMES MOBILITY 2040: AMES AREA MPO LONG RANGE TRANSPORTATION PLAN
12
Vision Themes
Based on the input received through these various public input mechanisms, a range of vision themes were identified. The vision
themes provide a foundation to guide the transportation planning process by reflecting community transportation desires. Five
transportation vision themes were identified:
Vision Theme 1 – Active Transportation System that is Connected Across all Modes of Travel: The Ames area should move
toward an integrated transportation system that provides improved connectivity for all modes, and is active by encouraging
walking and bicycling. Key concepts for this theme include providing a multimodal system that integrates all modes in some
corridors; and in other corridors providing separate, dedicated, and mode-specific facilities. The system needs to be connected,
so that access barriers for each mode are identified, and provide projects, programs, and strategies that address those barriers.
Vision Theme 2 – Safe: Safety is a critical transportation system consideration. Transportation system projects, programs, and
strategies implemented in the Ames area should provide safety and security benefits to users of all modes.
Vision Theme 3 – Environmentally Aware: Transportation investments and actions are linked to the natural and built
environment. The environmental implications, impacts, and benefits of transportation actions in the Ames area should be
considered in the decision-making process.
Vision Theme 4 – Forward Thinking and Innovative: The Ames area should look to emerging and innovative methods for
achieving its vision for the transportation system, leveraging best practices and successes from other cities around the country.
Vision Theme 5 – Efficient Personal Mobility: The Ames area transportation system should provide easy and convenient
access, leveraging and enhancing existing transportation assets when possible, to provide efficient travel and multiple options
for personal mobility.

AMES MOBILITY 2040: AMES AREA MPO LONG RANGE TRANSPORTATION PLAN
13
FEDERAL TRANSPORTATION VISION GUIDANCE
For the Ames Mobility 2040 study to provide a federally compliant LRTP, federal transportation planning guidance was considered
while the community-tailored transportation vision for the Ames area was developed. The MAP-21 legislation was passed by the U.S.
Congress in June 2012. MAP-21 is the foundation of current national transportation funding and policy direction.
MAP-21 National Performance Goals
Final rulemaking associated with MAP-21 performance measurement is incomplete at the time of the Ames Mobility 2040 update
publishing. Performance measurement will be an ongoing activity for the MPO, and the MPO will need to continually monitor regional
progress toward achieving its performance targets. In this regard, the role of the LRTP is to promote and recommend projects,
policies, and programs that help the region achieve its performance targets. Thus, the project performance scoring should be
measured in terms consistent with the guidance provided in MAP-21.
MAP-21 established national performance goals for the federal-aid transportation program in seven areas1:
Safety: To achieve a significant reduction in traffic fatalities and serious injuries on all public roads.
Infrastructure condition: To maintain the highway infrastructure asset system in a state of good repair.
Congestion reduction: To achieve a significant reduction in congestion on the National Highway System.
System reliability: To improve the efficiency of the surface transportation system.
Freight movement and economic vitality: To improve the national freight network, strengthen the ability of rural communities
to access national and international trade markets, and support regional economic development.
Environmental sustainability: To enhance the performance of the transportation system while protecting and enhancing the
natural environment.
Reduced project delivery delays: To reduce project costs, promote jobs and the economy, and expedite the movement of
people and goods by accelerating project completion through eliminating delays in the project development and delivery
process, including reducing regulatory burdens and improving agencies’ work practices.
1 [§1203; 23 United States Code (USC) 150(b)]

AMES MOBILITY 2040: AMES AREA MPO LONG RANGE TRANSPORTATION PLAN
14
MAP-21 Planning Factors
The federally defined scope of the metropolitan transportation planning process, as defined in 23 USC 450.306, is that “the
metropolitan transportation planning process shall be continuous, cooperative, and comprehensive, and provide for consideration and
implementation of projects, strategies, and services that will address the following factors:
1. Support the economic vitality of the metropolitan area, especially by enabling global competitiveness, productivity, and
efficiency;
2. Increase the safety of the transportation system for motorized and non-motorized users;
3. Increase the security of the transportation system for motorized and non-motorized users;
4. Increase accessibility and mobility of people and freight;
5. Protect and enhance the environment, promote energy conservation, improve the quality of life, and promote consistency
between transportation improvements and State and local planned growth and economic development patterns;
6. Enhance the integration and connectivity of the transportation system, across and between modes, for people and freight;
7. Promote efficient system management and operation; and
8. Emphasize the preservation of the existing transportation system”.2
2 § 450.306

AMES MOBILITY 2040: AMES AREA MPO LONG RANGE TRANSPORTATION PLAN
15
GOALS
Goals provide broad statements of intent, providing direction for Ames Mobility 2040. In developing goals for the Ames Mobility 2040
study, the Federal guidance on transportation vision was compared to the community-generated input on transportation vision. In
general, there was congruence between the two. The Federal guidance provided the framework for the broad goal areas that the
study should address, while the community vision provided direction on how to tailor each broad goal area into a community specific
vision, defining a successful outcome for each goal area. The goals for the study are provided below.
Goal 1 - Provide a
connected transportation system that offers efficient
and reliable mobility options for all modes of
travel.
Goal 2 - Provide a safe transportation system.
Goal 3 - Consider and mitigate the impacts of the transportation system on
the natural and built environment
Goal 4 - Provide an accessible transportation
system fits within the context of its surroundings and preserves community
character.
Goal 5 - Provide a transportation system that
supports the regional economy and efficiently
moves goods.
Goal 6 - Maintain transportation
infrastructure in a state-of-good-repair.

AMES MOBILITY 2040: AMES AREA MPO LONG RANGE TRANSPORTATION PLAN
16
PROJECT AND REGIONAL PERFORMANCE MEASUREMENT
The project-level and regional performance measures have been developed consistently with the vision themes established for the
Ames Mobility 2040, and reflect the MAP-21 authorization. Performance measures are used at two levels of analysis:
Project-Level Performance Scoring: Project-level performance criteria were provided to assess how individual projects fit with
the Ames area’s performance goals. These criteria were applied as a part of the alternatives analysis to prioritize projects.
Regional-Level System Performance Assessment: Regional performance measures were developed to assess the outcome of
various scenarios or packages of projects. Similar to the project-level criteria, these regional-level measures were used as
benchmarks to assess how a scenario (group or package of individual projects) does in terms of meeting the regional
transportation vision.
PROJECT-LEVEL PERFORMANCE CRITERIA HIERARCHY
The project-level performance criteria are part of a hierarchy, with six goals for the LRTP, and each of those goals has multiple
performance objectives. In turn, each measurable performance objective has a performance measure associated with it. That
relationship is illustrated as an example in FIGURE 6.
Figure 6. Hierarchical Relationship between Goals – Objectives – Performance Measures

AMES MOBILITY 2040: AMES AREA MPO LONG RANGE TRANSPORTATION PLAN
17
CYRIDE SERVICE PHILOSOPHY AND SERVICE IMPROVEMENT GUIDELINES
Additional consideration was given to CyRide’s service philosophy and service improvement guidelines when evaluating transit
alternatives. At the November 15, 2014, special Transit Board meeting, board members discussed a service level philosophy that could
guide current and future discussions and, when considering service improvements, guidelines that would provide a framework for
decisions.
Service Level Philosophy: Within financial constraints, provide a ride for every customer desiring to use transit when and
where CyRide operates.
Service Improvement Guidelines (provided in order of priority):
o Guideline #1 - Capacity Change: Service changes that address capacity challenges within the existing system. For
example, extra buses added due to overcrowding on a route consistently exceeding 150 % of seated capacity (60
riders); published schedule is unchanged.
o Guideline #2 - Improved Existing Service: Service improvements that address improved convenience and capacity within
the existing system. For example, better service frequency or longer service hours on a route; published schedule is
changed.
o Guideline #3 - New Service: Service improvements that address expansion of service into new areas and days of service.
For example, adding a new route (for example, State Street route) or implementing service on an existing route on a
day it is not currently offered; published schedule is changed.
PROJECT PERFORMANCE SCORING APPROACH AND MATRIX
TABLE 1 illustrates the performance scoring matrix and relates each of those project-level performance criteria to the appropriate
performance objective and LRTP goal. The table summarizes 25 different performance objectives, of which 22 can be used to measure
alternative performance. The three performance objectives that do not have a scoring approach associated with them are still
priorities for the community and/or anticipated national priorities, but do not have a feasible scoring mechanism (as outlined in the
table) that will be considered during LRTP development. Additionally, some alternatives did not have a logical “good” (+1) score, they
either provided a benefit for that performance objective, or did not.
AMES MOBILITY 2040: AMES AREA MPO LONG RANGE TRANSPORTATION PLAN
18
Because some of the measures are mode-specific, the performance measure scores should not be used to compare alternatives of
different modes. This system was used to measure how well an alternative fit with the LRTP goals and objectives compared to other
alternatives of the same mode. The performance scoring outcomes were not the final answer to project selection. Some projects
scored well, but were not reasonable to implement due to cost, right-of-way impacts, inconsistency with wider regional initiatives, or
stakeholder concerns.
TABLE 2 provides a list of performance issues that were considered fatal flaws, and removed an alternative from further consideration.

AMES MOBILITY 2040: AMES AREA MPO LONG RANGE TRANSPORTATION PLAN
19
Table 1. Project Performance Objectives and Scoring Approach
LRTP Project Performance Objective
Performance Method
Candidate Project Scoring Approach
Scoring Discussion
2 1 0 -2
Very Good Good Neutral Poor
Goal 1: Provide a connected transportation system that offers efficient and reliable mobility options for all modes of travel.
1A. Create and enhance
multimodal access and connections between bicycle, pedestrian, transit, and private vehicle travel.
Multimodal Connectivity
Ranking
Enhances access and connections between
at least two modes. Or, a project that improves
mobility for two or more modes.
Enhances access and connections for bicycle,
pedestrian, or transit travel.
No significant impact on multimodal access
or connectivity.
Creates barrier to multimodal
connections.
Intermodal projects and those that have multiple modes score highest here.
Projects improving bicycle, pedestrian, or transit mobility are assumed "good", as automobile travel already accounts for over 90% of regional travel. Complete
streets projects score “Very Good”.
1B. Reduce the incidence of
roadway congestion.
Vehicular Level of Service
Improves vehicular level of service to "D"
or better for a location that would be "E" or worse otherwise, or
improves LOS on NHS route.
Improves vehicular level of service.
No significant impact on traffic operations.
Degrades vehicular level of service a letter
grade or worse.
LOS for existing or 2040 conditions - intersections and segments where
appropriate. Assumes that target is LOS D or better. Minor drops of less than 1 LOS
letter grade are not negatively scored. Alternate measure: +2 scoring for LOS
improvements on NHS routes (per MAP-21), and +1 for non-NHS routes.
1C. Enhance the efficiency
of the existing transportation system through system management and demand management approaches.
Transportation Management Assessment
Improves existing facility or transit route mobility. OR a project
that adjusts travel demand to better fit on
existing system.
- No significant impact on system or demand
management.
Degrades the service levels of an existing facility or route, or
increases peak demand on the system.
Assess Transportation System Management and Demand Management -
potentially new transit services that degrade demand on an existing route, or alternatives that somehow increase peak
hour demands. No “good” score.
1D. Improve system
connectivity through improved multimodal network connections and reduced network gaps.
System Connectivity Assessment
New multimodal network connection
where a gap of 1/2 mile or more existed before.
(1/2 mile from adjacent, parallel
facilities)
Provides a new connection between two existing modal
facilities, or an extension of an existing
facility.
No change facility connectivity.
Reduces facility connectivity.
Scored for all modes separately. Determine distance of new facility to
nearest existing facility as measured to parallel facilities. Must connect to existing facilities. Roadways considered should be
arterial or higher for a +2.
1E. Plan for and address
transportation system impacts and sufficiency when considering new developments.
No way to measure and compare in LRTP on an alternative basis.

AMES MOBILITY 2040: AMES AREA MPO LONG RANGE TRANSPORTATION PLAN
20
Table 1. Project Performance Objectives and Scoring Approach (continued)
LRTP Project Performance Objective
Performance Method
Candidate Project Scoring Approach
Scoring Discussion
2 1 0 -2
Very Good Good Neutral Poor
Goal 2: Provide a safe transportation system.
2A. Reduce the rate and
number of serious injury and fatal crashes.
Safety Assessment
Results in likely safety benefits or reduced
crash severity in one of the top vehicular or bicycle/pedestrian safety issue areas.
Improves vehicular or bicycle / pedestrian safety non-safety issue area; or improves safety through traffic diversion from a safety issue corridor.
No effect on vehicular or bicycle / pedestrian safety.
Increases safety concerns at an
identified vehicular or bicycle/pedestrian safety issue area.
Issue areas defined in LRTP as highest-crash frequency intersections, or public-identified safety concern locations. May be assessed through crash modification
factors. Addresses HSIP proposed rulemaking and 2013 Iowa Strategic
Highway Safety Plan.
2B. Consider the safety of
all travel modes when considering changes to the transportation system.
Multimodal Safety
Assessment
Provides anticipated safety benefits to two
or more modes of travel.
Provides anticipated safety benefits to one
mode with no anticipated negative safety impacts
on other modes.
No anticipated change in safety for
any modes.
Anticipated negative impact on any mode.
Addresses the input regarding multimodal safety when considering projects. Projects
where literature / studies suggest the improvement would enhance two or more
modes' safety highest ranked here.
2C. Enhance transportation
security by collaborating with the appropriate agencies and emergency responders.
Qualitative Security
Assessment
Provides improved communications,
emergency response coordination, secures
critical asset or otherwise improves
transportation security.
- No anticipated
change to security.
Negative impact on communications,
emergency response coordination, critical
assets, or overall transportation security.
Addresses security - many alternatives will be security neutral. No "Good", either
improves security or doesn't.
Goal 3: Consider and mitigate the impacts of the transportation system on the natural and built environment.
3A. Minimize the
transportation system’s impacts on the natural and built environment.
Environmental Screening
Reduces the natural / built environmental
impacts of current and future transportation
system.
-
Neutral effect on transportation
system impacts on natural / built environment.
Overall increase transportation system
impacts to natural / built environment.
Look at several factors: right-of-way impacts (acres), potential acquisitions
(number), noise potential (yes/no), threatened and endangered species
habitat (yes/no), wetlands and floodway impacts (acres). No “good” score.
3B. Identify transportation
system projects and programs that can improve regional air quality.
VMT / VHT Estimation
Provides significant reduction to regional
VMT and VHT.
Provides significant reduction to either VMT
or VHT; no significant growth in either measure.
No significant change in regional
VMT or VHT.
Project would increase both VMT and VHT.
Use model / analysis to estimate when possible. MOVES air quality model
evaluates VMT at various travel speeds, with higher emissions rates coming at low urban speeds / idling. Thus, VMT and VHT declines infer improved air quality. Define
"significant" in relative terms by comparing alternatives' impacts.

AMES MOBILITY 2040: AMES AREA MPO LONG RANGE TRANSPORTATION PLAN
21
Table 1. Project Performance Objectives and Scoring Approach (continued)
LRTP Project Performance Objective
Performance Method
Candidate Project Scoring Approach
Scoring Discussion
2 1 0 -2
Very Good Good Neutral Poor
Goal 3: Consider and mitigate the impacts of the transportation system on the natural and built environment (continued).
3C. Coordinate with
environmental agencies during project planning.
No way to measure and compare in LRTP on an alternative basis. Coordination is part of overall LRTP, and becomes more focused during project planning and development.
Goal 4: Provide an accessible transportation system that fits within the context of its surroundings and preserves community character.
4A. Plan and design
transportation facilities that fit within their physical and social setting.
CSS Assessment
Alternative is generally more consistent with neighborhood context
than current transportation facilities.
- No real impact on
neighborhood context.
Alternative is generally inconsistent with
neighborhood context.
Qualitative assessment. Consider how the project fits aesthetically, how it enhances
/ conflicts with neighborhood's modal orientation, affects on-street parking
where it's needed, or residents' perception of the project (if applicable).
No "Good" score.
4B. Plan for transit, bicycle,
and pedestrian access in new urban developments.
Bicycle / Pedestrian /
Transit Screening
Provides bicycle, pedestrian, or transit
access in neighborhoods / subareas that
previously had none.
Expands bicycle, pedestrian, or transit
access in neighborhoods /
subareas that previously had access
to that mode.
No change in bicycle, pedestrian, or transit
access to neighborhood /
subarea.
Reduces bicycle, pedestrian, or transit
access to neighborhood / subarea.
Define neighborhoods as existing subdivisions, or those subareas with
homogenous land uses that are bounded by arterial streets (including commercial nodes / industrial areas). Develop new streets with complete street concepts.
Consider how appropriate the mode is for that corridor.
4C. Provide balanced
transportation access to both environmental justice and non-environmental justice communities.
Environmental Justice
Assessment
Directly improves mobility for EJ populations.
Limited direct effect on EJ population
mobility.
Project degrades mobility for EJ populations.
Use the defined EJ areas. No "Very Good" score.
4D. Promote active
transportation projects and programs.
Active Transportation
Screening
Likely enhances walking, biking and recreational
opportunities compared to current conditions.
-
Limited effect on walking, biking and
recreational opportunities.
Likely reduces walking, biking and recreational
opportunities compared to current
conditions.
Bicycle / pedestrian projects where demand likely exists and programs that
encourage biking and walking and include complete streets will score +2. No “good”
score.
4E. Provide transit service
to areas with high density or mix of land uses.
Transit Density Screening
Other subareas of similar land use mix and
density have above- average ridership.
No comparative transit density.
Other subareas of similar land use mix
and density have lower than-average ridership.
Qualitative assessment, considering development density and mix of land uses to gauge if appropriate for transit service.
No “good” score.

AMES MOBILITY 2040: AMES AREA MPO LONG RANGE TRANSPORTATION PLAN
22
Table 1. Project Performance Objectives and Scoring Approach (continued)
LRTP Project Performance Objective
Performance Method
Candidate Project Scoring Approach
Scoring Discussion
2 1 0 -2
Very Good Good Neutral Poor
Goal 5: Provide a transportation system that supports the regional economy and efficiently moves goods.
5A. Promote the efficient
and safe movement of freight and goods.
Freight Route Assessment
Improves capacity, safety, or travel
reliability on freight corridors through Ames
area.
-
No effect on capacity, safety, or travel
reliability on freight corridors through Ames
area.
Decreases capacity, safety,
or travel reliability on freight
corridors through Ames area.
Evaluate alternatives according to whether or not they could potentially enhance mobility or safety in defined freight corridors. Work with MPO to
define freight corridors. No “good” score.
5B. Identify projects and
programs that maintain the current high levels of freight mobility on Interstate 35 through the Ames area.
I-35 Freight Assessment
Improves capacity, safety, or travel
reliability on I-35 through Ames area.
-
No effect on capacity, safety, or travel
reliability on I-35 through Ames area.
Decreases capacity, safety,
or travel reliability on I-35 through
Ames area.
Specific to I-35 only to address MAP-21 Freight National Performance Goals / Draft Rules -
anticipated to only relate to Interstate Highway System. No “good” score.
5C. Identify multimodal
transportation projects and programs that enhance the area's economy.
Employment / Retail
Connectivity Assessment
New multimodal connection directly to employment or retail
areas.
Provides improved, but indirect
multimodal access / mobility to
employment or retail area.
Neutral effect on connectivity to
employment or retail areas.
Reduces multimodal
connectivity to employment or
retail areas.
Review TAZ data for employment areas and determine if project expands access or enhances
mobility to those areas. New direct access gets +2, enhanced access gets +1.
5D. Identify multimodal
transportation projects and programs that enhance access to K-12 schools.
K-12 School Connectivity Assessment
New multimodal connection directly to
school.
Provides improved, but indirect
multimodal access / mobility to school.
No effect on connectivity to school.
Reduces multimodal
connectivity to school.
Performance objective added to reflect input regarding concerns on K-12 school access. New direct access gets +2, enhanced access gets +1.
5E. Reduce project delivery
delays No way to measure for LRTP alternatives. LRTP will discuss processes that can help streamline project development.
5F. Provide a financially-
sustainable transportation system.
Travel Benefits per Dollar
Spent
Highest ranking tier of benefits / dollar spent.
Next tier of benefits / dollar spent.
Limited benefits / dollar spent OR cannot
measure.
Negative VMT / VHT benefits.
Compare VMT and VHT reductions to projects cost. Rank projects against one another. Cannot measure smaller projects that aren't modeled.
Transit projects to consider operational efficiency and cost savings.

AMES MOBILITY 2040: AMES AREA MPO LONG RANGE TRANSPORTATION PLAN
23
Table 1. Project Performance Objectives and Scoring Approach (continued)
LRTP Project Performance Objective
Performance Method
Candidate Project Scoring Approach
Scoring Discussion
2 1 0 -2
Very Good Good Neutral Poor
Goal 6: Maintain transportation infrastructure in a state-of-good-repair.
6A. Allocate resources to
maintain pavement conditions at sufficient levels.
PCI
Improves pavement in a corridor with
pavement considered deficient.
No impact to pavement
condition.
Use PCI data from existing conditions report. Addresses NHPP proposed rulemaking. No “good”
score.
6B. Allocate resources to
maintain bridge conditions at sufficient levels.
NBI Ratings Improves a bridge
considered deficient.
No impact to bridge condition.
Use National Bridge Inventory (NBI) functional and
structural ratings. Addresses NHPP proposed rulemaking. No “good” score.
6C. Allocate resources to
maintain transit fleet in state of good repair
Average Fleet Age
Improves average fleet age.
No impact to average
fleet age.
Evaluate alternatives that affect the average fleet age. No “good” score.
Table 2. Fatal Flaws for Selected Performance Measures
LRTP Project Performance Objective Potential Alternative Fatal Flaw
1A. Create and enhance multimodal access and connections between bicycle,
pedestrian, transit, and private vehicle travel. Alternative that removes bicycles or pedestrians from a corridor.
1B. Reduce the incidence of roadway congestion. Alternatives that degrade traffic operations to LOS E / F on the NHS system, including forecasts of 2040 traffic operations.
2A. Reduce the rate and number of serious injury and fatal crashes per
strategies outlined in the 2013 Iowa Strategic Highway Safety Plan.
Alternative increases likelihood of fatal or severe injury crashes for any mode, measured through crash modification factors.
3A. Minimize the transportation system’s impacts on the natural and built
environment.
Alternative has potential for significant impact on floodplain. Future development considered.
5A. Promote the efficient and safe movement of freight and goods. If a designated freight corridor, alternative reduces the mobility of heavy commercial vehicles.

AMES MOBILITY 2040: AMES AREA MPO LONG RANGE TRANSPORTATION PLAN
24
REGIONAL PERFORMANCE MEASURES
Regional performance measures are used to compare existing conditions and 2040 “do nothing” Existing Plus Committed (E+C)
conditions with the Ames Mobility 2040 scenario. This E+C scenario assumes that no additional improvements are made to the
transportation system beyond those currently considered “committed” (as described in Chapter 6), but that regional housing and
employment growth continues at anticipated rates through 2040. The regional performance measures tie back to the six LRTP
performance goals, outlined as goal areas in TABLE 3. In addition to a summary of regional performance measures for consideration for
the Ames Mobility 2040 plan, performance targets are shown that reflect challenging, yet achievable performance targets for the
Ames area to achieve.
The performance targets are shown as a way of assessing the level of consistency between Ames Mobility 2040 Plan outcomes with
the regional transportation vision and goals. The performance measures do not reflect AAMPO policy, and there are not positive or
negative consequences to the AAMPO or its member jurisdictions whether they are achieved or not achieved. The regional
performance measures are desired outcomes that reflect the community vision, and the metrics reflected in TABLE 3 attempt to
measure how the Ames Mobility 2040 plan compares to that vision as a first step toward performance measurement. It is assumed
that the Ames area’s regional performance measures and targets will be ultimately be modified when formal performance
measurement rulemaking is finalized.
Additional LRTP Regional Performance Strategies for Consideration
There are additional LRTP regional performance strategies that will relate to overall plan performance but do not directly apply to
individual projects. These strategies were used as guiding principles when assembling the final list of LRTP projects and programs:
Placing a priority on safety projects for LRTP implementation. While no MPO policies were set for safety project, certain
thresholds were considered, such as establishing a target percentage of LRTP budget to expend on safety projects; for instance,
spending at least 5 % of the budget on safety projects. An emphasis was placed on selecting projects to enhance system safety.
Implement projects that move Ames closer to achieving bicycle-friendly community status from the League of American
Bicyclists. There are various criteria used to determine bicycle-friendly status for each of the 5E Perspectives: Engineering,
Education, Encouragement, Enforcement, and Evaluation/Planning
(http://bikeleague.org/sites/default/files/Attributes_of_BFC.pdf.)

AMES MOBILITY 2040: AMES AREA MPO LONG RANGE TRANSPORTATION PLAN
25
Table 3. Regional System Performance Measures
Goal Area Performance Measure Performance Measure Target for Ames Mobility 2040
Existing Conditions Baseline
3
2040 Conditions E+C Baseline
Performance Measure Discussion
1. Connected, Efficient, and
Reliable
System Reliability / Reliability Index 80
(RI80)
Address reliability issues at the two (2) NHS segments with poorest
reliability.
Arterial System: RI80 = 1.20 Freeway System: RI80 = 1.03
N/A
Compare 80th
percentile travel times to median travel times by time of
day.
Miles of On-Street Bicycle Facilities
Increase the segment-mileage of on-street bicycle facilities by 100%
compared to current levels.
3.9 Miles On-Street Lanes / Paved Shoulders
57 miles Shared-Use Paths / Sidepaths
11.1 Miles On-Street Lanes /
Paved Shoulders 66 Miles of Shared-
Use Paths / Sidepaths
Ames Bicycle Coalition has suggested balanced target
that includes off-street and on-street. MPO to
adjust as needed in future planning efforts.
2. Safety Serious Injury / Fatal
Crashes
Address safety issues at five (5) locations with highest crash rates
or most serious injury / fatal crashes.
< 2.6 fatal crashes/year < 20 major injury crashes/
year N/A
3. Environment
VMT per Household 2040 VMT per household grows by
10% or less compared to 2010 levels.
41.6 daily VMT per household
49.7 daily VMT per household
Transportation plan likely to have limited impact on
VMT.
VHT per Household 2040 VHT per household grows 20%
or less compared to 2010 levels. 1.00 daily VHT per
household 1.28 daily VHT per
household
Transit Mode Share 2040 transit mode share is higher
than 2010 transit mode share. 12.5% of all modeled (auto
and transit) trips.
12.0% of all modeled (auto and
transit) trips.
3 Existing Year Data Sources: System Reliability – 2015 Data; On-Street Bike Facilities – 2015 data; Crashes – 2009 to 2013 data; VMT, VHT and Transit Mode
Share – 2010 Travel Model estimates and Iowa DOT Geographic Information Management System (GIMS) data.
AMES MOBILITY 2040: AMES AREA MPO LONG RANGE TRANSPORTATION PLAN
26
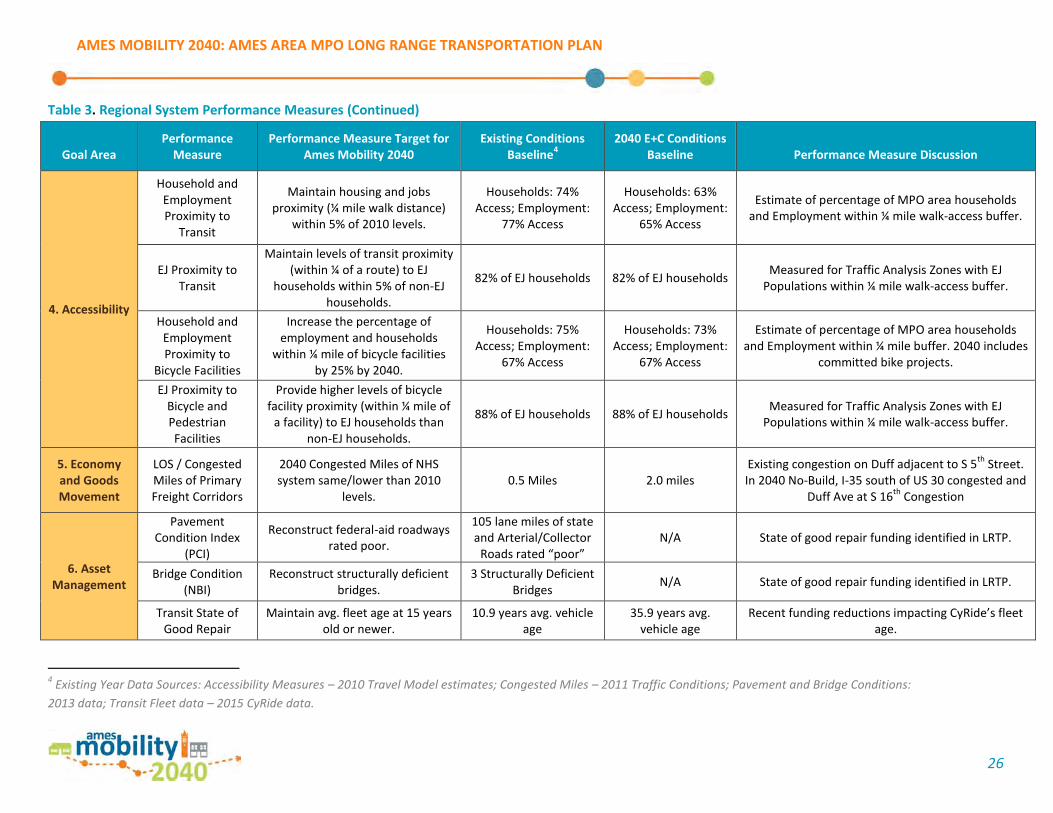
Table 3. Regional System Performance Measures (Continued)
Goal Area Performance
Measure Performance Measure Target for
Ames Mobility 2040 Existing Conditions
Baseline4
2040 E+C Conditions Baseline Performance Measure Discussion
4. Accessibility
Household and Employment Proximity to
Transit
Maintain housing and jobs proximity (¼ mile walk distance)
within 5% of 2010 levels.
Households: 74% Access; Employment:
77% Access
Households: 63% Access; Employment:
65% Access
Estimate of percentage of MPO area households and Employment within ¼ mile walk-access buffer.
EJ Proximity to Transit
Maintain levels of transit proximity (within ¼ of a route) to EJ
households within 5% of non-EJ households.
82% of EJ households 82% of EJ households Measured for Traffic Analysis Zones with EJ
Populations within ¼ mile walk-access buffer.
Household and Employment Proximity to
Bicycle Facilities
Increase the percentage of employment and households
within ¼ mile of bicycle facilities by 25% by 2040.
Households: 75% Access; Employment:
67% Access
Households: 73% Access; Employment:
67% Access
Estimate of percentage of MPO area households and Employment within ¼ mile buffer. 2040 includes
committed bike projects.
EJ Proximity to Bicycle and Pedestrian Facilities
Provide higher levels of bicycle facility proximity (within ¼ mile of
a facility) to EJ households than non-EJ households.
88% of EJ households 88% of EJ households Measured for Traffic Analysis Zones with EJ
Populations within ¼ mile walk-access buffer.
5. Economy and Goods Movement
LOS / Congested Miles of Primary Freight Corridors
2040 Congested Miles of NHS system same/lower than 2010
levels. 0.5 Miles 2.0 miles
Existing congestion on Duff adjacent to S 5th
Street. In 2040 No-Build, I-35 south of US 30 congested and
Duff Ave at S 16th
Congestion
6. Asset Management
Pavement Condition Index
(PCI)
Reconstruct federal-aid roadways rated poor.
105 lane miles of state and Arterial/Collector
Roads rated “poor” N/A State of good repair funding identified in LRTP.
Bridge Condition (NBI)
Reconstruct structurally deficient bridges.
3 Structurally Deficient Bridges
N/A State of good repair funding identified in LRTP.
Transit State of Good Repair
Maintain avg. fleet age at 15 years old or newer.
10.9 years avg. vehicle age
35.9 years avg. vehicle age
Recent funding reductions impacting CyRide’s fleet age.
4 Existing Year Data Sources: Accessibility Measures – 2010 Travel Model estimates; Congested Miles – 2011 Traffic Conditions; Pavement and Bridge Conditions:
2013 data; Transit Fleet data – 2015 CyRide data.


![Contra Costa Lifeline Transportation Program Cycle 5 ... Application... · [ ] Community-Based Transportation Plan (CBTP) ... The Project’s goals and objectives are to provide safe,](https://img.pdfslide.us/doc/110x75/5b392b1d7f8b9ab9068e35ca/contra-costa-lifeline-transportation-program-cycle-5-application-.jpg)