Embed Size (px)
Citation preview

TRADE AND COMMERCE
78. Trade and commerce have played a pivotal role in promoting the growth of Delhi's economy by making a significant contribution in terms of tax revenues. Delhi is the biggest trade and commerce centre in India. The contribution to Gross State Domestic Product (GSDP) from trade, hotels and restaurants was about one fifth during the last eight years. The number of registered dealers under Delhi Value Added Tax (DVAT), excluding dealers registered under Central Sales Tax Act increased from 1,71,868 in 2003-04 to 2,64,340 in 2013-14 and annual average growth rate was 4.62 percent. During the same period, the revenue increased from ` 15804 crore to ` 17925 crore recording annual average growth rate at 15.14 per cent.
POVERTY LINE
79. Poverty is a situation where the individual or communities lack the resources, ability and environment to meet the basic needs of life. It indicates a status wherein a person fails to maintain a living standard adequate for a comfortable lifestyle. On the basis of National Sample Survey Organisation's 61st Round (June 2004- July 2005), Planning Commission published State Specific poverty line for rural and urban. The poverty line was estimated at ` 410.38 for rural and ` 612.91 urban Delhi as against the national level of ` 356.30 for rural and ̀ 538.60 for urban India respectively. The number of persons below poverty line in Delhi during 2011-12 was estimated at 16.96 lakh and it worked out to 9.91 per cent of the total population of Delhi.
16 ECONOMICSURVEYOFDELHI,2014-15 ECONOMICSURVEYOFDELHI,2014-15 17
CHAPTER 2DEMOGRAPHIC PROFILE
Area
Delhi is located at 28.61°N 77.23°E, and lies in Northern India. It borders the Indian states of Haryana on the north, west and south and Uttar Pradesh (UP) to the east. The total area of NCT Delhi is 1483 Sq. km. It has a length of 51.9 km (32 mi) and a width of 48.48 km (30 mi). Delhi is included in India's seismic zone-IV, indicating its vulnerability to major earthquakes. Delhi features an atypical version of the humid subtropical climate. Due to rapid pace of urbanization; landscape of Delhi has undergone a change from majority of rural area to urban. The rural-urban areas changes during the last three census in Delhi is presented in Statement 2.1:
Statement 2.1 AREA - RURAL AND URBAN
2. The growth in urban area during 2001-2011 was observed at 20.44 per cent. This pace of urbanization has reduced the number of villages in Delhi from 300 in 1961 to 165 in 2001 and 112 in 2011. The number of urbanized villages has increased from 20 in 1961 to 135 in 2011. The number of census towns has increased from 3 in 1971 to 29 in 1991 and 110 in 2011. Thus more and more rural villages of Delhi are being declared Census Towns in each successive Census resulting in decreasing rural population and rural area in Delhi.
3. Population
3.1 Population Census is the only source providing comprehensive data on population characteristics carried out decennially by GoI in collaboration with states. The first synchronous census in India was held in 1881. Latest census, 15th in the series, was conducted in 2011 and as per this census, population of Delhi, as on 1st March, 2011, was 16.78 million as against 13.85 million as on 1st March, 2001. According to census 2011 about 97.50 per cent of the population of Delhi lives in urban areas and remaining 2.5 percent in rural areas. This urban population includes population of 110 Census towns in 2011 Census. As per Revenue Department record these census towns are located in rural area of Delhi and they are not part of notified urban area of Delhi.
Source: Census of India, 1991, 2001 & 2011 provisional.
Sl. No.
Classification of Area
1991 2001 2011 Sq. Km % Sq. Km % Sq. Km %
1. Rural 797.66 53.79 558.32 37.65 369.35 24.91 2. Urban 685.34 46.21 924.68 62.35 1113.65 75.09 3. Total 1483.00 100.00 1483.00 100.00 1483.00 100.00
18 ECONOMICSURVEYOFDELHI,2014-15 ECONOMICSURVEYOFDELHI,2014-15 19
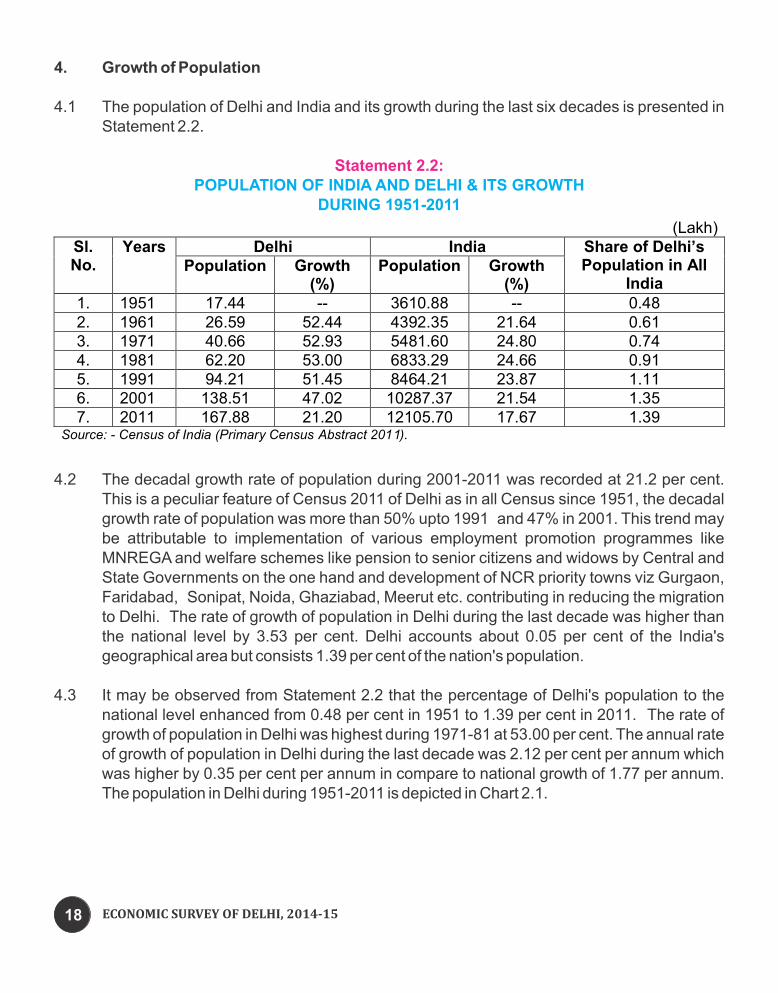
4. Growth of Population
4.1 The population of Delhi and India and its growth during the last six decades is presented in Statement 2.2.
Statement 2.2:POPULATION OF INDIA AND DELHI & ITS GROWTH
DURING 1951-2011
4.2 The decadal growth rate of population during 2001-2011 was recorded at 21.2 per cent. This is a peculiar feature of Census 2011 of Delhi as in all Census since 1951, the decadal growth rate of population was more than 50% upto 1991 and 47% in 2001. This trend may be attributable to implementation of various employment promotion programmes like MNREGA and welfare schemes like pension to senior citizens and widows by Central and State Governments on the one hand and development of NCR priority towns viz Gurgaon, Faridabad, Sonipat, Noida, Ghaziabad, Meerut etc. contributing in reducing the migration to Delhi. The rate of growth of population in Delhi during the last decade was higher than the national level by 3.53 per cent. Delhi accounts about 0.05 per cent of the India's geographical area but consists 1.39 per cent of the nation's population.
4.3 It may be observed from Statement 2.2 that the percentage of Delhi's population to the national level enhanced from 0.48 per cent in 1951 to 1.39 per cent in 2011. The rate of growth of population in Delhi was highest during 1971-81 at 53.00 per cent. The annual rate of growth of population in Delhi during the last decade was 2.12 per cent per annum which was higher by 0.35 per cent per annum in compare to national growth of 1.77 per annum. The population in Delhi during 1951-2011 is depicted in Chart 2.1.
Chart 2.1:POPULATION OF DELHI: 1951-2011
5. District-wise Population
5.1 At the time of 1991 census Delhi was a single district Territory. In 1996, Government of NCT of Delhi, through a Gazette notification, created 9 districts and 27 sub-divisions. Population Census 2001 was conducted in each of 9 districts and 27 Sub-divisions. The district-wise population of NCT Delhi during the census 2001 and 2011 is presented in Statement 2.3.
Statement 2.3DISTRICT-WISE POPULATION OF NCT DELHI: 2001 & 2011
5.2 It is evident from Statement 2.3 that more than 53 per cent of the population of Delhi in 2011 lived in three districts viz. North-west, South and West districts of Delhi. The district-wise population of Delhi in 2001 and 2011 is depicted in Chart 2.2
(Lakh)
1951
1961
1971
1981 1991
2001
2011
0
20
40
60
80
100
120
140
160
180
17.4426.59
40.66
62.2
94.21
138.51
167.88
(Lakh) Sl. No.
Years Delhi India Share of Delhi’s Population in All
India Population Growth
(%) Population Growth
(%) 1. 1951 17.44 -- 3610.88 -- 0.48 2. 1961 26.59 52.44 4392.35 21.64 0.61 3. 1971 40.66 52.93 5481.60 24.80 0.74 4. 1981 62.20 53.00 6833.29 24.66 0.91 5. 1991 94.21 51.45 8464.21 23.87 1.11 6. 2001 138.51 47.02 10287.37 21.54 1.35 7. 2011 167.88 21.20 12105.70 17.67 1.39
Source: - Census of India (Primary Census Abstract 2011).
Sl. No.
Districts 2001 2011 Number Per cent Rank Number Per cent Rank
1. North West 2860869 20.65 1 3656539 21.78 1 2. South 2267023 16.37 2 2731929 16.27 2 3 West 2128908 15.37 3 2543243 15.15 3 4 North East 1768061 12.77 4 2241624 13.35 5 5. South West 1755041 12.67 5 2292958 13.66 4 6. East 1463583 10.57 6 1709346 10.18 6 7. North 781525 5.64 7 887978 5.29 7 8. Central 646385 4.67 8 582320 3.47 8 9. New Delhi 179112 1.29 9 142004 0.85 9
Total 13850507 100.00 16787941 100.00 Source: - Census of India (Primary Census Abstract 2011).

18 ECONOMICSURVEYOFDELHI,2014-15 ECONOMICSURVEYOFDELHI,2014-15 19
4. Growth of Population
4.1 The population of Delhi and India and its growth during the last six decades is presented in Statement 2.2.
Statement 2.2:POPULATION OF INDIA AND DELHI & ITS GROWTH
DURING 1951-2011
4.2 The decadal growth rate of population during 2001-2011 was recorded at 21.2 per cent. This is a peculiar feature of Census 2011 of Delhi as in all Census since 1951, the decadal growth rate of population was more than 50% upto 1991 and 47% in 2001. This trend may be attributable to implementation of various employment promotion programmes like MNREGA and welfare schemes like pension to senior citizens and widows by Central and State Governments on the one hand and development of NCR priority towns viz Gurgaon, Faridabad, Sonipat, Noida, Ghaziabad, Meerut etc. contributing in reducing the migration to Delhi. The rate of growth of population in Delhi during the last decade was higher than the national level by 3.53 per cent. Delhi accounts about 0.05 per cent of the India's geographical area but consists 1.39 per cent of the nation's population.
4.3 It may be observed from Statement 2.2 that the percentage of Delhi's population to the national level enhanced from 0.48 per cent in 1951 to 1.39 per cent in 2011. The rate of growth of population in Delhi was highest during 1971-81 at 53.00 per cent. The annual rate of growth of population in Delhi during the last decade was 2.12 per cent per annum which was higher by 0.35 per cent per annum in compare to national growth of 1.77 per annum. The population in Delhi during 1951-2011 is depicted in Chart 2.1.
Chart 2.1:POPULATION OF DELHI: 1951-2011
5. District-wise Population
5.1 At the time of 1991 census Delhi was a single district Territory. In 1996, Government of NCT of Delhi, through a Gazette notification, created 9 districts and 27 sub-divisions. Population Census 2001 was conducted in each of 9 districts and 27 Sub-divisions. The district-wise population of NCT Delhi during the census 2001 and 2011 is presented in Statement 2.3.
Statement 2.3DISTRICT-WISE POPULATION OF NCT DELHI: 2001 & 2011
5.2 It is evident from Statement 2.3 that more than 53 per cent of the population of Delhi in 2011 lived in three districts viz. North-west, South and West districts of Delhi. The district-wise population of Delhi in 2001 and 2011 is depicted in Chart 2.2
(Lakh)
1951
1961
1971
1981 1991
2001
2011
0
20
40
60
80
100
120
140
160
180
17.4426.59
40.66
62.2
94.21
138.51
167.88
(Lakh) Sl. No.
Years Delhi India Share of Delhi’s Population in All
India Population Growth
(%) Population Growth
(%) 1. 1951 17.44 -- 3610.88 -- 0.48 2. 1961 26.59 52.44 4392.35 21.64 0.61 3. 1971 40.66 52.93 5481.60 24.80 0.74 4. 1981 62.20 53.00 6833.29 24.66 0.91 5. 1991 94.21 51.45 8464.21 23.87 1.11 6. 2001 138.51 47.02 10287.37 21.54 1.35 7. 2011 167.88 21.20 12105.70 17.67 1.39
Source: - Census of India (Primary Census Abstract 2011).
Sl. No.
Districts 2001 2011 Number Per cent Rank Number Per cent Rank
1. North West 2860869 20.65 1 3656539 21.78 1 2. South 2267023 16.37 2 2731929 16.27 2 3 West 2128908 15.37 3 2543243 15.15 3 4 North East 1768061 12.77 4 2241624 13.35 5 5. South West 1755041 12.67 5 2292958 13.66 4 6. East 1463583 10.57 6 1709346 10.18 6 7. North 781525 5.64 7 887978 5.29 7 8. Central 646385 4.67 8 582320 3.47 8 9. New Delhi 179112 1.29 9 142004 0.85 9
Total 13850507 100.00 16787941 100.00 Source: - Census of India (Primary Census Abstract 2011).

20 ECONOMICSURVEYOFDELHI,2014-15 ECONOMICSURVEYOFDELHI,2014-15 21
Chart 2.2DISTRICT-WISE POPULATION OF DELHI-2001& 2011
6. Sex Ratio
6.1 Sex ratio is a very important demographic indicator for analyzing Socio Economic features of population. It is the ratio of females per thousand male population. As per 2011 census, the sex ratio of Delhi was 868. During the last decade sex ratio in Delhi increased from 821 in 2001 to 868 in 2011. In order to overcome this critical situation both at the national and state level, various stringent actions against female foeticide and complete abolition of sex determination practices during the pregnancy period have been introduced and implemented. The district-wise sex ratio of NCT Delhi in 2001and 2011 is presented in Statement 2.4.
Statement 2.4DISTRICT-WISE SEX RATIO OF NCT DELHI DURING 2001 &2011
6.2 In most of the Northern States in India, sex ratio indicated a critical situation as per 2001 and 2011 censuses. Sex ratio of northern states as per 2001 and 2011 Census is presented in Statement 2.5.
Statement 2.5SEX RATIO OF NORTHERN STATES IN INDIA- 2001& 2011
6.3 The total number of births registered in Delhi under Civil Registration System (CRS) is presented in Statement 2.6.
Statement 2.6BIRTHS REGISTERED UNDER CRS – SEX-WISE
2860869
2267023
2128908
1768061
1755041
1463583
781525
646385
179112
3656539
2731929
2543243
2241624
2292958
1709346
887978
582320
142004
0 1000000 2000000 3000000 4000000
North West
South
West
North East
South West
East
North
Central
New Delhi
2011 2001
Sl. No.
Districts Sex Ratio 2001 Rank 2011 Rank
1. North East 849 1 886 2 2. East 843 2 884 3 3 Central 842 3 892 1 4 West 830 4 875 4 5. North 826 5 869 5 6. North West 820 6 865 6 7. South 799 7 862 7 8. New Delhi 792 8 822 9 9. South West 784 9 840 8 Delhi 821 868 Source: - Census of India (Primary Census Abstract 2011).
Sl. No.
States Sex Ratio 2001 2011
1. Jammu and Kashmir 892 889 2. Himachal Pradesh 968 972 3 Punjab 876 895 4. Chandigarh 777 818 5 Uttarakhand 962 963 6. Haryana 861 879 7. Rajasthan 921 928 8. Uttar Pradesh 898 912 9. Delhi 821 868 India 933 943 Source: - Census of India (Primary Census Abstract 2011).
Sl. No
Years Births Sex Ratio Total Male Female
1. 2001 296287 163816 (55.29) 132471 (44.71) 809 2. 2002 300659 164184 (54.61) 136475 (45.39) 831 3. 2003 301165 165173 (54.84) 135992 (45.16) 823 4. 2004 305974 167849 (54.86) 138125 (45.14) 823 5. 2005 324336 178031 (54.89) 146305 (45.11) 822 6. 2006 322750 176242 (54.61) 146508 (45.39) 831 7. 2007 322044 174289 (54.12) 147755 (45.88) 848 8. 2008 333908 166583 (49.89) 167325 (50.11) 1004 9. 2009 354482 185131 (52.22) 169351 (47.78) 915
10. 2010 359463 189122(52.61) 170341(47.39) 901 11 2011 353759 186870(52.82) 166889(47.18) 893 12 2012 360473 191129(53.02) 169344(46.98) 886
13 2013 370000 195226(52.76) 174774(47.24) 895
Source: -Annual Report on Registration of Births and Deaths, 2013, Directorate of Economics and Statistics, Delhi.

22 ECONOMICSURVEYOFDELHI,2014-15 ECONOMICSURVEYOFDELHI,2014-15 23
6.4 Sex ratio as per the birth registered in Delhi under Civil Registration System (CRS) indicate
a positive picture, enhanced from 809 in 2001 to 895 in 2013.The increase in sex ratio
during 2005 to 2008 may be linked to the introduction of a number of schemes for
empowerment of women and welfare of children by the Government of NCT of Delhi.
6.5 On the basis of estimates of population for the year 2009, the sex ratio of selected nations is
presented in Statement 2.7.
Statement 2.7
SEX RATIO IN SELECTED NATIONS- 2009
7. Density of Population
7.1 Population density is an often reported and commonly compared statistics for places all
over the world. Population density is the measure of the number of population per unit area.
It is commonly represented as people residing per square kilometer. As per 2011 census,
the density of population in Delhi worked out at 11320 persons per square kilometer as
against the national level of 382 persons per square kilometer. Density of population in
Delhi was the highest among all States and Union Territories during the year 2011. District-
wise density of population in Delhi in 2001and 2011 is presented in Statement 2.8.
Statement 2.8
DISTRICT-WISE POPULATION DENSITY OF NCT DELHI
2001 AND 2011
7.2 It is evident from Statement 2.8 that North East District ranks the first in terms of population
density in Delhi at 36155 persons per Sq. Km and New Delhi ranks last district with
population density at 4057 persons per Sq. Km. During the last decade the density of
population in New Delhi showed a declining trend from 5117 persons per sq.km in 2001 to
4057 persons per sq. Km in 2011.
8. Household Size
8.1 Number of persons living together in one house commonly called as household size. As per
2011 census, there were 3340538 households in Delhi. The average size of household in
Delhi was found of 5.02. It indicates that in one house there had more than five persons.
More than one half of the households had more than five members during the year 2011.
The distribution of households by size in Delhi in 2001 and 2011 are presented in Statement
2.9.
(Number) Sl. No.
Nations Total Male Female Sex Ratio
1. China 1,345,750,973 698,405,850 647,345,123 927 2. India 1,198,003,272 618,942,535 579,060,737 936 3. United States of
America 314,658,780 155,244,097 159,414,683
1027 4. Indonesia 229,964,723 114,807,198 115,157,525 1003 5. Brazil 193,733,795 95,406,000 98,327,795 1031 6. Pakistan 180,808,096 93,101,700 87,706,396 942 7. Russian
Federation 140,873,647 65,096,448 75,777,199
1164 8. Bangladesh 162,220,762 82,032,166 80,188,596 978 9. Japan 127,156,225 61,939,779 65,216,446 1053 10 Nigeria 154,728,892 77,547,502 77,181,390 995 11. United Kingdom 61,565,422 30,202,183 31,363,239 1038 12. Sri Lanka 20,237,730 9,965,629 10,272,101 1031 13. South Africa 50,109,820 24,705,240 25,404,580 1028
World 6,829,360,438 3,442,850,573 3,386,509,865 984 Source:-http://www.geohive.com/earth/pop_gender.aspx
Sl. No.
Districts Population Density (Persons per Sq. Km) 2001 Rank 2011 Rank
1. North East 29,468 1 36155 1 2. Central 25,855 2 27730 2 3 East 22,868 3 27132 3 4 West 16,503 4 19563 4 5. North 13,246 5 14557 5 6. South 9,068 6 11060 6 7. North West 6,502 7 8254 7 8. New Delhi 5,117 8 4057 9 9. South West 4,169 9 5446 8
Delhi 9340 11320 Source: - Census of India, census 2011(primary census abstract).

24 ECONOMICSURVEYOFDELHI,2014-15 ECONOMICSURVEYOFDELHI,2014-15 25
Statement 2.9DISTRIBUTION OF HOUSEHOLDS BY SIZE IN DELHI- 2001&2011
9. Literacy Rate
9.1 As per the Census 2011, Delhi showed a high level of literacy i.e. 86.2 per cent as compared to 81.67 per cent in 2001 with the literacy rate of 90.9 per cent for males and 80.8 for females. The Rural and Urban literacy rates of Delhi were 81.9 and 86.3% respectively in 2011.
10. Age-wise Distribution of Population
10.1 The age-wise distribution of population is the best indicator of future human potential, the magnitude of responsibility of working population especially for taking care of children and their age-old parents. The information regarding the age-wise distribution of population in Delhi during the last two census periods is presented in Statement 2.10.
Statement 2.10AGE-WISE DISTRIBUTION OF POPULATION IN DELHI: 1991, 2001& 2011
10.2 It may be observed from Statement 2.10 that one third of total population in Delhi during 2001 was in the category of children within the age group of 0 to 14 and the percentage change was recorded at a minimal rate. The condition was more or less same in all other age-wise categories either at positive in one group or at negative in consecutive age group. The information regarding age-wise distribution of Population of Delhi during 2011 is depicted in Chart 2.3.
Chart 2.3: AGE-WISE DISTRIBUTION OF POPULATION IN DELHI 2011
11 Metro Cities Population
11.1 The population of metropolitan cities in India is presented in Statement 2.11.
Statement 2.11POPULATION OF SOME OF THE METROPOLITAN CITIES IN INDIA: 2001 & 2011
4565319
16673751764060
1668326
2753943
2008410
1196361
1147445
16702
0
500000
1000000
1500000
2000000
2500000
3000000
3500000
4000000
4500000
5000000
0-14 15-19 20-24 25-29 30-39 40-49 50-59 60 ormore
Age notstated
age-wise
Sl. No.
Age Group
1991 2001 2011 Number Per cent Number Per cent Number Per cent
1. 0-14 3273482 34.75 4492939 32.44 4565319 27.19 2. 15-19 914871 9.71 1427979 10.31 1667375 9.93 3. 20-24 982866 10.43 1426860 10.30 1764060 10.51 4. 25-29 956788 10.16 1358925 9.81 1668326 9.94 5. 30-39 1438035 15.26 2211006 15.96 2753943 16.40 6. 40-49 867731 9.21 1432467 10.34 2008410 11.96 7. 50-59 504149 5.35 759505 5.48 1196361 7.13 8. 60 or
more 439520 4.67 719650 5.20 1147445 6.83
9. Age not stated
43202 0.46 21176 0.15 16702 0.1
Total 9420644 100.00 13850507 100.00 16787941 100.00 Source: -Census of India. Primary Census Abstract 2011
Sl. No.
Metropolitan Cities
Population (Number) Ranks 2001 2011 2001 2011
1. Mumbai 16,434,386 18414288 1 1 2. Delhi 12,877,470 16314838 3 2 3. Kolkata 13,211,853 14112536 2 3 4. Chennai 6,560,242 8696010 4 4 5. Bangalore 5,701,456 8499399 6 5 6. Hyderabad 5,742,036 7749334 5 6
Source: - Census of India and Provisional Population census 2011.
Sl. No.
Size of Household No. of Household Per cent of total No. of Household
2001 2011* 2001 2011* 1. One member 99786 123106 3.90 3.70 2. Two members 206925 252370 8.10 7.60 3. Three members 295216 428403 11.56 12.80 4. Four Members 544289 803065 21.31 24.00 5. Five Members 506711 681142 19.84 20.40 6. Six to Eight Members 680065 853773 26.63 25.60 7. Nine or more members 221157 198679 8.66 5.90 Total Households 2554149 3340538 100.00 100.00
Source: -Houses, Household Amenities and Assets, Figures at a Glance, Census of India 2011.

26 ECONOMICSURVEYOFDELHI,2014-15 ECONOMICSURVEYOFDELHI,2014-15 27
11.2 It may be observed from Statement 2.11 that Delhi was placed at the third position during 2001 and came to second position during 2011. Population in Mumbai in 2001 was 16.43 million; 3.55 million higher than the Delhi's population. The difference between the population of Mumbai and Delhi in 2011 (census 2011) reduced to 2.1 million which clearly indicate the fast development of national capital city, Delhi. The population of metro cities in India during 2011 is depicted Chart 2.4.
Chart 2.4POPULATION OF METRO CITIES IN INDIA-2011
11.3 As the population increases, more people will prefer to live in large cities. Many people will live in the growing cities with over 10 million inhabitants, known as megacities. Megacities were numbered 16 in 2000. By 2025, there will be 27 megacities. The top ten largest urban agglomerations of the world during 1975, 2000 and 2025 are presented in Statement 2.12.
Statement 2.12TOP 10 LARGEST URBAN AGGLOMERATIONS: 1975, 2000 & 2025
11.4 It may be observed from Statement 2.12 that three cities in India (Mumbai, Kolkata and Delhi) shown as the top ten largest urban agglomerations of the world during 2000 and 2025 (Mumbai, Delhi and Kolkata). In 1975 Kolkata ranked 9th largest urban agglomerations in the world. All the three period placed Tokyo in Japan first in terms of number of population in urban agglomerations. The information regarding the growth rate of population in largest urban agglomerations of the world during 1975-2000 and 2000-2025 is presented in Statement 2.13.
Statement 2.13GROWTH RATE OF POPULATION IN LARGEST URBAN AGGLOMERATIONS
DURING 1975-2000 & 2000-2025
11.5 It may be observed from Statement 2.13 that highest annual growth rate of population during 1975-2000 and projected growth rate during 2000-2025 was recorded highest in Delhi at 7.27 per cent and 3.26 per cent per annum respectively, while Mumbai recorded second position during the period. The attributes towards highest growth of population in Delhi may be due to higher rate of migration of people from neighboring states as well as from other parts of the nation.
12. Urban- Rural Scenario in Delhi
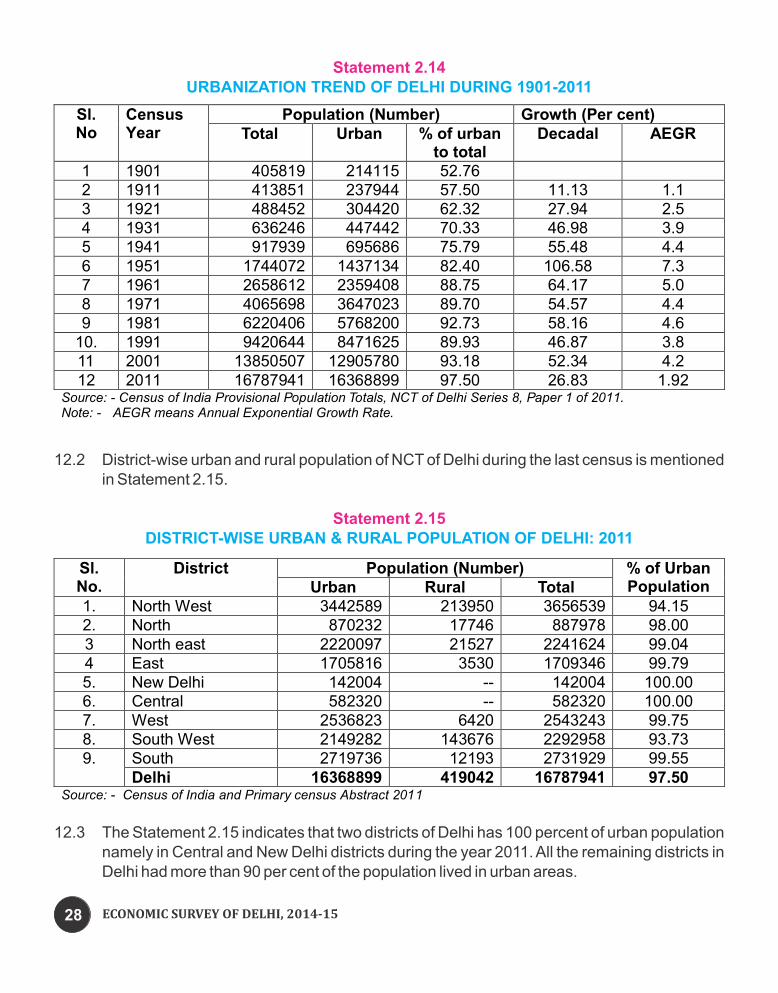
12.1 At the beginning of 21st century, more than 93 per cent of the population was in urban areas as compared to 53 per cent in 1901. This clearly indicates fast growth of urbanization in the national capital. The information regarding the urbanization trend in Delhi during the century is presented in Statement 2.14.
18414288
16314838
14112536
8696010
8499399
7749334
0 5,000,000 10,000,000 15,000,000 20,000,000 25,000,000
Mumbai
Delhi
Kolkata
Chennai
Bangalore
Hyderabad
(Million) Sl. No
1975 2000 2025 (projected) Cities Population Cities Population Cities Population
1. Tokyo 26.6 Tokyo 34.5 Tokyo 36.4 2. New York 15.9 Mexico City 18.0 Mumbai 26.4 3. Mexico City 10.7 New York 17.9 Delhi 22.5 4. Osaka 9.8 Sao Polo 17.1 Dhaka 21.4 5. Sao Polo 9.6 Mumbai 16.1 Sao Polo 21.4 6. Los Angels 8.9 Shanghai 13.2 Mexico City 21.0 7. Buenos Aires 8.8 Kolkata 13.1 New York 20.6
8. Paris 8.6 Delhi 12.4 Kolkata 20.6 9. Kolkata 7.9 Buenos Aires 11.9 Shanghai 19.4
10 Moscow 7.6 Los Angels 11.8 Karachi 19.1 Sources: -
1. United Nations, World Urbanization Prospects, the 2007 Revision. 2. http://www.un.org/esa/population/publications/WUP2005/2005WUP_FS7.pdf
Sl. No.
Name of Cities Population (million) Annual Growth Rate (Per cent)
1975 2000 Projected 2025 1975-2000 2000-2025 1. Tokyo 26.6 34.5 36.4 1.19 0.22 2. New York 15.9 17.9 20.6 0.50 0.60 3. Mexico City 10.7 18.0 21.0 2.73 0.67 4. Sao Polo 9.6 17.1 21.4 3.13 1.01 5. Kolkata 7.9 13.1 20.6 2.63 2.29 6. Mumbai 7.1 16.1 26.4 5.07 2.56 7. Delhi 4.4 12.4 22.5 7.27 3.26 Sources: -
1. United Nations, World Urbanization Prospects, the 2007 Revision. 2. http://www.un.org/esa/population/publications/WUP2005/2005WUP_FS7.pdf

26 ECONOMICSURVEYOFDELHI,2014-15 ECONOMICSURVEYOFDELHI,2014-15 27
11.2 It may be observed from Statement 2.11 that Delhi was placed at the third position during 2001 and came to second position during 2011. Population in Mumbai in 2001 was 16.43 million; 3.55 million higher than the Delhi's population. The difference between the population of Mumbai and Delhi in 2011 (census 2011) reduced to 2.1 million which clearly indicate the fast development of national capital city, Delhi. The population of metro cities in India during 2011 is depicted Chart 2.4.
Chart 2.4POPULATION OF METRO CITIES IN INDIA-2011
11.3 As the population increases, more people will prefer to live in large cities. Many people will live in the growing cities with over 10 million inhabitants, known as megacities. Megacities were numbered 16 in 2000. By 2025, there will be 27 megacities. The top ten largest urban agglomerations of the world during 1975, 2000 and 2025 are presented in Statement 2.12.
Statement 2.12TOP 10 LARGEST URBAN AGGLOMERATIONS: 1975, 2000 & 2025
11.4 It may be observed from Statement 2.12 that three cities in India (Mumbai, Kolkata and Delhi) shown as the top ten largest urban agglomerations of the world during 2000 and 2025 (Mumbai, Delhi and Kolkata). In 1975 Kolkata ranked 9th largest urban agglomerations in the world. All the three period placed Tokyo in Japan first in terms of number of population in urban agglomerations. The information regarding the growth rate of population in largest urban agglomerations of the world during 1975-2000 and 2000-2025 is presented in Statement 2.13.
Statement 2.13GROWTH RATE OF POPULATION IN LARGEST URBAN AGGLOMERATIONS
DURING 1975-2000 & 2000-2025
11.5 It may be observed from Statement 2.13 that highest annual growth rate of population during 1975-2000 and projected growth rate during 2000-2025 was recorded highest in Delhi at 7.27 per cent and 3.26 per cent per annum respectively, while Mumbai recorded second position during the period. The attributes towards highest growth of population in Delhi may be due to higher rate of migration of people from neighboring states as well as from other parts of the nation.
12. Urban- Rural Scenario in Delhi
12.1 At the beginning of 21st century, more than 93 per cent of the population was in urban areas as compared to 53 per cent in 1901. This clearly indicates fast growth of urbanization in the national capital. The information regarding the urbanization trend in Delhi during the century is presented in Statement 2.14.
18414288
16314838
14112536
8696010
8499399
7749334
0 5,000,000 10,000,000 15,000,000 20,000,000 25,000,000
Mumbai
Delhi
Kolkata
Chennai
Bangalore
Hyderabad
(Million) Sl. No
1975 2000 2025 (projected) Cities Population Cities Population Cities Population
1. Tokyo 26.6 Tokyo 34.5 Tokyo 36.4 2. New York 15.9 Mexico City 18.0 Mumbai 26.4 3. Mexico City 10.7 New York 17.9 Delhi 22.5 4. Osaka 9.8 Sao Polo 17.1 Dhaka 21.4 5. Sao Polo 9.6 Mumbai 16.1 Sao Polo 21.4 6. Los Angels 8.9 Shanghai 13.2 Mexico City 21.0 7. Buenos Aires 8.8 Kolkata 13.1 New York 20.6
8. Paris 8.6 Delhi 12.4 Kolkata 20.6 9. Kolkata 7.9 Buenos Aires 11.9 Shanghai 19.4
10 Moscow 7.6 Los Angels 11.8 Karachi 19.1 Sources: -
1. United Nations, World Urbanization Prospects, the 2007 Revision. 2. http://www.un.org/esa/population/publications/WUP2005/2005WUP_FS7.pdf
Sl. No.
Name of Cities Population (million) Annual Growth Rate (Per cent)
1975 2000 Projected 2025 1975-2000 2000-2025 1. Tokyo 26.6 34.5 36.4 1.19 0.22 2. New York 15.9 17.9 20.6 0.50 0.60 3. Mexico City 10.7 18.0 21.0 2.73 0.67 4. Sao Polo 9.6 17.1 21.4 3.13 1.01 5. Kolkata 7.9 13.1 20.6 2.63 2.29 6. Mumbai 7.1 16.1 26.4 5.07 2.56 7. Delhi 4.4 12.4 22.5 7.27 3.26 Sources: -
1. United Nations, World Urbanization Prospects, the 2007 Revision. 2. http://www.un.org/esa/population/publications/WUP2005/2005WUP_FS7.pdf
Sl. No.
District Population (Number) % of Urban Population Urban Rural Total
1. North West 3442589 213950 3656539 94.15 2. North 870232 17746 887978 98.00 3 North east 2220097 21527 2241624 99.04 4 East 1705816 3530 1709346 99.79 5. New Delhi 142004 -- 142004 100.00 6. Central 582320 -- 582320 100.00 7. West 2536823 6420 2543243 99.75 8. South West 2149282 143676 2292958 93.73 9. South 2719736 12193 2731929 99.55
Delhi 16368899 419042 16787941 97.50 Source: - Census of India and Primary census Abstract 2011
Sl. No
Census Year
Population (Number) Growth (Per cent) Total Urban % of urban
to total Decadal AEGR
1 1901 405819 214115 52.76 2 1911 413851 237944 57.50 11.13 1.1 3 1921 488452 304420 62.32 27.94 2.5 4 1931 636246 447442 70.33 46.98 3.9 5 1941 917939 695686 75.79 55.48 4.4 6 1951 1744072 1437134 82.40 106.58 7.3 7 1961 2658612 2359408 88.75 64.17 5.0 8 1971 4065698 3647023 89.70 54.57 4.4 9 1981 6220406 5768200 92.73 58.16 4.6
10. 1991 9420644 8471625 89.93 46.87 3.8 11 2001 13850507 12905780 93.18 52.34 4.2 12 2011 16787941 16368899 97.50 26.83 1.92
Source: - Census of India Provisional Population Totals, NCT of Delhi Series 8, Paper 1 of 2011. Note: - AEGR means Annual Exponential Growth Rate.
28 ECONOMICSURVEYOFDELHI,2014-15 ECONOMICSURVEYOFDELHI,2014-15 29
Statement 2.14URBANIZATION TREND OF DELHI DURING 1901-2011
12.2 District-wise urban and rural population of NCT of Delhi during the last census is mentioned in Statement 2.15.
Statement 2.15DISTRICT-WISE URBAN & RURAL POPULATION OF DELHI: 2011
12.3 The Statement 2.15 indicates that two districts of Delhi has 100 percent of urban population namely in Central and New Delhi districts during the year 2011. All the remaining districts in Delhi had more than 90 per cent of the population lived in urban areas.
13 Vital Rates
13.1 Vital rates are perhaps the most widely used national, state, and local data generally includes birth, death and infant mortality rates. The information regarding vital rates (Both Civil Registration System and Sample Registration System) in Delhi is presented in Statement 2.16.
13.2 Civil Registration System is the legal recording of the occurrence of vital events (birth and death) through a network of government offices and designated officials, together with certain identifying or descriptive characteristics of the events on a continuous, permanent and compulsory basis. Civil Registration System also serves as the tool for measuring the changes in the population. In other words population census held once in a period of 10 years gives stock of population at a point of time whereas, Vital statistics presents the flow of population.
Statement 2.16VITAL RATES IN DELHI: CRS AND SRS
13.3 It may be inferred from Statement 2.16 that the vital rates of Delhi during 2001-2011 under CRS showed a positive trend in birth and infant mortality rates. On the contrary the death rate by CRS indicated slightly a increasing trend. Under SRS system both birthrate and death rate showed a positive trend while infant mortality rates showed a negative trend.
Sl. No
Year *Estimated Mid Year
Population (Lakh)
Vital Rates (Per Thousand) Birth Rate Death Rate Infant Mortality
Rate
SRS CRS* SRS CRS SRS
1. 2001 139.40 21.23 18.9 5.81 5.1 24 29 2. 2002 142.10 21.18 17.2 6.05 5.1 16 30 3. 2003 144.86 20.78 17.3 6.07 5.0 17 28 4. 2004 147.68 20.72 18.4 5.76 4.7 13 32 5. 2005 150.54 21.52 18.6 6.24 4.6 13 35 6. 2006 153.47 21.05 18.4 6.45 4.7 18 37 7. 2007 156.45 20.58 18.1 6.46 4.8 25 36 8. 2008 159.49 21.94 18.4 6.77 4.8 18 35 9. 2009 162.58 21.77 18.1 6.89 4.4 19 33
10. 2010 165.74 21.66 17.8 7.48 4.2 22 30 11. 2011 168.96 20.89 17.5 6.63 4.3 22 28 12 2012 172.24 20.90 17.3 6.10 4.2 24 25 13 2013 175.59 21.07 17.2 5.52 4.1 22 24
Source: -Office of Chief Registrar, Births & Deaths, Government of NCT Delhi. *estimated midyear population based on Census 2011
Notes: - CRS- Civil Registration System and SRS- Sample Registration System.
CRS*

30 ECONOMICSURVEYOFDELHI,2014-15 ECONOMICSURVEYOFDELHI,2014-15 31
14. Migration
14.1 The estimates of migration in Delhi are based on birth and death rates and total increase in population. It may be observed from Statement 2.17 that the percentage of migration was 18.51 per cent in 2013, while the percentage of natural growth in 2013 was 81.49 per cent. In absolute terms, natural increase in population during 2013 was 2.73 lakh, whereas migration has been estimated at 0.62 lakh. The trend of migration from 2001 to 2013 is given in the Statement 2.17.
Statement 2.17TREND OF MIGRATION IN DELHI 2001-2011
14.2 As per census 2001, a good percentage of population in Delhi was migrant, majority of them from the neighboring states of Uttar Pradesh, Haryana, Rajasthan, Punjab etc. The information regarding state-wise migration in Delhi during the year 2001 is presented in Statement 2.18.
Statement 2.18STATE-WISE MIGRATION IN DELHI-2001
14.3 It is evident from above Statement that more than two fifth of the migrants in Delhi during the year 2001 were from Uttar Pradesh. Second and third position of high percentage of migrant population in Delhi during 2001 was from Bihar and Haryana with 14 percent and 10 per cent respectively. The information regarding state-wise migration in Delhi during 2001 is depicted in Chart 2.5
Chart 2.5STATE-WISE MIGRATION IN DELHI-2001
15. Language-wise Distribution of Population in Delhi
15.1 At the time of collection of census details, the information is collected about people on the basis of their mother tongue. The information regarding the distribution of scheduled languages during 1991 and 2001 is presented in Statement 2.19.
(Lakh) Sl. No.
Year Estimated Mid Year
Population
Increased Population Over Previous Year
Total Natural Increase
Migration Birth Death
1. 2001 139.40 -- 2.96 0.81 2.15 -- 2. 2002 142.10 2.7 3.01 0.86 2.15 0.55 3. 2003 144.86 2.76 3.01 0.88 2.13 0.63 4. 2004 147.68 2.82 3.06 0.85 2.21 0.61 5. 2005 150.54 2.86 3.24 0.94 2.30 0.56 6. 2006 153.47 2.93 3.23 0.99 2.24 0.69 7. 2007 156.45 2.98 3.22 1.01 2.21 0.77 8. 2008 159.49 3.04 3.34 1.08 2.26 0.78 9. 2009 162.58 3.09 3.54 1.12 2.42 0.67
10. 2010 165.74 3.16 3.59 1.24 2.35 0.81 11. 2011 168.96 3.22 3.53 1.12 2.41 0.81 12 2012 172.24 3.28 3.60 1.05 2.55 0.73 13 2013 175.59 3.35 3.70 0.97 2.73 0.62
Source: -Office of Chief Registrar, Births & Deaths, Government of NCT Delhi. *estimated midyear population based Census 2011 Notes: - 1. Natural Increase of population means the difference between total births and deaths.
2. Migrated population is the difference between increased population and natural increase in population.
Sl. No States Per cent
1. Uttar Pradesh 43.13
2. Bihar 13.63
3. Haryana 10.43
4. Rajasthan 5.16
5. Punjab 4.81
6. West Bengal 3.22
7. Madhya Pradesh 1.90
8. Other States 17.72
Source: -Census of India
(Per cent)
43.13
13.63
10.43
5.16
4.81
3.221.9
17.72
Uttar Pradesh Bihar Haryana Rajasthan
Punjab West Bengal Madhya Pradesh Other States

15.2 It may be inferred from Statement 2.19 Hindi constitutes the mother tongue of more than 80 per cent of the population of Delhi during 1991 and 2001. Punjabi and Urdu are the other two main important mother tongues in both the period covered under the study.
Statement 2.19LANGUAGE-WISE DISTRIBUTION OF POPULATION
IN DELHI-1991 & 2001
16. Disabled Population in Delhi
16.1 As per 2011 census more than 2.34 lakh persons in Delhi were under the category of disabled and constitute 1.4 per cent of the total population in Delhi. The distribution of disabled population by sex, type of disability in NCT Delhi is presented in Statement 2.20.
Statement 2.20DISABLED POPULATION IN DELHI-2011
16.2 It may be inferred from Statement 2.20 that a good percentage of disabled persons facing the problem of movement disability and it constitutes about 29% of the disabled population. Near about 0.67 lakh persons in Delhi were facing movement disabilities.
Sl. No.
Languages 1991 2001 Number % Number %
1. Assamese 2730 0.03 6329 0.05 2. Bengali 121938 1.29 208414 1.51 3. Bodo 0 0.0 222 0.01 4. Dogri 0 0.0 6974 0.05 5. Gujrati 26372 0.28 45145 0.33 6. Hindi 7690631 81.64 11210843 80.94 7. Kannada 9923 0.10 10525 0.08 8. Kashmiri 11360 0.12 21325 0.15 9. Konkani 2518 0.03 1767 0.01
10. Maithili 0 0.0 85331 0.62 11. Malayalam 64952 0.69 92009 0.66 12. Manipuri 221 0.01 2020 0.02 13. Marathi 20393 0.22 26472 0.19 14. Nepali 26390 0.28 44367 0.32 15. Oriya 13099 0.14 29178 0.21 16. Punjabi 748145 7.94 988980 7.14 17. Sanskrit 587 0.01 288 0.01 18. Santali 0 0.0 364 0.01 19. Sindhi 37381 0.40 42841 0.31 20. Tamil 84873 0.90 92426 0.67 21. Telugu 22882 0.24 28067 0.20 22. Urdu 512990 5.45 874333 6.31
Total 9397745 99.76 13818220 99.77 Source: - Census of India 1991 &2001.
Sl. No
Disability in Disabled Population (Number) Urban Rural Total
Male Female Male Female Male Female Total 1. Seeing 16434 12898 430 362 16864 13260 30124 2. Speaking 8738 6017 208 131 8946 6148 15094 3. Hearing 18845 14829 432 393 19277 15222 34499 4. Walking 39529 25969 1198 687 40727 26656 67383 5. Mind 16260 9527 417 180 16677 9707 26384 6. Any Other
Disability 21197 14811 586 419 21783 15230 37013
7. Multiple Disability
13708 10004 397 276 14105 10280 24385
Total 134711 94055 3668 2448 138379 96503 234882 Source: - Census of India. 2011
ECONOMICSURVEYOFDELHI,2014-1532 ECONOMICSURVEYOFDELHI,2014-15 33