Embed Size (px)
Citation preview
Chapter 2 Titrimetric and spectrophotometric assay of atenolol
24
SECTION 2.0
DRUG PROFILE AND LITERATURE SURVEY
2.0.1 DRUG PROFILE
Atenolol (ATN), is chemically known as, 2-[4-[(2RS)-2-hydroxy-3-[(1-
methylethyl)amino]propoxy]phenyl]acetamide [1]. Its molecular formula is
C14H22N2O3 and molecular weight is 266.34 g mol-1. The chemical structure of ATN
is as shown below:
O
H2N
NH
OH
O
It is a white powder, soluble in water, acetonitrile, acetic acid, sparingly
soluble in ethanol, acetone, dioxane, dichloromethane and chloroform.
It was first developed by the pharmaceutical company Imperial Chemical
Industries in the late 1970s [2]. ATN is a β1-selective (cardioselective) adrenoreceptor
antagonist drug commonly used for management of hypertension, prevention of heart
diseases as angina pectoris and control of some forms of cardiac arrhythmia. It is also
indicated for prophylaxis of migraine [3].
ATN is officially reported in European Pharmacopoeia (EP) [4], British
Pharmacopoeia (BP) [5], and Indian Pharmacopoeia (IP) [6]. BP and EP both describe
non-aqueous titration with perchloric acid as titrant where the end point is located
potentiometrically. IP describes an UV-spectrophotmetric method for the assay of
ATN.
Chapter 2 Titrimetric and spectrophotometric assay of atenolol
25
2.0.2 LITERATURE SURVEY OF ANALYTICAL METHODS FOR
ATENOLOL
A literature survey regarding the quantitative analysis of ATN revealed that
several methods based on techniques such as titrimetry, UV/visible spectrophotometry
and chromatography have been developed for the determination of ATN in
pharmaceutical formulations. A brief review of those methods is given below.
2.0.2.1 Titrimetric methods
There are only five reports on the titrimetric determination of ATN. A method
reported by Marmo [7] consisted of dissolving 0.2 g of ATN in 20 mL of 0.05 M
H2SO4 followed by back titration of the residual acid with 0.1 M NaOH using methyl
red-bromocresol green mixed indication for visual location of end point. Basavaiah et
al [8] reported a titrimetric method based on the oxidation of atenolol by a measured
excess of cerium(IV) sulphate in acid medium followed by the determination of the
amount of unreacted oxidant by ferrous ammonium sulphate using ferroin as
indicator. Basavaiah et al [9] reported a titrimetric method involving the oxidation of
ATN by a measured excess of chloramine-T (CAT) in acid medium followed by the
determination of the residual oxidant by iodometric back titration. A method based on
the bromination reaction in which ATN was treated with a known excess of bromate-
bromide mixture in acid medium followed by the determination of unreacted bromine
by iodometry has been reported by the same authors [10]. Three more methods
reported by Basavaiah et al [11] involves the reaction of weakly basic ATN with a
measured excess of acid followed by the titration of residual acid with base by visual,
potentiometric and conductometric end point detection.
2.0.2.2 UV-Visible spectrophotometric methods
There are a few reports on the UV-spectrophotometric determination of ATN
in dosage forms when present in combination with other drugs [12-17].
There are only two reports dealing with the UV-spectrophotometric assay of
ATN in dosage forms when present alone. Huang and Jin [18] have determined ATN
in tablets by measuring the absorbance of the tablet extract in 0.01 M HCl at 224 nm.
The calibration graph was linear over 0.5-25.0 µg mL-1. Measurement of the
absorbance of the tablet extract in anhydrous ethanol at 227 nm enabling the
Chapter 2 Titrimetric and spectrophotometric assay of atenolol
26
determination of ATN in the concentration range 4.0-24.0 µg mL-1 has been reported
by Wang [19].
To the best of the author’s knowledge, there are twelve reports on the use of
visible spectrophotometry for the determination of ATN in pharmaceuticals. Agrawal
et al [20] reported a method based on the reaction of ATN with hydroxylamine
hydrochloride in NaOH medium followed by the reaction of the resultant hydroxamic
acid derivative with FeCl3 to give a red-violet ferric hydroxamate complex which was
measured at 510 nm and the method is applicable over a concentration range of 50.0-
800.0 µg mL-1. Bashir et al [21] have reported a method in which ATN in basic
medium reacts with sodium nitroprusside to generate a colored complex that absorbs
at 495 nm and Beer’s law was obeyed over the concentration range of 0.5-30.0 µg
mL-1. In a method reported by Korang et al [22] ATN in chloroform treated with
chloranil and propan-2-ol in acetaldehyde and resulting coupled product was
measured at 690 nm. In a method reported by Basavaiah et al [11] ATN reacts with
phenol red and the resulting yellow colored product was measured at 430 nm between
a linear range of 3-30 µg mL-1.
A kinetic method developed by Hiremath et al [23] based on the oxidation of
atenolol by a known excess of permanganate in alkaline medium and unreacted
permanganate was measured at 526 nm by rate-constant, constant-concentration and
constant-time methods between the concentration range 1.06-6.6 mg mL-1
Basavaiah et al [24] have reported a method based on the oxidation of ATN by
a measured excess of CAT followed by determination of the unreacted oxidant by a
charge-transfer complexation reaction involving metol and sulphanilic acid. The
absorbance of the product was measured at 520 nm and the method is applicable over
a concentration range of 2.2-25.0 µg mL-1. Two methods reported by Basavaiah et al
[9] in which the drug is treated with a measured excess of CAT in HCl medium and
subsequent determination of the unreacted oxidant with metanil yellow or indigo
carmine and measuring the absorbance at 530 nm or 610 nm, respectively. Beer’s law
was obeyed over a concentration range of 1.0-20.0 µg mL-1 for metanil yellow
method and 2.2-20.0 µg mL-1 for indigo carmine method. Basavaiah et al [10] devised
one more method by treating ATN with a known excess of bromate-bromide mixture
in HCl medium, and after 10 min, the unreacted oxidant was determined by reacting
with methyl orange and measuring the absorbance at 520 nm and the method is
applicable over a concentration range of 0.5-4.0 µg mL-1.
Chapter 2 Titrimetric and spectrophotometric assay of atenolol
27
Three methods reported by Basavaiah et al [8] based on the oxidation of ATN
by a measured excess of cerium(IV) sulphate in acid medium followed by the
determination of the amount of unreacted oxidant by using ferroin, methyl orange or
iron(III)-thiocyanate as reagents at 510 nm, 520 nm and 480 nm, respectively. Beer’s
law was obeyed over a concentration range of 2.5-35.0 µg mL-1 for ferroin method,
2.5-60.0 µg mL-1 for methyl orange method and 0.6-8.75 µg mL-1 for iron(III)
thiocyanate method.
Agarwal et al [25] reported a method based on charge transfer complexation
reaction of ATN with choranilic acid and absorbance was measured at 534 nm
between the concentration range 25.0-250.0 µg mL-1. Similarly, Yu et al [26] reported
a charge transfer complexation reaction of ATN with choranilic acid and absorbance
was measured at 530 nm between the concentration range 10.0-280.0 µg mL-1.
2.0.2.3 Other methods
Of the chromatographic techniques, HPLC is perhaps the most frequently
used for the determination of ATN in single as well as combined dosage forms.
Several methods were reported for the quantification of ATN when present
alone [27-31].
HPLC procedure have also been proposed for the determination of ATN when
present in combination with amlodipine [32,33], nifidipine [34-36],
hydrochlorthiazide and amiloride [37,38], nitrendipine [39], hydrochlorthiazide and
chlorthalidone [40] or amiloride and chlorthalidone [41].
Procedures based on several other chromatographic techniques such as liquid
chromatography (LC) [42], ion-pair LC [43], chiral LC [44], LC-mass
spectrophotometry [45], non-supressed ion-chromatography [46], thin layer
chromatography (TLC) [47], HPTLC [48] gas liquid chromatography [49-51] and
ultra performance liquid chromatography (UPLC) [52] are found in the literature for
the assay of ATN in pharmaceuticals, when present in combined dosage forms.
Many other techniques including spectrofluorometry [53-55], atomic
absorption spectrometry [56], nuclear magnetic resonance spectrometry [57],
differential scanning calorimetry-thermogravimetry [58], kinetic mass spectrometry
[59], capillary electrophoresis [60], capillary zone electrophoresis [61-63] and
chemometric-assisted spectrophotometry [64,41] have been applied for the
Chapter 2 Titrimetric and spectrophotometric assay of atenolol
28
determination of ATN in pharmaceuticals. But, majority of the techniques are devoted
to assay in combined dosage forms.
From the foregoing paragraphs, it is clear that titrimetric methods are indirect,
time consuming [7-11], and require higher acid concentrations [7]. The currently
available UV-spectrophotometric methods [18,19] for assay of ATN in single dosage
forms are not stability indicating. The reported visible spectrophotometric methods
are cumbersome due to heating step [20,21]. In addition, few methods are either less
sensitive or based on the measurement of less stable colored species
[8,11,20,24,25,26].
Other non-spectrophotometric methods require expensive instrumentation
which is less readily accessible to most laboratories in third world countries. There is,
therefore, a need for simple and sensitive methods for the assay of ATN.
Keeping in view the limitations of the reported titrimetric, UV and visible
spectrophotometric methods and the need for alternatives, some more titrimetric and
spectrophotometric methods including a UV- spectrophotometric method which is
stability-indicating were developed. The details are presented in this chapter.
Chapter 2 Titrimetric and spectrophotometric assay of atenolol
29
Section 2.1
DETERMINATION OF ATENOLOL AND ITS PHARMACEUTICAL
PREPARATIONS BY ACID –BASE TITRATION IN NON – AQUEOUS
MEDIUM
2.1.1 INTRODUCTION
Non-aqueous titrations are titrations carried out in the absence of water. These
titrations are based on the principle of Lowry-Bronsted theory and are particularly
useful for the assay of drugs that are very weakly acidic or basic, so weak in fact that
they will not ionize in aqueous conditions. Water, being an amphoteric compound,
acts to suppress the ionization of very weak acids and bases. All the apparatus and
glassware for a non-aqueous titration must be scrupulously dry, as even a drop of
water will ruin the whole assay [65]. The non-aqueous titrations have become of
considerable importance in pharmaceutical analysis and have been accepted by the
majority of modern pharmacopoeias as an official analytical method such as British
pharmacopoeia (2009) [5]. Non-aqueous titration is the most common titrimetric
procedure used in pharmacopoeial assays and serves a double purpose, as it is suitable
for the titration of very weak acids and bases and provides a solvent in which organic
compounds are soluble [66].
A large number of drugs are either weakly acidic (such as barbiturates,
phenytoin or sulfonamides), or weak bases (antihistamines, local anaesthetics,
morphine, etc.). The weak acids are usually titrated with tetrabutylammonium
hydroxide (N(Bu)4OH) or potassium methoxide (CH3OK) in dimethylformamide
(DMF) as solvent. Weak bases are dissolved in glacial acetic acid and titrated with
perchloric acid (HClO4). Acetic acid is a very weak proton acceptor and thus does not
compete effectively with weak bases for protons. Only very strong acids will
protonate acetic acid appreciably according to the following equation:
HA+CH3COOH CH3COOH2+ + A
Perchloric acid is the strongest of the common acids in acetic acid solution and
the titration medium usually used for non-aqueous titration of bases is perchloric acid
in acetic acid. These assays sometimes take some perfecting in terms of being able to
judge precisely the end-point. The end point of this type of titrations is detected either
This work has been published in Der Pharma Lettre, 2012, 4 (5): 1534-1540.
Chapter 2 Titrimetric and spectrophotometric assay of atenolol
30
visually using indicators or potentiometrically using a potentiometer or pH meter. The
most popular indicator for the non-aqueous titration of bases is crystal violet and other
indicators used include p- naphtholbenzein, quinaldine red and malachite green [67].
In many cases, the color change is complex and the end point can be detected by
measuring the potential of a glass electrode using a potentiometer or pH meter with a
suitable indicator and reference electrodes.
Non-aqueous titration with acetous perchloric acid is used in the
pharmacopoeial assays of many compounds such as adrenaline, aciclovir, adenine,
adenosine, alanine, alcuronium chloride, alfuzosin hydrochloride, alprazolam,
bifonazole, domperidone maleate, gliclazide, loperamide oxide monohydrate,
nikethamide, pefloxacin mesilate and sulpiride, etc., to mention a few [5]. BP and EP
describe non aqueous titrimetry for the quantification of ATN but, require 0.1 M
HClO4 and involve only potentiometric titration. In this section, two non-aqueous
titrimetric procedures for the determination of ATN in tablets have been developed
and validated. The methods are based on the neutralization reaction of the secondary
amino group of ATN with acetous perchloric acid (0.005 M) as titrant in anhydrous
acetic acid medium. The end point was detected both visually using crystal violet as
indicator and potentiometrically using modified glass electrode-SCE electrode
system. The details about the reaction chemistry, method development and validation
are presented in this Section (2.1).
2.1.2 EXPERIMENTAL
2.1.2.1 Instrument
An Elico 120 digital pH meter provided with a combined glass-SCE electrode
system was used for potentiometric titration. The KCl of the salt bridge was replaced
with saturated solution of KCl in glacial acetic acid.
2.1.2.2 Reagents and materials
All chemicals used were of analytical reagent grade. All solutions were made
in glacial acetic acid (S. D. Fine Chem, Mumbai, India) unless mentioned otherwise.
Pharmaceutical grade atenolol (ATN) certified to be 99.89 % pure was gifted by Cipla
India Ltd., Mumbai, India, and was used as received. The following pharmaceutical
preparations were purchased from commercial sources in the local market and
subjected to analysis: Atenex-25 (25 mg ATN per tablet) from Zydas Healthcare, East
Sikkim, India; Atekind-50 (50 mg ATN per tablet) from Mankind Pharma Ltd., New
Chapter 2 Titrimetric and spectrophotometric assay of atenolol
31
Delhi, India, and Aten-100 (100 mg ATN per tablet) from Zydas Healthcare, East
Sikkim, India.
Perchloric acid (0.005 M): The stock solution of (~0.1 M) perchloric acid (S. D. Fine
Chem, Mumbai, India) was standardized with pure potassium hydrogen phthalate and
crystal violet as indicator [68], and then diluted appropriately with glacial acetic acid
to get a working solution of 0.005 M perchloric acid.
Crystal violet indicator (0.1 %): Prepared by dissolving 50 mg of dye (S. D. Fine
Chem, Mumbai, India) in 50 mL of glacial acetic acid.
Standard ATN solution (1.5 mg mL-1): Stock standard solution containing 1.5 mg
mL-1 drug was prepared by dissolving the required amount of ATN (Cipla India Ltd.,
Mumbai, India) in glacial acetic acid.
2.1.2.3 Assay procedures
Visual titration
An aliquot of the drug solution containing 1.5-15.0 mg of ATN was measured
accurately and transferred into a clean and dry 100 mL titration flask and the total
volume was brought to 10 mL with glacial acetic acid. Two drops of crystal violet
indicator were added and titrated with standard 0.005 M perchloric acid to a blue
colour end point. An indicator blank titration was performed and corrections to the
sample titration were applied. The amount of the drug in the measured aliquot was
calculated from
Amount (mg) = VMwR/n
where V = volume of perchloric acid consumed (mL); Mw = relative molecular mass
of the drug; R = molarity of the perchloric acid and n = number of moles of perchloric
acid reacting with each mole of ATN.
Potentiometric titration
An aliquot of the standard drug solution equivalent to 1.5-15.0 mg of ATN
was measured accurately and transferred into a clean and dry 50 mL beaker and the
solution was diluted to 25 mL by adding glacial acetic acid. The combined glass-SCE
(modified) system was dipped in the solution. The content was stirred magnetically
and the titrant (0.005 M HClO4) was added from a microburette. Near the equivalence
point, titrant was added in 0.1 mL increments. After each addition of titrant, the
solution was stirred magnetically for 30 s and the steady potential (e.m.f) was noted.
The addition of titrant was continued until there was no significant change in potential
Chapter 2 Titrimetric and spectrophotometric assay of atenolol
32
on further addition of titrant observed. The equivalence point was determined
graphically. The amount of the drug in the measured aliquot was calculated as
described under visual titration.
Procedure for tablets
Twenty tablets each containing 25, 50 or 100 mg of ATN were weighed
accurately and pulverized. An amount of powdered tablet equivalent to 150 mg of
ATN was transferred into a 100 mL calibrated flask and 60 mL of glacial acetic acid
was added. The content was shaken thoroughly for about 15-20 min, diluted to the
mark with glacial acetic acid, mixed well and filtered using a Whatman No. 42 filter
paper. The first 10 mL portion of the filtrate was discarded and a suitable aliquot was
taken and assayed by following the general procedures described for visual and
potentiometric end point detection.
Procedure for selectivity study
A placebo blank containing starch (10 mg), acacia (15 mg), hydroxyl cellulose
(10 mg), sodium citrate (10 mg), talc (20 mg), magnesium stearate (15 mg) and
sodium alginate (10 mg) was made and its solution was prepared as described under
“Procedure for tablets” and then 10 mg of the above mixture subjected to analysis by
the proposed methods.
To 100 mg of the placebo blank described above, 150 mg of ATN was added,
homogenized and the solution of the synthetic mixture was prepared in a 100 mL
calibration flask as described under “Procedure for tablets”. The filtrate was collected
and analyzed by following the procedures of both visual and potentiometric titrations.
2.1.3 RESULTS AND DISCUSSION
2.1.3.1 Chemistry
The methods are based on the principle that substances, which are weakly
basic in aqueous medium, when dissolved in non-aqueous solvents exhibit enhanced
basicity thus allowing their easy determination. In the present titrimetric methods, the
weakly basic property of ATN was enhanced due to the non-leveling effect of glacial
acetic acid and titrated with perchloric acid with visual and potentiometric end point
detection. Crystal violet gave satisfactory end point for the amounts of analyte and
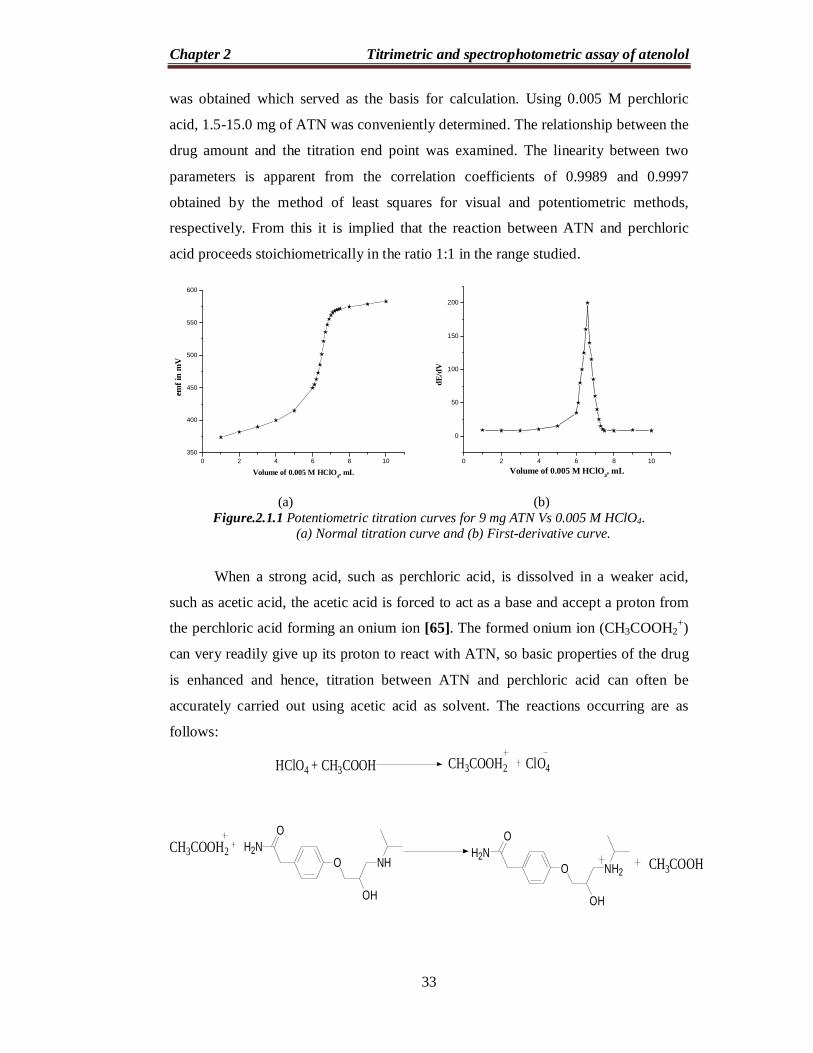
concentrations of titrant employed. A steep rise in the potential was observed at the
equivalence point with potentiometric end point detection (Figure. 2.1.1). With both
methods of equivalence point detection, a reaction stoichiometry of 1:1 (drug:titrant)
Chapter 2 Titrimetric and spectrophotometric assay of atenolol
33
was obtained which served as the basis for calculation. Using 0.005 M perchloric
acid, 1.5-15.0 mg of ATN was conveniently determined. The relationship between the
drug amount and the titration end point was examined. The linearity between two
parameters is apparent from the correlation coefficients of 0.9989 and 0.9997
obtained by the method of least squares for visual and potentiometric methods,
respectively. From this it is implied that the reaction between ATN and perchloric
acid proceeds stoichiometrically in the ratio 1:1 in the range studied.
(a) (b)
Figure.2.1.1 Potentiometric titration curves for 9 mg ATN Vs 0.005 M HClO4. (a) Normal titration curve and (b) First-derivative curve.
When a strong acid, such as perchloric acid, is dissolved in a weaker acid,
such as acetic acid, the acetic acid is forced to act as a base and accept a proton from
the perchloric acid forming an onium ion [65]. The formed onium ion (CH3COOH2+)
can very readily give up its proton to react with ATN, so basic properties of the drug
is enhanced and hence, titration between ATN and perchloric acid can often be
accurately carried out using acetic acid as solvent. The reactions occurring are as
follows:
HClO4 + CH3COOH CH3COOH2 ClO4
OH2N
NH
OH
OCH3COOH2
OH2N
NH2
OH
O
CH3COOH
0 2 4 6 8 10350
400
450
500
550
600
emf i
n m
V
Volume of 0.005 M HClO4, mL0 2 4 6 8 10
0
50
100
150
200
dE/d
V
Volume of 0.005 M HClO4, mL
Chapter 2 Titrimetric and spectrophotometric assay of atenolol
34
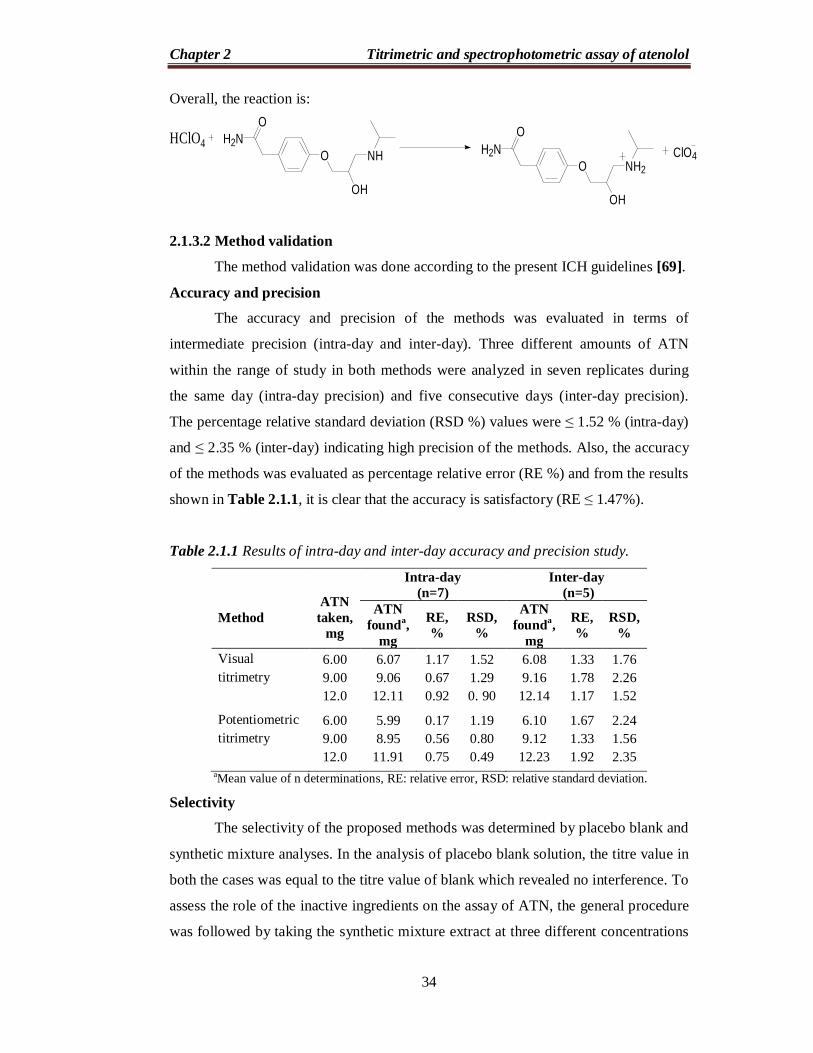
Overall, the reaction is:
OH2N
NH
OH
OHClO4
OH2N
NH2
OH
OClO4
2.1.3.2 Method validation
The method validation was done according to the present ICH guidelines [69].
Accuracy and precision
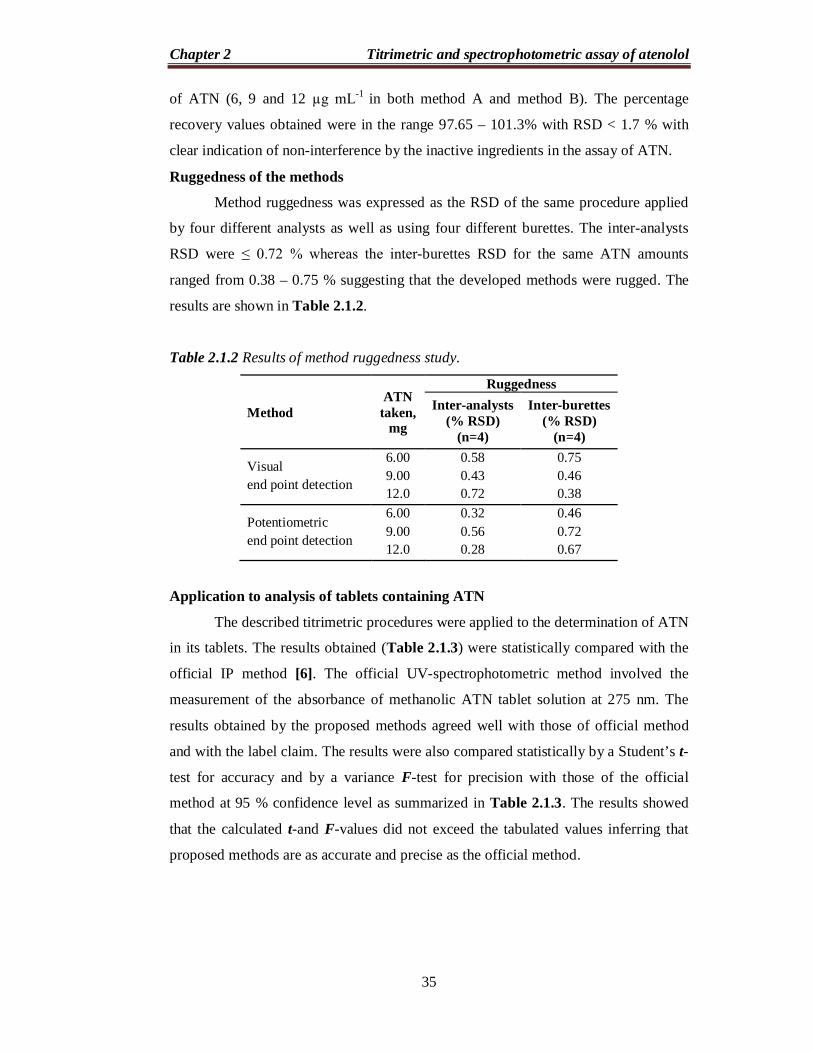
The accuracy and precision of the methods was evaluated in terms of
intermediate precision (intra-day and inter-day). Three different amounts of ATN
within the range of study in both methods were analyzed in seven replicates during
the same day (intra-day precision) and five consecutive days (inter-day precision).
The percentage relative standard deviation (RSD %) values were ≤ 1.52 % (intra-day)
and ≤ 2.35 % (inter-day) indicating high precision of the methods. Also, the accuracy
of the methods was evaluated as percentage relative error (RE %) and from the results
shown in Table 2.1.1, it is clear that the accuracy is satisfactory (RE ≤ 1.47%).
Table 2.1.1 Results of intra-day and inter-day accuracy and precision study.
Method
ATN
taken, mg
Intra-day (n=7)
Inter-day (n=5)
ATN founda,
mg RE, %
RSD, %
ATN founda,
mg RE, %
RSD, %
Visual titrimetry
6.00 9.00 12.0
6.07 9.06
12.11
1.17 0.67 0.92
1.52 1.29 0. 90
6.08 9.16
12.14
1.33 1.78 1.17
1.76 2.26 1.52
Potentiometric titrimetry
6.00 9.00 12.0
5.99 8.95
11.91
0.17 0.56 0.75
1.19 0.80 0.49
6.10 9.12
12.23
1.67 1.33 1.92
2.24 1.56 2.35
aMean value of n determinations, RE: relative error, RSD: relative standard deviation.
Selectivity
The selectivity of the proposed methods was determined by placebo blank and
synthetic mixture analyses. In the analysis of placebo blank solution, the titre value in
both the cases was equal to the titre value of blank which revealed no interference. To
assess the role of the inactive ingredients on the assay of ATN, the general procedure
was followed by taking the synthetic mixture extract at three different concentrations
Chapter 2 Titrimetric and spectrophotometric assay of atenolol
35
of ATN (6, 9 and 12 µg mL-1 in both method A and method B). The percentage
recovery values obtained were in the range 97.65 – 101.3% with RSD < 1.7 % with
clear indication of non-interference by the inactive ingredients in the assay of ATN.
Ruggedness of the methods
Method ruggedness was expressed as the RSD of the same procedure applied
by four different analysts as well as using four different burettes. The inter-analysts
RSD were ≤ 0.72 % whereas the inter-burettes RSD for the same ATN amounts
ranged from 0.38 – 0.75 % suggesting that the developed methods were rugged. The
results are shown in Table 2.1.2.
Table 2.1.2 Results of method ruggedness study.
Method ATN
taken, mg
Ruggedness Inter-analysts
(% RSD) (n=4)
Inter-burettes (% RSD)
(n=4)
Visual end point detection
6.00 9.00 12.0
0.58 0.43 0.72
0.75 0.46 0.38
Potentiometric end point detection
6.00 9.00 12.0
0.32 0.56 0.28
0.46 0.72 0.67
Application to analysis of tablets containing ATN
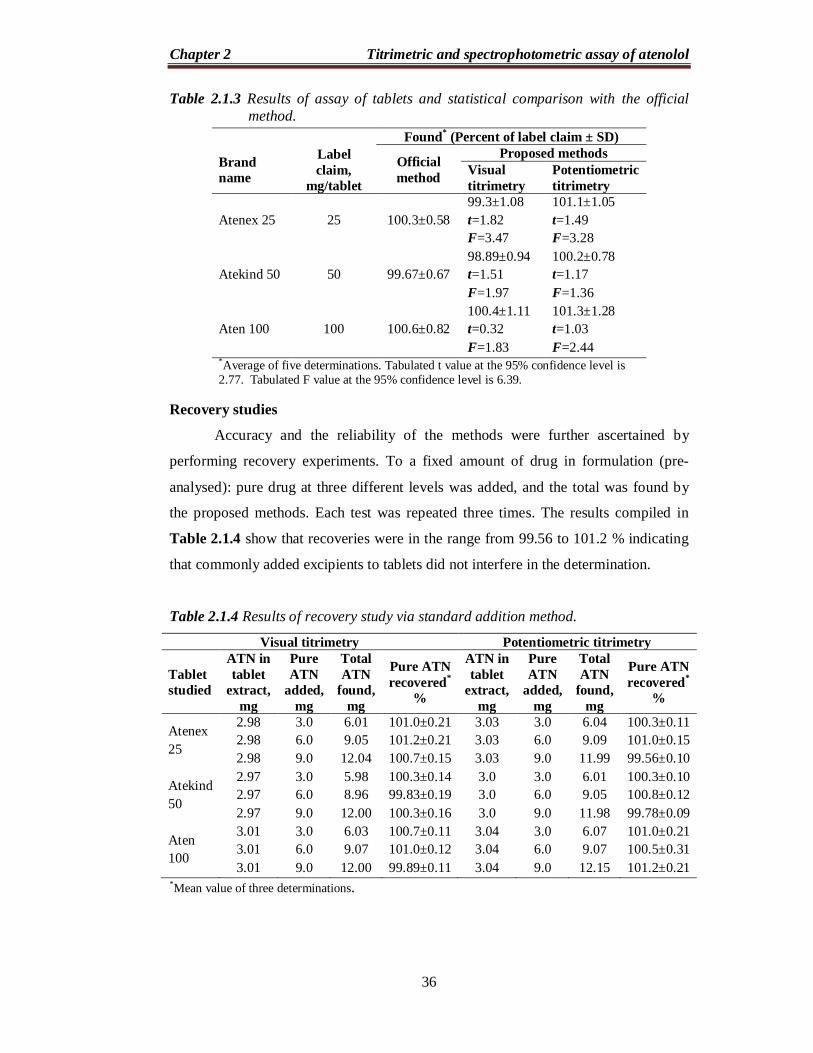
The described titrimetric procedures were applied to the determination of ATN
in its tablets. The results obtained (Table 2.1.3) were statistically compared with the
official IP method [6]. The official UV-spectrophotometric method involved the
measurement of the absorbance of methanolic ATN tablet solution at 275 nm. The
results obtained by the proposed methods agreed well with those of official method
and with the label claim. The results were also compared statistically by a Student’s t-
test for accuracy and by a variance F-test for precision with those of the official
method at 95 % confidence level as summarized in Table 2.1.3. The results showed
that the calculated t-and F-values did not exceed the tabulated values inferring that
proposed methods are as accurate and precise as the official method.
Chapter 2 Titrimetric and spectrophotometric assay of atenolol
36
Table 2.1.3 Results of assay of tablets and statistical comparison with the official method.
Recovery studies
Accuracy and the reliability of the methods were further ascertained by
performing recovery experiments. To a fixed amount of drug in formulation (pre-
analysed): pure drug at three different levels was added, and the total was found by
the proposed methods. Each test was repeated three times. The results compiled in
Table 2.1.4 show that recoveries were in the range from 99.56 to 101.2 % indicating
that commonly added excipients to tablets did not interfere in the determination.
Table 2.1.4 Results of recovery study via standard addition method.
Visual titrimetry Potentiometric titrimetry
Tablet studied
ATN in tablet
extract, mg
Pure ATN
added, mg
Total ATN
found, mg
Pure ATN recovered*
%
ATN in tablet
extract, mg
Pure ATN
added, mg
Total ATN
found, mg
Pure ATN recovered*
%
Atenex 25
2.98 2.98 2.98
3.0 6.0 9.0
6.01 9.05
12.04
101.0±0.21 101.2±0.21 100.7±0.15
3.03 3.03 3.03
3.0 6.0 9.0
6.04 9.09
11.99
100.3±0.11 101.0±0.15 99.56±0.10
Atekind 50
2.97 2.97 2.97
3.0 6.0 9.0
5.98 8.96
12.00
100.3±0.14 99.83±0.19 100.3±0.16
3.0 3.0 3.0
3.0 6.0 9.0
6.01 9.05
11.98
100.3±0.10 100.8±0.12 99.78±0.09
Aten 100
3.01 3.01 3.01
3.0 6.0 9.0
6.03 9.07
12.00
100.7±0.11 101.0±0.12 99.89±0.11
3.04 3.04 3.04
3.0 6.0 9.0
6.07 9.07
12.15
101.0±0.21 100.5±0.31 101.2±0.21
*Mean value of three determinations.
Brand name
Label claim,
mg/tablet
Found* (Percent of label claim ± SD)
Official method
Proposed methods Visual titrimetry
Potentiometric titrimetry
Atenex 25 25 100.3±0.58 99.3±1.08 t=1.82 F=3.47
101.1±1.05 t=1.49 F=3.28
Atekind 50 50 99.67±0.67 98.89±0.94 t=1.51 F=1.97
100.2±0.78 t=1.17 F=1.36
Aten 100 100 100.6±0.82 100.4±1.11 t=0.32 F=1.83
101.3±1.28 t=1.03 F=2.44
*Average of five determinations. Tabulated t value at the 95% confidence level is 2.77. Tabulated F value at the 95% confidence level is 6.39.
Chapter 2 Titrimetric and spectrophotometric assay of atenolol
37
Section 2.2
SPECTROPHOTOMETRIC DETERMINATION OF ATENOLOL IN
PHARMACEUTICALS THROUGH CHARGE-TRANSFER COMPLEX
FORMATION REACTION
2.2.1 INTRODUCTION
The molecular interaction between electron donors and acceptors are generally
associated with the formation of intensely colored charge-transfer complex [70] which
absorbs radiation in the visible region. Amines are excellent electron donors and
quinines are good electron acceptors [71-74]. The formation of outer complexes or
electron donor-acceptor (EDA) complexes between quinone and amines is well
known. Since both the donor and the acceptor are often very reactive, chemical
reaction can occur between them. Charge transfer phenomenon was introduced first
by Mulliken [75] and widely discussed by Foster [76] to define a new type of adduct
to explain the behavior of certain classes of molecules which do not conform to
classical patterns of ionic, covalent, and coordination of hydrogen bonding
components. While such adducts largely retain some of the properties of the
components, some changes are apparent, e.g., its solubility, the diamagnetic and
paramagnetic susceptibility. The charge-transfer complexation arises from the partial
transfer of an electron from a donating molecule having sufficient low ionization
potential to an accepting one having sufficient high electron affinity and as a result,
formation of intensely colored charge transfer complexes which absorb radiation in
the visible region [77].
Compounds with unshared pairs of electrons may interact with other
compounds through the donation of such electrons in a manner different from the
traditional dative bond formation. Those interactions giving rise to intermolecular
forces may be sufficiently strong or show features that do not exactly fit the definition
of the classical dipole–dipole, dipole-induced dipole and/or van der Waals
interactions. Depending upon the orbital that accepts these electrons, these acceptors
may be described as d - or p -acceptors [78].
Quinones have long been known to react with amines to give coloured
products. The color reaction with p-benzoquinone was first reported by Fouery [79] This work has been published in Acta Poloniae Pharmaceutica-Drug Research, 2012, 69(2): 213-223.
Chapter 2 Titrimetric and spectrophotometric assay of atenolol
38
and later developed into a quantitative method [80-82]. In addition, a number of
substituted quinones are known to form C-T complexes with amines and amine-
containing substances which have permitted the determination of many
pharmaceutical compounds containing amino group such as mefenamic acid [83],
some psychotropic phenothiazine drugs [84], certain cephalosporins [85], some
pharmaceutical amides [86], some antibacterial drugs [87], some corticosteroid drugs
[88], certain cardiovascular drugs [89], guanidino drugs [90], some pharmaceutical
piperazine derivatives [91], cyproheptadine HCl, methdilazine HCl and promethazine
theoclate [92], nizatidine, haloperidol and droperidol [93], clobetasol propionate,
halobetasol propionate and quinagolide HCl [94], amodiaquine HCl, chloroquine
phosphate and primaquine phosphate [95], mebrophenhydramine HCl and
hydroxyzine HCl [96], astemizole and loratadine [97], cetirizine [98], isoxsuprine
HCl [99], zidovudine [100], amoxycillin [101], clozapine [102], ondansetron HCl
[103], praziquantel [104], ciprofloxacin [105], sulbutamol [106], oxamniquine [107],
metoclopramide [108], disopyramide [109], ranitidine HCl [110], nortriptyline [111],
barbiturates and phenytoin [112], perindopril [113], ganciclovir [114], ketamine HCl
[115], diethylcarbamazine citrate [116], terfenadine [117], loperamide HCl [118],
moclobemide [119], famotidine [120], diclofenac sodium [121] ketorolac
tromethamine [122] and bupropion [123] etc., to mention a few.
Similarly, aromatic nitro compounds also act as electron acceptors. Interaction
between nitrophenols (picric acid, 2,4-dinitrophenol) and compounds containing
amine groups may give rise to the formation of charge transfer complex where a
proton is transferred from nitrophenols to the amine, as well as to charge-transfer
interaction via partial transfer of charge from n-lone pair of the amine to the oxygen-
π* of the nitro-group [124]. Modern understanding of C-T interaction involves the
partial transfer of charge from the highest occupied molecular orbital (HOMO) to the
lowest unoccupied molecular orbital (LUMO) of the C-T complex [70]. Specifically,
the nature of interaction between PA or DNP and ATN is presumed to be of charge-
transfer type (i.e., transfer of electronic charge from the amine donor to nitrophenol
acceptors). Few pharmaceutical compounds [125-129] were quantitatively analyzed
by utilizing nitrophenols as electron acceptors.
From the literature survey of the methods for the assay of atenolol presented in
Section 2.0.2 and from the foregoing paragraphs, it is clear that atenolol has been
assayed by visible spectrophotometry based on charge-transfer complex formation
Chapter 2 Titrimetric and spectrophotometric assay of atenolol
39
reaction using chloranilic acid as a π-acceptor. The author has studied the reaction
between ATN and DDQ in acetonitrile medium and the reaction between ATN and
nitrophenols in dichloromethane medium based on which three simple and moderately
sensitive methods have been developed for the determination of ATN in tablets. The
details regarding the method development and method validation are presented in this
Section.
2.2.2 EXPERIMENTAL
2.2.2.1 Instrument
A Systronics model 106 digital spectrophotometer (Systronics, Ahmedabad,
Gujarat, India) provided with 1 cm matched quartz cells was used for all absorbance
measurements.
2.2.2.2 Reagents and materials
All reagents used were of analytical reagent grade and HPLC grade organic
solvents were used throughout the investigation.
2,3-Dichloro-5,6-dicyano-1,4-benzoquinone (DDQ): A 0.1 % (w/v) DDQ solution
was prepared by dissolving 100 mg of the chemical (S.D. Fine Chem Ltd, Mumbai) in
1,4 dioxane and diluted to the mark with same solvent in 100 mL calibrated flask. It
was prepared afresh just before use.
2,6-Dinitrophenol (DNP): A 0.1 % (w/v) solution was prepared by dissolving 100
mg of the chemical (S.D. Fine Chem Ltd, Mumbai) in dichloromethane and made up
to the mark in a 100 mL calibrated flask with the same solvent. This solution was kept
in the dark when not in use.
Picric acid (PA): A 0.05 % (w/v) solution was prepared by dissolving 50 mg of the
chemical (S.D. Fine Chem Ltd, Mumbai) in dichloromethane and made up to the
mark in a 100 mL calibrated flask with the same solvent.
Standard ATN solution: A stock standard solution containing 100 µg mL-1 ATN was
prepared by dissolving 10 mg of pure drug in acetonitrile and diluting to the mark in a
100 mL calibrated flask with the same solvent. This was diluted appropriately with
acetonitrile to get the working concentrations of 60, 40 and 30 µg mL-1 ATN for
methods using DDQ, DNP and PA, respectively.
The pharmaceutical grade ATN and tablets used in this study are those
mentioned in the Section 2.1.2.2.
Chapter 2 Titrimetric and spectrophotometric assay of atenolol
40
2.2.2.3 Assay procedures
Method A (using DDQ)
Varying aliquots (0.25– 4.0 mL) of a standard ATN solution (60 µg mL-1)
were accurately transferred into a series of 5 mL calibrated flasks using a micro
burette and the total volume in each flask was brought to 4 mL by adding adequate
quantity of acetonitrile. To each flask, 1 mL of 0.1% DDQ solution was added, the
content was mixed well and the absorbance was measured at 590 nm against a reagent
blank similarly prepared without adding ATN solution.
Method B (using DNP)
Different aliquots (0.25–3.0 mL) of standard ATN solution (40 µg mL-1) were
accurately transferred into a series of 5 mL calibration flasks as described above. One
milliliter of 0.1% DNP solution was added to each flask and diluted to volume with
dichloromethane. The content was mixed well and the absorbance was measured at
420 nm against a reagent blank.
Method C (using PA)
Aliquots (0.25–3.0 mL) of a standard ATN (30 µg mL-1) solution were
accurately transferred into a series of 5 mL calibration flasks and the total volume was
brought to 3 mL by adding acetonitrile. To each flask, 1 mL of 0.05% PA solution
was added and the solution made up to volume with dichloromethane. The content
was mixed well and the absorbance was measured at 420 nm against a reagent blank
after 5 min.
Standard graph was prepared by plotting the absorbance versus ATN
concentration, and the concentration of the unknown was read from the calibration
graph or computed from the respective regression equation.
Procedure for tablets
Twenty tablets were weighed and pulverized. An amount of tablet powder
equivalent to 10 mg ATN was extracted with three 30 mL portions of acetonitrile. The
extracts were filtered using Whatmann No 42 filter paper; the filtrate was collected in
a 100 mL calibrated flask and diluted to volume with acetonitrile. A suitable aliquot
of the filtrate (100 µg mL-1 ATN) was diluted to get the working concentrations of 60,
40 and 30 µg mL-1 ATN for analysis by methods A, B and C, respectively, as
described above.
Chapter 2 Titrimetric and spectrophotometric assay of atenolol
41
Procedure for selectivity study
A placebo blank was prepared as described under Section 2.1.2.3, and then 10
mg placebo blank extracted in acetonitrile or dichloromethane was analyzed as done
in “Procedure for tablets”.
A synthetic mixture was prepared by adding pure ATN (50 mg) to 30 mg of
the above mentioned placebo blank and the mixture was homogenized. Synthetic
mixture containing 10 mg of ATN was weighed and its solution was prepared as
under “Procedure for tablets”. Two different aliquots were subjected to analysis by
the general procedure and the concentration of ATN was found from the calibration
graph or from the regression equation.
2.2.3 RESULTS AND DISCUSSION
2.2.3.1 Absorption spectra
The reaction of ATN as n-electron donor and the π-acceptors such as DDQ,
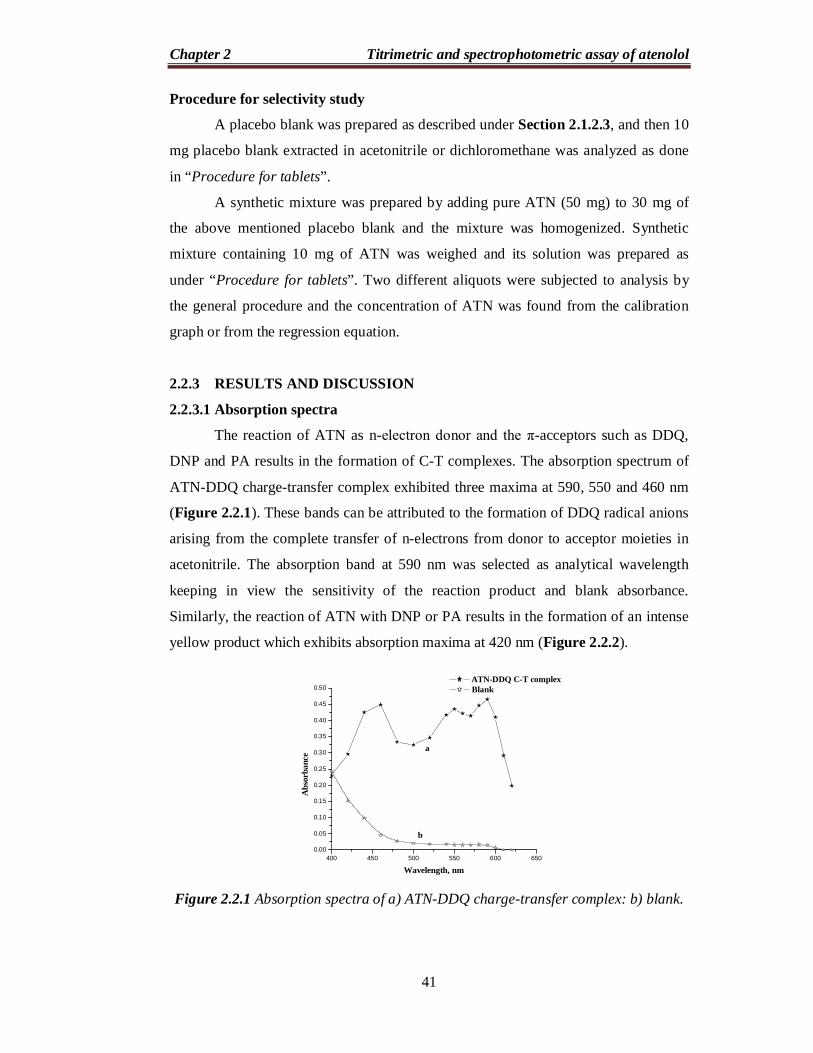
DNP and PA results in the formation of C-T complexes. The absorption spectrum of
ATN-DDQ charge-transfer complex exhibited three maxima at 590, 550 and 460 nm
(Figure 2.2.1). These bands can be attributed to the formation of DDQ radical anions
arising from the complete transfer of n-electrons from donor to acceptor moieties in
acetonitrile. The absorption band at 590 nm was selected as analytical wavelength
keeping in view the sensitivity of the reaction product and blank absorbance.
Similarly, the reaction of ATN with DNP or PA results in the formation of an intense
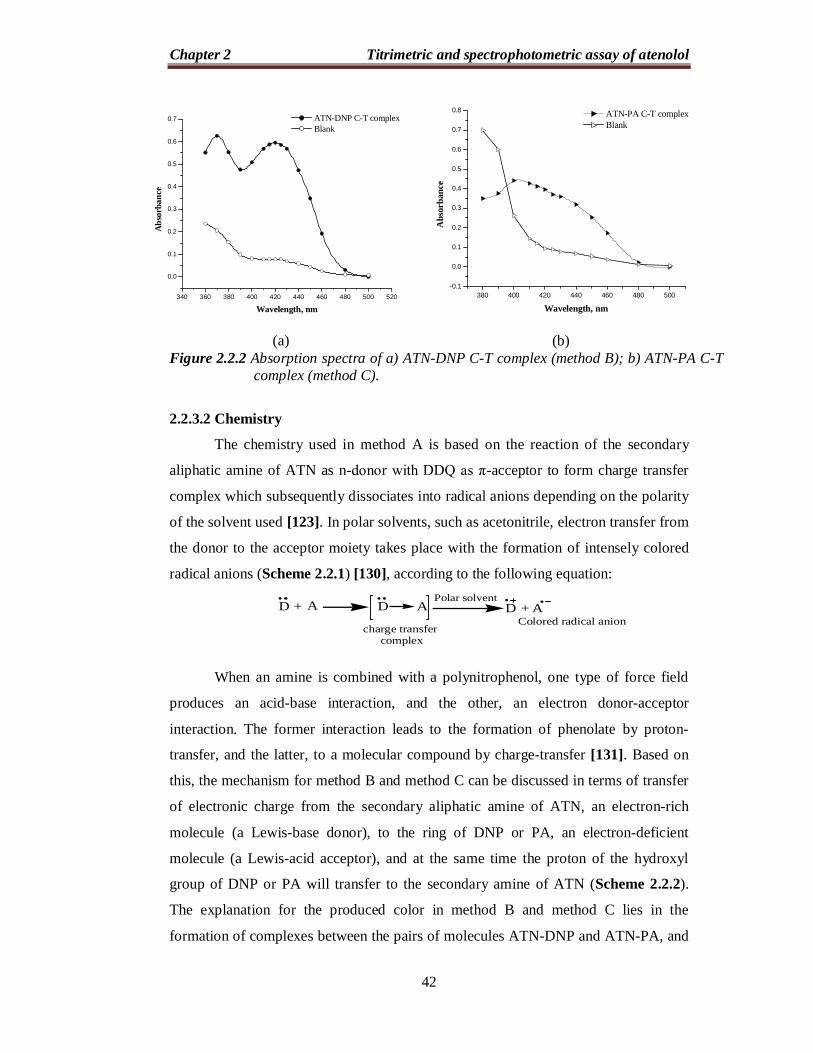
yellow product which exhibits absorption maxima at 420 nm (Figure 2.2.2).
Figure 2.2.1 Absorption spectra of a) ATN-DDQ charge-transfer complex: b) blank.
400 450 500 550 600 6500.00
0.05
0.10
0.15
0.20
0.25
0.30
0.35
0.40
0.45
0.50
b
a
Abs
orba
nce
Wavelength, nm
ATN-DDQ C-T complex Blank
Chapter 2 Titrimetric and spectrophotometric assay of atenolol
42
(a) (b)
Figure 2.2.2 Absorption spectra of a) ATN-DNP C-T complex (method B); b) ATN-PA C-T complex (method C).
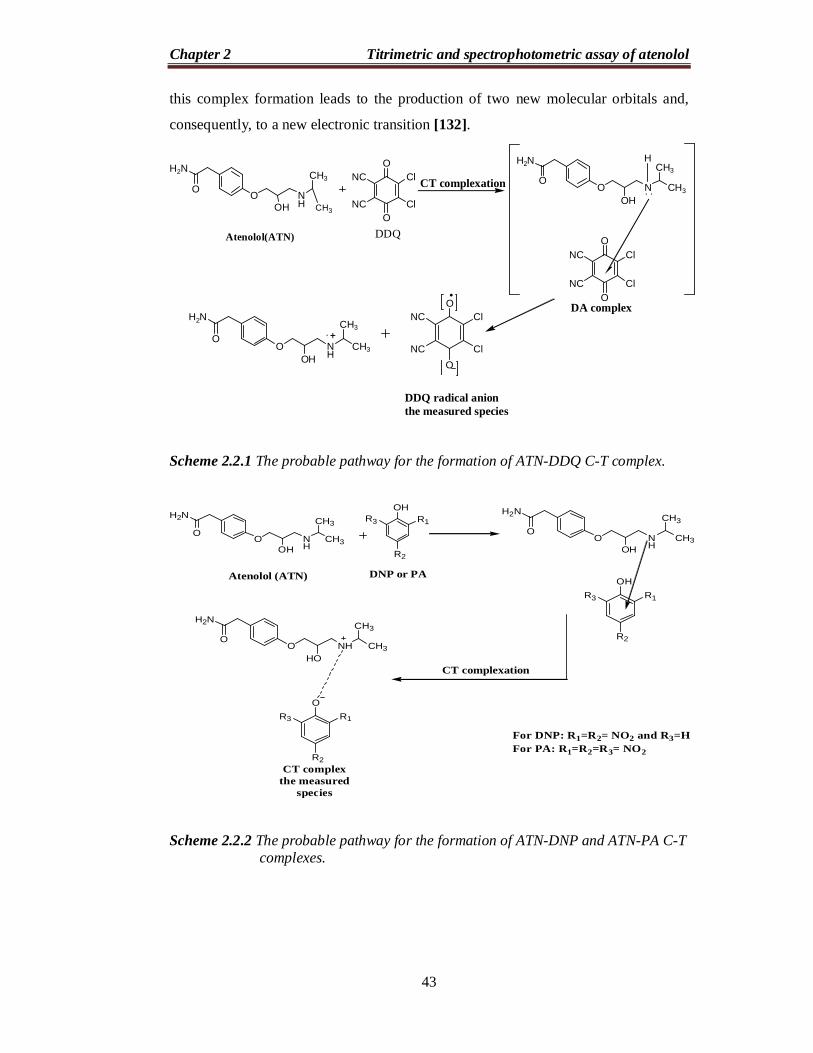
2.2.3.2 Chemistry
The chemistry used in method A is based on the reaction of the secondary
aliphatic amine of ATN as n-donor with DDQ as π-acceptor to form charge transfer
complex which subsequently dissociates into radical anions depending on the polarity
of the solvent used [123]. In polar solvents, such as acetonitrile, electron transfer from
the donor to the acceptor moiety takes place with the formation of intensely colored
radical anions (Scheme 2.2.1) [130], according to the following equation:
When an amine is combined with a polynitrophenol, one type of force field
produces an acid-base interaction, and the other, an electron donor-acceptor
interaction. The former interaction leads to the formation of phenolate by proton-
transfer, and the latter, to a molecular compound by charge-transfer [131]. Based on
this, the mechanism for method B and method C can be discussed in terms of transfer
of electronic charge from the secondary aliphatic amine of ATN, an electron-rich
molecule (a Lewis-base donor), to the ring of DNP or PA, an electron-deficient
molecule (a Lewis-acid acceptor), and at the same time the proton of the hydroxyl
group of DNP or PA will transfer to the secondary amine of ATN (Scheme 2.2.2).
The explanation for the produced color in method B and method C lies in the
formation of complexes between the pairs of molecules ATN-DNP and ATN-PA, and
340 360 380 400 420 440 460 480 500 520
0.0
0.1
0.2
0.3
0.4
0.5
0.6
0.7
Abs
orba
nce
Wavelength, nm
ATN-DNP C-T complex Blank
380 400 420 440 460 480 500-0.1
0.0
0.1
0.2
0.3
0.4
0.5
0.6
0.7
0.8
Abs
orba
nce
Wavelength, nm
ATN-PA C-T complex Blank
D + A D A
charge transfer complex
Polar solventD + A
Colored radical anion
Chapter 2 Titrimetric and spectrophotometric assay of atenolol
43
this complex formation leads to the production of two new molecular orbitals and,
consequently, to a new electronic transition [132].
O
O
Cl
ClNC
NC
O
O
Cl
ClNC
NC
O
O
Cl
ClNC
NC
H2N
O O NHOH CH3
CH3
H2N
OO N
HOHCH3
CH3
Atenolol(ATN) DDQ
CT complexation
H2N
OO N
OHCH3
CH3H
DA complex
DDQ radical anion the measured species
Scheme 2.2.1 The probable pathway for the formation of ATN-DDQ C-T complex.
OHR1
R2
R3
H2N
OO N
HOHCH3
CH3H2N
OO N
HOHCH3
CH3
OHR1
R2
R3
OR1
R2
R3
H2N
OO NH
HOCH3
CH3
Atenolol (ATN) DNP or PA
CT complexthe measured
species
CT complexation
For DNP: R1=R2= NO2 and R3=H For PA: R1=R2=R3= NO2
Scheme 2.2.2 The probable pathway for the formation of ATN-DNP and ATN-PA C-T
complexes.
Chapter 2 Titrimetric and spectrophotometric assay of atenolol
44
2.2.3.3 Optimization of experimental variables
Many experimental variables which were found to affect the color intensity
and stability of the resulting complexes were optimized to achieve maximum
sensitivity and adherence to Beer’s law.
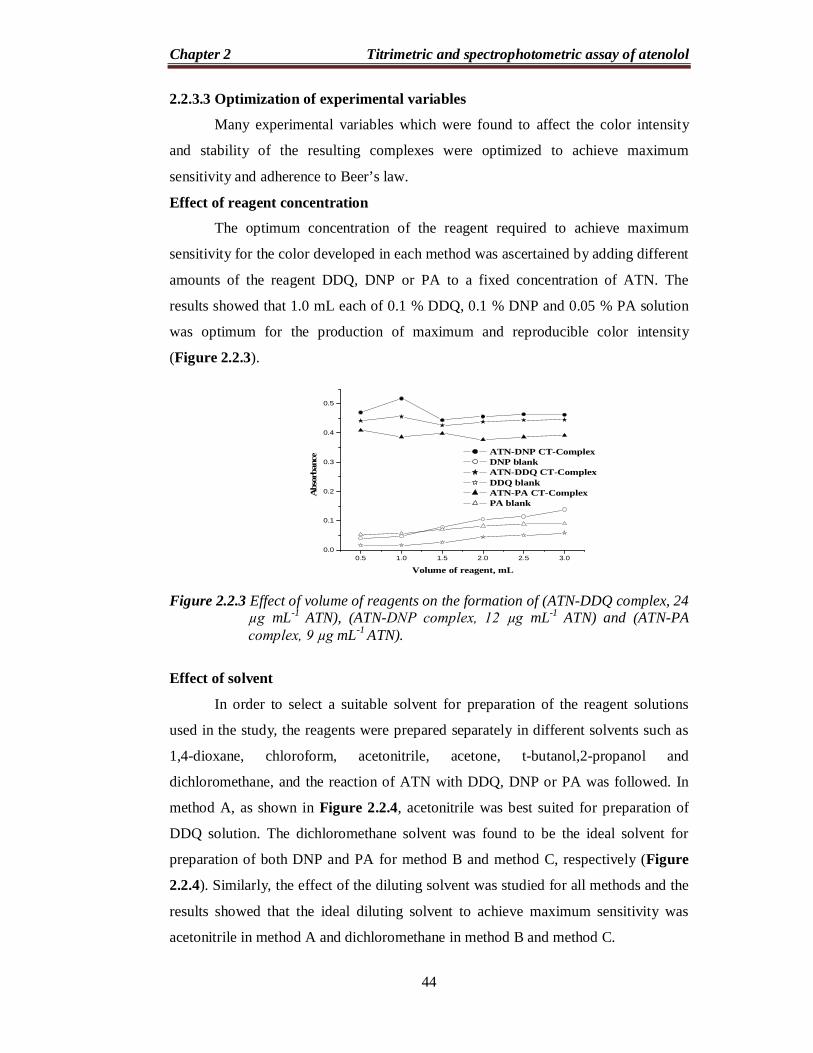
Effect of reagent concentration
The optimum concentration of the reagent required to achieve maximum
sensitivity for the color developed in each method was ascertained by adding different
amounts of the reagent DDQ, DNP or PA to a fixed concentration of ATN. The
results showed that 1.0 mL each of 0.1 % DDQ, 0.1 % DNP and 0.05 % PA solution
was optimum for the production of maximum and reproducible color intensity
(Figure 2.2.3).
Figure 2.2.3 Effect of volume of reagents on the formation of (ATN-DDQ complex, 24
µg mL-1 ATN), (ATN-DNP complex, 12 µg mL-1 ATN) and (ATN-PA complex, 9 µg mL-1 ATN).
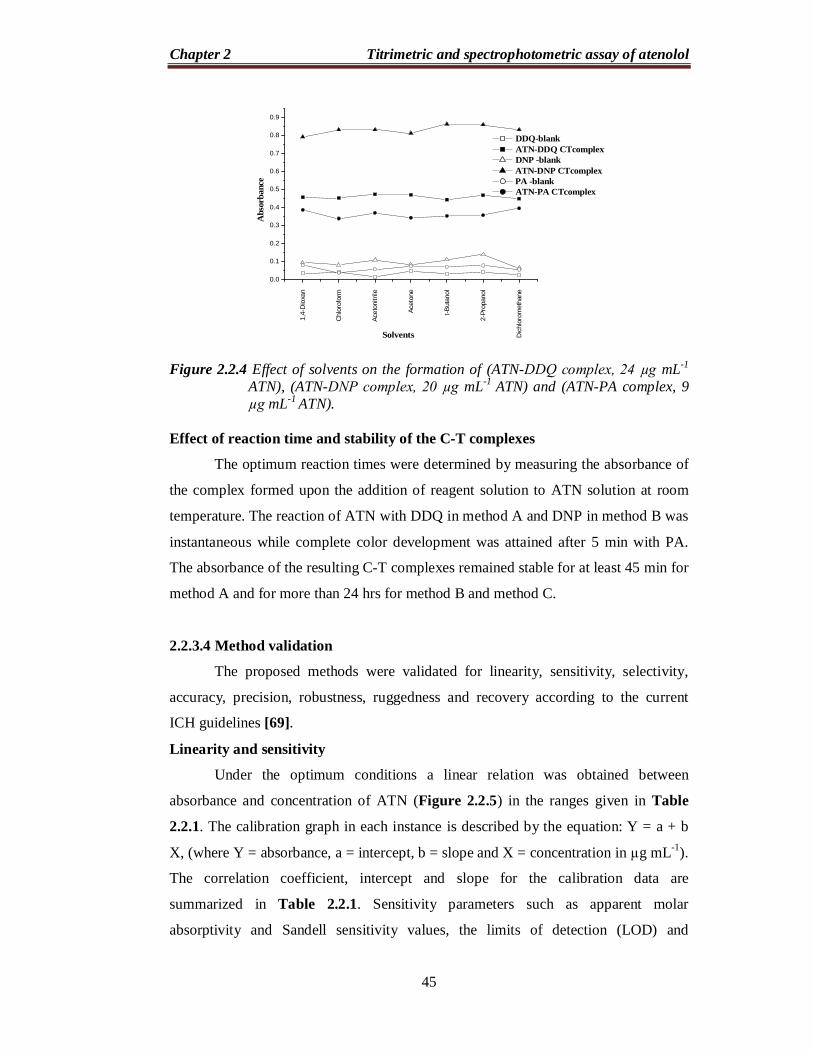
Effect of solvent
In order to select a suitable solvent for preparation of the reagent solutions
used in the study, the reagents were prepared separately in different solvents such as
1,4-dioxane, chloroform, acetonitrile, acetone, t-butanol,2-propanol and
dichloromethane, and the reaction of ATN with DDQ, DNP or PA was followed. In
method A, as shown in Figure 2.2.4, acetonitrile was best suited for preparation of
DDQ solution. The dichloromethane solvent was found to be the ideal solvent for
preparation of both DNP and PA for method B and method C, respectively (Figure
2.2.4). Similarly, the effect of the diluting solvent was studied for all methods and the
results showed that the ideal diluting solvent to achieve maximum sensitivity was
acetonitrile in method A and dichloromethane in method B and method C.
0.5 1.0 1.5 2.0 2.5 3.00.0
0.1
0.2
0.3
0.4
0.5
Abs
orba
nce
Volume of reagent, mL
ATN-DNP CT-Complex DNP blank ATN-DDQ CT-Complex DDQ blank ATN-PA CT-Complex PA blank
Chapter 2 Titrimetric and spectrophotometric assay of atenolol
45
Figure 2.2.4 Effect of solvents on the formation of (ATN-DDQ complex, 24 µg mL-1
ATN), (ATN-DNP complex, 20 µg mL-1 ATN) and (ATN-PA complex, 9 µg mL-1 ATN).
Effect of reaction time and stability of the C-T complexes
The optimum reaction times were determined by measuring the absorbance of
the complex formed upon the addition of reagent solution to ATN solution at room
temperature. The reaction of ATN with DDQ in method A and DNP in method B was
instantaneous while complete color development was attained after 5 min with PA.
The absorbance of the resulting C-T complexes remained stable for at least 45 min for
method A and for more than 24 hrs for method B and method C.
2.2.3.4 Method validation
The proposed methods were validated for linearity, sensitivity, selectivity,
accuracy, precision, robustness, ruggedness and recovery according to the current
ICH guidelines [69].
Linearity and sensitivity
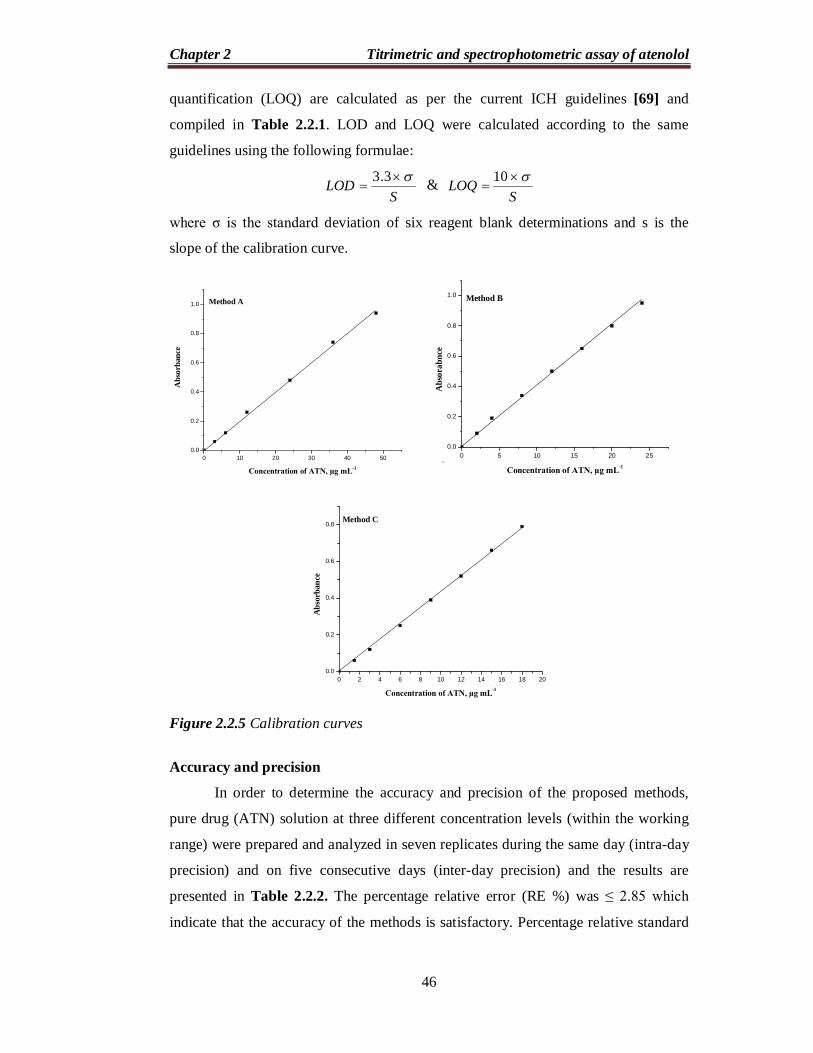
Under the optimum conditions a linear relation was obtained between
absorbance and concentration of ATN (Figure 2.2.5) in the ranges given in Table
2.2.1. The calibration graph in each instance is described by the equation: Y = a + b
X, (where Y = absorbance, a = intercept, b = slope and X = concentration in µg mL-1).
The correlation coefficient, intercept and slope for the calibration data are
summarized in Table 2.2.1. Sensitivity parameters such as apparent molar
absorptivity and Sandell sensitivity values, the limits of detection (LOD) and
1,4-
Dio
xan
Chl
orof
orm
Acet
onitr
ile
Acet
one
t-But
anol
2-Pr
opan
ol
Dic
hlor
omet
hane
0.0
0.1
0.2
0.3
0.4
0.5
0.6
0.7
0.8
0.9
Abs
orba
nce
Solvents
DDQ-blank ATN-DDQ CTcomplex DNP -blank ATN-DNP CTcomplex PA -blank ATN-PA CTcomplex
Chapter 2 Titrimetric and spectrophotometric assay of atenolol
46
quantification (LOQ) are calculated as per the current ICH guidelines [69] and
compiled in Table 2.2.1. LOD and LOQ were calculated according to the same
guidelines using the following formulae:
SLOD
3.3 &
SLOQ
10
where σ is the standard deviation of six reagent blank determinations and s is the
slope of the calibration curve.
Figure 2.2.5 Calibration curves
Accuracy and precision
In order to determine the accuracy and precision of the proposed methods,
pure drug (ATN) solution at three different concentration levels (within the working
range) were prepared and analyzed in seven replicates during the same day (intra-day
precision) and on five consecutive days (inter-day precision) and the results are
presented in Table 2.2.2. The percentage relative error (RE %) was ≤ 2.85 which
indicate that the accuracy of the methods is satisfactory. Percentage relative standard
0 10 20 30 40 500.0
0.2
0.4
0.6
0.8
1.0 Method A
Abs
orba
nce
Concentration of ATN, µg mL-1
0 5 10 15 20 250.0
0.2
0.4
0.6
0.8
1.0 Method B
Abs
orab
nce
Concentration of ATN, µg mL-1
0 2 4 6 8 10 12 14 16 18 200.0
0.2
0.4
0.6
0.8Method C
Abs
orba
nce
Concentration of ATN, µg mL-1
Chapter 2 Titrimetric and spectrophotometric assay of atenolol
47
deviation (RSD %) for intra-day was ≤ 1.31 and for inter-day it was ≤ 2.01 indicating
repeatability and usefulness of the proposed methods in the routine analysis.
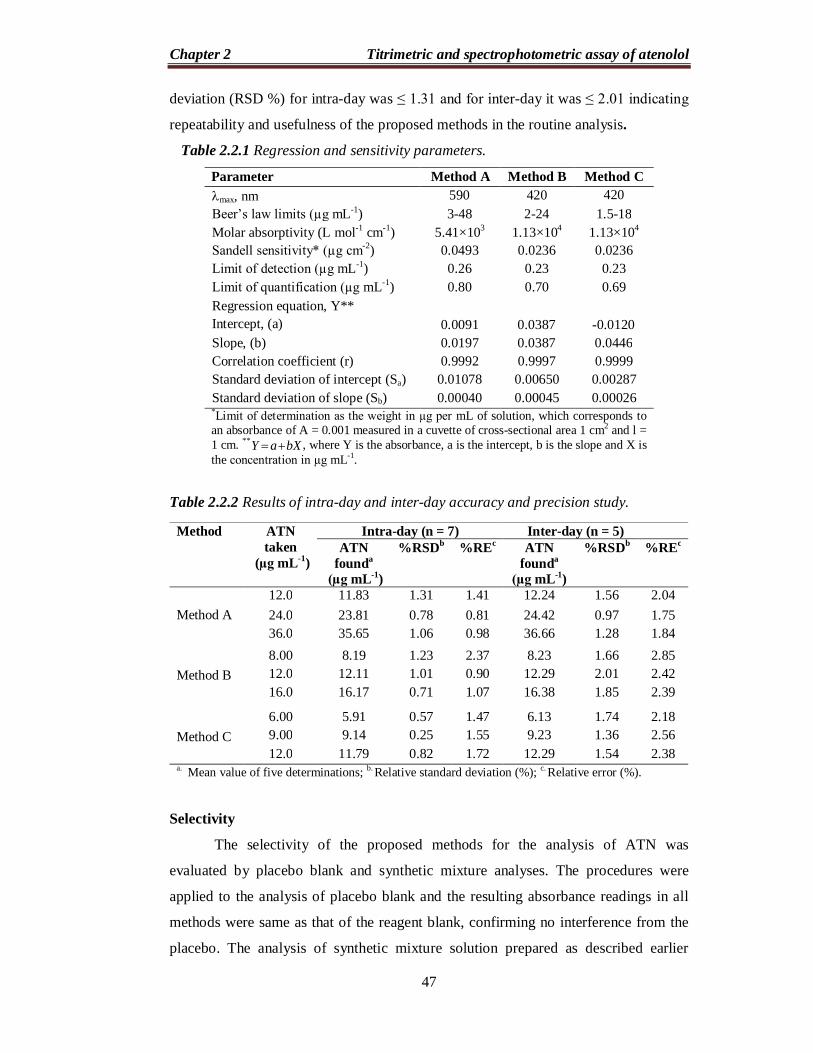
Table 2.2.1 Regression and sensitivity parameters.
Parameter Method A Method B Method C max, nm 590 420 420 Beer’s law limits (µg mL-1) 3-48 2-24 1.5-18 Molar absorptivity (L mol-1 cm-1) 5.41×10³ 1.13×10⁴ 1.13×10⁴ Sandell sensitivity* (µg cm-2) 0.0493 0.0236 0.0236 Limit of detection (µg mL-1) 0.26 0.23 0.23 Limit of quantification (µg mL-1) 0.80 0.70 0.69 Regression equation, Y** Intercept, (a)
0.0091
0.0387
-0.0120
Slope, (b) 0.0197 0.0387 0.0446 Correlation coefficient (r) 0.9992 0.9997 0.9999 Standard deviation of intercept (Sa) 0.01078 0.00650 0.00287 Standard deviation of slope (Sb) 0.00040 0.00045 0.00026 *Limit of determination as the weight in µg per mL of solution, which corresponds to an absorbance of A = 0.001 measured in a cuvette of cross-sectional area 1 cm2 and l = 1 cm. ** bXaY , where Y is the absorbance, a is the intercept, b is the slope and X is the concentration in µg mL-1.
Table 2.2.2 Results of intra-day and inter-day accuracy and precision study.
Selectivity
The selectivity of the proposed methods for the analysis of ATN was
evaluated by placebo blank and synthetic mixture analyses. The procedures were
applied to the analysis of placebo blank and the resulting absorbance readings in all
methods were same as that of the reagent blank, confirming no interference from the
placebo. The analysis of synthetic mixture solution prepared as described earlier
Method ATN taken
(µg mL-1)
Intra-day (n = 7) Inter-day (n = 5) ATN
founda (µg mL-1)
%RSDb %REc ATN founda
(µg mL-1)
%RSDb
%REc
Method A
12.0 11.83 1.31 1.41 12.24 1.56 2.04 24.0 23.81 0.78 0.81 24.42 0.97 1.75 36.0 35.65 1.06 0.98 36.66 1.28 1.84
Method B
8.00 8.19 1.23 2.37 8.23 1.66 2.85 12.0 12.11 1.01 0.90 12.29 2.01 2.42 16.0 16.17 0.71 1.07 16.38 1.85 2.39
Method C
6.00 5.91 0.57 1.47 6.13 1.74 2.18 9.00 9.14 0.25 1.55 9.23 1.36 2.56 12.0 11.79 0.82 1.72 12.29 1.54 2.38
a. Mean value of five determinations; b. Relative standard deviation (%); c. Relative error (%).
Chapter 2 Titrimetric and spectrophotometric assay of atenolol
48
yielded percent recoveries of 98.3±2.13, 99.1±1.76 and 98.9±1.91 (n=5) for method
A, method B and method C, respectively. The results of this study showed that the
inactive ingredients did not interfere in the assay indicating the high selectivity of the
proposed method and applicability to use for routine determination in pure and in
tablets form.
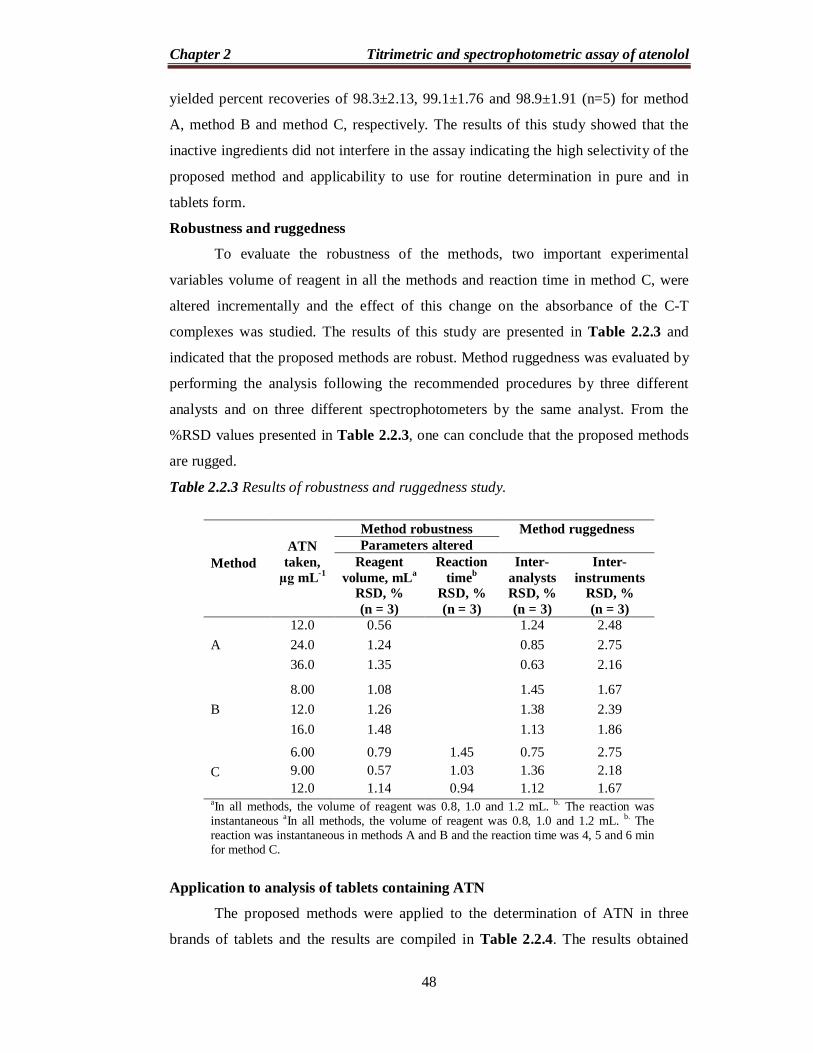
Robustness and ruggedness
To evaluate the robustness of the methods, two important experimental
variables volume of reagent in all the methods and reaction time in method C, were
altered incrementally and the effect of this change on the absorbance of the C-T
complexes was studied. The results of this study are presented in Table 2.2.3 and
indicated that the proposed methods are robust. Method ruggedness was evaluated by
performing the analysis following the recommended procedures by three different
analysts and on three different spectrophotometers by the same analyst. From the
%RSD values presented in Table 2.2.3, one can conclude that the proposed methods
are rugged.
Table 2.2.3 Results of robustness and ruggedness study.
Application to analysis of tablets containing ATN
The proposed methods were applied to the determination of ATN in three
brands of tablets and the results are compiled in Table 2.2.4. The results obtained
Method
ATN
taken, µg mL-1
Method robustness Method ruggedness Parameters altered
Reagent volume, mLa
RSD, % (n = 3)
Reaction timeb
RSD, % (n = 3)
Inter-analysts RSD, % (n = 3)
Inter-instruments
RSD, % (n = 3)
A
12.0 0.56 1.24 2.48 24.0 1.24 0.85 2.75 36.0 1.35 0.63 2.16
B
8.00 1.08 1.45 1.67 12.0 1.26 1.38 2.39 16.0 1.48 1.13 1.86
C
6.00 0.79 1.45 0.75 2.75 9.00 0.57 1.03 1.36 2.18 12.0 1.14 0.94 1.12 1.67
aIn all methods, the volume of reagent was 0.8, 1.0 and 1.2 mL. b. The reaction was instantaneous aIn all methods, the volume of reagent was 0.8, 1.0 and 1.2 mL. b. The reaction was instantaneous in methods A and B and the reaction time was 4, 5 and 6 min for method C.
Chapter 2 Titrimetric and spectrophotometric assay of atenolol
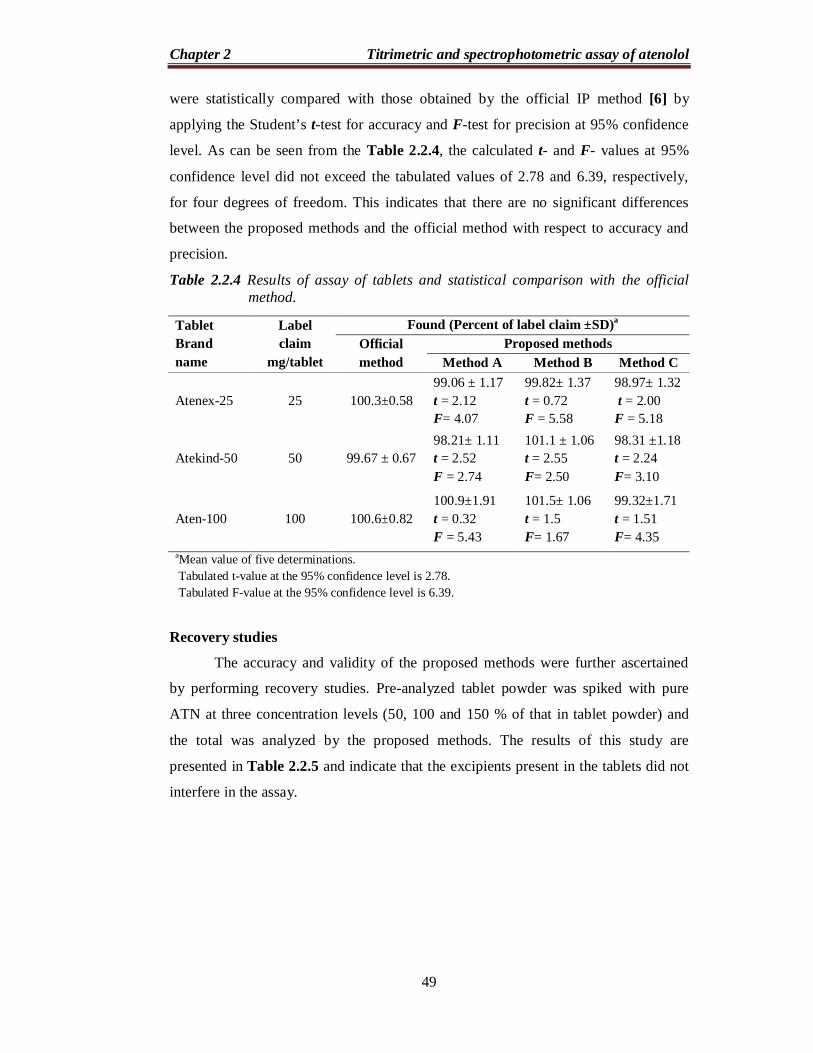
49
were statistically compared with those obtained by the official IP method [6] by
applying the Student’s t-test for accuracy and F-test for precision at 95% confidence
level. As can be seen from the Table 2.2.4, the calculated t- and F- values at 95%
confidence level did not exceed the tabulated values of 2.78 and 6.39, respectively,
for four degrees of freedom. This indicates that there are no significant differences
between the proposed methods and the official method with respect to accuracy and
precision.
Table 2.2.4 Results of assay of tablets and statistical comparison with the official method.
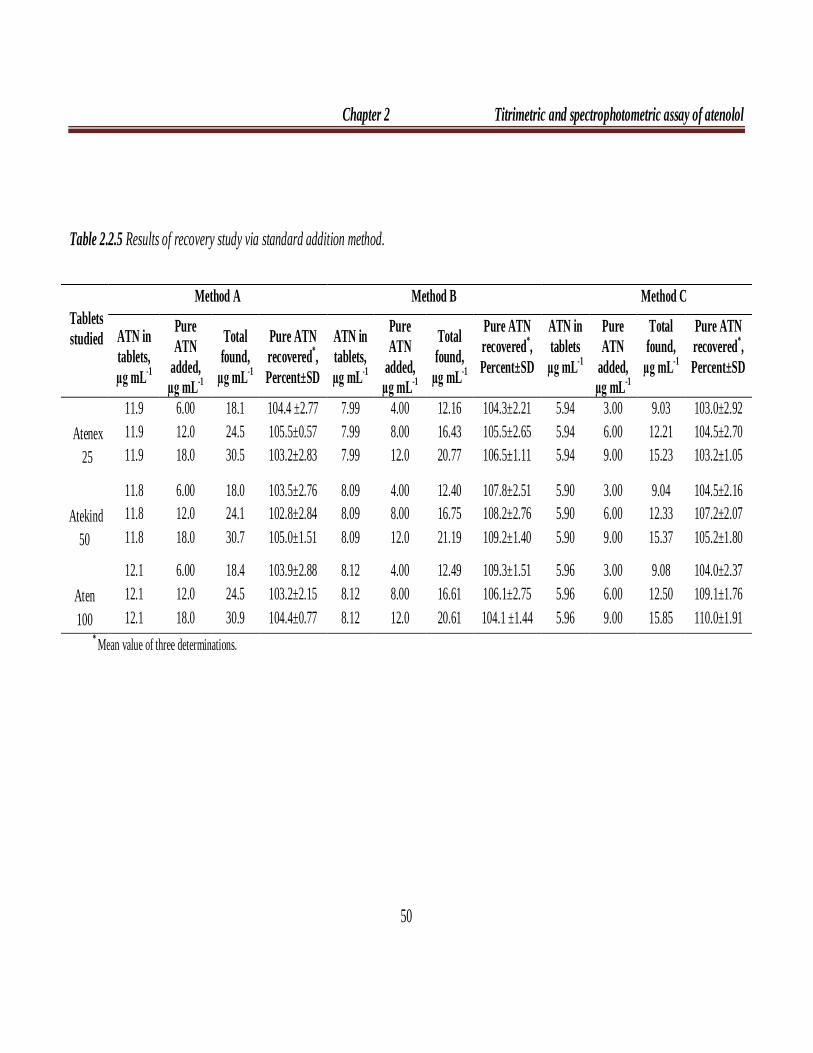
Recovery studies
The accuracy and validity of the proposed methods were further ascertained
by performing recovery studies. Pre-analyzed tablet powder was spiked with pure
ATN at three concentration levels (50, 100 and 150 % of that in tablet powder) and
the total was analyzed by the proposed methods. The results of this study are
presented in Table 2.2.5 and indicate that the excipients present in the tablets did not
interfere in the assay.
Tablet Brand name
Label claim
mg/tablet
Found (Percent of label claim ±SD)a
Official method
Proposed methods Method A Method B Method C
Atenex-25
25
100.3±0.58 99.06 ± 1.17 t = 2.12 F= 4.07
99.82± 1.37 t = 0.72 F = 5.58
98.97± 1.32 t = 2.00 F = 5.18
Atekind-50
50
99.67 ± 0.67 98.21± 1.11 t = 2.52 F = 2.74
101.1 ± 1.06 t = 2.55 F= 2.50
98.31 ±1.18 t = 2.24 F= 3.10
Aten-100 100 100.6±0.82 100.9±1.91 t = 0.32 F = 5.43
101.5± 1.06 t = 1.5 F= 1.67
99.32±1.71 t = 1.51 F= 4.35
aMean value of five determinations. Tabulated t-value at the 95% confidence level is 2.78. Tabulated F-value at the 95% confidence level is 6.39.
Chapter 2 Titrimetric and spectrophotometric assay of atenolol
50
Table 2.2.5 Results of recovery study via standard addition method.
Tablets studied
Method A Method B Method C
ATN in tablets, µg mL-1
Pure ATN
added, µg mL-1
Total found,
µg mL-1
Pure ATN recovered*, Percent±SD
ATN in tablets, µg mL-1
Pure ATN
added, µg mL-1
Total found,
µg mL-1
Pure ATN recovered*, Percent±SD
ATN in tablets
µg mL-1
Pure ATN
added, µg mL-1
Total found,
µg mL-1
Pure ATN recovered*, Percent±SD
Atenex 25
11.9 11.9 11.9
6.00 12.0 18.0
18.1 24.5 30.5
104.4 ±2.77 105.5±0.57 103.2±2.83
7.99 7.99 7.99
4.00 8.00 12.0
12.16 16.43 20.77
104.3±2.21 105.5±2.65 106.5±1.11
5.94 5.94 5.94
3.00 6.00 9.00
9.03 12.21 15.23
103.0±2.92 104.5±2.70 103.2±1.05
Atekind
50
11.8 11.8 11.8
6.00 12.0 18.0
18.0 24.1 30.7
103.5±2.76 102.8±2.84 105.0±1.51
8.09 8.09 8.09
4.00 8.00 12.0
12.40 16.75 21.19
107.8±2.51 108.2±2.76 109.2±1.40
5.90 5.90 5.90
3.00 6.00 9.00
9.04 12.33 15.37
104.5±2.16 107.2±2.07 105.2±1.80
Aten 100
12.1 12.1 12.1
6.00 12.0 18.0
18.4 24.5 30.9
103.9±2.88 103.2±2.15 104.4±0.77
8.12 8.12 8.12
4.00 8.00 12.0
12.49 16.61 20.61
109.3±1.51 106.1±2.75 104.1 ±1.44
5.96 5.96 5.96
3.00 6.00 9.00
9.08 12.50 15.85
104.0±2.37 109.1±1.76 110.0±1.91
* Mean value of three determinations.
Chapter 2 Titrimetric and spectrophotometric assay of atenolol
51
Section 2.3
SPECTROPHOTOMETRIC DETERMINATION OF ATENOLOL IN
PHARMACEUTICAL FORMULATIONS USING BROMATE-BROMIDE
MIXTURE AS AN ECO-FRIENDLY REAGENT
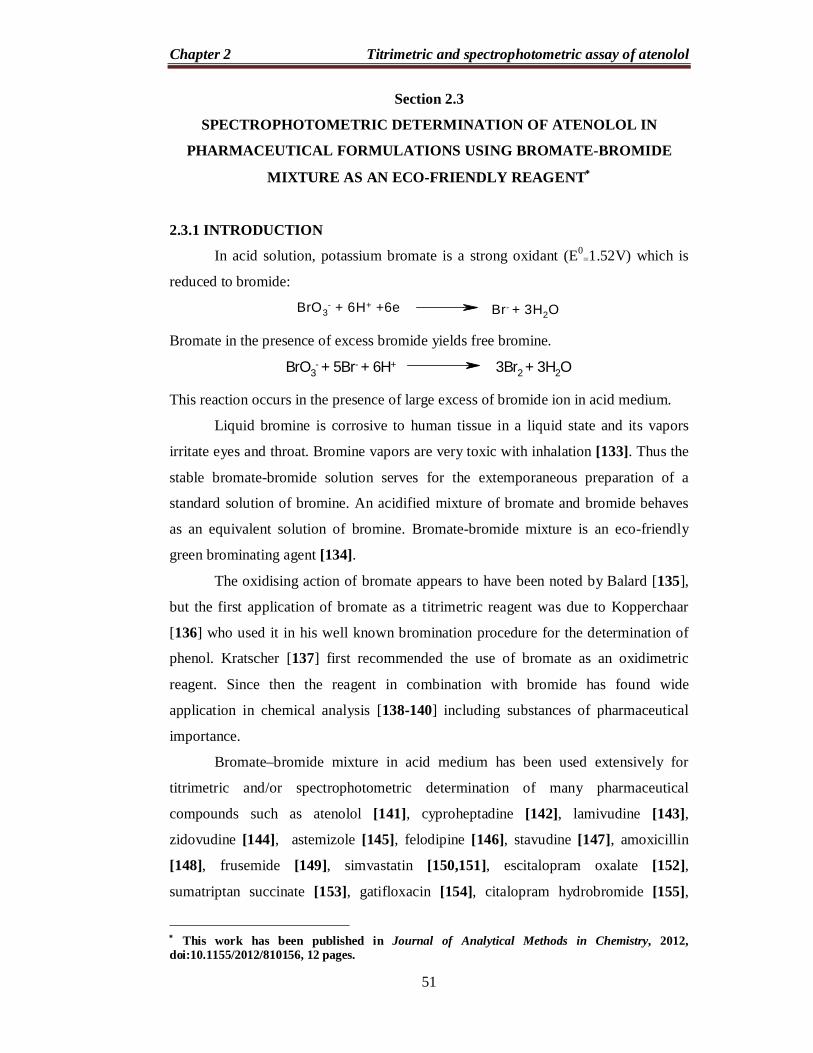
2.3.1 INTRODUCTION
In acid solution, potassium bromate is a strong oxidant (E0=1.52V) which is
reduced to bromide:
BrO3- + 6H+ +6e Br- + 3H2O
Bromate in the presence of excess bromide yields free bromine.
BrO3- + 5Br- + 6H+ 3Br2 + 3H2O
This reaction occurs in the presence of large excess of bromide ion in acid medium.
Liquid bromine is corrosive to human tissue in a liquid state and its vapors
irritate eyes and throat. Bromine vapors are very toxic with inhalation [133]. Thus the
stable bromate-bromide solution serves for the extemporaneous preparation of a
standard solution of bromine. An acidified mixture of bromate and bromide behaves
as an equivalent solution of bromine. Bromate-bromide mixture is an eco-friendly
green brominating agent [134].
The oxidising action of bromate appears to have been noted by Balard [135],
but the first application of bromate as a titrimetric reagent was due to Kopperchaar
[136] who used it in his well known bromination procedure for the determination of
phenol. Kratscher [137] first recommended the use of bromate as an oxidimetric
reagent. Since then the reagent in combination with bromide has found wide
application in chemical analysis [138-140] including substances of pharmaceutical
importance.
Bromate–bromide mixture in acid medium has been used extensively for
titrimetric and/or spectrophotometric determination of many pharmaceutical
compounds such as atenolol [141], cyproheptadine [142], lamivudine [143],
zidovudine [144], astemizole [145], felodipine [146], stavudine [147], amoxicillin
[148], frusemide [149], simvastatin [150,151], escitalopram oxalate [152],
sumatriptan succinate [153], gatifloxacin [154], citalopram hydrobromide [155],
This work has been published in Journal of Analytical Methods in Chemistry, 2012, doi:10.1155/2012/810156, 12 pages.
Chapter 2 Titrimetric and spectrophotometric assay of atenolol
52
lansoprazole [156], propranolol HCl [157,158] and captopril [159] etc., to mention a
few.
Many dyes are irreversibly oxidised/destroyed to colorless products by
oxidising agents in acid medium [139] and this observation has been exploited for the
indirect spectrophotometric determination of many oxidisable pharmaceuticals [160-
164]. This bleaching action has successfully been utilized for the indirect
spectrophotometric assay of wide range of pharmaceuticals.
In this section, more sensitive indirect spectrophotometric methods are
described for the determination of ATN using bromate-bromide mixture and two
dyes, meta-cresol purple and erioglaucine as reagents. The methods are based on the
oxidation of ATN by the bromine generated in situ by the action of the acid on the
bromate–bromide mixture followed by the determination of unreacted bromine by
reacting with a fixed amount of either MCP and measuring the absorbance at 540 nm
(method A) and 445 nm (method B) or EGC and measuring the absorbance at 630 nm
(method C).
2.3.2 EXPERIMENTAL
2.3.2.1 Instrument
The instrument used for absorbance measurements was the same as described
in Section 2.2.2.1.
2.3.2.2 Reagents and materials
All chemicals and reagents used were of analytical or pharmaceutical grade.
Distilled water was used to prepare the solutions.
Bromate-bromide mixture (40, 80 and 18 µg mL-1): A stock standard bromate-
bromide mixture solution equivalent to 500 µg mL-1 KBrO3 was prepared by
dissolving accurately weighed 50 mg of KBrO3 (S. D. Fine Chem. Ltd., Mumbai,
India) and 0.5 g of KBr (Merck, Mumbai, India) in water and diluted to the mark in a
100 mL calibrated flask. The stock solution was diluted appropriately with water to
get the working concentrations of 40, 80 and 18 µg mL-1 KBrO3 for use in method A,
method B and method C, respectively.
Meta-cresol purple solution (80 and 200 µg mL-1): A 400 µg mL-1 stock solution
was first prepared by dissolving 40 mg of dye (Loba Chemie, Mumbai, India) in 2 mL
of 0.1 M NaOH and diluted to volume with water in a 100 mL calibrated flask. The
Chapter 2 Titrimetric and spectrophotometric assay of atenolol
53
solution (400 µg mL-1) was diluted further with water to get the working
concentrations of 80 µg mL-1 and 200 µg mL-1 MCP solutions.
Erioglaucine solution (300 µg mL-1): The solution was prepared by dissolving 30
mg of dye (Loba Chemie, Mumbai, India) in water and diluting to the mark with
water in a 100 mL calibrated flask.
Hydrochloric acid (5 M and 1M): The solutions were prepared by appropriate
dilution of concentrated hydrochloric acid (S. D. Fine Chem. Ltd., Mumbai, India. Sp.
gr. 1.18) with water.
Standard ATN solution: A stock standard solution equivalent to 200 µg mL-1 ATN
was prepared by dissolving accurately weighed 50 mg of pure drug with water in a
250 mL calibrated flask. This stock solution was diluted appropriately with water to
get the working concentrations of 40 µg mL-1 for use in methods A and C, and 80 µg
mL-1 for use in method B.
The pharmaceutical grade ATN and tablets used in this study are those
mentioned in the Section 2.1.2.2.
2.3.2.3 Assay procedures
Method A (measuring MCP in acid medium)
Different aliquots (0.25- 5.0 mL) of standard ATN solution (40 µg mL-1) were
accurately transferred into a series of 10 mL calibrated flasks using micro burette and
the total volume was adjusted to 5.0 mL by adding requisite volume of water. To each
flask, 2 mL of 5 M HCl was added followed by 1 mL of bromate-bromide mixture (40
µg mL-1 in KBrO3). The content was mixed well and the flasks were allowed to stand
for 15 min with occasional shaking. Then, 1 mL of 80 µg mL-1 MCP was added to
each flask, diluted to the mark with water, mixed well and the absorbance of each
solution was measured at 540 nm against a reagent blank after 5 min.
Method B (measuring brominated product of MCP)
Varying aliquots (0.25-5.0 mL) of a standard solution (80 µg mL-1ATN) were
accurately measured into a series of 10 mL calibrated flasks and the total volume was
brought to 5 mL by adding water. To each flask were added 2 mL of 5 M HCl and 1
mL of KBrO3-KBr solution (80 µg mL-1 in KBrO3). The content of each flask was
mixed well and kept aside for 10 min with occasional swirling. At last, 1 mL of 200
µg mL-1 MCP solution was added to each flask and diluting up to the mark with
Chapter 2 Titrimetric and spectrophotometric assay of atenolol
54
water. The absorbance of each solution was measured after 5 min at 445 nm against
water.
Method C (using EGC)
Aliquots (0.25-2.0 mL) of a standard ATN (40 µg mL-1) solution were
accurately transferred into a series of 10 mL calibrated flasks and the total volume
was adjusted to 2.0 mL with water. To each flask, 5 mL of 1 M HCl was added
followed by 1.0 mL of bromate-bromide mixture (18 µg mL-1, in KBrO3). The content
was mixed and the flasks were let stand for 10 min with occasional shaking followed
by addition of 1 mL of 300 µg mL-1 EGC to each flask. The solutions were diluted to
the mark with water, mixed well and the absorbance of each solution was measured at
630 nm after 5 min against a reagent blank.
Standard graph was prepared by plotting the absorbance versus ATN
concentration, and the concentration of the unknown was read from the calibration
graph or computed from the respective regression equation.
Procedure for tablets
Tablet extract equivalent to 200 µg mL-1 ATN was prepared as described in
Section 2.1.2.3. A suitable aliquot of the extract (200 µg mL-1 ATN) was diluted to
get the working concentrations of 40 µg mL-1 ATN for the assay by methods A and C,
and 80 µg mL-1 ATN for method B.
Procedure for selectivity study
A placebo blank was prepared as described under Section 2.1.2.3, and then 10
mg placebo blank extract was analyzed as done in “Procedure for tablets”.
To the 30 mg of placebo blank of the composition described under Section
2.1.2.3, 20 mg of ATN was added and homogenized, transferred to a 100 mL
calibrated flask and the solution was prepared as described under ‘‘Procedure for
tablets’’, and then subjected to analysis by the procedures described above. The
analysis was used to study the interferences of excipients such as talc, starch, acacia,
methyl cellulose, sodium citrate, magnesium stearate and sodium alginate.
Chapter 2 Titrimetric and spectrophotometric assay of atenolol
55
2.3.3 RESULTS AND DISCUSSION
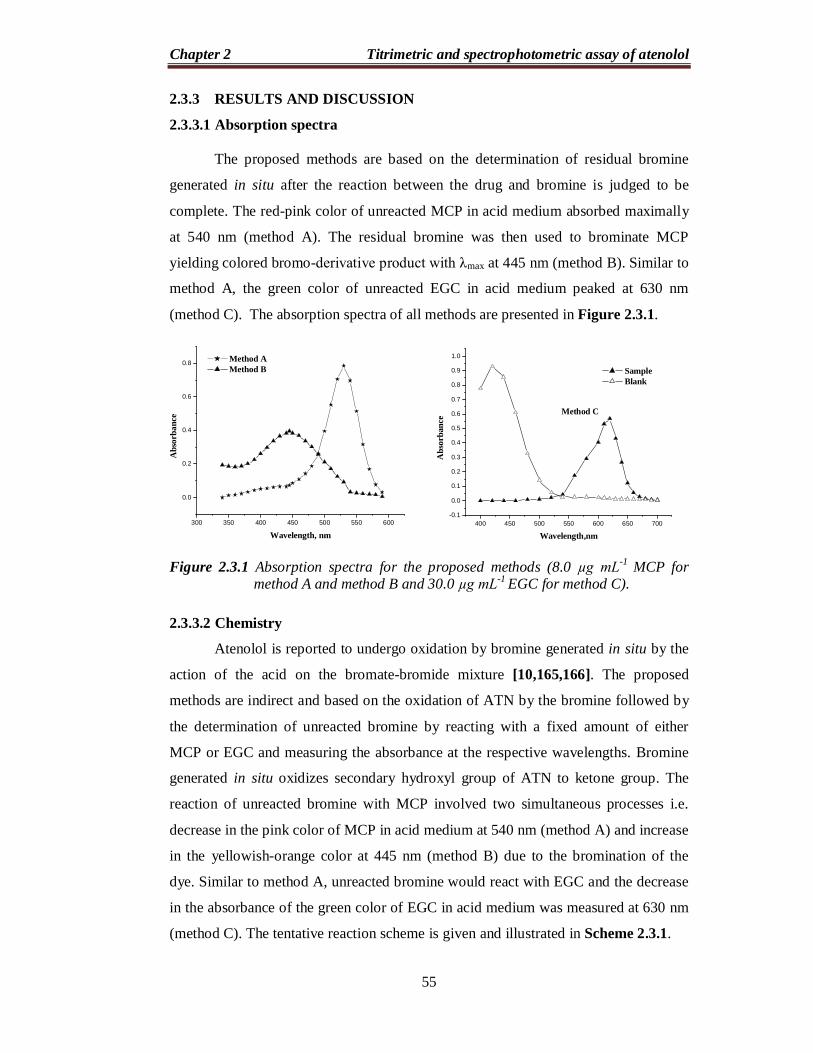
2.3.3.1 Absorption spectra
The proposed methods are based on the determination of residual bromine
generated in situ after the reaction between the drug and bromine is judged to be
complete. The red-pink color of unreacted MCP in acid medium absorbed maximally
at 540 nm (method A). The residual bromine was then used to brominate MCP
yielding colored bromo-derivative product with λmax at 445 nm (method B). Similar to
method A, the green color of unreacted EGC in acid medium peaked at 630 nm
(method C). The absorption spectra of all methods are presented in Figure 2.3.1.
Figure 2.3.1 Absorption spectra for the proposed methods (8.0 µg mL-1 MCP for
method A and method B and 30.0 µg mL-1 EGC for method C).
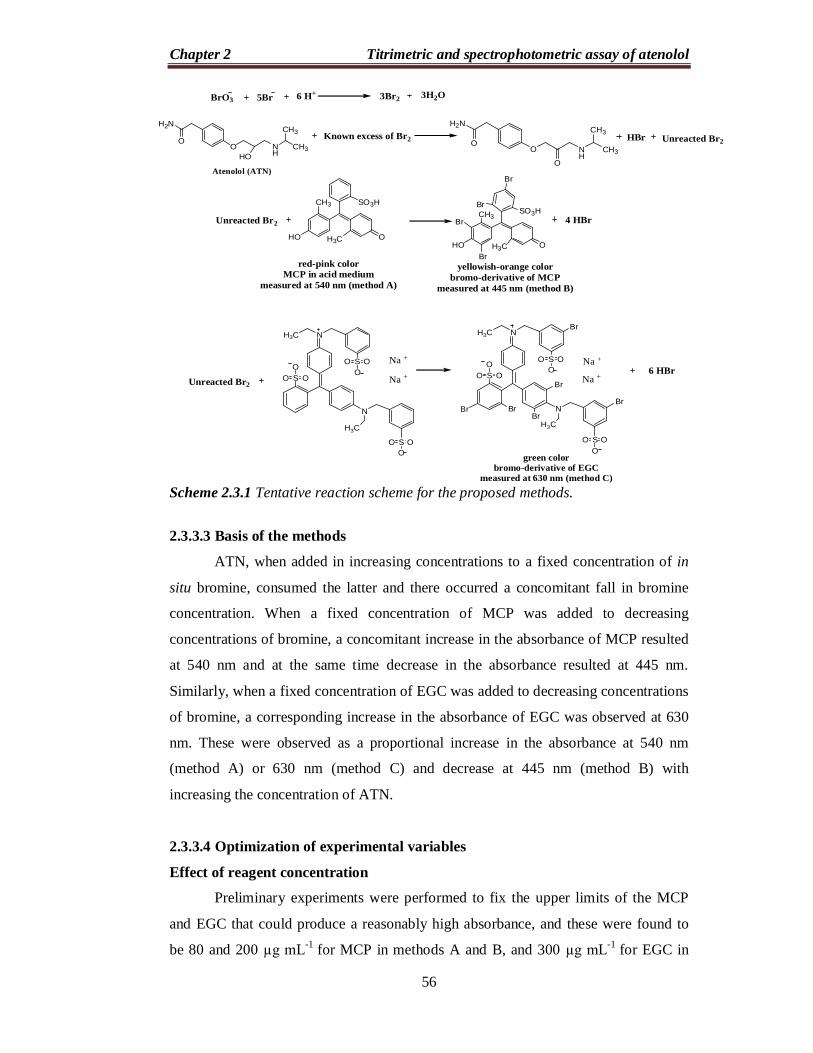
2.3.3.2 Chemistry
Atenolol is reported to undergo oxidation by bromine generated in situ by the
action of the acid on the bromate-bromide mixture [10,165,166]. The proposed
methods are indirect and based on the oxidation of ATN by the bromine followed by
the determination of unreacted bromine by reacting with a fixed amount of either
MCP or EGC and measuring the absorbance at the respective wavelengths. Bromine
generated in situ oxidizes secondary hydroxyl group of ATN to ketone group. The
reaction of unreacted bromine with MCP involved two simultaneous processes i.e.
decrease in the pink color of MCP in acid medium at 540 nm (method A) and increase
in the yellowish-orange color at 445 nm (method B) due to the bromination of the
dye. Similar to method A, unreacted bromine would react with EGC and the decrease
in the absorbance of the green color of EGC in acid medium was measured at 630 nm
(method C). The tentative reaction scheme is given and illustrated in Scheme 2.3.1.
300 350 400 450 500 550 600
0.0
0.2
0.4
0.6
0.8
Abs
orba
nce
Wavelength, nm
Method A Method B
400 450 500 550 600 650 700-0.1
0.0
0.1
0.2
0.3
0.4
0.5
0.6
0.7
0.8
0.9
1.0
Method C
Abs
orba
nce
Wavelength,nm
Sample Blank
Chapter 2 Titrimetric and spectrophotometric assay of atenolol
56
BrO3
H2N
OO N
HHOCH3
CH3
Atenolol (ATN)
3Br25Br 6 H+ 3H2O
Known excess of Br2
H2N
OO N
HO
CH3
CH3Unreacted Br2HBr
Unreacted Br2
SO3H
H3C OHO
CH3
4 HBrSO3H
H3C OHO
CH3
Br
Br
Br
Br
red-pink colorMCP in acid medium
measured at 540 nm (method A)
yellowish-orange colorbromo-derivative of MCP
measured at 445 nm (method B)
Unreacted Br2S OOO
N
N
H3C
S OOO
H3C
S OOO
Na +
Na + S OOO
N
N
H3C
S OOO
H3C
S OOO
Na +
Br Br
Br
Br
Br
Br
green colorbromo-derivative of EGC
measured at 630 nm (method C)
6 HBrNa +
Scheme 2.3.1 Tentative reaction scheme for the proposed methods.
2.3.3.3 Basis of the methods
ATN, when added in increasing concentrations to a fixed concentration of in
situ bromine, consumed the latter and there occurred a concomitant fall in bromine
concentration. When a fixed concentration of MCP was added to decreasing
concentrations of bromine, a concomitant increase in the absorbance of MCP resulted
at 540 nm and at the same time decrease in the absorbance resulted at 445 nm.
Similarly, when a fixed concentration of EGC was added to decreasing concentrations
of bromine, a corresponding increase in the absorbance of EGC was observed at 630
nm. These were observed as a proportional increase in the absorbance at 540 nm
(method A) or 630 nm (method C) and decrease at 445 nm (method B) with
increasing the concentration of ATN.
2.3.3.4 Optimization of experimental variables
Effect of reagent concentration
Preliminary experiments were performed to fix the upper limits of the MCP
and EGC that could produce a reasonably high absorbance, and these were found to
be 80 and 200 µg mL-1 for MCP in methods A and B, and 300 µg mL-1 for EGC in
Chapter 2 Titrimetric and spectrophotometric assay of atenolol
57
method C. Bromate concentrations of 4.0 and 1.8 µg mL-1 in the presence of excess
bromide were found optimum to bleach the dye color in method A and method C,
respectively, whereas 8.0 µg mL-1 KBrO3 produced a reasonable maximum
absorbance at 445 nm in method B. Hence, different concentrations of ATN were
reacted with 1.0 mL each of 40, 80 and 18 µg mL-1 bromate in methods A, B and C,
respectively.
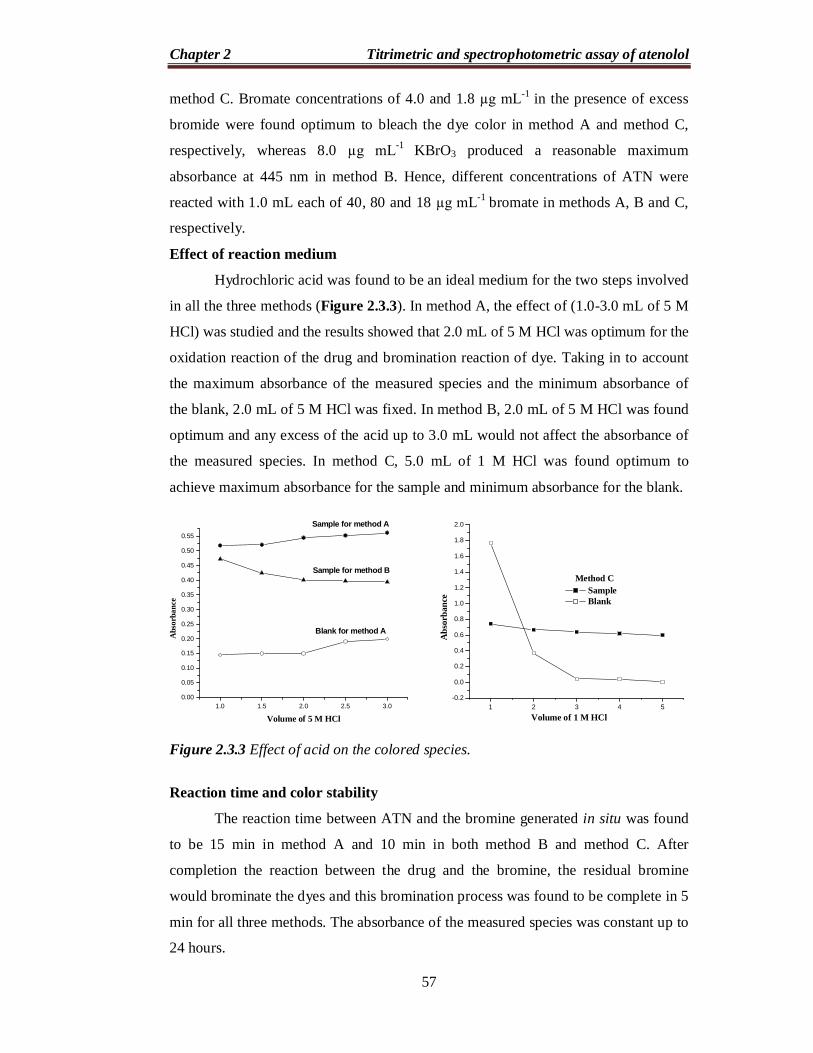
Effect of reaction medium
Hydrochloric acid was found to be an ideal medium for the two steps involved
in all the three methods (Figure 2.3.3). In method A, the effect of (1.0-3.0 mL of 5 M
HCl) was studied and the results showed that 2.0 mL of 5 M HCl was optimum for the
oxidation reaction of the drug and bromination reaction of dye. Taking in to account
the maximum absorbance of the measured species and the minimum absorbance of
the blank, 2.0 mL of 5 M HCl was fixed. In method B, 2.0 mL of 5 M HCl was found
optimum and any excess of the acid up to 3.0 mL would not affect the absorbance of
the measured species. In method C, 5.0 mL of 1 M HCl was found optimum to
achieve maximum absorbance for the sample and minimum absorbance for the blank.
Figure 2.3.3 Effect of acid on the colored species.
Reaction time and color stability
The reaction time between ATN and the bromine generated in situ was found
to be 15 min in method A and 10 min in both method B and method C. After
completion the reaction between the drug and the bromine, the residual bromine
would brominate the dyes and this bromination process was found to be complete in 5
min for all three methods. The absorbance of the measured species was constant up to
24 hours.
1.0 1.5 2.0 2.5 3.00.00
0.05
0.10
0.15
0.20
0.25
0.30
0.35
0.40
0.45
0.50
0.55
Blank for method A
Sample for method B
Sample for method A
Abs
orba
nce
Volume of 5 M HCl1 2 3 4 5
-0.2
0.0
0.2
0.4
0.6
0.8
1.0
1.2
1.4
1.6
1.8
2.0
Method C
Abs
orba
nce
Volume of 1 M HCl
Sample Blank
Chapter 2 Titrimetric and spectrophotometric assay of atenolol
58
2.3.3.5 Method validation
Linearity and sensitivity
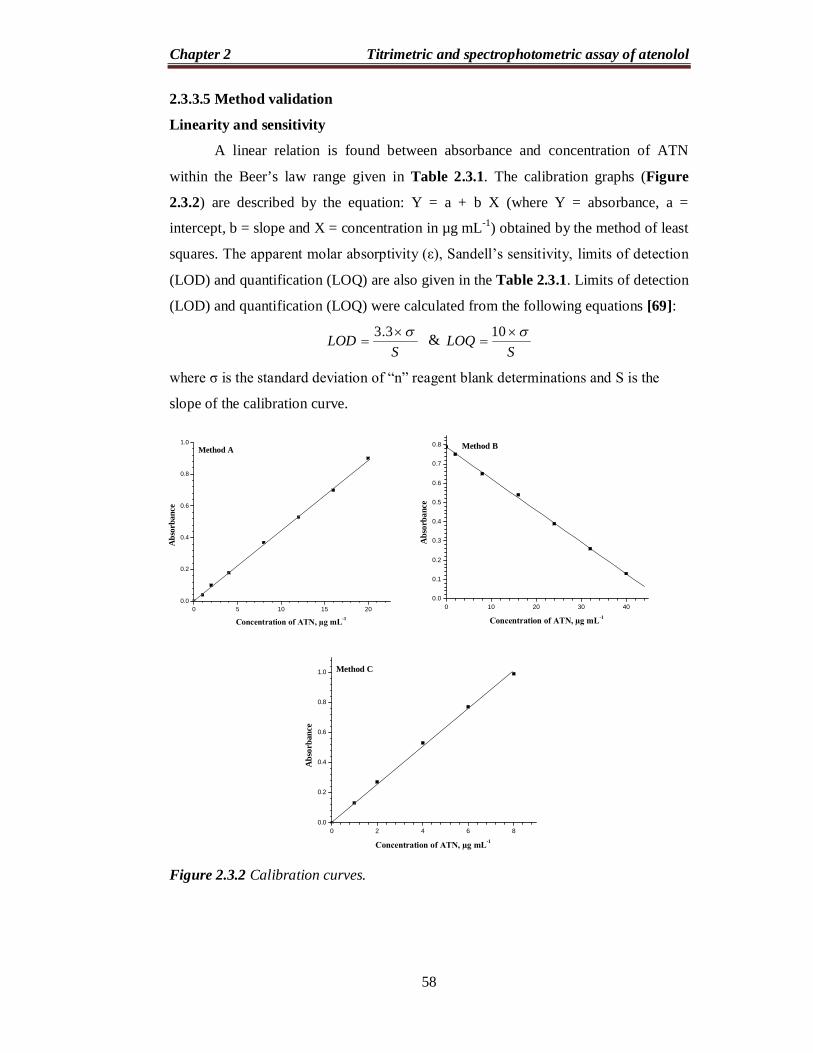
A linear relation is found between absorbance and concentration of ATN
within the Beer’s law range given in Table 2.3.1. The calibration graphs (Figure
2.3.2) are described by the equation: Y = a + b X (where Y = absorbance, a =
intercept, b = slope and X = concentration in µg mL-1) obtained by the method of least
squares. The apparent molar absorptivity (ε), Sandell’s sensitivity, limits of detection
(LOD) and quantification (LOQ) are also given in the Table 2.3.1. Limits of detection
(LOD) and quantification (LOQ) were calculated from the following equations [69]:
SLOD
3.3 &
SLOQ
10
where σ is the standard deviation of “n” reagent blank determinations and S is the
slope of the calibration curve.
Figure 2.3.2 Calibration curves.
0 5 10 15 200.0
0.2
0.4
0.6
0.8
1.0Method A
Abs
orba
nce
Concentration of ATN, µg mL-1
0 10 20 30 400.0
0.1
0.2
0.3
0.4
0.5
0.6
0.7
0.8 Method B
Abs
orba
nce
Concentration of ATN, µg mL-1
0 2 4 6 80.0
0.2
0.4
0.6
0.8
1.0 Method C
Abs
orba
nce
Concentration of ATN, µg mL-1
Chapter 2 Titrimetric and spectrophotometric assay of atenolol
59
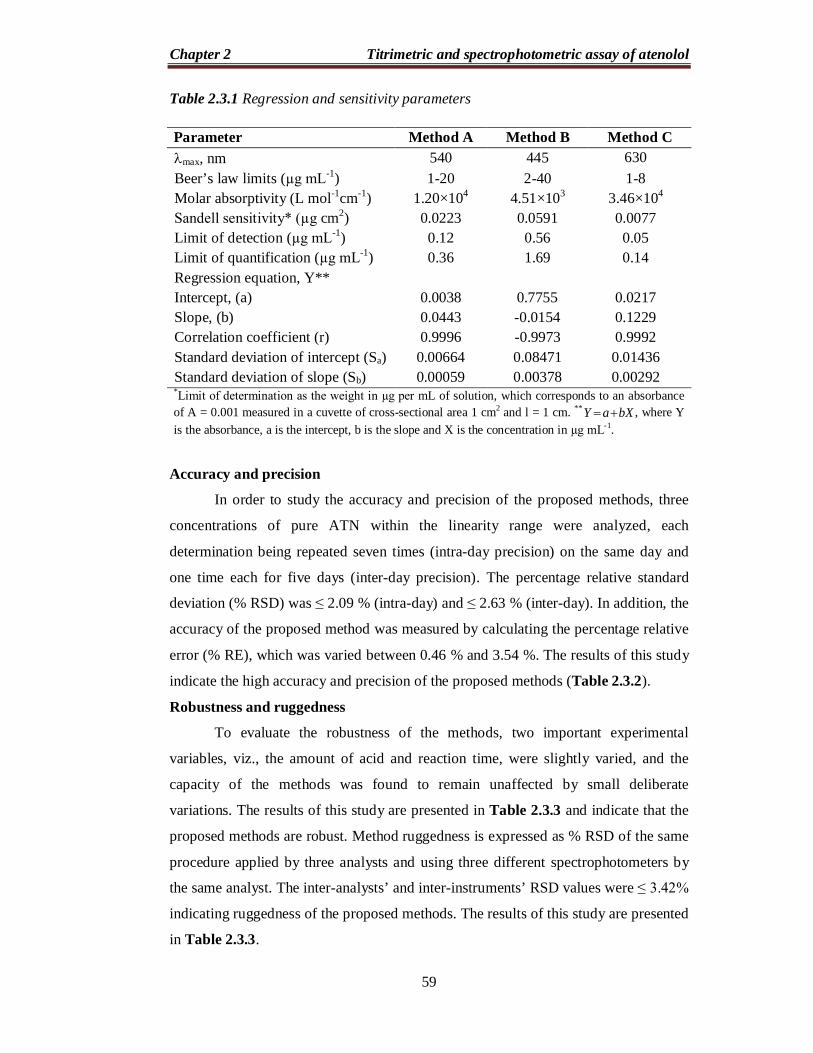
Table 2.3.1 Regression and sensitivity parameters
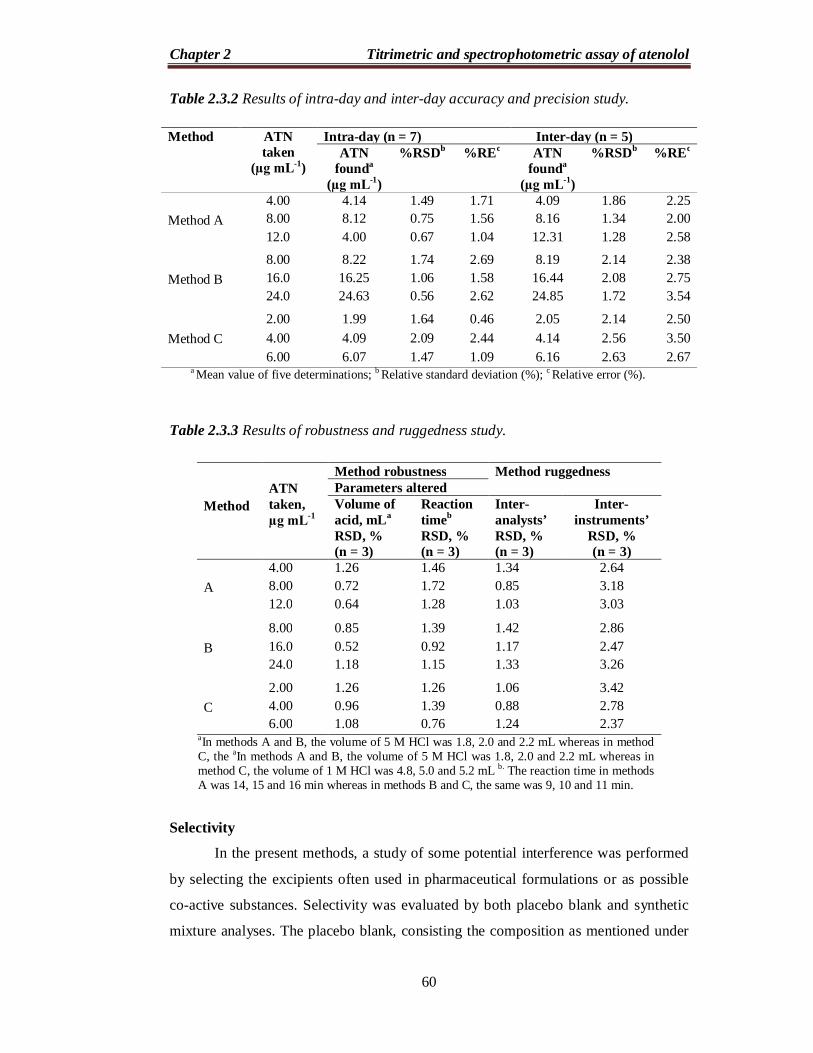
Accuracy and precision
In order to study the accuracy and precision of the proposed methods, three
concentrations of pure ATN within the linearity range were analyzed, each
determination being repeated seven times (intra-day precision) on the same day and
one time each for five days (inter-day precision). The percentage relative standard
deviation (% RSD) was ≤ 2.09 % (intra-day) and ≤ 2.63 % (inter-day). In addition, the
accuracy of the proposed method was measured by calculating the percentage relative
error (% RE), which was varied between 0.46 % and 3.54 %. The results of this study
indicate the high accuracy and precision of the proposed methods (Table 2.3.2).
Robustness and ruggedness
To evaluate the robustness of the methods, two important experimental
variables, viz., the amount of acid and reaction time, were slightly varied, and the
capacity of the methods was found to remain unaffected by small deliberate
variations. The results of this study are presented in Table 2.3.3 and indicate that the
proposed methods are robust. Method ruggedness is expressed as % RSD of the same
procedure applied by three analysts and using three different spectrophotometers by
the same analyst. The inter-analysts’ and inter-instruments’ RSD values were ≤ 3.42%
indicating ruggedness of the proposed methods. The results of this study are presented
in Table 2.3.3.
Parameter Method A Method B Method C max, nm 540 445 630 Beer’s law limits (µg mL-1) 1-20 2-40 1-8 Molar absorptivity (L mol-1cm-1) 1.20×10⁴ 4.51×10³ 3.46×10⁴ Sandell sensitivity* (µg cm2) 0.0223 0.0591 0.0077 Limit of detection (µg mL-1) 0.12 0.56 0.05 Limit of quantification (µg mL-1) 0.36 1.69 0.14 Regression equation, Y** Intercept, (a)
0.0038
0.7755
0.0217
Slope, (b) 0.0443 -0.0154 0.1229 Correlation coefficient (r) 0.9996 -0.9973 0.9992 Standard deviation of intercept (Sa) 0.00664 0.08471 0.01436 Standard deviation of slope (Sb) 0.00059 0.00378 0.00292 *Limit of determination as the weight in µg per mL of solution, which corresponds to an absorbance of A = 0.001 measured in a cuvette of cross-sectional area 1 cm2 and l = 1 cm. ** bXaY , where Y is the absorbance, a is the intercept, b is the slope and X is the concentration in µg mL-1.
Chapter 2 Titrimetric and spectrophotometric assay of atenolol
60
Table 2.3.2 Results of intra-day and inter-day accuracy and precision study.
Table 2.3.3 Results of robustness and ruggedness study.
Selectivity
In the present methods, a study of some potential interference was performed
by selecting the excipients often used in pharmaceutical formulations or as possible
co-active substances. Selectivity was evaluated by both placebo blank and synthetic
mixture analyses. The placebo blank, consisting the composition as mentioned under
Method ATN taken
(µg mL-1)
Intra-day (n = 7) Inter-day (n = 5) ATN
founda (µg mL-1)
%RSDb %REc ATN founda
(µg mL-1)
%RSDb
%REc
Method A
4.00 4.14 1.49 1.71 4.09 1.86 2.25 8.00 8.12 0.75 1.56 8.16 1.34 2.00 12.0 4.00 0.67 1.04 12.31 1.28 2.58
Method B
8.00 8.22 1.74 2.69 8.19 2.14 2.38 16.0 16.25 1.06 1.58 16.44 2.08 2.75 24.0 24.63 0.56 2.62 24.85 1.72 3.54
Method C
2.00 1.99 1.64 0.46 2.05 2.14 2.50 4.00 4.09 2.09 2.44 4.14 2.56 3.50 6.00 6.07 1.47 1.09 6.16 2.63 2.67
a Mean value of five determinations; b Relative standard deviation (%); c Relative error (%).
Method
ATN taken, µg mL-1
Method robustness Method ruggedness Parameters altered Volume of acid, mLa
RSD, % (n = 3)
Reaction timeb
RSD, % (n = 3)
Inter-analysts’ RSD, % (n = 3)
Inter-instruments’
RSD, % (n = 3)
A
4.00 1.26 1.46 1.34 2.64 8.00 0.72 1.72 0.85 3.18 12.0 0.64 1.28 1.03 3.03
B
8.00 0.85 1.39 1.42 2.86 16.0 0.52 0.92 1.17 2.47 24.0 1.18 1.15 1.33 3.26
C
2.00 1.26 1.26 1.06 3.42 4.00 0.96 1.39 0.88 2.78 6.00 1.08 0.76 1.24 2.37
aIn methods A and B, the volume of 5 M HCl was 1.8, 2.0 and 2.2 mL whereas in method C, the aIn methods A and B, the volume of 5 M HCl was 1.8, 2.0 and 2.2 mL whereas in method C, the volume of 1 M HCl was 4.8, 5.0 and 5.2 mL b. The reaction time in methods A was 14, 15 and 16 min whereas in methods B and C, the same was 9, 10 and 11 min.
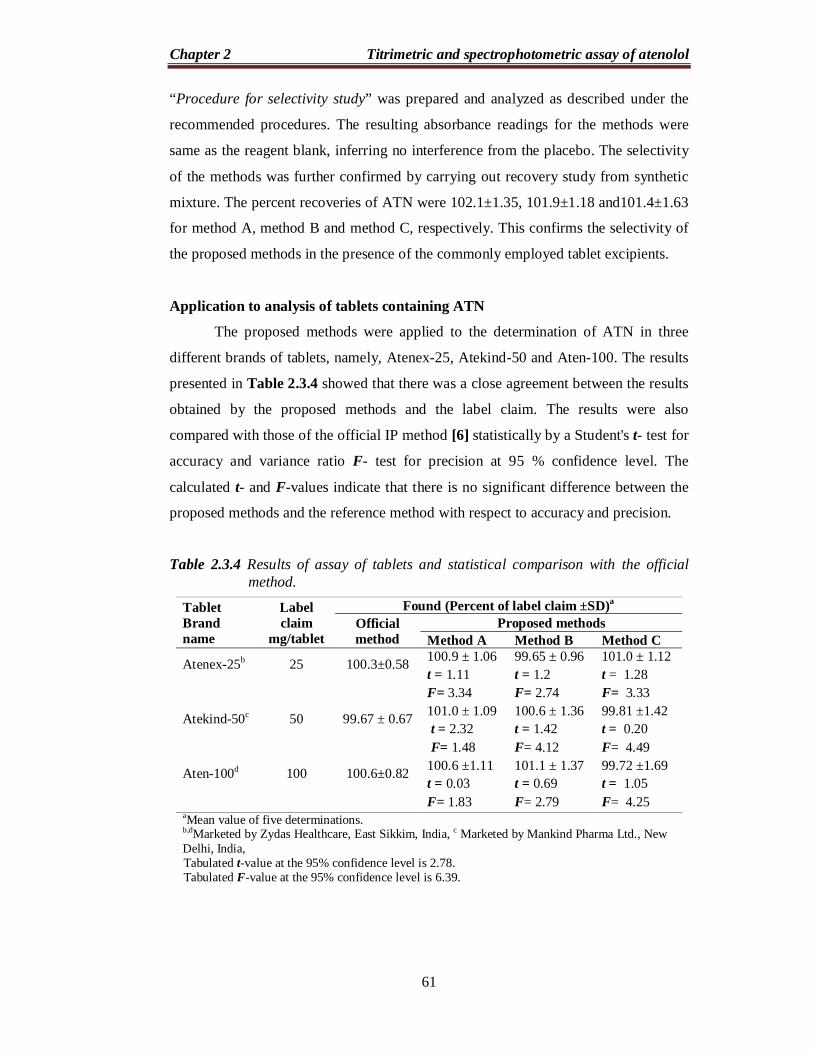
Chapter 2 Titrimetric and spectrophotometric assay of atenolol
61
“Procedure for selectivity study” was prepared and analyzed as described under the
recommended procedures. The resulting absorbance readings for the methods were
same as the reagent blank, inferring no interference from the placebo. The selectivity
of the methods was further confirmed by carrying out recovery study from synthetic
mixture. The percent recoveries of ATN were 102.1±1.35, 101.9±1.18 and101.4±1.63
for method A, method B and method C, respectively. This confirms the selectivity of
the proposed methods in the presence of the commonly employed tablet excipients.
Application to analysis of tablets containing ATN
The proposed methods were applied to the determination of ATN in three
different brands of tablets, namely, Atenex-25, Atekind-50 and Aten-100. The results
presented in Table 2.3.4 showed that there was a close agreement between the results
obtained by the proposed methods and the label claim. The results were also
compared with those of the official IP method [6] statistically by a Student's t- test for
accuracy and variance ratio F- test for precision at 95 % confidence level. The
calculated t- and F-values indicate that there is no significant difference between the
proposed methods and the reference method with respect to accuracy and precision.
Table 2.3.4 Results of assay of tablets and statistical comparison with the official method.
Tablet Brand name
Label claim
mg/tablet
Found (Percent of label claim ±SD)a
Official method
Proposed methods Method A Method B Method C
Atenex-25b
25
100.3±0.58
100.9 ± 1.06 t = 1.11 F= 3.34
99.65 ± 0.96 t = 1.2 F= 2.74
101.0 ± 1.12 t = 1.28 F= 3.33
Atekind-50c
50
99.67 ± 0.67
101.0 ± 1.09 t = 2.32 F= 1.48
100.6 ± 1.36 t = 1.42 F= 4.12
99.81 ±1.42 t = 0.20 F= 4.49
Aten-100d
100
100.6±0.82
100.6 ±1.11 t = 0.03 F= 1.83
101.1 ± 1.37 t = 0.69 F= 2.79
99.72 ±1.69 t = 1.05 F= 4.25
aMean value of five determinations. b,dMarketed by Zydas Healthcare, East Sikkim, India, c Marketed by Mankind Pharma Ltd., New Delhi, India,
Tabulated t-value at the 95% confidence level is 2.78. Tabulated F-value at the 95% confidence level is 6.39.
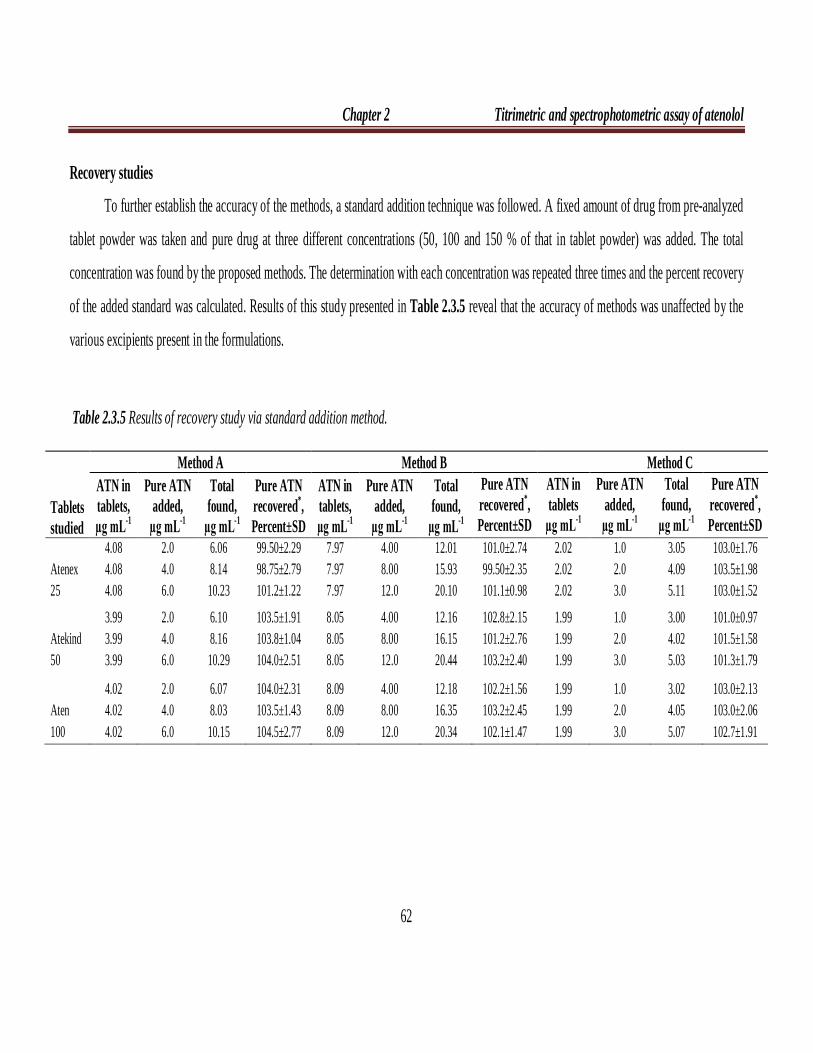
Chapter 2 Titrimetric and spectrophotometric assay of atenolol
62
Recovery studies
To further establish the accuracy of the methods, a standard addition technique was followed. A fixed amount of drug from pre-analyzed
tablet powder was taken and pure drug at three different concentrations (50, 100 and 150 % of that in tablet powder) was added. The total
concentration was found by the proposed methods. The determination with each concentration was repeated three times and the percent recovery
of the added standard was calculated. Results of this study presented in Table 2.3.5 reveal that the accuracy of methods was unaffected by the
various excipients present in the formulations.
Table 2.3.5 Results of recovery study via standard addition method.
Tablets studied
Method A Method B Method C ATN in tablets, µg mL-1
Pure ATN added,
µg mL-1
Total found,
µg mL-1
Pure ATN recovered*, Percent±SD
ATN in tablets, µg mL-1
Pure ATN added,
µg mL-1
Total found,
µg mL-1
Pure ATN recovered*, Percent±SD
ATN in tablets
µg mL-1
Pure ATN added, µg mL-1
Total found,
µg mL-1
Pure ATN recovered*, Percent±SD
Atenex 25
4.08 4.08 4.08
2.0 4.0 6.0
6.06 8.14 10.23
99.50±2.29 98.75±2.79 101.2±1.22
7.97 7.97 7.97
4.00 8.00 12.0
12.01 15.93 20.10
101.0±2.74 99.50±2.35 101.1±0.98
2.02 2.02 2.02
1.0 2.0 3.0
3.05 4.09 5.11
103.0±1.76 103.5±1.98 103.0±1.52
Atekind 50
3.99 3.99 3.99
2.0 4.0 6.0
6.10 8.16 10.29
103.5±1.91 103.8±1.04 104.0±2.51
8.05 8.05 8.05
4.00 8.00 12.0
12.16 16.15 20.44
102.8±2.15 101.2±2.76 103.2±2.40
1.99 1.99 1.99
1.0 2.0 3.0
3.00 4.02 5.03
101.0±0.97 101.5±1.58 101.3±1.79
Aten 100
4.02 4.02 4.02
2.0 4.0 6.0
6.07 8.03 10.15
104.0±2.31 103.5±1.43 104.5±2.77
8.09 8.09 8.09
4.00 8.00 12.0
12.18 16.35 20.34
102.2±1.56 103.2±2.45 102.1±1.47
1.99 1.99 1.99
1.0 2.0 3.0
3.02 4.05 5.07
103.0±2.13 103.0±2.06 102.7±1.91
Chapter 2 Titrimetric and spectrophotometric assay of atenolol
63
Section 2.4
APPLICATION OF BROMATE-BROMIDE MIXTURE AS AN OXIDISING
AGENT FOR THE SPECTROPHOTOMETRIC DETERMINATION OF
ATENOLOL IN PHARMACEUTICALS
2.4.1 INTRODUCTION
The chemistry and applicability of bromate-bromide mixture has been
reviewed in Section 2.3.1.
The bromate-bromide reagent has been used in the assay of many
pharmaceutical compounds based on oxidation and/or bromination of the drug by
bromine generated in situ after the drug solution is treated with a known excess of
bromate-bromide mixture in acid medium followed by determination of the residual
bromine iodometrically [10,142-148].
Literature survey presented in Section 2.0.2 reveals that bromate-bromide
reagent has not been used with potassium iodide and starch reagents. Based on this
two simple, sensitive and economic spectrophotometric methods have been developed
for the determination of ATN in bulk drug and pharmaceuticals.
2.4.2 EXPERIMENTAL
2.4.2.1 Instrument
The instrument used for absorbance measurements was the same as described
in Section 2.2.2.1.
2.4.2.2 Reagents and materials
All reagents and chemicals used were of analytical or pharmaceutical grade
and distilled water was used to prepare the solutions.
Bromate-bromide mixture: A standard stock solution of KBrO3–KBr equivalent to
300 µg mL-1 KBrO3 was prepared by dissolving accurately weighed 30 mg of KBrO3
(S. D. Fine Chem. Ltd., Mumbai, India) and 0.3 g of KBr (Merck, Mumbai, India) in
water and diluted to the mark in a 100 mL calibrated flask. The stock solution was
diluted with water to get bromate–bromide mixture solutions containing 30.0 µg mL-1
in KBrO3 for use in method A and 15 µg mL-1 in KBrO3 for method B.
This work has been published in Chemical Industry & Chemical Engineering Quarterly, 2012, 18 (1): 43-52.
Chapter 2 Titrimetric and spectrophotometric assay of atenolol
64
Potassium iodide: A 2% potassium iodide (Merck, Mumbai, India) solution was
prepared by dissolving 2 g potassium iodide with water in a 100 mL calibrated flask.
This solution was prepared a fresh daily.
Starch solution: One gram of starch (LOBA Chemie Ltd., Mumbai, India) was made
in to paste with water and slowly poured with constant stirring into 100 mL boiling
water, boiled for 5 min, cooled and used. This solution was prepared freshly every
day.
Hydrochloric acid: Concentrated acid (Merck, Mumbai, India, Sp. gr. 1.18) was
diluted appropriately with water to get 3 M HCl for use in both methods.
Sodium acetate: A 3 M aqueous solution of sodium acetate was prepared by
dissolving suitable quantity of sodium acetate trihydrate crystals (Merck, Mumbai,
India) in water for use in method A.
Standard ATN solution: A stock standard solution equivalent to 100 µg mL-1 ATN
was prepared by dissolving accurately weighed 25 mg of pure drug with water in a
250 mL calibrated flask. This stock solution was diluted with water to get the working
concentrations of 20 and 15 µg mL-1 for method A and method B, respectively.
Tablets used in this study are those mentioned in the Section 2.1.2.2.
2.4.2.3. Assay procedures
Method A (based on the measurement of tri-iodide ion)
Varying aliquots (0.25–4.5 mL) of standard ATN solution (20 µg mL-1) were
accurately transferred into a series of 10 mL calibrated flasks and the total volume
was adjusted to 4.5 mL with water. One mL of 3 M HCl was added to each flask
followed by the addition of 1 mL bromate–bromide mixture solution (30 µg mL-1 in
KBrO3). The content was mixed well and let stand for 15 min with occasional
shaking. Then, 1.0 mL of 3 M sodium acetate solution was added to each flask
followed by 1 mL of 2 % potassium iodide. The volume was brought up to the mark
with water and the absorbance of the resulting triiodide ion was measured at 360 nm
after 5 min against the water.
Method B (based on the measurement of starch-iodine complex)
Into a series of 10 mL calibrated flasks, different aliquots (0.2, 0.5, 1.0, 2.0,
3.0 and 4.0 mL) of standard ATN (15 µg mL-1) solution were transferred using a
micro burette. The total volume in each flask was brought to 4 mL by adding required
quantity of water. The solution was acidified by adding 1.0 mL of 3 M HCl, and 1.0
Chapter 2 Titrimetric and spectrophotometric assay of atenolol
65
mL of bromate–bromide (15 µg mL-1 in KBrO3) solution was then added to each
flask. The flasks were kept aside for 15 min with periodic shaking; 1.0 mL of 2%
potassium iodide was added and the content was mixed well. After 5 min, 1 mL of 1%
starch solution was added to each flask and the volume was made up to the mark with
water and mixed well. The absorbance of the resulting blue chromogen was measured
at 570 nm against water blank after 5 min.
Standard graph was prepared by plotting the absorbance versus ATN
concentration, and the concentration of the unknown was read from the calibration
graph or computed from the respective regression equation.
Procedure for tablets
Tablet extract equivalent to 100 µg mL-1 ATN was prepared as described in
Section 2.1.2.3. A suitable aliquot of the extract (100 µg mL-1 ATN) was diluted
appropriately with water to get 20.0 and 15.0 µg mL-1 ATN for the assay by methods
A and B, respectively.
Procedure for selectivity study
A placebo blank was prepared as described under Section 2.1.2.3, and then 10
mg placebo blank extract was analyzed as done in “Procedure for tablets”.
A synthetic mixture was prepared by adding 10 mg of ATN to the 20 mg of
the placebo blank, homogenized and the solution was prepared as done under
“Procedure for tablets”. The filtrate was collected in a 100 mL flask. The synthetic
mixture solution (100 µg mL-1 in ATN) was appropriately diluted with water to get
20.0 and 15.0 µg mL-1 ATN solutions, and appropriate aliquots were subjected to
analysis by method A and method B, separately.
2.4.3 RESULTS AND DISCUSSION
The proposed methods use the bromine generated in situ by the action of the
acid on bromate-bromide mixture which can be considered as a green
brominating/oxidizing agent and are based on the oxidation reaction of ATN with a
known excess of bromate-bromide mixture in acid medium. The unreacted bromine is
made oxidizes iodide and liberated iodine which will form tri-iodide ion (I3 -) in the
presence of excess iodide. The amount of iodine liberated, by the reaction of
unreacted bromine with potassium iodide, was either measured directly at 360 nm
(method A) or reacted with starch and resulting blue colored chromogen of starch-
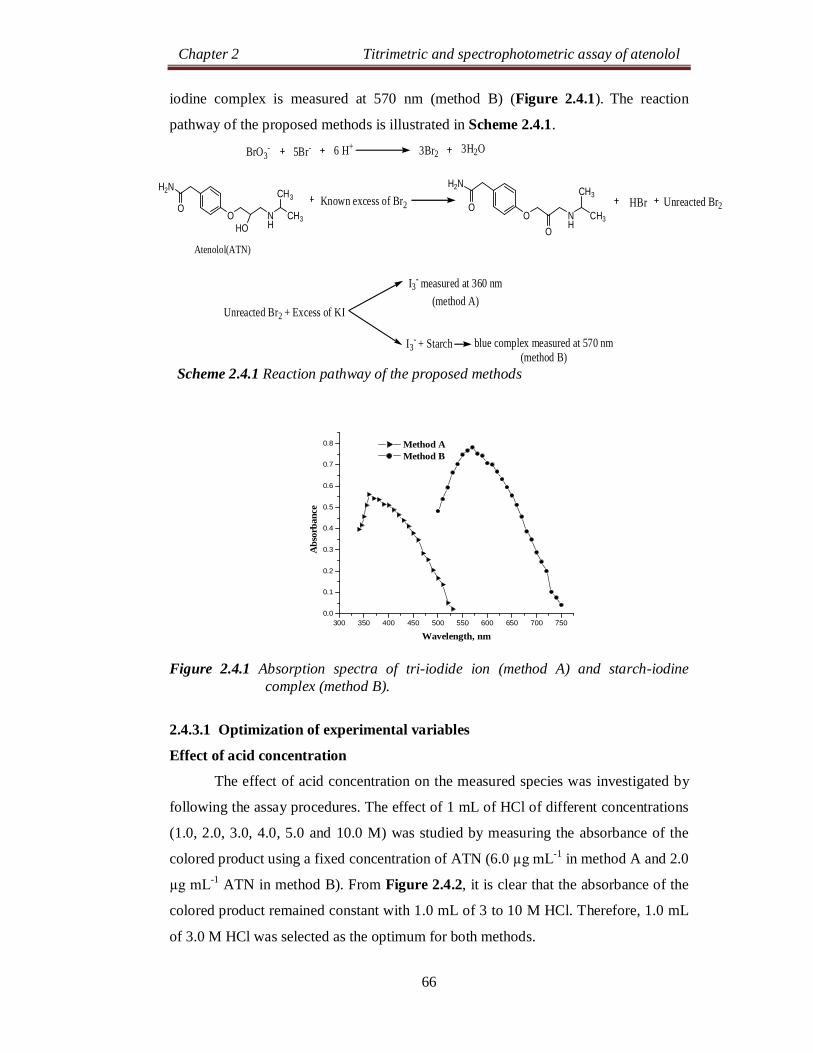
Chapter 2 Titrimetric and spectrophotometric assay of atenolol
66
iodine complex is measured at 570 nm (method B) (Figure 2.4.1). The reaction
pathway of the proposed methods is illustrated in Scheme 2.4.1.
BrO3-
H2N
OO N
HHOCH3
CH3
Atenolol(ATN)
3Br25Br- 6 H+ 3H2O
Known excess of Br2
H2N
OO N
HOCH3
CH3Unreacted Br2HBr
Unreacted Br2 + Excess of KI
I3- measured at 360 nm
(method A)
blue complex measured at 570 nm(method B)
I3- + Starch
Scheme 2.4.1 Reaction pathway of the proposed methods
Figure 2.4.1 Absorption spectra of tri-iodide ion (method A) and starch-iodine
complex (method B).
2.4.3.1 Optimization of experimental variables
Effect of acid concentration
The effect of acid concentration on the measured species was investigated by
following the assay procedures. The effect of 1 mL of HCl of different concentrations
(1.0, 2.0, 3.0, 4.0, 5.0 and 10.0 M) was studied by measuring the absorbance of the
colored product using a fixed concentration of ATN (6.0 µg mL-1 in method A and 2.0
µg mL-1 ATN in method B). From Figure 2.4.2, it is clear that the absorbance of the
colored product remained constant with 1.0 mL of 3 to 10 M HCl. Therefore, 1.0 mL
of 3.0 M HCl was selected as the optimum for both methods.
300 350 400 450 500 550 600 650 700 7500.0
0.1
0.2
0.3
0.4
0.5
0.6
0.7
0.8
Abs
orba
nce
Wavelength, nm
Method A Method B
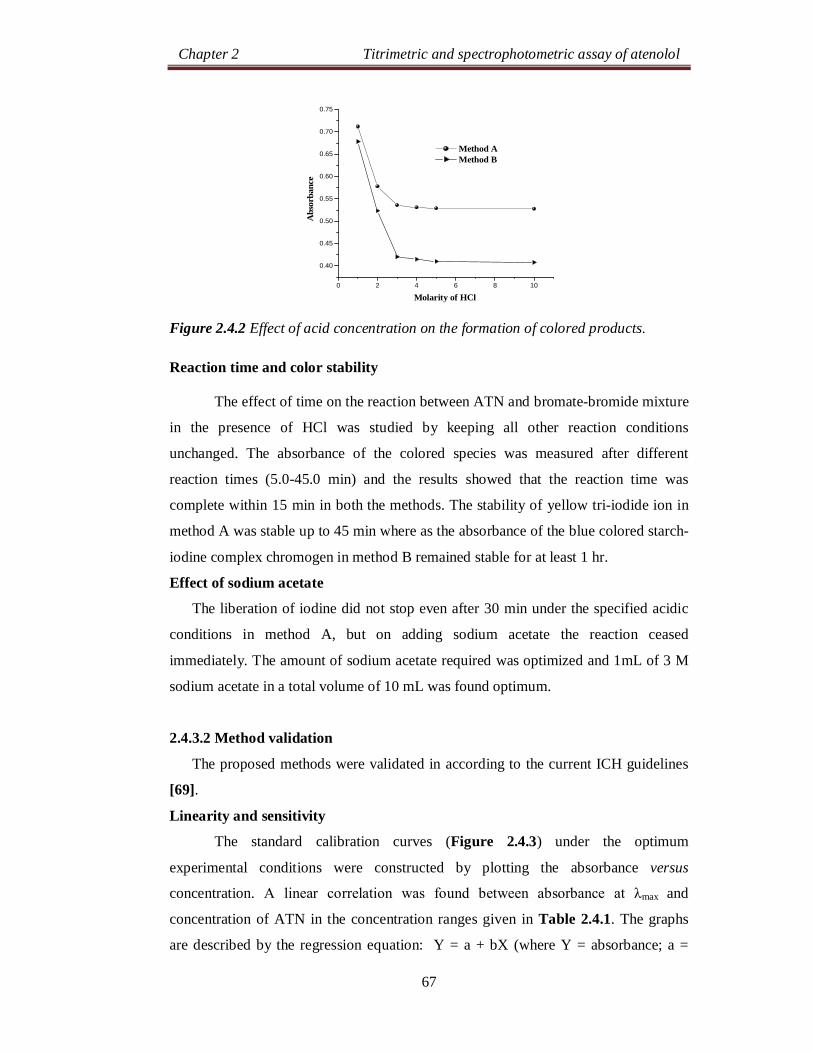
Chapter 2 Titrimetric and spectrophotometric assay of atenolol
67
Figure 2.4.2 Effect of acid concentration on the formation of colored products.
Reaction time and color stability
The effect of time on the reaction between ATN and bromate-bromide mixture
in the presence of HCl was studied by keeping all other reaction conditions
unchanged. The absorbance of the colored species was measured after different
reaction times (5.0-45.0 min) and the results showed that the reaction time was
complete within 15 min in both the methods. The stability of yellow tri-iodide ion in
method A was stable up to 45 min where as the absorbance of the blue colored starch-
iodine complex chromogen in method B remained stable for at least 1 hr.
Effect of sodium acetate
The liberation of iodine did not stop even after 30 min under the specified acidic
conditions in method A, but on adding sodium acetate the reaction ceased
immediately. The amount of sodium acetate required was optimized and 1mL of 3 M
sodium acetate in a total volume of 10 mL was found optimum.
2.4.3.2 Method validation
The proposed methods were validated in according to the current ICH guidelines
[69].
Linearity and sensitivity
The standard calibration curves (Figure 2.4.3) under the optimum
experimental conditions were constructed by plotting the absorbance versus
concentration. A linear correlation was found between absorbance at λmax and
concentration of ATN in the concentration ranges given in Table 2.4.1. The graphs
are described by the regression equation: Y = a + bX (where Y = absorbance; a =
0 2 4 6 8 10
0.40
0.45
0.50
0.55
0.60
0.65
0.70
0.75
Abs
orba
nce
Molarity of HCl
Method A Method B
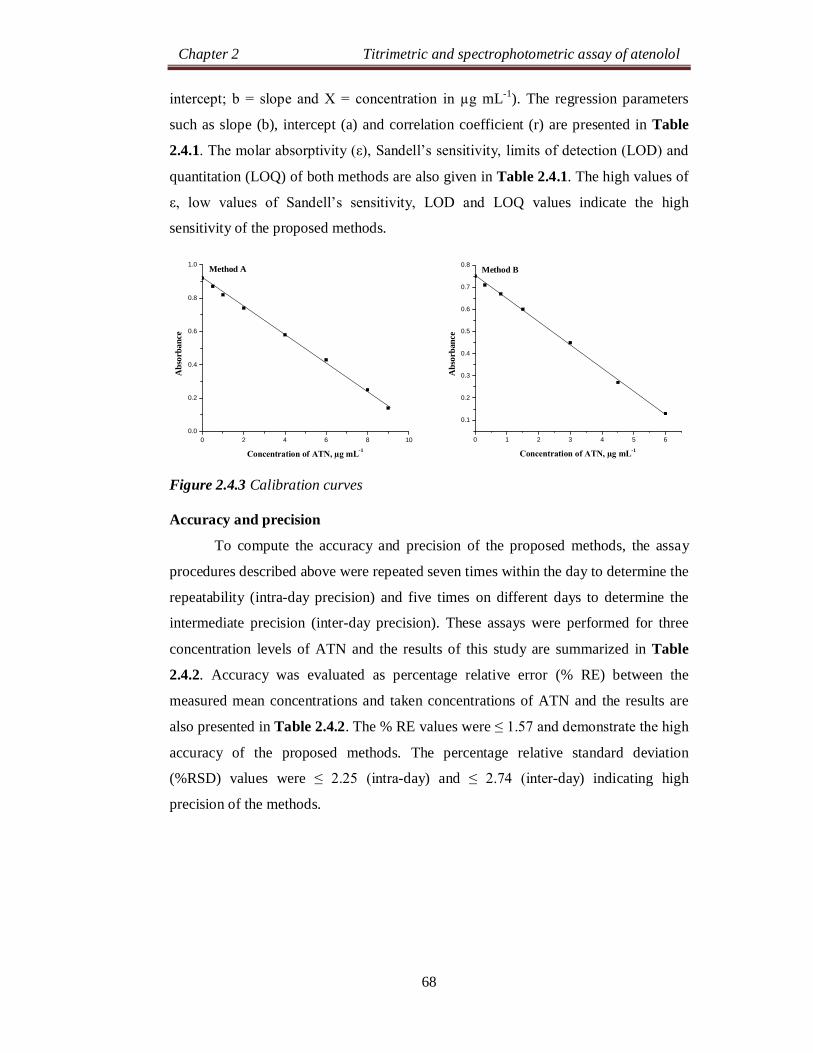
Chapter 2 Titrimetric and spectrophotometric assay of atenolol
68
intercept; b = slope and X = concentration in µg mL-1). The regression parameters
such as slope (b), intercept (a) and correlation coefficient (r) are presented in Table
2.4.1. The molar absorptivity (ε), Sandell’s sensitivity, limits of detection (LOD) and
quantitation (LOQ) of both methods are also given in Table 2.4.1. The high values of
ε, low values of Sandell’s sensitivity, LOD and LOQ values indicate the high
sensitivity of the proposed methods.
Figure 2.4.3 Calibration curves
Accuracy and precision
To compute the accuracy and precision of the proposed methods, the assay
procedures described above were repeated seven times within the day to determine the
repeatability (intra-day precision) and five times on different days to determine the
intermediate precision (inter-day precision). These assays were performed for three
concentration levels of ATN and the results of this study are summarized in Table
2.4.2. Accuracy was evaluated as percentage relative error (% RE) between the
measured mean concentrations and taken concentrations of ATN and the results are
also presented in Table 2.4.2. The % RE values were ≤ 1.57 and demonstrate the high
accuracy of the proposed methods. The percentage relative standard deviation
(%RSD) values were ≤ 2.25 (intra-day) and ≤ 2.74 (inter-day) indicating high
precision of the methods.
0 2 4 6 8 100.0
0.2
0.4
0.6
0.8
1.0 Method A
Abs
orba
nce
Concentration of ATN, µg mL-1
0 1 2 3 4 5 6
0.1
0.2
0.3
0.4
0.5
0.6
0.7
0.8 Method B
Abs
orba
nce
Concentration of ATN, µg mL-1
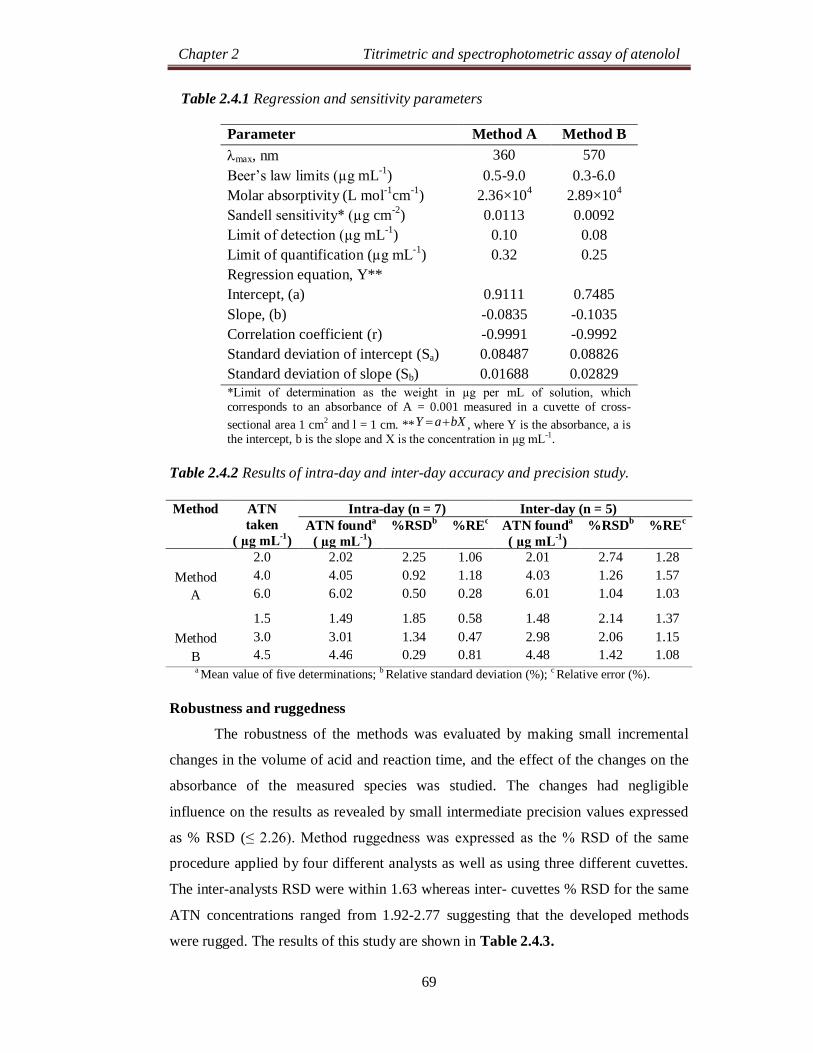
Chapter 2 Titrimetric and spectrophotometric assay of atenolol
69
Table 2.4.1 Regression and sensitivity parameters
Parameter Method A Method B max, nm 360 570 Beer’s law limits (µg mL-1) 0.5-9.0 0.3-6.0 Molar absorptivity (L mol-1cm-1) 2.36×10⁴ 2.89×10⁴ Sandell sensitivity* (µg cm-2) 0.0113 0.0092 Limit of detection (µg mL-1) 0.10 0.08 Limit of quantification (µg mL-1) 0.32 0.25 Regression equation, Y** Intercept, (a) 0.9111 0.7485 Slope, (b) -0.0835 -0.1035 Correlation coefficient (r) -0.9991 -0.9992 Standard deviation of intercept (Sa) 0.08487 0.08826 Standard deviation of slope (Sb) 0.01688 0.02829 *Limit of determination as the weight in µg per mL of solution, which corresponds to an absorbance of A = 0.001 measured in a cuvette of cross-sectional area 1 cm2 and l = 1 cm. ** bXaY , where Y is the absorbance, a is the intercept, b is the slope and X is the concentration in µg mL-1.
Table 2.4.2 Results of intra-day and inter-day accuracy and precision study.
Robustness and ruggedness
The robustness of the methods was evaluated by making small incremental
changes in the volume of acid and reaction time, and the effect of the changes on the
absorbance of the measured species was studied. The changes had negligible
influence on the results as revealed by small intermediate precision values expressed
as % RSD (≤ 2.26). Method ruggedness was expressed as the % RSD of the same
procedure applied by four different analysts as well as using three different cuvettes.
The inter-analysts RSD were within 1.63 whereas inter- cuvettes % RSD for the same
ATN concentrations ranged from 1.92-2.77 suggesting that the developed methods
were rugged. The results of this study are shown in Table 2.4.3.
Method ATN taken
( µg mL-1)
Intra-day (n = 7) Inter-day (n = 5) ATN founda ( µg mL-1)
%RSDb %REc ATN founda
( µg mL-1) %RSDb %REc
Method
A
2.0 2.02 2.25 1.06 2.01 2.74 1.28 4.0 4.05 0.92 1.18 4.03 1.26 1.57 6.0 6.02 0.50 0.28 6.01 1.04 1.03
Method
B
1.5 1.49 1.85 0.58 1.48 2.14 1.37 3.0 3.01 1.34 0.47 2.98 2.06 1.15 4.5 4.46 0.29 0.81 4.48 1.42 1.08
a Mean value of five determinations; b Relative standard deviation (%); c Relative error (%).
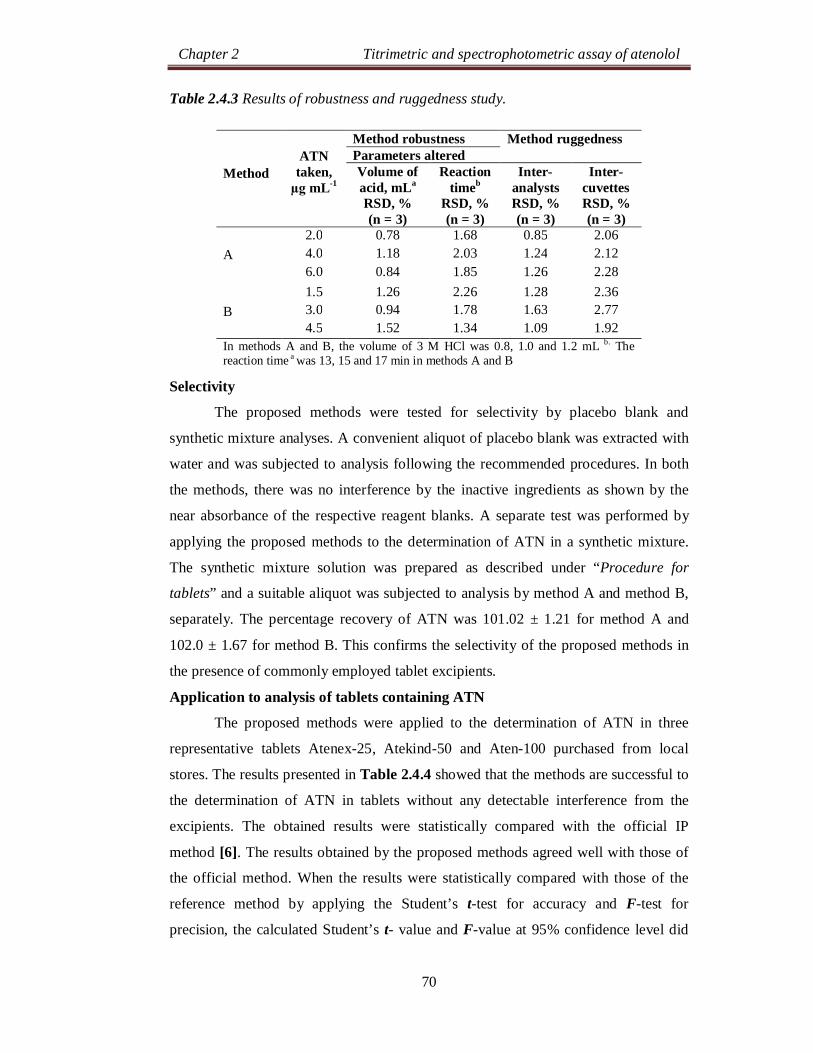
Chapter 2 Titrimetric and spectrophotometric assay of atenolol
70
Table 2.4.3 Results of robustness and ruggedness study.
Selectivity
The proposed methods were tested for selectivity by placebo blank and
synthetic mixture analyses. A convenient aliquot of placebo blank was extracted with
water and was subjected to analysis following the recommended procedures. In both
the methods, there was no interference by the inactive ingredients as shown by the
near absorbance of the respective reagent blanks. A separate test was performed by
applying the proposed methods to the determination of ATN in a synthetic mixture.
The synthetic mixture solution was prepared as described under “Procedure for
tablets” and a suitable aliquot was subjected to analysis by method A and method B,
separately. The percentage recovery of ATN was 101.02 ± 1.21 for method A and
102.0 ± 1.67 for method B. This confirms the selectivity of the proposed methods in
the presence of commonly employed tablet excipients.
Application to analysis of tablets containing ATN
The proposed methods were applied to the determination of ATN in three
representative tablets Atenex-25, Atekind-50 and Aten-100 purchased from local
stores. The results presented in Table 2.4.4 showed that the methods are successful to
the determination of ATN in tablets without any detectable interference from the
excipients. The obtained results were statistically compared with the official IP
method [6]. The results obtained by the proposed methods agreed well with those of
the official method. When the results were statistically compared with those of the
reference method by applying the Student’s t-test for accuracy and F-test for
precision, the calculated Student’s t- value and F-value at 95% confidence level did
Method
ATN
taken, µg mL-1
Method robustness Method ruggedness Parameters altered Volume of acid, mLa
RSD, % (n = 3)
Reaction timeb
RSD, % (n = 3)
Inter-analysts RSD, % (n = 3)
Inter-cuvettes RSD, % (n = 3)
A
2.0 0.78 1.68 0.85 2.06 4.0 1.18 2.03 1.24 2.12 6.0 0.84 1.85 1.26 2.28
B
1.5 1.26 2.26 1.28 2.36 3.0 0.94 1.78 1.63 2.77 4.5 1.52 1.34 1.09 1.92
In methods A and B, the volume of 3 M HCl was 0.8, 1.0 and 1.2 mL b. The reaction time a was 13, 15 and 17 min in methods A and B
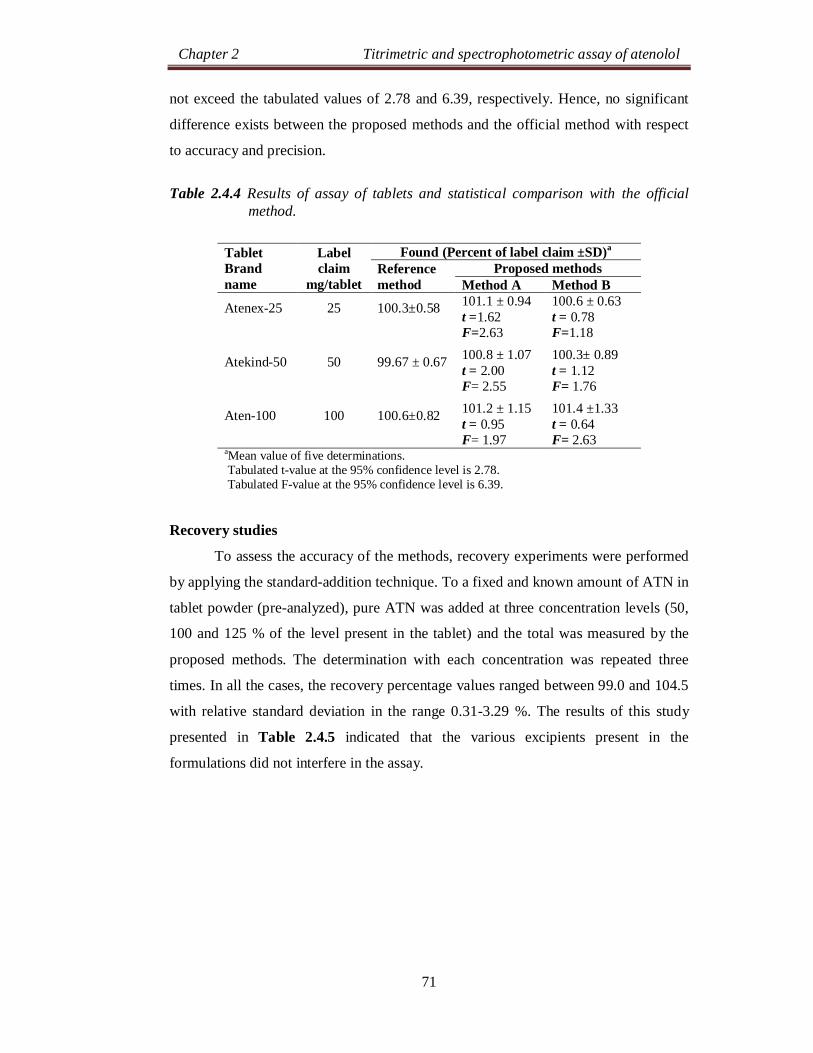
Chapter 2 Titrimetric and spectrophotometric assay of atenolol
71
not exceed the tabulated values of 2.78 and 6.39, respectively. Hence, no significant
difference exists between the proposed methods and the official method with respect
to accuracy and precision.
Table 2.4.4 Results of assay of tablets and statistical comparison with the official
method.
Recovery studies
To assess the accuracy of the methods, recovery experiments were performed
by applying the standard-addition technique. To a fixed and known amount of ATN in
tablet powder (pre-analyzed), pure ATN was added at three concentration levels (50,
100 and 125 % of the level present in the tablet) and the total was measured by the
proposed methods. The determination with each concentration was repeated three
times. In all the cases, the recovery percentage values ranged between 99.0 and 104.5
with relative standard deviation in the range 0.31-3.29 %. The results of this study
presented in Table 2.4.5 indicated that the various excipients present in the
formulations did not interfere in the assay.
Tablet Brand name
Label claim
mg/tablet
Found (Percent of label claim ±SD)a
Reference method
Proposed methods Method A Method B
Atenex-25
25
100.3±0.58
101.1 ± 0.94 t =1.62 F=2.63
100.6 ± 0.63 t = 0.78 F=1.18
Atekind-50
50
99.67 ± 0.67
100.8 ± 1.07 t = 2.00 F= 2.55
100.3± 0.89 t = 1.12 F= 1.76
Aten-100
100
100.6±0.82
101.2 ± 1.15 t = 0.95 F= 1.97
101.4 ±1.33 t = 0.64 F= 2.63
aMean value of five determinations. Tabulated t-value at the 95% confidence level is 2.78. Tabulated F-value at the 95% confidence level is 6.39.
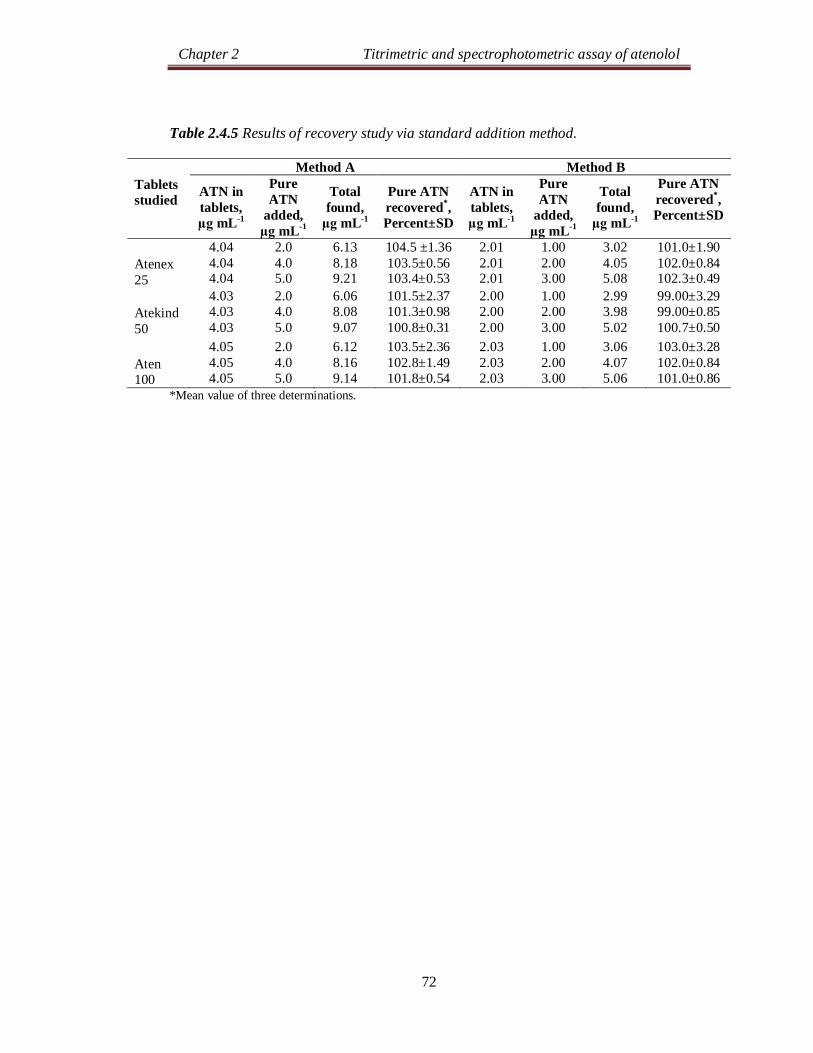
Chapter 2 Titrimetric and spectrophotometric assay of atenolol
72
Table 2.4.5 Results of recovery study via standard addition method.
*Mean value of three determinations.
Tablets studied
Method A Method B ATN in tablets, µg mL-1
Pure ATN
added, µg mL-1
Total found,
µg mL-1
Pure ATN recovered*, Percent±SD
ATN in tablets, µg mL-1
Pure ATN
added, µg mL-1
Total found,
µg mL-1
Pure ATN recovered*, Percent±SD
Atenex 25
4.04 4.04 4.04
2.0 4.0 5.0
6.13 8.18 9.21
104.5 ±1.36 103.5±0.56 103.4±0.53
2.01 2.01 2.01
1.00 2.00 3.00
3.02 4.05 5.08
101.0±1.90 102.0±0.84 102.3±0.49
Atekind 50
4.03 4.03 4.03
2.0 4.0 5.0
6.06 8.08 9.07
101.5±2.37 101.3±0.98 100.8±0.31
2.00 2.00 2.00
1.00 2.00 3.00
2.99 3.98 5.02
99.00±3.29 99.00±0.85 100.7±0.50
Aten 100
4.05 4.05 4.05
2.0 4.0 5.0
6.12 8.16 9.14
103.5±2.36 102.8±1.49 101.8±0.54
2.03 2.03 2.03
1.00 2.00 3.00
3.06 4.07 5.06
103.0±3.28 102.0±0.84 101.0±0.86
Chapter 2 Titrimetric and spectrophotometric assay of atenolol
73
Section 2.5
UV- SPECTROPHOTOMETRIC ASSAY OF ATENOLOL IN
PHARMACEUTICALS AND STUDY OF ITS FORCED DEGRADATION
2.5.1 INTRODUCTION
As a wide variety of pharmaceutical substances absorb radiation in the near-
ultraviolet (200–380 nm) region of the electromagnetic spectrum, the UV-
spectrophotometric technique is widely employed in pharmaceutical analysis. UV-
spectrophotometry [167-170], because of its simplicity, reproducibility and speed and
minimum solvent/reagent system required and less analysis time, is widely used for
the assay of many therapeutic compounds used as medications. UV-
spectrophotometry is perhaps the most widely used spectrophotometric technique for
the quantitative analysis of chemical substances as pure materials and as components
of dosage forms. It has found increasing usefulness as a means of assaying
pharmaceutical substances described in the pharmacopeias [171]. There are a lot of
pharmaceutical compounds such as quetiapine fumarate [172], oxcarbazepine [173],
lomefloxacin [174], ascorbic acid [175], doxazosin [176], simvastatin [177],
rosiglitazone maleate [178], ranitidine HCl [179], piroxicam [180], ketoconazole
[181], and famotidine [182], etc., to mention a few, which have been successfully
assayed by UV-spectrophotometry.
In spite of many-fold advantages, only two methods have been reported for the
determination of ATN in pharmaceuticals when present alone by UV-
spectrophotometry and none of them is stability-indicating.
Stability testing and stress testing (forced degradation studies) are critical
components of drug development strategy. The studies help us to understand the
mechanism of a drug’s decomposition, which further helps in obtaining information
on physical and chemical factors that result in instability [183]. Stress testing is
defined as the stability testing of drug substances and drug products under conditions
exceeding those used for accelerated testing. The International Conference on
Harmonization (ICH) guidelines entitled “stability testing of new drug substances and
products” requires that stress testing be carried out to elucidate the inherent stability
This work has been communicated to Malaysian Journal of Pharmaceutical Sciences.
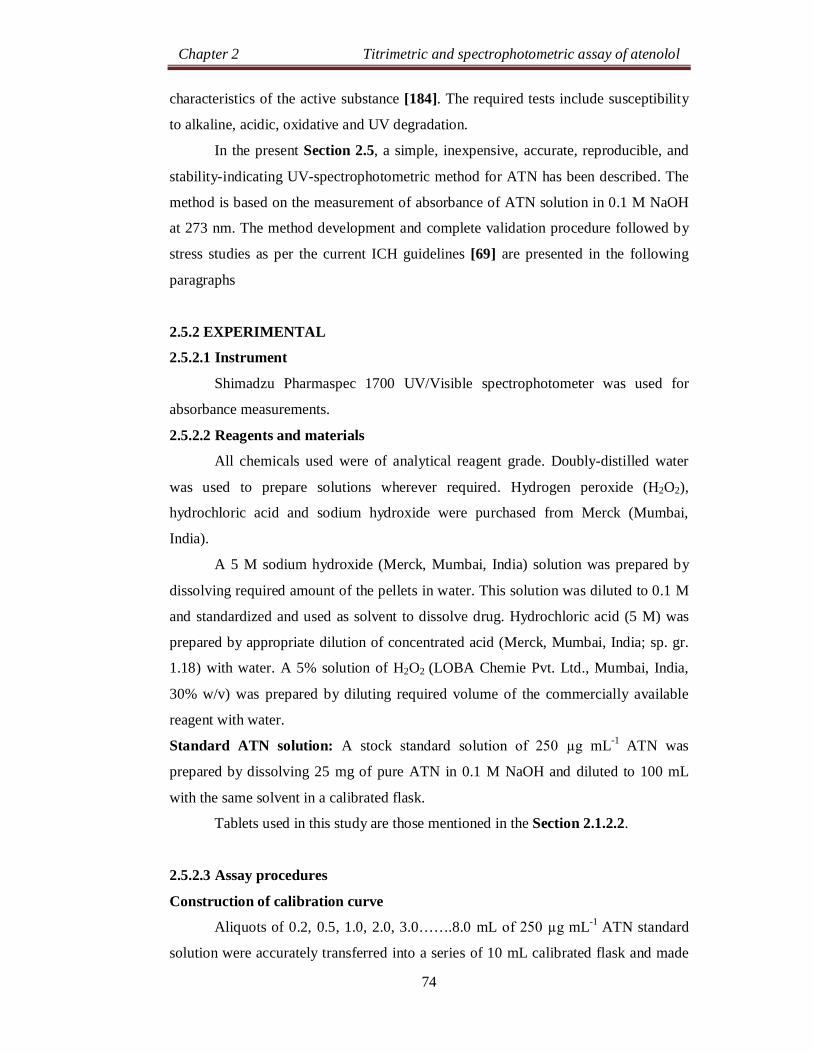
Chapter 2 Titrimetric and spectrophotometric assay of atenolol
74
characteristics of the active substance [184]. The required tests include susceptibility
to alkaline, acidic, oxidative and UV degradation.
In the present Section 2.5, a simple, inexpensive, accurate, reproducible, and
stability-indicating UV-spectrophotometric method for ATN has been described. The
method is based on the measurement of absorbance of ATN solution in 0.1 M NaOH
at 273 nm. The method development and complete validation procedure followed by
stress studies as per the current ICH guidelines [69] are presented in the following
paragraphs
2.5.2 EXPERIMENTAL
2.5.2.1 Instrument
Shimadzu Pharmaspec 1700 UV/Visible spectrophotometer was used for
absorbance measurements.
2.5.2.2 Reagents and materials
All chemicals used were of analytical reagent grade. Doubly-distilled water
was used to prepare solutions wherever required. Hydrogen peroxide (H2O2),
hydrochloric acid and sodium hydroxide were purchased from Merck (Mumbai,
India).
A 5 M sodium hydroxide (Merck, Mumbai, India) solution was prepared by
dissolving required amount of the pellets in water. This solution was diluted to 0.1 M
and standardized and used as solvent to dissolve drug. Hydrochloric acid (5 M) was
prepared by appropriate dilution of concentrated acid (Merck, Mumbai, India; sp. gr.
1.18) with water. A 5% solution of H2O2 (LOBA Chemie Pvt. Ltd., Mumbai, India,
30% w/v) was prepared by diluting required volume of the commercially available
reagent with water.
Standard ATN solution: A stock standard solution of 250 µg mL-1 ATN was
prepared by dissolving 25 mg of pure ATN in 0.1 M NaOH and diluted to 100 mL
with the same solvent in a calibrated flask.
Tablets used in this study are those mentioned in the Section 2.1.2.2.
2.5.2.3 Assay procedures
Construction of calibration curve
Aliquots of 0.2, 0.5, 1.0, 2.0, 3.0…….8.0 mL of 250 µg mL-1 ATN standard
solution were accurately transferred into a series of 10 mL calibrated flask and made
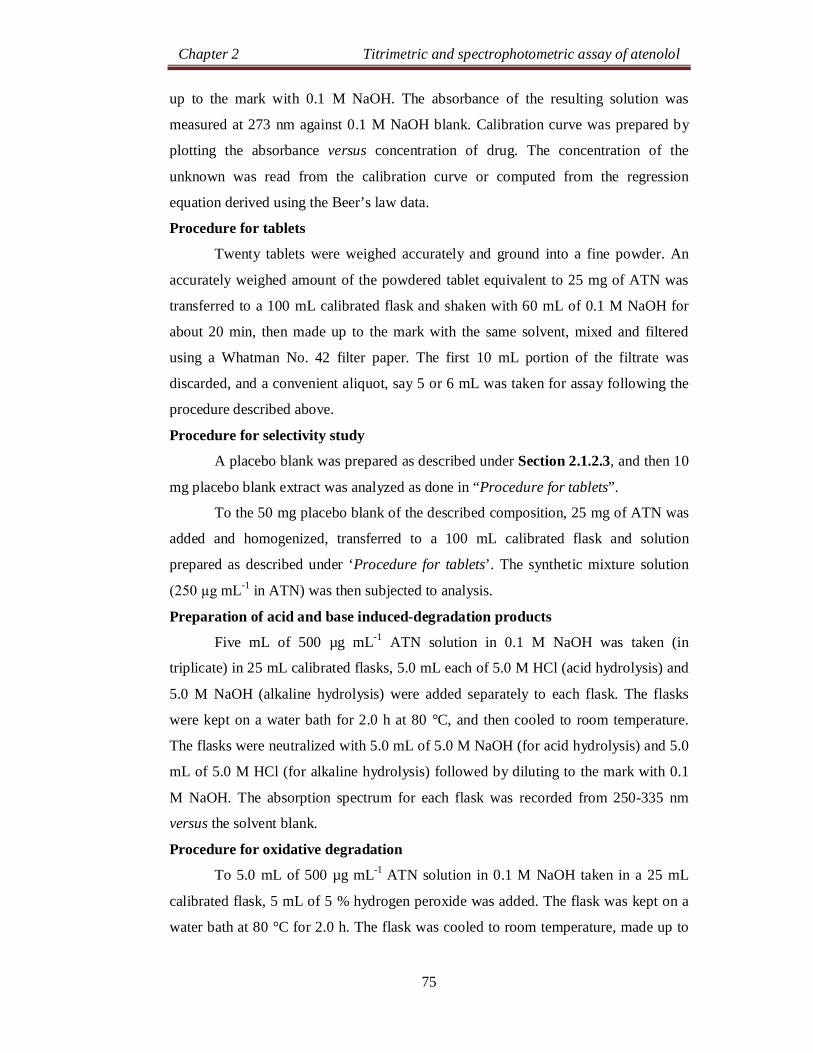
Chapter 2 Titrimetric and spectrophotometric assay of atenolol
75
up to the mark with 0.1 M NaOH. The absorbance of the resulting solution was
measured at 273 nm against 0.1 M NaOH blank. Calibration curve was prepared by
plotting the absorbance versus concentration of drug. The concentration of the
unknown was read from the calibration curve or computed from the regression
equation derived using the Beer’s law data.
Procedure for tablets
Twenty tablets were weighed accurately and ground into a fine powder. An
accurately weighed amount of the powdered tablet equivalent to 25 mg of ATN was
transferred to a 100 mL calibrated flask and shaken with 60 mL of 0.1 M NaOH for
about 20 min, then made up to the mark with the same solvent, mixed and filtered
using a Whatman No. 42 filter paper. The first 10 mL portion of the filtrate was
discarded, and a convenient aliquot, say 5 or 6 mL was taken for assay following the
procedure described above.
Procedure for selectivity study
A placebo blank was prepared as described under Section 2.1.2.3, and then 10
mg placebo blank extract was analyzed as done in “Procedure for tablets”.
To the 50 mg placebo blank of the described composition, 25 mg of ATN was
added and homogenized, transferred to a 100 mL calibrated flask and solution
prepared as described under ‘Procedure for tablets’. The synthetic mixture solution
(250 µg mL-1 in ATN) was then subjected to analysis.
Preparation of acid and base induced-degradation products
Five mL of 500 µg mL-1 ATN solution in 0.1 M NaOH was taken (in
triplicate) in 25 mL calibrated flasks, 5.0 mL each of 5.0 M HCl (acid hydrolysis) and
5.0 M NaOH (alkaline hydrolysis) were added separately to each flask. The flasks
were kept on a water bath for 2.0 h at 80 °C, and then cooled to room temperature.
The flasks were neutralized with 5.0 mL of 5.0 M NaOH (for acid hydrolysis) and 5.0
mL of 5.0 M HCl (for alkaline hydrolysis) followed by diluting to the mark with 0.1
M NaOH. The absorption spectrum for each flask was recorded from 250-335 nm
versus the solvent blank.
Procedure for oxidative degradation
To 5.0 mL of 500 µg mL-1 ATN solution in 0.1 M NaOH taken in a 25 mL
calibrated flask, 5 mL of 5 % hydrogen peroxide was added. The flask was kept on a
water bath at 80 °C for 2.0 h. The flask was cooled to room temperature, made up to
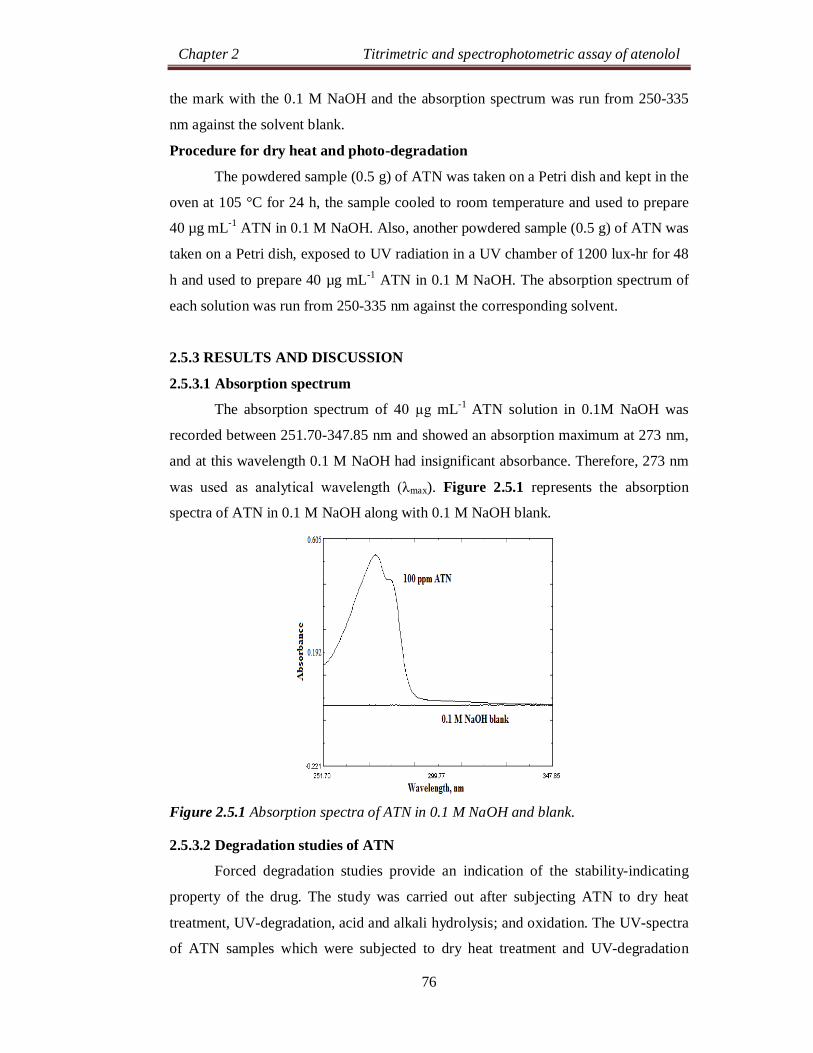
Chapter 2 Titrimetric and spectrophotometric assay of atenolol
76
the mark with the 0.1 M NaOH and the absorption spectrum was run from 250-335
nm against the solvent blank.
Procedure for dry heat and photo-degradation
The powdered sample (0.5 g) of ATN was taken on a Petri dish and kept in the
oven at 105 °C for 24 h, the sample cooled to room temperature and used to prepare
40 µg mL-1 ATN in 0.1 M NaOH. Also, another powdered sample (0.5 g) of ATN was
taken on a Petri dish, exposed to UV radiation in a UV chamber of 1200 lux-hr for 48
h and used to prepare 40 µg mL-1 ATN in 0.1 M NaOH. The absorption spectrum of
each solution was run from 250-335 nm against the corresponding solvent.
2.5.3 RESULTS AND DISCUSSION
2.5.3.1 Absorption spectrum
The absorption spectrum of 40 µg mL-1 ATN solution in 0.1M NaOH was
recorded between 251.70-347.85 nm and showed an absorption maximum at 273 nm,
and at this wavelength 0.1 M NaOH had insignificant absorbance. Therefore, 273 nm
was used as analytical wavelength (λmax). Figure 2.5.1 represents the absorption
spectra of ATN in 0.1 M NaOH along with 0.1 M NaOH blank.
Figure 2.5.1 Absorption spectra of ATN in 0.1 M NaOH and blank. 2.5.3.2 Degradation studies of ATN
Forced degradation studies provide an indication of the stability-indicating
property of the drug. The study was carried out after subjecting ATN to dry heat
treatment, UV-degradation, acid and alkali hydrolysis; and oxidation. The UV-spectra
of ATN samples which were subjected to dry heat treatment and UV-degradation
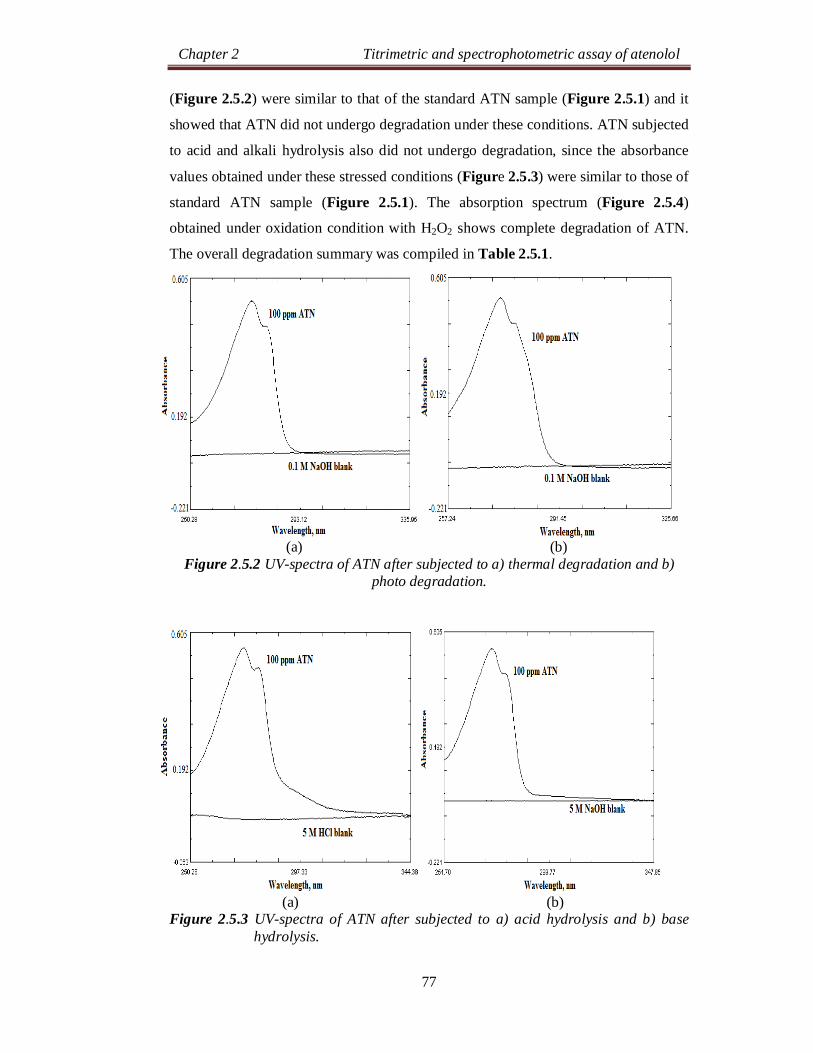
Chapter 2 Titrimetric and spectrophotometric assay of atenolol
77
(Figure 2.5.2) were similar to that of the standard ATN sample (Figure 2.5.1) and it
showed that ATN did not undergo degradation under these conditions. ATN subjected
to acid and alkali hydrolysis also did not undergo degradation, since the absorbance
values obtained under these stressed conditions (Figure 2.5.3) were similar to those of
standard ATN sample (Figure 2.5.1). The absorption spectrum (Figure 2.5.4)
obtained under oxidation condition with H2O2 shows complete degradation of ATN.
The overall degradation summary was compiled in Table 2.5.1.
(a) (b)
Figure 2.5.2 UV-spectra of ATN after subjected to a) thermal degradation and b) photo degradation.
(a) (b) Figure 2.5.3 UV-spectra of ATN after subjected to a) acid hydrolysis and b) base
hydrolysis.
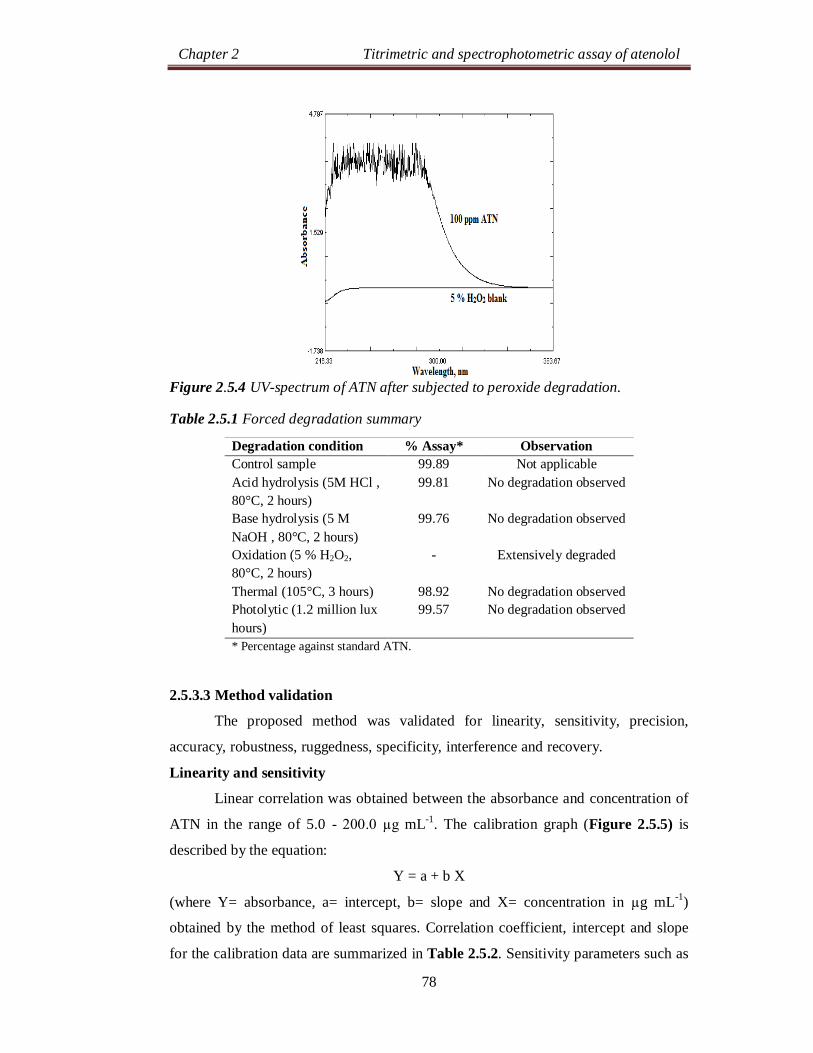
Chapter 2 Titrimetric and spectrophotometric assay of atenolol
78
Figure 2.5.4 UV-spectrum of ATN after subjected to peroxide degradation.
Table 2.5.1 Forced degradation summary
2.5.3.3 Method validation
The proposed method was validated for linearity, sensitivity, precision,
accuracy, robustness, ruggedness, specificity, interference and recovery.
Linearity and sensitivity
Linear correlation was obtained between the absorbance and concentration of
ATN in the range of 5.0 - 200.0 µg mL-1. The calibration graph (Figure 2.5.5) is
described by the equation:
Y = a + b X
(where Y= absorbance, a= intercept, b= slope and X= concentration in µg mL-1)
obtained by the method of least squares. Correlation coefficient, intercept and slope
for the calibration data are summarized in Table 2.5.2. Sensitivity parameters such as
Degradation condition % Assay* Observation Control sample 99.89 Not applicable Acid hydrolysis (5M HCl , 80°C, 2 hours)
99.81 No degradation observed
Base hydrolysis (5 M NaOH , 80°C, 2 hours)
99.76 No degradation observed
Oxidation (5 % H2O2, 80°C, 2 hours)
- Extensively degraded
Thermal (105°C, 3 hours) 98.92 No degradation observed Photolytic (1.2 million lux hours)
99.57 No degradation observed
* Percentage against standard ATN.
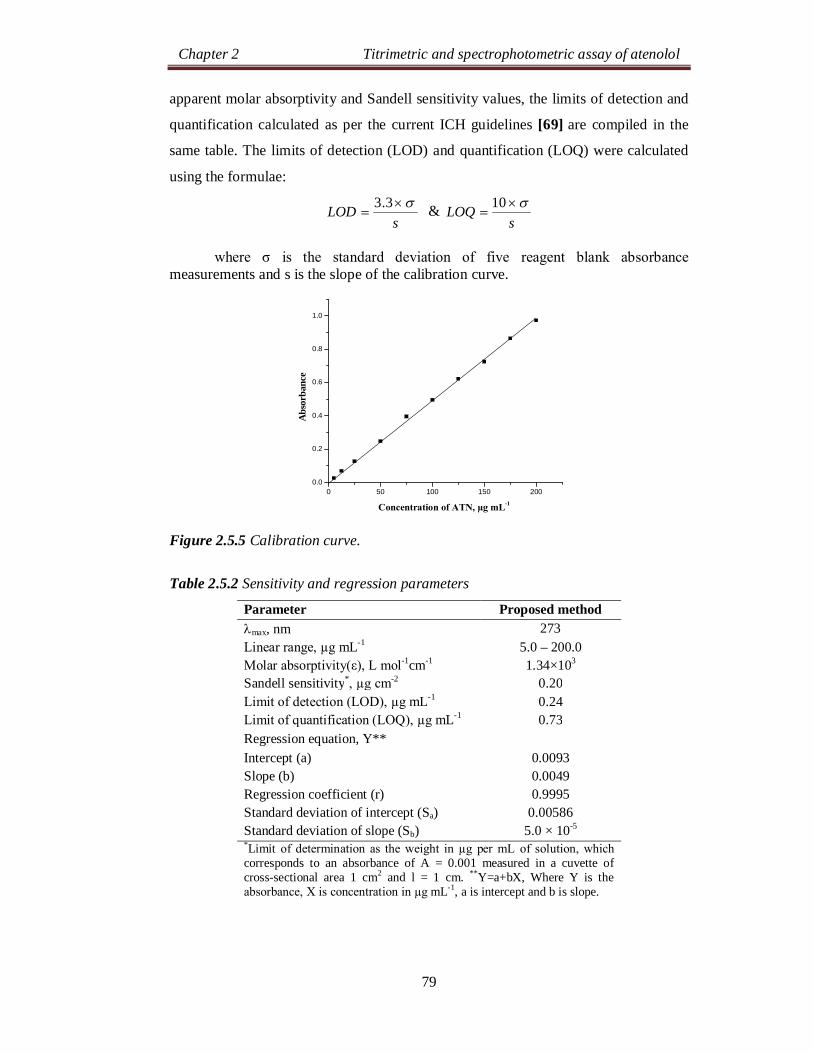
Chapter 2 Titrimetric and spectrophotometric assay of atenolol
79
apparent molar absorptivity and Sandell sensitivity values, the limits of detection and
quantification calculated as per the current ICH guidelines [69] are compiled in the
same table. The limits of detection (LOD) and quantification (LOQ) were calculated
using the formulae:
sLOD
3.3 &
sLOQ
10
where σ is the standard deviation of five reagent blank absorbance measurements and s is the slope of the calibration curve.
Figure 2.5.5 Calibration curve.
Table 2.5.2 Sensitivity and regression parameters
Parameter Proposed method max, nm 273 Linear range, µg mL-1 5.0 – 200.0 Molar absorptivity(ε), L mol-1cm-1 1.34×10³
Sandell sensitivity*, µg cm-2 0.20 Limit of detection (LOD), µg mL-1 0.24 Limit of quantification (LOQ), µg mL-1 0.73 Regression equation, Y** Intercept (a) 0.0093 Slope (b) 0.0049 Regression coefficient (r) 0.9995 Standard deviation of intercept (Sa) 0.00586 Standard deviation of slope (Sb) 5.0 × 10⁻⁵ *Limit of determination as the weight in µg per mL of solution, which corresponds to an absorbance of A = 0.001 measured in a cuvette of cross-sectional area 1 cm2 and l = 1 cm. **Y=a+bX, Where Y is the absorbance, X is concentration in µg mL-1, a is intercept and b is slope.
0 50 100 150 2000.0
0.2
0.4
0.6
0.8
1.0
Abs
orba
nce
Concentration of ATN, µg mL-1
Chapter 2 Titrimetric and spectrophotometric assay of atenolol
80
Accuracy and precision
Within-day accuracy and precision of the proposed method were evaluated by
replicate analysis (n=7) of calibration standards at three different concentration levels
on the same day. Between-day accuracy and precision were determined by assaying
the calibration standards at the same concentration levels on five consecutive days.
Percentage relative standard deviations (% RSD) as precision and percentage relative
error (% RE) as accuracy of the proposed method were calculated. These results of
accuracy and precision showed that the proposed methods have good repeatability and
reproducibility (Table 2.5.3).
Table 2.5.3 Results of intra-day and inter-day accuracy and precision study.
Robustness and ruggedness
Method robustness was checked by determination of ATN at three different
concentrations by measuring the absorbance at 272, 273 and 274 nm whereas the
method ruggedness was performed by four different analysts, and also with three
different cuvettes by a single analyst. The intermediate precision, expressed as percent
RSD, which is a measure of robustness and ruggedness was within the acceptable
limits as shown in the Table. 2.5.4.
Table 2.5.4 Results of robustness and ruggedness study.
ATN taken,
µg mL-1
Intra-day accuracy and precision (n=7)
Inter-day accuracy and precision (n=5)
ATN found, µg mL-1 %RE %RSD ATN found,
µg mL-1 %RE %RSD 50.00 100.0 150.0
49.70 99.37 149.6
0.59 0.63 0.27
0.18 0.28 0.33
50.38 100.53 151.22
0.76 0.53 0.81
0.85 1.03 0.96
%RE: Percentage relative error, %RSD: Percentage relative standard deviation.
ATN taken,
µg mL-1
Method robustness Method ruggedness Parameter altered
Wavelength*, nm, RSD % (n = 3)
Inter-analysts’ RSD, % (n = 4)
Inter-cuvettes’ RSD, % (n = 3)
50.00 2.58 1.25 1.75 100.0 3.12 0.74 1.24 150.0 2.64 0.85 1.07
*Wavelengths used were 272, 273 and 274 nm.
Chapter 2 Titrimetric and spectrophotometric assay of atenolol
81
Selectivity
The proposed method was tested for selectivity by placebo blank and synthetic
mixture analyses. The placebo blank solution showed nearly the same absorbance as
that 0.1 M NaOH blank indicating no interference from the inactive ingredients.
A separate experiment was performed with the synthetic mixture. The analysis
of synthetic mixture solution yielded percent recoveries which ranged from 100.47 –
101.78 with standard deviation of 0.65 – 1.19. The results of this study showed that
the inactive ingredients did not interfere in the assay. These results further
demonstrate the accuracy as well as the precision of the proposed method.
Application to analysis of tablets containing ATN
In order to evaluate the analytical applicability of the proposed method to the
quantification of ATN in commercial tablets, the results obtained by the proposed
method were compared to those of the official method [4] by applying Student’s t-test
for accuracy and F-test for precision. The official method described the non-aqueous
potentiometric method in acetic acid medium. The results (Table 2.5.5) showed that
the Student’s t- and F-values at 95 % confidence level did not exceed the tabulated
values, which confirmed that there is a good agreement between the results obtained
by the proposed method and the official method with respect to accuracy and
precision.
Table 2.5.5 Results of assay of tablets and statistical comparison with the official method.
Tablet Brand name
Label claim
mg/tablet
Found (Percent of label claim ±SD)a
Official method
Proposed method
Atenex-25b
25
100.3±0.58
99.32 ± 0.73 t = 2.35 F=1.58
Atekind-50c
50
99.67 ± 0.67
100.9 ± 0.77 t = 2.69 F= 1.32
Aten-100d
100
100.6±0.82
98.72 ± 1.01 t = 3.23 F= 1.52
aMean value of five determinations. Tabulated t-value at the 95% confidence level is 2.78. Tabulated F-value at the 95% confidence level is 6.39.
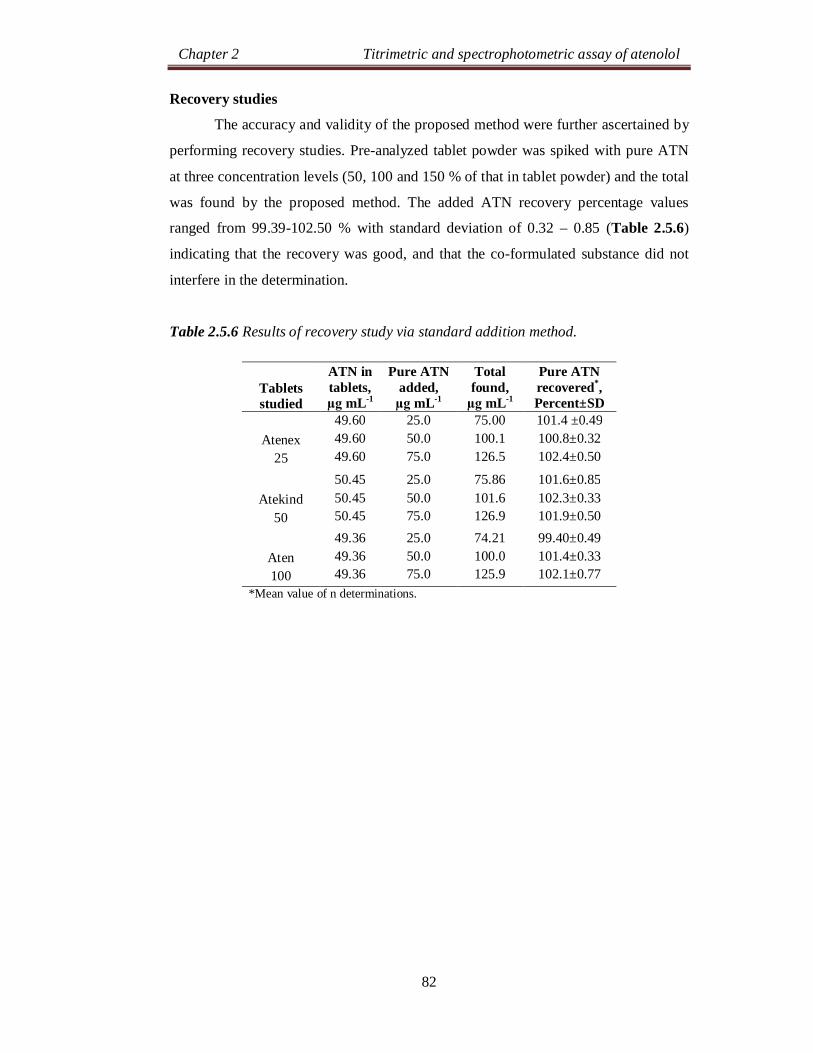
Chapter 2 Titrimetric and spectrophotometric assay of atenolol
82
Recovery studies
The accuracy and validity of the proposed method were further ascertained by
performing recovery studies. Pre-analyzed tablet powder was spiked with pure ATN
at three concentration levels (50, 100 and 150 % of that in tablet powder) and the total
was found by the proposed method. The added ATN recovery percentage values
ranged from 99.39-102.50 % with standard deviation of 0.32 – 0.85 (Table 2.5.6)
indicating that the recovery was good, and that the co-formulated substance did not
interfere in the determination.
Table 2.5.6 Results of recovery study via standard addition method.
Tablets studied
ATN in tablets, µg mL-1
Pure ATN added,
µg mL-1
Total found,
µg mL-1
Pure ATN recovered*, Percent±SD
Atenex
25
49.60 49.60 49.60
25.0 50.0 75.0
75.00 100.1 126.5
101.4 ±0.49 100.8±0.32 102.4±0.50
Atekind
50
50.45 50.45 50.45
25.0 50.0 75.0
75.86 101.6 126.9
101.6±0.85 102.3±0.33 101.9±0.50
Aten 100
49.36 49.36 49.36
25.0 50.0 75.0
74.21 100.0 125.9
99.40±0.49 101.4±0.33 102.1±0.77
*Mean value of n determinations.
Chapter 2 Titrimetric and spectrophotometric assay of atenolol
83
SECTION 2.6
SUMMARY AND CONCLUSIONS –Assessment of methods
Two titrimetric, eight visible spectrophotometric and one UV-
spectrophotometric methods were developed and validated for the assay of ATN in
pharmaceuticals. The performance characteristics of the methods developed and those
of the existing methods are compiled in Table 2.6.1. The EP [4] and BP [5] methods
which are based on the potentiometric titration of drug with 0.1 M HClO4 is
applicable for macroscale assays and unsuitable for semimicro analysis. Even though
few titrimetric methods were previously reported, they are time consuming as they are
indirect titrations. To fill this void, two methods using 5 mM HClO4 as titrant were
developed. Here, the end points was detected either visually or potentiometrically.
The methods are applicable over 1.5 – 15.0 mg of ATN. The methods were applied
successfully to the determination of ATN in tablets. Compared to all reported
methods for ATN, the proposed methods have two additional advantages of simplicity
of operations and low-cost per analysis. These advantageous features advocate their
use in quality control laboratories for routine use.
Many of the previously reported spectrophotometric methods suffered from
one or other disadvantage like poor sensitivity, heating or extraction step, use of
expensive chemical and/or complicated experimental setup as can be seen from Table
2.6.1. The proposed spectrophotometric methods are simple, sensitive and use non
hazardous eco-friendly reagents. As an overall review, BB: MCP method with ε value
3.46 × 10⁴ L mol-1 cm-1 is more sensitive among the proposed methods.
The previously reported UV-spectrophotometric methods [12-19] are confined
to the assay and are not stability-indicating. The present method employs 0.1 M
NaOH as the solvent and thereby reducing cost of analysis. The method offers an
additional advantage of wide linear dynamic range (5.0-200.0 µg mL-1). From the
stress study it clearly demonstrated that ATN undergoes extensive degradation under
oxidative stress condition and stable to acidic, thermal, photolytic, and alkaline
conditions. This study is a typical example of development of a stability indicating
assay, established following the recommendations of ICH-guidelines.
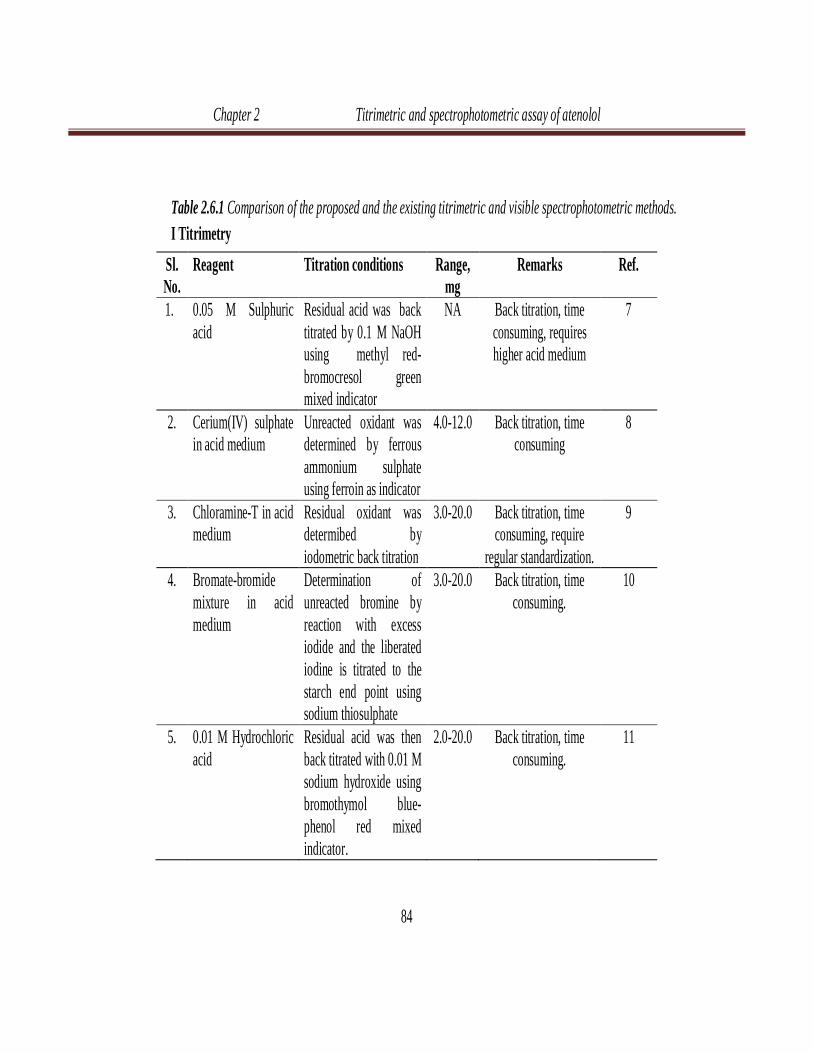
Chapter 2 Titrimetric and spectrophotometric assay of atenolol
84
Table 2.6.1 Comparison of the proposed and the existing titrimetric and visible spectrophotometric methods. I Titrimetry
Sl. No.
Reagent Titration conditions Range, mg
Remarks Ref.
1. 0.05 M Sulphuric acid
Residual acid was back titrated by 0.1 M NaOH using methyl red-bromocresol green mixed indicator
NA Back titration, time consuming, requires higher acid medium
7
2. Cerium(IV) sulphate in acid medium
Unreacted oxidant was determined by ferrous ammonium sulphate using ferroin as indicator
4.0-12.0 Back titration, time consuming
8
3. Chloramine-T in acid medium
Residual oxidant was determibed by iodometric back titration
3.0-20.0 Back titration, time consuming, require
regular standardization.
9
4. Bromate-bromide mixture in acid medium
Determination of unreacted bromine by reaction with excess iodide and the liberated iodine is titrated to the starch end point using sodium thiosulphate
3.0-20.0 Back titration, time consuming.
10
5. 0.01 M Hydrochloric acid
Residual acid was then back titrated with 0.01 M sodium hydroxide using bromothymol blue-phenol red mixed indicator.
2.0-20.0 Back titration, time consuming.
11
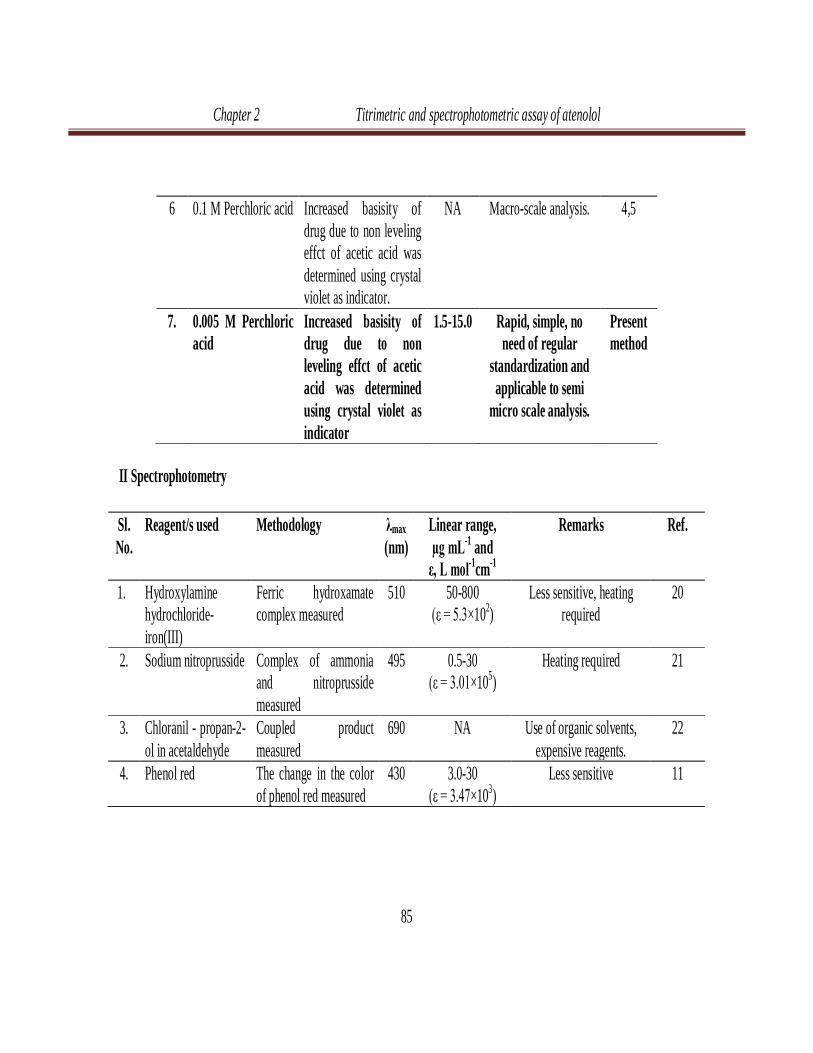
Chapter 2 Titrimetric and spectrophotometric assay of atenolol
85
II Spectrophotometry
6 0.1 M Perchloric acid Increased basisity of drug due to non leveling effct of acetic acid was determined using crystal violet as indicator.
NA Macro-scale analysis. 4,5
7. 0.005 M Perchloric acid
Increased basisity of drug due to non leveling effct of acetic acid was determined using crystal violet as indicator
1.5-15.0 Rapid, simple, no need of regular
standardization and applicable to semi
micro scale analysis.
Present method
Sl. No.
Reagent/s used Methodology λmax (nm)
Linear range, µg mL-1 and
ε, L mol-1cm-1
Remarks Ref.
1. Hydroxylamine hydrochloride- iron(III)
Ferric hydroxamate complex measured
510 50-800 (ε = 5.3×10²)
Less sensitive, heating required
20
2. Sodium nitroprusside Complex of ammonia and nitroprusside measured
495 0.5-30 (ε = 3.01×10⁵)
Heating required 21
3. Chloranil - propan-2-ol in acetaldehyde
Coupled product measured
690 NA Use of organic solvents, expensive reagents.
22
4. Phenol red The change in the color of phenol red measured
430 3.0-30 (ε = 3.47×10³)
Less sensitive 11
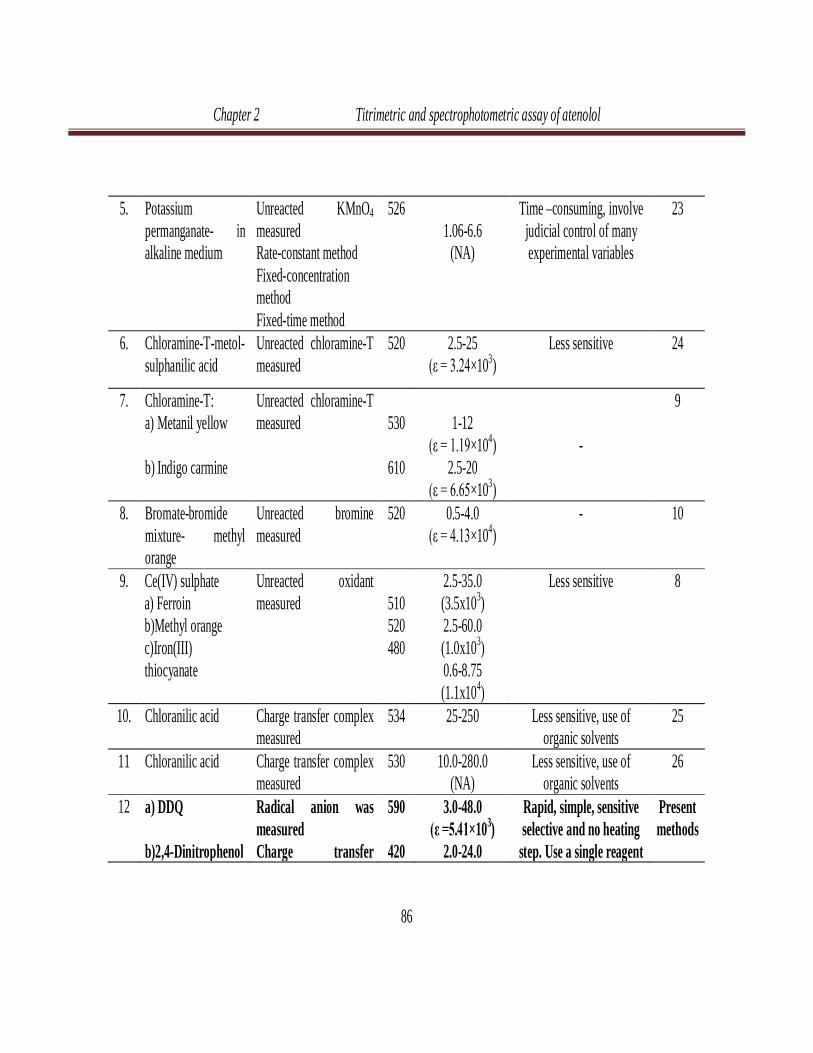
Chapter 2 Titrimetric and spectrophotometric assay of atenolol
86
5. Potassium permanganate- in alkaline medium
Unreacted KMnO4 measured Rate-constant method Fixed-concentration method Fixed-time method
526 1.06-6.6
(NA)
Time –consuming, involve judicial control of many experimental variables
23
6. Chloramine-T-metol-sulphanilic acid
Unreacted chloramine-T measured
520 2.5-25 (ε = 3.24×10³)
Less sensitive 24
7. Chloramine-T: a) Metanil yellow
b) Indigo carmine
Unreacted chloramine-T measured
530
610
1-12
(ε = 1.19×10⁴) 2.5-20
(ε = 6.65×10³)
-
9
8. Bromate-bromide mixture- methyl orange
Unreacted bromine measured
520 0.5-4.0 (ε = 4.13×10⁴)
- 10
9. Ce(IV) sulphate a) Ferroin b)Methyl orange c)Iron(III) thiocyanate
Unreacted oxidant measured
510 520 480
2.5-35.0 (3.5x10³) 2.5-60.0 (1.0x10³) 0.6-8.75 (1.1x10⁴)
Less sensitive 8
10. Chloranilic acid Charge transfer complex measured
534 25-250
Less sensitive, use of organic solvents
25
11 Chloranilic acid Charge transfer complex measured
530 10.0-280.0 (NA)
Less sensitive, use of organic solvents
26
12 a) DDQ b)2,4-Dinitrophenol
Radical anion was measured Charge transfer
590
420
3.0-48.0 (ε =5.41×10³)
2.0-24.0
Rapid, simple, sensitive selective and no heating
step. Use a single reagent
Present methods
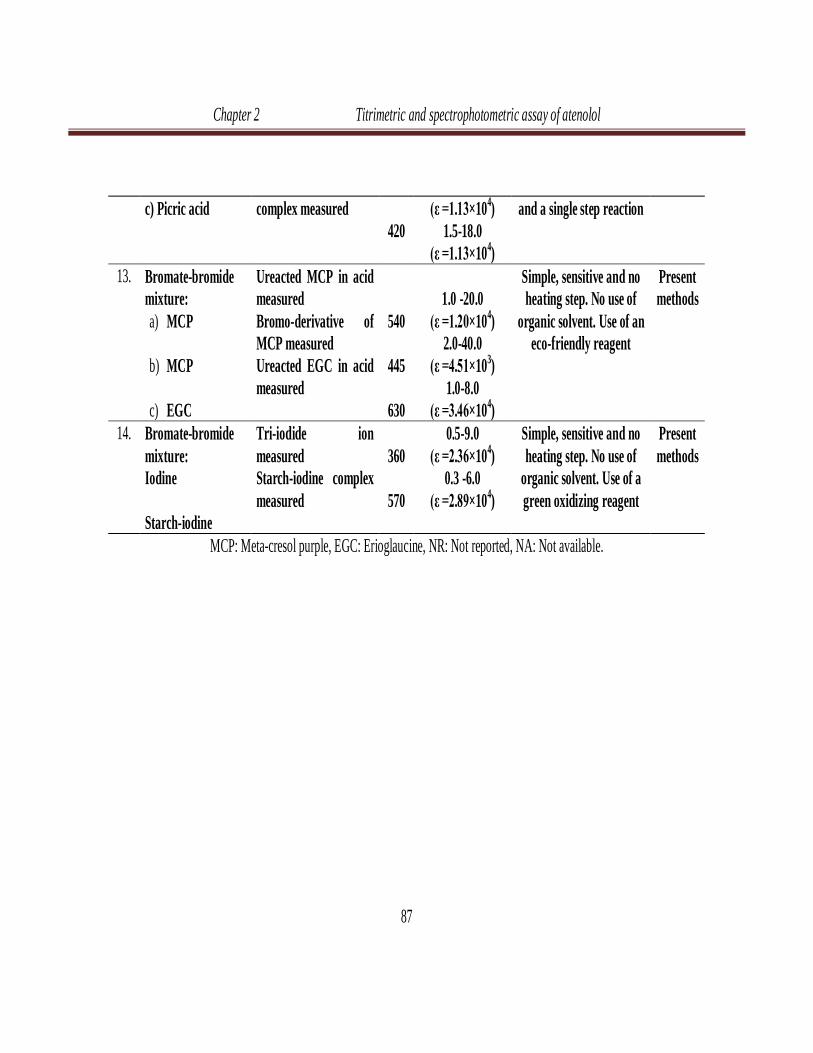
Chapter 2 Titrimetric and spectrophotometric assay of atenolol
87
c) Picric acid complex measured 420
(ε =1.13×10⁴) 1.5-18.0
(ε =1.13×10⁴)
and a single step reaction
13. Bromate-bromide mixture: a) MCP
b) MCP
c) EGC
Ureacted MCP in acid measured Bromo-derivative of MCP measured Ureacted EGC in acid measured
540
445
630
1.0 -20.0
(ε =1.20×10⁴) 2.0-40.0
(ε =4.51×10³) 1.0-8.0
(ε =3.46×10⁴)
Simple, sensitive and no heating step. No use of
organic solvent. Use of an eco-friendly reagent
Present methods
14. Bromate-bromide mixture: Iodine Starch-iodine
Tri-iodide ion measured Starch-iodine complex measured
360
570
0.5-9.0 (ε =2.36×10⁴)
0.3 -6.0 (ε =2.89×10⁴)
Simple, sensitive and no heating step. No use of
organic solvent. Use of a green oxidizing reagent
Present methods
MCP: Meta-cresol purple, EGC: Erioglaucine, NR: Not reported, NA: Not available.
Chapter 2 Titrimetric and spectrophotometric assay of atenolol
88
In the analysis of placebo blank and synthetic mixture the participation of inactive
ingredients in the reaction either with the reagent or chromogenic agent is almost
aught. This was confirmed by comparing the consumption of titrant or absorbance
values obtained in the presence and absence drug in the test solution. This confirms
the factor that the proposed methods are more selective. The accuracy (RE, %) and
precision (RSD, %) of all the methods were evaluated. With RE (%) and RSD (%)
values less than 3.54, methods are considered to be fairly accurate and precise. Upon
comparing the results of the proposed methods with those of the reference method
using Student’s t-test and F-test, all calculated values were found below the tabulated
t- and F- value. The results of the method robustness and ruggedness, both express in
terms of RSD (%), were less than 3.42 % for all the proposed methods. The reaction
scheme proposed for all the methods are tentative since the chromogenic products
were not isolated and characterized. Such inference is based either on reaction
stoichiometry or literature knowledge.
Chapter 2 Titrimetric and spectrophotometric assay of atenolol
89
REFERENCES
1. The Merck Index: An Encyclopedia of Chemicals, Drugs, and Biologicals, 14th
Edn., Merck & Co., Inc., Whitehouse Station, New Jersey, USA, 2006, p. 742.
2. A.M. Barrett, J. Carter, R. Hull, D.J. Le Count, C.J. Squire, US Patent 3,663,607;
May 16, 1972; Assigned to Imperial Chemical Industries Ltd., England.
3. M.R. Alan, D.S. Fred, J.T. Stewart, “Conquering headache”, 4th Edn., Decker
DTC, Hamilton, London, 2003, p. 76.
4. European Pharmacopoeia, Vol. II, European Department for the Quality of
Medicines, Council of Europe, Stranbourg, France, 2005, p. 1032.
5. British Pharmacopoeia, Vol. II, Her Majesty’s Stationary Office, London, 2009.
6. Indian Pharmacopeia, 4th Edn., Ministry of Health and Family Welfare,
Government of India, New Delhi, 1996, p. 74.
7. E. Marmo, Drugs Exptt. Clin. Res., 1980, 6, 639.
8. K. Basavaiah, U. Chandrashekar, P. Nagegowda, Bulg. Chem. Comm., 2003, 35,
174.
9. K. Basavaiah, U. Chandrashekar, P. Nagegowda, Indian J. Chem. Technol., 2004,
11, 769.
10. K. Basavaiah, U. Chandrashekar, P. Nagegowda, J. Serb. Chem. Soc., 2006, 71,
553.
11. K. Basavaiah, U. Chandrashekar, B.C. Somashekar, V. Ramakrishna, Proc. Nat.
Acad. Sci. India., 2005, 75(A), 233.
12. C.V.N. Prasad, C. Parihar, K. Sunil, P. Parimoo, J. Pharm. Biomed. Anal., 1998,
17, 877.
13. C.V.N. Prasad, C. Parihar, T.R. Chowdhary, S. Purohit, P. Parimoo, Pharm.
Pharmacol. Comm., 1998, 4, 325.
14. D. Bonazzi, R. Gotti, V. Andrisano, V. Cavrini, Farmaco, 1996, 51, 733.
15. S. Singh, R. Jain, Indian Drugs, 34, 1997, 678.
16. D. Satyanarayana, K. Kannan, R. Manavalan, Chem. Anal. (Warsaw)., 2006, 51,
771.
17. W. Wehner, Die Pharmazie, 2000, 55, 543.
18. J. Huang, J. Jin, Zhongguo Yiyao Gongye Zazhi, 1989, 20, 19.
19. S. Wang, Yaowu Fenxi Zazhi, 1990, 10, 110.
20. Y.K. Agarwal, K. Raman, S. Rajput, S.K. Menon, Anal. Lett., 1992, 25, 1503.
21. N. Bashir, S.W.H. Shah, M. Bangesh, Riazullah, J. Sci. Ind. Res., 2011, 70, 51.
Chapter 2 Titrimetric and spectrophotometric assay of atenolol
90
22. M.A. Korang, M.H. Abdel-Hay, S.M. Galal, M.A. Elsayed, J. Pharm. Belg., 1984,
40, 178.
23. G.C. Hiremath, R.M. Mulla, S.T. Nandibewoor, Chem. Anal. (Warsaw)., 2005,
50, 449.
24. K. Basavaiah, U. Chandrashekar, P. Nagegowda, Acta Cienc. Indica, Chem.,
2004, XXX C, 075.
25. S.P. Agarwal, V. Singhal, A. Prakash, Indian J Pharm. Sci., 1998, 60, 53.
26. L.L. Yu, J.C. Liu, H.K. Li, Yaowu Fenxi Zazhi, 2010, 30, 538.
27. L. Gung, Yaowu Fenxi Zazhi, 1989, 9, 175.
28. R. Mehvar, J. Chromatogr. Biomed. Appl., 1989, 85, 402.
29. D. Radulovic, L.J. Zivanovic, G. Velimirovic and D. Stevanovic, Anal. Lett.,
1991, 24, 1813.
30. Z. Pawalk and B.J. Clark, J. Pharm. Biomed. Anal., 1992, 10, 329.
31. S.V. Grram and H.P. Tipnis, Indian Drugs, 1993, 30, 195.
32. S.S. Zarapkar, S.S. Kolte and S.H. Rane, Indian Drugs, 1997, 34, 350.
33. A.P. Argekar and S.G. Powar, J. Pharm. Biomed. Anal., 2000, 21, 1137.
34. S.V. Erram and H.P. Tipnis , Indian Drugs, 1992, 29, 436.
35. R. Jain and C.L. Jain, Microchem. J., 1991, 44, 187.
36. H.L. Rau, A.R. Aroor and P.G. Rao, Indian Drugs, 1991, 28, 283.
37. R.T. Sane, V.R. Bhate, V.G. Nayak and K.D. Ladge, Indian Drugs, 1991, 28, 322.
38. M.S. Bhatia, S.G. Karkhedikar and S.G. Chaturvedi, Indian Drugs, 1997, 34, 576.
39. A.P. Argekar and J.G. Sawant, J. Liq. Chromatogr. Rel. Technol., 1999, 22, 1571.
40. S.I. Sasa, I.M. Jalal and H.S. Khalil, J. Liq. Chromatogr., 1988, 11, 1673.
41. A. El-Sindy, S, Emara and A. Mostafa, IL Farmaco, 2005, 60, 269.
42. A. Holbrook, A.M. Krstulovic, J.H. Miller and J. Rysaluk, Pharmeuropa, 1991, 3,
218.
43. S.T. Sasa , J. Liq. Chromatogr., 1988, 11, 929.
44. A.K. Singh, E.R.M. Kedor-Hackmann and M.I.R.M. Santora, J. AOAC Int., 2001,
84, 1724.
45. M.E. Abdel-Hamid, Farmaco, 2000, 55, 136.
46. R. Ghanem, M.A. Bello, M. Callejon and A. Guiraum, J. Pharm. Biomed. Anal.,
1996, 15, 383.
47. H.Y. Aboul-Enein, M.I. El-Awady and C.M. Heard, Pharmazie, 2002, 57, 169.
Chapter 2 Titrimetric and spectrophotometric assay of atenolol
91
48. I. Kaliappan, B.S.M. Pabbisetty and S.N. Karunanidhi, Indian Drugs, 2000, 37,
497.
49. M. Veronico, G. Ragno and C. Vetuschi, Spectrosc. Lett., 1995, 28, 407.
50. G.S. Sadan and A.B. Ghogare, Indian Drugs, 1990, 28, 147.
51. G.R. Rao, A.B. Avadhanutu, R. Siridhar, A.R.R. Pantalu and G.K. Kokate, East
Pharm., 1990, 33, 113.
52. G.S. Sadana, A.B. Ghogare, Indian Drugs, 1990, 28, 142.
53. J.A. Murillo-Pulgarin, A. Alanon Molina and P. Fernandezlopoz, Anal. Chim.
Acta, 1998, 370, 9.
54. M. Gajewska, G. Glass and J. Kostelecki, Acta Pol. Pharm., 1992, 49, 1.
55. H.C. Zhao, N.H. Yan and J.X. Guo, Fenxi Shiyanshi, 1994, 13, 36.
56. M.A. El-Ries, Anal. Lett., 1995, 28, 1629.
57. M.A. Iorio, A. Mazzeo Farina and A. Doldo, J. Pharm. Biomed. Anal., 1987, 5, 1.
58. G. Pyramides, J.W. Robinson and S.W. Zito, J. Pharm. Biomed. Anal., 1995, 13,
103.
59. W.A. Tao, F.C. Gazzo and R.G. Cooks, Anal. Chem., 2001, 73, 1692.
60. F.M. Han and Y. Chen, Fenxi Kexme x-uebao, 1998, 14, 135.
61. A. Saffati and B.J. Clark, J. Pharm. Biomed. Anal., 1996, 14, 1547.
62. A. Saffati and B.J. Clark, Anal. Proc. (London), 1993, 30, 481.
63. B.Y. Sun, A.J. Huang, Y.L. Sun and Z.P. Sun, Chin. Chem. Lett., 1997, 8, 1001.
64. M.C.F. Ferraro, P.M. Castellano and T.S. Kaufmann, J. Pharm. Sci., 1981, 18, 60.
65. D. Cairns. “Essentials of pharmaceutical chemistry”, 3rd Edn., Pharmaceutical
Press, Cornwall, UK, 2008.
66. D.G. Watson. “Pharmaceutical analysis: a textbook for pharmacy students and
pharmaceutical chemists”, 2nd Edn., Elsevier/Churchill Livingstone, UK, 2005.
67. K.G. Bothara. “A hand book of inorganic pharmaceutical chemistry”, 9th Edn.,
Pragati Books Pvt. Ltd., 2008.
68. R.N.J. Kucharsky, L. Safarik, “Titrations in non-aqueous solvents”, Elsevier
publishing company, Netherlands. 1965.
69. “International Conference on Harmonization of Technical Requirements for
Registration of Pharmaceuticals for Human Use”, ICH Harmonisation Tripartite
Guideline. Validation of Analytical Procedures: Text and Methodology Q2 (R 1),
Complementary Guideline on Methodology dated 06 November 1996,
incorporated in November 2005, London.
Chapter 2 Titrimetric and spectrophotometric assay of atenolol
92
70. R.S. Mulliken and W.B. Pearson, “Molecular Complexes”, Wiley Interscience,
NewYork, 1969.
71. R.Foster, “Molecular Complexes” Vol II , Elok Science, London, 1974, 251.
72. S. Patil (Edn.), “The Chemistry of Quinonoid Compounds”, Part-I, John-Wiley
and Sons, London, 1974.
73. R.H. Thomson, “Naturally Occurring Quinones”, Academic Press, London,
1971.
74. J. Yarwood (Edn.), “Spectorscopy and Structure of Molecular Complexes”,
Plenum., Press, London, 1973.
75. R.S. Mulliken, J. Am. Chem. Soc., 1950, 72, 600.
76. R. Foster. Charge transfer complexes, Academic Press, London, 1969.
77. P. Shahdousti, M. Aghamohammadi, N. Alizadeh, Spectrochim. Acta Part A.,
2008, 69, 1195.
78. J.O. Onah, J. E. Odeiani. J. Pharm. Biomed. Anal., 2002, 29, 639.
79. M. Fouery, J. Pharm. Chim., 1934, 20, 116.
80. J.W. Carett and J.P. Heotis, J. Assoc. Off. Agri. Chem., 1955, 41, 323.
81. H.F. Beckmann and L. Feldman, J. Agri. Food. Chem., 1960, 8, 227.
82. M.F. Loucks and L. Nauer Jr., J. Assoc. Off. Anal. Chem., 1967, 50, 268.
83. A. Raza. J. Anal. Chem., 2008, 63, 244.
84. K. Basavaiah. IL Farmaco, 2004, 59, 315.
85. G.A. Saleh, H.F. Askal, M.F. Radwan, M.A. Omar, Talanta, 2001, 54, 1205.
86. G.A. Saleh, H.F. Askal. J. Pharm. Biomed. Anal., 1991, 9, 219.
87. C.S. Xuan, Z.Y. Wang, J.L. Song. Anal. Lett., 1998, 31, 1185.
88. A.A. El Kheir, S.F. Belal, M.M. Ayad, S.M. El Adl, Anal. Lett., 1986, 19, 1019.
89. M.A. Elsayed, M. Barary, M. Abdel-salam, S. Mohamed, Anal. Lett., 1989, 22,
1665.
90. A.M. Wahbi, M.M. Bedair, S.M. Galal, A.A. Gazy, J. Pharm. Biomed. Anal.,
1993, 11, 639.
91. F.M. Abdel-Gawad, J. Pharm. Biomed. Anal., 1997, 15, 1679.
92. K. Basavaiah, V.S. Charan, Turk. J. Chem., 2002, 26, 653.
93. H.F. Askal, Talanta, 1997, 44, 1749.
94. A.A. Mostafa, L.I. Bebawy, H.H. Refaat, J. Pharm. Biomed. Anal., 2002, 27, 889.
95. A.M. Al-brashy, Anal. Lett., 1993, 26, 2595.
96. K. Basavaiah, V.S. Charan, Indian J. Pharm. Sci., 2003, 65, 660.
Chapter 2 Titrimetric and spectrophotometric assay of atenolol
93
97. K. Basavaiah, V.S. Charan, Sci. Asia., 2002, 28, 359.
98. A.F.M. El-Walily, M.A. Korany, A. El-Gindy, M.F. Bedair, J. Pharm. Biomed.
Anal., 1998, 17, 435.
99. K. Basavaiah, K. Tharpa, K.B. Vinay, Croat. Chem. Acta., 2010, 83, 415.
100. K. Basavaiah, U.R. Anil kumar. E-J.Chem., 2007, 4, 173.
101. K. Basavaiah, K. Tharpa, N. Rajendraprasad, S.G. Hiriyanna, K.B. Vinay, Indian
J. Chem. Technol., 2009, 16, 265.
102. C.S.P. Sastry, T.V. Rekha, A. Satyanarayana, Mikrochim. Acta., 1998, 128, 201.
103. A. Raza, A.S. Ijaz, Atta-ur-Rehmana, U. Rasheed, J. Chin. Chem. Soc., 2007, 54,
223.
104. A.S. Amin, I.S. Ahmed, Mikrochim. Acta., 2001, 137, 35.
105. F.M. Abdel-Gawad, Y.M. Issa, H.M. Fahmy, H.M. Hussein, Mikrochim. Acta
1998, 130, 35.
106. G.G. Mohamed, S.M. Khalil, M.A. Zayed, M.A. El-Shall, J. Pharm. Biomed.
Anal., 2002, 28, 1127.
107. N.A. El Ragehy, M.F. El Tarras, F.I. Khattab, A.K.S. Ahmad, Spectrosc. Lett.,
1991, 24, 81.
108. A.E. El-Gendy, Spectrosc. Lett., 1992, 25, 1297.
109. C.S.P. Sastry, J. Murali, P.Y. Nalidu, Indian Drugs, 1998, 35, 364.
110. M. Walash, M. Sharaf-El Din, M.E.S. Metwalli, M. RedaShabana, Arch. Pharm.
Res., 2004, 27, 720.
111. F.M. Abou-Attia. IL Farmaco, 2000, 55, 659.
112. G.A. Saleh, Talanta, 1998, 46, 111.
113. H.E. Abdellatef, J. Pharm. Biomed. Anal., 1998, 17, 1267.
114. A.A. Gouda, Talanta, 2009, 80, 151.
115. G.B. Okide, U.E. Odoh, Indian J. Pharm. Sci., 1998, 60, 368.
116. M.U. Adikwu, K.C. Ofokansi, A.A. Attama, Chem. Pharm. Bull., 1999, 47, 463.
117. E. Khaled, Talanta, 2008, 75, 1167.
118. Z.A. El-Sherif, A.O. Mohamed, M.I. Walash, F.M. Tarras, J. Pharm. Biomed.
Anal., 2000, 22, 13.
119. M.U. Adikwu, K.C. Ofokansi, J. Pharm. Biomed. Anal., 1997, 16, 529.
120. B.V. Kamath, K. Shivram, S. Vangani, Anal. Lett., 1992, 25, 2239.
121. B.V. Kamath, K. Shivram, G.P. Oza, S. Vangani, Anal. Lett., 1993, 26, 665.
122. B.V. Kamath, K. Shivram, S. Vangani, Anal. Lett., 1994, 27, 103.
Chapter 2 Titrimetric and spectrophotometric assay of atenolol
94
123. K. Basavaiah, S.A.M. Abdulrahman, Thai J. Pharm. Sci., 2010, 34, 134.
124. M. Hasani, M. Irandoust, M. Shamsipur, Spectrochim. Acta A., 2006, 63, 377.
125. F.A. El-Yazbi, A.A. Gazy, H. Mahgoub, M.A. El-Sayed, R.M. Youssef, J. Pharm.
Biomed. Anal., 2003, 31, 1027.
126. M.H. Abdel-Hay, S.M. Sabry, M.H. Barary, T.S. Belal, Anal. Lett., 2004, 37,247.
127. N. Rajendraprasad, K. Basavaiah, K.B. Vinay, J. Serb. Chem. Soc., 2011, 76,
1551.
128. A.M.A. Sameer, K. Basavaiah, Int. J. Anal. Chem. 2011,
doi:10.1155/2011/619310, Vol. 2011, Article ID 619310, 9 pages.
129. M.S. Raghu, K. Basavaiah, Journal of the Association of Arab Universities for
Basic and Applied Sciences, 2012, 12, 33.
130. M.E. Abdel-Hamid, M. Abdel-Salam, M.S. Mahrous, M.M. Abdel-Khalek,
Talanta, 1985, 32, 1002.
131. G. Saito, Y. Matsunaga, Bull. Chem. Soc. Jpn., 1971, 44, 3328.
132. W. Kemp, Organic Spectroscopy, 3rd edn., Replika press, India, 2006, p. 274.
133. http://www.lenntech.com/periodic/elements/br.htm
134. P. Anastas, J.C. Warner, “Green Chemistry: Theory and Practice”, Oxford
University Press, New York, 1998, p. 30.
135. Balard, Ann. Chim. et. Phys., 1826, 32, 337.
136. W.F. Koppeschaar, Z. Anal. Chem., 1876, 15, 233.
137. Kratschmer , Z. Anal. Chem., 1885, 24, 546.
138. M.R.F. Ashworth, “Titrimetric OrganicAnalysis”, Part I, Interscience Publishers,
London, pp. 118.
139. I.M. Kolthoff and R. Belcher, “Volumetric Analysis”, Vol. III, Interscience
Publishers, Inc, New York, 1957, pp. 529.
140. T. Higuchi and E. Brochmann-Hausen (edn.), “Pharmaceutical Analysis”, CBS
Publishers and Distributors, New Delhi (Indian edition, 1997).
141. K. Basavaiah, U. Chandrashekar, P. Nagegowda. J. Serb. Chem. Soc., 2006, 71,
553.
142. K. Basavaiah. Ind. J. Chem. Technol., 2006, 13, 360.
143. K. Basavaiah, B. C. Somashekar. J. Sci. Ind. Res., 2006, 65, 349.
144. U.R. Anilkumar, K. Basavaiah. Bulgarian Chem. Commun., 2007, 39, 53.
145. P. Nagegowda, K. Basavaiah. J. Braz. Chem. Soc., 2005, 16, 821.
Chapter 2 Titrimetric and spectrophotometric assay of atenolol
95
146. K. Basavaiah, U. Chandrashekar, P. Nagegowda. J. Serb. Chem. Soc., 2005, 70,
969.
147. K. Basavaiah, V. Ramakrishna, B. C. Somashekar, U. R. Anilkumar. An. Acad.
Bras. Cienc., 2008,80, 253.
148. V. Ramakrishna, K. Basavaiah. Ind. J. Chem. Technol., 2005, 12,543.
149. K. Basavaiah, U. Chandrashekar, P. Nagegowda. Ind. J. Chem. Technol., 2005,
12, 149.
150. K. Tharpa, K. Basavaiah. J. Anal. Chem., 2009,64, 1193.
151. K. Basavaiah, K. Tharpa. Chem. Ind. Chem. Eng. Q., 2008, 14, 205.
152. B.G. Chaudhari, H.R. Parmar. Int. J. Pharm. Qual. Assur., 2010, 2, 9.
153. K.V.V. Satyanarayana, P.N. Rao. E-J. Chem., 2011, 8, 269.
154. K. Basavaiah, U.R. Anilkumar, K. Tharpa. Chem. Ind. Chem. Eng. Q., 2008,
14,185.
155. B. Narayana, K. Veena. J. Mex. Chem. Soc, 2010, 54, 98.
156. K. Basavaiah, V. Ramakrishna, U.R. Anilkumar, B.C. Somashekar. Ecl. Quím.,
2007, 32, 57
157. A.M. El-Didamony. Drug Test. Anal., 2010, 2,122.
158. K. Basavaiah, U. Chandrashekar, H.C. Prameela, P. Nagegowda, Acta Cienc.
Indica, Chem., 2003, XXIX, 25.
159. A.M. El-Didamony, E.A.H. Erfan. Spectrochim. Acta Part A., 2010, 75, 1138.
160. C.S.P. Sastry, S.G. Rao, J.S.V.L.M. Rao and P.Y. Naidu, Anal. Lett., 1997, 30,
2377.
161. A.S. Amin and G.H. Ragab, Anal, Sci., 2003, 19, 247.
162. C.S.N. Sharma, C. Kamala Sastry and C.S.P. Sastry, Acta Cieneia Indica Chem.,
2002, 28, 221.
163. C.S.P. Sastry and J.S.V.L.M. Rao, East. Pharm., 1996, 39, 117.
164. C.S.P. Sastry, V.A.N. Sarma, U.V. Prasad and C.S.R. Lakshmi, Indian J. Pharm,
Sci, 1997, 59, 161.
165. K. Basavaiah, U.R. Anilkumar, J. Mex. Chem. Soc., 2007, 51, 106.
166. K. Basavaiah, K. Tharpa, J. Mex. Chem. Soc., 2008, 52, 193.
167. J.H. Miyawa, S.G. Schulman In: L. Ohannesian, A. J. Streeter, Editors,
“Handbook of pharmaceuticals analysis”, Marcel Dekker, Inc., New York, 2002
(Chapter 5).
Chapter 2 Titrimetric and spectrophotometric assay of atenolol
96
168. K. Basavaiah, N. Rajendraprasad, P.J. Ramesh, K.B. Vinay. Thai J. Pharm. Sci.
2010, 34, 146.
169. K. Basavaiah, N. Rajendraprasad, M.X. Cijo, K.B. Vinay, P.J. Ramesh. J. Sci. Ind.
Res. 2011, 70, 346.
170. G.C. Gomes, H.R.N. Salgado. Acta Farm. Bonaerense, 2005, 24, 406.
171. R.N. Saha, C. Sajeev, P.R. Jadhav, S.P. Patil, N. Srinivasan. J. Pharm. Biomed.
Anal., 2002, 28,741.
172. C. Sajeev, P.R. Jadhav, D. RaviShankar, R.N. Saha. Anal. Chem. Acta., 2002, 463,
207.
173. M.S. Arayne, N. Sultana, F. Hussain, S.A. Ali. J. Anal. Chem., 2007, 62, 536.
174. M.I. Walash, A. El-Brashy, N. El-Enany, M.E. Kamel. Pharm. Chem. J., 2009,
43, 697.
175. E.M.A. Orsine, J.L.S. Martins. Anal. Lett., 1993, 26,1933.
176. E.R.M. Hackmann, E.A.S. Gianotto, M.I.R.M. Santoro. Anal. Lett., 1993, 26,259.
177. E.R.M. Hackmann, M.M.F. Nery, M.I.R.M. Santoro. Anal. Lett., 1994, 27,363.
178. O.Z. Devi, K. Basavaiah, P.J. Ramesh, K.B. Vinay, Farmacia, 2011, 59, 647.
179. B.R. Matthews, Drug Dev. Ind. Pharm. 1999, 25, 831.
180. ICH-Q1A (R2), Stability testing of new drug substances and products,
International Conference on Harmonisation, Geneva, February, 2003.
181. D.A. Skoog, D.M. West, “Principles of Instrumental Analysis”, Sounders College
Publications, USA.1980.
182. B.G. Nagavi, “Laboratory Handbook of Instrumental Drug Analysis Advanced
Pharmaceutical Analysis”, Vallabh Prakashan, India, 2009.
183. Thomas, “Ultraviolet and visible spectroscopy”, John willey and sons ltd. U.K.,
2nd ed., 1996, 131.
184. D. Harvey, “Modern Analytical Chemistry”- 1st Edn. James M. Smith Publishers,
2000.