Embed Size (px)
Citation preview
CHAPTER 2
''Soil is the stomach of the plant".
- Aristotle
Can we hit at the stomach of the ~lant without hiitinsr at our own stomach?
THE EXPERIMENTAL SOILS
THEIR TYPES AND DISTRIBUTION IN CHHATTISGARH REGION
CHARACTERIZATION,STUDIES OF
MINERAL CONSTITUENTS
l1ICRO-NUTRIENTS AND MICRO-POLLUTAf/TS
HUI11C ACID
BACTERIAL POPULATION
18
2.1 THE SOILS OF CHHATTISGARH REGION
INTRODUCTION
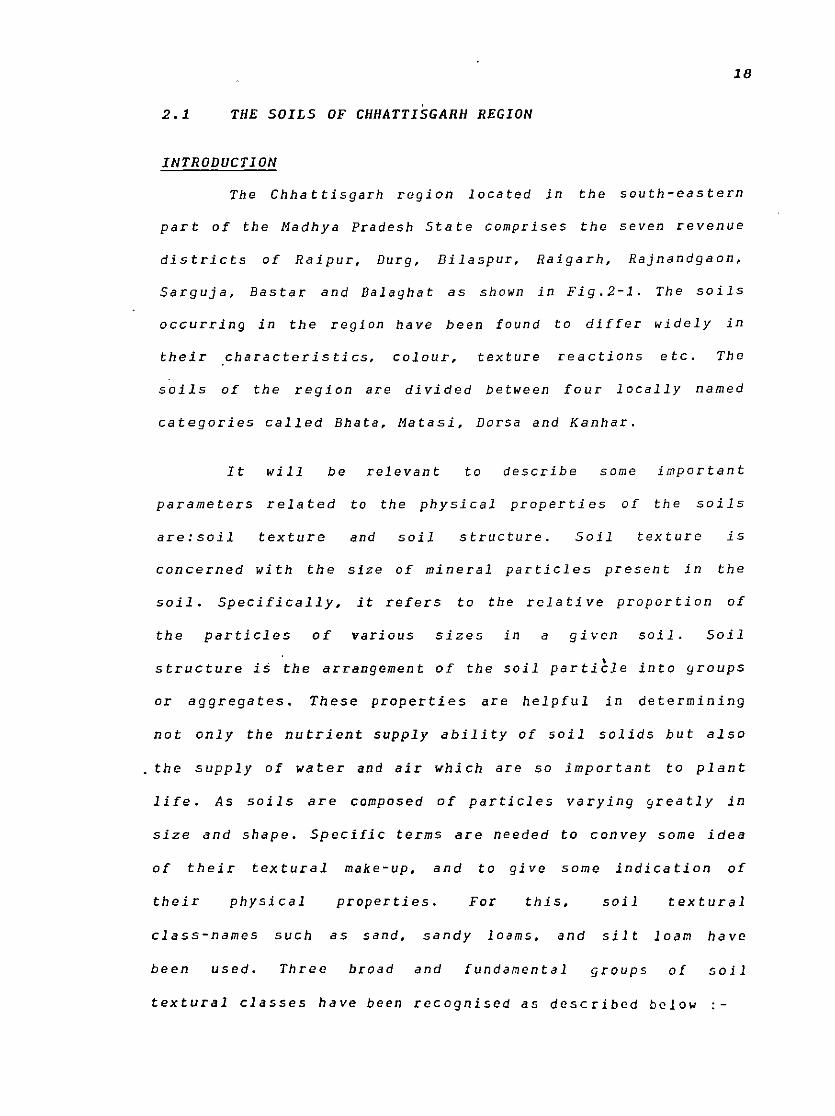
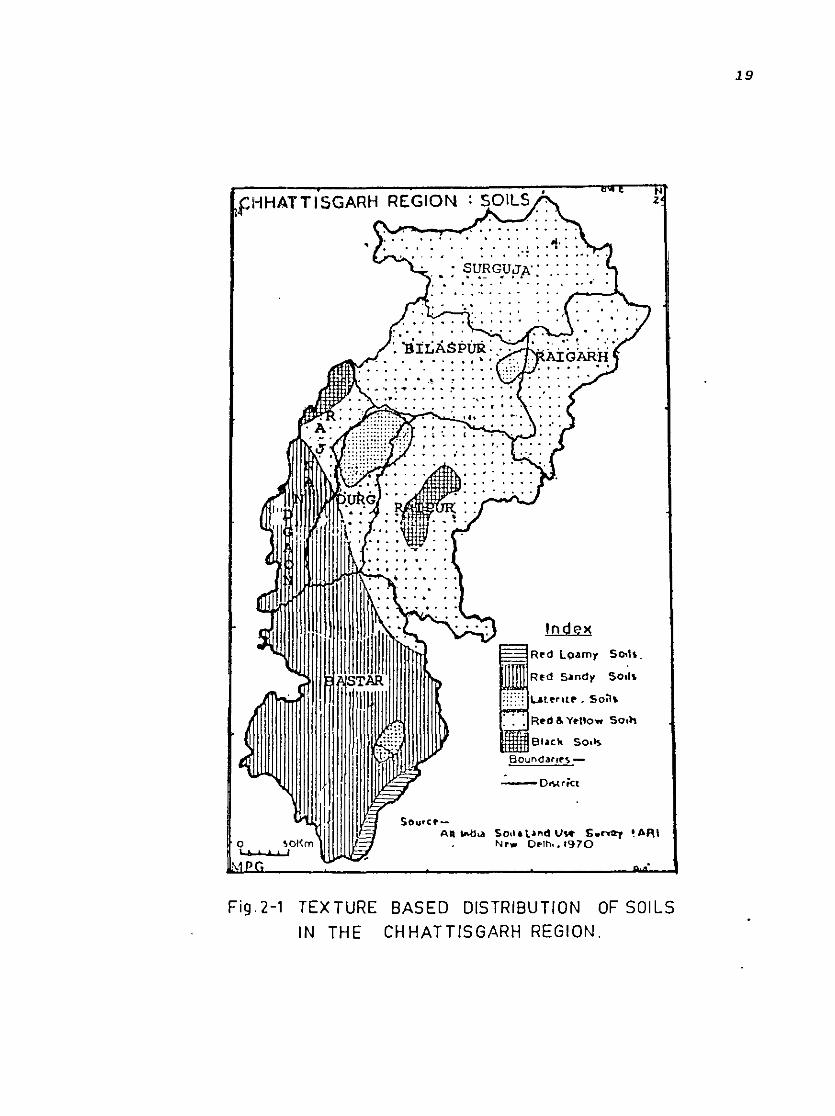
The Chhattisgarh region located in the south-eastern
part of the Madhya Pradesh State comprises the seven revenue
districts of Raipur, Durg, Bilaspur, Raigarh, Rajnandgaon,
Sarguja, Bastar and Balaghat as shown in Fig.2-1. The soils
occurring in the region have been found to differ widely in
their characteristics, colour, texture reactions etc. The
soils of the region are divided between four locally named
categories called Bhata, Matasi, Dorsa and Kanhar.
It wi 11 be relevant to describe some important
parameters related to the physical properties of the soils
are:soil texture and soil structure. Soil texture is
concerned with the size of mineral particles present in the
soil. Specifically, it refers to the relative proportion of
the particles of various sizes in a given soil. Soil
structure is the arrangement of the soil particle into groups
or aggregates. These properties are helpful in determining
not only the nutrient supply ability of soil solids but also
. the supply of water and air which are so important to plant
life. As soils are composed of particles varying greatly in
size and shape. Specific terms are needed to convey some idea
of their textural make-up, and to give some indication of
their physical properties. For this. soil textural
class-names such as sand, sandy loams, and silt loam have
been used. Three broad and fundamental groups of soil
textural classes have been recognised as described below
HHATTISGARH REGION
0 'JOI{m I • t 6 t I
Sou,cf'-
Index
So.h
d S•ndy So~•
Ail Mtil<l Sotlt ll"d \Jw $.~ ~ t.RI Nrw Dt>Jh,. 1970
Fig. 2-1 TEXTURE BASED DISTRIBUTION OF SOl LS
IN THE CHHATTISGARH REGION.
19
20
Sands : The sand group includes all soils whose sand contents
make up 70% or more of the material by weight. The properties
of such soils are, therefore, characteristically sandy in
contrast witb the stickier nature of the heaviour groups of
the soil.
Clays A soil to be designated a clay must carry at least
35% of the clay-separate, and in most cases not less than
40%. In such soils, the characteristics of the clay-separate
are distinctly dominant, and the class name is sandy clay,
silty clay, or, the most common of all, simply clay.
Loams An ideal loam may be defined as a mixture of sand,
silt and clay particles which exhibits light and heavy
properties in about equal proportions. Roughly it is half
and-half mixture on the basis of properties. Most soils of
agricultural importance are some type of loam. In most cases,
however, the quantities of sand, silt or clay present require
a modified textural class name. Thus, a loam in which sand is
dominant is classified as sandy loam. In the same way there
may occur silt loams, silty clay loams and clay loams (1).
One of the most significant indirect effects of soil
texture is through its control of the structure. Roots
require space for growth, and this space is provided by the
pores and fissures in the soils. Plant roots extend into the
soil in search of both water and nutrients. Since most roots
are of the order of 1-5 mm in diameter, and the pores in the
soil are rarely more than 1.0 mm in size, roots can only grow
21
by forcing their way into the soil. A critical factor,
therefore, is the ability of the soil to give way in the face
of limited pressure which can be exerted by the tips of the
growing roots. This in turn depends upon the consistence and
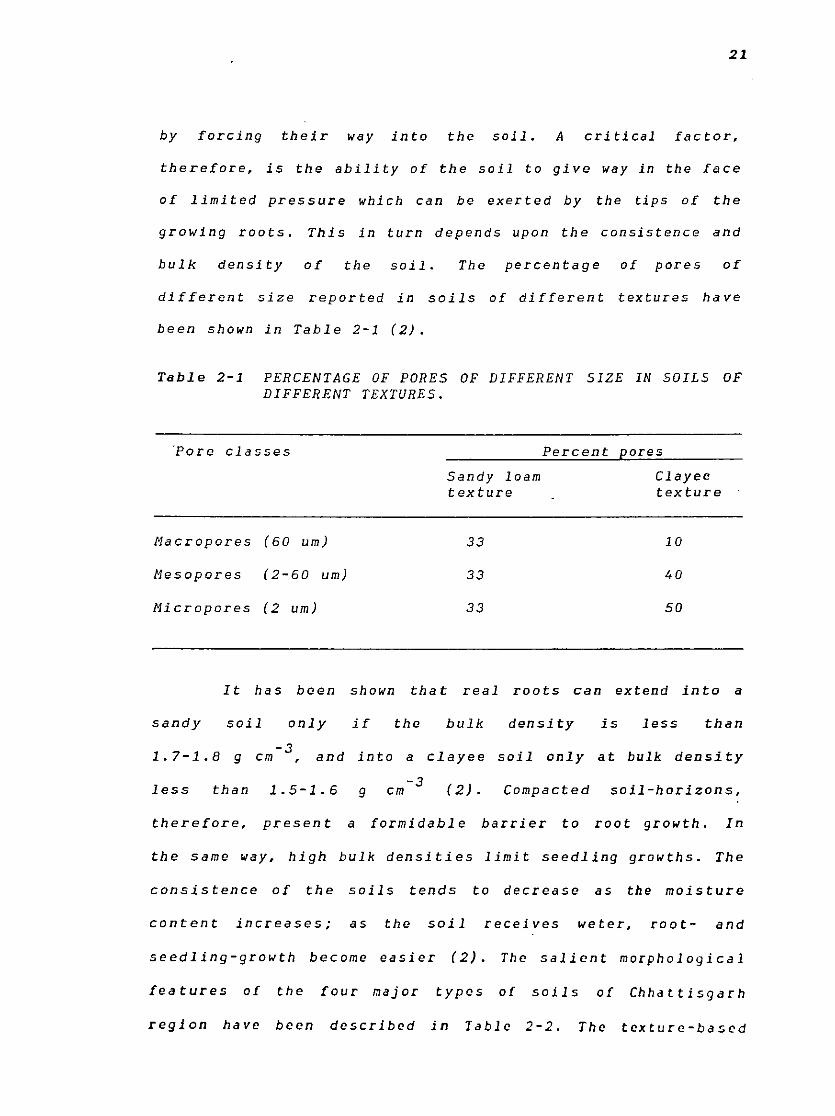
bulk density of the soil. The percentage of pores of
different size reported in soils of different textures have
been shown in Table 2-1 (2).
Table 2-1 PERCENTAGE OF PORES OF DIFFERENT SIZE IN SOILS OF DIFFERENT TEXTURES.
"Pore classes
Macropores (60 um)
Mesopores (2-60 um)
Micropores (2 um)
Sandy loam texture
33
33
33
Percent pores
Clayee texture
10
40
50
lt has been shown that real roots can extend into a
sandy soil only if the bulk density is less than
1.7-1.8 g -3 em and into a clayee soil only at bulk density
less than 1.5-1.6 g -3
em ( 2) . Compacted soil-horizons,
therefore, present a formidable barrier to root growth. In
the same way, high bulk densities limit seedling growths. The
consistence of the soils tends to decrease as the moisture
content increases; as the soil receives weter, root- and
seedling-growth become easier (2). The salient morphological
features of the four major types of soils of Chhattisgarh
region have been described in Table 2-2. The texture-based
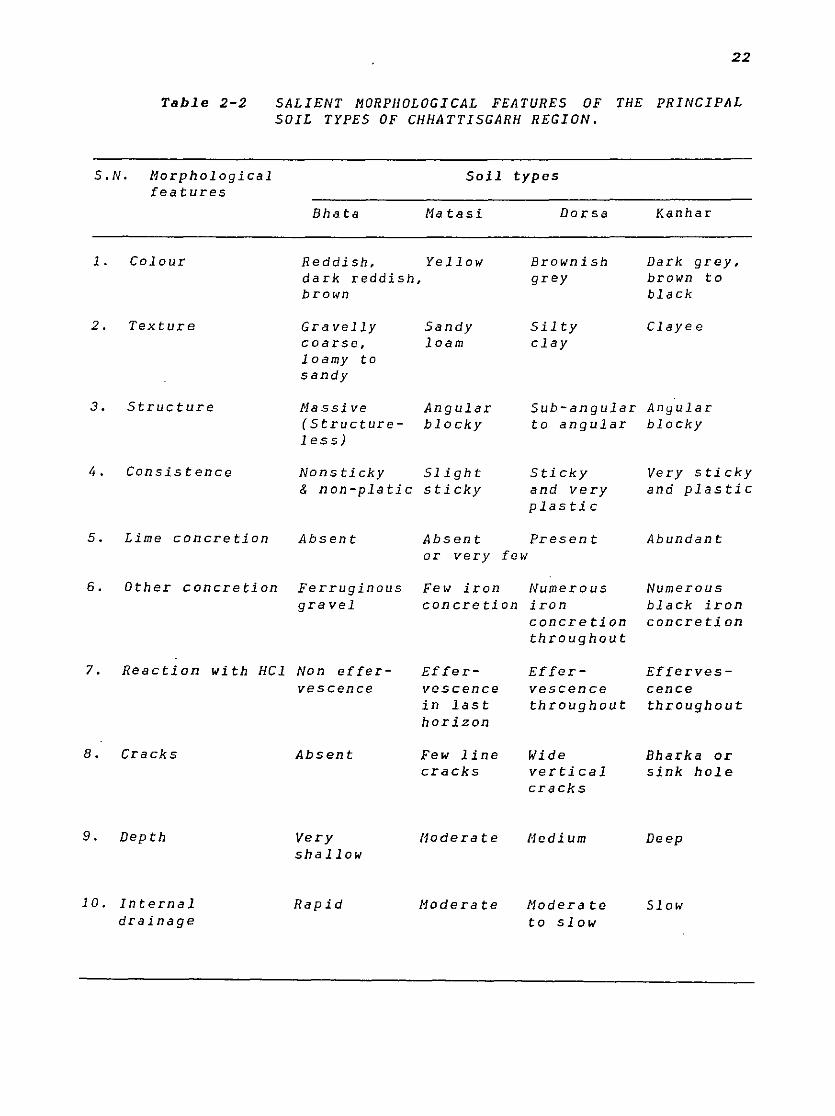
Table 2-2
S.N. Morphological features
Colour
2. Texture
3. Structure
4. Consistence
22
SALIENT MORPHOLOGICAL FEATURES OF THE PRINCIPAL SOIL TYPES OF CHHATT I SGARH REGION.
Soil types
Bhata
Reddish, dark reddish, brown
Gravelly coarse, loamy to sandy
Massive (Structureless)
Matasi
Yellow
Sandy loam
Angular blocky
Nonsticky Slight & non-platic sticky
Dorsa
Brownish grey
Silty clay
Kanhar
Dark grey, brown to black
Clayee
Sub-angular Angular to angular blocky
Sticky and very plastic
Very sticky and plastic
5. Lime concretion Absent Absent Present Abundant
6. Other concretion Ferruginous gravel
7. Reaction with HCl Non effervescence
8. Cracks
9. Depth
10. Internal drainage
Absent
Very shallow
Rapid
or very few
Few iron Numerous concretion iron
Numerous black iron
Effervescence in last horizon
Few line cracks
11oderate
Moderate
concretion concretion throughout
Effervescence throughout
Wide vertical cracks
11edium
Moderate to slow
Effervescence throughout
Bharka or sink hole
Deep
Slow
23
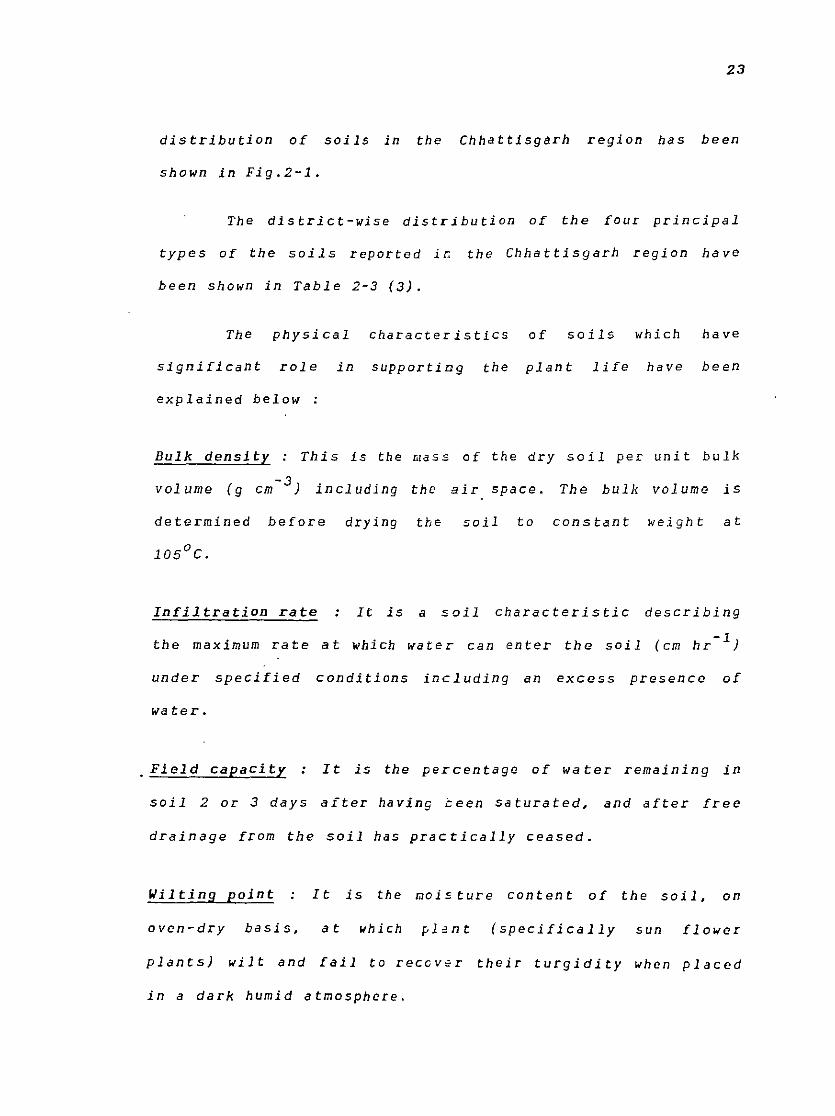
distribution of soils in the Chhattisgarh region has been
shown in Fig.2-1.
The district-wise distribution of the four principal
types of the soils reported ir:; the Chhattisgarh region have
been shown in Table 2-3 (3).
The physical characteristics of soils which have
significant role in supporting the plant life have been
explained below :
Bulk density : This is the mass of the dry soil per unit bulk
-3 volume (g em ) including the air space. The bulk volume is
determined before drying the soil to constant weight at
Infiltration rate : It is a soil characteristic describing
the maximum rate at which water can enter the soil (em hr- 1 )
under specified conditions including an excess presence of
water •
. Field capacity : It is the percentage of water remaining in
soil 2 or 3 days after having teen saturated, and after free
drainage from the soil has practically ceased.
Wilting point It is the r.Joisture content of the soil, on
oven-dry basis, at which plant (specifically sun flower
plants) wilt and fail to recov:r their turgidity when placed
in a dark humid atmosphere.
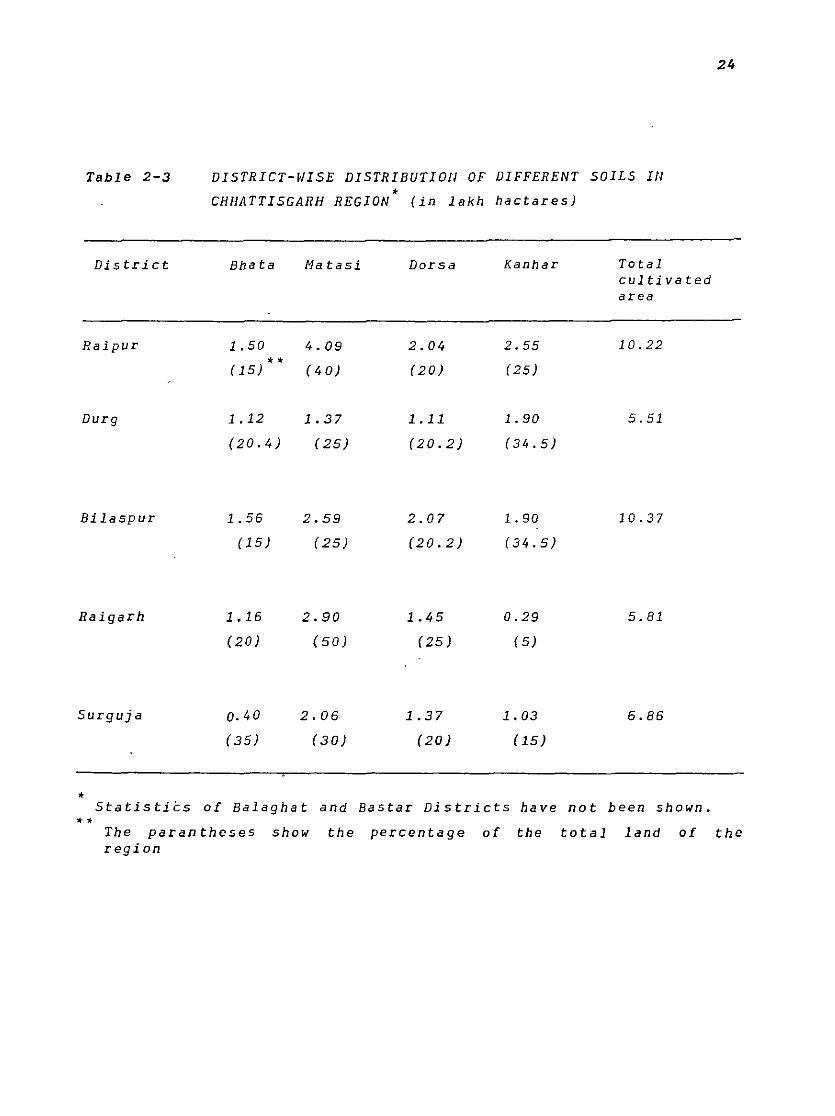
Table 2-3
District
Raipur
Durg
Bilaspur
Raigarh
Surguja
•
DISTRICT-WISE DISTRIBUTIOfl OF DIFFERENT SOILS Ill • CHHATTISGARH REGION (in lakh hactares)
Bhata
1.50 •• (15)
1.12
(20.4)
1. 56
(15)
1.16
(20)
a. 40
(35)
Matasi
4.09
I 40)
1. 37
(25)
2.59
(25)
2.90
(50)
2.06
( 30)
Dorsa
2.04
I 20)
1.11
(20.2)
2. 07
(20. 2)
1.45
(25)
1.37
(20)
Kanhar
2.55
(25)
1. 90
(34.5)
1. 90
(34.5)
0.29
(5)
1.03
(15)
Total cultivated area
10.22
5.51
10.37
5.81
6.86
Statistics of Balaghat and Bastar Districts have not been shown . ••
24
The parantheses show the percentage of the total land of the region
Available water : It is the portion of water in soil that can
be readily absorbed by plant roots. This is defined by most
workers as that water held in the soil against a pressure
upto 15 bars (1).
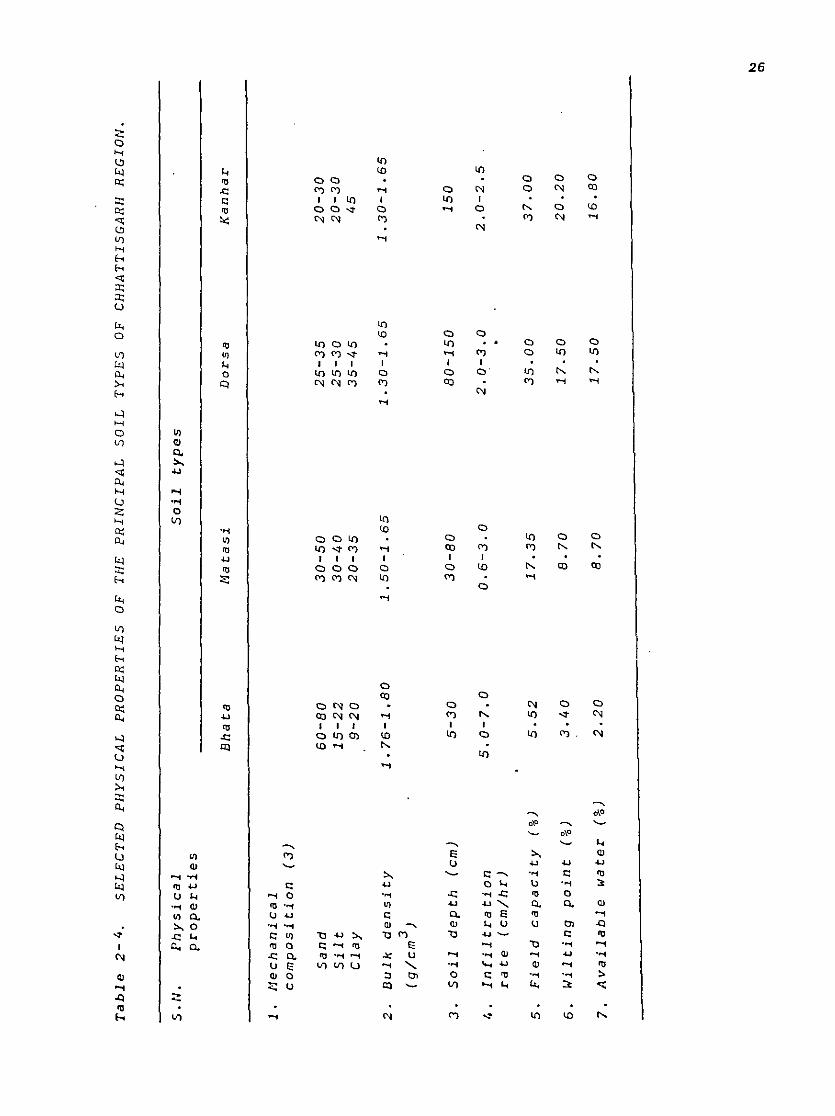
The physical characteristics reported (1) to be
assigned to the four types of the soil have been shown in
Table 2-4.
2.2 SOILS OF TRE CHHATTISGARH REGION:THEIR TESTING AND CHARACTERIZATION
INTRODUCTION
The soil testing gives a measure of the availability
of the nutrients to the crops. It is multi-purpose in nature.
Among other things, it aims at : (i) Grouping the soils into
classes relative to the level of nutrients. (ii} Predictir;g
the probability of getting profitable r.esponses in terms of
the crop yield. (iii) Helping to evaluate soil properties,
and (iv) Determining the specific soil conditions like
alkalinity, salinity and acidity which limit corp yield (4).
The significanc~ of the physico-chemical ch-aracter is tics
experimentally determined here has been described below :-
Ta
ble
2
-4.
SE
LE
CT
ED
P
HY
SIC
AL
P
RO
PE
RT
IES
O
F TH
E
PR
INC
IPA
L
SO
IL
TY
PE
S
OF
CH
HA
TT
ISG
AR
H
RE
GIO
N.
S.
N.
Ph
ysic
al
So
il
typ
es
pro
perti
es
---~
Bh
ata
M
ata
si
Do
rsa
K
an
ha
r
1.
Nech
an
ica
l co
mp
osit
ion
(3
)
Sa
nd
6
0-8
0
30
-50
2
5-3
5
20
-30
S
ilt
15
-22
3
0-4
0
25
-30
2
0-3
0
Cla
y
9-2
0
20
-35
3
5-4
5
45
2.
Bu
lk
den
sit
y
1.7
6-1
,80
1
. 5
0-1
.65
1
.30
-1.6
5
1.3
0-1
.65
(g/c
m3
)
3.
So
il
dep
th
(em
) S
-30
3
0-8
0
80
-15
0
15
0
4.
In
filt
ra
tio
n
5.0
-7
.0
0.6
-3.0
2
.0-3
.0
2.0
-2.5
ra
te
(cm
/hr)
5.
Fie
ld
ca
pa
cit
y
(%}
5.5
2
17
.35
3
5.0
0
37
.00
6.
Wil
tin
g
po
int
(%)
3.
4 0
8.7
0
17
.50
2
0.2
0
7.
Ava
ila
ble
w
ate
r
(%}
2.2
0
8.7
0
17
.50
1
6.8
0
1\)
"'
27
The supply of the plant nutrients, and thus the
fertility of the soil is significantly affected by pH. The
solubility of most nutrients varies in response to pH. Most
of the nutrients become more soluble as pH falls, and thus
they are released more rapidly in acid conditions. As acidity
increas'es, however, the losses of the nutrient by leaching
increases also, and thus their availability to plants may
actually be decreased. In other cases, the quanti ties of some
nutrients may rise to such large extents under acid
conditions that they become toxic to plant. In addition, we
may note that soil acidity also affects the activity of soil
organisms-a factor which indirectly influences soil
fertility. For these reasons, one of the main aims of soil
management is to control the pH, and maintain a slight
acidity in the otherwise neutral soils (2).
Electrical conductivity The measurement of electrical
conductivity is used as means of apprising soil salinity. The
electrical conductance, expressed in mS -1
em increases with
soluble salt contents, and thus •lllows simple interpretation
of the readings ( 5). Saline soils include those soils
containing salts in quantities sufficient to interfere with
the growth of most crop plants, but not containing enough
exchangeable sodium to alter the soil characteristics
is appreciably. Technically, a saline soil ·defined as a soil
having a conductivity of the saturation extract greater than
4.0 mS
15 (5).
-1 em and an exchangeable sodium percentage loss than
Organic carbon
organic matter.
28
Carbon is a common constituent of all
Consequently, its movements during the
microbial digestion of plant tissues are extremely
significant. Much of the energy acquired by the fauna and
flora within the soil comes from the oxidation of carbon. As
a result; its oxide is evolved continuously in large amounts.
The various changes this element undergoes within or without
the soils are collectively described in what is known as the
·carbon cycle. The soil is the main source of C02
gas,
although small amount of it are excreted by plant roots, and
are brought down in rain water. Under optimum conditions, as
much as 45.5 Kg of carbon dioxide per acre per day may be
evolved. The carbon dioxide from the soil ultimately escapes
to a large degree into the atmosphere where it may again be
used by plants thus completing the cycle. The degradation of
the organic matter also results in the formation of other
carbon products. Elemental carbon is found· in soils to a
certain extent, and its presence in soils is considered
significant. Under certain conditions, methane and carbondi
sulphide may be produced in small amounts in soils. But, of
all the simple produ.cts, carbondioxide is by far the most
abundant ( 1).
Available nutrients : The plant growth depends upon the
supply of a range of plant nutrients, many of which are
derived from the soils. Numerous factors inf 1 uence the
availability of plant nutrients. In the case of those
nutrients, such as nitrogen supplied by biological process of
fixation and mineralization, the biological properties of the
29
soils are particularly important. In the case of minerals,
such as phosphorus and potassium, a more crucial factor is
the rate of ions released from their source minerals. A pool
of readily available nutrients occurs in the soil solutions,
and these are supplied to the plants directly. When these are
drawn out from the· •SOil solutions, more nutrients are
released from the reserves held by adsorption on the
colloidal particles. Thus, most nutrients occur in three
forms: (i) available nutrients which are dissolved in the
soil water, (ii) exchangeable nutrients which are held on the
surface of colloidal particles (iii) labile nutrients which
are held within the soil minerals, and released
weathering. The rate of release of nutrients from
by
the
exchangeable reserve into the soil solution is sufficiently
rapid to meet the needs of the plants. The rate of
replenishment of the exchangeable reserves by minerals from
the labile pool is slow,however. Consequently, over time ·the
exchangeable reserves tend to be depleted,
became exhausted (2).
and the soil
Cation Exchange Capacity : The plants need C, H, 0, P, K, N,
5, Ca, Fe, Mg, Mn, Cu, B, Zn, Co, Mo, Cl, Na, and probably
several other elements which are yet to be confirmed. A small
but an important fraction of the total of the elements
present in soil minerals occurs as readily exchanyeable or
adsorbed ions. These forms of the elements are of vi tal
importance to the nutrition of the plants on
different soils. The mineralogical composition of soils thus
30
has an important bearing on soil productivity. The rate of
release of ions slows down as the soil minerals become highly
weathered, often becoming too slow to support intensive crop
production. The electric charge on the soil particles is
neutralised by an equivalent amount of oppositely charged
ions, the so called exchangeable ions held to the surface by
mainly Coulomb forces.
The most common exchangeable cations of soils are
+ + + + 2+ 2+ 2+ Ca ' Mg ' K ' H ' Na • and NH . Ca generally is the
4
dominant ion. In very acid soils, Al(OH)+ 2
may constitute a
considerable part of the counter ions,. the proportion
increasing with falling pH. In alkali soils, the content of
+ Na is exceptionally high. Common anions are
2-HOP4 , HC03 and anions of humic acids.
Cl ,
Though some of
these anions do not always function as exchangeable ions, but
are nearly always present in the soil solutions. The
capacities of soils to adsorb and exchange cations and anions
vary greatly with the content of clay, organic matter and the
mineralogical composition. The Cation Exchange Capacity (CEC)
is defined as the amount of cation species bound at pH 7.0 or
another sui table pH, depending on the method used for its
measurement. It varies slightly with the bonding strength of
the ions, and increases with the content of clay and organic
matter. The CEC of mineral soils may range form a few to
50-60 meq/100 g, whereas the CEC of organic soils may exceed
200 meq/100 g (5).
31
Silica : Free silica occurs in the soil mainly in the form of
quartz (Si02
), consisting of a continuous frame-work of
silica tetrahedra. Free silica also occurs in some soils. It
also occurs in some soils as cristobalite. Substituted
cristobalite occurs with varying substitutes (NaAL, SiJ02 , in
which the Na is exchangeable. In certain soils, cristobalite
may take up nearly 50% of the clay, the other half being
quartz (6). Exchange capacity of the clay arises almost
entirely through the substitution in cristobalite. Free
silica particles provide the frame-work of soil structure,
and influence the soil formation. Quartz occurs in the
majority of the soils, and makes up from 50 to 90% of the
sand coarser silts of many soils.
Iron oxide The most common· iron oxides in the soils are
hematite (Fe2o
3) which gives pink to bri9ht red colour to the
soils, and goethite (Fe2o
3.H
20J which gives brown and dark
reddish colour to the soils. Iron oxides provide an extremely
important reflection of the chemical properties of the soil
and the genetic processes that have governed the soil"
formation ( 7-9). In poorly drained organic soils, the
occurrence of FeOOH, an isomer of goethite, has been reported
(8). It gives a brown orange colour to the soils. Iron
oxides of the soils are usually the products of weathering of
iron-bearing minerals. Hematite may also be inherited from the
parent rocks.
32
Aluminium oxides The crystalline mineral. gibbsite Al (OH) 3
(or Al2o
3.3H
20), is the most abundant hydrous oxide of
aluminium in soils occurring primarily in soils of tropical
and sub-tropical region which have undergone intensive
leaching of silica. Clay formation is enhanced by Al2
o3
-
content of the parent material of non-resistant minerals.
High porosity which enhances the water holding capacity was
found to enhance clay formation (5).
The physico-chemical characteristics of the four soil
types (Ebata, Matasi, Dorsa, and Kanhar) have been determined
and described below.
MATERIALS AND METHODS
Soil Sampling from Farm-Fields Three farm-fields (2 to 4
hactares each) were identified in each of Chandkhuri,
Lakholi, Arang and Kurud villages in the Raipur Tehsil and
District of the Chhattisgarh region of Madhya Pradesh. These
villages are known for the occurrence of Bhata, Matasi,
Dorsa, and Kanhar types of soils respectively·. Thin slices of
soils were taken out with the help of a spade from the plow
layer of each field at intervals of 20 steps, and a total of
30 samples were collected from each field. The samples
collected from each village were composited and brought to
the laboratory for chemical analysis (10). The collected
samples were first air-dried. The bulk samples were then
passed through a sieve (6 mm). partitioned, and quantities
(about 1 Kg each) were retained. The samples were then
further subjected to the processes of grinding.
33
sieving (4mm and 2mm) and partitioning, and representative
samples of about 100 g in each case were obtained. The
samples were then heated in oven at 110°C for 3 hours, and
used for analysis.
Procedure The determinations were carried out as described
below :
I!.!!.: A soil-water suspension (1:5 by wt.) was prepared, and
the pH was directly recorded using a pH meter (Systronic
Model 324) ( 11).
Electrical conductivity : The electrical conductivity of the
soil suspension ( 1:5 by wt.) prepared in conductivity water
was measured using a conductivity meter (Century Model
CK- 71 0) ( 11) .
Organic carbon : Weighed quantities (1 g each) of the samples
were transferred to Erlenmeyer flasks after pretreatment with
sulphurous acid to decompose the carbonates present. 10 ml of
chromic acid solution (34% Cro3
in H20- H
3Po
4 medium) was
added, followed by the additionof 50 ml of 112_504
- H3
Po4
(1:1
mixture). The mixture was
··free air through
bailed for 5 minutes using a flow
the reaction mixture. The evolved
co2
was absorbed in 25 ml of 0.5 N NaOH solution placed in a
conical flask. 15 ml of 0.1 M BaC12
solution was then added
to precipitate the carbonates. The excess Na0/1 was back
titrated with standard 0.5 IJ I!Cl using phenolphthlein
solution as an indicator. Fromthe weight of co2
forncd, the
amount of total organic carbon was calculated (10).
34
Total nitrogen Weighed quantities (5.0 g each) of the
finely powdered form of the samples were placed in Kjeldahl
digestion flasks. 20 g of sodium sulphate and a pinch of
cuso4
.SH2
0 were then added. This was then followed by an
addition of 35 ml of conc.H2so
4• The mixture was digested tor
30 minutes in low flame, and then for another one hour at
full flame. The flask was then cooled, and 300 ml of ammonia
free water was added cautiously, and the mixture was further
cooled. The contents were transferred to a distillation
flask, and ammonia was distilled after the addition of NaOH
solution (40%) into the distillation flask. The evolved
ammonia was absorbed in 25 ml of boric acid solution (4%)
placed in a 500 ml conical flask with 4 drops of bromocresol
green methyl red indicator solution. The boric acid was then
back-titrated with standard hydrochloric acid solution (0.788 N)
( 10).
Total phosphorus : Weighed quantities (2 g each) of the
finely powdered samples were transferred to a 300 ml conical
flask. The sample was heated on a hat plate with 20 ml of
cone. HN03
for the oxidation of the organic matter. Then 30
ml of HC104
solution (60%) was added and the mixture digested
in a fume cupboared for 40 minutes. After cooling, 50 ml of
distilled water was added, and the mixture was filtered into
a 200 ml volumetric flask. An aliquot of this solution was
used for the analysis by the phasphavanadamalybda tc me thad.
Far this purpose, the solutions were prepared by the
dissolution of 25 g of ammonium molybdate in 400 ml of water,
35
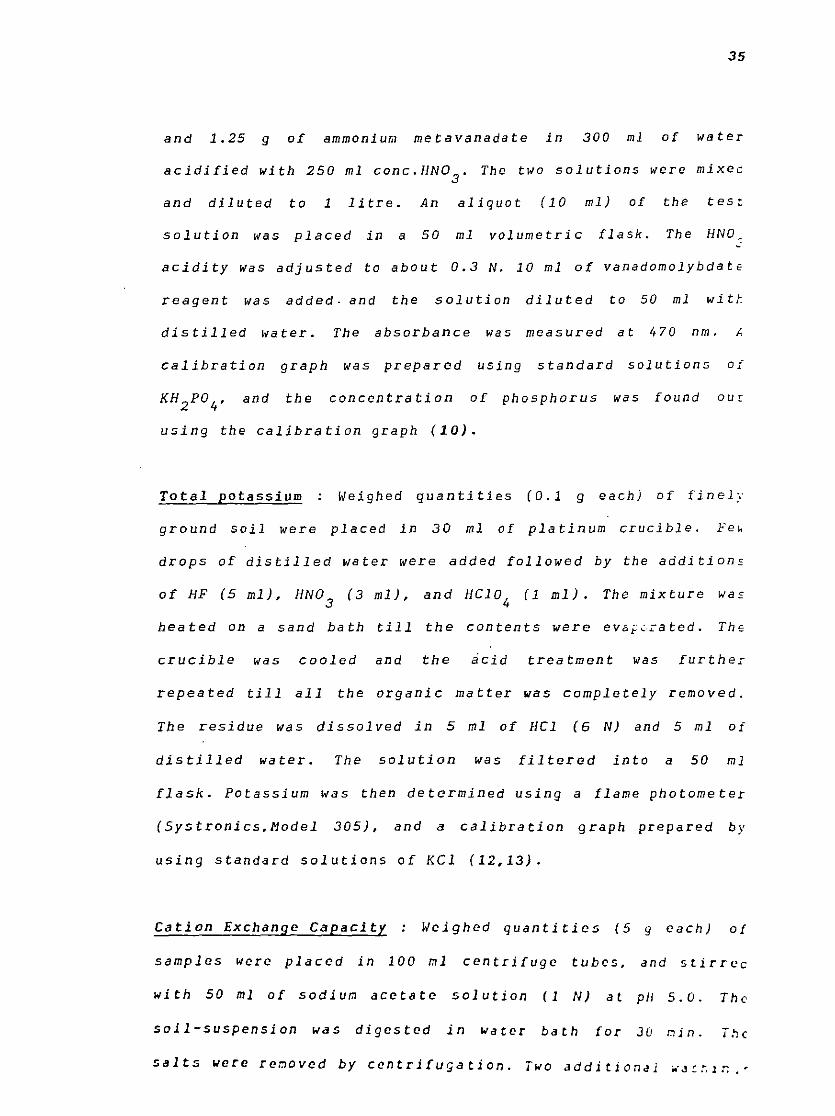
and 1.25 g of ammoniur.J metavanadate in 300 ml of water
acidified with 250 ml conc.HN03
. The two solutions were mixec
and diluted to 1 litre. An aliquot (10 ml) of the test
solution was placed in a 50 ml volumetric flask. The HNO,
acidity was adjusted to about 0.3 N. 10 ml of vanadomolybdate
reagent was added. and the solution diluted to 50 ml wi ti:
distilled water. The absorbance was measured at 470 nm. ,;
calibration graph was prepared using standard solutions of
KH2
Po4
, and the concentration of phosphorus was found out
using the calibration graph (10).
Total potassium Weighed quantities (0.1 g each) of finely
ground soil were placed in 30 ml of platinum crucible. Fe•
drops of distilled water were added followed by the addition,
of HF (5 ml). HN03
(3 ml), and HClo4
(1 ml). The mixture wao
heated on a sand bath till the contents were eva;;c:ated. The
crucible was cooled and the acid treatment was further
repeated till all the organic matter was completely removed.
The residue was dissolved in 5 ml of HCl (6 N) and 5 ml of
distilled water. The solution was filtered into a 50 ml
flask. Potassium was then determined using a flame photometer
(Systronics,l1odel 305), and a calibration graph prepared by
using standard solutions of KCl (12,13).
Cation Exchange Capacity Weighed quanti ties ( 5 g each) of
samples were placed in 100 ml centrifuge tubes, and stirrec
with 50 ml of sodium acetate solution ( 1 N) at p/1 5.0. Th~
soil-suspension was digested in water bath for 30 nin. T.~c
salts were renoved by centrifugation. Two additional ... J :: :-. l r. ....
36
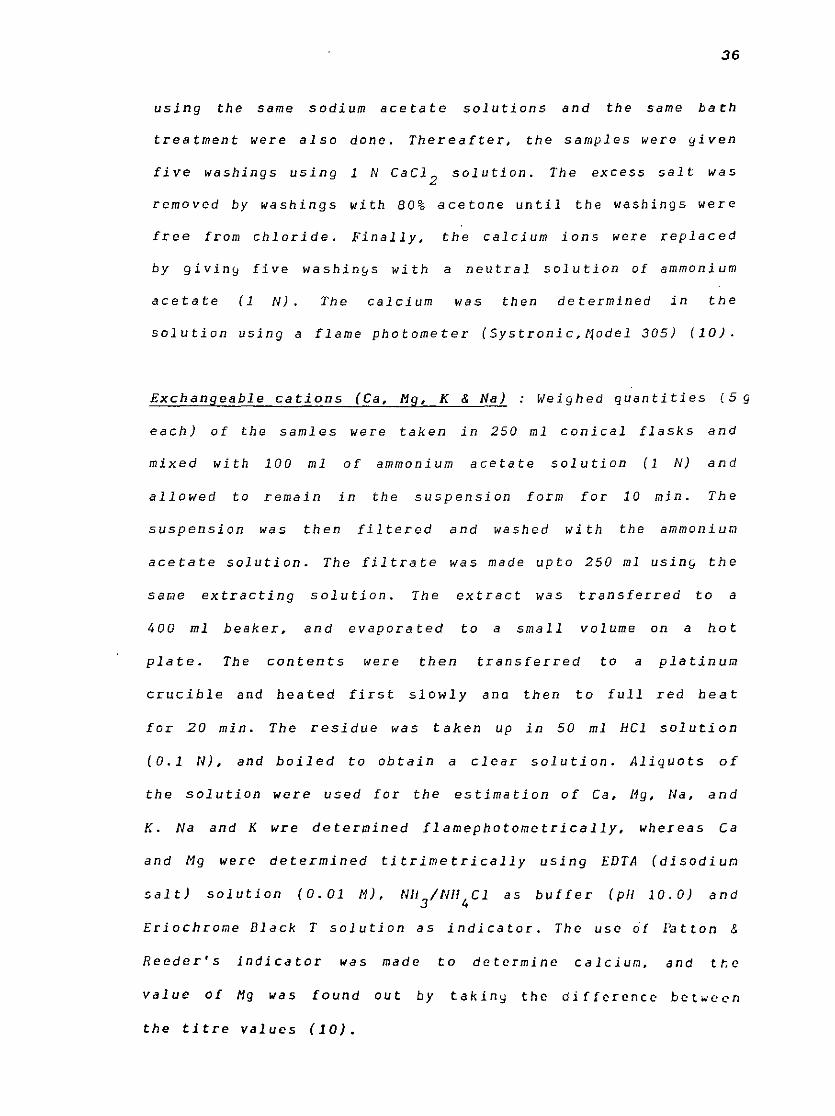
using the same sodium acetate solutions and the same bath
treatment were also done. Thereafter, the samples were given
five washings using 1 N cac12
solution. The excess salt was
removed by washings with 80% acetone until the washings were
free from chloride. Finally, the calcium ions were replaced
by givin<; five washin~s with a neutral solution of ammonium
acetate (1 N). The calcium was then determined in the
solution using a flame photometer (Systronic,nodel 305) (10).
Exchangeable cations (Ca, Hg, K & Na) : Weighed quantities (59
each) of the samles were taken in 250 ml conical flasks and
mixed with 100 ml of ammonium acetate solution (1 N) and
allowed to remain in the suspension form for 10 min. The
suspension was then filtered and washed with the ammoniur.>
acetate solution. The filtrate was made upto 250 ml usin9 the
saLJe extracting solution. The extract was transferred to a
400 ml beaker, and evaporated to a small volume on a hot
plate. The contents were then transferred to a platinur.>
crucible and heated first slowly ana then to full red beat
for 20 min. The residue was taken up in 50 ml HCl solution
(0.1 N), and boiled to obtain a clear solution. Aliquots of
the solution were used for the estimation of Ca, !1g, Na, and
K. Na and K wre determined flamephotometrically, whereas Ca
and Mg were determined titrimetrically using EDTA (disodiur.J
salt) solution (0.01 11), NH3
/NH4
Cl as buffer (pli 10.0) and
Eriochrome Black T solution as indicator. The use of Patton &
Reeder's indicator was made to determine calcium, and tt.e
value of Mg was found out by takiny the di ffcrence between
the titre values (10).
37
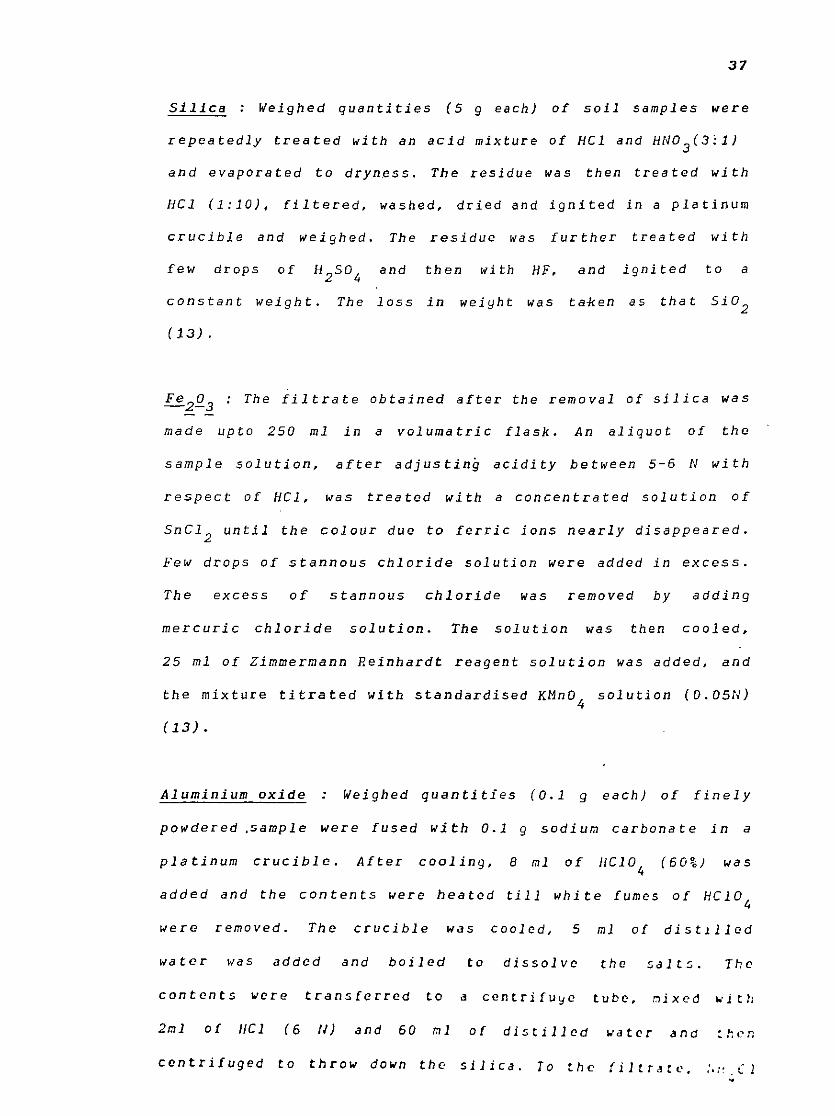
Silica Weig/led quantities (5 g each) of soil samples were
repeatedly treated with an acid mixture of HCl and HN03
(3l1J
and evaporated to dryn.ess. The residue was then treated with
HCl (1:10), filtered, washed, dried and ignited in a platinum
crucible and weighed. The residue was further treated with
few drops of H 2
50 4
and then with HF, and ignited to a
constant weight. The loss in weiyht was ta-ken as that 5i02
(13).
Fe2
Q3
: The filtrate obtained after the removal of silica
made upto 250 ml in a volumatric flask. An aliquot of
was
the
sample solution, after adjusting acidity between 5-6 N with
respect of HCl, was treated with a concentrated solution of
SnC12
until the colour due to ferric ions nearly disappeared.
Few drops of stannous chloride solution were added in excess.
The excess of stannous chloride was removed by adding
mercuric chloride solution. The solution was then cooled,
25 ml of Zimmermann Reinhardt reagent solution was added, and
the mixture titrated with standardised KMn04
solution (0.05N)
(13).
Aluminium oxide : Weighed quantities (0.1 g each) of finely
powdered ,sample were fused with 0.1 g sodium carbonate in a
platinum crucible. After cooling, 8 ml of HC104
(60%) was
added and the contents were heated till white fumes of HC104
were removed. The crucible was cooled, 5 ml of dist1lled
water was added and boiled to dissolve the salts. The
contents were transferred to a centri fuye tube, r:>ixecl .,.i th
2ml of 1/Cl (6 II) and 60 ml of distilled water and :t:cn
centrifuged to throw down the silica. To the filtnte. ;,,, c 1
38
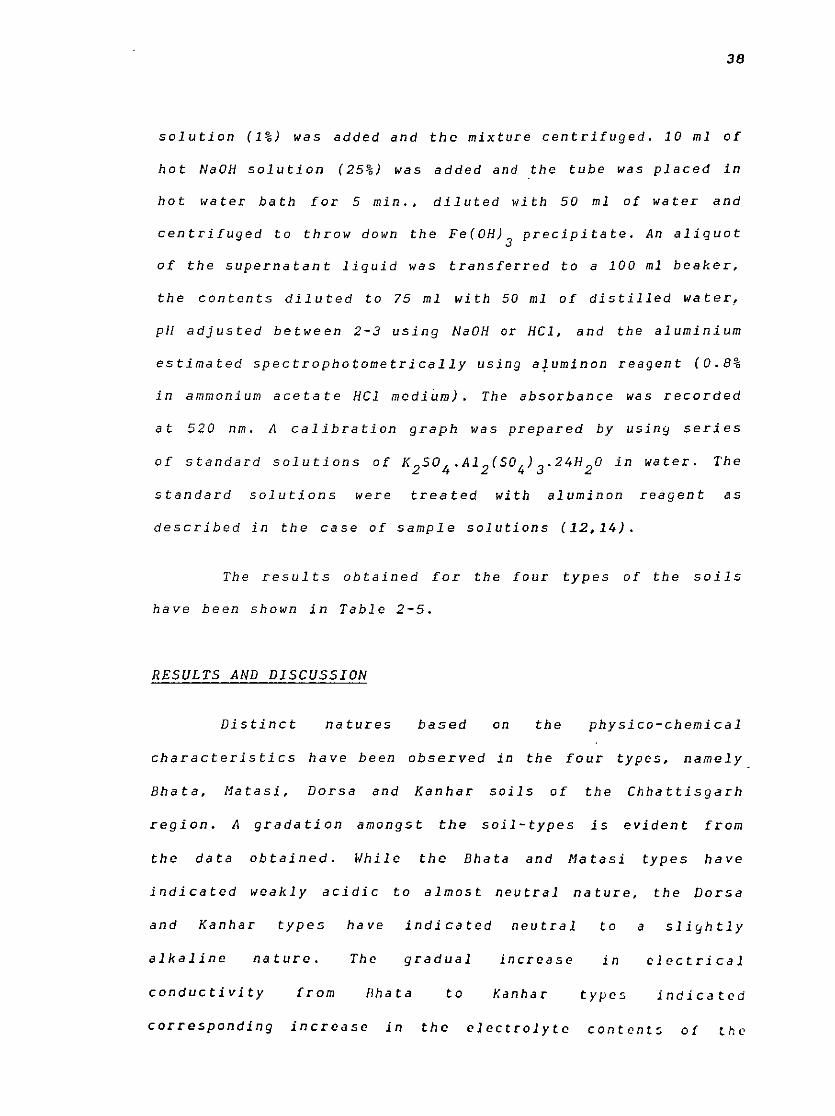
solution (1%) was added and the mixture centrifuged. 10 ml of
hot NaOH solution (25%) was added and the tube was placed in
hot water bath for 5 min., diluted with 50 ml of water and
centrifuged to throw down the Fe(OH)3
precipitate. An aliquot
of the supernatant liquid was transferred to a 100 ml beaker,
the contents diluted to 75 ml with 50 ml of distilled water,
pH adjusted between 2-3 using NaOH or HCl, and the aluminium
estimated spectrophotometrically using a+uminon reagent (0.8%
in amiJonium acetate HCl medium). The absorbance was recorded
at 520 nm. A calibration graph was prepared by usiny series
of standard solutions of K2so
4.Al
2(so
4)
3.24H
2o in water. The
standard solutions were treated with aluminon reagent as
described in the case of sample solutions (12,14).
The results obtained for the four types of the soils
have been shown in Table 2-5.
RESULTS AND DISCUSSION
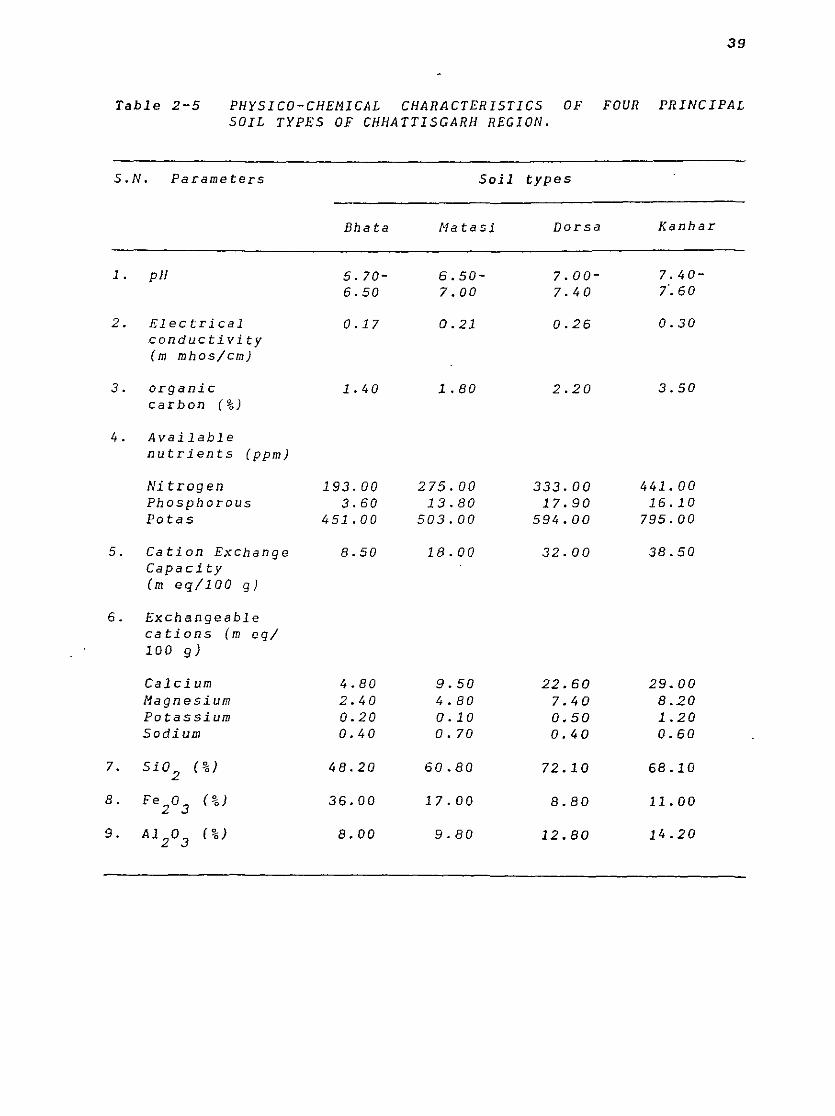
Distinct natures based on the physico-chemical
characteristics have been observed in the four types, namely
Bhata, 11atasi, Dorsa and Kanhar soils of the Chhattisgarh
region. A gradation amongst the soil-types is evident froiJ
the data obtained. While the Bhata and 11atasi types have
indicated weakly acidic to almost neutral nature, the Dorsa
and Kanhar types
alkaline nature.
conductivity from
have indicated neutral
The gradual increase
Dhata to Kanhar
to a sliyhtly
in
types
electrical
indicated
corresponding increase in the electrolyte contents of the
39
Table 2-5 PHYSICO-CHEMICAL CHARACTERISTICS OF FOUR PRINCIPAL SOIL TYPES OF CHHATTISGARH REGION.
S.N. Parameters Soil types
Ebata Matasi Dorsa Kanhar
1. pH 5.70- 6.50- 7.00- 7. 40-6.50 7.00 7. 4 0 7". 60
2. Electrical 0.17 0.21 0.26 0.30 conductivity (m mhos/em]
3. organic 1. 40 1. 80 2.20 3.50 carbon ( %)
4. Available nutrients (ppm}
Nitrogen 193.00 275.00 333.00 441. 00 Phosphorous 3.60 13.80 17.90 16.10 Pot as 451.00 503.00 594.00 795.00
5. Cation Exchange 8.50 18.00 32.00 38.50 Capacity (m eq/100 g)
6. Exchangeable cations (m eq/ 100 g)
Calcium 4.80 9.50 22.60 29.00 Magnesium 2.40 4.80 7. 40 8.20 Potassium 0.20 0.10 0.50 1.20 Sodium 0. 4 0 0. 70 0.40 0.60
7. Si02
(%) 48.20 60.80 72. 10 68.10
8. Fe2o
3 (%) 36.00 17.00 8.80 11.00
9. Al2o
3 (%) 8.00 9.80 12.80 14.20
40
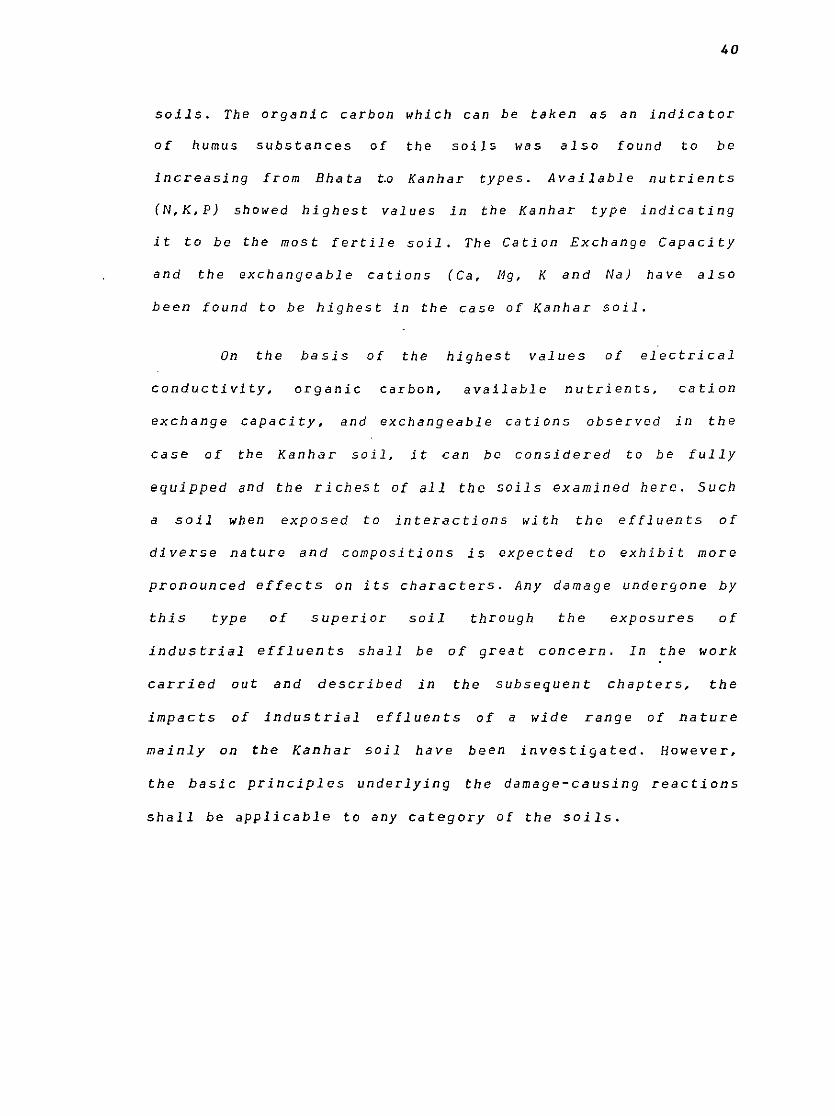
soils. The organic carbon which can be taken as an indicator
of humus substances of the soils was also found to be
increasing from Bhata t.o Kanhar types. Available nutrients
(N,K,P) showed highest values in the Kanhar type indicating
it to be the most fertile soil. The Cation Exchange Capacity
and the exchangeable cations (Ca, Mg, K and Na) have also
been found to be highest in the case of Kanhar soil.
On the basis of the highest values of electrical
conductivity, organic carbon, available nutrients, cation
exchange capacity, and exchangeable cations observed in the
case of the Kanhar soil, it can be considered to be fully
equipped and the richest of all the soils examined here. Such
a soil when exposed to interactions with the effluents of
diverse nature and compositions is expected to exhibit more
pronounced effects on its characters. Any damage undergone by
this type of superior soi 1 through the exposures of
industrial effluents shall be of great concern. In the work
carried out and described in the subsequent chapters, the
impacts of industrial effluents of a wide range of nature
mainly on the Kanhar soil have been investigated. However,
the basic principles underlying the damage-causing reactions
shall be applicable to any category of the soils.
41
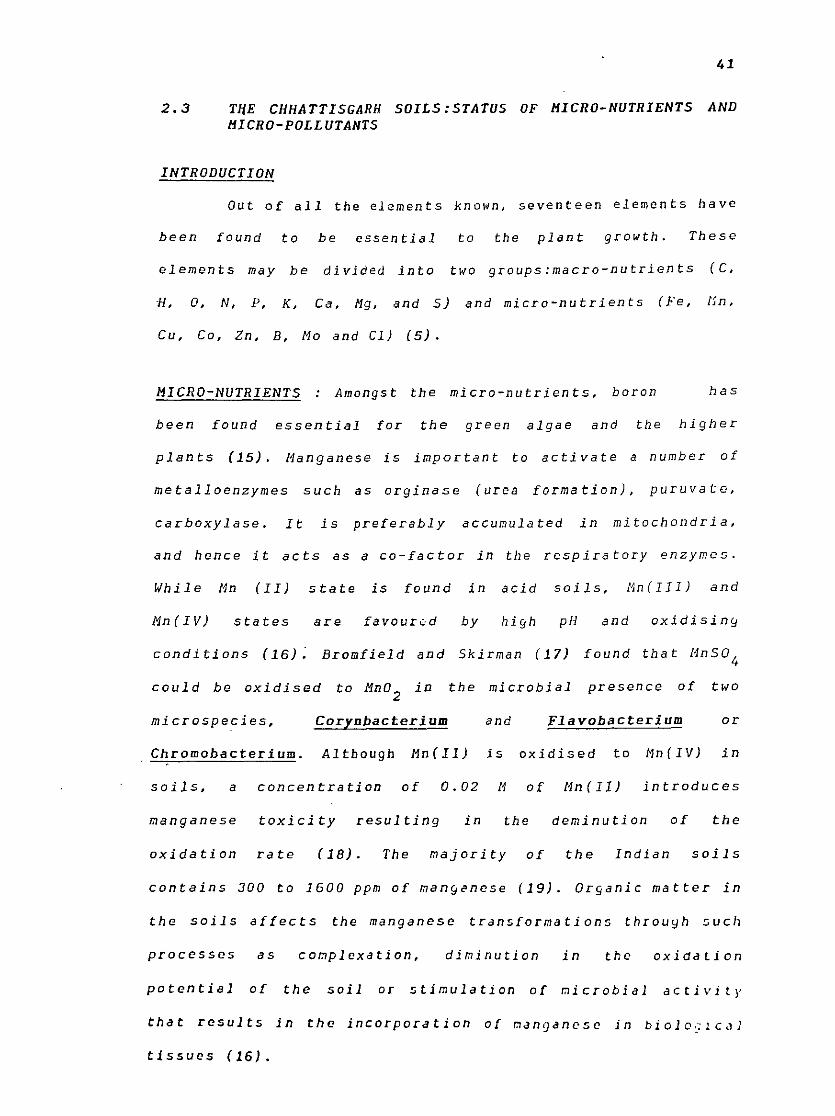
2. 3 T/fE CHHATTISGARH SOILS: STATUS OF MICRO-NUTRIENTS AND MICRO-POLLUTANTS
INTRODUCTION
Out of all the elements known, seventeen elements have
been found to be essential to the plant growth. These
elements may be divided into two groups:macro-nutrients (C.
H, 0, N, P, K, Ca, Ng, and 5) and micro-nutrients (Fe, !Jn,
Cu, Co, Zn, B, Mo and Cl) (5).
MICRO-NUTRIENTS : Amongst the micro-nutrients, boron has
been found essential for the green algae and the higher
plants (15). Manganese is important to activate a number of
metalloenzymes such as arginase (urea formation), puruva to,
carboxylase. It is preferably accumulated in mitochondria,
and hence it acts as a co-factor in the respiratory enzymes.
While Mn (II) state is found in acid soils, 11n(IJI) and
Mn (IV) states are favourc,d pH and oxidisin~
conditions (16); Bromfield and Skirman (17) found that l1nS04
could be oxidised in the microbial presence of two
microspecies, Corynbacterium and Flavobacterium or
Chromobacterium. Although Mn(II) is oxidised to Mn(IV) in
soils, a concentration of 0.02 M of Mn(II) introduces
manganese toxicity resulting in the deminution of the
oxidation rate ( 18). The majority of the Indian soils
contains 300 to 1600 ppm of manyenose (19). Organic matter in
the soils affects the manganese transformations throuyh such
processes as complexation, diminution in the ox ida ti on
potential of the soil or stimulation of microbial activity
that results in the incorporation o[ manganese in biolc~zcal
tissues ( 16).
42
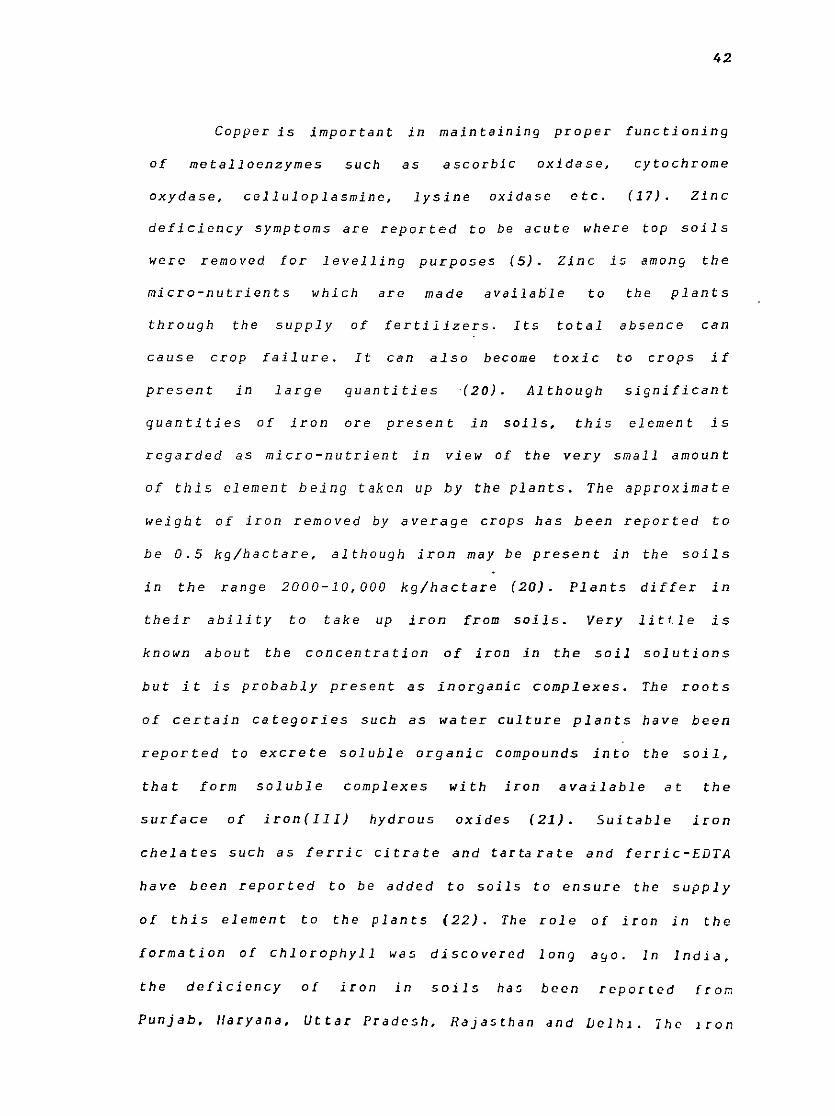
Copper is important in maintaining proper functioning
of metalloenzymes such as ascorbic oxidase, cytochrome
oxydase, celluloplasmine, lysine oxidase etc. ( 17) • Zinc
deficiency symptoms are reported to be acute where top soils
were removed for levelling purposes (5). Zinc is among the
micro-nutrients which are made available to the plants
through the supply of fertilizers. Its total absence can
cause crop failure. It can also become toxic to crops if
present in large quantities ( 20). Although significant
quantities of iron ore present in soils, this element is
regarded as micro-nutrient in view of the very small amount
of this element being taken up by the plants. The approximate
weight of iron removed by average crops has been reported to
be 0. 5 kg/hactare, although iron may be present in the soils
in the range 2000-10,000 kg/hac tare (20). Plants differ in
their ability to take up iron from soils. Very litt.le is
known about the concentration of iron in the soil solutions
but it is probably present as inorganic complexes. The roots
of certain categories such as water culture plants have been
reported to excrete soluble organic compounds into the soil,
that form soluble complexes with iron available at the
surface of iron(Ili) hydrous oxides (21). Suitable iron
chelates such as ferric citrate and tartarate and ferric-EDTA
have been reported to be added to soils to ensure the supply
of this element to the plants (22). The role of iron in the
formation of chlorophyll was discovered long a9o. In India,
the deficiency of iron in soils has been reported frol':l
Punjab, 1/aryana, Uttar Pradesh, Rajasthan and Velhl. The 1 ron
43
deficiency is called iron chlorosis which results in the
yellowing of the plants due to lack of chlorophyll (23).
The reservoir of cabal t in many soils is reported. to
be that adsorbed on the surface of manganese oxides, the
availability of cobalt is decreased by any soil-treatment
which converts the manganous ions to insoluble oxides, and is
increased by those treatments which convert manganese oxides
to manganous ions (24). It is reported that biological
nitrogen fixing system needs cobalt along with iron and
molydenum (25, 26). Cobalt in the form of its sulphate is
usually added to correct the cobalt deficiency of soils (27).
Molybdenum is needed for symbiotic nitrogen fixation. It is
also required for the reductionof nitrates in plant tissues.
2-It is taken up as either HMoo
4 or Mo0
4 (28). The reservoir of
molybdate is that adsorbed on the surface of ferric oxides or
hydra ted oxides which have a very strong affinity for
molybdate (29). Molybdenum deficiency is normaJly found in
acid soils (30). The molybdenum content varies from 0.2 to
5.0 ppm with a mean value of 2 ppm (31).
Chlorine has in recent years been established as one
of the essential nutrients for plant growth. Wilting is
considered the most generaly symptom of chlorine deficiency.
Considerable work has been done on the toxicity symptoms
caused by excess presence of Cl. Generally, these symptoms
include burning of the leaf tips or margins, bronzing,
premature yellowing and abscission of leaves, and less
frequently chlorosis (23). There is no strOn<J evidence that
chloride has any specific effect on plant yrowth, though it
44
may some time hasten maturity. Its main [unction, for which,
however, it is not specific, is on osmotic pressure regula tor
and cation balancer in the cell sap and in the plant cells
(32).
Excess supply of one or more of the above stated
micronutrients often results in depression in growth rate,
and visual pathological effects which at time are
chracteristics of elements supplied in excess (23).
MICRO-POLLUTANTS:THEIR INDUSTRIAL SOURCES AND UPTAKE BY PLANT SPECIES
Apart from micro-nutrients, the soils may also receive
some elements which have no established role in the plant
growth. No beneficial effects of these elements on the plant
growth have been reported. On the contrary, these elements
have been reported to result in damage to the plants in one
or more ways. Some elements of this nature are being
described below.
Arsenic bas been described has poisonous to the plants
(35). Arsenic exists in nature in -3, 0, +3, and +5, state, is
stable in aerated water, whereas elemental arsenic and arsine
(AsH3
) exist in reducing sediments. In moderately reducing
environment, the trivalent state is found to occur ( 34).
As(III) is known to be highly toxic, while As(V) is known to
be less toxic. Arsenic can be removed from solutions in the
As(V) state by adsorption on activated solid~. Ar~enic is
very common element present in nearly all soils, and hence 1n
plants and animal products. At 1 ppm an below, there 1 , nc
45
known harmful effect of arsenic 135). Sodium arsenite is
reported to have been used for many years as a weeo killer
136, 37). More recently organic arsenic compounds such as
cacodylic acid has been found useful as general contact
herbicides to control, weeds, particularly grasses 138,39).
Soils near some smelters are often polluted with large amount
of arsenic I 39). Methylation ot~ dimethyl arsenic acid, whi.ch
is also used as a pesticide, is evident in soils treated with
this pesticide (40). A strain of methanobacterium is reported
to produce dimethylarsine from arsenate (41).
Extensive work has been done about the presence of
lead in air, water and soils. It has been remarked that
modern man contains 100 times more lead than pre-historic man
(42). The average concentration of lead in soils is reported
to be 16 mg/kg. Brown algae and phytoplankton have been
reported to show an affinity for lead (43). It will be useful
to take into account the environmental pollution by cadmium,
zinc and lead attributed to the largest lead-zinc smelter
plant of Japan located at Annaka city. Here about 500 samples
of soil and 80 samples of agricultural products were analysed
for Cd, Zn and Pb. A high correlation was found to exist
between the content of Cd, Zn, and Pb of soils and the
occurrences of these elements in the farm products I 44, 45).
In other words, the closer the soil and vegetation to the
smelter plants, the greater was the contamination found. The
concentrations of these metals in leaf vegetables were found
to be substantially hiyher than those in root ve~etablcs,
fruits and cereals. The flour fror.J wheat and barley were
found to contain r.Juch more Cd, Zn, and I'b than rJce 1n t.~c
46
same polluted area. The soil-profiles near the above-stated
smelter stack were also examined. The upper soil (0-10 em)
was found to be most polluted and soils deeper than 40 em
showed approximately the same values as in unpolluted soils
(44, 45). The toxic effects of lead on human body have been
described in Chapter 1 (Section 1.3). It has been estimated
that in USA, the man has a daily intake of approximately 300
ug of Pb (46), of which about 60% comes from the ingestion of
contaminated food ( 47). The lead-content of food has been
largely influenced by environmental contaminations. This may
have been through surface contamination as well as plant
tissue incorporation of lead that was deposited on soils or
crops grown in areas near the highways or lead smelters (48).
When such crops were used as forage for farm animals, the
lead was found transported into milk or meat (48,49). Amon9st
birds, ducks have been shown susceptible to poisoning from
the consumption of marsh soils ·contaminated with lead (50).
The soils near smelters contain far greater amounts of lead
than does the forage. It was found that horses which have a
marked tendency of. pulling grass along with the roots and
soils could digest far greater quantities of lead than would
be estimated from the analysis of forage alone (51). The
extent to which lead contamination in corn leaves from lead
smelter situated 75 meters away can occur is evident by the
reported presence of lead at a level of 3200 ug/g of the corn
leaves on dry weight basis (52). The lead presence in the
range 1 to 7000 ppm in the ash of a variety of plants [ron
the whole of USA was found in 761 out of 912 sanplcs (53). In
47
contaminated areas, the Pb-content may be much higher; cedar
trees in Missouri on a road side contaminated with lead-ore
dusts contained as much as 20,000 ppm in ash (54), and
Spanish moss near heavily t ravelled roads contained as much
as 15,000 ppm in ash (56). There is also report of bi a
methylation of lead in environment. Any aqueous saline medium
would produce mono- and dimethyl lead( IV) species in the
soils. These species are known to decompose rapidly. (56).
According to Schroeder (57), tetraethyllead is 100 times more
toxic as inorganic lead.
Hercury compounds in the crust of earth are believed
to degrade to the metallic form which in turn is volatilized
to the atmosphere. The atmosphere contributes to the
world-wide distribution in the environment. Rain fall acts as
a scrubber of the atmosphere, and may deposit up to 500 "'Y
annually/acre on the arth surface (58,59). The levels of
mercury have been reported as follows: Swedish soil
50-510 ppb, England and Northern Ireland soils 5000-15,000 ppb
French and Sudan soils 10-60 ppb, (58, 59). Plant and animal
tissues also ahve been reported to have substantial amounts
of mercury with a wide range of levels (60). Some values are
as follows apples (New Zealand) 11-135 ppb, apples (U.K.)
20-120 ppb, rice (Japan) 227-1,000 ppb, rice (U.K.) S-15 ppb.
Schacklette (61) reported mercury in trees and shrubs that
grew over a cinnabar deposit in Alaska-ranye between 0.5-3.5
ppm on dry basis. As the absorbed mercury passes into blood,
one half of it is firmly bound to the albuminof plasr.a and
the other half is associated with the red cells (62). It ic.
therefore, readily redistributed to the tissues, and in a few
hour found in highest concentration in the kidneys. By the
end of a week, 85-95% of all the mercury in the body is
stored in the kidneys (63). Other details of the toxic
effects of mercury have been described in Chapter I (Section
1 • 3 ;'. In sulphide-rich anoxic sediments,. mercury
concentration becomes vanishingly small as a result of the
formation of HgS. In natural systems, bacterial methylation
of mercury occurs in sediments, mobilising the mercury and
making it available for biota (64,66). The evidence of the
formation Of mercury humate with purified humic acid
extracted from the river sediments has been reported (66).
Mercury is methylated in aquatic environment by biological
and non-biological processes that were discovered several
decades ago. Dimethyl mercury [(CH3
)2
Hg] and methyl mercury
cation +
[CH3
Hg] are both formed in nature (67}. Methyl- and
ethyl mercury which are soluble are carried and stored for
extended periods in the blood cells (68). Extremely high
toxicity of methyl mercury to man and its concentration in
the environment have been reported to be of particular
concern (69). Most of the mercury in the Ji Yun river
sediment was found associated with humic acid and other
organic substances (70). Humic acid present in the sediments
has also been found to dissolve mercury (II) sulphide. Thus,
mercury sulphide in the sediments mi~ht be mobilized and
cycled between the sediments and water column (71). The
adsoprtion capacity of different ad5orbents for mercury wa5
found to decrease in the following order : humic acid > /1n00
>
clay minerals > > The adr.orption of mercury
48
49
the main process for the enrichment of mercury in soils and
sediments (72,73). Humic acid in the river water thus
enhances the transport of mercury in form of soluble complex.
The stability of mercury humate in river .was found to be
greater than the stabilities of mercury chloride, hydroxide,
sulphate, or phosphate complexes (74). The emission of methyl
mercury· from the sediments into the water is reported to be
in -2 -1
the range of 0.4 to 5.0 ug Hg m day · (75).
The concentration of cadmium in most ~oils is reported
in -1 the range 0.5-1.0 mg kg although concentrations greater
than 20 mg kg - 1 occur naturally in some places. Raised
concent:ration results from smelting and mining activities,
and from the use of sewage sludge on land. The average
concentration of cadmium in the earth crust is 0.15 mg kr; -l
( 76). and the background concentrations found in soils
depenct upon parent material from which they are derived
( 77). Soils derived from igneous rocks are reported to
contain 0.1-0.3 mg Cd -1
kg (dry matter), from r.Jetamorphic
rocks
zinc
-1 0.3-11.0 mg kg (76).
ores, calamine
Cadmium is a contaminant of the
and sphalarite ( ZnS) • The
contamination of soil resulting from mining activities in
U.K. have been found to contain upto BOO mg Cd kg- 1 · (78).
Soils near the large zinc smelting complex in 1100 kg 2 area
in U.K. is -1 reported to have Cd-levels in excess of 4 mg kg
(79). Phsophatic fertilizer is another important source of Cd
in agricultural soils. Williams and David (80) reported Cd-
concentra tiorl.s o[ 5-100 mg -1 kg in rock phsophat-2, most or
all of which enters the fertilizer prepared fror:J it. The
background values o[ cadmium in a sel12ction of SO di[[ 12 rcnt
50
-1 plants have been reported in the range 0.02-1.00 mg kg (dry
matter) (81, 82). Jarvis et al. examined the distribution of
cadmium between the roots and shoots of 23 plants species
-1 after exposure to a nutrient solution containing 0.01 mg Cd L
In all, except three species, more than 50% of the Cd of
taken-up was re ttdned in the roots ( 83). In the case· rye
grass, approximately 80% of Cd was retained in the roots.
John (84) examined the distribution of Cd in a range of crops
y rown in soils containing 40-200 mg Cd kg -l soil. He found
that root-concentrations of Cd were found to exceed leaf
concentrations for all the crops tested. Using Cd 109 as a
tracer, Stenstrom and Lonsjo (85) found that 0.33% of Cd in
sludge-treated soil was recovered in wheat tops, but only a
quarter was found in the grain. Cadmium is a non-essential
element for both plants and animals, so there is no lower
critical concentration below which deficiency would ,:-::cur.
Upper critical concentrations marked the onset of toxicity.
Cd may be described as zootoxic since it is more toxic to
the animals than to the plants. So the zootoxic upper
critical concentration in plant-tissue precedes the
phytotoxic concentrations, and animals could conceivably be
harmed by eating apparently healthy plant material. Beckette
and Davis (86) found that at a median value -1 of 80 mg Cd kg
in tissues of young barley plants, the yield was found
reduced. For practical purposes, Yield is taken to be a
sensitive indicator of plant health, and reductions in yield
precede visual symptoms of Cd-toxicity as shown by chlorosis,
red brown patches on lcavc!:i, stunted !itCr:J!:i and. in !::C\•crc
51
cases, leaf curling and abscission (87,88). The long-term
exposure to enhanced level of Cd which is a cumulative poison
may be significant. Long lived animals such as humans are
more at risk to chronic Cd-toxicity than farm animals whose
life is comparetively short. Under normal circumstances, food
constitutes the most important source for the general
population. Over 50% of the total dietary intake of Cd is
derived from the cereals and vegetable portions of the diet
(89). WHO and US environmental agency have independently
estimated the safe limit of daily intake of Cd at about 70 ug
(90, 91). Cadmium is an element which is highly toxic to
mammals. In 1969, Tsuchiyia (92) reported that Itai itai
syndrome was associated with the ingestion of Cd-contaminated
rice together with other pre-disposing factors (93). It is
now well established that kidney dysfunction following
proximal tubule damage is the most characteristics symptom of
chronic poisoning by cadmium (94,95). Details of other toxic
effects of cadmium have been described in Chapter I (Section
1.3). There are reports of cadmium undergoing biomethylation.
The dimethyl cadmium hydrolyses quickly to a gelatinous
precipitate of polymeric CH Cd(OH) . This polymer is capable 3 X
of methylating aqua ted metal electrophiles such as Hg( II)
(96,97). Studies have also shown that cadmium is adsorbed on
clay minerals, hydrous oxides of iron and manganese, humic
substances which are all norr.Jal constitutents of the soil
(98,99). It is reported that the uptake and transport of
cadmium in plants is reduced at increased zinc or potassiu~
concentrations ( 100). !11]1: IIDU .~H ·.~ 111 r ll
T 133<5
The cadr.Jiur.J presence in
52
near Annaka city where Japan's largest zinc smelter is
located has been reported as follows (46) rice 0.4-0.95;
wheat 0.5-8.6; green vegetables 2.6-56.0; root crops 0.9-17.0
fruit vegetables 0.3-0.6; ppm (dry matter basis). In 1968,
Fukushima et al (101) analysed rice samples collected from 77
farm houses in different parts of the endemic area of Itai
i tai des ease in Japan, and also from control areas, and
obtained a correlation between the geographical distribution
of the prevalence of desease and the cadmium contents in the
soil and rice in the endemic area (102). The results of pot
culture experiments on rice plants and wheat preferred by
Kobayashi and Muramoto (103) in which different amounts of
cadmium and zinc were added to the soil indicated that the
more cadmium oxide added to the soil the greater was the
uptake Of cadmium especially in wheat, and that the yield of
wheat was reduced at a level of 0.003% cadmium in the soil,
while in rice a significant decrease in yield was not seen
until 0.1%. There is also a report of severe chlorosis of the
leaves of sweet potatos which turned bright yellow due to
cadmium poisoning in a cadmium mining district in Japan
(104).
Chromite (FeO.Cr2o
3) is the only important ore of
chromium, and approximately 0. 03% of the igneous rock in the
earth crust is chromium. The absorption, distribution and
of excretion.chromium by animal and man at levels beyond normal
ingestion have been well investigated (105). At the5e level~.
orally administered trivalent chromium is ab~orbed to tl:c
extent of only about 1% or Jess (106). J/cxavalcnt cl:ro~ 1 ~-
53
better absorbed than trivalent chromium (106), and readily
passes through the membrane of red blood cells and becomes
bound to the globin fraction of hemoglobin ( 107). The other
adverse effects of chromium have been described in Chapter I
(Section 1.3). The occurrence of chromium in plant tissues of . ' ' food and feed plants have been reported as follows: the
element has been detected in the range of Jess than 1 to
700 ppm in ash of a variety of native species found
throughout USA in 1096 samples. out of 1139 samples ( 108).
Chromium salts, particularly chromates, even at very low
concentrations, have been found to be toxic to plants ( 109).
Chromium (III) has been reported as an essential element for
man and animals required as part of the glucose tolerance
factor ( 110, 111).
Nickel is wide-spread in its occurrence, and
distributed widely in foods, Estimates of daily human intake
are from 0.24-1.0 Ni mg/day (112,113). Vegetable materials
contain much more nickel than material from animal origin.
Estimates between 0.15-0.35 ppm Ni have been made for foods,
tubers and grains ( 114, 115). Some i terns, high in Ni, were tea
7.6 ppm, buck wheat seed 6.4 ppm, oyesters 6.0 ppm, on dry
weight basis ( 115, 116). Significant concentrations of Ni are
present in DNA and RNA ( 117, 118). The harmful effects of
nickel on human health have been described in Chapter I
(Section 1.3). The occurrence of nickel in tissues of food and
feed plants in USA has been reported from 5 to 500 ppm in 82~
samples out of 912 samples on dry weight basis 1108). In ash,
Ni occurs in most samples of food plants in concentratJon o[
54
5 ppm, and rarely exceeds 100 ppm (119). An exception is
provided by soya bean seed samples in which Ni is found to
occur in the range of 30-500 ppm (in ash), in contrast with
corn grains from the same area in which Ni ranged between
5-70 ppm (in ash) ( 120). There is a report that cyanobacteria
brown and green algae and yeast cells all bioconcentra te
nickel (121).
The determinations of the mocronutrients and micro
pollutants in the principle soil-types of Chhattisgarh region
have been described below.
MATERIALS AND METHODS
Sample collection The method of the collection of the
samples of the four principal soil-types (Bhata, 11?tasi,
Dorsa, and Kanhar) and the methods of sample preparations
have been described earlier (Section 2.2).
Method Manganese, copper, zinc, molybdenum, cobalt, lead,
cadmium, chromium, and nickel were determined in the soil
samples using an atomic absorption spectrophotometer. As and
Mg were determined spectrophotometrically.
Sample preparation Weighed quanti ties ( 5 g each) of the
samples were dried at 110°C in an oven for three hours. and
thereafter reduced to a powder form. Weighed quantity (0.5 9)
of samples were treated in a teflon diyestion bomb usin~ lOnl
acid mixture
C for
of /ICl, /IF, and 111103
and placiny in an oven dt
three hours (122). Sample ~olution for t~c
55
determination of Pb were made in a medium of 0.1 M EDTA to
suppress the interference of phosphate and fluoride (123).
Reagent solutions : For the AAS determinations, the standard
solutions of the respective metals were prepared by the
prescribed procedures (123) as follows
Manganese 1 g of the metal (wire form) was dissolved in
minimum volume of nitric acid (1:1), and the solution was
diluted to 1 L (1 ml = 1,000 ug Mn).
Copper 1 g at the metal wire was dissolved in minimum
volume of nitric acid (1:1), and the solution diluted to 1 L
(1 ml = 1000 ug Cu).
Zinc : 1 g of the granule was dissolved in 40 ml HCl ( 1 :1)
and the solution diluted to 1 L. ( 1 ml = 1, 000 ug Zn).
Molybdenum 1 g of tbe metal wire was dissolved in HCl acid
(1:1) with gentle heating. The solution was cooled and
diluted to 1 L (1 ml = 1,000 ug Mo).
Cobalt : 1 g of metal wire was dissolved in minimum volume of
nitric acid (1:1). and the solution diluted to 1 L (1 ml =
1,000 ug Co).
Lead,: 1 g of the metal-wire was dissolved in nitric acid (1:1)
and the solution diluted to 1 L ( 1 ml = 1, 000 ug Pb).
Cadmium·; 1 g of the metal was dissolved in minimum volume of
nitric acid (1;1). and the solution diluted to 1 1. ( 1 :-:1
1. 000 ug Cd).
56
Chromium:!-: 1 g of the metal wire-form was dissolved in HCl
acid (1:1) with gentle heating. The solution was diluted to
1 L (1 ml = 1,000 ug Cr).
Nickel : 1 g of the metal strip was dissolved in nitric acid
(1 :1), and the solution diluted to 1 L (1 ml = 1,000 ug Nil.
All the metals and chemical reagents used were of
spectroscopic grade. The water used was distilled and
deionised. The glassware used were superior quality
borosilicate.
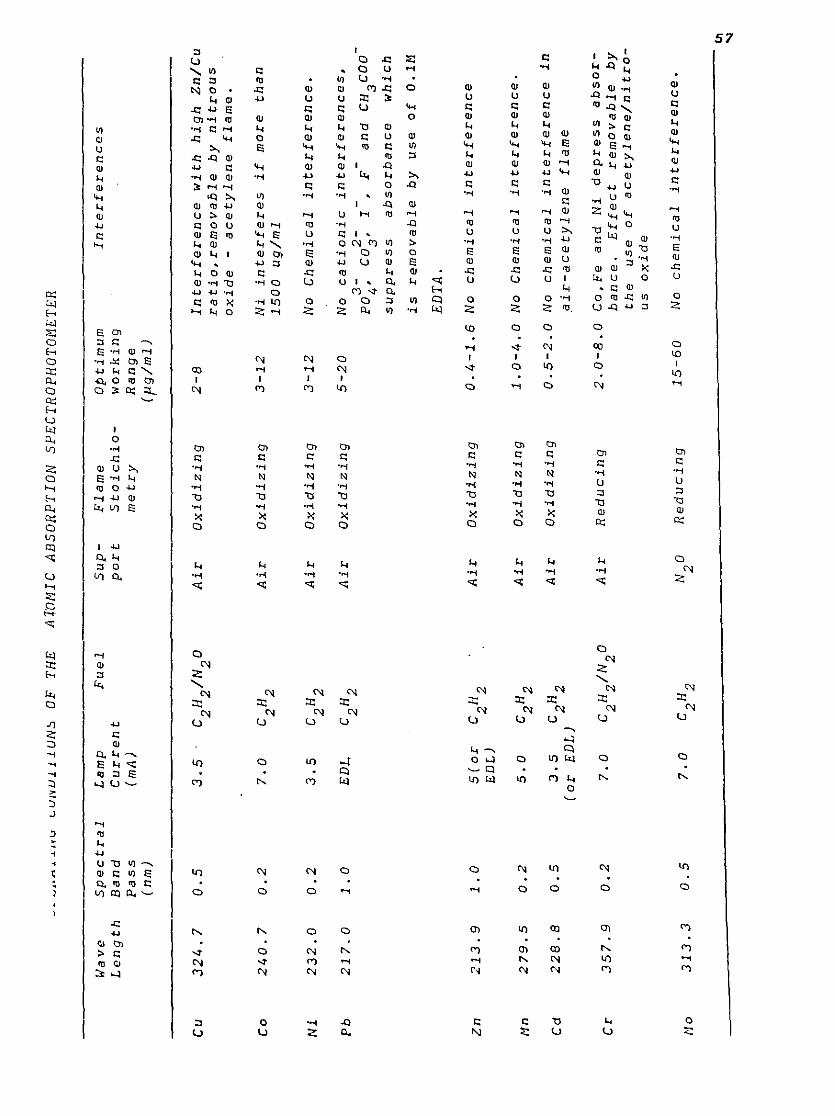
Apparatus The analysis was carried out by using an atomic
absorption spectrophotometer (Varian Techtron Model AA 575).
The operating conditions of the instrument ( 123) have been
shown in Table 2-6.
During calibration the standard solutions of the
metals were suitably diluted to match the ocncentrations of
the sample solutions within the measurement sensitivity
( 124). The physical properties of the sample and standard
were matched closely to avoid matrix effect (124). The
methods were also suitably modified to remove the effects of
interference.
The results obtained have been shown in Table 2-7.
The determinations of arsenic and mercury were made
spectrophotometrically using the following procedures.
Cu
Co
Ni
Pb
Zn
11n
Cd
Cr
No
Wa
ve
Len
gth
32
4.7
24
0.7
23
2.0
21
7.0
21
3.9
27
9.5
22
8.8
35
7.9
31
3.3
-·~"n'""" t..uJVUlllUN~
OF
T
HE
A~OMIC
AB
SO
RP
TIO
N
SPE
CT
RO
PH
OT
OM
ET
ER
Sp
ectr
al
Ba
nd
P
ass
(nm
)
0.5
0.2
0.2
1.0
1.0
0,2
0.5
0.2
0.5
La
mp
C
urren
t (m
A)
Fu
el
3.5
7.0
3.5
ED
L.
C2
H2
!N2
0
C2
H2
C2
H2
C2
H2
5(o
r
C2
H2
ED
L)
5.0
c 2
H2
3.5
c 2
fl2
(or
ED
[,)
7.0
C
2f!
2/N
2o
7.0
C
2fl
2
Su
p
po
rt
Air
Air
Air
Air
Air
Air
Air
Air
N2
0
Fla
me
Sto
ich
io
metr
y
Oxid
izin
g
Oxid
izin
g
Oxid
izin
g
Oxid
izin
g
Oxid
izin
g
Oxid
izin
g
Oxid
izin
g
Red
ucin
g
Red
ucin
g
Op
tim
um
w
orkin
g
Ra
ng
e
(pg
/ml)
2-8
3-1
2
3-1
2
5-2
0
In
terferen
ces
In
terfe
ren
ce
wit
h
hig
h
Zn
/Cu
ra
tio
,rem
ova
ble
b
y n
itro
us
oxid
e
-acety
len
e
flam
e.
Ni
inte
rfe
res if
mo
re
than
1
50
0
ug
/ml
No
Ch
em
ica
l in
terfe
ren
ce.
No
ca
tio
nic
in
terferen
ces.
3-
2-
--
P0
4,
C0
3,
I ,
F
an
d
CH
3C
OO
su
pp
ress
ab
so
rb
an
ce
wh
ich
is
rem
ova
ble
b
y
use
o
f O
.lM
ED
TA
.
0.4
-1.6
N
o ch
em
ica
l in
terfe
ren
ce
1.0
-4
.0
No
Ch
em
ica
l in
terfe
ren
ce.
0.5
-2
.0
No
ch
em
ica
l in
terfe
ren
ce
in
air
-a
cety
len
e
fla
me
2.0
-8
.0
Co
,Fe
an
d
Ni
dep
ress
ab
so
rb
an
ce.
Eff
ect
rem
ova
ble
b
y
the
use
o
f a
cety
len
e/n
itro
u
s
ox
ide
15
-60
N
o ch
em
ica
l in
terfe
ren
ce.
"' 'ol
58
Arsenic A weighed quantity (5 g) of the soil sample was
transferred to a Kjeldahl flask and mixed with 20 .ml
concentrated sulphuric acid, 5 ml concentrated nitric acid
and 0.1 g of potassium chlorate. After completion of
digestion, mixture was cooled, filtered and diluted to 250
ml. An aliquot (25 ml) was placed in a arsine evolution
flash, treated with 5 ml concentrated HCl, 2 ml KI solution
(15%), and eight drops of SnC12
solution. After 15 min., 5 g
of pure granulated zinc was added to the solution. The arsine
evolved was absorbed in a si 1 ver diethyldithocarbamate
solution (5% in pure pyridine). The absorbance of the complex
was measured at 540 nm. A blank was also run. A calibration
curve was prepared by using standard solutions of arsenic
prepared by dissolving arsenious oxide in NaOH solution (13,
125).
Mercury : A weighed quantity (1 g) of the sample was
transferred to a Kjeldahl flask, 30 ml of 1:1 mixture of
cone. sulphuric and nitric acid was added, and heated for
two hours. The mixture was cooled, filtered and diluted to
250 ml. An aliquot (25 ml) was taken in a separatory funnel,
and 50 ml of dilute hydrochloric (20%) was added. It was then
treated with 10 ml of dithizone solution (0.25%) in
chloroform. Two more extractions were done. The organic laye::
was treated with 50 ml of hydrochloric acid (1:70/ and 5 ml
of KBr solution (40%) and shaken vigorously. The chloroforr:
layer containing copper was discarded. The aqueous phase
containing mercury was used for the 5pcctrophotor:etric
59
determination using dithizone reagent at pH 1-2 by measuring
absorbance at 485 nm (14).
The results obtained have been shown in Table 2-7.
RESULTS AND DISCUSSION
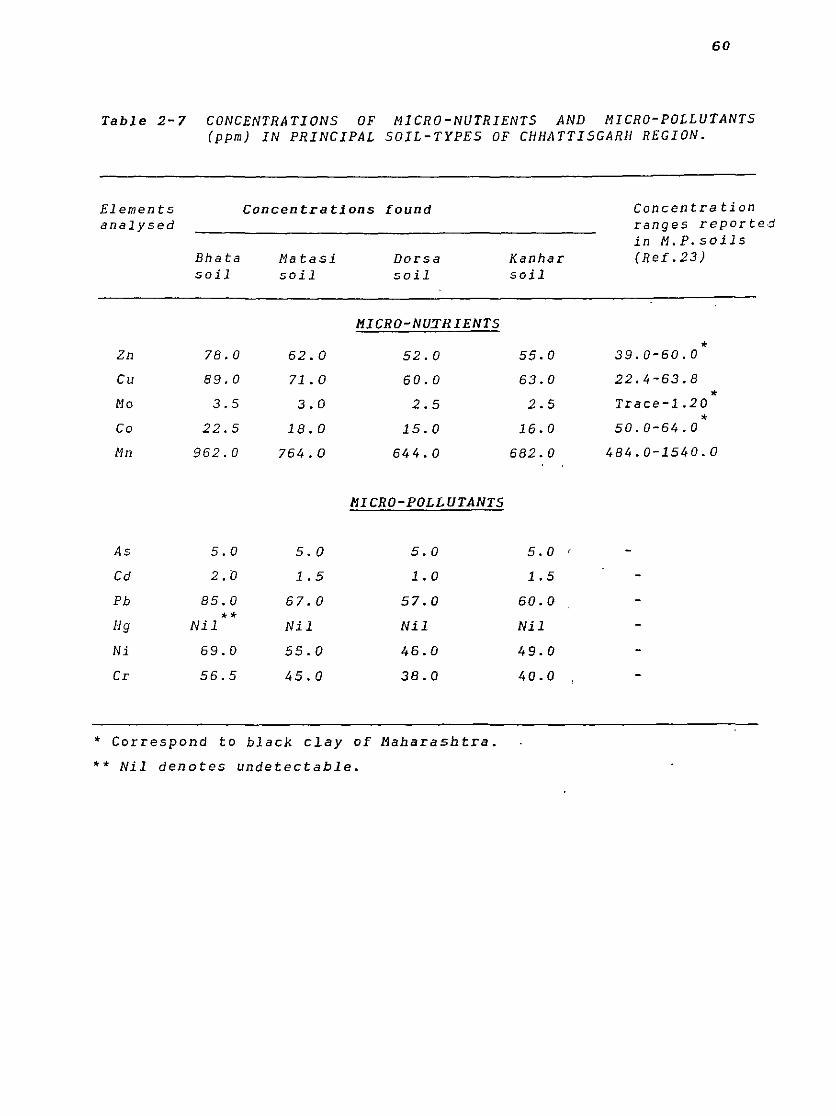
The results obtained (Table 2-7) show that the four
principal soi)-types (Bhata, Hatasi, Dorsa, and Kanhar) of
the Chhattis·garh region contain the selected micronutrients
(Zn,Cu,Mo,Co,Hn) at concentration 1 e vel s which have a
reasonable agreement with those reported for the soils of
Madhya Pradesh State and in the neighbouring area (25). The
status of the selected micronutrients in the soils here can
thus be taken as normal.
Apart from the micronutrients, the soils have
indicated the presence of a number of metallic elements which
have no direct role in the plant growth. On the other hand,
some of these elements e.g. Cd, Ni, Cr have been reported to
have a tendency of getting into the plant body, and farm part
·of the food chain. However, cadmium which has been found to
be very sensitive element from the point of view of plant
uptake, particularly by the paddy crops, has been found to be
present at low concentration levels (1.0-2.0 ppm).
60
Table 2-7 CONCENTRATIONS OF MICRO-NUTRIENTS AND MICRO-POLLUTANTS (ppm} IN PRINCIPAL SOIL-TYPES OF CHHATTISGARH REGION.
Elements Concen tra ti ons found analysed
Bhata Matasi Dorsa soil soil soil
HICRO-NU:TRIENTS
Zn 78.0 62.0 52.0
Cu 89.0 71. 0 60.0
Mo 3.S 3.0 2.5
Co 22.5 18.0 15.0
Mn 962.0 764.0 644.0
MICRO-POLLUTANTS
As 5.0 5.0 5.0
Cd 2.0 1.5 1.0
Pb 85.0 67.0 57.0 ** Hg Nil Nil Nil
Ni 69.0 55.0 46.0
Cr 56.5 45.0 38.0
* Correspond to black clay of Haharashtra.
** Nil denotes undetectable.
Concen tra ti on ranges rep or te,d in M.P. soils
Kanhar (Ref.23) soil
* 55.0 39.0-60.0
63.0 22.4-63.8
* 2.5 Trace-1.20 * 16.0 50.0-64.0
682.0 484.0-1540.0
5.0
1.5
60.0
Nil
49.0
40.0
61
2.4 HUMIC ACID ITS ISOLATION FROM PADDY SOIL (KANHAR TYPE) AND CHARACTERIZATION.
INTRODUCTION
Humus has been defined as the substance left after the soil
organisms have modified it from the original organic matter to a
rather stable group of decay product. In other words, humus is th·e
colloidal remains of organic matter. Soil organic matter has been
defined as any living or dead plant or animal materials in the soil.
Organic matter is often confused with humus, because organic matter
consists of either living or dead plant or animal materials. Hence it
must contain all the nutrients needed for the growth of these
organisms. The amount and type of these nutrients are directly
dependent on the original source. In raw (undecomposed) organic
matter, there are few major groups of organic compounds which are
contributed to the soils. These are : carbohydrates, lignins,
proteins, fats, waxes and resins. Of these, carbohydrate end proteins
are the most important and most readily decomposed. These two
constituents are also the greatest contributors of soil nutrients
such as nitrogen, sulphur and phosphorus. Lignin is a very resistant
compound which persists in the soil as one of the main component of
the humus. Fats, waxes and resins are resistant compounds which
contribute sulphur and phosphorous to the soil. Alongwith these major
compounds, there exists a host of other minor compounds. Unless the
organic matter is decomposed, these nutrients will remain i:: the
soil, but in unavailable form. The decomposition of organic matt;,r i~
carried-out by soil organism (22). The nuclei of humus arise both
from altered lignin compounds and through the ::;ynthesis of arc::a tlc
62
compounds by micro-organisms. Micro-organisms are thus
implicated in all phases of humus formations. They affect the
decomposition of the original plants and animal residues to
simpler compounds, and at the same time are responsible for
the alteration of lignin and tanin molecules which will
become parts of the structural units of humus. Several
hypotheses have been proposed about the nature of humic
substances. Most of these hypotheses have several aspects in
common:humic substances are amorphous, three-dimensional,
polymeric, acidic substances, of high molecular weight, with
more or less aromatic nature. It is also generally agreed
that no single specific structural formula will adequately
represent the humic substances. Rather most hypotheses
suggest a type or a skeltal structure in which only general
aspects are included. The hypotheses differ primarily in the
nature of structural nucleus whether it is benzenoid~
phenolic, quinonic, or heterocyclic in nature, whether the N
is a fundamental part of such nucleus or an accidental
contaminant or whether there is a reasonable degree of
uniformity as reflected in a number of structural units
randomly distributed throughout the nucleus (25). Humus was
regarded as a soil constituent of great significarce in soil
forming processes, and in soil fertility; its presence in tbe
soil was the qualitative feature distinguishing the soil from
the parent rock. Efforts to quantitatively isolate humus
matter in a form suitable for analysis have had only a
limited success. Most schemes of separation involved the
63
solubilisation of organic matter through the alkaline,
neutral extracting reagents and various organic solvents
( 25).
Humic material primarily consists of negatively
charged colloids. Some of it is bound to the clay through
polyvalent cations such as calcium or aluminium, one of whose
charges neutralise a negative charge on the clay and the
other on a humus. Some is bound to positively charged
surfaces of iron or aluminium hydrated oxides, and some is
held at clay surfaces through hydrogen bonding or by van der
Wall forces. The classical way of separation of humus part
from soil that is most widely used is to extract the soil
with sodium hydroxide (0.1-0.5 N) • This replaces the
polyvalent ions by sodium and precipitates them as
hydroxides, or converts the alumina to the aluminate anion.
It increases the negative charge on humus colloid and
decreases the positive charge on any sesquioxide surfaces. So
far as the humus is bonded to the clay through polyvalent
cations, a treatment with chelating agent such as sodium
pyrophosphate will be an effective dispersing agent ( 126).
The classical method for fractionating the humic colloid
dispersed in sodium hydroxide extract is to acidify the
suspension with sulphuric or hydrochloric acid, which causes
a part of dispersed organic matter to precipitate. The part
that stays in solution is known as fulvic acid, that which·
precipitates out as humic acid, and that part of the organic
matter which docs not disperse in the alkali but re,ain~ in
the soi 1 as humin. Although these fractions arc
64
definite names, they are not homogenous. Each contains
par ti cl es with a wide range of molecular weight and
constitution, nor there is a clear cut division between the
fractions. Also, the proportion of humic matter that is
precipitated by the acid depends on the type of acid used and
its strength.
The humic colloides (or humic acids) are built-up of
carbon, oxygen, hydrogen, nitrogen, sulphur and phosphorus;
and, as far as is known, no other element forms an integral
part. The elemental composition of humus from different soils
varies within quite wide limits, but for many agricultural
soils, the ratio C:N:S:P is of the order 100:10:1:2 on a
weight basis. The dispersed humic particles have a wide range
of molecular weight, but there is still some difficulty in
separating the humic suspension into fractions ·having a
molecular weight in a given range. The molecular weights of
humic acids have been found to be above 5000 and going to
several millions ( 127). Humic colloids contain a range of
polysaccharides, proteins or polypeptides and substances of
unknown compositions, but rich in aromatic rings, as wel_l as
a large range of substances present in small or very small
quantities. This includes waxes and asphalts on the one hand
(127), and substances likely to be present in the living
cells in the soil organisms such as purin and pyrimidine
bases and nucleic acids (128) on the other.
Humic substances are able to form complex linkages of
various kinds with metals by ion-exhange, adsorption on
65
ourfaces and formation of chelates. Cation exchange reactions
are important in plant nutritions. According to the different
types of linkages between functional groups of humic acids
and the inorganic soil constituents, three main types of
metal-organic derivatives can be distinguished ( i) the ionic
type with participation of carboxyl and phenolic hydroxic
groups leading to the corresponding humates by the known
reaction of salt formation, (ii) the semi-polar type, formed
by co-ordination linkages with participation of amino, imino,
keto and thioether groups, leading to the complex compounds
of chelate types, (iii) a type that is formed by polarisation
effects and hydrogen bridge linkages with special
participation of terminal functional groups forming compounds
of the adsorption type (129).
The infrared spectroscopy of humic acid preparations
and their fractions is used by many authors
characterizing humic substances of different soil origins
( 129). The assignment of different specific bands is limited
by the fact that soil organic matter preparations represent
in most cases mixture of more or less complex molecules
containing different types of linkages and functional groups.·
This leads to an overlaping of the absorption bands. The
infrared absorption spectra of humic acid, therefore, shows
only some bands which are characteristic for the chemical
nature of the molecule. The infrared absorption properties of
the samples are also strongly influenced by different methods
of sample preparation (130).
66
The isolation of the humic acid from one variety of
the paddy soils (Kanhar type), and its subsequent characteri-
zation by IR-spectroscopy has been described below.
MATERIALS AND METHODS
Sample collection The method of the sample collection of
the Kanhar variety fo the paddy soil has been described
earlier (Section 2.2).
Isolation of humic acid A weighed quantity (200 g) of the
soil was extracted with 2 litres of sodium pyrophosphate •
solution (0.1 M) in 0.1 M sodium hydroxide medium (pH 13.0).
The supernatant was collected by centrifugation. The extract
was acidified with H2
so4
to a pH of 1.5 which yielded
precipitated humic acid.
Purification of humic acid The humic acid obtained was
purified by repeated flocculation and peptisation using
dil.H2
so4
and NaOH till free form metal and sulphate ions.
The product was further purified in a batch of flasks
containing Dowex-15 cation exchange resin until no further
decrease in its pH was noticed. The ash content in a small
portion of the purified humic acid was determined, and the
value of the same was found to be 0.25%. The total wei<;;ht of
humic acid after oven drying at was recorded (131,
132).
67
IR-spectra of isolated humic acid The IR-spectra of the
isolated pure humic acid were recorded in the spectral range
of 4000 to 400 em -l in the nujol medium using an IR-spectro-
photometer (Nicolet FT-IR). The spectra obtained has been
shown in Fig.2-2. the observed bands and their assignment to
different functional groups have been shown in Table 2-8.
RESULTS AND DISCUSSION
The results obtained (Fig.2-2, Table 2-8) have
confirmed the presence of a number of functional groups in
the skeltal network of the humic acid. The notable functional
groups whose presence is confirmed in the humic acid
structure include hydroxy, aromatic, carboxylate, carbonyls
of aldehydes, ketones and quinones, and C=C unsaturated
groups, apart from stretching frequencies of N-H and S-H
groups.
The response of these groups towards different
reacting cationic species bas. been studied in detail, and
described in subsequent chapters.
2.5 BACTERIAL PRESENCE:STANDARD PLATE COUNT STUDY OF PADDY SOIL (KANHAR VARIETY).
INTRODUCTION
The Standard Plant Count ( Sl'C) procedure provides a
standardised method of determining the density of aerobic and
facultative aerobic and heterotropic bacteria in water a::.
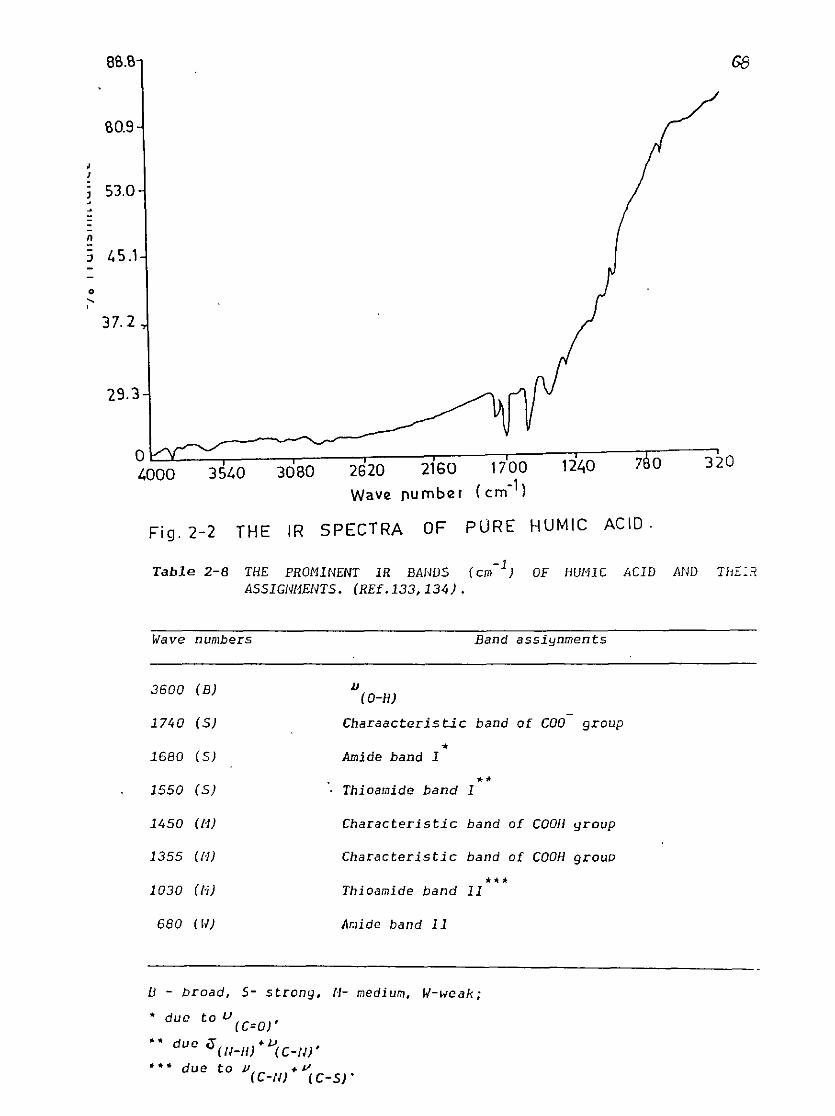
l . = --n
J
0 .... '
as.s
80.9
53.0
L. 5.1
37.2
29.3
0 1700 1240 7 0
1.000 351.0 3060 2G20 2160 ( cm-1 l Wave number
Fig. 2-2 THE IR SPECTRA OF PURE HUMIC ACID.
Table 2-B THE PROMINENT IR BANDS -1
(em ) OF HUMIC ASSIGN/1ENT5. (REf.133, 134).
Wave numbers Band assiynments
3600 (B) J.J (0-H)
1740 (5) Charaacter is tic band of coo group .,.
1680 ( SJ Amide band 1
** 1550 (5) Thioamide band 1
1450 (11) Characteristic band of COOII group
1355 (N) Characteristic band of COOH grouo
*** 1030 (N) Thioamide band 11
680 ( II) Ar.lide band 11
IJ - broad, 5- strong, N- medium, W-weak;
• due to u (C=O)'
• • due 0 (11-11) <~~(c-ur • •,. due to JJ + v
(C-N) CC-5)"
ACID
G8
320
AND T/JL.i
69
well as in soil. Soil is a unique medium that contains a
diverse community of organisms representing many
morphological and physiological types. In attempting to
characterise these organisms, one has to take in to
consideration both their numbers and activities. Organisms in
soils are never static in number and activity. Therefore, the
enumeration of the population or microbial" activity
represents a point in time for that particular population
that is in dynamic equilibrium with its physical, chemical
and biological environments. Variation of microbial numbers
and activities can occur with depth and soil types (135,136).
Soil structure, texture and moisture levels can drastically
affect aeration within the soil environment attributing
aerobic to anaerobic properties. The season of the year is as
important as soil physical properties for the microbial
diversity ( 137). Hagedron ( 138) observid differences in
numbers and diversity of actinomycetes depending on soil
acidities. Schmidt (139) considers the plate count method
acceptable particularly because in this method media that are
specific for fixed physiological groups are developed, ana
the incubation conditions approach the natural environment.
It will have to be kept in mind that organisms are not
uniformaly distributed throughout the soil environment, but
rather are found in a point distribution depending on a
localised feature that allows maximum expression of that
particular organism.
70
MATERIALS AND METHODS
Sampling : The soil samples of the Kanhar type of paddy soil
was collected by standard procedure as described earlier
(Section 2.2). The samples were shifted to the laboratory
soon after collection. During the short period of storage of
the samples, a ro_om cooler was put on operation to provide a
static and moderately cool temperature.
Procedure : The freshly collected soil sample (1 g) was taken
in a sterilized bottle. 10 ml of aseptic distilled water was
added to obtain a suspension. The supernatant liquid was
decanted into another sterilized bottle and used for Standard
Plate Count study. Reagents required for the plate count were
prepared as follows :
Dilution water : (a) 3.4 g of patassium hydrogenphosphate was
dissolved in about 50 ml of distilled water. pH was adjusted
to 7.2 by using 1 N NaOH and finally the volume was made upto
100 ml by distilled water. (b) 3.8 g of magnesium chloride
was- dissolved in 100 ml of distilled water. 1.25 ml fo the
above stated phosphate buffer solution and 5.0 ml of
magnesium chloride solution were mixed in a volumatric flask
(1,000 ml) and the volume made upto 1 litre using distilled
water. After 15 to 20 min., this dilution water (1 L) was
sterilized in anautoclave.
Nutrient agar medium 5.0 g of trypton, 2.5 g of yea!;t
extract, 1.0 g of glucose and 15.0 g of agar were added to
71
1 litre of distilled water and sterilized in an autoclave.
Hethod Using the soil-extract solution, more diluted
samples were prepared using sterilized dilution water in
sterilized bott.les in the following ratios (i) 1:1, (ii) 1:10
(iii) 1:100, (iv) 1:1,000, (v) 1:10,000, (vi) 1:1,00,000. 1ml
aliquots of the above diluted samples were transferred
separately to sterilized Petri plates in three replicates. 12
ml of sterilized nutrient agar medium, 0 (temp.45 C) was poured
to each of these Petri plates. The medium and the samples
were mixed by gently moving the Petri plates in circular
order. When the medium was solidified, Petri plates were
inverted and incubated at 37° C for 48 hours in an incubator.
On completion of incubation period, bacterial colonies were
counted in each plate and calculated as No./ml by dividing it
with dilution factor ( 140). The average value was recorded
and shown in Table 2-9.
RESULTS AND DISCUSSION
The primary environmental variables influencing soil
bacteria include:moisture, aeration, temperature, organic
matter, acidity and inorganic nutrient supply. Some lesser
variables such as cultivation, season, and depth have also
been described to influence the denisty and composition of
the bacterial flora. The plate count of the .bacteria as found
here (Table 2-9) was 20 x 106
/g soil. The value of a typical
soil-profile in USA for a depth of 3-8 em i::, reported to be
7.8 x 10⁶/g soil (39). The count found here thu::, indicated a
correct order.
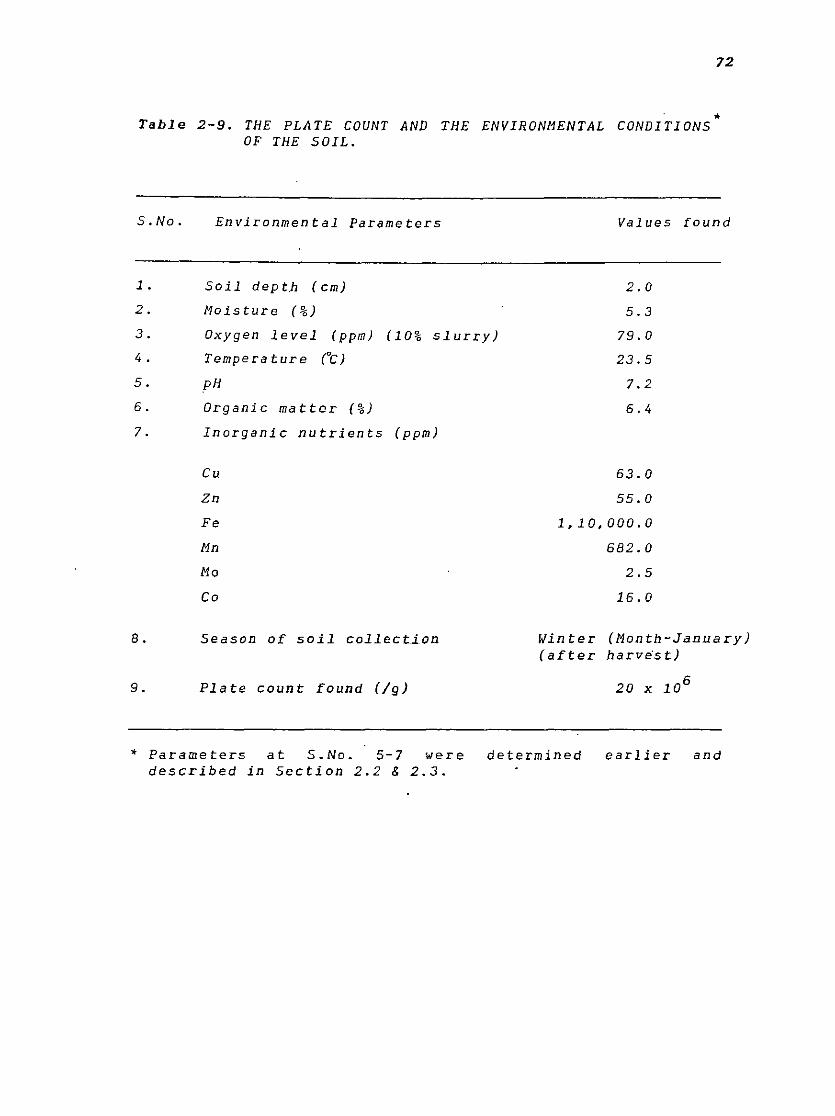
72
* Table 2-9. THE PLATE COUNT AND THE ENVIRON11ENTAL CONDITIONS OF THE SOIL.
S.No. Environmental Parameters
1. Soil depth (em)
2. /1oisture (%)
3.
4 .
5.
6.
Oxygen level (ppm) ( 10% slurry)
Temperature ("c)
pH
Organic matter (%}
7. Inorganic nutrients (ppm)
8.
9.
Cu
Zn
Fe
Mn
Mo
Co
Season of soil collection
Plate counr found (/g)
Values found
2.0
5.3
79.0
23.5
7.2
6.4
63.0
55.0
1,10,000.0
682.0
2.5
16.0
Winter (11onth-January) (after harve·st)
20 X 106
* Parameters at S.No. 5-7 were determined described in Section 2.2 & 2.3.
earlier and
73
SUMMARY
This chapter wa.:... devoted to having a close
acquaintence with the soils of the local areas which formed
the central object for studying the impacts of the effluents.
For this purpose, the soil types, their morphological
features and their distributions in different districts of
the Chhattisgarh region were studied. Some importent terms
related to soil structure (bulk density, infiltration rate,
field capacity, wilting point) were also explained. The
importance of key-paramters (pH, electrical conductivity,
organic carbon, available nutrients, cation exchange
capacity, silica, iron oxide, aluminium oxide) which affects
the functionality of the soil was explained. The four
principal soil types (Bhata, Matasi, Dorsa, and Kanhar) were
collected from farm fields as per prescribed procedures and
their physico-chemical character is tics (pH, electrical
conductivity, organic carbon, available nutrients, cation
exchange capacity, exchangeable cations, 5102
, Fe2o
3, Al
2o
3J
were determined. A gradation amongst the four soil types used
here was found evident from the data obtained.While tpe Bhata
and Matasi type indicated weakly acidic to neutral nature,
the Dorsa and Kanhar types were neutral to slightly alkaline.
On the basis of available nutrients (N,K, P, CEC) and the
organic carbon, the Kanhar type appeared to be the most
fertile of the four types. It was found to be more useful to
select this particular soil type for the study of the
effluents' impacts.
74
The status of micronutrients (Zn, Cu, Mo, Co, Mn) and
micro-pollutants (As, Cd, Pb, Hg, Ni, Cr) were studied in
detail. The role of the micronutrients in the growth of the
plant species was studied. A literature survey to identify
the channel of entries of toxic metals from different
industrial sources and the resulting harmful effects on crops
and vagetations was carried out.
The humic acid contents of the paddy soil (Kanhar
type) were studied in detail. For this purpose, the genesis
and the structural aspects of the humic acid were studied and
described. The reactivity of the humic acid with metal ions
were also studied. For the experimental studies, the humic
acid was isolated form the paddy soil and purified with
standard procedures. The IR spectra of the pure humic acid
d d · f 4000 to 400 cm-l were recor e ~n the range o The bands
observed in the spectra were assigned to respective
functional troups. On the ·basis of the IR spectra, the
presence of -OH, -COO , amide, and thioamide groups were
indicated in the humic acid.
The bac·terial count in the Kanhar variety of paddy
soil was determined by the standard plate count method. Prior
to the plate count determination of the soil bacteria, the
environmental conditions of the soil (depth, moisture, oxygen
level, temp., pH, organic matter, inorganic nutrients, and
the season of soil collection) were also determined. The
plate count of the bacteria was found to be 20 x 10 6 /y soil.
The order of the count was found to be in agreement with that
reported elsewhere.
75
REFERENCES
1. Brady N.,"The Nature and Properties of Soils", (8th edn.) McMillan Publishing Co., Inc., New York (1978) 145.
2. Briggs D., "Soils", Nutterworth & Co.Ltd.,London (1977), 51-129.
3. Katre R.K., "Soils of Chhattisgarh Region", Indira Gandhi Krishi Vishwa Vidyalaya Report ( 1989).
4. Kanwar J.S., "Soil Fertility Theory and Practice", Indian Council of Agricultural Research, New Delhi (1976).
5. Bear F.E.,"Chemistry of the Soil",(2nd edn,),Oxford & IBH Publishing Co, New Delhi (1964), 78-160.
6. Swindale L.D. and M.L.jackson, Trans International Society of Soil Science, 6th Congress, Paris 5, ( 1956), 233-239.
7. Daniels R.B., G.H.Simonson and R.L.Handy, Soil Science, 91 ( 1961)' 378-382.
B. Schwertmann U., Neues Jb Miner., 93 (1959), 67-86.
9. Soileau J.M., and R.J.Cracken, "Agronomy Abstract", American Society of Agronomy; Madison, (1962).
10. Jackson M.l., "Soil Chemical Analysis", Prentice Hall of Indian Pvt. Ltd., New Delhi (1967).
11. Loveday J., "Methods for Analysis of Irrigated Soils", Commonwealth Agricult~ral Bureaux,Clayto~. (1974).
12. Page A.L., (Ed.), "Method of Soil Analysis", Sail Science Society of America Inc., Madison,
(Part II) (1982).
13. Bassett J., R.C.Denney, G.H. Jeffery, J. Mendham, "Text Book of Quantitative Inorganic Analysis, (4th edn.), ELBS and Langman, Essex, (1989) ·.
14. Snell F.D. Analysis'1
,
(1959).
and C.T. Snell, (Val.II A), D.Van
"Colorimetric Nostrand Co.,
11ethods of New Jersey,
15. Das A.K., "A Text Inorganic Chemistry", Delhi ( 1990).
Book CBS
on Medical Publishers
Aspects of Bio& Distributors,
16. Tisdale L.S., N.L.Werner, "Soil Fertility and Fertilizers'" The 11cMillan Company, New York, (1956).
17. Bromfield S.M., V.B.D.Skirman, "Biological Oxidation of Manganese in Soil", Soil Science, 69, (1950), 337-348.
76
18. McLaren A.D. and Edward Arnold Ltd., York, (1967).
G.H.Peterson, "Soil Biochemistry", London, and Marcel Dekker Inc •• New
19. Agrawal R.R ..• "Soil Fertility in India", Asia PUblishing House, New Delhi, ( 1967).
20. Sopher C. D., "Soils Publishing Company Inc.,
and Soil Virginia,
Management", (1978).
Reston
21. Webley D.M. and Duff R.B •• Plant and Soil, 22, 307 (1978)
22. Hunter J.G. and O.Vergano, Ann.Appl.Biol., 39, 279, ( 1952).
23. Kanwar J.S. and N.S. Randhawa, Micronutrient Research in Soils and Plants in India :A Review, ( 1967).
24. Taylor R.N., R.M., McKenzie and K.Norrish, Aust.J.Soil Research, 4, 29, (1966).
25. Chatt J •• Proc.Roy.Soc., 172 B, 327 (1969).
26. Delwiche c.c. and C.M.Johnson, Plant Physiology, 36, 73, (1961).
27. Ozanne P.G., E.A.N., Greenwood and T.C.Shaw.,Aust.J.Agric Res., 14, 39, (1964).
28. Jones L.H.P., J.Soil Sci., 8, 313 (1957).
29. Trobisch S. and G.Schilling, Chem.el Erde., 23, 91, (1963)
30. Dautil P., Comp.Rend.Acad.Agric., 947, (1967)
31. Swaine D.J., Commonw.Bur.Soil Sci.Tech.Communs., (1953).
32. Russell E.W., "Soil and Longman, Essex,
Conditions -(1973).
and Plant Growth"~
48,
ELBS
33. Booz Allen Applied Research. Inc •• A Waste Materials, Hazardous Effects and (vol.II}, Report PB-221, 446, Va.Nat. Service, Springfield.
Study of Hazardous Disposal Methods, Tech. Information
34. Gupta S.K. and V.Chenk, "Arsenic Removal by Adsorption". J.Water Pollution Control Federation, (1978), 493.
35. Frost D.V., "Arsenic:Science or Superstition". Food and Nutrition News, (1968).
36. Crafts Control (1933),
A.S., "The Use of Deep Rooted
461-498.
of Arsenical compounds in the Perennial Weeds", 1/ilgardia, 9
37. Crafts A.S., "The Acid Arsenical Method in Weed Control··. J.Amer.Soc.Agron •• 29 (1937), 934-943.
77
38. Ashton F.M. and A.S.Crafts, John Wiley & Sons, New York,
"Mode of Action of Herbicides", (1973).
39. Alexander M., Eastern Ltd.,
"Introduction to Soil Microbiology", New Delhi, ( 1978).
Wiley
40. Woolson E.A. and P.C.Kerarney, Environ.Sc.Technol., 7, ( 1973). 47-50.
41. McBride B.C. and R.S.Wolfe, Biochemistry, 10, (1971), 4312-4317.
42. Shukla S.S. and H.V.Leland, J.Water Pollut.Control Fed., 45 (1973), 1319.
43. Lazms A.L., E. Lorange and J.P.Lodge, Environ.Sci.Technol 4, ( 1970). 50.
44. Matsunaga S., M.Kohno, K.Nagai, T.Nakayama and H.Ohide, Arch.Kohno.Clin., Med.Res.Inst., 1, (1962), 1.
45. Kohno M., H.Sugihara, T.Nakayama and N.Hagino, Clin. Nutr 9, (2}, I, (1956).
46. Lead, National Academy of Science, ANON, Washington, D.C. (1972).
47. Mahaggey K.R. and P.E.Liussen, Environ.Health Perspect., 12, (1975), 63.
48. Darn C.R.,J.O.Pierce,G.R.Chase and P.E.Phillips, Environ. Res., 9, (1975), 159.
49. Lisk D.J., A.K.Furr, D.R.Merten,W.H.Gutemann and C.A. Bache, J.Agr.Food Chern., 22 (1974), 954.
50. Irwin J.C.and L.H.Karstad, J.Wildl.Dis., 8, (1972). 149.
51. Muller P.K. adn R.L.Staneiy, "Origin of Lead in Surface Vegetation", ATHL Report No.87, State of California, Department of Public Health, Air and Industrial Hygiene Laboratory, Berkeley (1970).
52. Hammond P.B. and A.L.Aronson, "Lead Poisoning in Cattle and Horsesin the Vicinity of a Smelter", Ann.N.Y.Acad.Sci 111, (1964), 595-611.
53. Shacklette H.T., J.C.Iiamilton, J.G.Boerengen and J./1.Bowes. ''Analyses of Plants Collected Throughout the Conterminous United States at. Intervals of about 50 miles, in connection with the Soil Study", U.S.Geol.Survey Prof. Paper 574-D, (1971).
54. Connor J,J., 1/.T.Shacklette, and J.A.Erdmann,U.S. Gcol. Sruvey Prot. Paper 750-B, ( 1971).
55. Shack e 1 e t t e II. T. , Connor J. J. , U. S • G eo 1. S u v e y pro f. )'a i· c r • 574-E, (1960).
78
56. Haupt H.J., F.Hurber,J.Gmehling, "Zerset Zungs-reaktion von Dimethylbleichlorid in Losungen mit undohne Fremdsalzzusatz", Z.Anorg.Allg.Chem., (1972), 390.
57. Schroeder H.A., "The Poison Around Us", Indiana
58.
University Press, Bloomington (1974).
Buck W.B.,G.D.Osweiler and G.A.van Diagnostic Veterinary Toxicology", Hunt, Dubuque, Iowa (1973).
Gelder, "Clinical and (Ist edn.). Kendall/
59. Dewey J.F. and R.F. Pendleton, Agrichemical Age, 14, (4), ( 1971).
60 Selikoff I.J., Environ.Res:, 4 (1971)
61. Schacklette H.T., U.S.Geol.Survey Prof.Paper 713, (1970)
62. Berlin M. and S.Gibson, Arch.Environ.Health, 6, (1963), 61 7.
63. Rothstein A. and A.D.Hayes, J.Pharmacol.Exp.Ther., 130, (1960). 166.
64. Jensen S. and Jernelow, "Biological Methylation of Mercury in Aquatic Organisms", Nature, 233, (1969), 753.
65. Vallee Mercury, 91.
B.L. and Cadmium,
D.D. Ulmer, "Biochemical Effects of and Lead, Ann. Rev.Biochem., 41, (1972)
66. Yuhuan Lin, K.Demeng and L.Cbing, I., "Species Distribution of Mercury in Ji Yun River Sediments", Huanjing Huaxue, 2, ( 1980) 10.
67. Jawald M., F.Ingman, Extraction Studies on Methylmercury (II) and Ions", Acta Chem.Scand.,
D.H.Liem and T.Wallin, tbe Complex Formation Bromide, Chloride, and A 32, (1978), 7.
"Solvent Between Nitrate
68. Wallace,R.A., W.Fulkorson, W.D.Shults and W.S. "Mercury {n the Environment-The Human Element" Oak National Laboratory Report, NSF-EP-1, National Infor.Serv., Springfield, Virginia, (1971).
Lyon, Ridge Tech.
69. "/>lercury and the Environment", OECD Publn., Paris, (1974)
70. Pang.S.W.,O.K.Qui and J.F.Sun,"Sequential Chemical Extraction for Speciation of Mercury in River", /lanjing Kexue Xeubao, 1, ( 1981), 234.
71. Xu K. and A.Peng, "Computation of Mercury Species in Downstream J Yun River", /luanjing lluaxue, 3 (1984), 19.
72. Reimers R.S. and P.A.Krenkel, "Kinetics Adsorption and Desorption in Sediments", Control Fed., 46, (1974), 352.
of /·Jercury J.Water Poll.
79
73. Li.C.S. and C. I. Liu, "Adsorption of Mercury in Fresh Water", Huanjing Huaxue, 1, ( 1982) 1 304.
74. Peng A., W.H. Wang, Humic Acid from Ji (1981), 126.
"Extraction and Characterisation Yun River", Huanjing Kexue Xuebao.,
of 1,
75. Wang S.H.,T.C.Hao, And G.O.Liu, "Release Rate of Methyl mercury form River Sediment", Huanjing Kexue, 2, ( 1978), 11.
76. Page A.L. and Bingham F.T., Residue Reviews, 48, (1973),
"Cadmium in 1-44.
the Environment",
77. Waketa H. and R.A. Schmitt, Wedepohl,
"Cadium K.H.),
in Hand Book of Springor Verlag,
78.
79.
Geochemistry, (Ed. Berlin, (1970).
Oehme F.W.,"Toxicology Environment", (Part I), (1978).
of the Marcel
heavy Dekker
Metal in the Inc., New York,
Thornton I. and A .£.Marples, "The Distance Derived from Geochemical and Industrial Agricultural Soils and Pasture Herbage in Britain", Proceedings the Second International of Cadmium in the Environment, Cannes, ( 1979).
of Cadmium Sources in
Parts of Conference
80. Williams C.H. and D.J.David, "The Accumulation in the Soil of Cadmium, Residues from Phosphate Fertilizers and Their Effects on the Cadmium Contents of Plants", Soil Sci., 121, (1976), 86-93.
81. "Cadmium in the Environment", IRCC Publn., London, ( 1973)
82. Thornton !.,"Background Levels of Heavy and Plants, Proceedings Conference on Contaminated Land", Eastbourne, ( 1979).
t1etals in Soils Reclamation of
83. Jarvis S.c., L.Jones and M.J.Hopper, "Cadmium uptake from Solution and Its Transport from Roots to Shoots", Plant and Soil, 44, ( 1976), 179-191.
84. John M.K., "Cadmium uptake Influenced by Various Environmental Pollution, 4,
by Eight Soil Level (1973), 7-15.
Food of
Crops as Cadmium",
85. Stenstrom T. and H.Lonsjo, "Cadmium Availability to Wheat: A Study with Radioactive Tracers Under Field Conditions'', Ambia., 3, (1974), 87-90.
86. Backett P.H.T. Toxic Elements 95-106.
and R.D. Davis, "Upper Critical Levels of in Plants", New Phytologist. 79, (1977),
87. Davis R.D., P.H.T.Backett and E.Wollen,"Critical Le1•els of Twenty Potentially Toxic Elements in Youn~ Sprin~ Barley", Plant and Soil, 49, (1978), 395-408.
80
88. Boggess S.F., S.Willavize and Koeppe D.E., "Differential Response of Soya bean varieties of Soil Cadmium", Agronomy Journal, 70 ( 1978), 756-760.
89. Hubbard A. W. and D.G.Lindsay, "Dietary Intake of Heavy Metals by Consumers in the U.K., Proceedings Con f. on Management and Control of Heavy Metals in the Environment", Edinburgh, (1979).
90. WHO Publn.,"Evaluation of Certain Food Additives and the Contaminants Mercury, Lead and Cadmium", WHO Technical Report Series no.505, WHO Geneva, (1972).
91. "Critria of Facility and 44, ( 1979).
Classification Practices", EPA
of Solid Waste Disposal Publn., Federal Register,
92. Tsuchiya K., "Causation of Ouch-ouch Disease", An of Medicine, 18, (1969), 181. Inroductory Review, Keio J.
93. Tsuchiya K., "Cadmium Studies in Japan:A Review", £levier North Holland Biomedical press, Amsterdam, ( 1978).
94. Kazantzis G., F.Flynn, J.Spowage and G.Troh, Tubular Malfunction and Pulmonary Emphysema in Pigment Workers", Quarterly J. of Medicine, 32, 165-192.
"Renal Cadmium (1963),
95. Lauwerys R.R., J.P.Buchet, H.A.Roels, J.Brouwerys and D.Stanescu, "Epidimiological Survey of Workers Exposed to Cadmium", Archives of Environment Health, 18, (1974), 145-148.
96. Kauanaugh K. and D.F.Evans, ~Raman and Infrared Spectra of Methyl Cadmium Halidesand Related Compounds, J.Chem.Soc. (A), (1969), 2890.
97. Robinson J.W. and E.L. Kiesel, "Methylation of Cadmium with Vitamin B:A Possible Method of Detoxification", J.Environ.Sci.Health, (A). 16, (1981). 341.
98. Tang H.X., H.B., Xue, "Adsorption Characteristics of Cadmium Pollutants on Chines<; Clay Minerals", Huanjing Kexue Xuebao, 1, (1981), 140.
99. Tang H.X. and H.B.Xue, "Study on f1ulticomponent Adsorption Model fo Aquatic Sediments with a Sequential Chemical Separation Procedure", Huanjing Kexue Xuebao, 2, (1982), 292.
100. Turner M.A., "Effect of Cadmium Treatment on Cadmium and Zinc uptake by Selected Vegetable Species", J.Environ. Qual., 2, ( 1973), 118.
101. Fukushima M., A. Ishizaki, f1.Sakamoto and J.Kobayashi, Jap.J.IIyg., 28 (1973), 406.
102.
103.
104.
105.
106.
107
108.
109.
110.
111.
112.
113.
114.
115.
116.
117.
118.
11 9.
Fukushima M., "New Methods in Environmental Chemistry and Toxicology", Proceedings International Symposium on Ecological Chemistry, Susono, {Nov., 1973).
Kobayashi J. and s Muramoto, Jap.J.Hyg., 24 (1969), 66, 26, (1971), 170.
Hagiono N., J.Kobayashi, Jap.J.Hyg., 23, {1968), 196
Christian G.D., E.C.Knoblock,W.L.Purdy and W.Mertz, Biochem.Biophys.Acta, 66, 91963), 420.
Donaldson R.M.and R.F.Barrearas, J.Lab.Clin.Med., 68 91966), 484.
Gray S.J. and K.Sterling,J.Clin.Invest,29 (1950), 1604
S c h c k 1 e t t e H. T. ; H. I. Sauer and A . T. M i c s·c h, U. S. G eo 1. Survey Prof.Paper 574-C, 1970, 39.
McMurtrey j.D. and W.O.Robinson, "Year Book of Agriculture", U.S.Dept.Agr., (1938), 807-829.
"Chromium", NAS Publn.Washington,D.C., (1974).
Mertz W., "The Essential Trace Elements", Science, 213 (1981), 1332.
Kent N.L. and R .A .McChance, Biochem. J. ' 35, (1941), 877.
Kent N. L. and R.A.McChance, Biochem. J.' 35 {1941) 837.
Schroeder H.A. and J.J.Balassa, J.Chronic Dis., 15, (1961), 51.
Bertrand G. and M.Macheboeuf. C.R.Acad. Sci., . 180, {1925), 1380.
Bertrand G. and M.Macheboeuf, C.R.Acad.Sci., 180 {1925), 1993. Bertrand G. and M.Macheboeuf. C.R.Acad.Sci., 182 {1926), 1504.
Eichhorn G.L., Nature, 194, {1962), 474.
81
Connor J.J. Paper 574-F,
and JJ.T. Shacklette, {1975). 168.
U.S.Geol.Survey Prof
120 Erdman J.A .. II.A. Shacklette and J.R.Keith,U.S.Geol. Survey Prof. Paper 954-C, { 1976), 87.
121.
122.
123.
124.
125.
126.
12 7.
128.
129.
130.
82
Fuge R. and K.H.James, "Trace Metal Concentrations in Brown Seaweeds, Cardigan Bag, Wales", Har.Chem., 1, ( 1973). 281.
Richard J., B.Thompson, H.George, P.Lazzy, "Analysis of Selected Elements in Atmospheric Particulate Hatter by Atomic Absorption", Atomic Absorp. News Letter, 9 (3), (1970).
Varian Publn., "Analytical Method of Flame Spectroscopy" Varian Publication No.85-100009-00, Springwale, (June, 1978).
Van Loon J:c •• "Analytical scopy Selected Methods", ( 1980). 60-70.
Atomic Absorption SpectraAcademic Press New York,
APHA-AWWA-WPCF, "Standard Methods for the Examination of Water and Waste Water", (14th edn.), American Public Health Association, Washington, D.C., (1976).
Parsons J.W. and J.Tinsley,Soil Sci., 92 (1961), 46.
Mehta N.C., P.Dubach and H.Deuel, Z.Pfl.Ernahr., 102 ( 1963). 128.
Laren Me. and G.H.Peterson (ed.). "Soil Biochemistry", Marcel Dekker Inc •• New York, ( 1966).
Gieseking J.E., (ed.), "Soil Organic Components", (Vol.1), Springer-Vorlag Inc., New York (1975)
Theng B.K.G. Bumic Acids",
and J. R. H. Wake. "Infrared Spec truro Soil Sci., 102, (1966), 70-72.
of
131 Prasad B. and M.K.Sinha, "Properties of Poultry litter Humic Acid Fractions and Their metal Complexes", Plant and Soil, 63, (1981), 439-448.
132.
133.
134.
135.
136.
Grace D., B.Khar, B.Prasad, M.K.Sinha and S.B. Pandey, "Interaction of Metal Ions with Fulvic and Humic Acids Isolated from· Forest and Cultivated Soils of Meghalaya Sti!te, Ind.J.Forestry. 8, (3) (1985). 213-2J9.
Suzuki I., Bull.Chem.Soc.Japan, 35, (1962). 1286.
Rao C.N.R., "Chemical Spectroscopy", Academic
Applications of Infrared Press, New York & Longan,
(1963), 260-263.
Hishutsin E.N., "The Law of Zonality and the Microbial Association of the Soil", 19, (1956), 333-392.
the Study of Soils Fert .•
Stare A., "Hikrobiologischc Untersuchungen Einigcr Podsoliger Boden Kroaticns", Arch.Hikrobiol.. 1:. (1942), 329-352.
13 7.
138.
139.
14 0.
Lochhead A.G. and F.E. Chase, "Qualitative Studies of Soil Micro-organisms, V.Nutritional Requirements of the Predominant Bacterial Flora", Soil Sci.,55, (1943) 18S-19S.
Hagedron c., "Influence on Soil Acidity on Streptomyces Populations Inhibiting Forest Soils", Appl.Environ. Microbial., 32, (1976), 368-375.
Schmidt E.L., Among Modern 4S1-4S4.
"The Traditional Plate Count Method:Chairman's Summary",
Technique (1973),
Saxena M.M., "Environmental Analysis, Water, Soil and Air, Agro Botanical Publishers, India, Bikaner, ( 1978)
83