Embed Size (px)
Citation preview
1
CHAPTER 2
THE AUTOMOBILE INDUSTRY IN AND BEYOND THE CRISIS
Introduction and summary
The automobile industry
has been severely hit by
the crisis
The automobile industry is among the sectors that have been hit most
by the recession. Demand for cars fell sharply, accentuating the difficulties
of excess production capacity already faced before the crisis and deepening
the economic downturn in major car-producing countries. Relative to the
general downturn, the decline in car sales was nonetheless not deeper than
what was observed in the past.
The automobile
industry…
This chapter considers the role of the automobile industry in the
current cycle. It first examines the role of the industry in the economy,
before analysing the relation between the automobile and business cycles.
After casting some light on the sources of the collapse in car sales at the
start of the crisis, the chapter discusses the policy measures, in particular
car scrapping programmes, put in place to support the automobile industry.
Finally it investigates the short and medium-term prospects for the
automobile industry.
The main results are the following:
…is economically
important… The size of the automobile industry relative to overall activity is
small, but because of its strong linkages with other parts of the
economy, the final impact of a shock in the industry on the
broader economy is sizable.
… and intertwined with
business cycles The automobile and business cycles usually move in line with
each other but the amplitude of the cycle is higher in the
automobile industry. The volatility of the automobile industry is
also higher than that of the manufacturing industries as a whole.
It has suffered from
constrained credit in the
crisis…
Evidence for the United States and Canada suggests that the
reduction in car sales since mid-2008 has been magnified by the
lack of access to credit, leading many households to postpone
their car purchases. This implies that continued improvement in
financial market conditions could provide an impetus to car sales.
2
… but benefited from
government support… Government support to the automobile industry has been provided
in a variety of forms, including subsidies to firms and direct
involvement in industry restructuring plans. These measures are
likely to impede the structural changes the industry will need to
go through in the years to come.
… including car
scrapping schemes… Many countries have introduced car scrapping schemes to cushion
the overall downturn in economic activity, boosting sales in the
short term. However, crowding-out effects whereby the demand
for new cars dampens the demand for other products are likely to
have lowered their final impact on economic activity. As these
programmes are temporary and consist mostly in a shift of
purchases from the future to the present, the surge in sales is
likely to be reversed after the schemes end. Evidence on the
timing and the magnitude of this “payback effect” varies but
suggests that over the short term, car sales may be temporarily
depressed by the termination of scrapping programmes in many
countries. At the same time, these schemes do not appear to be
cost-effective instruments to reduce greenhouse gas emissions.
… and is set to rebound
in many countries… As actual sales are well below trend, a rebound in car sales is
likely in North America, Japan and the United Kingdom. In
contrast, car sales in Germany have been pushed significantly
above trend and may weaken going forward.
… though medium-term
sales trends are likely to
be divergent across
regions
Over the medium term, regions within and outside the OECD are
likely to experience diverse trends in car sales. In mature markets,
such as Europe and North America, trend sales are likely to
remain stagnant. By contrast, rapid increases are foreseen in
China, which is already now the second largest market for cars. A
rapid increase is also projected in India. Medium-term projections
suggest that capacity exceeds trend sales by around 20% in the
five largest Western European markets considered as a whole.
Without an adjustment in capacity, these countries would need to
ensure an ongoing strong export performance. By contrast, in
North America, capacity is projected to be around 65% of trend
sales. Automakers in the NAFTA area would thus need to halt
their decline in domestic market share or to rely increasingly on
exports in order to avoid excess capacity. The fortunes of Korean
and Japanese auto firms are heavily tied to world markets as they
export a large part of their production. Maintaining their high
levels of capacity utilisation will require them to keep up their
strong export performance.
3
The importance of the automobile industry in the economy
The industry is more
important than its size
implies
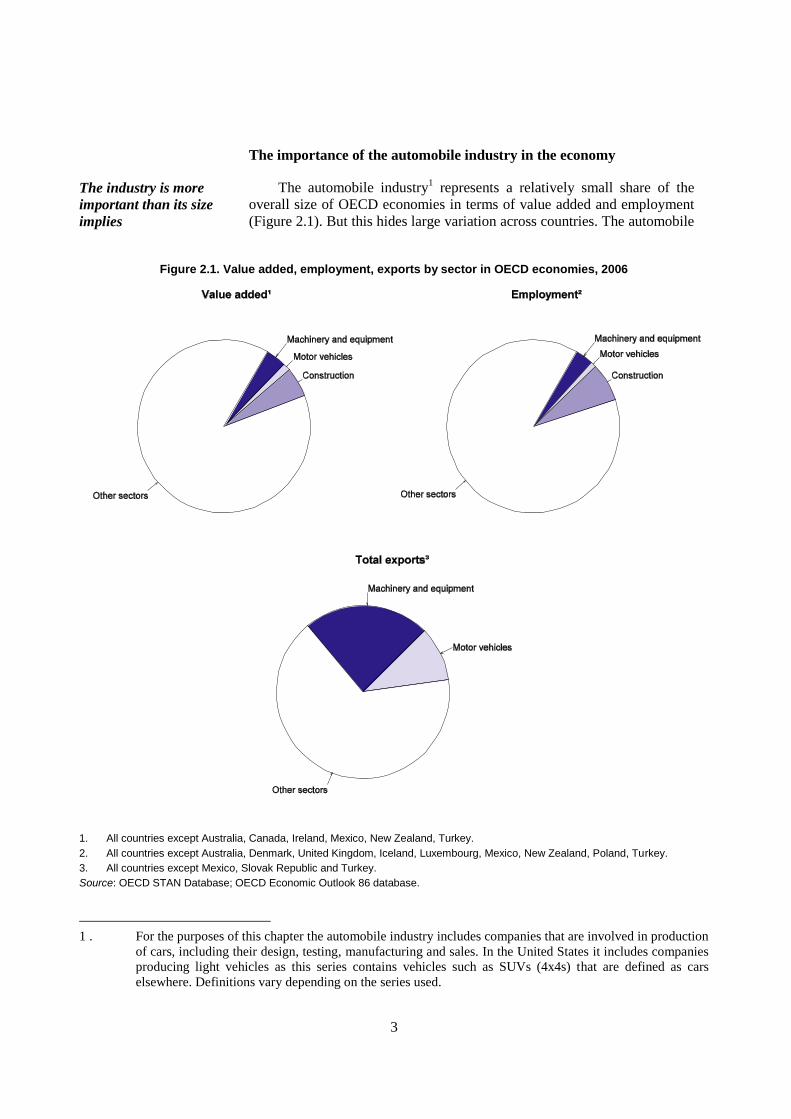
The automobile industry1 represents a relatively small share of the
overall size of OECD economies in terms of value added and employment
(Figure 2.1). But this hides large variation across countries. The automobile
Figure 2.1. Value added, employment, exports by sector in OECD economies, 2006
1. All countries except Australia, Canada, Ireland, Mexico, New Zealand, Turkey.
2. All countries except Australia, Denmark, United Kingdom, Iceland, Luxembourg, Mexico, New Zealand, Poland, Turkey.
3. All countries except Mexico, Slovak Republic and Turkey.
Source: OECD STAN Database; OECD Economic Outlook 86 database.
1 . For the purposes of this chapter the automobile industry includes companies that are involved in production
of cars, including their design, testing, manufacturing and sales. In the United States it includes companies
producing light vehicles as this series contains vehicles such as SUVs (4x4s) that are defined as cars
elsewhere. Definitions vary depending on the series used.
4
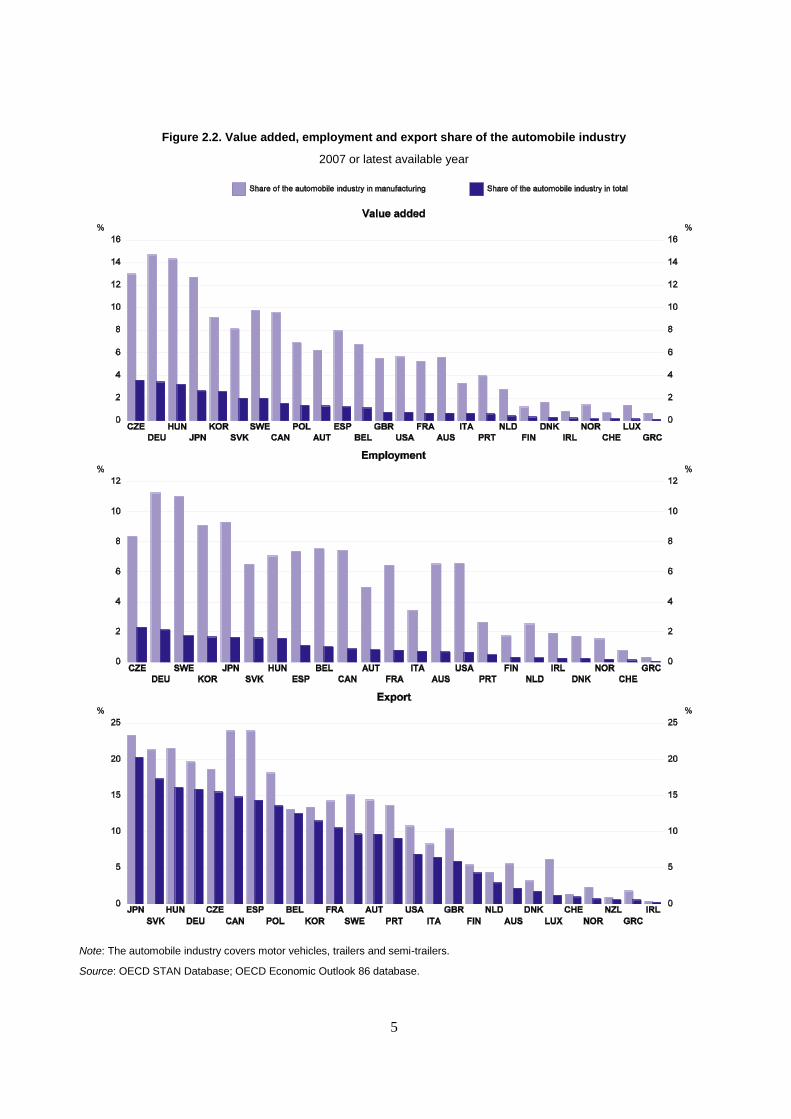
industry accounts for almost 4% of total output in the Czech Republic and
Germany, while it is almost non-existent in several countries (Figure 2.2).
Over 2% of employed people work in the industry in the large automobile-
producing countries. These numbers understate the size of the automobile-
related workforce, as a higher number of people are employed in the
automobile value chain e.g. both downstream, in services such as car
financing, insurance and maintenance, and upstream, in steel and transport.2
In many car-producing countries a large share of output is exported.
Automobile exports represent more than 20% of manufacturing exports in
Japan, the Slovak Republic, Hungary, Canada and Spain, and account for
more than or close to 15% of total exports in these countries. The current
structure of the industry is the result of a long process of structural change
(Box 2.1), which is likely to have further to go (see below).
Box 2.1. Some specific features of the automobile industry
The industry is capital intensive, with a relatively high capital-to-labour ratio, and in many countries a large share of the production is exported.
In recent years, production has been increasingly shifted towards non-OECD regions, in particular Asia. Between 2000 and 2007, the share of the United States and Japan in global production fell from 40 to 30%, while the share of the non-OECD areas increased from producing of one car in ten to one car in five (OECD, 2009). The economic crisis may serve to reinforce and accelerate this trend.
Market saturation in OECD countries, high shipping costs and efforts by automakers to gain market share by locating production where they sell have encouraged these trends. Outsourcing the manufacturing of small automobiles and parts has also been increasing among main car producers. At the same time, the minimum efficient scale of production has increased over time, spurring mergers and acquisitions in order to gain economies of scale.
The resulting economic geography of the industry is complex, with only some segments being fully global (Sturgeon and Van Biesebroeck, 2009). Automakers and part suppliers form buyer-supplier relationships on a global scale. Inter-regional vehicle and parts trade is substantial, but capped by political and operational considerations. Intra-regional trade of finished vehicle and parts is the dominant operational pattern. Domestic production is still very strong in many national markets. Activities such as design or assembly tend to be geographically concentrated in clusters of specialised activity within countries.
The industry has been in a difficult situation for some years, especially the three big American producers which have traditionally been specialised in larger vehicles. The rise in oil prices up to mid-2008 drove material costs higher and also shifted consumer preferences towards smaller vehicles. High debt burdens, huge fixed capital and labour costs, as well as sizable pension and health care commitments to retirees added to their difficulties. Finally, strong vehicle sales in the previous decade, fuelled by discounts, created saturated markets, especially in the United States.
2 . Input-output tables allow the quantification of the size of multiplier effects from the automobile industry to
the rest of the economy. These multipliers combine information on both domestic and import inter-sectoral
linkages. They are estimated to be close to three in G7 countries, i.e. a $1 increase in the value added
delivered by the automobile industry would increase output by $3. This level of multiplier is at or close to
the top of what is observed in other industries, and always stronger than the average across industry (which
is estimated to be at 2.2). Focusing on domestic linkages would lead to smaller multipliers but, with the
exception of the United Kingdom and Canada, the automobile industry would continue to display stronger
multipliers than the average across industry.
5
Figure 2.2. Value added, employment and export share of the automobile industry
2007 or latest available year
Note: The automobile industry covers motor vehicles, trailers and semi-trailers.
Source: OECD STAN Database; OECD Economic Outlook 86 database.
6
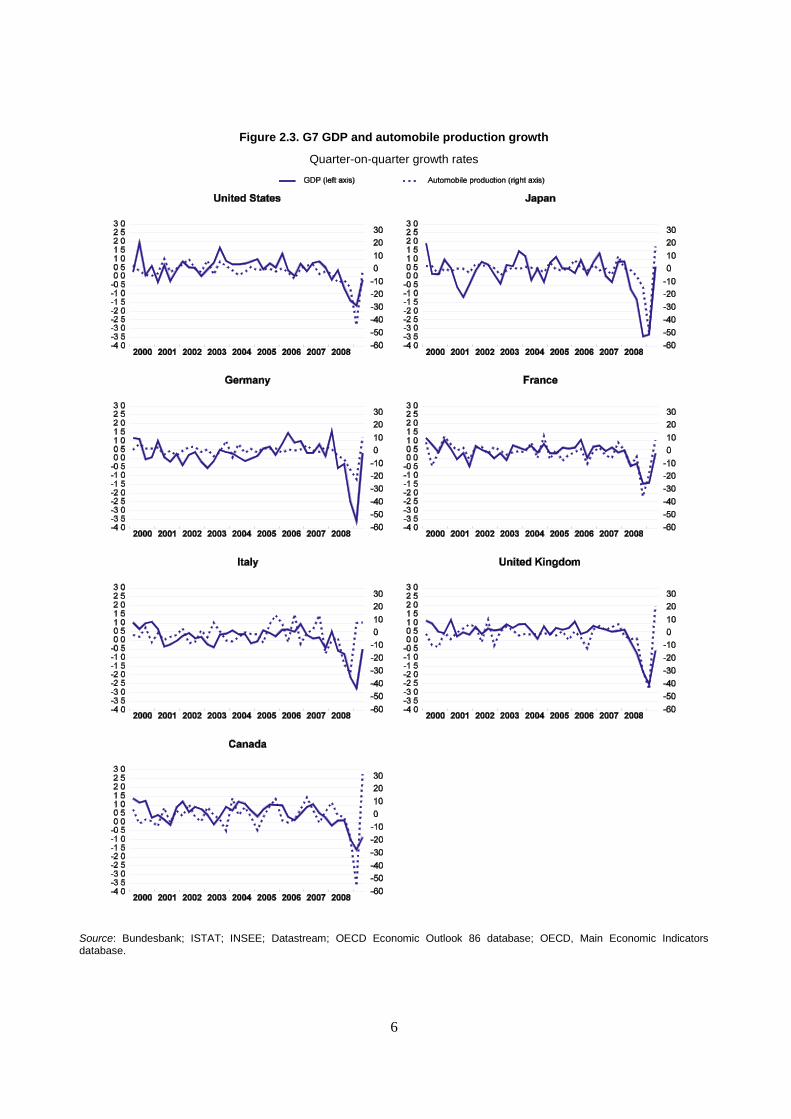
Figure 2.3. G7 GDP and automobile production growth
Quarter-on-quarter growth rates
Source: Bundesbank; ISTAT; INSEE; Datastream; OECD Economic Outlook 86 database; OECD, Main Economic Indicators database.
7
How closely related are the automobile and the business cycles?
The automobile and
business cycles are
intertwined
Economic activity in the automobile industry usually moves in line
with the overall business cycle, the relationship being particularly stronger
in countries such as the United States, Japan and Germany (Figure 2.3).
The link may even have strengthened in the recent period. That said, the
two cycles can become disconnected at times, for instance due to sector-
specific developments in the automobile industry.
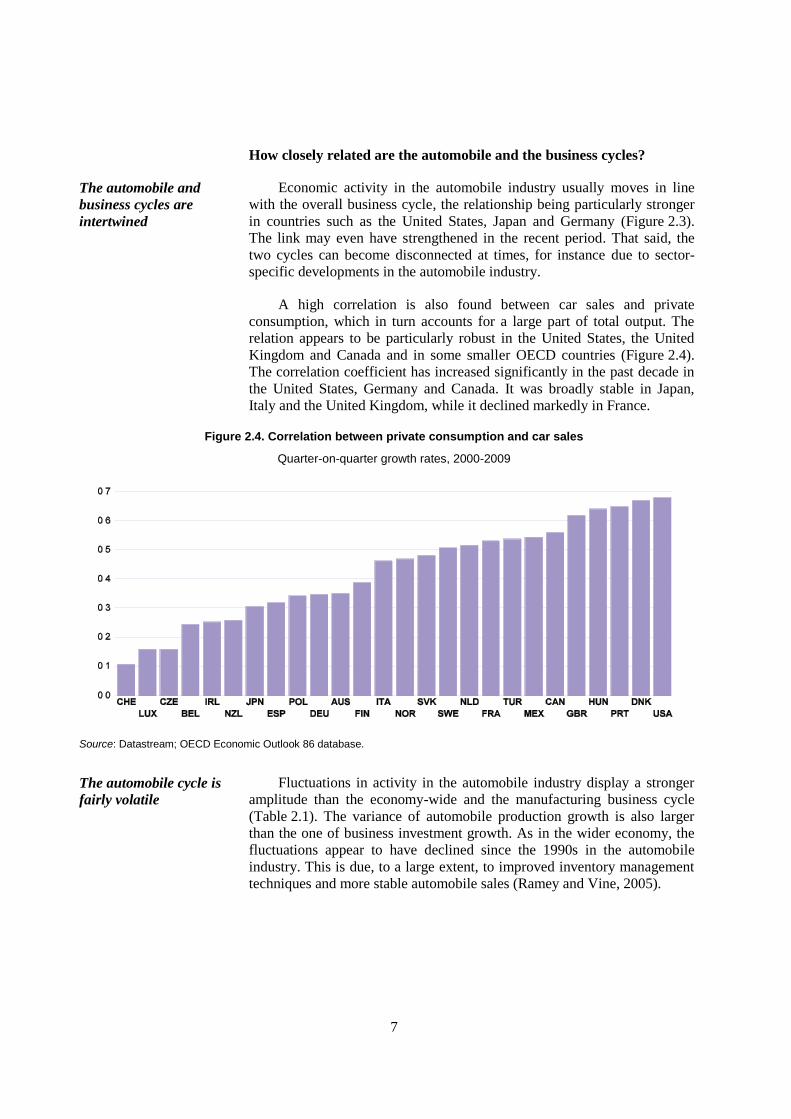
A high correlation is also found between car sales and private
consumption, which in turn accounts for a large part of total output. The
relation appears to be particularly robust in the United States, the United
Kingdom and Canada and in some smaller OECD countries (Figure 2.4).
The correlation coefficient has increased significantly in the past decade in
the United States, Germany and Canada. It was broadly stable in Japan,
Italy and the United Kingdom, while it declined markedly in France.
Figure 2.4. Correlation between private consumption and car sales
Quarter-on-quarter growth rates, 2000-2009
Source: Datastream; OECD Economic Outlook 86 database.
The automobile cycle is
fairly volatile
Fluctuations in activity in the automobile industry display a stronger
amplitude than the economy-wide and the manufacturing business cycle
(Table 2.1). The variance of automobile production growth is also larger
than the one of business investment growth. As in the wider economy, the
fluctuations appear to have declined since the 1990s in the automobile
industry. This is due, to a large extent, to improved inventory management
techniques and more stable automobile sales (Ramey and Vine, 2005).
8
Table 2.1. Automobile production is more volatile than GDP and investment
Standard deviation of quarter-on-quarter growth rates
1960-1980 1980-1990 1990-2000 2000-2007
Automobile
productionGDP
Invest-
ment
Automobile
productionGDP
Invest-
ment
Automobile
productionGDP
Invest-
ment
Automobile
productionGDP
Invest-
ment
United States 10.6 1.0 2.3 10.1 1.0 2.5 6.7 0.5 1.8 3.9 0.5 1.9
Japan 7.7 1.4 4.0 3.1 1.0 2.6 3.5 0.9 3.1 3.2 0.7 2.9
Germany - - - - - 3.9 0.7 2.1 2.8 0.5 2.0
France - 1.3 2.9 5.3 0.5 1.7 5.5 0.5 1.6 4.2 0.4 1.4
United Kingdom 16.7 1.3 3.3 8.3 0.9 4.2 5.4 0.6 2.8 5.4 0.3 10.4
Canada 12.6 0.9 2.7 15.0 1.0 3.2 12.0 0.7 3.2 6.8 0.4 1.9
Source : Bundesbank; INSEE; Datastream; OECD Economic Outlook 86 and Main Economic Indicators.
The automobile industry has been severely affected by the economic
downturn
Car sales collapsed
across the board at the
start of the crisis…
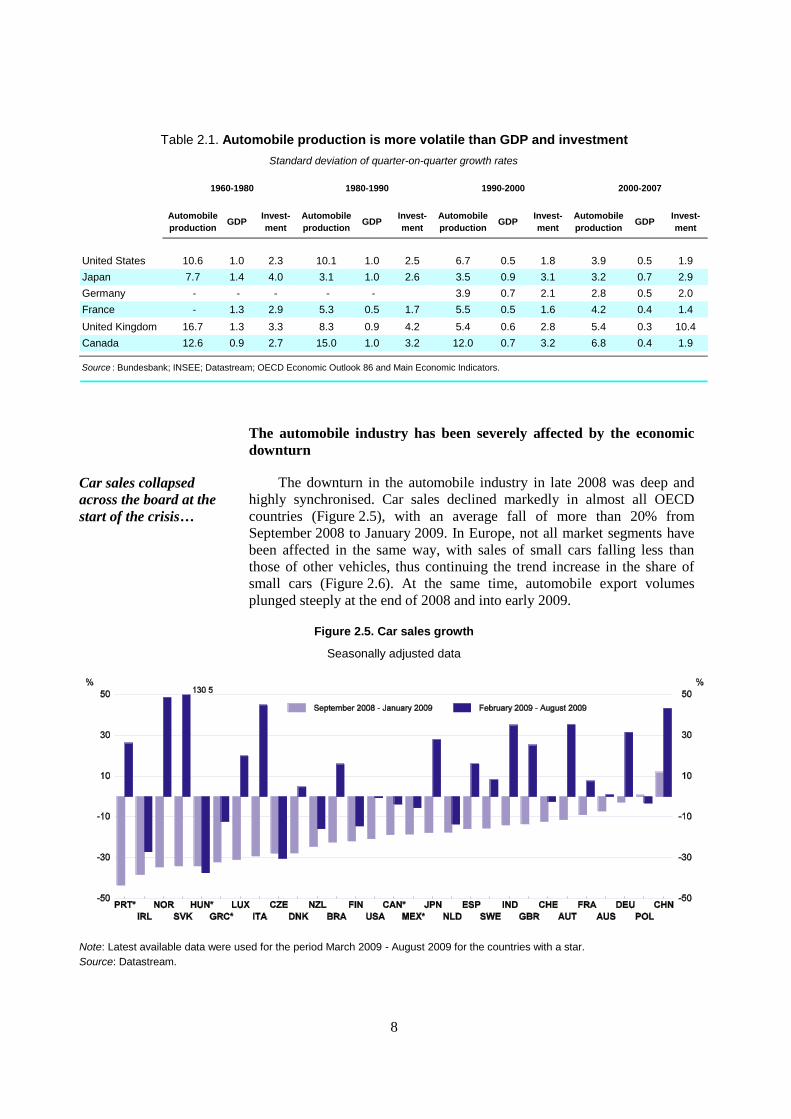
The downturn in the automobile industry in late 2008 was deep and
highly synchronised. Car sales declined markedly in almost all OECD
countries (Figure 2.5), with an average fall of more than 20% from
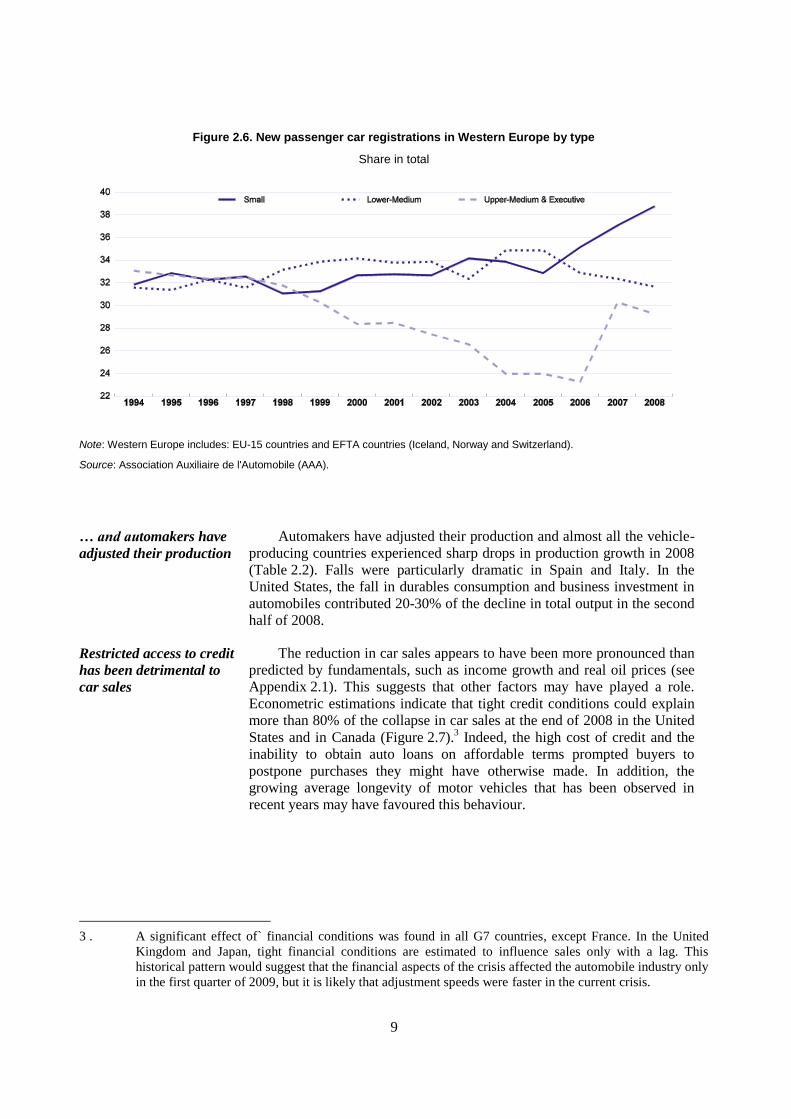
September 2008 to January 2009. In Europe, not all market segments have
been affected in the same way, with sales of small cars falling less than
those of other vehicles, thus continuing the trend increase in the share of
small cars (Figure 2.6). At the same time, automobile export volumes
plunged steeply at the end of 2008 and into early 2009.
Figure 2.5. Car sales growth
Seasonally adjusted data
Note: Latest available data were used for the period March 2009 - August 2009 for the countries with a star.
Source: Datastream.
9
Figure 2.6. New passenger car registrations in Western Europe by type
Share in total
Note: Western Europe includes: EU-15 countries and EFTA countries (Iceland, Norway and Switzerland).
Source: Association Auxiliaire de l'Automobile (AAA).
… and automakers have
adjusted their production
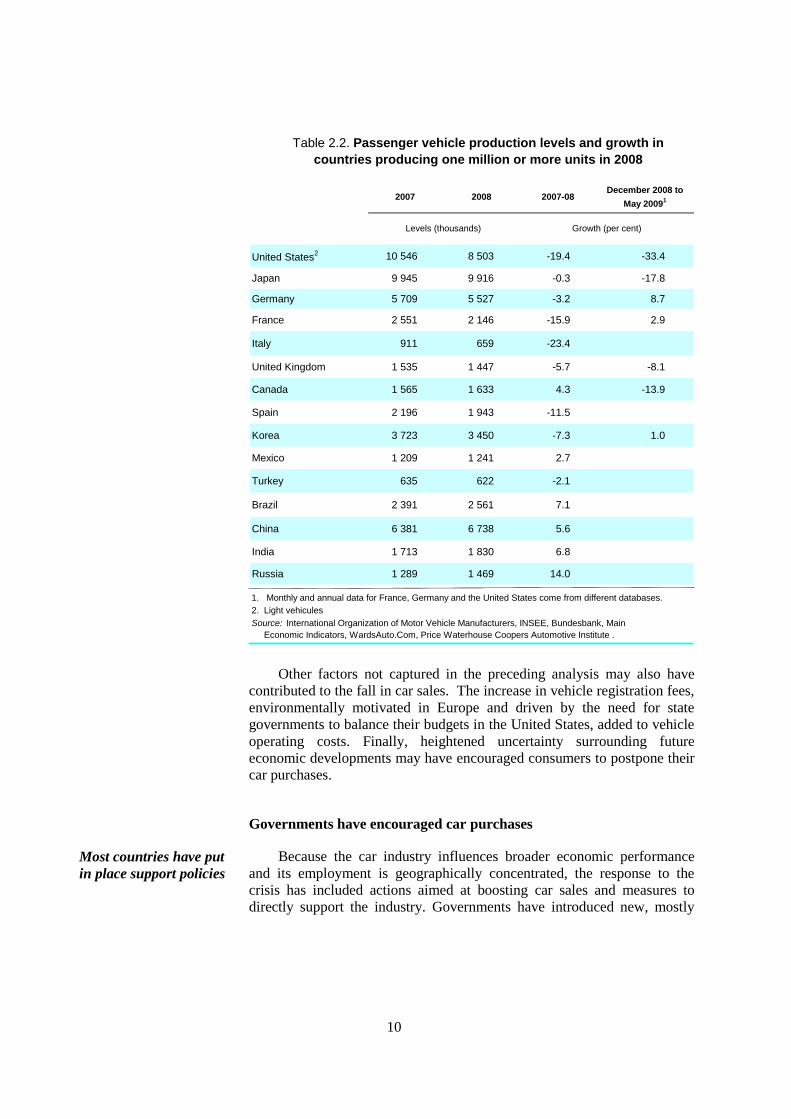
Automakers have adjusted their production and almost all the vehicle-
producing countries experienced sharp drops in production growth in 2008
(Table 2.2). Falls were particularly dramatic in Spain and Italy. In the
United States, the fall in durables consumption and business investment in
automobiles contributed 20-30% of the decline in total output in the second
half of 2008.
Restricted access to credit
has been detrimental to
car sales
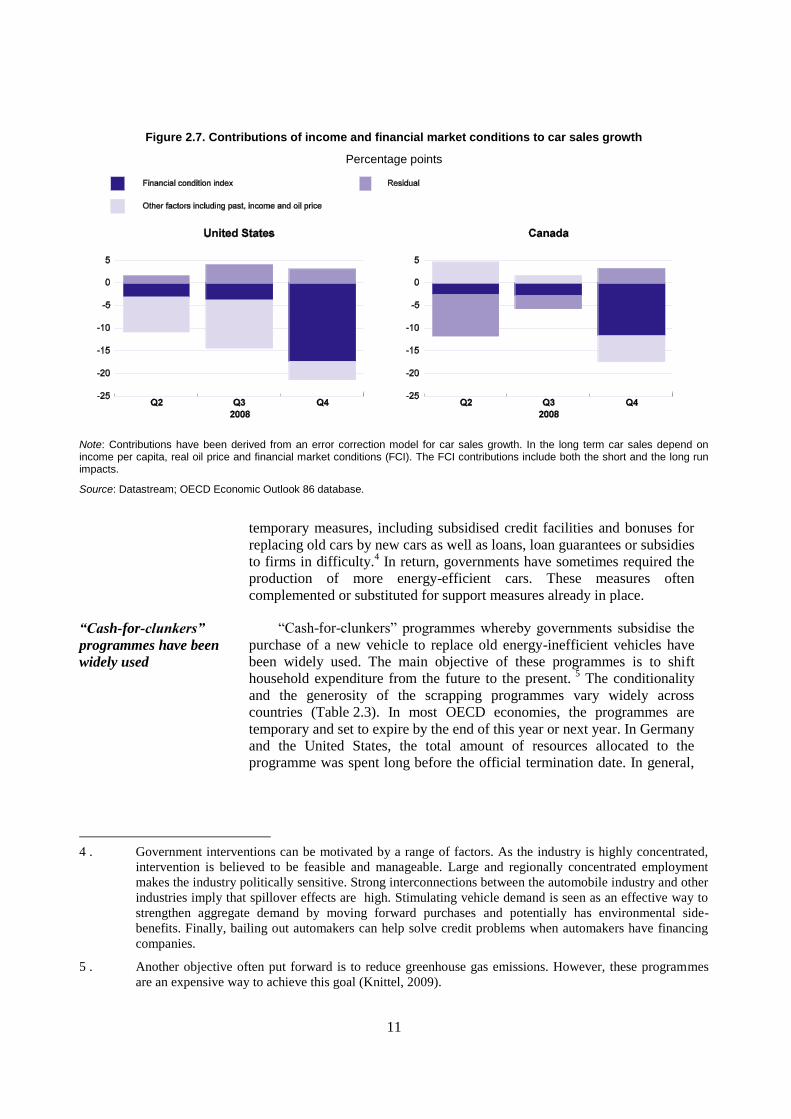
The reduction in car sales appears to have been more pronounced than
predicted by fundamentals, such as income growth and real oil prices (see
Appendix 2.1). This suggests that other factors may have played a role.
Econometric estimations indicate that tight credit conditions could explain
more than 80% of the collapse in car sales at the end of 2008 in the United
States and in Canada (Figure 2.7).3 Indeed, the high cost of credit and the
inability to obtain auto loans on affordable terms prompted buyers to
postpone purchases they might have otherwise made. In addition, the
growing average longevity of motor vehicles that has been observed in
recent years may have favoured this behaviour.
3 . A significant effect of` financial conditions was found in all G7 countries, except France. In the United
Kingdom and Japan, tight financial conditions are estimated to influence sales only with a lag. This
historical pattern would suggest that the financial aspects of the crisis affected the automobile industry only
in the first quarter of 2009, but it is likely that adjustment speeds were faster in the current crisis.
10
Table 2.2. Passenger vehicle production levels and growth in
countries producing one million or more units in 2008
2007 2008 2007-08December 2008 to
May 20091
United States2 10 546 8 503 -19.4 -33.4
Japan 9 945 9 916 -0.3 -17.8
Germany 5 709 5 527 -3.2 8.7
France 2 551 2 146 -15.9 2.9
Italy 911 659 -23.4
United Kingdom 1 535 1 447 -5.7 -8.1
Canada 1 565 1 633 4.3 -13.9
Spain 2 196 1 943 -11.5
Korea 3 723 3 450 -7.3 1.0
Mexico 1 209 1 241 2.7
Turkey 635 622 -2.1
Brazil 2 391 2 561 7.1
China 6 381 6 738 5.6
India 1 713 1 830 6.8
Russia 1 289 1 469 14.0
1. Monthly and annual data for France, Germany and the United States come from different databases.
2. Light vehicules
Source: International Organization of Motor Vehicle Manufacturers, INSEE, Bundesbank, Main
Economic Indicators, WardsAuto.Com, Price Waterhouse Coopers Automotive Institute .
Levels (thousands) Growth (per cent)
Other factors not captured in the preceding analysis may also have
contributed to the fall in car sales. The increase in vehicle registration fees,
environmentally motivated in Europe and driven by the need for state
governments to balance their budgets in the United States, added to vehicle
operating costs. Finally, heightened uncertainty surrounding future
economic developments may have encouraged consumers to postpone their
car purchases.
Governments have encouraged car purchases
Most countries have put
in place support policies
Because the car industry influences broader economic performance
and its employment is geographically concentrated, the response to the
crisis has included actions aimed at boosting car sales and measures to
directly support the industry. Governments have introduced new, mostly
11
Figure 2.7. Contributions of income and financial market conditions to car sales growth
Percentage points
Note: Contributions have been derived from an error correction model for car sales growth. In the long term car sales depend on income per capita, real oil price and financial market conditions (FCI). The FCI contributions include both the short and the long run impacts.
Source: Datastream; OECD Economic Outlook 86 database.
temporary measures, including subsidised credit facilities and bonuses for
replacing old cars by new cars as well as loans, loan guarantees or subsidies
to firms in difficulty.4 In return, governments have sometimes required the
production of more energy-efficient cars. These measures often
complemented or substituted for support measures already in place.
“Cash-for-clunkers”
programmes have been
widely used
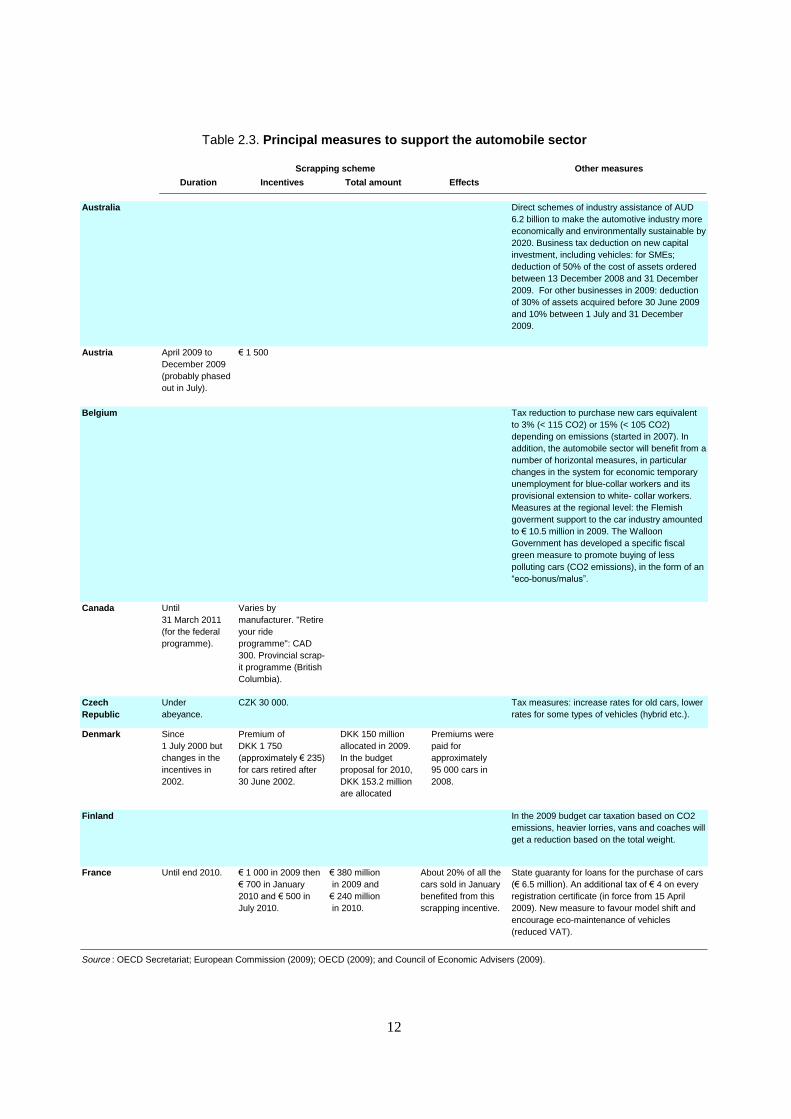
“Cash-for-clunkers” programmes whereby governments subsidise the
purchase of a new vehicle to replace old energy-inefficient vehicles have
been widely used. The main objective of these programmes is to shift
household expenditure from the future to the present. 5
The conditionality
and the generosity of the scrapping programmes vary widely across
countries (Table 2.3). In most OECD economies, the programmes are
temporary and set to expire by the end of this year or next year. In Germany
and the United States, the total amount of resources allocated to the
programme was spent long before the official termination date. In general,
4 . Government interventions can be motivated by a range of factors. As the industry is highly concentrated,
intervention is believed to be feasible and manageable. Large and regionally concentrated employment
makes the industry politically sensitive. Strong interconnections between the automobile industry and other
industries imply that spillover effects are high. Stimulating vehicle demand is seen as an effective way to
strengthen aggregate demand by moving forward purchases and potentially has environmental side-
benefits. Finally, bailing out automakers can help solve credit problems when automakers have financing
companies.
5 . Another objective often put forward is to reduce greenhouse gas emissions. However, these programmes
are an expensive way to achieve this goal (Knittel, 2009).
12
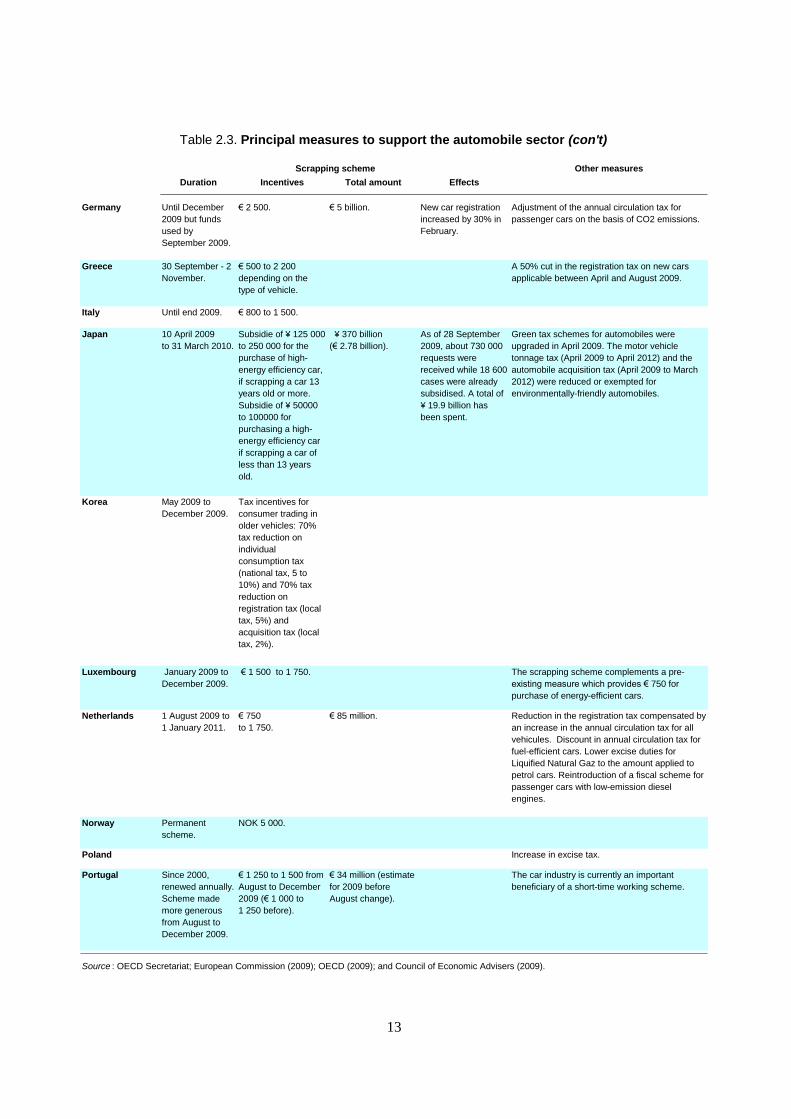
Table 2.3. Principal measures to support the automobile sector
Scrapping scheme Other measures
Duration Incentives Total amount Effects
Australia Direct schemes of industry assistance of AUD
6.2 billion to make the automotive industry more
economically and environmentally sustainable by
2020. Business tax deduction on new capital
investment, including vehicles: for SMEs;
deduction of 50% of the cost of assets ordered
between 13 December 2008 and 31 December
2009. For other businesses in 2009: deduction
of 30% of assets acquired before 30 June 2009
and 10% between 1 July and 31 December
2009.
Austria April 2009 to
December 2009
(probably phased
out in July).
€ 1 500
Belgium Tax reduction to purchase new cars equivalent
to 3% (< 115 CO2) or 15% (< 105 CO2)
depending on emissions (started in 2007). In
addition, the automobile sector will benefit from a
number of horizontal measures, in particular
changes in the system for economic temporary
unemployment for blue-collar workers and its
provisional extension to white- collar workers.
Measures at the regional level: the Flemish
goverment support to the car industry amounted
to € 10.5 million in 2009. The Walloon
Government has developed a specific fiscal
green measure to promote buying of less
polluting cars (CO2 emissions), in the form of an
“eco-bonus/malus”.
Canada Until
31 March 2011
(for the federal
programme).
Varies by
manufacturer. "Retire
your ride
programme": CAD
300. Provincial scrap-
it programme (British
Columbia).
Czech
Republic
Under
abeyance.
CZK 30 000. Tax measures: increase rates for old cars, lower
rates for some types of vehicles (hybrid etc.).
Denmark Since
1 July 2000 but
changes in the
incentives in
2002.
Premium of
DKK 1 750
(approximately € 235)
for cars retired after
30 June 2002.
DKK 150 million
allocated in 2009.
In the budget
proposal for 2010,
DKK 153.2 million
are allocated
Premiums were
paid for
approximately
95 000 cars in
2008.
Finland In the 2009 budget car taxation based on CO2
emissions, heavier lorries, vans and coaches will
get a reduction based on the total weight.
France Until end 2010. € 1 000 in 2009 then
€ 700 in January
2010 and € 500 in
July 2010.
€ 380 million
in 2009 and
€ 240 million
in 2010.
About 20% of all the
cars sold in January
benefited from this
scrapping incentive.
State guaranty for loans for the purchase of cars
(€ 6.5 million). An additional tax of € 4 on every
registration certificate (in force from 15 April
2009). New measure to favour model shift and
encourage eco-maintenance of vehicles
(reduced VAT).
Source : OECD Secretariat; European Commission (2009); OECD (2009); and Council of Economic Advisers (2009).
13
Table 2.3. Principal measures to support the automobile sector (con't)
Scrapping scheme Other measures
Duration Incentives Total amount Effects
Germany Until December
2009 but funds
used by
September 2009.
€ 2 500. € 5 billion. New car registration
increased by 30% in
February.
Adjustment of the annual circulation tax for
passenger cars on the basis of CO2 emissions.
Greece 30 September - 2
November.
€ 500 to 2 200
depending on the
type of vehicle.
A 50% cut in the registration tax on new cars
applicable between April and August 2009.
Italy Until end 2009. € 800 to 1 500.
Japan 10 April 2009
to 31 March 2010.
Subsidie of ¥ 125 000
to 250 000 for the
purchase of high-
energy efficiency car,
if scrapping a car 13
years old or more.
Subsidie of ¥ 50000
to 100000 for
purchasing a high-
energy efficiency car
if scrapping a car of
less than 13 years
old.
¥ 370 billion
(€ 2.78 billion).
As of 28 September
2009, about 730 000
requests were
received while 18 600
cases were already
subsidised. A total of
¥ 19.9 billion has
been spent.
Green tax schemes for automobiles were
upgraded in April 2009. The motor vehicle
tonnage tax (April 2009 to April 2012) and the
automobile acquisition tax (April 2009 to March
2012) were reduced or exempted for
environmentally-friendly automobiles.
Korea May 2009 to
December 2009.
Tax incentives for
consumer trading in
older vehicles: 70%
tax reduction on
individual
consumption tax
(national tax, 5 to
10%) and 70% tax
reduction on
registration tax (local
tax, 5%) and
acquisition tax (local
tax, 2%).
Luxembourg January 2009 to
December 2009.
€ 1 500 to 1 750. The scrapping scheme complements a pre-
existing measure which provides € 750 for
purchase of energy-efficient cars.
Netherlands 1 August 2009 to
1 January 2011.
€ 750
to 1 750.
€ 85 million. Reduction in the registration tax compensated by
an increase in the annual circulation tax for all
vehicules. Discount in annual circulation tax for
fuel-efficient cars. Lower excise duties for
Liquified Natural Gaz to the amount applied to
petrol cars. Reintroduction of a fiscal scheme for
passenger cars with low-emission diesel
engines.
Norway Permanent
scheme.
NOK 5 000.
Poland Increase in excise tax.
Portugal Since 2000,
renewed annually.
Scheme made
more generous
from August to
December 2009.
€ 1 250 to 1 500 from
August to December
2009 (€ 1 000 to
1 250 before).
€ 34 million (estimate
for 2009 before
August change).
The car industry is currently an important
beneficiary of a short-time working scheme.
Source : OECD Secretariat; European Commission (2009); OECD (2009); and Council of Economic Advisers (2009).
14
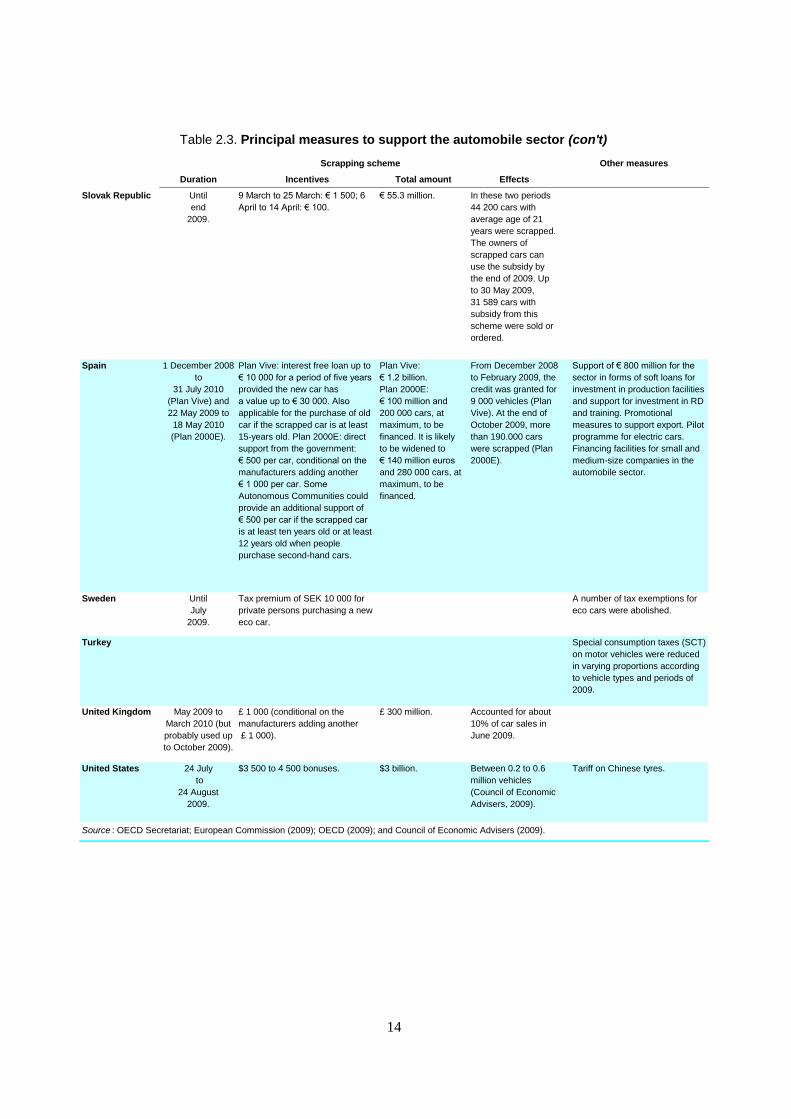
Table 2.3. Principal measures to support the automobile sector (con't)
Scrapping scheme Other measures
Duration Incentives Total amount Effects
Slovak Republic Until
end
2009.
9 March to 25 March: € 1 500; 6
April to 14 April: € 100.
€ 55.3 million. In these two periods
44 200 cars with
average age of 21
years were scrapped.
The owners of
scrapped cars can
use the subsidy by
the end of 2009. Up
to 30 May 2009,
31 589 cars with
subsidy from this
scheme were sold or
ordered.
Spain 1 December 2008
to
31 July 2010
(Plan Vive) and
22 May 2009 to
18 May 2010
(Plan 2000E).
Plan Vive: interest free loan up to
€ 10 000 for a period of five years
provided the new car has
a value up to € 30 000. Also
applicable for the purchase of old
car if the scrapped car is at least
15-years old. Plan 2000E: direct
support from the government:
€ 500 per car, conditional on the
manufacturers adding another
€ 1 000 per car. Some
Autonomous Communities could
provide an additional support of
€ 500 per car if the scrapped car
is at least ten years old or at least
12 years old when people
purchase second-hand cars.
Plan Vive:
€ 1.2 billion.
Plan 2000E:
€ 100 million and
200 000 cars, at
maximum, to be
financed. It is likely
to be widened to
€ 140 million euros
and 280 000 cars, at
maximum, to be
financed.
From December 2008
to February 2009, the
credit was granted for
9 000 vehicles (Plan
Vive). At the end of
October 2009, more
than 190.000 cars
were scrapped (Plan
2000E).
Support of € 800 million for the
sector in forms of soft loans for
investment in production facilities
and support for investment in RD
and training. Promotional
measures to support export. Pilot
programme for electric cars.
Financing facilities for small and
medium-size companies in the
automobile sector.
Sweden Until
July
2009.
Tax premium of SEK 10 000 for
private persons purchasing a new
eco car.
A number of tax exemptions for
eco cars were abolished.
Turkey Special consumption taxes (SCT)
on motor vehicles were reduced
in varying proportions according
to vehicle types and periods of
2009.
United Kingdom May 2009 to
March 2010 (but
probably used up
to October 2009).
£ 1 000 (conditional on the
manufacturers adding another
£ 1 000).
£ 300 million. Accounted for about
10% of car sales in
June 2009.
United States 24 July
to
24 August
2009.
$3 500 to 4 500 bonuses. $3 billion. Between 0.2 to 0.6
million vehicles
(Council of Economic
Advisers, 2009).
Tariff on Chinese tyres.
Source : OECD Secretariat; European Commission (2009); OECD (2009); and Council of Economic Advisers (2009).
15
Table 2.3. Principal measures to support the automobile sector (con't)
Scrapping scheme Other measures
Duration Incentives Total amount Effects
Brazil Reduction of federal VAT on
purchases of small cars and
trucks, and other federal taxes on
the production and financing of
motorbikes. Value: About $3.3
billion for 2009.
China From
1 June 2009 to
31 May 2010.
CNY 3 000 to 6 000
(only large cars can be scrapped).
CNY 4 billion. Cars to the countryside
programme (CNY 5 billion).
India A reduction in the excise duty on
cars and utility vehicles with an
engine capacity of 2 000 cc and
above. A reduction in excise duty
for small cars from 16 to 12 per
cent and for hybrid cars from 24
to 14 per cent in the 2008 budget.
Source : OECD Secretariat; European Commission (2009); OECD (2009); and Council of Economic Advisers (2009).
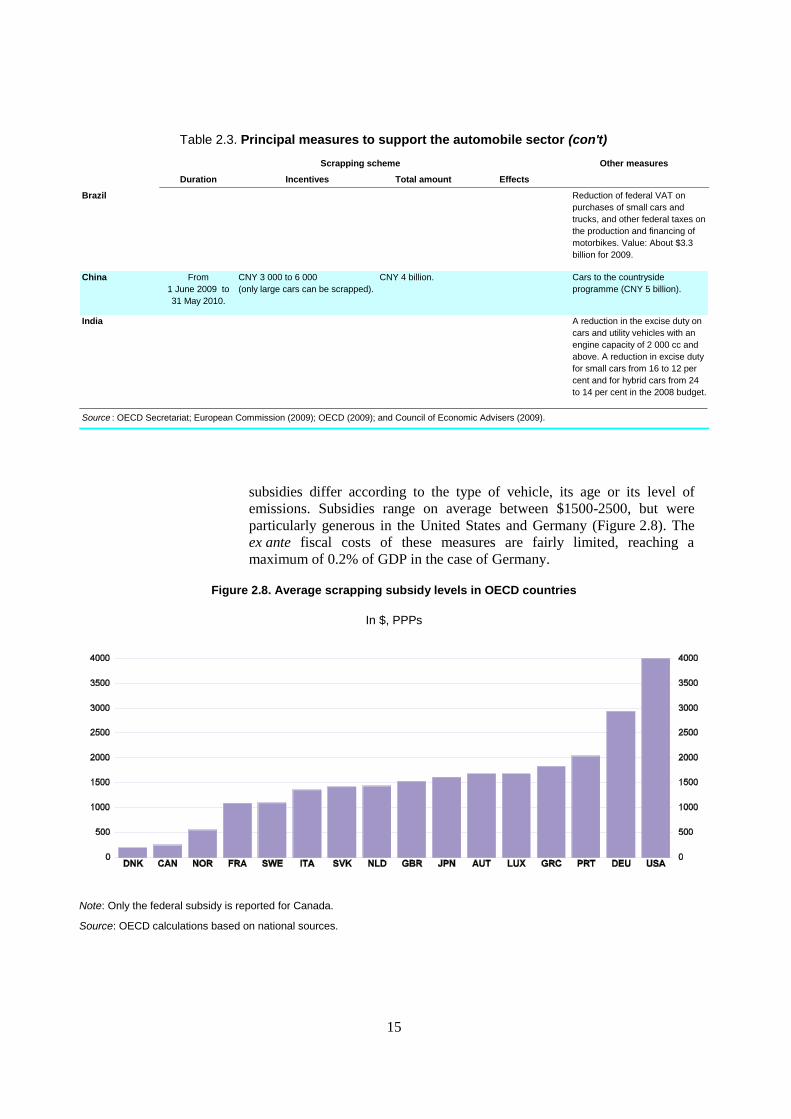
subsidies differ according to the type of vehicle, its age or its level of
emissions. Subsidies range on average between $1500-2500, but were
particularly generous in the United States and Germany (Figure 2.8). The
ex ante fiscal costs of these measures are fairly limited, reaching a
maximum of 0.2% of GDP in the case of Germany.
Figure 2.8. Average scrapping subsidy levels in OECD countries
In $, PPPs
Note: Only the federal subsidy is reported for Canada.
Source: OECD calculations based on national sources.
16
These schemes have
temporarily boosted sales
and activity…
The short-term economic impacts of these measures are difficult to
assess, given the lack of information on what would have happened in their
absence. A surge in sales was observed in the United States in the first half
of 2009, leading to a sharp decline in inventories. Motor vehicle car sales
dropped back to their pre-incentive level in September after the incentive
ended. Likewise, new car registrations went up sharply in Europe since the
beginning of 2009. Substantial increases were recorded in Germany,
Austria, Italy, Portugal, the Slovak Republic and the United Kingdom.
There is some evidence that car and parts manufacturing in Poland, which
did not introduce any scrapping scheme, benefited from the German
programme. Similar spillover effects were also reported in the Slovak
Republic, France and Italy that all export small and less expensive cars to
Germany. The high import share of car demand and the fact that the
German scheme was designed to avoid discrimination against foreign firms
explain these spillover effects.
At the macroeconomic level, the car purchase incentive measures
appear to have had some success in cushioning the downturn in the short
term. Motor vehicle output added 1.7 percentage points to the third-quarter
change in real GDP in the United States. The Clash-for-Clunkers (“CARS”)
programme is officially expected to have boosted the level of GDP for a
period and then to be followed by a drop that slightly more than reverses
the initial increase. The programme is estimated to have raised GDP growth
by 0.1-0.4 percentage points at an annual rate in the third quarter of 2009
(Council of Economic Advisers, 2009).6 It is also officially estimated to
save between 22 and 59 thousand jobs in 2009. In the euro area, the impact
of the scheme on real GDP growth in the first half of 2009 is estimated to
have been positive but relatively small (ECB, 2009). Indeed, crowding-out
effects, whereby the purchase of new cars reduces demand for other
products through income and relative price effects, is likely to have lowered
the final effect of the car purchase incentive schemes on GDP.
… but their effects is
likely to be reversed in
the months to come
As most of the schemes have already ended or will expire at the end of
2009, the GDP impact expected for next year will depend on the size of the
“payback effect”, i.e. to what extent programmes pulled forward sales
which will then not occur in the near future. Past experience suggest that
the size and the timing of this payback effects is variable (Box 2.2). In most
episodes, sales appear to have been depressed after the termination of car
scrapping schemes.
6 . Other estimates are more optimistic. For instance, Goldman and Sachs estimate that CARS will add
0.8 percentage point to GDP growth at an annual rate in the third quarter of 2009, with no effect on growth
in the fourth quarter. Other studies point to more negative effects. Abramo and Parsons (2009) estimate the
cost of the programme would amount to $2 000 per vehicle. Assuming 700 000 vehicles would benefit
from the programme, this would lead to a total loss of $1.4 billion.
17
Some forms of support
are detrimental to long-
term growth
Support has also taken the form of direct government loans and
subsidies to firms7 and interference in industry restructuring. Examples
include the involvement of the US government in the restructuring of
General Motors (GM) and those of the German government, while GM was
proposing to sell Opel, in the choice of buyers for GM’s Opel subsidiary
and in financing the sale. The latter intervention raised concerns that plans
concerning factory closures across countries were not entirely based on
business considerations.
More generally, the long-term economic effects of support to the
automobile industry differ depending on the type of intervention.
Temporary support to demand is likely to be the least distortive. However,
sometimes such support can distort competition by favouring incumbent
firms. As regards more direct support, some measures have sought to step
up applied research and may foster innovation and production.8 But support
to producers in distress could impede needed industry restructuring and
renewal. Moreover, measures perceived as protectionist could trigger
retaliation from other countries, damaging both short and long term growth
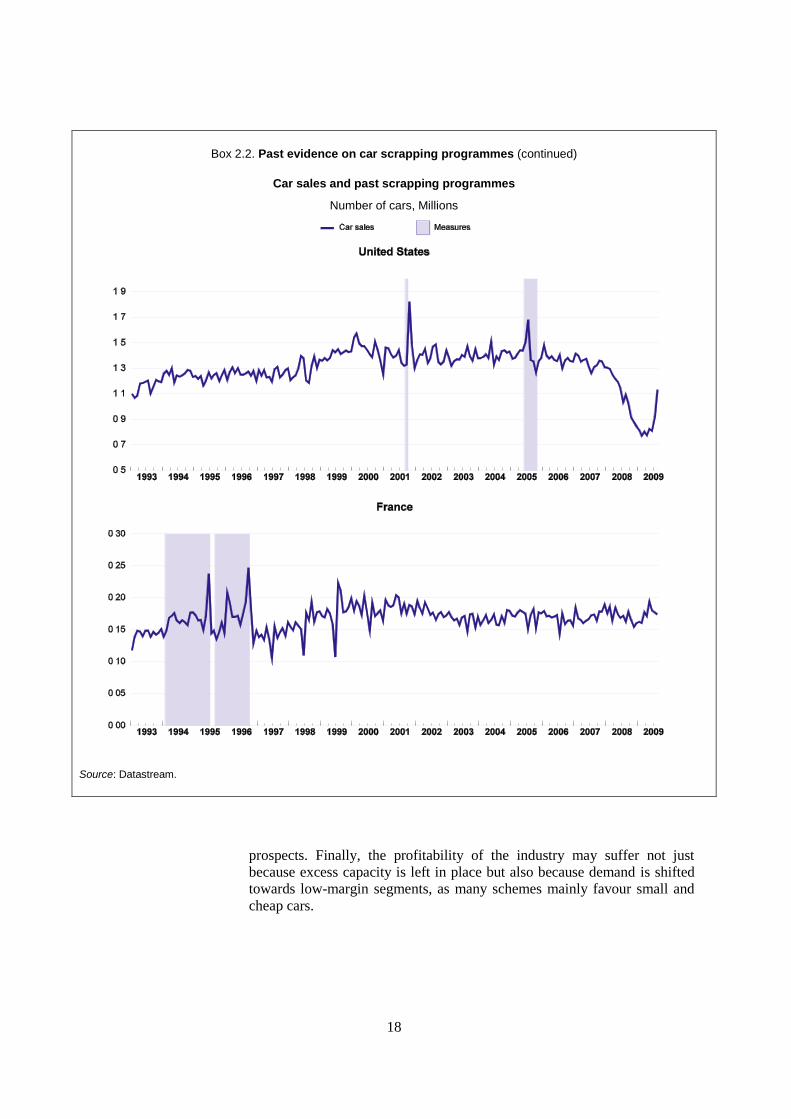
Box 2.2. Past evidence on car scrapping programmes
A large number of countries have put in place scrapping schemes in response to the crisis. Evidence from similar measures introduced in the past suggests that:
Scrapping programmes can markedly boost sales in the short-term.
There is no clear evidence on the timing and the magnitude of a “payback effect” when the scheme is terminated. The period which followed the Employee Pricing Summer in the United States in 2005 saw a sizable payback effect (Figure). By contrast, there was no payback effect after the post-September 2001 incentives, but this may reflect the relatively small size of the scheme which lasted only one month. France, Spain and Italy saw a decline in sales immediately after the end of the scrapping programmes they introduced in the 1990s. However, data are not conclusive about the size and the timing of a “payback effect” beyond a few months after the ending of the schemes.
Scrapping schemes may have medium-term structural effects, e.g. changing consumer preferences in terms of vehicle choices. Evidence for Spain suggests for instance that programmes implemented in the 1990s accelerated the development of diesel-driven cars. However, such effects would have not been visible, had the diesel technology not been widespread. These structural changes will take several years to materialise.
Source: Council of Economic Advisers (2009), Miravete and Moral (2009).
7 . For example, the Canadian and Ontarian governments provided the Canadian arms of General Motors and
Chrysler with a combined $4 billion in loans.
8 . The industry is classified as a medium high-tech manufacturing sector. In some countries, however, the
industry invests substantially in R&D and employs a large number of R&D personnel. The share of highly
skilled staff in the industry is particularly large in Spain, Germany, the United Kingdom and France
(OECD, 2009).
18
Box 2.2. Past evidence on car scrapping programmes (continued)
Car sales and past scrapping programmes
Number of cars, Millions
Source: Datastream.
prospects. Finally, the profitability of the industry may suffer not just
because excess capacity is left in place but also because demand is shifted
towards low-margin segments, as many schemes mainly favour small and
cheap cars.
19
Prospects for the short and medium term differ across regions
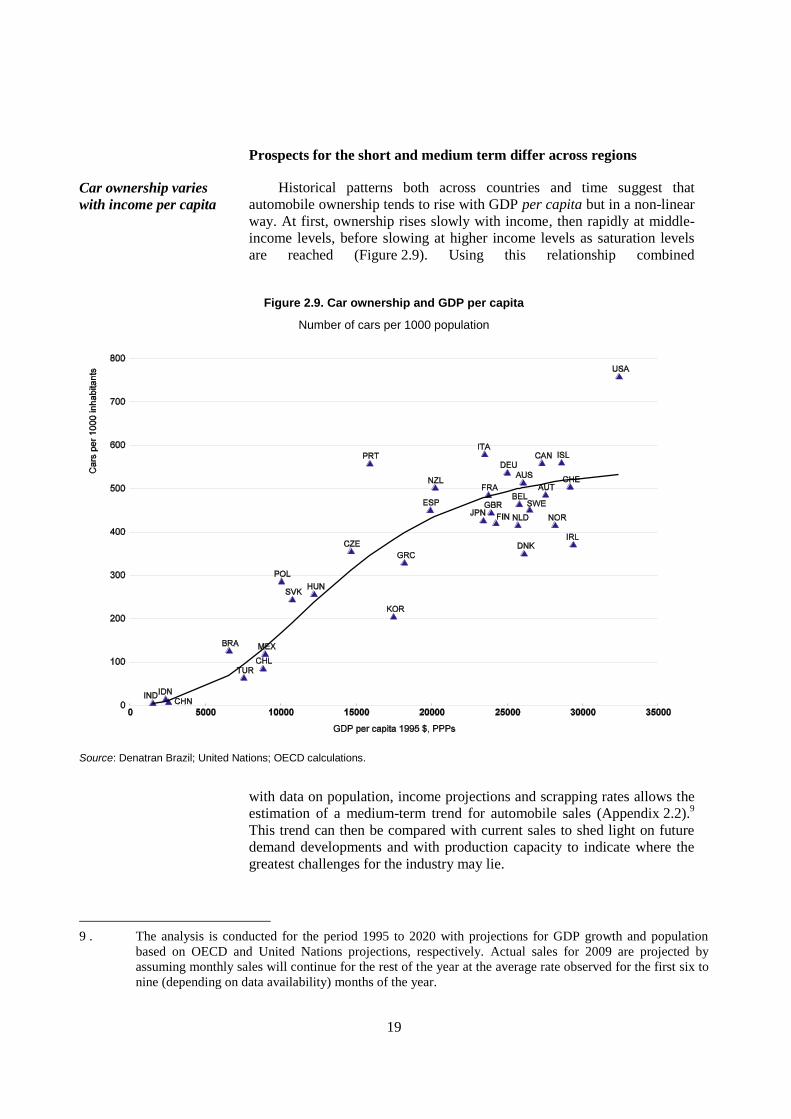
Car ownership varies
with income per capita
Historical patterns both across countries and time suggest that
automobile ownership tends to rise with GDP per capita but in a non-linear
way. At first, ownership rises slowly with income, then rapidly at middle-
income levels, before slowing at higher income levels as saturation levels
are reached (Figure 2.9). Using this relationship combined
Figure 2.9. Car ownership and GDP per capita
Number of cars per 1000 population
Source: Denatran Brazil; United Nations; OECD calculations.
with data on population, income projections and scrapping rates allows the
estimation of a medium-term trend for automobile sales (Appendix 2.2).9
This trend can then be compared with current sales to shed light on future
demand developments and with production capacity to indicate where the
greatest challenges for the industry may lie.
9 . The analysis is conducted for the period 1995 to 2020 with projections for GDP growth and population
based on OECD and United Nations projections, respectively. Actual sales for 2009 are projected by
assuming monthly sales will continue for the rest of the year at the average rate observed for the first six to
nine (depending on data availability) months of the year.
20
Markets are close to
saturation in many
advanced economies
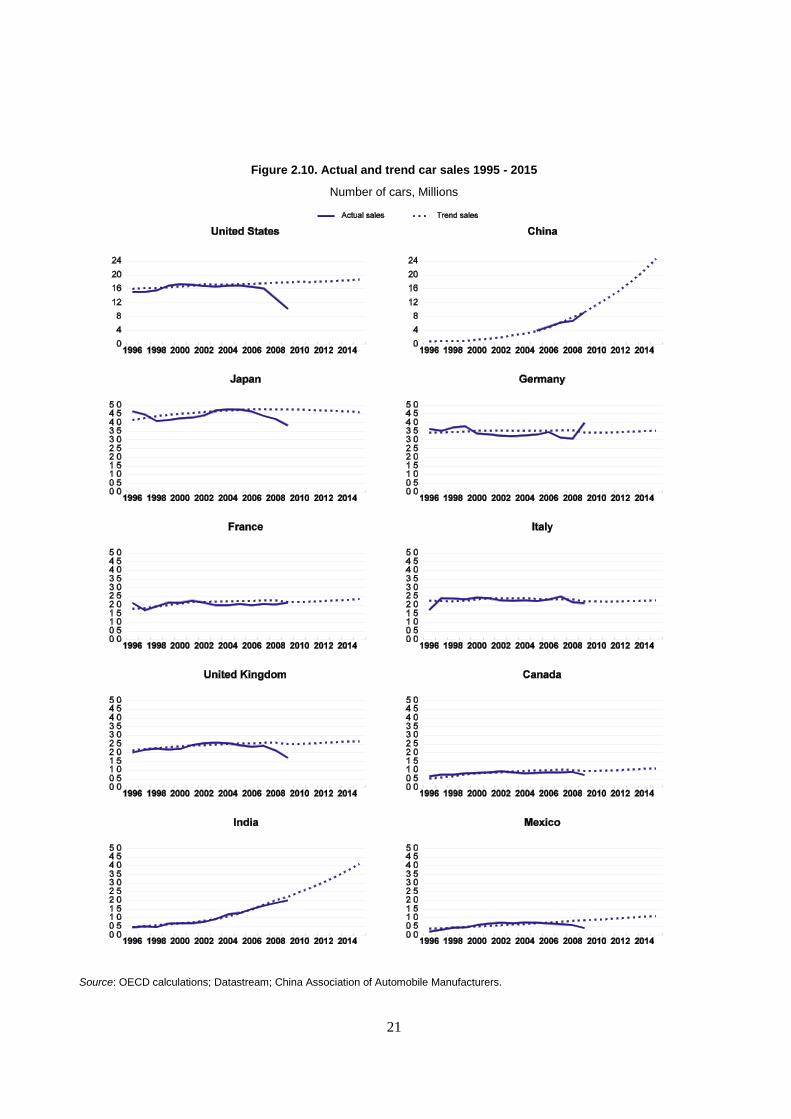
Future trends in car sales are likely to vary considerably across the G7
countries, other advanced countries, China, India and Mexico (Figure 2.10).
In high-income countries, car ownership per capita is likely to be relatively
close to saturation and therefore future developments are likely to be driven
by a slow increase in vehicles per capita. In Japan, trend car sales may
stagnate as a slight increase in car ownership per capita is more than offset
by a declining population. In Germany and Italy, as well, trend car sales are
expected to be broadly flat. In France, the United Kingdom and the United
States, trend sales are expected to continue to increase due to population
increases as well as some increase in car ownership per capita, though the
latter effect is less important in the United States, where the density is
already high.
Trend car sales are
increasing at a rapid
pace in China and India
In contrast with the G7 countries, car ownership levels in China are
very low and incomes have now risen to a level where the income elasticity
of vehicle ownership per capita is typically high (around 2 compared with
around 0.4 in Japan and Western Europe). The combination of low car
ownership per capita, a high income elasticity, and rapidly rising income
levels means that trend car sales in China are increasing extremely rapidly
and are likely to do so for the foreseeable future. Trend sales increased
from around 4 million per annum in 2005 to around 9 million in 2009.
Actual sales are also rising rapidly in line with the trend, increasing from
approximately 4 million in 2005 to around 7 million in 2008. China will
likely overtake the United States in the coming years to become the largest
car market in the world. Starting from a lower level than in China, trend
sales are also increasing at a fast rate in India.
Car sales are below or at
trend in many OECD
countries
Comparing recent car sales with trend sales may provide an indication
of car sales developments over the near term beyond the next months. In
Germany, the car scrapping scheme appears to have pushed car sales far
above their long-term trend, suggesting that near-term car sale prospects are
likely to be particularly weak. In Australia, France, Italy and Korea sales
appear to be close to their trend level. In contrast, in Canada, Japan,
Mexico, Spain, the United Kingdom and the United States, car sales have
clearly fallen below their trend level, suggesting some scope for a cyclical
rebound. This is particularly the case in the United States where actual car
sales in 2009 are set to be around 60% of trend levels.
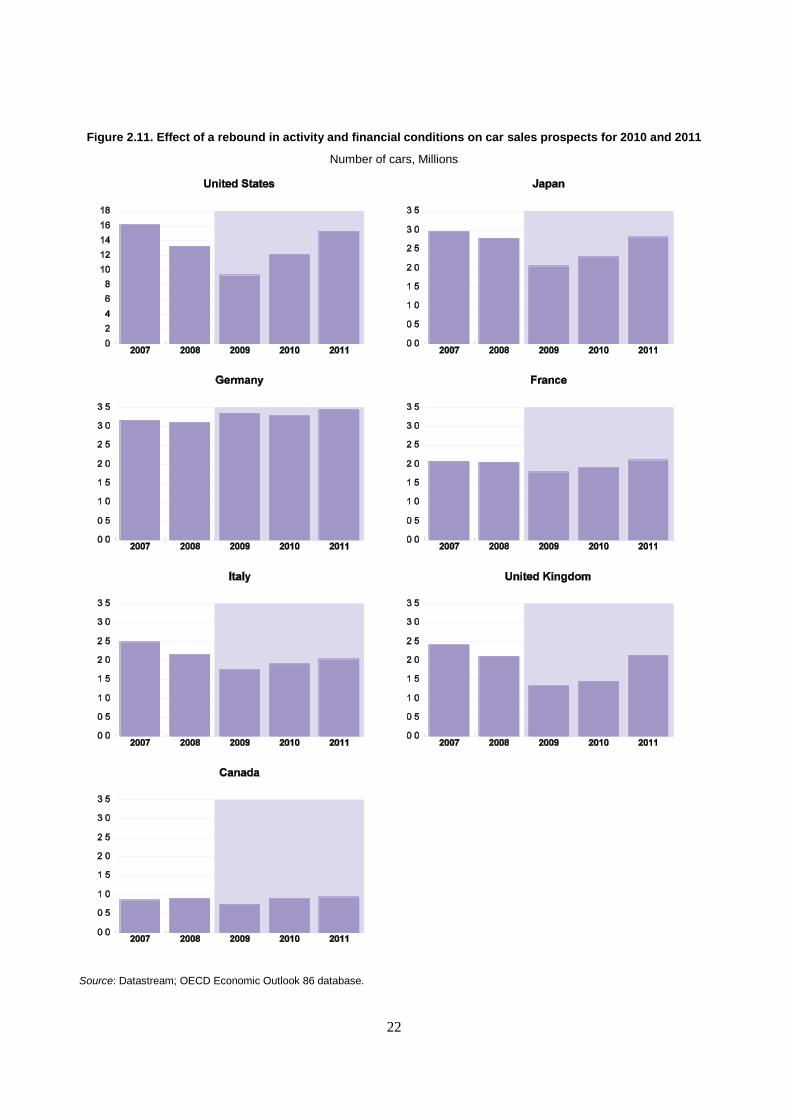
Car sales should benefit
from the recovery in
activity and the
improvement in financial
markets conditions
As a cross-check on these calculations, estimated equations for car
sales in G7 countries can be used to make short-term projections on a
mechanical basis. More specifically, these projections are based on
economic activity developments and assumptions concerning financial
conditions consistent with those of this Economic Outlook. The results
suggest that higher activity and improved financial conditions could boost
car sales by 1.9 million units in the United States, around 0.3 to 0.4 million
in Japan and the United Kingdom, and 0.2 million in the three largest euro
area countries from mid-2009 to 2011 (Figure 2.11). But the calculations do
not incorporate the likely payback effect from car scrapping schemes,
which have already or are expected to be terminated by the end of the year.
21
Figure 2.10. Actual and trend car sales 1995 - 2015
Number of cars, Millions
Source: OECD calculations; Datastream; China Association of Automobile Manufacturers.
22
Figure 2.11. Effect of a rebound in activity and financial conditions on car sales prospects for 2010 and 2011
Number of cars, Millions
Source: Datastream; OECD Economic Outlook 86 database.
23
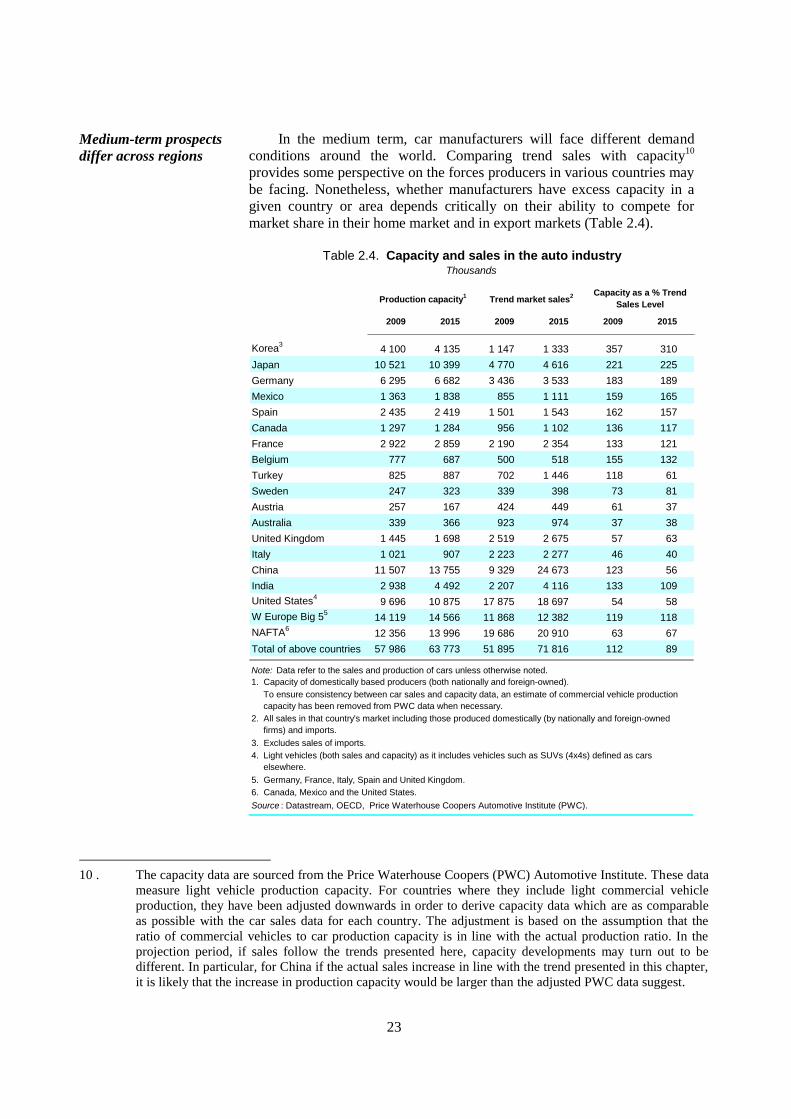
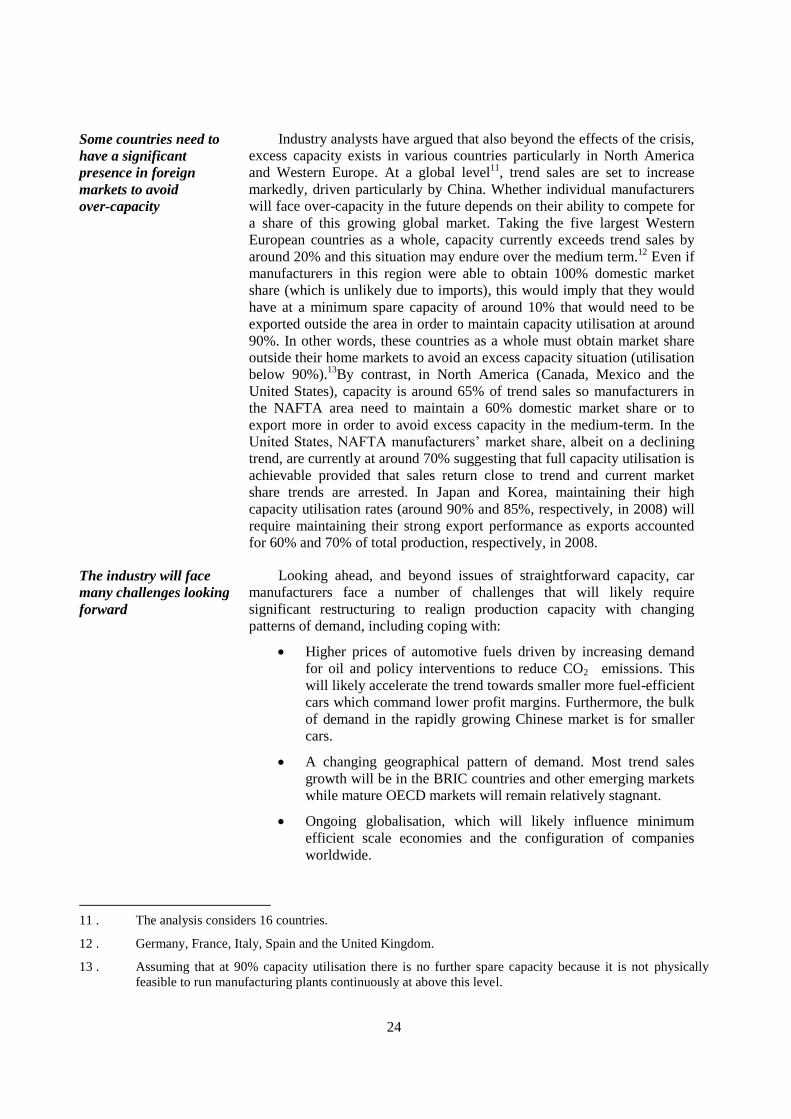
Medium-term prospects
differ across regions
In the medium term, car manufacturers will face different demand
conditions around the world. Comparing trend sales with capacity10
provides some perspective on the forces producers in various countries may
be facing. Nonetheless, whether manufacturers have excess capacity in a
given country or area depends critically on their ability to compete for
market share in their home market and in export markets (Table 2.4).
Table 2.4. Capacity and sales in the auto industryThousands
Production capacity1
Trend market sales2 Capacity as a % Trend
Sales Level
2009 2015 2009 2015 2009 2015
Korea3
4 100 4 135 1 147 1 333 357 310
Japan 10 521 10 399 4 770 4 616 221 225
Germany 6 295 6 682 3 436 3 533 183 189
Mexico 1 363 1 838 855 1 111 159 165
Spain 2 435 2 419 1 501 1 543 162 157
Canada 1 297 1 284 956 1 102 136 117
France 2 922 2 859 2 190 2 354 133 121
Belgium 777 687 500 518 155 132
Turkey 825 887 702 1 446 118 61
Sweden 247 323 339 398 73 81
Austria 257 167 424 449 61 37
Australia 339 366 923 974 37 38
United Kingdom 1 445 1 698 2 519 2 675 57 63
Italy 1 021 907 2 223 2 277 46 40
China 11 507 13 755 9 329 24 673 123 56
India 2 938 4 492 2 207 4 116 133 109
United States4
9 696 10 875 17 875 18 697 54 58
W Europe Big 55
14 119 14 566 11 868 12 382 119 118
NAFTA6
12 356 13 996 19 686 20 910 63 67
Total of above countries 57 986 63 773 51 895 71 816 112 89
Note: Data refer to the sales and production of cars unless otherwise noted.
1. Capacity of domestically based producers (both nationally and foreign-owned).
2. xxreign-owned firms) and imports
3. Excludes sales of imports.
4. xx
5. Germany, France, Italy, Spain and United Kingdom.
6. Canada, Mexico and the United States.
Source : Datastream, OECD, Price Waterhouse Coopers Automotive Institute (PWC).
To ensure consistency between car sales and capacity data, an estimate of commercial vehicle production
capacity has been removed from PWC data when necessary.
All sales in that country's market including those produced domestically (by nationally and foreign-owned
firms) and imports.
Light vehicles (both sales and capacity) as it includes vehicles such as SUVs (4x4s) defined as cars
elsewhere.
10 . The capacity data are sourced from the Price Waterhouse Coopers (PWC) Automotive Institute. These data
measure light vehicle production capacity. For countries where they include light commercial vehicle
production, they have been adjusted downwards in order to derive capacity data which are as comparable
as possible with the car sales data for each country. The adjustment is based on the assumption that the
ratio of commercial vehicles to car production capacity is in line with the actual production ratio. In the
projection period, if sales follow the trends presented here, capacity developments may turn out to be
different. In particular, for China if the actual sales increase in line with the trend presented in this chapter,
it is likely that the increase in production capacity would be larger than the adjusted PWC data suggest.
24
Some countries need to
have a significant
presence in foreign
markets to avoid
over-capacity
Industry analysts have argued that also beyond the effects of the crisis,
excess capacity exists in various countries particularly in North America
and Western Europe. At a global level11
, trend sales are set to increase
markedly, driven particularly by China. Whether individual manufacturers
will face over-capacity in the future depends on their ability to compete for
a share of this growing global market. Taking the five largest Western
European countries as a whole, capacity currently exceeds trend sales by
around 20% and this situation may endure over the medium term.12
Even if
manufacturers in this region were able to obtain 100% domestic market
share (which is unlikely due to imports), this would imply that they would
have at a minimum spare capacity of around 10% that would need to be
exported outside the area in order to maintain capacity utilisation at around
90%. In other words, these countries as a whole must obtain market share
outside their home markets to avoid an excess capacity situation (utilisation
below 90%).13
By contrast, in North America (Canada, Mexico and the
United States), capacity is around 65% of trend sales so manufacturers in
the NAFTA area need to maintain a 60% domestic market share or to
export more in order to avoid excess capacity in the medium-term. In the
United States, NAFTA manufacturers’ market share, albeit on a declining
trend, are currently at around 70% suggesting that full capacity utilisation is
achievable provided that sales return close to trend and current market
share trends are arrested. In Japan and Korea, maintaining their high
capacity utilisation rates (around 90% and 85%, respectively, in 2008) will
require maintaining their strong export performance as exports accounted
for 60% and 70% of total production, respectively, in 2008.
The industry will face
many challenges looking
forward
Looking ahead, and beyond issues of straightforward capacity, car
manufacturers face a number of challenges that will likely require
significant restructuring to realign production capacity with changing
patterns of demand, including coping with:
Higher prices of automotive fuels driven by increasing demand
for oil and policy interventions to reduce CO2 emissions. This
will likely accelerate the trend towards smaller more fuel-efficient
cars which command lower profit margins. Furthermore, the bulk
of demand in the rapidly growing Chinese market is for smaller
cars.
A changing geographical pattern of demand. Most trend sales
growth will be in the BRIC countries and other emerging markets
while mature OECD markets will remain relatively stagnant.
Ongoing globalisation, which will likely influence minimum
efficient scale economies and the configuration of companies
worldwide.
11 . The analysis considers 16 countries.
12 . Germany, France, Italy, Spain and the United Kingdom.
13 . Assuming that at 90% capacity utilisation there is no further spare capacity because it is not physically
feasible to run manufacturing plants continuously at above this level.
25
APPENDIX 2.1:
ERROR – CORRECTION MODEL OF CAR SALES
This appendix describes the model of car sales growth which has been
used to explain the fall in car sales in the last quarter of 2008 and the effect
of the improvement in financial conditions and the recovery in demand on
short-term prospects for car sales. For each G7 country the equation is
specified as an error-correction model. In the long-term, sales depend on
GDP per capita (gdppc), real oil price (roil) and financial market
conditions (fci):
fcicroilcgdppcccsale 3210 )log()log()log( .
Over the short-term, sales growth is driven by growth of gdp per capita,
real oil prices and financial market conditions as well as the gradual level
adjustment of sales to their long-term trend.
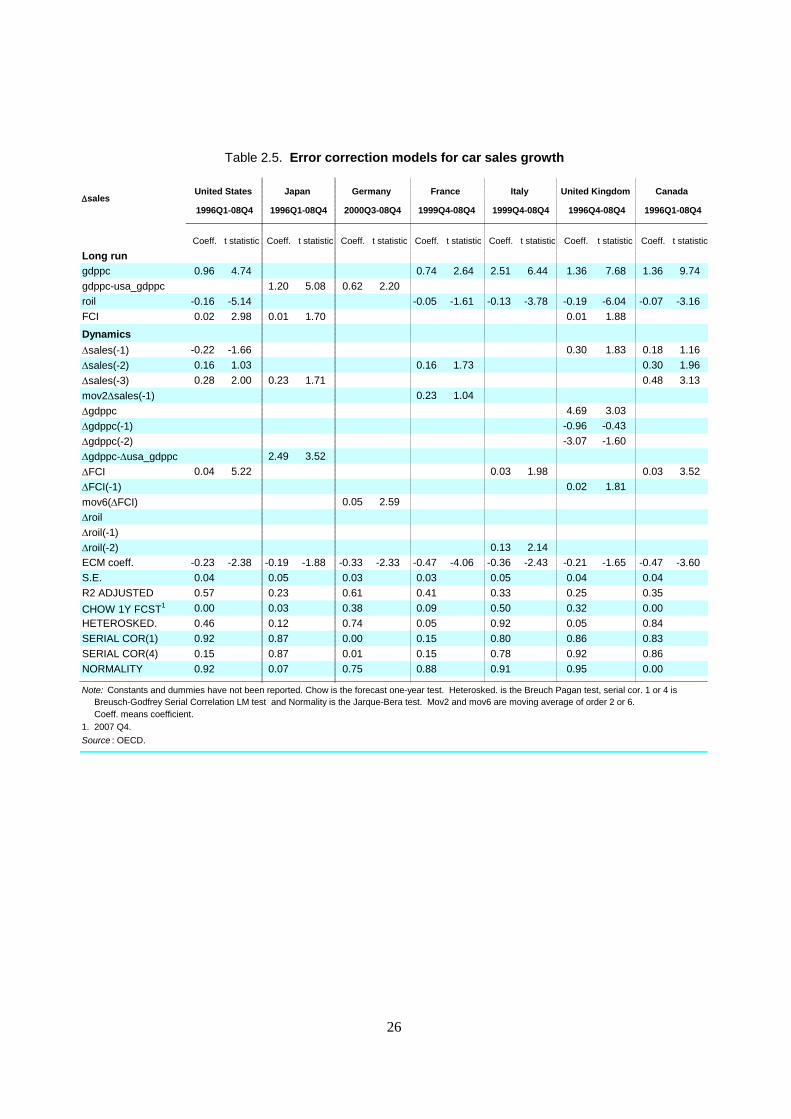
The equation is estimated by a two-step procedure for each individual
country (Table 2.5). Data for sales are passenger car sales and are taken
from Datastream. Real oil price is the price of Brent oil deflated by core
consumer prices and financial market conditions are captured by the
financial condition index developed in Guichard et al. (2009). Given the
lack of data for some individual countries, the euro financial condition
index (FCI) has been used for all three European countries and the US FCI
has been used for Canada.FCI is found to be significant in all countries but
France. The introduction of the unemployment rate in the analysis would
not modify this result.
26
Table 2.5. Error correction models for car sales growth
DsalesUnited States Japan Germany France Italy United Kingdom Canada
1996Q1-08Q4 1996Q1-08Q4 2000Q3-08Q4 1999Q4-08Q4 1999Q4-08Q4 1996Q4-08Q4 1996Q1-08Q4
Coeff. t statistic Coeff. t statistic Coeff. t statistic Coeff. t statistic Coeff. t statistic Coeff. t statistic Coeff. t statistic
Long run
gdppc 0.96 4.74 0.74 2.64 2.51 6.44 1.36 7.68 1.36 9.74
gdppc-usa_gdppc 1.20 5.08 0.62 2.20
roil -0.16 -5.14 -0.05 -1.61 -0.13 -3.78 -0.19 -6.04 -0.07 -3.16
FCI 0.02 2.98 0.01 1.70 0.01 1.88
Dynamics
Dsales(-1) -0.22 -1.66 0.30 1.83 0.18 1.16
Dsales(-2) 0.16 1.03 0.16 1.73 0.30 1.96
Dsales(-3) 0.28 2.00 0.23 1.71 0.48 3.13
mov2Dsales(-1) 0.23 1.04
Dgdppc 4.69 3.03
Dgdppc(-1) -0.96 -0.43
Dgdppc(-2) -3.07 -1.60
Dgdppc-Dusa_gdppc 2.49 3.52
DFCI 0.04 5.22 0.03 1.98 0.03 3.52
DFCI(-1) 0.02 1.81
mov6(DFCI) 0.05 2.59
Droil
Droil(-1)
Droil(-2) 0.13 2.14
ECM coeff. -0.23 -2.38 -0.19 -1.88 -0.33 -2.33 -0.47 -4.06 -0.36 -2.43 -0.21 -1.65 -0.47 -3.60
S.E. 0.04 0.05 0.03 0.03 0.05 0.04 0.04
R2 ADJUSTED 0.57 0.23 0.61 0.41 0.33 0.25 0.35
CHOW 1Y FCST1 0.00 0.03 0.38 0.09 0.50 0.32 0.00
HETEROSKED. 0.46 0.12 0.74 0.05 0.92 0.05 0.84
SERIAL COR(1) 0.92 0.87 0.00 0.15 0.80 0.86 0.83
SERIAL COR(4) 0.15 0.87 0.01 0.15 0.78 0.92 0.86
NORMALITY 0.92 0.07 0.75 0.88 0.91 0.95 0.00
Coeff. means coefficient.
1. 2007 Q4.
Source : OECD.
Note: Constants and dummies have not been reported. Chow is the forecast one-year test. Heterosked. is the Breuch Pagan test, serial cor. 1 or 4 is
Breusch-Godfrey Serial Correlation LM test and Normality is the Jarque-Bera test. Mov2 and mov6 are moving average of order 2 or 6.
27
APPENDIX 2.2:
CAR SALES IN THE MEDIUM TERM
This annex sets out the method used to calculate trend car sales
discussed in the main text. Trend car sales in country i at time t is given by:
where Δstockit is the trend change in the stock of cars between period t and
t-1 and scrappageit is the trend number of cars scrapped and replaced in
each period. Scrappage is in turn a function of the average historical
scrappage rate multiplied by the previous year’s car stock:
where the historical average scrap rate , asri , is determined by:
The estimated stock of cars depends on passenger cars per capita
multiplied by the total population:
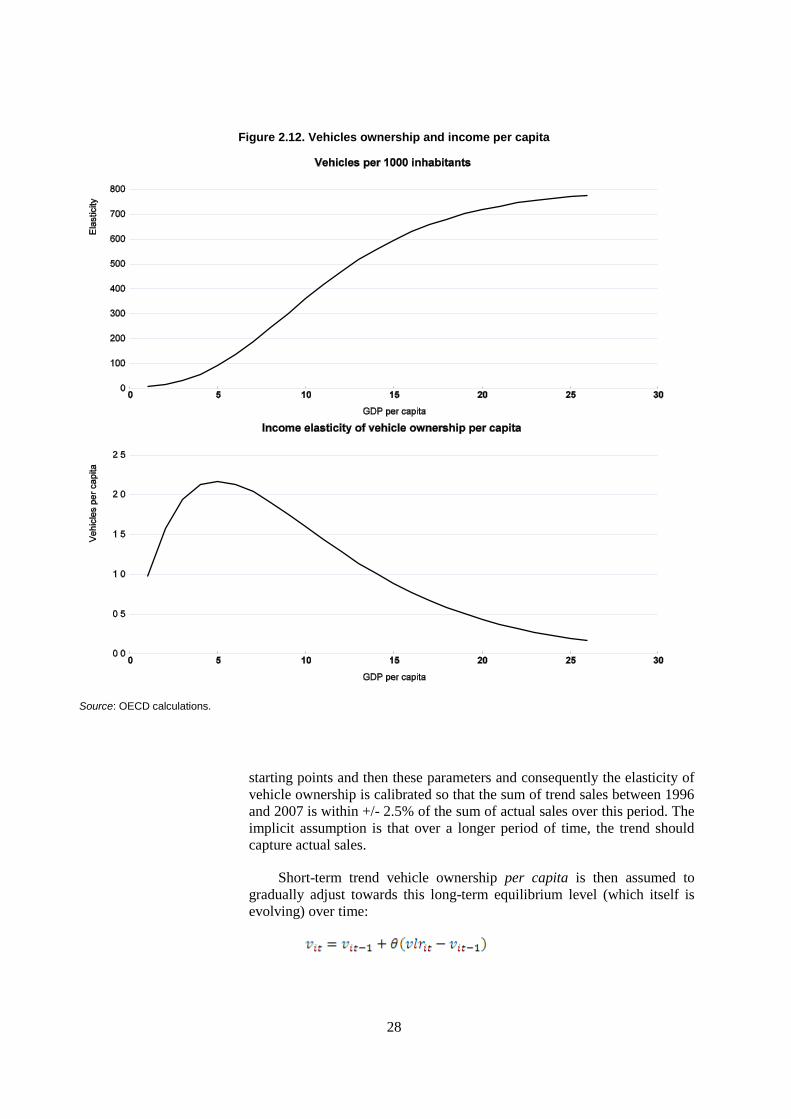
To obtain pcit, first the long-run equilibrium stock of vehicles per
capita (per 1 000 inhabitants) is obtained:
where vlrit a non-linear function of the level of per capita income (Dargay
et al., 2007). In particular, γi is the saturation level of vehicles per capita
and α and βi define the shape of the function and GDP is real GDP per
capita measured in purchasing power parity (Figure 2.12). The implied
long-run elasticity of vehicle ownership is then given by:
Dargay et al. (2007) econometrically estimate these parameters using
annual data over the period 1960-2002. Their estimates for γi and α are used
in this simulation exercise. Their estimates for βi are used as
28
Figure 2.12. Vehicles ownership and income per capita
Source: OECD calculations.
starting points and then these parameters and consequently the elasticity of
vehicle ownership is calibrated so that the sum of trend sales between 1996
and 2007 is within +/- 2.5% of the sum of actual sales over this period. The
implicit assumption is that over a longer period of time, the trend should
capture actual sales.
Short-term trend vehicle ownership per capita is then assumed to
gradually adjust towards this long-term equilibrium level (which itself is
evolving) over time:
29
where θ is the speed of adjustment and 0 < θ < 1.
Vehicles are composed of both cars and other vehicles. Passenger car
per capita are therefore generally obtained by:
where pcr is the ratio of the historical average of the passenger car to total
vehicle. In almost all higher-income OECD countries, this proportion is
highly stable, varying by less than 1% from year to year. In developing
countries, the ratio of cars to total vehicles tends to rise over time. In these
cases, the historical rate of increase is used until a threshold of 85% is
reached which is the average for higher-income OECD countries.
30
BIBLIOGRAPHY
Abrams, B. and G. Parsons (2009), “Is CARS a Clunkers?”, The
Economist’s voice, August.
Council of Economic Advisers (2009), “Economic Analysis of the Car
Allowance rebate System (“Cash for Clunkers”)”, September.
Dargay, J., D. Gately and M. Sommer (2007), “Vehicle Ownership and
Income Growth, Worldwide: 1960-2030”, Energy Journal, Vol. 28,
No. 4.
ECB (European Central Bank) (2009), Monthly Bulletin, October.
European Commission (2009), Economic Report, March.
Guichard, S., D. Haugh and D. Turner (2009), “Quantifying the Effects of
Financial Conditions in the Euro Area, Japan, the United Kingdom
and the United States,” OECD Economics Department Working
Papers, No. 677.
Miravete, E. and M. Moral (2009), “Qualitative effects of Cash-for-
Clunkers Programs”, mimeo.
OECD (2009), “Responding to the economic crisis: Fostering Industrial
Restructuring and renewal”, July.
Ramey, V. and D. Vine (2005), “Tracking the source of the decline in GDP
volatility: An analysis of the Automobile Industry”, Finance and
Economics discussion Series, No. 2005-14, Federal Reserve Board,
Washington.
Sturgeon, T. and J. van Biesebroeck (2009), “Crisis protection in the
Automotive Industry: a Global Value Chain Perspective”, World
Bank policy research Working Paper, No. 5060, September.