Embed Size (px)
Citation preview

43
CHAPTER 2
SYNTHESIS AND STRUCTURAL
CHARACTERIZATION OF
NANOMATERIAL BASED
SORBENTS
“All truths are easy to understand once they are discovered; the point is to discover
them.”
GALILEO GALILEI
44
2.1 Introduction
2.1.1 Nano – The Beginning
In the recent times, nanoparticles, or objects of size in the range of nanometer (1-100
nm) have become one of the most exciting objects of investigation and have played important
roles in the forefront areas of Physics, Chemistry, Engineering, Biology and Medical Science
[61,62]. Such materials show great promise in providing many breakthroughs in the near
future that may change the direction of technological advances in a wide range of
applications [61]. Nanoscience or the science of nanoparticles refers to the control and
manipulation of matter at nanometer dimension, which includes synthesis, characterization,
exploration, and application of nanostructured and nanosized materials. While the word
‘nanoscience’ is relatively new, the applications of nanomaterials can be historically traced
back to even before the generation of modern science and technology. Nature makes
nanometer sized objects of varying kind. Several structures of nanometer dimensions have
probably existed on earth ever since the inception of life on it [61]. The abalone, a mollusk,
constructs very strong shells having iridescent inner surfaces by utilizing calcium carbonate
as strong ‘nanostructured bricks’ held together by ‘glue’ made of carbohydrate-protein mix.
Cracks initiated on the outside are unable to move through the shell because of the
nanostructured bricks. The shells represent a natural demonstration that a structure fabricated
from nanoparticles can be much stronger than that made with bulk materials. Another
example is that of the bacteria, ‘Magnetosperillum magnetotacticum’, which makes
nanometer sized magnetite (Fe3O4) particles of specific morphology [61]. The magnetism
caused by such particles helps the bacteria in finding a direction favorable for its growth.
There are several other bacteria like the familiar ‘Lactobacillus’ which can take up metal ions
added into butter milk, and reduce them inside the cell and make nanoparticles [61].
45
It is not clear when humans first began to take advantage of the nanosized materials. It
is known that in the 4th century A.D., Roman glassmakers were fabricating glasses containing
nanosized metals [61]. In the ancient Indian medical system called Ayurveda, nanosized gold
particles were used in several medicinal preparations [61]. Over 5000 years ago, the
Egyptians also used nanosized gold particles in dentistry [61]. Photography, now an advanced
and mature technology was developed in the eighteenth and nineteenth centuries based on
production of silver nanoparticles sensitive to light. However, the science of nanometer scale
objects was not discussed until much later. In 1959, the Nobel Prize winning physicist,
Richard Feynman presented a visionary and prophetic lecture at a meeting of the American
Physical Society, entitled “There is plenty of room at the bottom”, where he speculated on the
possibility and potential of nanosized materials [61,63]. But, it was not until the 1990s with
the emergence of appropriate methods of fabrication of nanostructures that a notable increase
in research activity occurred, and a number of significant developments resulted. This period
was also marked by the phenomenal success in developing important tools for viewing,
characterizing and for atomic manipulation of the nanostructures. Several sophisticated
instruments for characterization and manipulation such as scanning electron microscopy,
transmission electron microscopy and scanning probe microscopy became available for
researchers to explore the nanoworld.
Owing to their unique properties, nanomaterials are now used in various diverse fields
like nanophotonics, lasers, nanoelectronics, solar cells, resonators, high sensitivity sensors,
catalysis, functional coatings, energy storage, drug delivery and biomedicines [61,62,64].
Today, nanomaterials are revolutionizing social and economic development by offering
innovative and viable solutions to some of the most pressing problems of the world
community. However, these are only a limited part of the fast developing applications of
nanomaterials and numerous other applications of these materials are yet to be unfolded.
46
2.1.2 Nanomaterials as sorbents for radionuclide generators
Nanomaterials are expected to provide unprecedented opportunities in developing a
new class of sorbents for chromatographic applications due to their unique surface and
morphological features. While the structural features of such materials are in between of
those of atoms and the bulk materials, the properties of materials with nanometer dimensions
are significantly different from those of atoms and bulks materials. Due to their small
dimensions, nanomaterials have extremely large surface area to volume ratio, which makes a
large fraction of atoms of the materials to be the surface or interfacial atoms, resulting in
more ‘surface-dependent’ material properties. These surface atoms are unsaturated, exhibit
intrinsic surface reactivity and have a tendency to chemisorb charged species in aqueous
solution in order to achieve surface stabilization. Moreover, the small size of nanomaterials
either renders them free of internal structural imperfections or impurities present cannot
multiply sufficiently in them to cause mechanical failure [65,66]. The imperfections within
the nano dimension are highly energetic and will migrate to the surface to relax themselves
under annealing, thereby leaving pure and perfect material structures inside the
nanomaterials. This phenomenon of increased materials perfection affects the properties of
nanomaterials. For example, the chemical stability for certain nanomaterials may be
enhanced and the mechanical properties of nanomaterials will be better than the
corresponding bulk materials [65,66]. Further, it is reported that nanocrystalline materials are
more radiation resistant than their bulk counterparts with larger grain sizes [67,68].
There are few reports available in the literature on the exploitation of nanomaterial
based sorbents in the chromatographic separation of metal ions [69,70]. However, the
potential of using such materials as column matrices in radionuclide generators for
biomedical applications is yet to be explored. Owing to their high surface area and intrinsic
surface reactivity, nanomaterial based sorbents have much higher sorption capacity and
47
selectivity compared to the conventional sorbents. Consequently, parent radioisotopes
obtained from medium flux reactors with low specific activity can also be used for the
preparation of radionuclide generators and the daughter activity can be availed with
appreciably high radioactive concentration and purity. The enhanced mechanical and
chemical stability of such sorbents ensure that the column matrix does not dissolve even after
multiple elutions and prolonged use of the generator, thereby preventing the addition of
chemical impurities in the eluate. Further, owing to the high radiation stability, nanomaterials
can withstand the radiation environment and demonstrate consistently good performance over
a prolonged period of time.
2.1.3 Synthesis of nanomaterials
The synthesis of nanoparticles forms an essential component of nanoscience and
requires strict control over size, shape and crystalline nature, in order to utilize them for the
desired applications [62]. Several methods of synthesis of nanoparticles have been reported in
the literature, which include high energy milling, sputtering, laser ablation, utilization of
plasma generated by radiofrequency heating coils, thermolysis, combustion, chemical-vapor
deposition, electrodeposition, sol-gel and chemical solution methods [62,71,72]. Of these, the
chemical solution method is probably the most useful method of synthesis of nanomaterial
based sorbents for radionuclide generators. This is primarily due to the suitability of this
method to be scaled up for the routine synthesis of large quantities of nanomaterials using
inexpensive and less complicated apparatus [62]. Moreover, chemical methods have proved
to be much more effective than other methods, as they provide better size-control,
homogeneity and enable different shapes and functionalization [62,71].
Chemical synthesis of nanomaterials has been reviewed by many authors [65,71-74],
and innumerable improvements and better methods are being reported continually. In
accomplishing the synthesis and manipulation of nanomaterials using this approach, a variety
48
of reagents and strategies have been employed, besides, a wide spectrum of reaction
conditions. It must be mentioned here that there is no general strategy to make nanoparticles
with narrow size distribution, tailored properties, and desired morphologies, which could be
universally applied to different materials. It is believed that the formation of nanoparticle
using chemical method follows the classic LaMer mechanism, which suggests a short burst of
nucleation followed by slow diffusive growth, favoring formation of monodisperse
crystalline nanoparticles [75]. In this thesis, chemical solution method has been used for the
syntheses of various nanomaterial based sorbents for use in radionuclide generators.
2.1.4 Characterization of nanomaterials and understanding their properties
The characterization of nanomaterials is generally done with a probe which may
consist of photons, electrons, neutrons, atoms, ions or even atomically sharp pins [61,62,65].
For nanomaterials, the probing light or particle often has varying frequencies, ranging from
gamma to infrared rays or beyond in the case of photons or hyperthermal (<100 keV) to
relativistic energies in case of particles. The resulting information can be processed to yield
images or spectra which reveal the topographic, geometric, structural, chemical or physical
details of the material. Several techniques are available under the broad umbrella of
characterization of materials [61,62,65] and a systematic application of one or more
techniques leads to a complete understanding of the nanomaterial. In this thesis, techniques
like Brunauer-Emmett-Teller (BET) surface area analysis, Fourier Transform Infrared
Spectroscopy (FTIR), powder X-Ray Diffraction (XRD), Transmission Electron Microscopy
(TEM) and zeta-potential analysis were used for the characterization of the materials and
understanding their properties. The chemical stability of the nanomaterial based sorbents in
different medium was determined using Inductively Coupled Plasma Atomic Emission
Spectroscopy (ICP-AES). These techniques are briefly described below.
49
2.1.4.1 BET Surface Area Analysis
Gas sorption (both adsorption and desorption) on the clean surface of dry solid
powders is the most popular method for determining the surface area and pore size
distribution of nanomaterials [76]. In a gas sorption experiment, the material is heated and
degassed by vacuum force or inert gas purging to remove adsorbed foreign molecules.
Controlled doses of an inert gas, such as nitrogen, krypton, or argon, are introduced and the
gas is adsorbed, and later, withdrawn and desorbed. This cycle of adsorption and desorption
is carried out several times. The sample material is placed in a vacuum chamber at a constant
and very low temperature, usually at the temperature of liquid nitrogen (77.4 K), and
subjected to a wide range of pressures, to generate adsorption and desorption isotherms. The
amounts of gas molecules adsorbed or desorbed are determined by the pressure variations due
to the adsorption or desorption of the gas molecules by the material (the adsorbent). Various
amounts of gas molecules will be adsorbed or desorbed at different doses of the gas (the
adsorbate). Knowing the area occupied by one adsorbate molecule, (for example, 16.2 Å2 for
nitrogen), and using an adsorption model, the total surface area of the material can be
determined. The specific surface area that can be determined by gas sorption ranges from
0.01 to over 2000 m2 g-1. Determination of pore size and pore size distribution of porous
materials can also be made from the adsorption/desorption isotherm using an assessment
model, suitable for the shape and structure of the pores [76]. The range of pore sizes that can
be measured using gas sorption is from a few Angstroms up to about half a micron.
2.1.4.2 FTIR Spectroscopy
Molecules and crystals can be thought of as systems of balls (atoms or ions)
connected by springs (chemical bonds) [77]. These systems can be set into vibration, and they
vibrate with frequencies determined by the mass of the balls (atomic weight) and by the
stiffness of the springs (bond strengths). The molecular and crystal vibrations are at very high
50
frequencies ranging from 1012 – 1014 Hz (3-300 µm wavelength), which are in the infrared
(IR) region of the electromagnetic spectrum. The oscillations induced by certain vibrational
frequencies provide a means for matter to couple with an impinging beam of infrared
electromagnetic radiation and to exchange energy with it when the frequencies are in
resonance. These absorption frequencies represent excitation of vibration of the chemical
bonds and are thus specific to the type of bonds and group of atoms involved in the vibration.
In the infrared spectroscopy, the intensity of a beam of infrared radiation is measured before
and after it interacts with the sample as a function of light frequency. A plot of relative
intensity versus frequency is the infrared spectrum. The term ‘FTIR’ refers to Fourier
Transform Infrared Spectroscopy, when the intensity-time output of the interferometer is
subjected to a Fourier Transformation to convert it into the familiar infrared spectrum
(intensity versus frequency). The identities, surrounding environments and atomic
arrangements, and concentration of chemical bonds that are present in the sample can be
determined.
2.1.4.3 Powder X-Ray Diffraction
X-Ray Diffraction (XRD) is a very important technique that has long been used to
address numerous issues related to the crystal structures of solids, including lattice constants
and geometry, identification of unknown materials, orientation of single crystals, preferred
orientation of polycrystals, defects, stresses etc. In XRD, a collimated beam of X-rays with a
wavelength typically ranging from 0.7 to 2 Å, is incident on a specimen and is diffracted by
the crystalline phases in the specimen according to Bragg’s Law [78]:
nλ = 2d sin θ
where, n is the order of diffraction, d is the spacing between atomic planes in the crystalline
phase and λ is the X-ray wavelength. The intensity of the diffracted X-rays is measured as a
function of diffraction angle 2θ and the specimen’s orientation. The diffraction pattern is used
51
to measure the specimen’s crystalline phases and measure its structural properties. The most
commonly used X-ray diffraction technique is the powder diffraction [78]. Powder XRD can
be used to determine the average crystallite size of a nanocrystalline material [78]. If the
average crystallite size in a powder is below a certain limit (~2000 Å diameter), additional
broadening of diffracted X-ray beams occurs. From measurement of this extra broadening an
average crystallite size can be obtained. However, a normal diffraction line might also have a
finite width due to several reasons: the radiation is not absolutely monochromatic, the Kα line
has finite breadth due to Heisenberg Uncertainty Principle and the focusing geometry of the
instrument may not be perfect for a variety of reasons. In order to correct for the peak
broadening which is caused by the diffractometer due to the aforementioned reasons, the peak
broadening due a sample is always measured in comparison with that of a standard material.
The crystallite size, D, might be estimated from the peak width using the Scherrer’s formula:
0.9cos
DB
λ
θ=
where, λ is the X-ray wavelength and θ is the Bragg angle. B is the line broadening,
indicating the extra peak width of the sample in comparison to the standard, derived using the
Warren formula, B2 = BM2 – BS
2, where M and S refer to specimen and the standard. BM and
BS are measured in radians at half the peak height (full width at half maxima, FWHM). The
sample and standard must have peaks close to each other. With good experimental
techniques, crystallite sizes up to 200 nm can be measured by using the Scherrer formula. In
the range of 5-50 nm, the broadening is easy to determine. At larger particle sizes, the
difference between the sample and standard is small and at small particle sizes, the peak is
difficult to distinguish from the background. For smaller particles, low angle peaks are used
for size determination as they are less broad as compared to the large angle peaks.
2.1.4.4 Transmission electron microscopy
Transmission Electron Microscopy (TEM) is a well known technique for imaging
52
solid materials at atomic resolution. Structural information can be acquired both by (high
resolution) imaging as well as by electron diffraction [65]. Additional detectors allow for
elemental and chemical analysis down to sub-nanometer scale. The greatest advantages that
TEM offers are the high magnification ranging from 50 to 106 and its ability to provide both
image and diffraction information from a single sample. TEM instruments with resolving
powers in the vicinity of 1 Å are now common and have become one of the most essential
tools for the characterization of nanomaterials. In TEM, the electrons from a source such as
an electron gun (W or LaB6) enter the sample, are scattered as they pass through it, are
focused by the objective lens, are amplified by the magnifying projector lens, and finally
produce the desired image. The transmitted electrons are used to create the image of a
sample. Scattering occurs when an electron beam interacts with matter. Elastic scattering
involves no energy loss and give rise to diffraction patterns. Inelastic interactions between
primary electrons and the sample electrons at heterogeneities such as grain boundaries,
dislocations, second phase particles, defects, density variations etc., can cause complex
absorption and scattering effects, leading to a spatial variation in the intensity of the
transmitted electrons. In TEM, one can switch between imaging the sample and viewing its
diffraction pattern by changing the strength of the intermediate lens.
The higher the operating voltage of a TEM instrument, the greater is the lateral spatial
resolution. High voltage TEM instruments (e.g. with 400 kV) have resolutions better than 0.2
nm. High voltage TEM instruments have additional advantage of greater electron penetration,
because high energy electrons interact less strongly with matter than low energy electrons. So
it is possible to work with thicker samples using a high voltage TEM. However, the chances
of irradiation damages are more at higher acceleration voltages.
2.1.4.5 Zeta potential of nanomaterial based sorbents
The zeta potential (ζ) of a nanomaterial based sorbent is commonly used to describe
53
the charge developed on the surface of the nanoparticles when they interact with their
surroundings and is a very useful tool in the interpretation of their sorption behavior. The
development of positive or negative charge at the surface of the nanoparticle affects the
distribution of ions in the surrounding interfacial region, resulting in an increased
concentration of counter ions (ions of charge opposite to that of the particle) close to the
surface. Thus an electrical double layer exists round each particle [79,80]. The liquid layer
surrounding the particle exists as two parts; an inner region (Stern plane) where the ions are
strongly bound and an outer (diffuse) region where they are less firmly associated. Within the
diffuse layer there is a notional boundary inside which the ions and particles form a stable
entity. When a particle moves (e.g. due to gravity), ions within the boundary also move with
it. Those ions beyond the boundary stay with the bulk dispersant. The potential at this
boundary (surface of hydrodynamic shear) is the zeta potential (ζ).The pH of the solution in
which the nanomaterial is dispersed is one of the most important factors that affect its zeta
potential. A zeta potential value on its own without defining the solution conditions is
virtually a meaningless number. Generally, the zeta potential values change with change in
pH of the solution. Sometimes, at a particular pH, the zeta potential of a nanoparticle is zero.
This point is called as ‘isoelectric point’ (IEP) of the sample.
When nanoparticles are dispersed in the electrolyte of interest and an electric field is
applied across the electrolyte, the charged nanoparticles suspended in the electrolyte are
attracted towards the electrode of opposite charge due to electrostatic attraction. Viscous
forces acting on the particles tend to oppose this movement. When equilibrium is reached
between these two opposing forces, the particles move with constant velocity. The velocity is
dependent on the strength of electric field or voltage gradient, the dielectric constant of the
medium, the viscosity of the medium and the zeta potential. The velocity of a particle in a
54
unit electric field is referred to as its electrophoretic mobility. Zeta potential is related to the
electrophoretic mobility by the Henry equation:-
2 ( )3
Ef a
Uες κ
η=
where UE = electrophoretic mobility, ζ = zeta potential, ε = dielectric constant, η = viscosity
and f(κa) = Henry’s function which depends on the ratio of the particle radius to electrical
double layer thickness. For aqueous electrolyte of moderate concentration, f(κa) is taken as
1.5, and this is referred to as the Smoluchowski approximation.
The zeta potential of a sample is measured by an instrument known as ‘Zetasizer’,
which uses a combination of laser Doppler velocimetry and phase analysis light scattering
(PALS) [81]. A laser is used to provide a light source to illuminate the particles within the
sample. This light source is split to provide an incident and reference beam. The incident
laser beam passes through the centre of the sample cell, and the scattered light is detected.
When an electric field is applied to the cell, any particles moving through the measurement
volume will cause the intensity of light detected to fluctuate with a frequency proportional to
the particle speed (electrophoretic mobility) and this information is passed to a digital signal
processor and then to a computer. The zetasizer has a software which produces a frequency
spectrum from which the electrophoretic mobility and hence zeta potential is calculated.
2.1.4.6 Inductively coupled plasma atomic emission spectroscopy (ICP-AES)
ICP-AES is a spectral method used to determine very precisely the presence of metal
analyte and the elemental concentration thereof. There are numerous reports on utilization of
this technique for analysis of nanoparticles [82-85]. ICP-AES analysis requires a sample to be
in solution. It works by the emission of photons from analytes that are brought to an excited
state by the use of high-energy plasma. The plasma source is induced when passing argon gas
through an alternating electric field that is created by an inductively couple coil. A peristaltic
pump delivers the sample into a nebulizer where it is atomized and introduced directly inside
55
the plasma flame. When the analyte is excited, the electrons try to dissipate the induced
energy by moving to a ground state of lower energy and in doing this they emit the excess
energy in the form of light. The wavelength of light emitted depends on the energy gap
between the excited energy level and the ground state and is thus specific to the element. In
this way, the wavelength of light can be used to determine what elements are present by
detection of the light at specific wavelengths. In order to determine the concentration of
elements present, a calibration curve is developed using analyte solutions of known
concentrations, whereby the intensity of the signal changes as a function of the concentration
of the material that is present. When measuring the intensity from a sample of unknown
concentration, the intensity from this sample can be compared with the calibration curve to
determine the concentration of the analytes within the sample.
2.1.5 The present work
This chapter describes the synthesis and characterization of four nanomaterial based
sorbents, namely, polymer embedded nanocrystalline titania (TiP), mixed phase nano-
zirconia (nano-ZrO2), tetragonal nano-zirconia (t-ZrO2) and nano-ceria-polyacrylonitrile
composite (CeO2-PAN) for use in the preparation of radionuclide generators.
2.2 Materials
2.2.1 Chemicals
Reagents such as hydrochloric acid, ammonium hydroxide, oxalic acid, cerium (III)
nitrate etc. were of analytical grade and were procured from S.D. Fine Chemicals, Mumbai,
India. Zirconyl chloride (ZrOCl2.8H2O), titanium tetrachloride and isopropyl alcohol (A.R.
grade) were obtained from E. Merck, Darmstadt, Germany. Polyacrylonitrile (PAN) beads
(+99.9%, A.R. grade) were procured from Aldrich, England.
56
2.2.2 Instruments
X-ray diffraction
X-ray diffraction data were collected on the powder sample for the phase
identification and crystallite size estimation, using monochromatized Cu-Kα radiation on a
PANalytical X-ray diffractometer (X’pert PRO). The instrument was operated at 40 kV and
30 mA. Silicon was used as an external standard for the correction due to instrumental line
broadening. The nano powder was ground and loaded in the groove of the perspex sample
holder. XRD pattern was recorded in the 2θ range of 10-90o for 1 h with a scan step size of
0.02o.
Surface area measurement
The surface area and the pore size analysis were carried out by nitrogen adsorption
(BET) technique at 77 K using Quantachrome, Autosorb-1 analyzer (Quantachrome
Instruments, FL 33426 USA). The nanomaterial was first preheated in vacuum at 300o C for 1
h to activate the sample.
Transmission electron microscopy
TEM data were recorded using TEM, JEOL FX microscope (Jeol Ltd., Tokyo, Japan)
on the powder sample. The preparation of samples for TEM analysis involved sonication in
ethanol for 5 minutes and deposition on a carbon coated copper grid. The accelerating voltage
of the electron beam was 200 kV.
Zeta potential analysis
The zeta potential of the nanomaterials was measured using a zeta potential analyzer
(Zetasizer Nano ZS/ZEN3600, Malvern Instruments Ltd., UK). The preparation of samples
for zeta potential analysis involved dispersion of ~5 mg of the nanomaterial in 50 mL of de-
ionized water, followed by sonication for 5 min. The pH of the suspension was adjusted using
57
HClO4 and NaOH solution, and a small volume of the suspension was injected into the
electrolytic cell. All measurements were carried out at 25 ºC in triplicate.
ICP-AES analysis
The chemical analysis for the determination of trace levels of metal ion contaminants
in solution was done using ICP-AES (ICP-AES Model JY-238, Emission Horiba Group,
France). The calibration curve for the metal ions was obtained by using standard solutions
having known concentration of these ions.
2.3 Synthesis and characterization of TiP
2.3.1 Synthesis of TiP
Titanium tetrachloride was drop-wise added to isopropyl alcohol with vigorous
stirring. The ratio of the two reactants, titanium tetrachloride : isopropyl alcohol was
maintained at 2:1 (v/v). The viscosity of the reaction mixture increased gradually with time
and after 4-6 h, a semisolid mass was formed which was difficult to stir. The reaction
between isopropyl alcohol and titanium tetrachloride was very slow. The semisolid mass was
kept for 5 days to complete the reaction and subsequently dried under an infrared lamp at a
temperature of 80o-90o C for nearly 2 days to remove the generated HCl fumes and excess
unreacted isopropyl alcohol. The reaction time and the drying time were very important for
the preparation of the desired quality sorbent. With decrease in reaction time, the product
obtained was not homogeneous and crumbled into fine powder. The material obtained after
this initial stage of drying was water soluble. To render the water soluble precursor as an
insoluble sorbent, it was heated for 2 h at a temperature of 160 ºC in a furnace. The solid mass
obtained was subjected to repeated washings with distilled water to remove traces of
remaining HCl and isopropyl alcohol. The residue was dried, ground in a porcelain mortar
and sieved using a sieve of 50-100 mesh (149 – 297 µm). After drying and sieving, the
58
product obtained was granular and exhibited free flow characteristics for use in a column. It
was insoluble in water and most of the mineral acids and alkalis.
2.3.2 Chemical stability of TiP
The chemical stability of the TiP was assessed in several mineral acids and bases,
such as HCl, HNO3, NaOH and NH4OH of concentration up to 5 N. A weighed amount of
TiP (1 g) was placed in 50 mL solvent of interest and kept for 24 h with continuous shaking
at room temperature. It was clear that only a negligible amount of sorbent dissolved even
after 24 h of shaking, as there was no turbidity in the solvent. Subsequently, it was filtered
and the level of Ti metal ions in the filtrate, as determined by ICP-AES analysis was <0.1
ppm. This characteristic shows that the sorbent can safely be used for generator preparation.
2.3.3 Structural characterization of TiP
The structural characteristics of TiP were investigated by various analytical
techniques like FTIR spectroscopy, BET surface area analysis, XRD and TEM.
2.3.3.1 FTIR spectroscopy
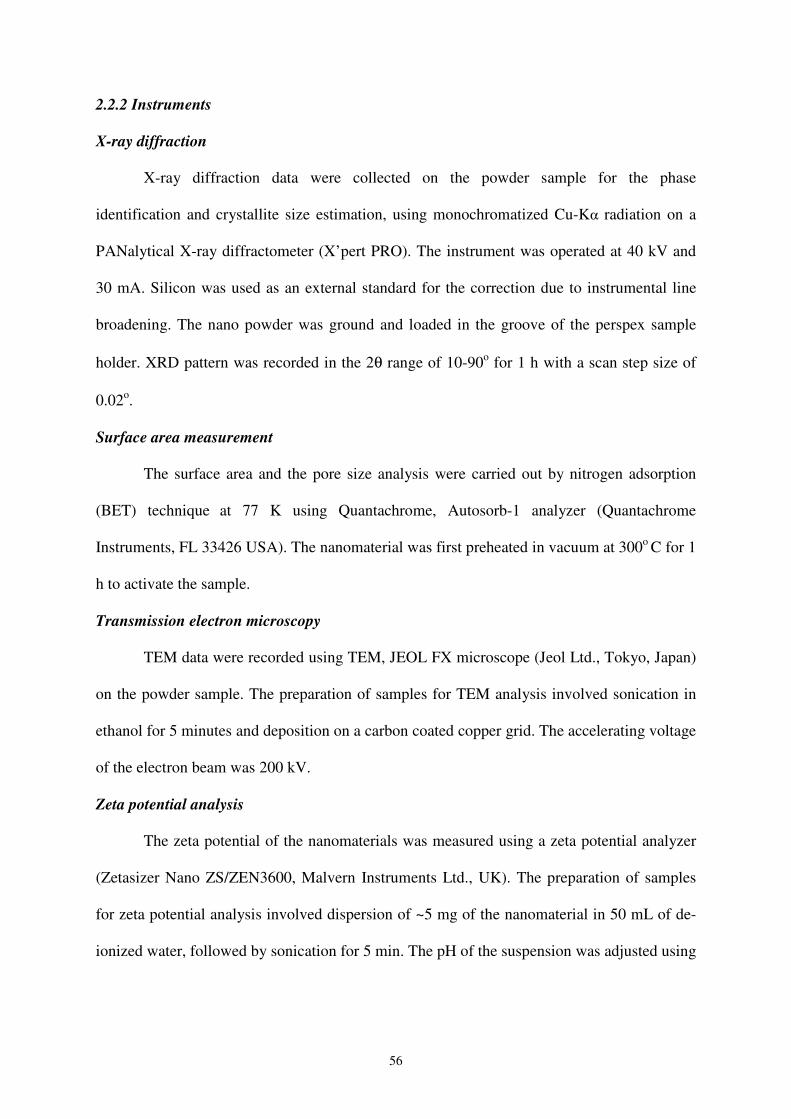
The FTIR spectrum of TiP is shown in Fig. 2.1. The sample as such showed a broad
absorption peak in the range 3600-3000 cm-1, which was due to the sum of the contributions
of hydroxyl groups and water molecules. Absorption peak at 1614 cm-1 was due to the
bending mode of OH- group attached to the matrix. The continuous absorption peak
appearing at <1000 cm-1 was due to titanium-oxygen bonds [86].
2.3.3.2 BET surface area analysis
The surface area measurement by standard BET technique was carried out on the
prepared sample. The surface area of TiP was found to be 30 m2 g-1. The surface area was
also measured after decomposing the polymer matrix and it was found to be 38 m2 g-1. The
increase in surface area might be due to the decomposition of the sorbent accompanied by
59
evolution of gases, which makes the product more porous. The average pore size of the
powder was found to be ~4 Å.
4000 3600 3200 2800 2400 2000 1600 1200 800 400
% T
(a.u
.)
Wavenumber (cm-1)
Fig. 2.1: FTIR spectrum of TiP
2.3.3.3 XRD studies
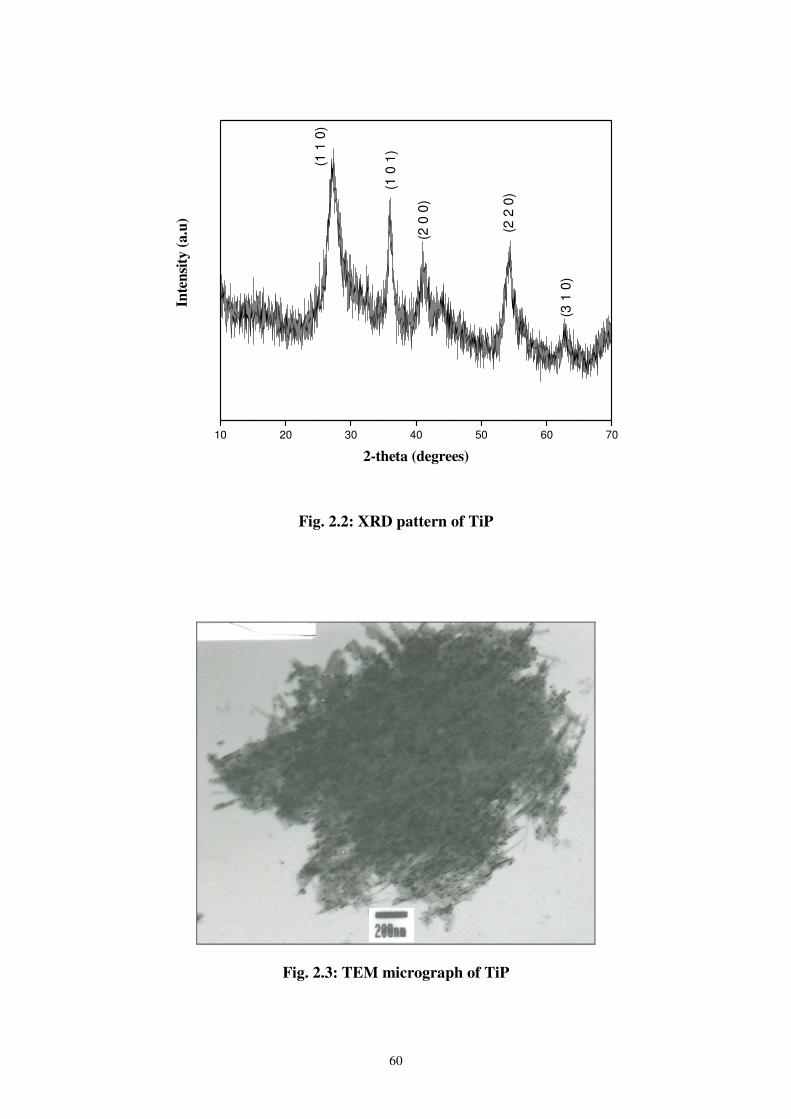
The XRD pattern of TiP is shown in Fig. 2.2 and it matches well with the rutile
modification of TiO2. The average crystallite size of TiO2 was calculated using Scherrer’s
formula and was found to be 5.2 ± 0.6 nm (n=5).
2.3.3.4 TEM studies
The TEM micrograph of TiP is shown in Fig. 2.3 and it reveals the network of
polymer with dispersed titania phase. The crystallite size of TiP as observed from the TEM
micrograph ranged between 4-6 nm, which was in accordance with the result obtained from
XRD studies. Excess time exposure of the electron beam to the sample caused degradation of
the polymer. This led us to the inference that in TiP, TiO2 nanoparticles are embedded in the
polymer matrix.
60
10 20 30 40 50 60 70
(3 1
0)
(2 2
0)
(2 0
0)
(1 0
1)
(1 1
0)
Inte
nsi
ty (
a.u
)
2-theta (degrees)
Fig. 2.2: XRD pattern of TiP
Fig. 2.3: TEM micrograph of TiP
61
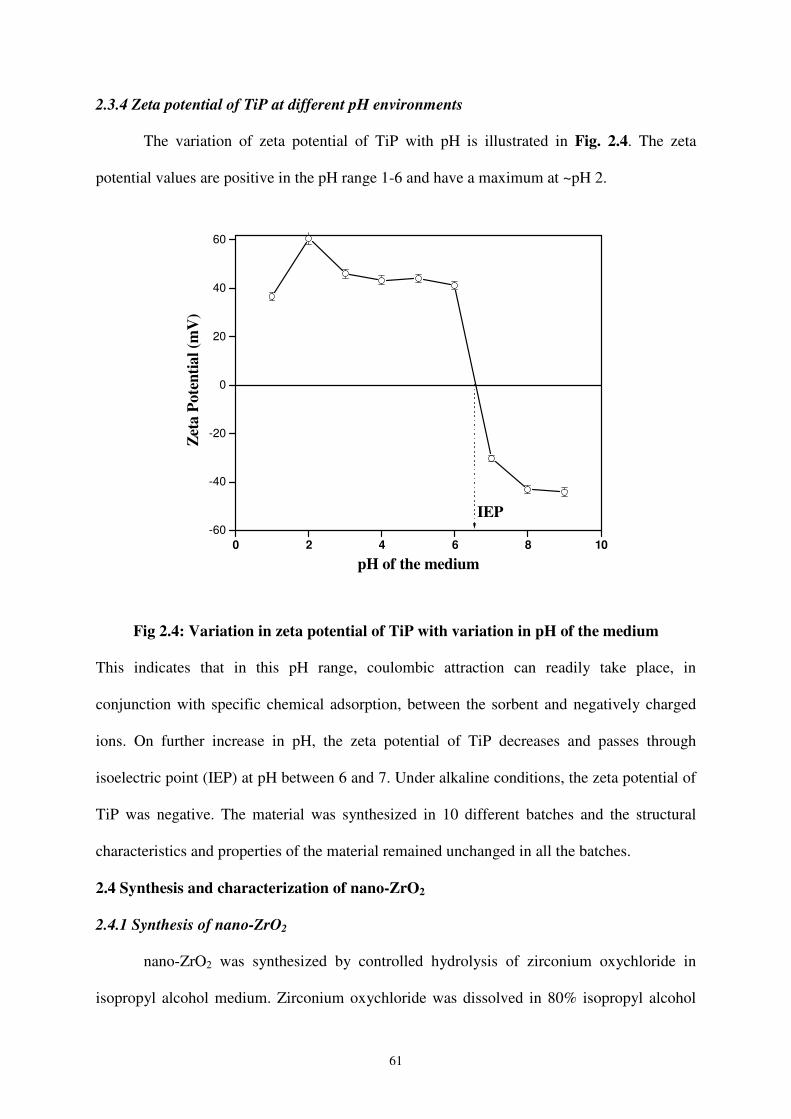
2.3.4 Zeta potential of TiP at different pH environments
The variation of zeta potential of TiP with pH is illustrated in Fig. 2.4. The zeta
potential values are positive in the pH range 1-6 and have a maximum at ~pH 2.
0 2 4 6 8 10
-60
-40
-20
0
20
40
60
IEP
Zet
a P
ote
nti
al
(mV
)
pH of the medium
Fig 2.4: Variation in zeta potential of TiP with variation in pH of the medium
This indicates that in this pH range, coulombic attraction can readily take place, in
conjunction with specific chemical adsorption, between the sorbent and negatively charged
ions. On further increase in pH, the zeta potential of TiP decreases and passes through
isoelectric point (IEP) at pH between 6 and 7. Under alkaline conditions, the zeta potential of
TiP was negative. The material was synthesized in 10 different batches and the structural
characteristics and properties of the material remained unchanged in all the batches.
2.4 Synthesis and characterization of nano-ZrO2
2.4.1 Synthesis of nano-ZrO2
nano-ZrO2 was synthesized by controlled hydrolysis of zirconium oxychloride in
isopropyl alcohol medium. Zirconium oxychloride was dissolved in 80% isopropyl alcohol
62
and 20% ammonia solution in isopropyl alcohol medium was added drop-wise to it with
vigorous stirring. The stirring of the reaction mixture was essential in order to prevent
agglomeration and obtain nanocrystalline zirconia. The ammonia solution was added until
complete formation of the white precipitate. However, the pH of the reaction medium was
maintained at ~4 during the course of the reaction. The precipitate was subsequently refluxed
for 12 hours at ~96 οC, maintaining pH at ~4, to facilitate the stabilization of the nano-
zirconia particles. The precipitate obtained was washed with distilled water, dried at 100 °C
and calcined at 600 °C for 2 h. The material produced was sieved to obtain particles of 50-100
mesh size (149 – 297 µm). The product obtained was granular with adequate mechanical
strength for reliable fixed-bed column operation.
2.4.2 Chemical stability of nano-ZrO2
The chemical stability of the nano-ZrO2 was assessed in several mineral acids and
bases, such as HCl, HNO3, NaOH and NH4OH of concentration up to 5 N. A weighed
amount of nano-ZrO2 (1 g) was placed in 50 mL solvent of interest and kept for 24 h with
continuous shaking at room temperature. It was clear that no appreciable amount of
dissolution took place and the sorbent was fairly stable in most of the dilute mineral acids and
alkalis. There was no turbidity when the sorbent was suspended in dilute mineral acids and
alkalis for 24 hours. Subsequently, it was filtered and the level of Zr metal ions in the filtrate,
as determined by ICP-AES was <0.1 ppm. This characteristic shows that the sorbent can
safely be used for generator preparation.
2.4.3 Structural characterization of nano-ZrO2
In order to obtain information on the structure of nano-ZrO2, it was subjected to FTIR
spectroscopy, BET surface area analysis, XRD and TEM.
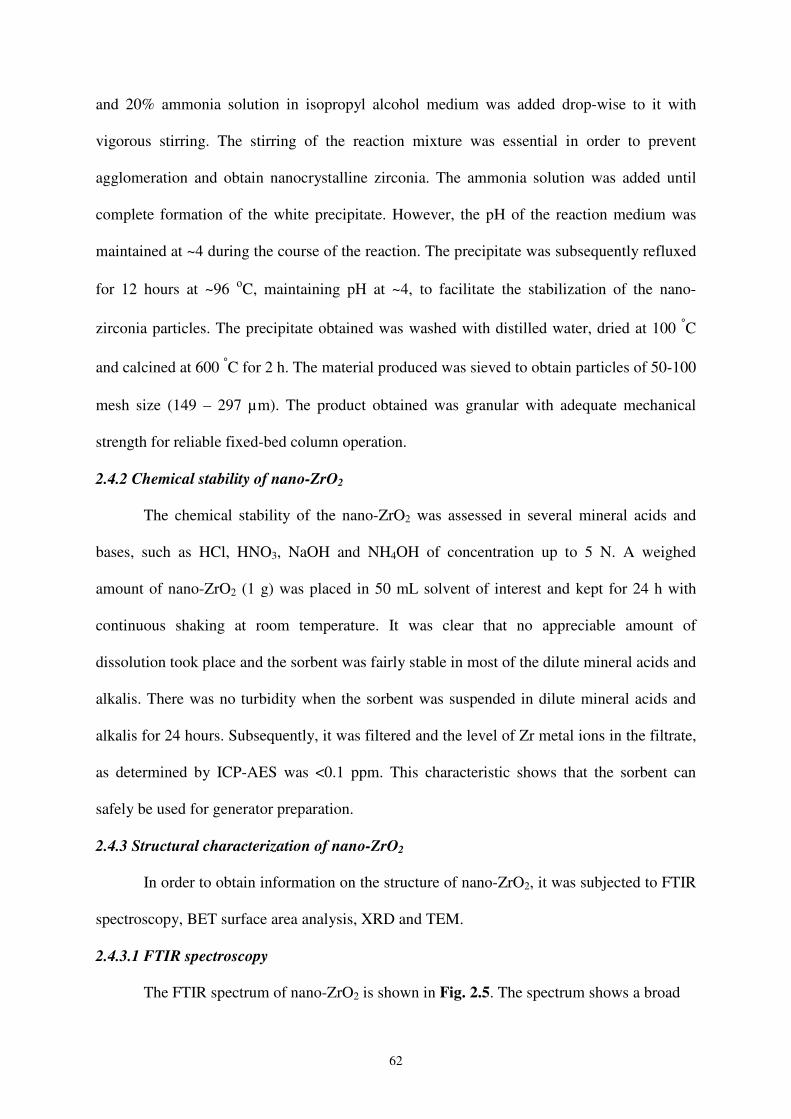
2.4.3.1 FTIR spectroscopy
The FTIR spectrum of nano-ZrO2 is shown in Fig. 2.5. The spectrum shows a broad
63
absorption peak in the range 3600-3000 cm-1, which can be attributed to the sum of the
contributions of hydroxyl groups and water molecules.
4000 3500 3000 2500 2000 1500 1000
% T
(a.u
.)
Wavenumber(cm-1)
Fig. 2.5: FTIR spectrum of nano-ZrO2
The absorption band centred at around ~1614 cm-1 can be attributed to the bending mode of
OH- group attached to the matrix. The band at 490-501 cm-1 is attributed to Zr-O-Zr bond
[87]. The presence of a small peak at ~2300 cm-1 may be due to carbon dioxide trapped inside
the bulk structure of the nano oxide.
2.4.3.2 BET surface area analysis
The surface area measurement and the pore size distribution of the sorbent were
carried out by standard BET technique. The surface area of nano-ZrO2 was found to be ~45
m2 g-1. The average pore size was determined to be ~4 Å. It was observed that the pore sizes
were quite uniform.
2.4.3.3 XRD studies
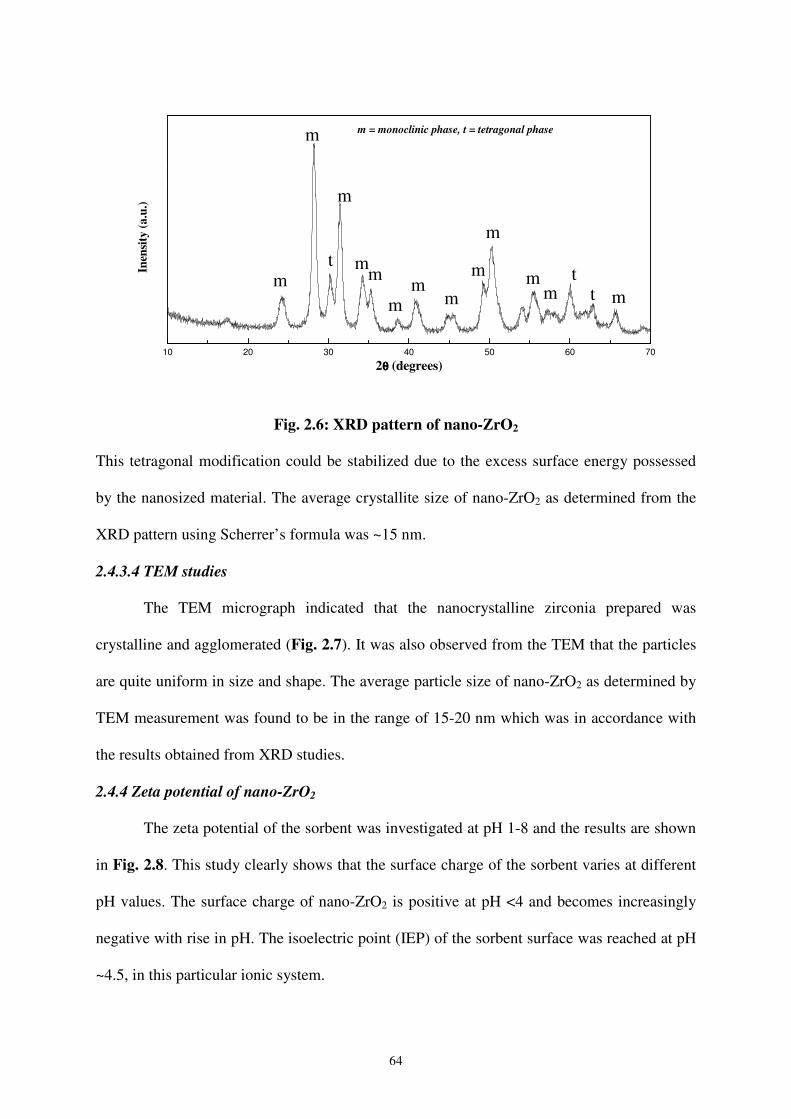
The XRD pattern of nano-ZrO2 is shown in Fig. 2.6. It shows that nanocrystalline
zirconia prepared by this method consists of two phases, of which the major crystalline phase
is monoclinic zirconia. The minor phase is tetragonal zirconia.
64
10 20 30 40 50 60 70
m = monoclinic phase, t = tetragonal phase
m
m
mtt
t
mm
m
mm
mm
m
m
m
Inen
sity
(a.u
.)
2θθθθ (degrees)
Fig. 2.6: XRD pattern of nano-ZrO2
This tetragonal modification could be stabilized due to the excess surface energy possessed
by the nanosized material. The average crystallite size of nano-ZrO2 as determined from the
XRD pattern using Scherrer’s formula was ~15 nm.
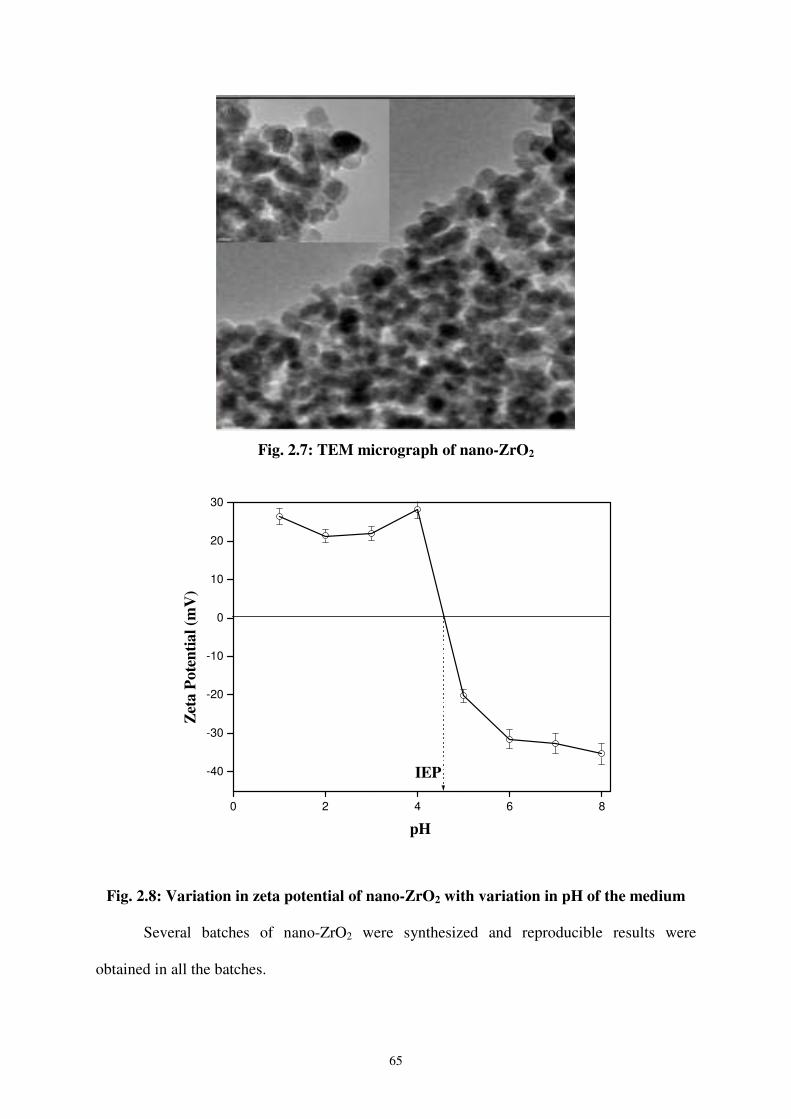
2.4.3.4 TEM studies
The TEM micrograph indicated that the nanocrystalline zirconia prepared was
crystalline and agglomerated (Fig. 2.7). It was also observed from the TEM that the particles
are quite uniform in size and shape. The average particle size of nano-ZrO2 as determined by
TEM measurement was found to be in the range of 15-20 nm which was in accordance with
the results obtained from XRD studies.
2.4.4 Zeta potential of nano-ZrO2
The zeta potential of the sorbent was investigated at pH 1-8 and the results are shown
in Fig. 2.8. This study clearly shows that the surface charge of the sorbent varies at different
pH values. The surface charge of nano-ZrO2 is positive at pH <4 and becomes increasingly
negative with rise in pH. The isoelectric point (IEP) of the sorbent surface was reached at pH
~4.5, in this particular ionic system.
65
Fig. 2.7: TEM micrograph of nano-ZrO2
0 2 4 6 8
-40
-30
-20
-10
0
10
20
30
IEP
Zet
a P
ote
nti
al
(mV
)
pH
Fig. 2.8: Variation in zeta potential of nano-ZrO2 with variation in pH of the medium
Several batches of nano-ZrO2 were synthesized and reproducible results were
obtained in all the batches.
66
2.5 Synthesis and characterization of t-ZrO2
2.5.1 Synthesis of t-ZrO2
t-ZrO2 was synthesized by controlled hydrolysis of zirconyl chloride in ammonical
medium as per the procedure reported by Yin et al [88]. Zirconyl chloride solution (0.17 M)
was added drop-wise into a round bottom flask containing 2.5 M ammonia solution, with
careful control of pH (9-11) and with vigorous stirring. This order of addition of reagents is
important as formation of zirconia precipitate in alkaline environment helps in stabilization of
the precursor to t-ZrO2 nanoparticles [89,90]. The vigorous stirring of the reaction mixture
prevents agglomeration of the precipitate and hence facilitates the formation of the
nanoparticles. The resultant hydrogel was washed with de-ionized water until free of chloride
ions. The hydrogel was then digested under reflux at 96 οC for 24 h in a 1 L round bottom
flask that contained aqueous solution of ammonia (pH ~12). The reflux digestion of the basic
solution in the glass vessel leads to stabilization of nanometer-sized tetragonal crystals [88].
Subsequently, the digested gel was washed extensively with de-ionized water. The washed
gel was dried at 100 οC overnight. The dried gel was calcined at 600 οC for 5 h and used for
structural studies. Further, it was ground in a porcelain mortar and sieved to get particles of
50-100 mesh (149 – 297 µm). The product obtained was granular in texture with adequate
mechanical strength and exhibited free flowing characteristics in fixed-bed column operation.
2.5.2 Chemical stability of t-ZrO2
The chemical stability of the t-ZrO2 was assessed in several mineral acids and bases,
such as HCl, HNO3, NaOH and NH4OH of concentration up to 5 N. A weighed amount of t-
ZrO2 (1 g) was placed in 50 mL solvent of interest and kept for 24 h with continuous shaking
at room temperature. The solvent used was clear and no turbidity was observed in it even
after 24 h of shaking with t-ZrO2 suspended in it. Subsequently, it was filtered and the level
of Zr metal ions in the filtrate as determined by ICP-AES analysis, was <0.1 ppm. This shows
67
that t-ZrO2 is insoluble in water, dilute mineral acids and alkalis and can safely be used as a
sorbent in a radionuclide generator.
2.5.3 Structural characterization of t-ZrO2
The structural characterization of t-ZrO2 was carried out by various analytical
techniques such as FTIR spectroscopy, BET surface area and pore size analysis, XRD and
TEM.
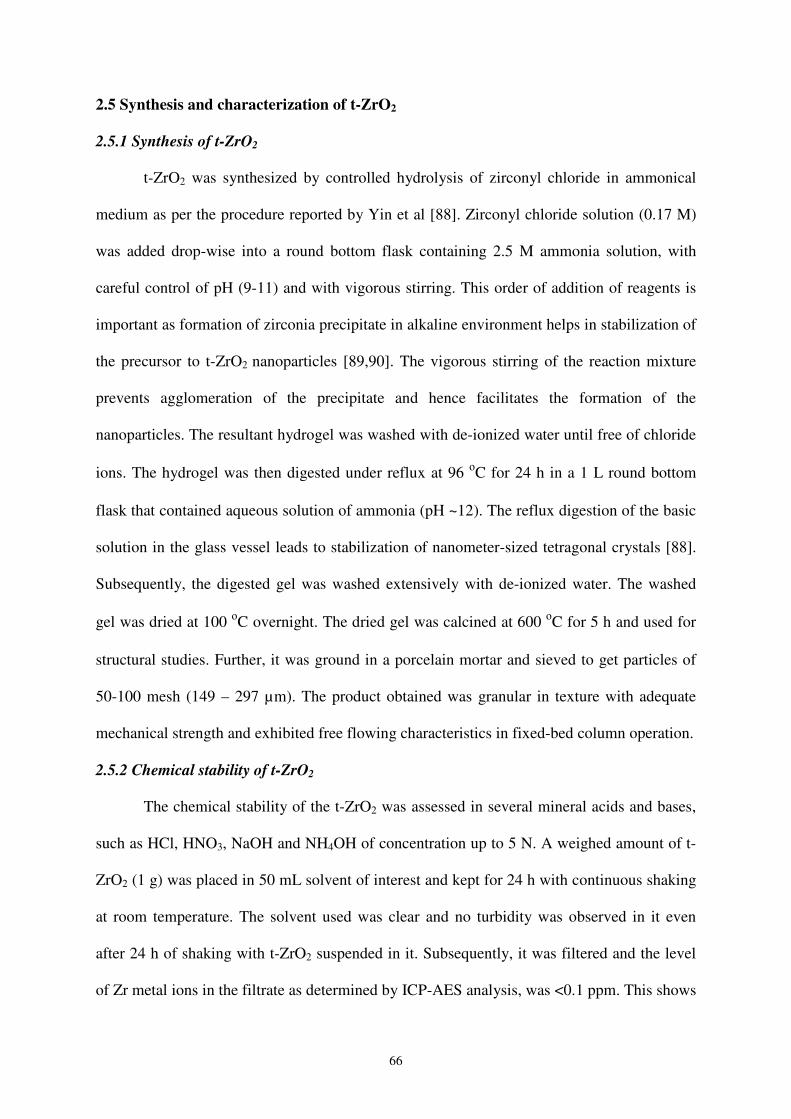
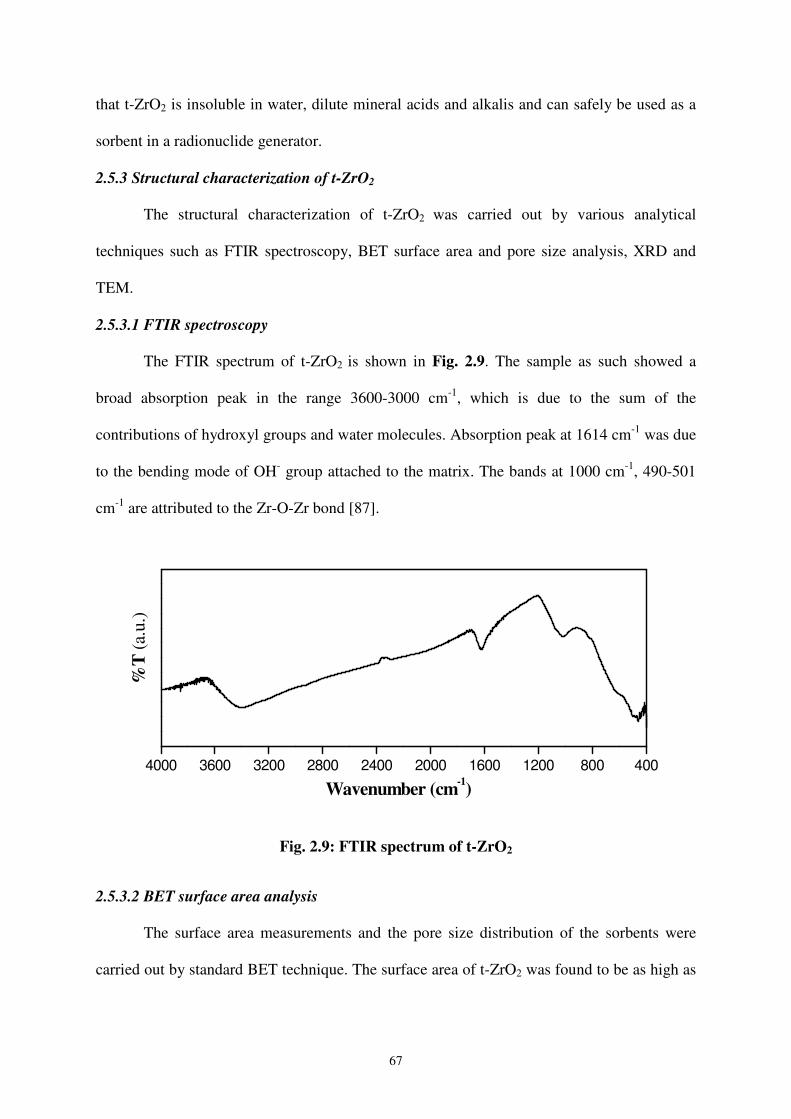
2.5.3.1 FTIR spectroscopy
The FTIR spectrum of t-ZrO2 is shown in Fig. 2.9. The sample as such showed a
broad absorption peak in the range 3600-3000 cm-1, which is due to the sum of the
contributions of hydroxyl groups and water molecules. Absorption peak at 1614 cm-1 was due
to the bending mode of OH- group attached to the matrix. The bands at 1000 cm-1, 490-501
cm-1 are attributed to the Zr-O-Zr bond [87].
4000 3600 3200 2800 2400 2000 1600 1200 800 400
Wavenumber (cm-1)
%T
(a.u
.)
Fig. 2.9: FTIR spectrum of t-ZrO2
2.5.3.2 BET surface area analysis
The surface area measurements and the pore size distribution of the sorbents were
carried out by standard BET technique. The surface area of t-ZrO2 was found to be as high as
68
~340 m2 g-1. The average pore size of the material was determined to be ~4 Å. It was
observed that pores sizes are uniform which facilitate permeation of liquid.
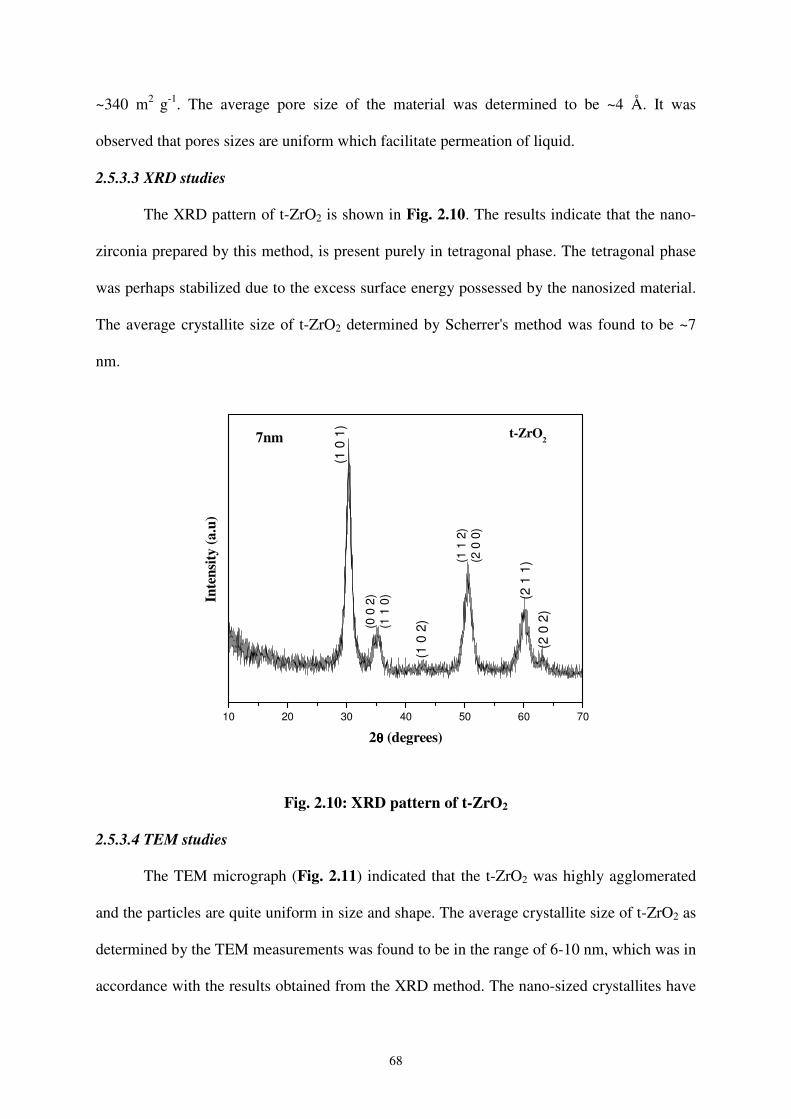
2.5.3.3 XRD studies
The XRD pattern of t-ZrO2 is shown in Fig. 2.10. The results indicate that the nano-
zirconia prepared by this method, is present purely in tetragonal phase. The tetragonal phase
was perhaps stabilized due to the excess surface energy possessed by the nanosized material.
The average crystallite size of t-ZrO2 determined by Scherrer's method was found to be ~7
nm.
10 20 30 40 50 60 70
(2 0
2)
(2 1
1)
(0 0
2)
(1 1
0)
(1 0
2)
(1 1
2)
(2 0
0)
(1 0
1)
t-ZrO27nm
Inte
nsi
ty (
a.u
)
2θθθθ (degrees)
Fig. 2.10: XRD pattern of t-ZrO2
2.5.3.4 TEM studies
The TEM micrograph (Fig. 2.11) indicated that the t-ZrO2 was highly agglomerated
and the particles are quite uniform in size and shape. The average crystallite size of t-ZrO2 as
determined by the TEM measurements was found to be in the range of 6-10 nm, which was in
accordance with the results obtained from the XRD method. The nano-sized crystallites have
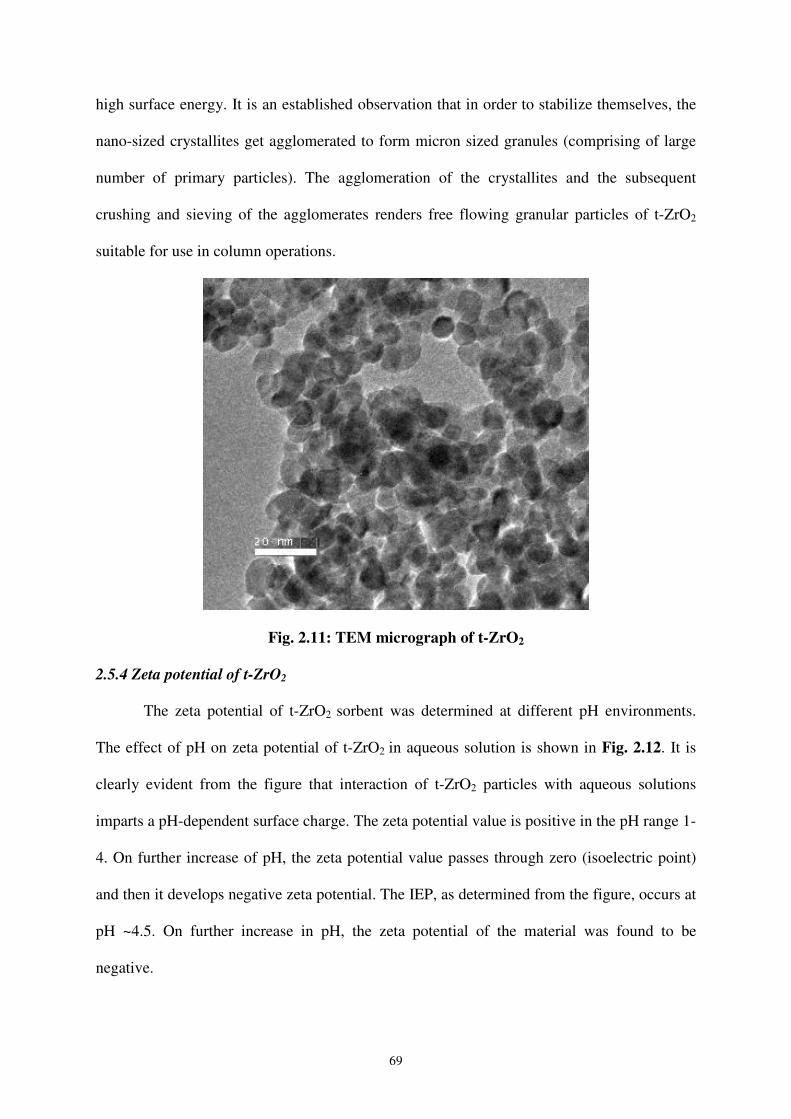
69
high surface energy. It is an established observation that in order to stabilize themselves, the
nano-sized crystallites get agglomerated to form micron sized granules (comprising of large
number of primary particles). The agglomeration of the crystallites and the subsequent
crushing and sieving of the agglomerates renders free flowing granular particles of t-ZrO2
suitable for use in column operations.
Fig. 2.11: TEM micrograph of t-ZrO2
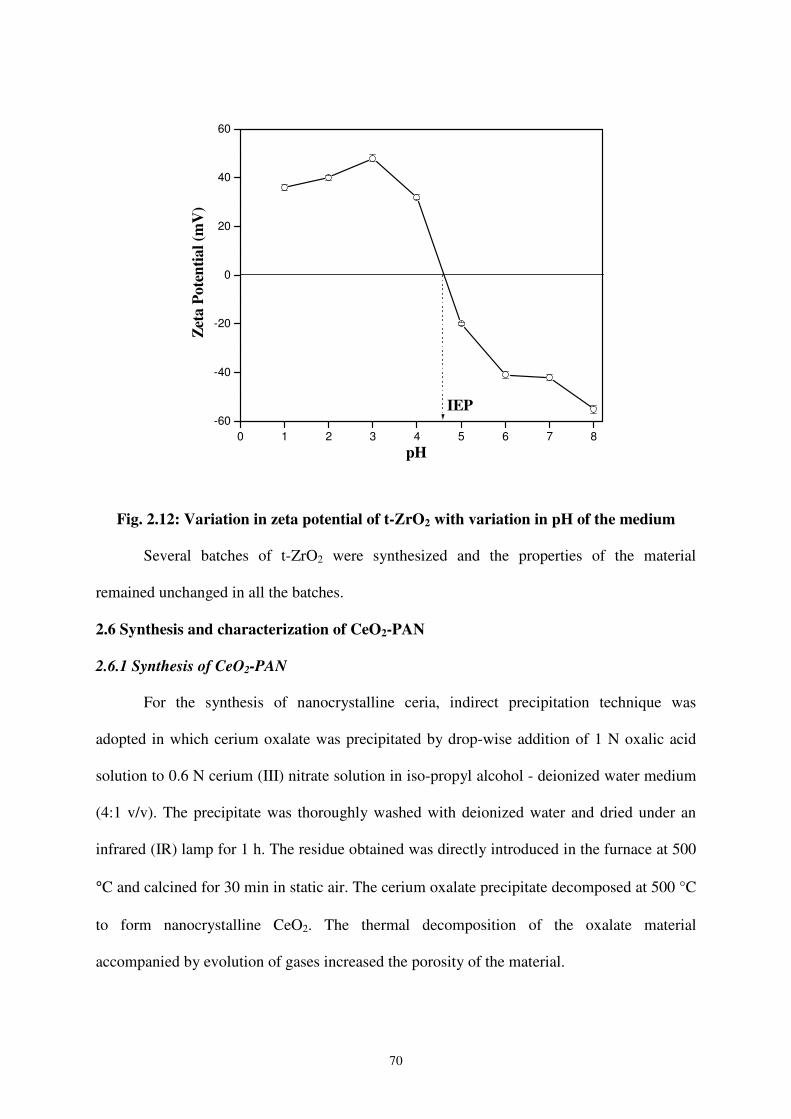
2.5.4 Zeta potential of t-ZrO2
The zeta potential of t-ZrO2 sorbent was determined at different pH environments.
The effect of pH on zeta potential of t-ZrO2 in aqueous solution is shown in Fig. 2.12. It is
clearly evident from the figure that interaction of t-ZrO2 particles with aqueous solutions
imparts a pH-dependent surface charge. The zeta potential value is positive in the pH range 1-
4. On further increase of pH, the zeta potential value passes through zero (isoelectric point)
and then it develops negative zeta potential. The IEP, as determined from the figure, occurs at
pH ~4.5. On further increase in pH, the zeta potential of the material was found to be
negative.
70
0 1 2 3 4 5 6 7 8
-60
-40
-20
0
20
40
60
IEP
Zet
a P
ote
nti
al
(mV
)
pH
Fig. 2.12: Variation in zeta potential of t-ZrO2 with variation in pH of the medium
Several batches of t-ZrO2 were synthesized and the properties of the material
remained unchanged in all the batches.
2.6 Synthesis and characterization of CeO2-PAN
2.6.1 Synthesis of CeO2-PAN
For the synthesis of nanocrystalline ceria, indirect precipitation technique was
adopted in which cerium oxalate was precipitated by drop-wise addition of 1 N oxalic acid
solution to 0.6 N cerium (III) nitrate solution in iso-propyl alcohol - deionized water medium
(4:1 v/v). The precipitate was thoroughly washed with deionized water and dried under an
infrared (IR) lamp for 1 h. The residue obtained was directly introduced in the furnace at 500
°C and calcined for 30 min in static air. The cerium oxalate precipitate decomposed at 500 °C
to form nanocrystalline CeO2. The thermal decomposition of the oxalate material
accompanied by evolution of gases increased the porosity of the material.
71
The material obtained consisted of fine powder and hence was not amenable for use
as a column matrix owing to low permeability to aqueous solutions. In order to use nano ceria
for column applications, a suitable binding agent was required, which would improve the
granulometric properties and flow characteristics of the sorbent material [91-93].
Polyacrlonitrile (PAN) was selected for this purpose due to its favorable features such as
strong adhesive force with inorganic materials, high hydrophilicity, excellent chemical
stability in acidic and radiation environments [91-94]. PAN has been shown to effectively
immobilize ion-exchange materials into granular forms, without altering the sorption
behavior of these materials [91-93]. The PAN granules obtained by dispersing PAN solution
in water are highly porous [91-93,95]. The pores of these granules are mainly (>99.9%)
composed of macropores (pore size >0.05 µm) along with a minor portion (<0.1%) of
mesopores (pore size between 0.002 µm and 0.05 µm) [95]. When the ion-exchanger is
mixed with the PAN solution and dispersed in water, the resultant PAN granules obtained can
accommodate very high loadings of the ion-exchange material (up to 90% by weight) into the
PAN matrix [91-95]. These porous PAN granules exhibit numerous advantages over other
sorbents such as improved kinetics, enhanced sorption capacity owing to the increased
availability of the sorbent material, easy modification of physicochemical properties
(hydrophilicity, porosity, and mechanical strength) and simplified production [91-93]. The
granular material obtained from this method is suitable for column chromatographic
applications due to the presence of hard agglomerates and high surface area.
For the preparation of the nano ceria-PAN composite, a weighed amount (1 g) of
PAN was dissolved in 25 mL of 10 M HNO3 with mild heating (~70° C) and continuous
stirring, till a viscous solution was obtained. An equal amount (1 g) of calcined cerium oxide
(in 1:1 mass ratio) was added to the PAN solution with vigorous stirring to obtain
homogeneous suspension of the composite. The homogeneous suspension thus formed was
72
poured into a water bath containing 1 L of deionized water, resulting in the formation of a
lump. The lump obtained was washed several times with deionized water and dried for 12 h
at 70° C in a furnace. The dried lump was crushed mechanically and sieved to obtain the
particles of 50-100 mesh size (149 – 297 µm).
2.6.2 Chemical stability of CeO2-PAN
The chemical stability of CeO2-PAN was assessed in mineral acids such as HCl,
HNO3 and H2SO4 up to concentration of 5 M. The dried material (1 g) was immersed in 50
mL solution in a stoppered conical flask for 24 h at room temperature, under continuous
shaking using a wrist action shaking machine. Subsequently the solution was filtered and the
level of Ce ions in the filtrate was determined by ICP-AES. Negligible amount of Ce ions
(<0.1 ppm) were detected in the filtrate and therefore CeO2-PAN was stable in these
solutions.
2.6.3 Structural characterization of CeO2-PAN
2.6.3.1 FTIR spectroscopy
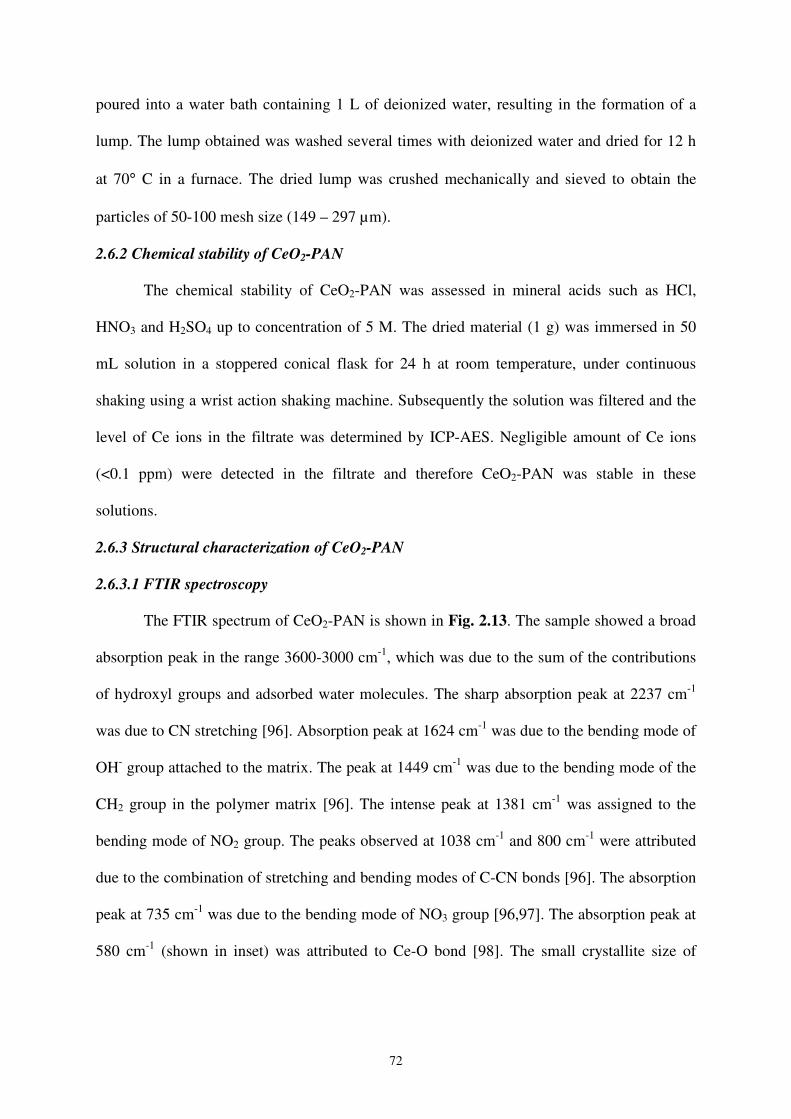
The FTIR spectrum of CeO2-PAN is shown in Fig. 2.13. The sample showed a broad
absorption peak in the range 3600-3000 cm-1, which was due to the sum of the contributions
of hydroxyl groups and adsorbed water molecules. The sharp absorption peak at 2237 cm-1
was due to CN stretching [96]. Absorption peak at 1624 cm-1 was due to the bending mode of
OH- group attached to the matrix. The peak at 1449 cm-1 was due to the bending mode of the
CH2 group in the polymer matrix [96]. The intense peak at 1381 cm-1 was assigned to the
bending mode of NO2 group. The peaks observed at 1038 cm-1 and 800 cm-1 were attributed
due to the combination of stretching and bending modes of C-CN bonds [96]. The absorption
peak at 735 cm-1 was due to the bending mode of NO3 group [96,97]. The absorption peak at
580 cm-1 (shown in inset) was attributed to Ce-O bond [98]. The small crystallite size of
73
CeO2 nanoparticles results in shortening of the bond length of Ce-O bond and therefore the
absorption peak was observed at such high energy or low wavenumber [98].
4000 3600 3200 2800 2400 2000 1600 1200 800 400
800 750 700 650 600 550 500 450
% T
(a
.u.)
Wavenumber (cm-1
)
% T
(a.u
.)
Wavenumber (cm-1)
Fig. 2.13: FTIR spectrum of CeO2-PAN
2.6.3.2 BET surface area analysis
The surface area measurements and the pore size distribution of CeO2-PAN were
carried out by standard BET technique. The surface area of CeO2-PAN was found to be ~72
m2 g-1. The average pore size was determined to be ~3.6 Å. It was observed that pores sizes
are uniform which facilitate permeation of liquid.
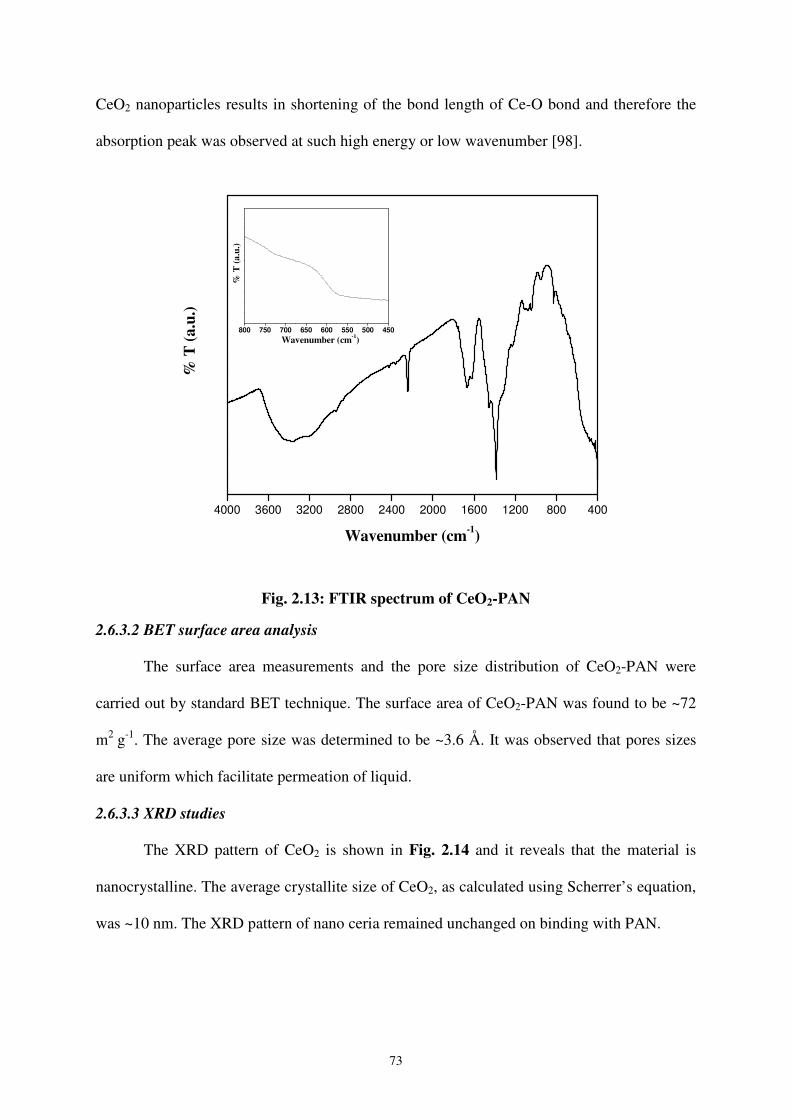
2.6.3.3 XRD studies
The XRD pattern of CeO2 is shown in Fig. 2.14 and it reveals that the material is
nanocrystalline. The average crystallite size of CeO2, as calculated using Scherrer’s equation,
was ~10 nm. The XRD pattern of nano ceria remained unchanged on binding with PAN.
74
20 40 60 80
(4 2
2)
(1 1
1)
(2 2
0)
(3 1
1)
(2 2
2)
(4 0
0)
(3 3
1)
(4 2
0)
(2 0
0)
Inte
nsi
ty (
a.u
)
2θθθθ (degrees)
Fig. 2.14: XRD pattern of nano-CeO2
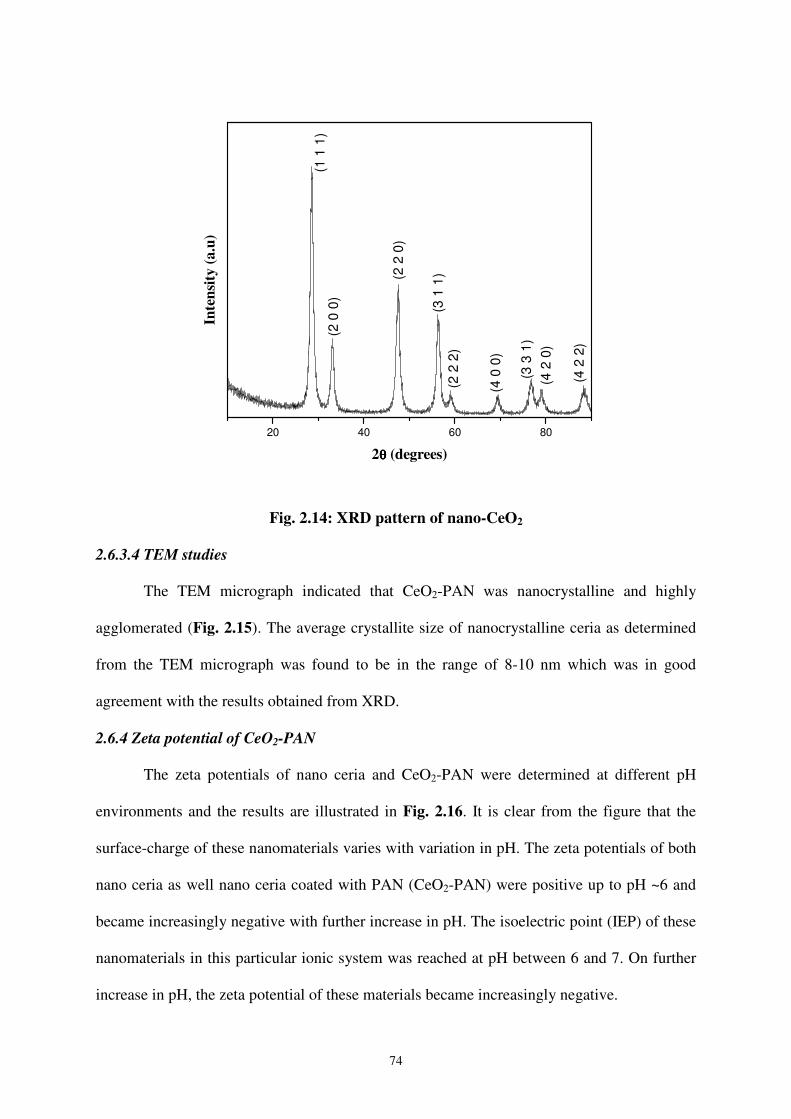
2.6.3.4 TEM studies
The TEM micrograph indicated that CeO2-PAN was nanocrystalline and highly
agglomerated (Fig. 2.15). The average crystallite size of nanocrystalline ceria as determined
from the TEM micrograph was found to be in the range of 8-10 nm which was in good
agreement with the results obtained from XRD.
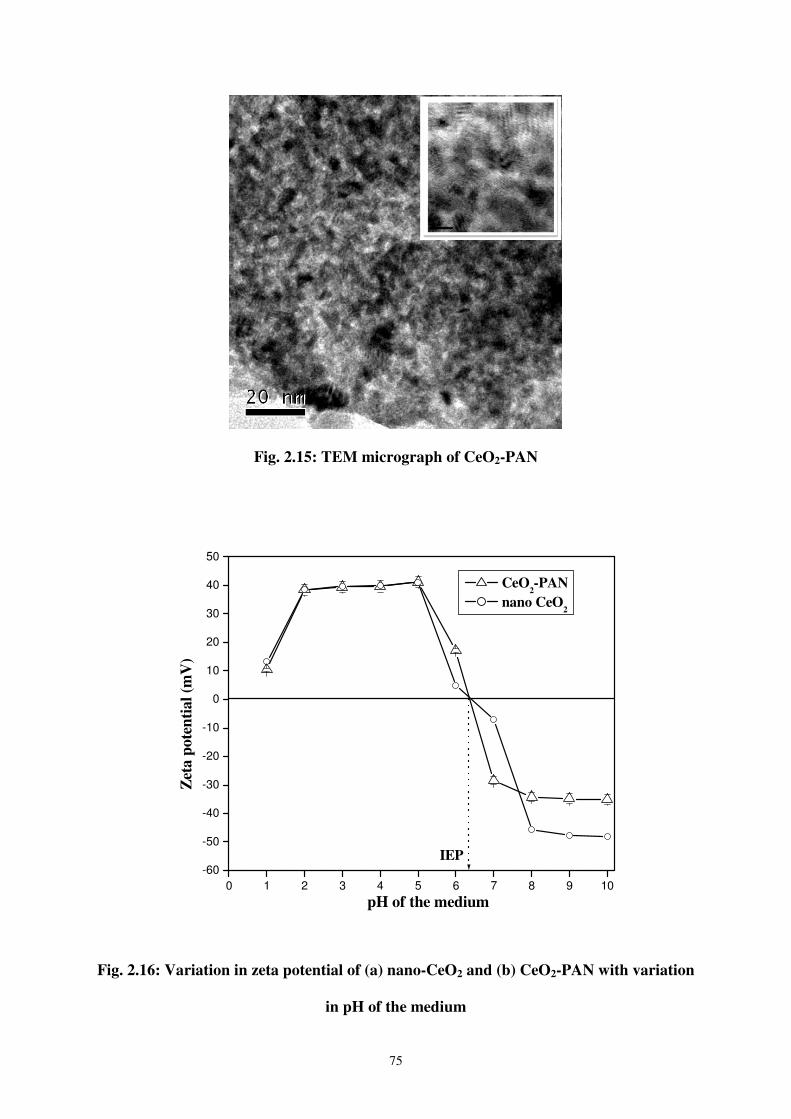
2.6.4 Zeta potential of CeO2-PAN
The zeta potentials of nano ceria and CeO2-PAN were determined at different pH
environments and the results are illustrated in Fig. 2.16. It is clear from the figure that the
surface-charge of these nanomaterials varies with variation in pH. The zeta potentials of both
nano ceria as well nano ceria coated with PAN (CeO2-PAN) were positive up to pH ~6 and
became increasingly negative with further increase in pH. The isoelectric point (IEP) of these
nanomaterials in this particular ionic system was reached at pH between 6 and 7. On further
increase in pH, the zeta potential of these materials became increasingly negative.
75
Fig. 2.15: TEM micrograph of CeO2-PAN
0 1 2 3 4 5 6 7 8 9 10
-60
-50
-40
-30
-20
-10
0
10
20
30
40
50
IEP
Zet
a p
ote
nti
al
(mV
)
pH of the medium
CeO2-PAN
nano CeO2
Fig. 2.16: Variation in zeta potential of (a) nano-CeO2 and (b) CeO2-PAN with variation
in pH of the medium
76
It can be seen from the figure that the zeta potential of nano ceria, under acidic conditions,
did not change significantly on coating with PAN. Therefore, it could be concluded that the
sorption characteristics of nano ceria remained unaltered on preparation of the composite
sorbent (CeO2-PAN).
2.7 Conclusions
Potential pathways to rationally synthesize nanomaterial based sorbents for use as
column matrices in radionuclide generators have been established. The materials synthesized
were nanocrystalline and possessed appreciably high chemical stability and surface area.
Owing to their granular strength and free flow characteristics, the materials are suitable for
column operations. The efficacy of these sorbent materials for the development of
radionuclide generators are described in the subsequent chapters. It is envisioned that
nanomaterials can become critical components of radionuclide generators in the near future
and shall open up many new opportunities in synthesis and application of novel nanomaterial
based sorbents.