Embed Size (px)
Citation preview
Chapter 2Reading Topographic Maps
and Making Calculations
______________________________________________________________________________In this chapter you will learn about:
Reading the marginsInterpreting contour linesEstimating slopeEstimating aspectEstimating acreageEstimating distancesEstimating percent contained
A nice reference to have while reading this chapter is a USGS color topographic map.______________________________________________________________________________
A topographic map is printed on a flat piece of paper yet it provides a picture of the terrain and man-made features through the use of contour lines, colors and symbols. Contour lines represent the shapeand elevation of the land, such as ridges, valleys, and hills. Colors and symbols are used to representother features on the land, such as water, vegetation, roads, boundaries, urban areas and structures.
The USGS produces a series of topographic maps that are extremely accurate. The United States wassystematically divided into precise quadrangles based on latitude and longitude lines and these maps arecommonly referred to as “quads.”
This chapter starts with tips on how to read the margins of a topographic map. Then it describes how tointerpret contour lines. Finally, it covers how to estimate slope, aspect, acreage, distances, and percentcontained using a topographic map.
_____________________________________________________________Page 2.1
Basic Land Navigation
Page 2.2____________________________________________________________
Reading the Margins
This section addresses how to read the information that is in the margins of a USGS topographic map.It starts with the upper left corner of the map and moves clockwise around the map.
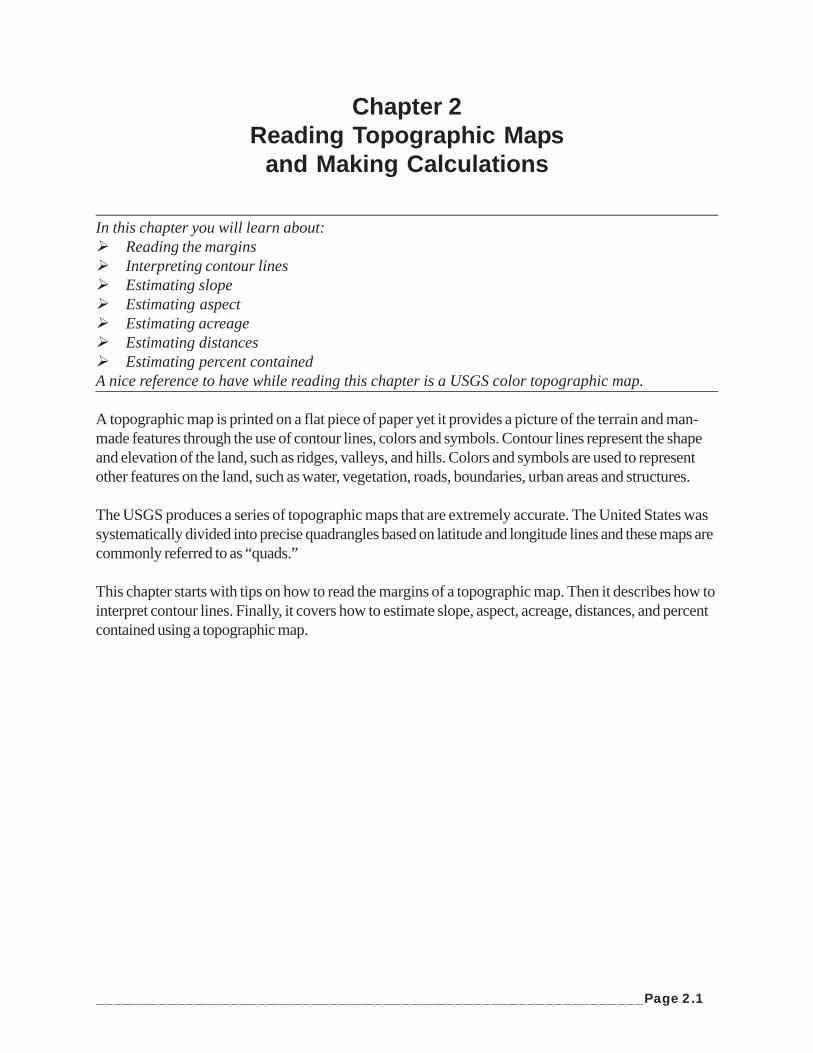
Agency or Author Who Created Map (upper left corner of map)
In Figure 2-1, the United States Department of the Interior Geological Survey is the agency that createdthe map. This same information can also be found in the bottom left corner.
Figure 2-1. Agency or author who created map.
Basic Land Navigation
_____________________________________________________________Page 2.3
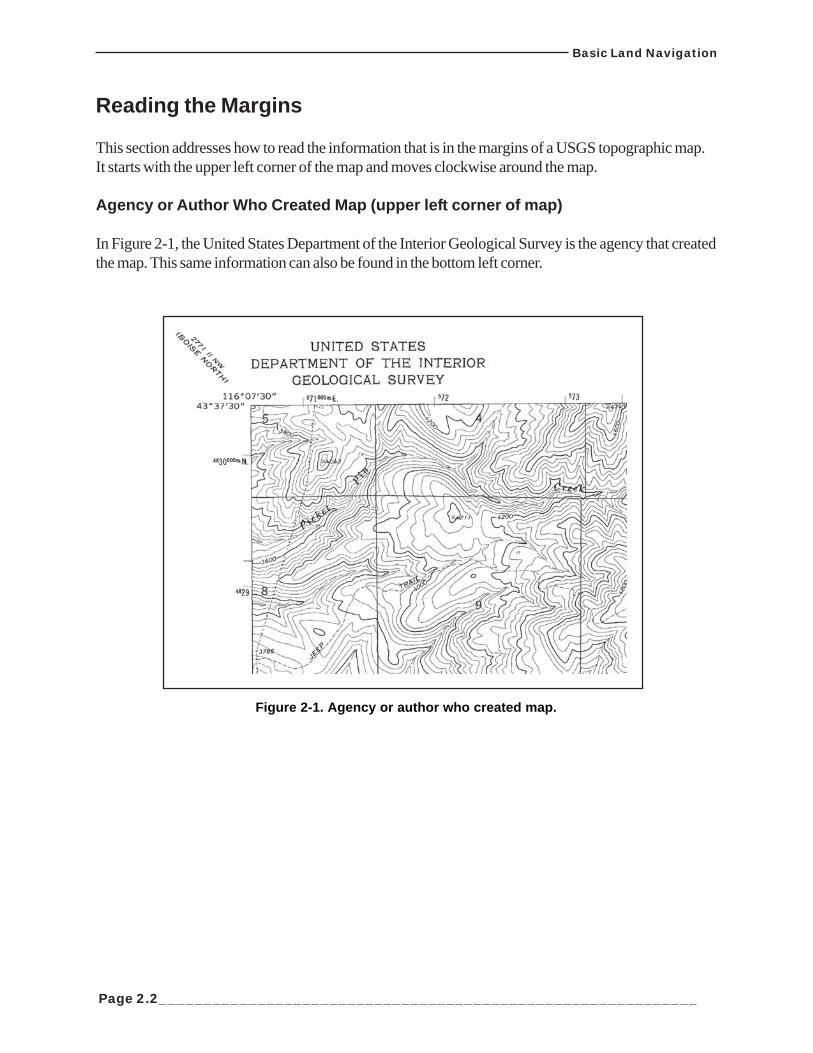
Map Title (upper right corner of map)
This corner section provides the name of quadrangle, state (and sometimes the county) where thequadrangle is located, and map series. Quadrangles are often named after a prominent town or featurethat is in the quadrangle. In Figure 2-2, the name of the quadrangle is “Lucky Peak” which is located inIdaho. The map series indicates how much land area is on the map; for example, in Figure 2-2 theLucky Peak quadrangle is a 7.5 minute series which indicates it covers a four sided area of 7.5 minutesof latitude and 7.5 minutes of longitude.
Figure 2-2. Map title.
Basic Land Navigation
Page 2.4____________________________________________________________
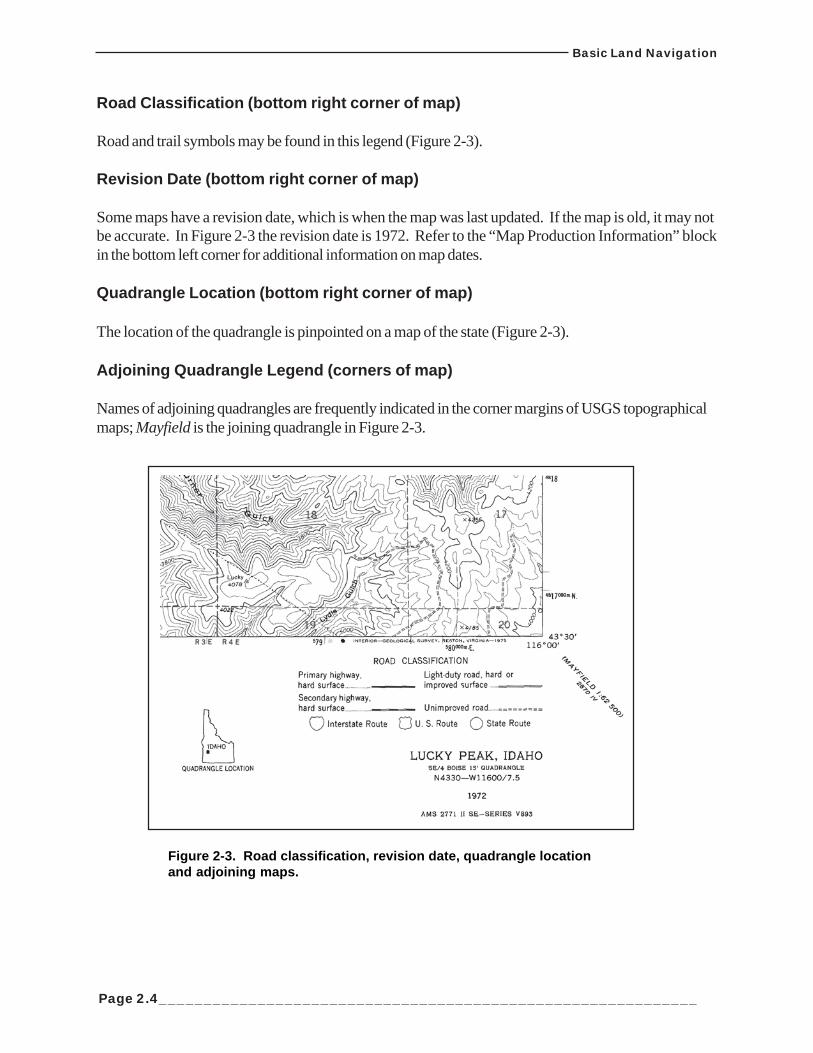
Road Classification (bottom right corner of map)
Road and trail symbols may be found in this legend (Figure 2-3).
Revision Date (bottom right corner of map)
Some maps have a revision date, which is when the map was last updated. If the map is old, it may notbe accurate. In Figure 2-3 the revision date is 1972. Refer to the “Map Production Information” blockin the bottom left corner for additional information on map dates.
Quadrangle Location (bottom right corner of map)
The location of the quadrangle is pinpointed on a map of the state (Figure 2-3).
Adjoining Quadrangle Legend (corners of map)
Names of adjoining quadrangles are frequently indicated in the corner margins of USGS topographicalmaps; Mayfield is the joining quadrangle in Figure 2-3.
Figure 2-3. Road classification, revision date, quadrangle locationand adjoining maps.
Basic Land Navigation
_____________________________________________________________Page 2.5
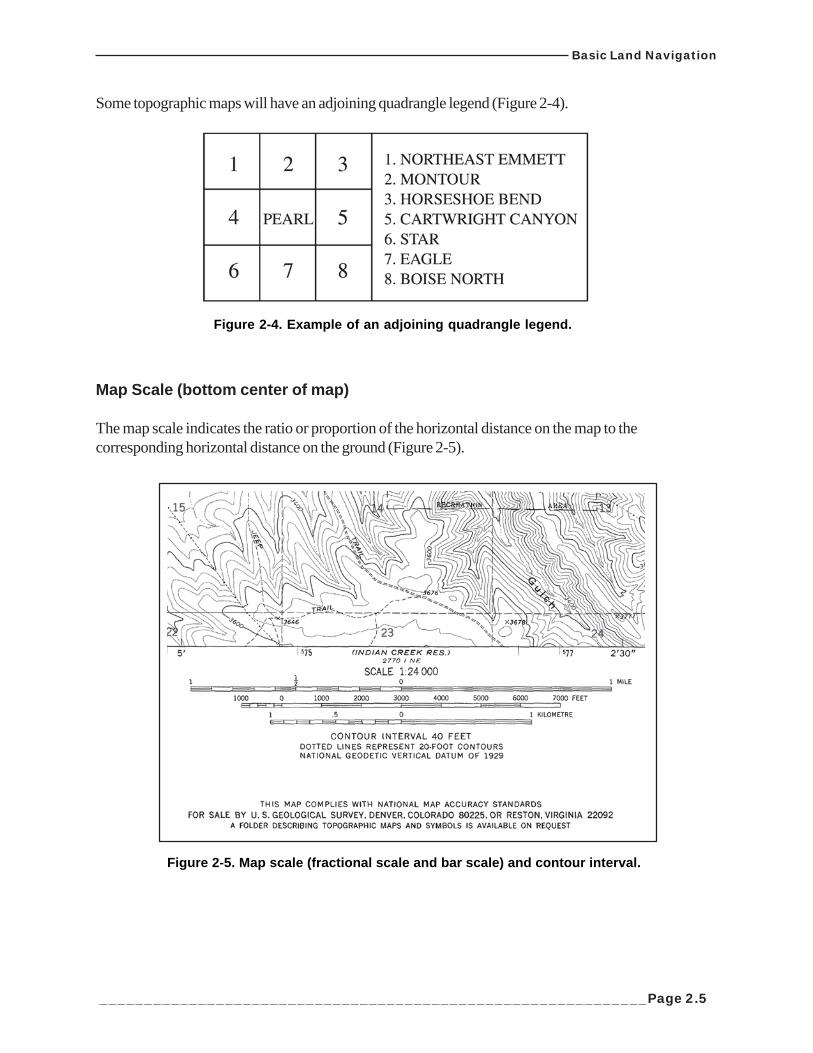
Some topographic maps will have an adjoining quadrangle legend (Figure 2-4).
Map Scale (bottom center of map)
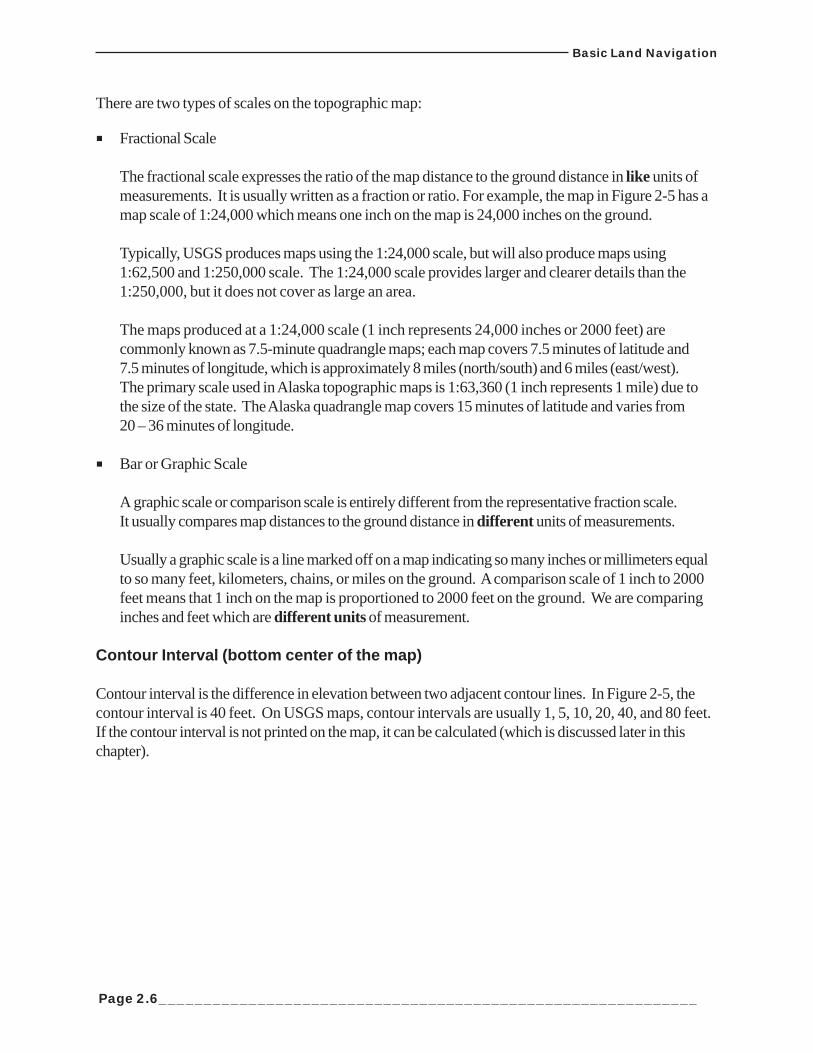
The map scale indicates the ratio or proportion of the horizontal distance on the map to thecorresponding horizontal distance on the ground (Figure 2-5).
Figure 2-4. Example of an adjoining quadrangle legend.
Figure 2-5. Map scale (fractional scale and bar scale) and contour interval.
Basic Land Navigation
Page 2.6____________________________________________________________
There are two types of scales on the topographic map:
Fractional Scale
The fractional scale expresses the ratio of the map distance to the ground distance in like units ofmeasurements. It is usually written as a fraction or ratio. For example, the map in Figure 2-5 has amap scale of 1:24,000 which means one inch on the map is 24,000 inches on the ground.
Typically, USGS produces maps using the 1:24,000 scale, but will also produce maps using1:62,500 and 1:250,000 scale. The 1:24,000 scale provides larger and clearer details than the1:250,000, but it does not cover as large an area.
The maps produced at a 1:24,000 scale (1 inch represents 24,000 inches or 2000 feet) arecommonly known as 7.5-minute quadrangle maps; each map covers 7.5 minutes of latitude and7.5 minutes of longitude, which is approximately 8 miles (north/south) and 6 miles (east/west).The primary scale used in Alaska topographic maps is 1:63,360 (1 inch represents 1 mile) due tothe size of the state. The Alaska quadrangle map covers 15 minutes of latitude and varies from20 – 36 minutes of longitude.
Bar or Graphic Scale
A graphic scale or comparison scale is entirely different from the representative fraction scale.It usually compares map distances to the ground distance in different units of measurements.
Usually a graphic scale is a line marked off on a map indicating so many inches or millimeters equalto so many feet, kilometers, chains, or miles on the ground. A comparison scale of 1 inch to 2000feet means that 1 inch on the map is proportioned to 2000 feet on the ground. We are comparinginches and feet which are different units of measurement.
Contour Interval (bottom center of the map)
Contour interval is the difference in elevation between two adjacent contour lines. In Figure 2-5, thecontour interval is 40 feet. On USGS maps, contour intervals are usually 1, 5, 10, 20, 40, and 80 feet.If the contour interval is not printed on the map, it can be calculated (which is discussed later in thischapter).
Basic Land Navigation
_____________________________________________________________Page 2.7
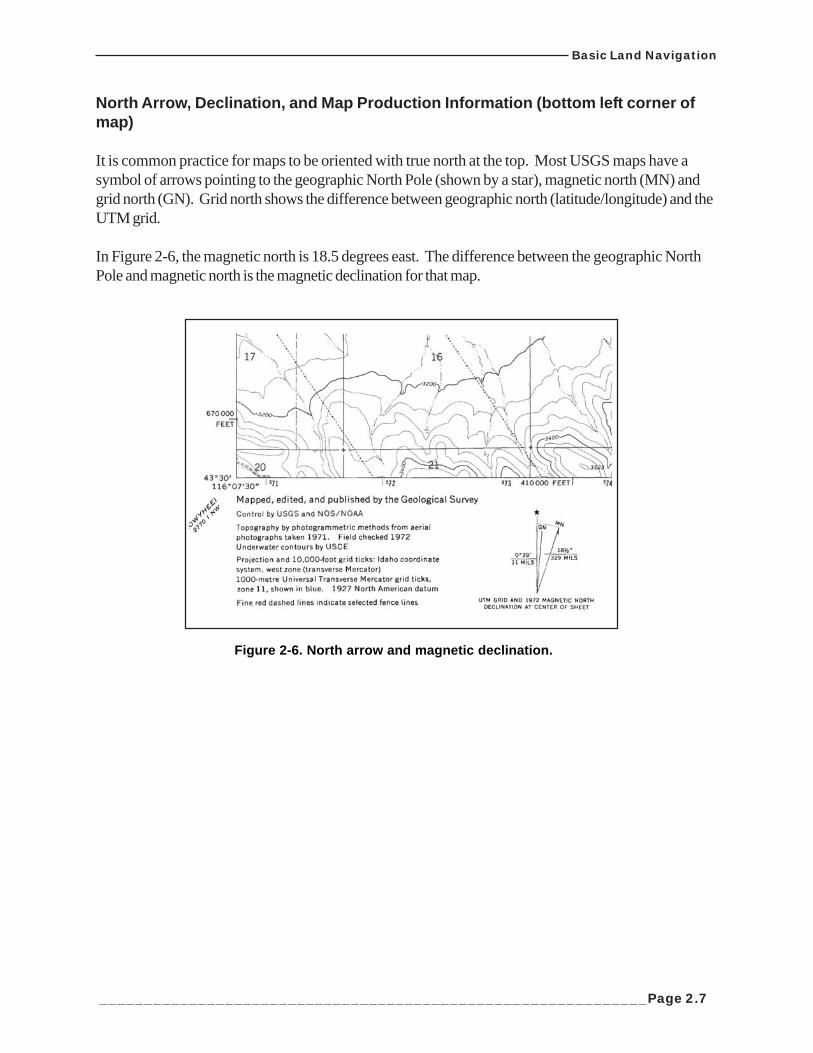
North Arrow, Declination, and Map Production Information (bottom left corner ofmap)
It is common practice for maps to be oriented with true north at the top. Most USGS maps have asymbol of arrows pointing to the geographic North Pole (shown by a star), magnetic north (MN) andgrid north (GN). Grid north shows the difference between geographic north (latitude/longitude) and theUTM grid.
In Figure 2-6, the magnetic north is 18.5 degrees east. The difference between the geographic NorthPole and magnetic north is the magnetic declination for that map.
Figure 2-6. North arrow and magnetic declination.
Basic Land Navigation
Page 2.8____________________________________________________________
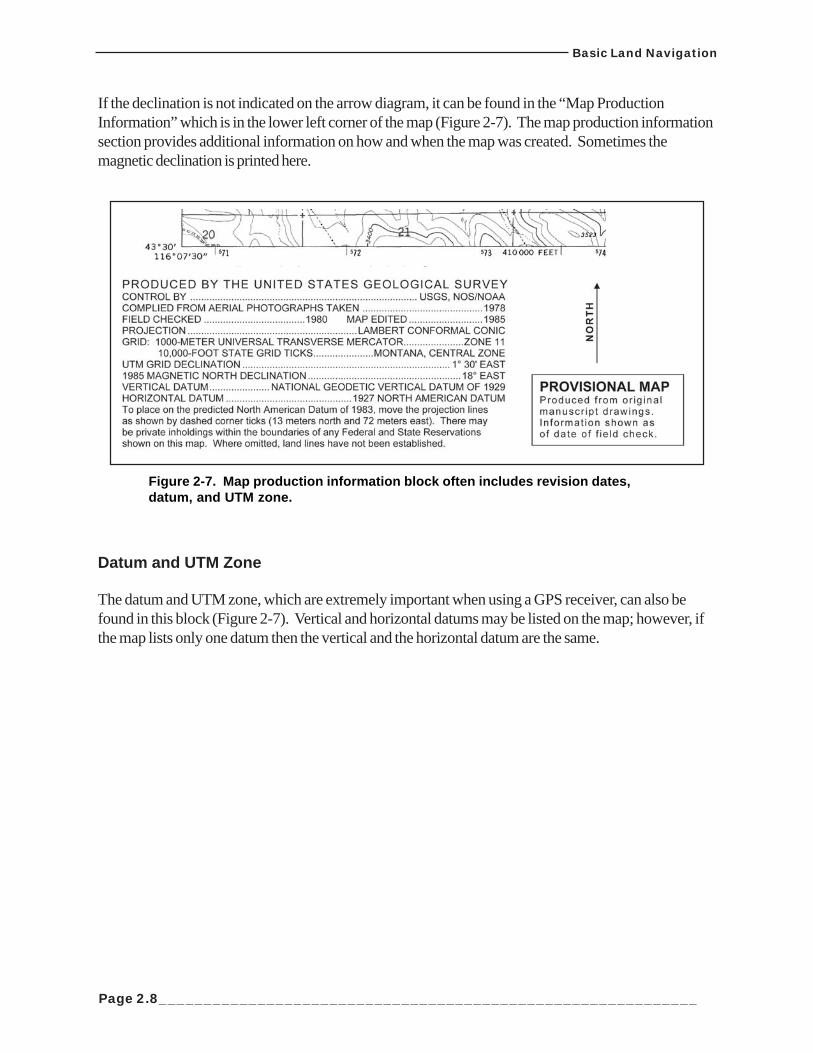
If the declination is not indicated on the arrow diagram, it can be found in the “Map ProductionInformation” which is in the lower left corner of the map (Figure 2-7). The map production informationsection provides additional information on how and when the map was created. Sometimes themagnetic declination is printed here.
Datum and UTM Zone
The datum and UTM zone, which are extremely important when using a GPS receiver, can also befound in this block (Figure 2-7). Vertical and horizontal datums may be listed on the map; however, ifthe map lists only one datum then the vertical and the horizontal datum are the same.
Figure 2-7. Map production information block often includes revision dates,datum, and UTM zone.
Basic Land Navigation
_____________________________________________________________Page 2.9
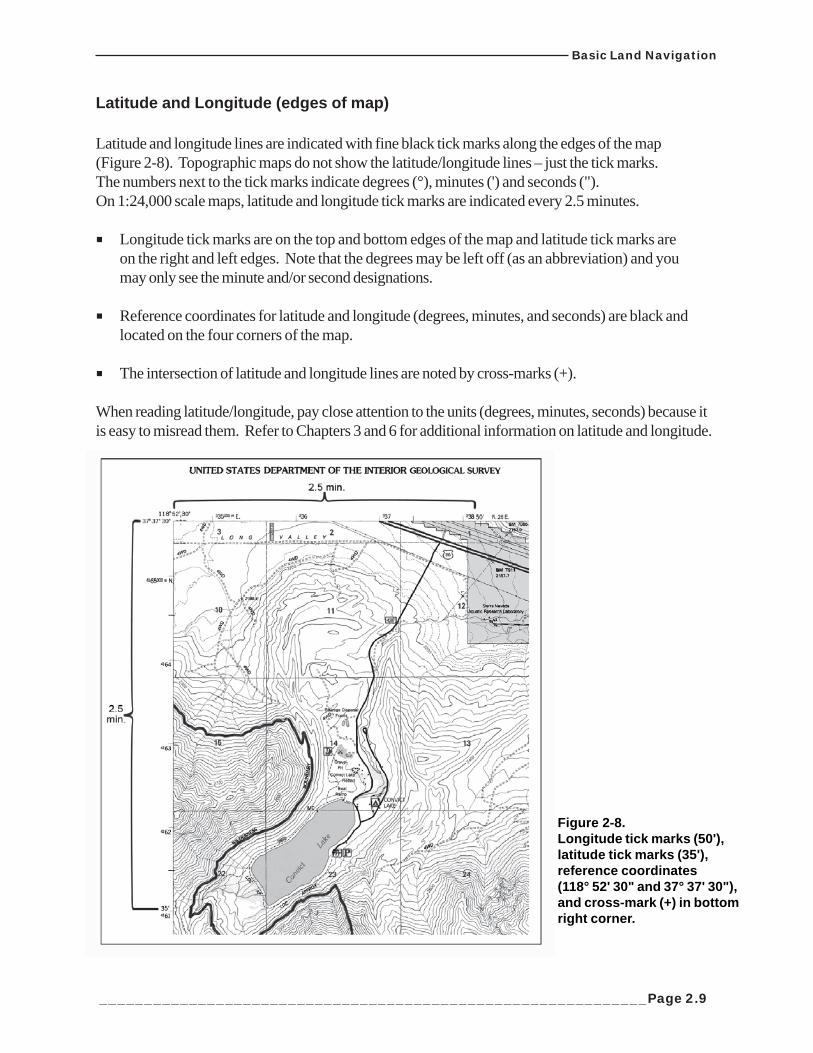
Latitude and Longitude (edges of map)
Latitude and longitude lines are indicated with fine black tick marks along the edges of the map(Figure 2-8). Topographic maps do not show the latitude/longitude lines – just the tick marks.The numbers next to the tick marks indicate degrees (°), minutes (') and seconds (").On 1:24,000 scale maps, latitude and longitude tick marks are indicated every 2.5 minutes.
Longitude tick marks are on the top and bottom edges of the map and latitude tick marks areon the right and left edges. Note that the degrees may be left off (as an abbreviation) and youmay only see the minute and/or second designations.
Reference coordinates for latitude and longitude (degrees, minutes, and seconds) are black andlocated on the four corners of the map.
The intersection of latitude and longitude lines are noted by cross-marks (+).
When reading latitude/longitude, pay close attention to the units (degrees, minutes, seconds) because itis easy to misread them. Refer to Chapters 3 and 6 for additional information on latitude and longitude.
Figure 2-8.Longitude tick marks (50'),latitude tick marks (35'),reference coordinates(118° 52' 30" and 37° 37' 30"),and cross-mark (+) in bottomright corner.
Basic Land Navigation
Page 2.10____________________________________________________________
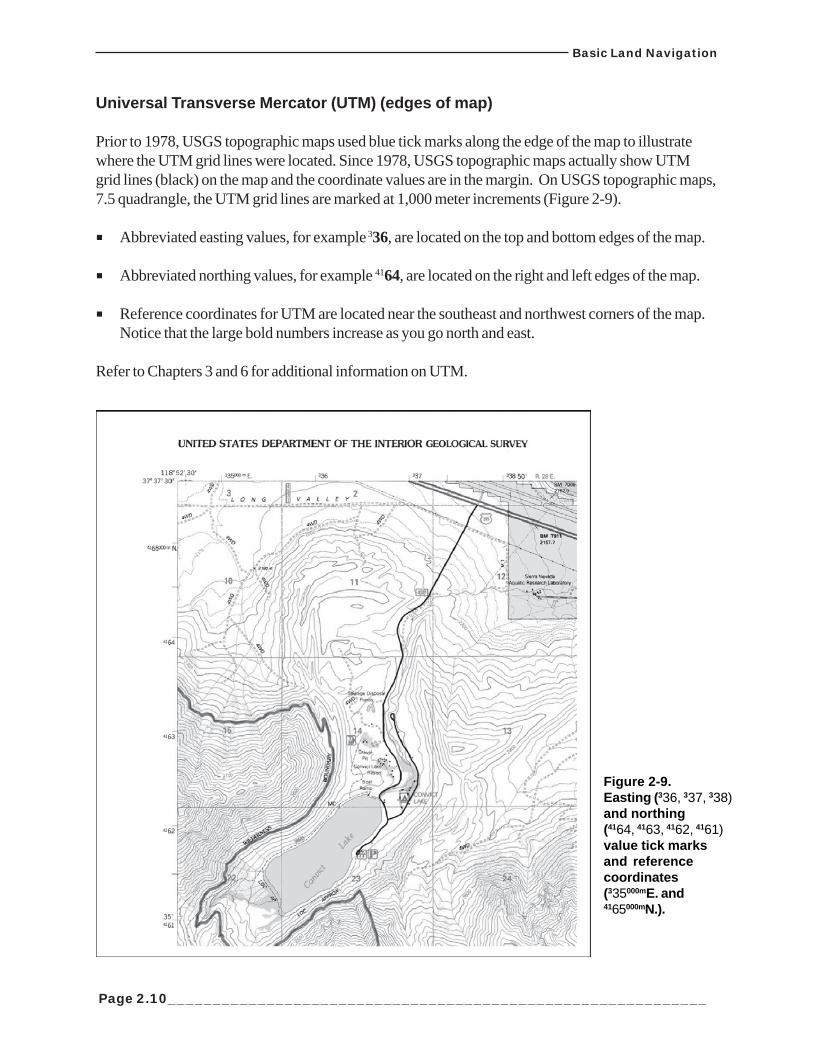
Universal Transverse Mercator (UTM) (edges of map)
Prior to 1978, USGS topographic maps used blue tick marks along the edge of the map to illustratewhere the UTM grid lines were located. Since 1978, USGS topographic maps actually show UTMgrid lines (black) on the map and the coordinate values are in the margin. On USGS topographic maps,7.5 quadrangle, the UTM grid lines are marked at 1,000 meter increments (Figure 2-9).
Abbreviated easting values, for example 336, are located on the top and bottom edges of the map.
Abbreviated northing values, for example 4164, are located on the right and left edges of the map.
Reference coordinates for UTM are located near the southeast and northwest corners of the map.Notice that the large bold numbers increase as you go north and east.
Refer to Chapters 3 and 6 for additional information on UTM.
Figure 2-9.Easting (336, 337, 338)and northing(4164, 4163, 4162, 4161)value tick marksand referencecoordinates(335000mE. and4165000mN.).
Basic Land Navigation
_____________________________________________________________Page 2.11
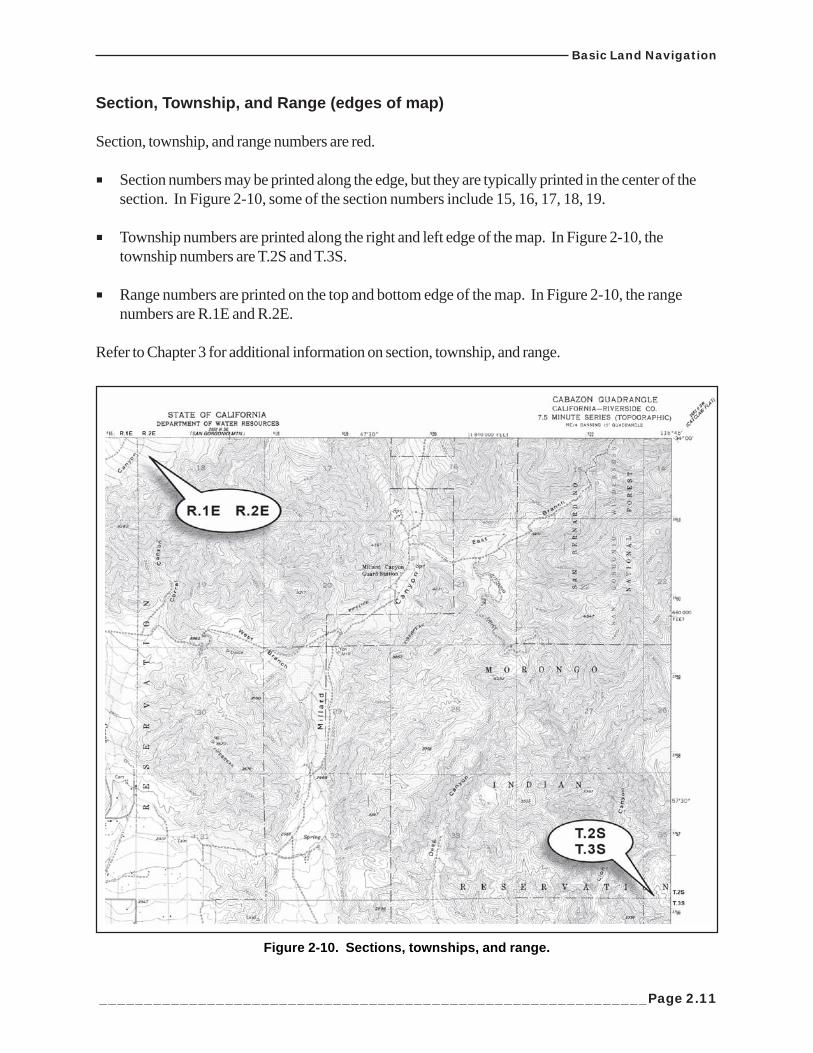
Section, Township, and Range (edges of map)
Section, township, and range numbers are red.
Section numbers may be printed along the edge, but they are typically printed in the center of thesection. In Figure 2-10, some of the section numbers include 15, 16, 17, 18, 19.
Township numbers are printed along the right and left edge of the map. In Figure 2-10, thetownship numbers are T.2S and T.3S.
Range numbers are printed on the top and bottom edge of the map. In Figure 2-10, the rangenumbers are R.1E and R.2E.
Refer to Chapter 3 for additional information on section, township, and range.
Figure 2-10. Sections, townships, and range.
Basic Land Navigation
Page 2.12____________________________________________________________
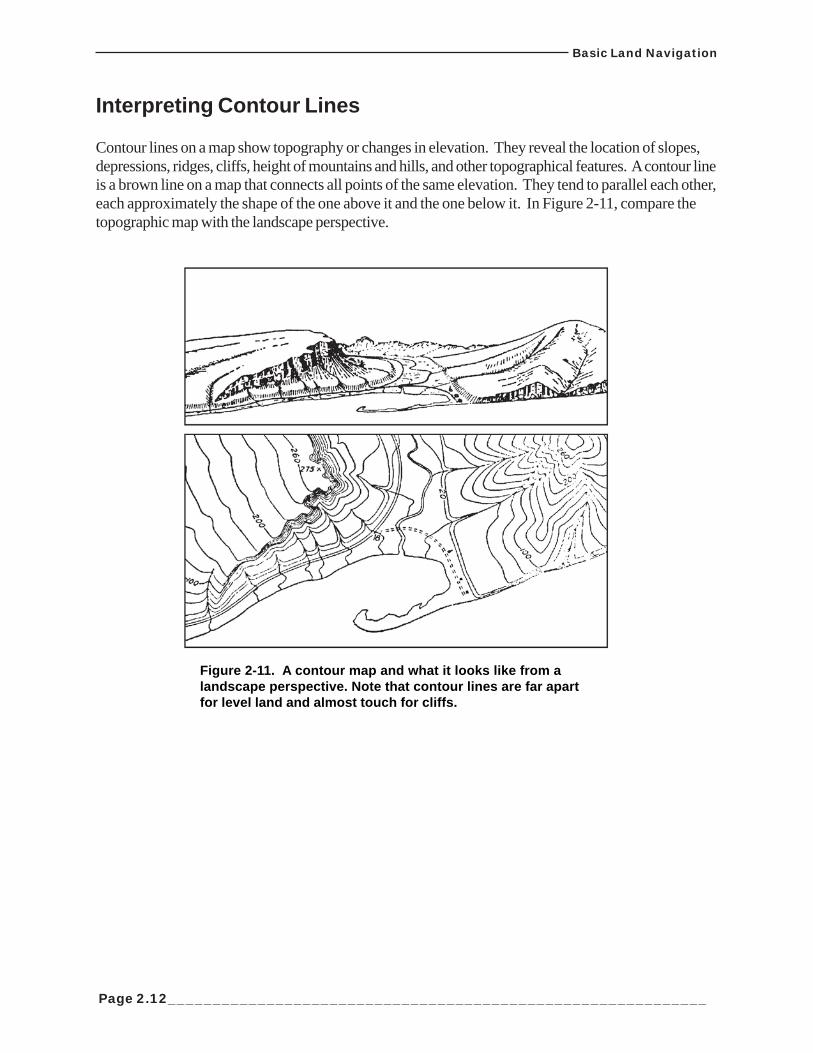
Interpreting Contour Lines
Contour lines on a map show topography or changes in elevation. They reveal the location of slopes,depressions, ridges, cliffs, height of mountains and hills, and other topographical features. A contour lineis a brown line on a map that connects all points of the same elevation. They tend to parallel each other,each approximately the shape of the one above it and the one below it. In Figure 2-11, compare thetopographic map with the landscape perspective.
Figure 2-11. A contour map and what it looks like from alandscape perspective. Note that contour lines are far apartfor level land and almost touch for cliffs.
Basic Land Navigation
_____________________________________________________________Page 2.13
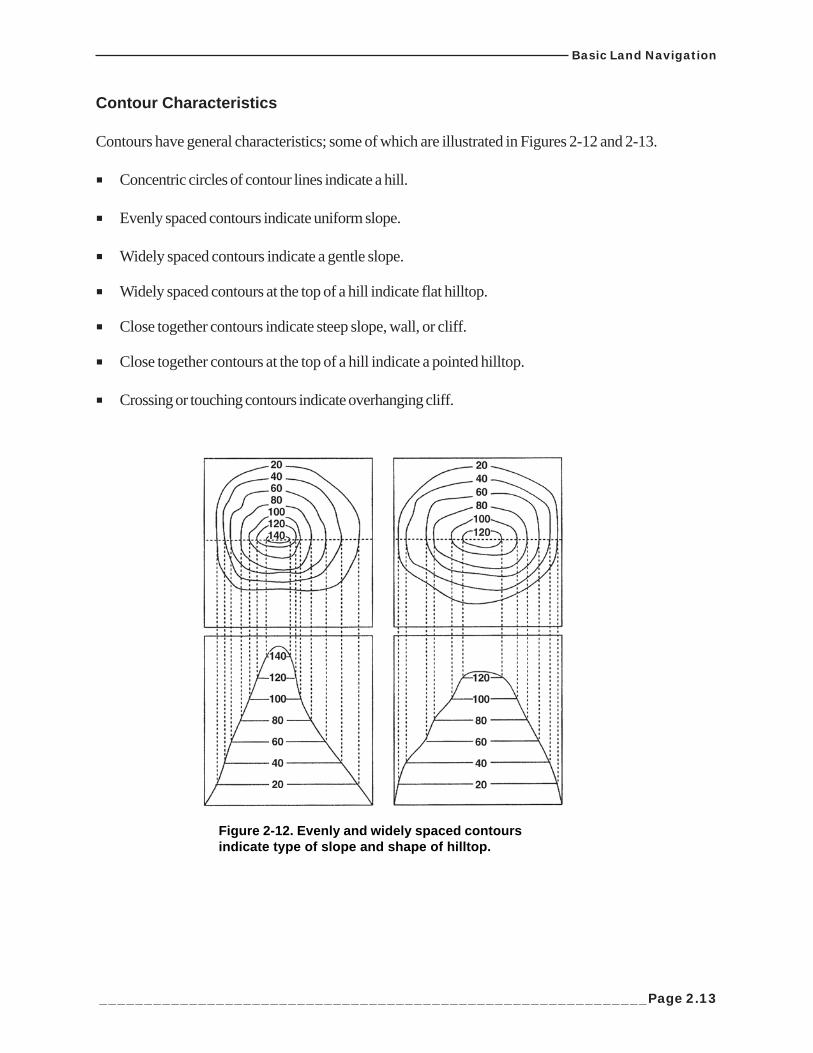
Contour Characteristics
Contours have general characteristics; some of which are illustrated in Figures 2-12 and 2-13.
Concentric circles of contour lines indicate a hill.
Evenly spaced contours indicate uniform slope.
Widely spaced contours indicate a gentle slope.
Widely spaced contours at the top of a hill indicate flat hilltop.
Close together contours indicate steep slope, wall, or cliff.
Close together contours at the top of a hill indicate a pointed hilltop.
Crossing or touching contours indicate overhanging cliff.
Figure 2-12. Evenly and widely spaced contoursindicate type of slope and shape of hilltop.
Basic Land Navigation
Page 2.14____________________________________________________________
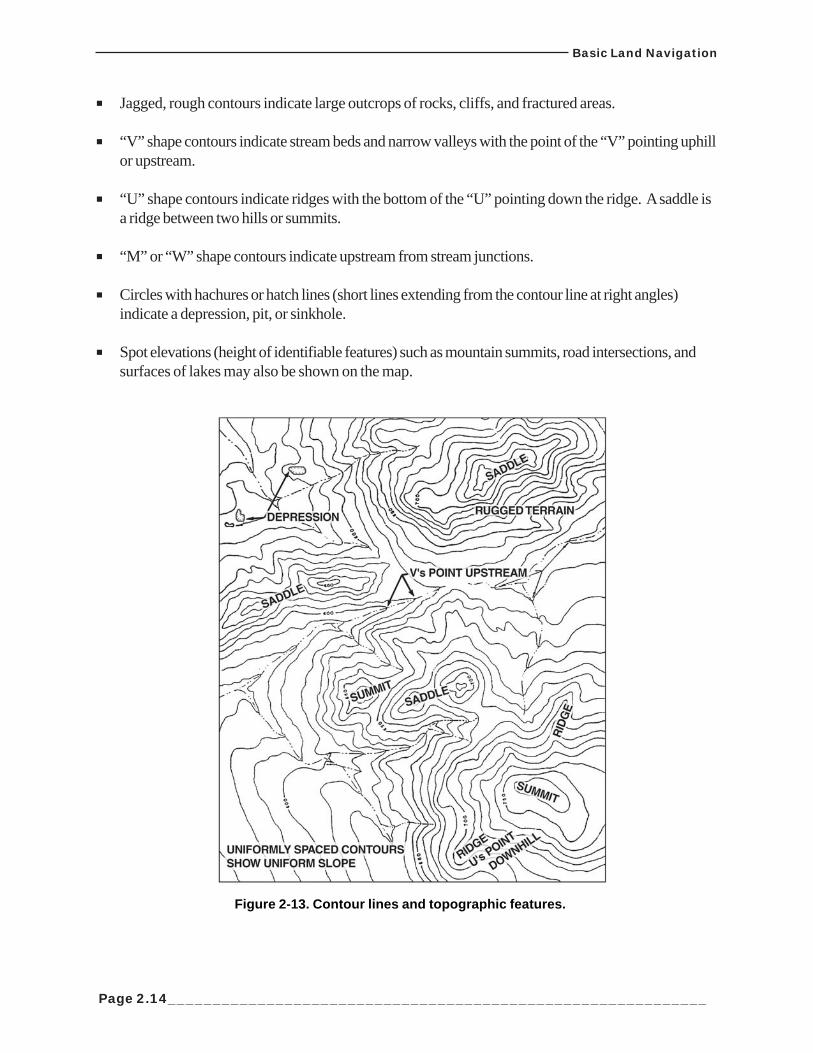
Jagged, rough contours indicate large outcrops of rocks, cliffs, and fractured areas.
“V” shape contours indicate stream beds and narrow valleys with the point of the “V” pointing uphillor upstream.
“U” shape contours indicate ridges with the bottom of the “U” pointing down the ridge. A saddle isa ridge between two hills or summits.
“M” or “W” shape contours indicate upstream from stream junctions.
Circles with hachures or hatch lines (short lines extending from the contour line at right angles)indicate a depression, pit, or sinkhole.
Spot elevations (height of identifiable features) such as mountain summits, road intersections, andsurfaces of lakes may also be shown on the map.
Figure 2-13. Contour lines and topographic features.
Basic Land Navigation
_____________________________________________________________Page 2.15
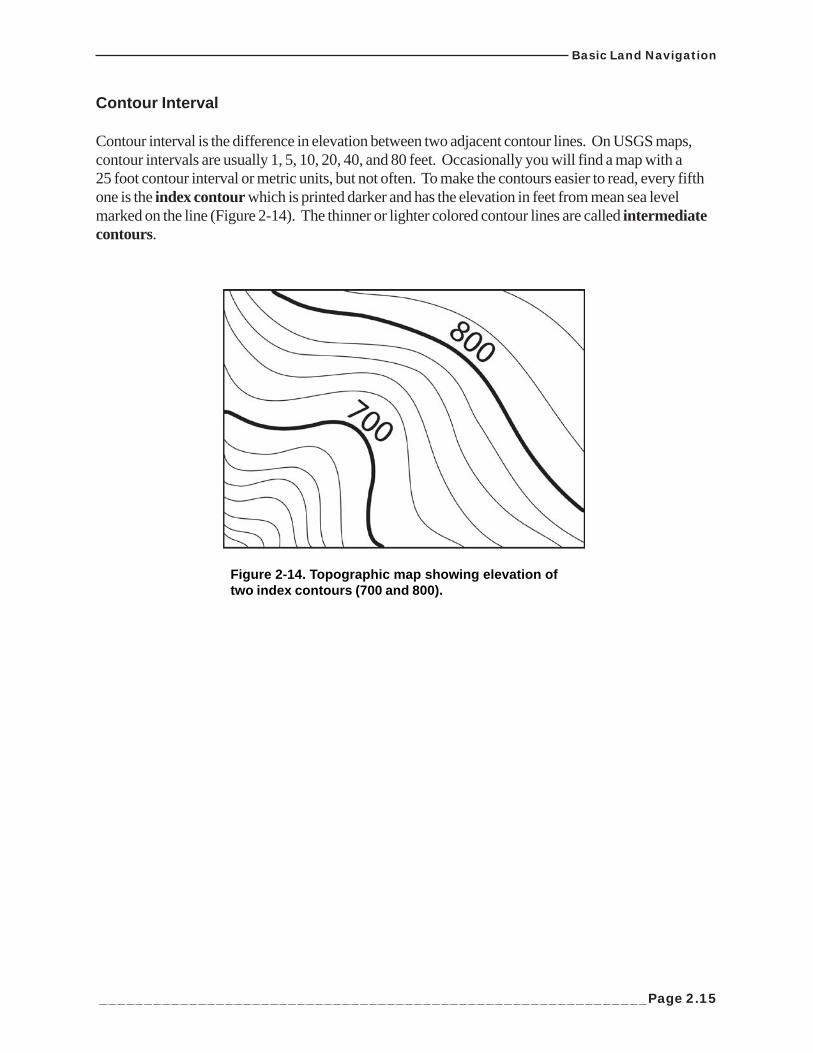
Contour Interval
Contour interval is the difference in elevation between two adjacent contour lines. On USGS maps,contour intervals are usually 1, 5, 10, 20, 40, and 80 feet. Occasionally you will find a map with a25 foot contour interval or metric units, but not often. To make the contours easier to read, every fifthone is the index contour which is printed darker and has the elevation in feet from mean sea levelmarked on the line (Figure 2-14). The thinner or lighter colored contour lines are called intermediatecontours.
Figure 2-14. Topographic map showing elevation oftwo index contours (700 and 800).
Basic Land Navigation
Page 2.16____________________________________________________________
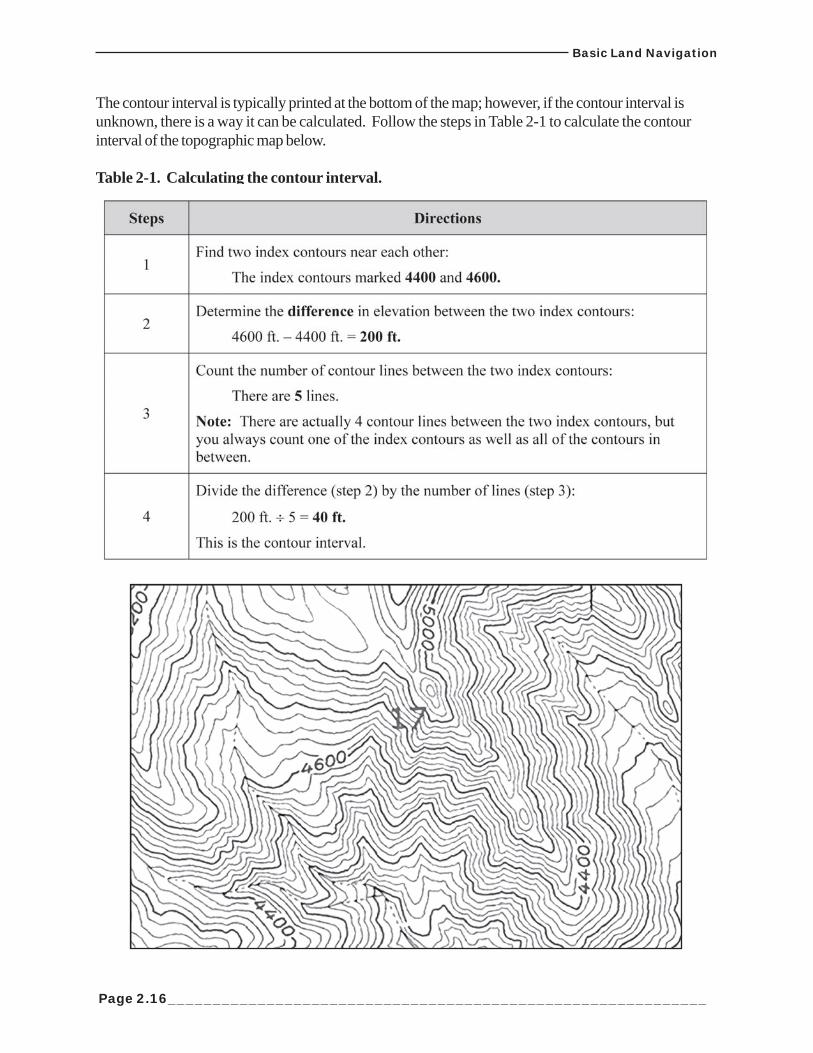
The contour interval is typically printed at the bottom of the map; however, if the contour interval isunknown, there is a way it can be calculated. Follow the steps in Table 2-1 to calculate the contourinterval of the topographic map below.
Table 2-1. Calculating the contour interval.