Embed Size (px)
Citation preview
70 2. LATIN AMERICAN AGRICULTURE: PROSPECTS AND CHALLENGES
OECD-FAO AGRICULTURAL OUTLOOK 2019-2028 © OECD/FAO 2019
Chapter 2. Latin American Agriculture:
Prospects and Challenges
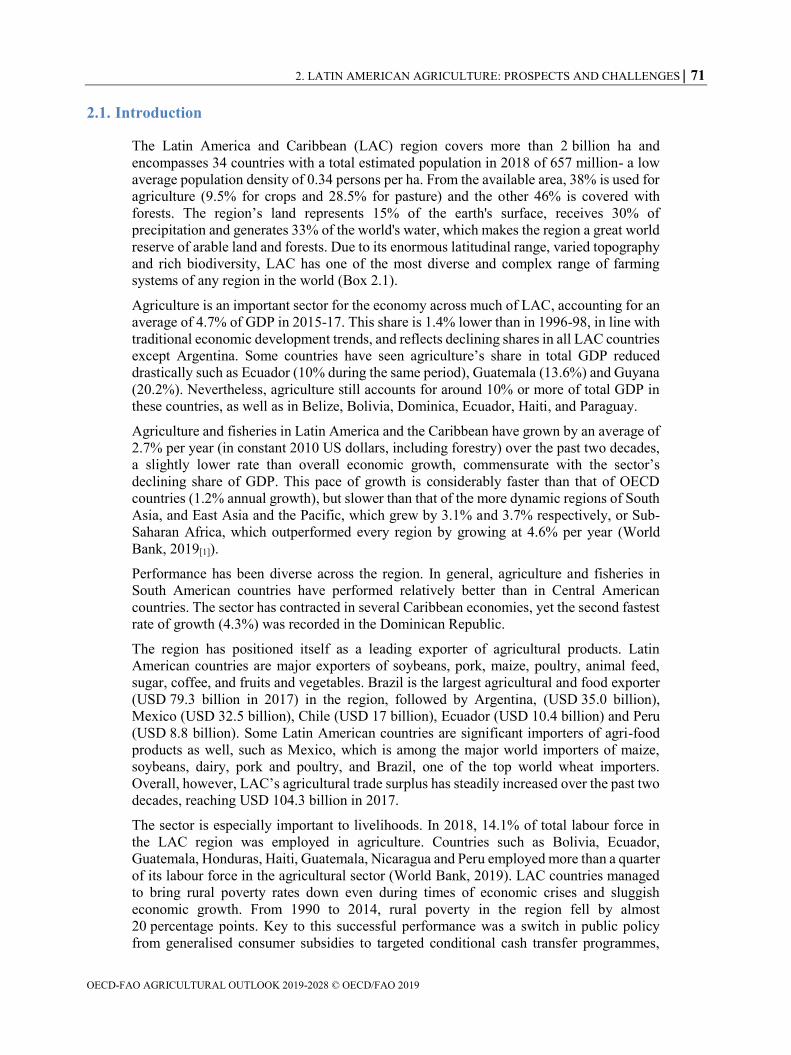
This chapter reviews the prospects and challenges facing the agricultural sector in Latin
America and the Caribbean (LAC). The region accounts for about a quarter of global
exports in agricultural and fisheries products, underscoring the importance of trade
openness at the global level. Strong growth opportunities in high value fruit and vegetable
crops provide opportunities for smallholders, but policies will need to be differentiated
according to resource endowments and market potential. Food security continues to be a
concern, with many households unable to afford the food they need. Given the simultaneous
rise in the number of people who are overweight and obese, several initiatives seek to
counter these trends. Raising agricultural productivity sustainably in LAC will rely on new
strategic investments in agriculture’s enabling environment. However, due to the region’s
diverse state of rural infrastructure, R&D initiatives and of environmental problems from
agricultural production, mixed potential exists to further expand public spending and
improve the environmental performance of the sector.
2. LATIN AMERICAN AGRICULTURE: PROSPECTS AND CHALLENGES 71
OECD-FAO AGRICULTURAL OUTLOOK 2019-2028 © OECD/FAO 2019
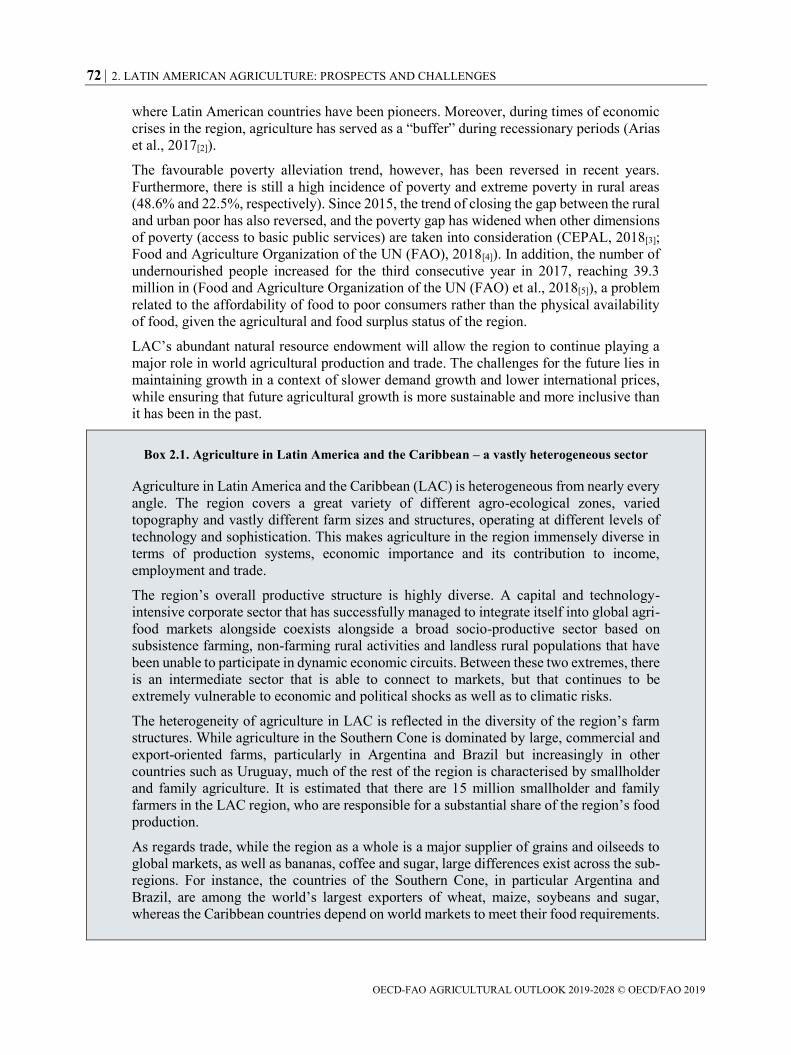
2.1. Introduction
The Latin America and Caribbean (LAC) region covers more than 2 billion ha and
encompasses 34 countries with a total estimated population in 2018 of 657 million- a low
average population density of 0.34 persons per ha. From the available area, 38% is used for
agriculture (9.5% for crops and 28.5% for pasture) and the other 46% is covered with
forests. The region’s land represents 15% of the earth's surface, receives 30% of
precipitation and generates 33% of the world's water, which makes the region a great world
reserve of arable land and forests. Due to its enormous latitudinal range, varied topography
and rich biodiversity, LAC has one of the most diverse and complex range of farming
systems of any region in the world (Box 2.1).
Agriculture is an important sector for the economy across much of LAC, accounting for an
average of 4.7% of GDP in 2015-17. This share is 1.4% lower than in 1996-98, in line with
traditional economic development trends, and reflects declining shares in all LAC countries
except Argentina. Some countries have seen agriculture’s share in total GDP reduced
drastically such as Ecuador (10% during the same period), Guatemala (13.6%) and Guyana
(20.2%). Nevertheless, agriculture still accounts for around 10% or more of total GDP in
these countries, as well as in Belize, Bolivia, Dominica, Ecuador, Haiti, and Paraguay.
Agriculture and fisheries in Latin America and the Caribbean have grown by an average of
2.7% per year (in constant 2010 US dollars, including forestry) over the past two decades,
a slightly lower rate than overall economic growth, commensurate with the sector’s
declining share of GDP. This pace of growth is considerably faster than that of OECD
countries (1.2% annual growth), but slower than that of the more dynamic regions of South
Asia, and East Asia and the Pacific, which grew by 3.1% and 3.7% respectively, or Sub-
Saharan Africa, which outperformed every region by growing at 4.6% per year (World
Bank, 2019[1]).
Performance has been diverse across the region. In general, agriculture and fisheries in
South American countries have performed relatively better than in Central American
countries. The sector has contracted in several Caribbean economies, yet the second fastest
rate of growth (4.3%) was recorded in the Dominican Republic.
The region has positioned itself as a leading exporter of agricultural products. Latin
American countries are major exporters of soybeans, pork, maize, poultry, animal feed,
sugar, coffee, and fruits and vegetables. Brazil is the largest agricultural and food exporter
(USD 79.3 billion in 2017) in the region, followed by Argentina, (USD 35.0 billion),
Mexico (USD 32.5 billion), Chile (USD 17 billion), Ecuador (USD 10.4 billion) and Peru
(USD 8.8 billion). Some Latin American countries are significant importers of agri-food
products as well, such as Mexico, which is among the major world importers of maize,
soybeans, dairy, pork and poultry, and Brazil, one of the top world wheat importers.
Overall, however, LAC’s agricultural trade surplus has steadily increased over the past two
decades, reaching USD 104.3 billion in 2017.
The sector is especially important to livelihoods. In 2018, 14.1% of total labour force in
the LAC region was employed in agriculture. Countries such as Bolivia, Ecuador,
Guatemala, Honduras, Haiti, Guatemala, Nicaragua and Peru employed more than a quarter
of its labour force in the agricultural sector (World Bank, 2019). LAC countries managed
to bring rural poverty rates down even during times of economic crises and sluggish
economic growth. From 1990 to 2014, rural poverty in the region fell by almost
20 percentage points. Key to this successful performance was a switch in public policy
from generalised consumer subsidies to targeted conditional cash transfer programmes,
72 2. LATIN AMERICAN AGRICULTURE: PROSPECTS AND CHALLENGES
OECD-FAO AGRICULTURAL OUTLOOK 2019-2028 © OECD/FAO 2019
where Latin American countries have been pioneers. Moreover, during times of economic
crises in the region, agriculture has served as a “buffer” during recessionary periods (Arias
et al., 2017[2]).
The favourable poverty alleviation trend, however, has been reversed in recent years.
Furthermore, there is still a high incidence of poverty and extreme poverty in rural areas
(48.6% and 22.5%, respectively). Since 2015, the trend of closing the gap between the rural
and urban poor has also reversed, and the poverty gap has widened when other dimensions
of poverty (access to basic public services) are taken into consideration (CEPAL, 2018[3];
Food and Agriculture Organization of the UN (FAO), 2018[4]). In addition, the number of
undernourished people increased for the third consecutive year in 2017, reaching 39.3
million in (Food and Agriculture Organization of the UN (FAO) et al., 2018[5]), a problem
related to the affordability of food to poor consumers rather than the physical availability
of food, given the agricultural and food surplus status of the region.
LAC’s abundant natural resource endowment will allow the region to continue playing a
major role in world agricultural production and trade. The challenges for the future lies in
maintaining growth in a context of slower demand growth and lower international prices,
while ensuring that future agricultural growth is more sustainable and more inclusive than
it has been in the past.
Box 2.1. Agriculture in Latin America and the Caribbean – a vastly heterogeneous sector
Agriculture in Latin America and the Caribbean (LAC) is heterogeneous from nearly every
angle. The region covers a great variety of different agro-ecological zones, varied
topography and vastly different farm sizes and structures, operating at different levels of
technology and sophistication. This makes agriculture in the region immensely diverse in
terms of production systems, economic importance and its contribution to income,
employment and trade.
The region’s overall productive structure is highly diverse. A capital and technology-
intensive corporate sector that has successfully managed to integrate itself into global agri-
food markets alongside coexists alongside a broad socio-productive sector based on
subsistence farming, non-farming rural activities and landless rural populations that have
been unable to participate in dynamic economic circuits. Between these two extremes, there
is an intermediate sector that is able to connect to markets, but that continues to be
extremely vulnerable to economic and political shocks as well as to climatic risks.
The heterogeneity of agriculture in LAC is reflected in the diversity of the region’s farm
structures. While agriculture in the Southern Cone is dominated by large, commercial and
export-oriented farms, particularly in Argentina and Brazil but increasingly in other
countries such as Uruguay, much of the rest of the region is characterised by smallholder
and family agriculture. It is estimated that there are 15 million smallholder and family
farmers in the LAC region, who are responsible for a substantial share of the region’s food
production.
As regards trade, while the region as a whole is a major supplier of grains and oilseeds to
global markets, as well as bananas, coffee and sugar, large differences exist across the sub-
regions. For instance, the countries of the Southern Cone, in particular Argentina and
Brazil, are among the world’s largest exporters of wheat, maize, soybeans and sugar,
whereas the Caribbean countries depend on world markets to meet their food requirements.
2. LATIN AMERICAN AGRICULTURE: PROSPECTS AND CHALLENGES 73
OECD-FAO AGRICULTURAL OUTLOOK 2019-2028 © OECD/FAO 2019
There are also large differences in the contribution of agriculture to overall economic
output. On average, primary agriculture merely accounts for less than 5% of GDP in LAC,
but the regional average masks considerable differences across countries. While agriculture
accounts for even less than 4 % of GDP in Mexico and Chile, it exceeds 15% in Belize and
Nicaragua and even 20% in Paraguay. Nevertheless, regardless of the individual country
situation, the importance of agriculture rises when upstream and downstream activities are
added to primary production. Applying this broader definition of agriculture, the sector
accounts for a share of more than 20% of GDP in most of the LAC economies.
2.2. Agricultural development
Agricultural performance
The Latin America and Caribbean region has experienced substantial agricultural output
growth over the past two decades. Brazil was one of the agricultural growth leaders both in
the region and worldwide, with an average growth rate of 4.1% between 1991 and 2015,
while Southern Cone1 and Andean countries’ agriculture grew 2.8%, Central American
agriculture grew 2.5%, and Caribbean countries reported a modest 1.0% average annual
growth rate.
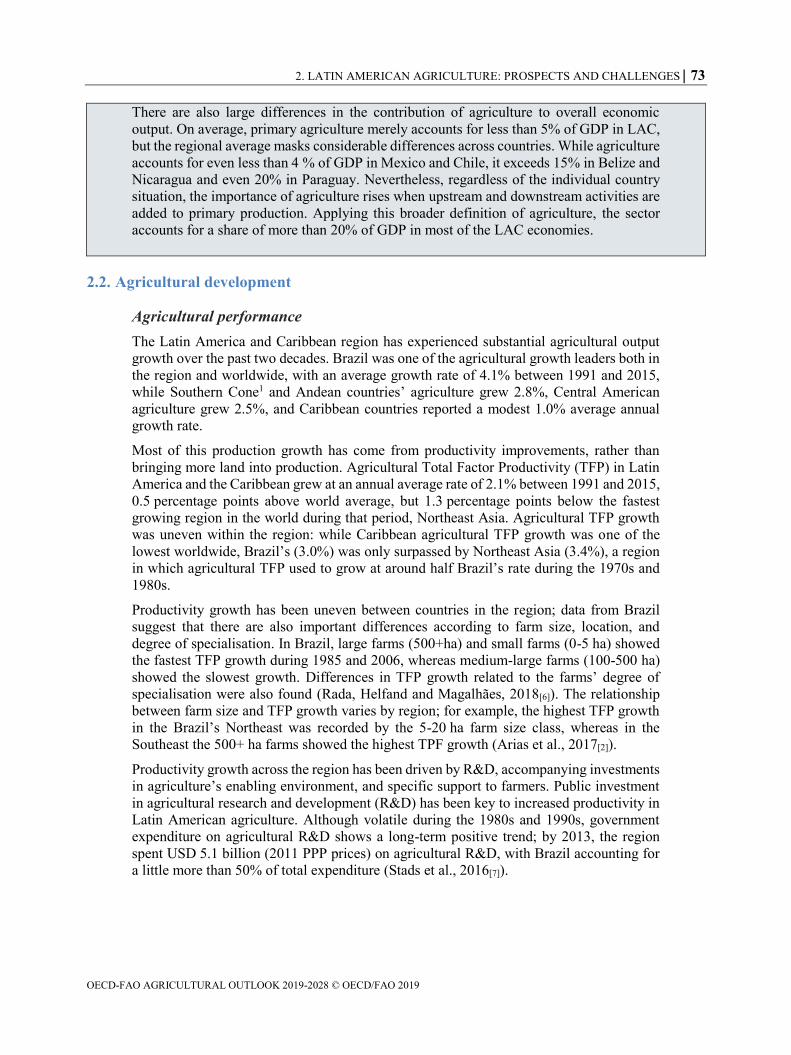
Most of this production growth has come from productivity improvements, rather than
bringing more land into production. Agricultural Total Factor Productivity (TFP) in Latin
America and the Caribbean grew at an annual average rate of 2.1% between 1991 and 2015,
0.5 percentage points above world average, but 1.3 percentage points below the fastest
growing region in the world during that period, Northeast Asia. Agricultural TFP growth
was uneven within the region: while Caribbean agricultural TFP growth was one of the
lowest worldwide, Brazil’s (3.0%) was only surpassed by Northeast Asia (3.4%), a region
in which agricultural TFP used to grow at around half Brazil’s rate during the 1970s and
1980s.
Productivity growth has been uneven between countries in the region; data from Brazil
suggest that there are also important differences according to farm size, location, and
degree of specialisation. In Brazil, large farms (500+ha) and small farms (0-5 ha) showed
the fastest TFP growth during 1985 and 2006, whereas medium-large farms (100-500 ha)
showed the slowest growth. Differences in TFP growth related to the farms’ degree of
specialisation were also found (Rada, Helfand and Magalhães, 2018[6]). The relationship
between farm size and TFP growth varies by region; for example, the highest TFP growth
in the Brazil’s Northeast was recorded by the 5-20 ha farm size class, whereas in the
Southeast the 500+ ha farms showed the highest TPF growth (Arias et al., 2017[2]).
Productivity growth across the region has been driven by R&D, accompanying investments
in agriculture’s enabling environment, and specific support to farmers. Public investment
in agricultural research and development (R&D) has been key to increased productivity in
Latin American agriculture. Although volatile during the 1980s and 1990s, government
expenditure on agricultural R&D shows a long-term positive trend; by 2013, the region
spent USD 5.1 billion (2011 PPP prices) on agricultural R&D, with Brazil accounting for
a little more than 50% of total expenditure (Stads et al., 2016[7]).
74 2. LATIN AMERICAN AGRICULTURE: PROSPECTS AND CHALLENGES
OECD-FAO AGRICULTURAL OUTLOOK 2019-2028 © OECD/FAO 2019
Figure 2.1. Annual total factor productivity growth in agriculture, weighted averages,
1991-2015
Notes: Brazil includes French Guyana, Guyana and Surinam; LAC is Latin American and the Caribbean.
Source: USDA (2018).
StatLink 2 http://dx.doi.org/10.1787/888933957859
Government agricultural research institutions, sometimes working together with the private
sector, have played a key role in operationalising government expenditure in R&D to
increase productivity. For instance, Brazil’s EMBRAPA, the largest agricultural research
institution in the region, completely transformed agriculture in the Cerrado region
(savannah area) in Midwest Brazil by introducing technologies from abroad (nitrogen
fixation, no-tillage practices, for example) and livestock breeds, and adapting them to the
local conditions to produce cotton, soybeans, maize and cattle (OECD/FAO, 2015[8]).
Argentina’s INTA, through its research on seed breeding, direct seeding, weed control, and
working together with the private sector, was instrumental in soybean productivity growth
(including the expansion of the double cropping soybean-wheat system) in the Pampa and
extra-Pampa regions (Bisang, Anlló and Campi, 2015[9]). Research conducted by Chile’s
INIA has contributed to boosting Chilean agricultural exports; by introducing new nut
varieties, farmers estimate that nut exports increased 1000% in the decade from 2001 to
2011. INIA also introduced blueberries in various regions of Chile and, from being
practically an unknown fruit to farmers only two decades ago, today Chile is an important
blueberry producer and exporter in the Southern hemisphere (Instituto de Investigaciones
Agropecuarias (INIA), 2014[10]). In Mexico, an assessment of 30 new technologies
developed by INIFAP over the 2000-2010 period (new bean, oat, garbanzo, and garlic
varieties, forage management, more efficient water use, for example) concluded that these
technologies reached 536 369 farmers and 1.8 Mha, and yielded internal rates of return
ranging from 10.6% to 73% (González-Estrada, 2016[11]).
Parallel investments in agriculture’s enabling environment can leverage the benefits of
R&D. Complementary factors include policies that improve economic incentives for
producers, stronger rural education and agricultural extension services, and rural
infrastructure that improves access to markets. (Fuglie and Wang, 2012[12]).
Specific support has also been delivered to farmers. Mexico’s Alianza para el Campo, for
example, has offered support to farmers under a wide array of instruments, including on-
farm investment subsidies (Programa de Apoyo a la Inversión en Equipamiento e
Infraestructura), income support (Procampo, Diesel Agropecuario, Fomento Productivo
0
0.5
1
1.5
2
2.5
3
3.5
Brazil Andean Central America and Mexico Caribbean LAC World
%
2. LATIN AMERICAN AGRICULTURE: PROSPECTS AND CHALLENGES 75
OECD-FAO AGRICULTURAL OUTLOOK 2019-2028 © OECD/FAO 2019
del Café, for example), natural resource conservation programmes, risk management and
marketing support. The Mexican government has also implemented special strategic
programmes such as PROMAF, which supports the maize and bean value chains, being
these two products traditional staple foods of the Mexican diet.
Brazil has similarly implemented comprehensive agricultural policies addressing specific
target farmer populations, such as PRONAF (National Programme to Strengthen Family
Farming). Mid-size farmers have had access to special lines of credit through PRONAMP
(National Programme to Support Medium Agricultural Producers) and larger producers
have benefitted from price support and subsidised credit and insurance programmes.
Chile’s agricultural policy has focused both on developing efficient internal markets
(improving market information, storage infrastructure, promoting contract agriculture, for
example) and promoting agricultural exports through its Fondo de Promoción de
Exportaciones Agropecuarias. The Chilean government subsidises small-scale irrigation
projects through competitive tender processes. Through FONDOSAG, farmers receive
government support to invest on phytosanitary, animal health and resource conservation
matters. Smallholder farmers have traditionally been supported by INDAP, a Ministry of
Agriculture Institute that provides a wide array of instruments for this type of farmers,
including credit, training, on-farm investment subsidies, and marketing support.
Other Latin American and Caribbean countries have also supported farmers, by facilitating
access to credit and new technologies, and providing other investments. However, their
impact on agricultural productivity is difficult to assess, and there have been few formal
impact evaluations.
Agricultural productivity also benefits from the building of human and social capital. Better
management skills are complemented by the fast-paced growth in information
technologies, which improve both technical and allocative efficiency. Better organisational
skills also allow farmers to respond better to changing market conditions (Chang and
Zepeda, 2001[13]). Over 33 000 agricultural cooperatives are active in the LAC region. In
addition, several farmers’ organisations at national, sub-regional and regional levels
operate with various degrees of effectiveness.
Colombia’s Federación Nacional de Cafeteros, for example, conducts marketing
campaigns in several countries, directly trades coffee, and conducts research and
technology transfer for its member farmers. The quinoa export boom would have probably
not been possible without the existence of quinoa producer associations, such as Bolivia’s
ANAPQUI and APQUISA, or Peru’s various quinoa cooperatives. At the regional level,
the Latin American Poultry Producers Association, through its Technical and Scientific
Committee, designs poultry disease prevention, control and eradication plans, as well as
training programmes for poultry associations at the country level.
Changes in the structure of agricultural production
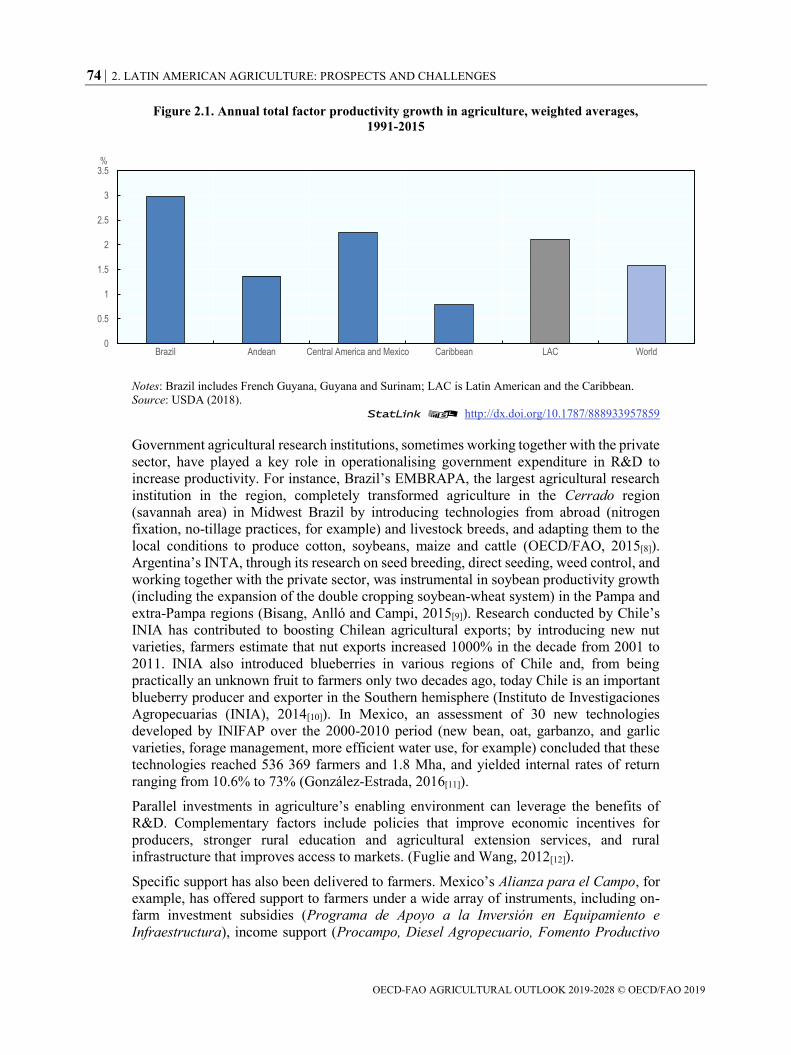
Since 2000, the pasture area in LAC has remained almost stable at 570 Mha, whereas crop
land has increased by 1.2% p.a. to 188 Mha in 2018. Brazil alone increased agricultural
harvested area by 55.7 Mha over the past three decades. Since 2000, nearly a third of the
increase in area harvested of cereals, oilseeds and pulses in Argentina and Brazil has been
due to double cropping. Oilseed (especially soybean) harvested area increased considerably
in MERCOSUR countries, remained fairly constant in Andean countries, except for
Bolivia, and declined steadily in Central America, Mexico and Chile. In contrast, fruits and
vegetables gained considerable importance in Central America, Mexico and Chile.
76 2. LATIN AMERICAN AGRICULTURE: PROSPECTS AND CHALLENGES
OECD-FAO AGRICULTURAL OUTLOOK 2019-2028 © OECD/FAO 2019
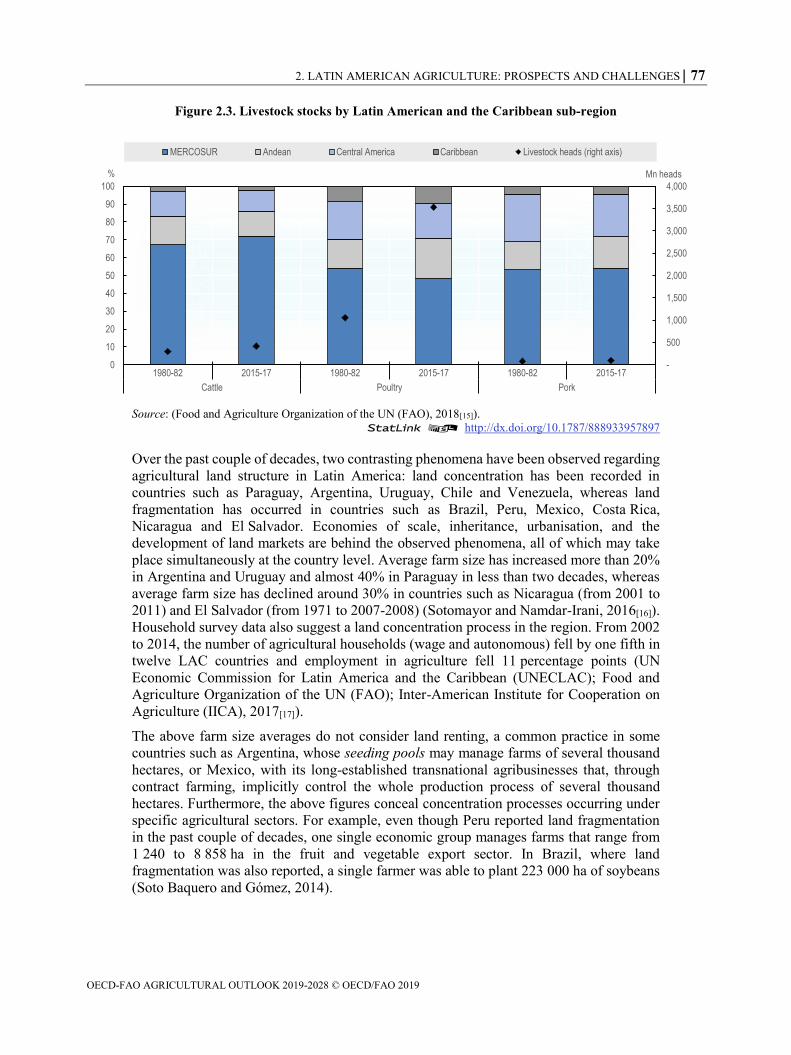
Cattle ranching has shown different dynamics in Latin America: while the cattle herd has
remained relatively constant in the Caribbean (the fall in Cuba and small island countries
has been offset by the increase in the Dominican Republic), it has grown moderately in
Central America, Mexico, Andean countries and Uruguay, and rapidly in Brazil and
Paraguay. Cattle herd increased from 293 million head in 1980-82 to 414 million head in
2015-17, with 80% of this growth occurring in Brazil alone. In 2015-17, Brazil accounted
for 53% of the total LAC herd (11 percentage points more than in 1980-82).
Aviculture has been particularly dynamic in the region, with growing domestic and foreign
demand underpinned by favourable prices relative to other meats. Poultry stocks have
trebled in MERCOSUR and Central American countries over the past three decades, and
more than trebled in Andean countries and in the Caribbean. In contrast to cattle ranching,
aviculture growth has been less concentrated regionally. In fact, even though poultry stocks
trebled in Brazil between 1980-82 and 2015-17, Brazil’s share of LAC’s total poultry
stocks fell 4 percentage points; nevertheless, the country still accounts for 40% of total
LAC poultry stocks. Andean countries’ share of total LAC poultry stocks increased
6 percentage points during this period, thanks mainly to Bolivia, whose expansion of
soybean area made poultry feed more affordable for Bolivian producers.
Figure 2.2. Cereal and soybean harvested area in Latin America and the Caribbean
Note: Area harvested includes double cropping; LAC is Latin American and the Caribbean.
Source: FAOSTAT.
StatLink 2 http://dx.doi.org/10.1787/888933957878
The structure of Latin American agriculture is heterogeneous and has evolved differently
across countries. Large, export-oriented, capital-intensive farms coexist with small, labour-
intensive, subsistence-oriented farms. Out of the estimated 20.4 million farms in the region,
81.3% are smallholder family farms, occupying only 23.4% of farm land. Conversely,
18.7% of all farms own 76.6% of total agricultural land (Leporati et al., 2014[14]).
a) LAC total area harvested 1980-2017 b) Proportion of area harvested by LAC regions
0
20000
40000
60000
80000
100000
120000
140000kha
Cereals Soybeans
0
10
20
30
40
50
60
70
80
90
100
1980-82 2015-17 1980-82 2015-17
Soybeans Cereals
% Argentina Brazil Other South
2. LATIN AMERICAN AGRICULTURE: PROSPECTS AND CHALLENGES 77
OECD-FAO AGRICULTURAL OUTLOOK 2019-2028 © OECD/FAO 2019
Figure 2.3. Livestock stocks by Latin American and the Caribbean sub-region
Source: (Food and Agriculture Organization of the UN (FAO), 2018[15]).
StatLink 2 http://dx.doi.org/10.1787/888933957897
Over the past couple of decades, two contrasting phenomena have been observed regarding
agricultural land structure in Latin America: land concentration has been recorded in
countries such as Paraguay, Argentina, Uruguay, Chile and Venezuela, whereas land
fragmentation has occurred in countries such as Brazil, Peru, Mexico, Costa Rica,
Nicaragua and El Salvador. Economies of scale, inheritance, urbanisation, and the
development of land markets are behind the observed phenomena, all of which may take
place simultaneously at the country level. Average farm size has increased more than 20%
in Argentina and Uruguay and almost 40% in Paraguay in less than two decades, whereas
average farm size has declined around 30% in countries such as Nicaragua (from 2001 to
2011) and El Salvador (from 1971 to 2007-2008) (Sotomayor and Namdar-Irani, 2016[16]).
Household survey data also suggest a land concentration process in the region. From 2002
to 2014, the number of agricultural households (wage and autonomous) fell by one fifth in
twelve LAC countries and employment in agriculture fell 11 percentage points (UN
Economic Commission for Latin America and the Caribbean (UNECLAC); Food and
Agriculture Organization of the UN (FAO); Inter-American Institute for Cooperation on
Agriculture (IICA), 2017[17]).
The above farm size averages do not consider land renting, a common practice in some
countries such as Argentina, whose seeding pools may manage farms of several thousand
hectares, or Mexico, with its long-established transnational agribusinesses that, through
contract farming, implicitly control the whole production process of several thousand
hectares. Furthermore, the above figures conceal concentration processes occurring under
specific agricultural sectors. For example, even though Peru reported land fragmentation
in the past couple of decades, one single economic group manages farms that range from
1 240 to 8 858 ha in the fruit and vegetable export sector. In Brazil, where land
fragmentation was also reported, a single farmer was able to plant 223 000 ha of soybeans
(Soto Baquero and Gómez, 2014).
-
500
1,000
1,500
2,000
2,500
3,000
3,500
4,000
0
10
20
30
40
50
60
70
80
90
100
1980-82 2015-17 1980-82 2015-17 1980-82 2015-17
Cattle Poultry Pork
Mn heads%
MERCOSUR Andean Central America Caribbean Livestock heads (right axis)
78 2. LATIN AMERICAN AGRICULTURE: PROSPECTS AND CHALLENGES
OECD-FAO AGRICULTURAL OUTLOOK 2019-2028 © OECD/FAO 2019
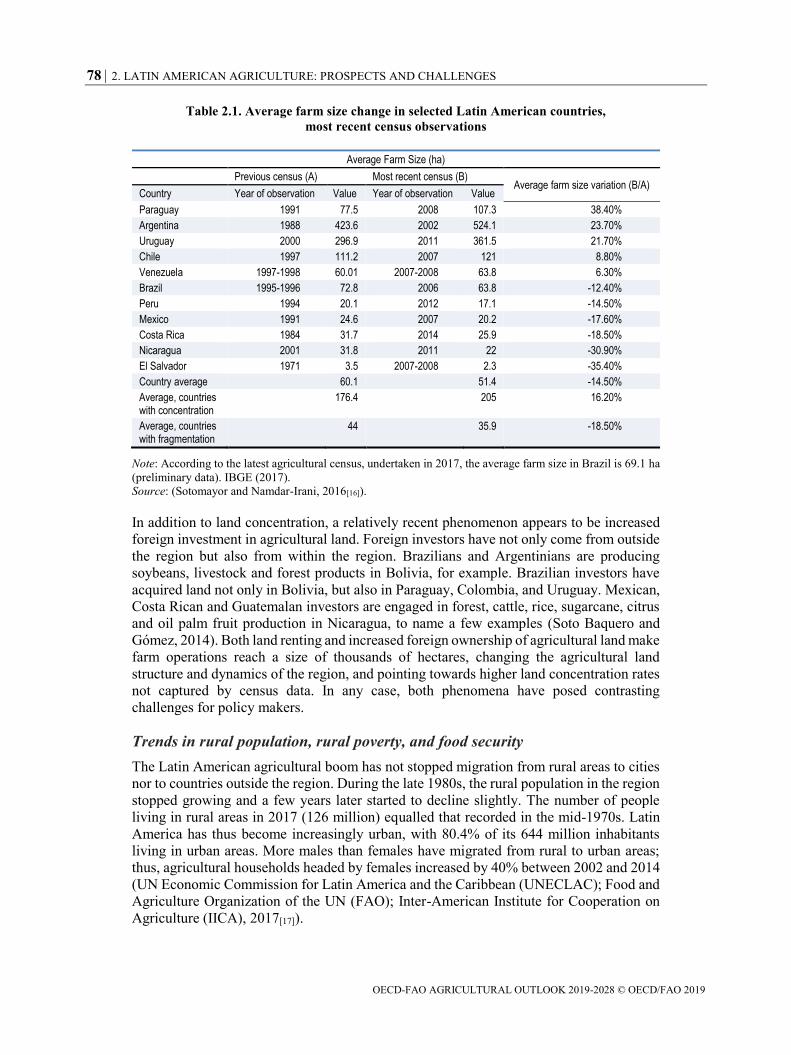
Table 2.1. Average farm size change in selected Latin American countries,
most recent census observations
Average Farm Size (ha) Previous census (A) Most recent census (B)
Average farm size variation (B/A) Country Year of observation Value Year of observation Value
Paraguay 1991 77.5 2008 107.3 38.40%
Argentina 1988 423.6 2002 524.1 23.70%
Uruguay 2000 296.9 2011 361.5 21.70%
Chile 1997 111.2 2007 121 8.80%
Venezuela 1997-1998 60.01 2007-2008 63.8 6.30%
Brazil 1995-1996 72.8 2006 63.8 -12.40%
Peru 1994 20.1 2012 17.1 -14.50%
Mexico 1991 24.6 2007 20.2 -17.60%
Costa Rica 1984 31.7 2014 25.9 -18.50%
Nicaragua 2001 31.8 2011 22 -30.90%
El Salvador 1971 3.5 2007-2008 2.3 -35.40%
Country average
60.1
51.4 -14.50%
Average, countries with concentration
176.4
205 16.20%
Average, countries with fragmentation
44
35.9 -18.50%
Note: According to the latest agricultural census, undertaken in 2017, the average farm size in Brazil is 69.1 ha
(preliminary data). IBGE (2017).
Source: (Sotomayor and Namdar-Irani, 2016[16]).
In addition to land concentration, a relatively recent phenomenon appears to be increased
foreign investment in agricultural land. Foreign investors have not only come from outside
the region but also from within the region. Brazilians and Argentinians are producing
soybeans, livestock and forest products in Bolivia, for example. Brazilian investors have
acquired land not only in Bolivia, but also in Paraguay, Colombia, and Uruguay. Mexican,
Costa Rican and Guatemalan investors are engaged in forest, cattle, rice, sugarcane, citrus
and oil palm fruit production in Nicaragua, to name a few examples (Soto Baquero and
Gómez, 2014). Both land renting and increased foreign ownership of agricultural land make
farm operations reach a size of thousands of hectares, changing the agricultural land
structure and dynamics of the region, and pointing towards higher land concentration rates
not captured by census data. In any case, both phenomena have posed contrasting
challenges for policy makers.
Trends in rural population, rural poverty, and food security
The Latin American agricultural boom has not stopped migration from rural areas to cities
nor to countries outside the region. During the late 1980s, the rural population in the region
stopped growing and a few years later started to decline slightly. The number of people
living in rural areas in 2017 (126 million) equalled that recorded in the mid-1970s. Latin
America has thus become increasingly urban, with 80.4% of its 644 million inhabitants
living in urban areas. More males than females have migrated from rural to urban areas;
thus, agricultural households headed by females increased by 40% between 2002 and 2014
(UN Economic Commission for Latin America and the Caribbean (UNECLAC); Food and
Agriculture Organization of the UN (FAO); Inter-American Institute for Cooperation on
Agriculture (IICA), 2017[17]).

2. LATIN AMERICAN AGRICULTURE: PROSPECTS AND CHALLENGES 79
OECD-FAO AGRICULTURAL OUTLOOK 2019-2028 © OECD/FAO 2019
For 25 years, Latin America witnessed continuous improvement in rural poverty reduction
(20 percentage points from 1990 to 2014). Some countries were able to reduce rural poverty
significantly such as Brazil (42 percentage points from 1990 to 2014), Ecuador
(39 percentage points from 2000 to 2014), Chile (32 percentage points from 1990 to 2013)
and Peru (27 percentage points from 1997 to 2014). Economic growth, public investment
in infrastructure and public services, and the implementation of social protection
programmes, mainly conditional cash-transfer programmes which, by 2015, covered about
a fifth of the Latin American population, largely explain these achievements (Food and
Agriculture Organization of the UN (FAO), 2018[4]).
This positive poverty alleviation trend, including the narrowing of the rural/urban poverty
gap, stagnated in 2014-2016 and reversed in some countries. Furthermore, significant
gender inequalities prevailed in the region, indigenous and Afro-descendant peoples
suffered from marginalisation, and social security, housing quality and educational-level
inequalities were evident (Food and Agriculture Organization of the UN (FAO), 2018[4]).
Paradoxically, being an agricultural and food surplus region, Latin America witnessed the
number of food insecure population increase for the third consecutive year (Food and
Agriculture Organization of the UN (FAO) et al., 2018[5]). Rather than the physical
availability of food, the affordability of food to poor consumers has been behind the swing
in food security trends in the region. In addition, overweight and obesity have increasingly
become a public health problem in Latin American and Caribbean societies. One-fifth of
LAC’s population is considered obese, and obesity seems to remain on the rise, particularly
affecting lower-income sectors of the population, women, indigenous peoples, Afro-
descendants and, in some cases, children (Box 2.2).
Box 2.2. The obesity epidemic in Latin America and the Caribbean region
A regional look at diet composition and at policies that aim to halt an alarming trend
The Latin America and Caribbean (LAC) region has faced the challenge of malnutrition
for a long time. Important progress in decreasing the prevalence of undernutrition has
occurred over the last decades in part related to a strong political commitment by countries
across the LAC region. A report by the World Food Programme (WFP) and the Economic
Commission for Latin America and the Caribbean (ECLAC) (WFP-ECLAC, 2017[19])
states that over-nutrition is expected to become the main social and economic problem in
the LAC region. Indeed, over-nutrition together with a lack of physical activity is a major
driver towards people becoming overweight and obese (Graf and Cecchini (2017[20])). This
is related to the energy imbalance between the calories consumed by an individual and the
calories expended (WHO, 2019[21]). Over-nutrition leads to non-communicable diseases
with consequences in terms of public health expenditures, rising prevalence of premature
deaths and to productivity inefficiencies (Devaux and Sassi, 2015[22]).
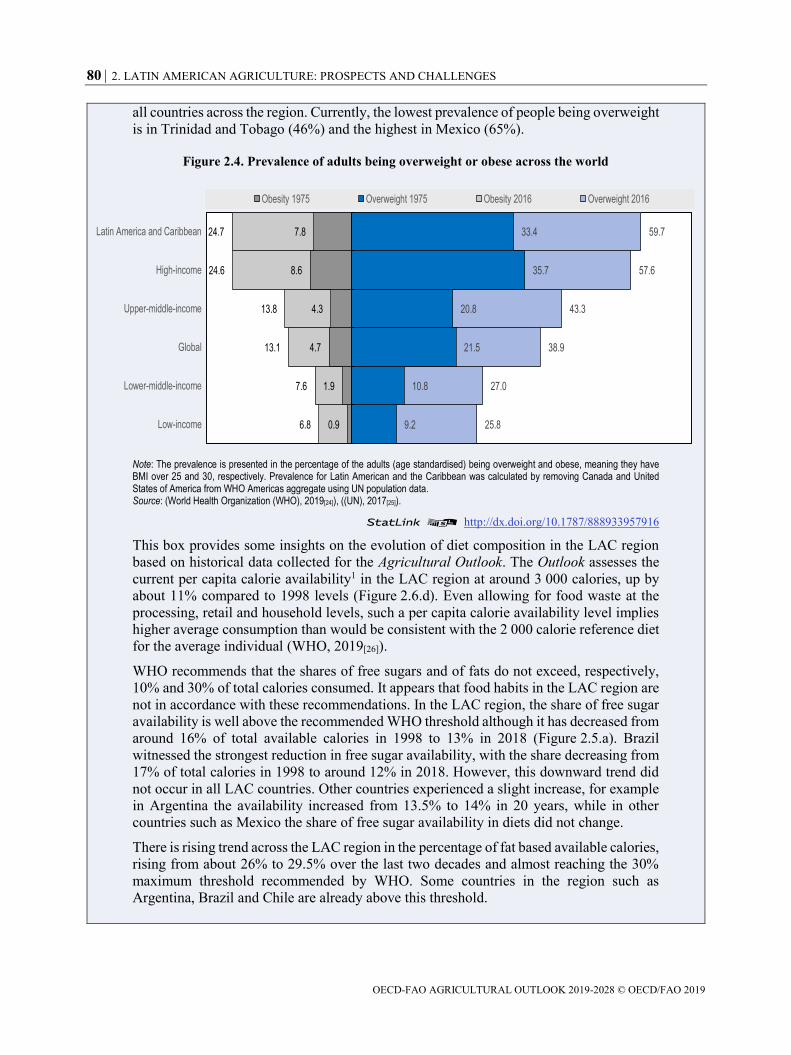
The prevalence of individuals being overweight and obese in the LAC region has been well
above average world levels for more than four decades and is comparable to the levels that
prevail in high-income countries (Figure 2.4). In fact, LAC is the region with the second
highest prevalence of individuals being overweight or obese in the world today, just behind
North America.
According to WHO (2019[23]), the prevalence of people being overweight in the region has
grown steadily from about 35% in 1975 to 60% in 2016 while the prevalence of people
being obese has grown from 8% in 1975 to 25% in 2016. This rising trend has occurred in
80 2. LATIN AMERICAN AGRICULTURE: PROSPECTS AND CHALLENGES
OECD-FAO AGRICULTURAL OUTLOOK 2019-2028 © OECD/FAO 2019
all countries across the region. Currently, the lowest prevalence of people being overweight
is in Trinidad and Tobago (46%) and the highest in Mexico (65%).
Figure 2.4. Prevalence of adults being overweight or obese across the world
Note: The prevalence is presented in the percentage of the adults (age standardised) being overweight and obese, meaning they have BMI over 25 and 30, respectively. Prevalence for Latin American and the Caribbean was calculated by removing Canada and United States of America from WHO Americas aggregate using UN population data. Source: (World Health Organization (WHO), 2019[24]), ((UN), 2017[25]).
StatLink 2 http://dx.doi.org/10.1787/888933957916
This box provides some insights on the evolution of diet composition in the LAC region
based on historical data collected for the Agricultural Outlook. The Outlook assesses the
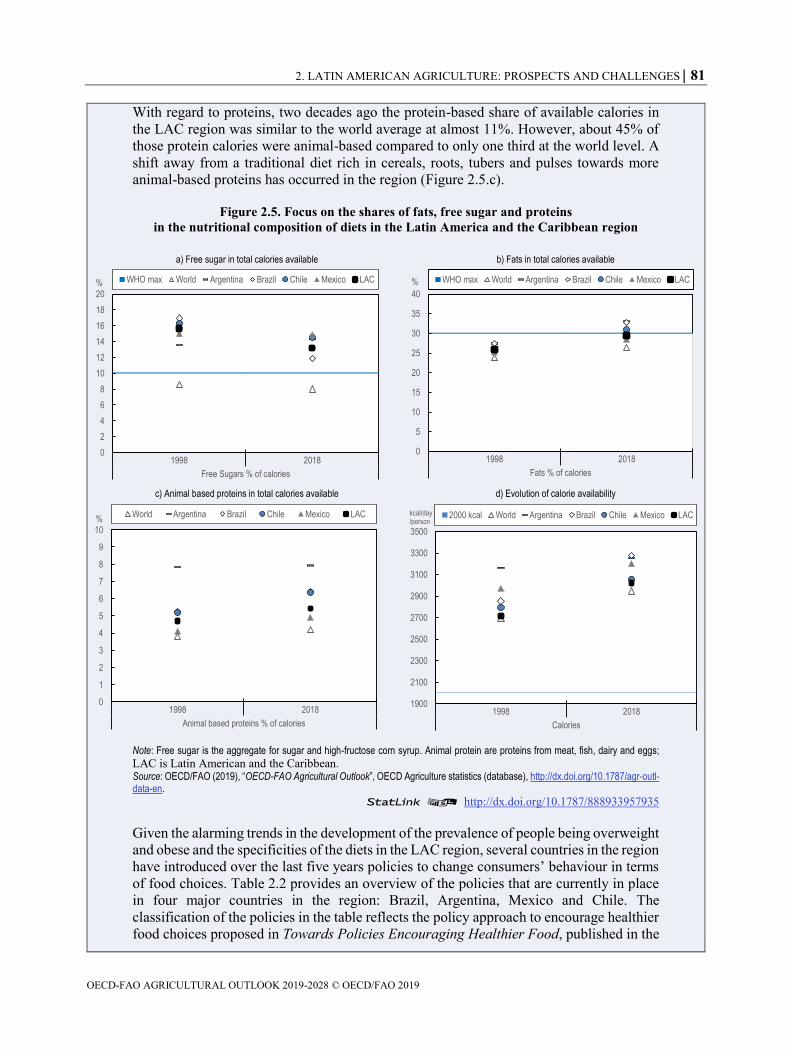
current per capita calorie availability1 in the LAC region at around 3 000 calories, up by
about 11% compared to 1998 levels (Figure 2.6.d). Even allowing for food waste at the
processing, retail and household levels, such a per capita calorie availability level implies
higher average consumption than would be consistent with the 2 000 calorie reference diet
for the average individual (WHO, 2019[26]).
WHO recommends that the shares of free sugars and of fats do not exceed, respectively,
10% and 30% of total calories consumed. It appears that food habits in the LAC region are
not in accordance with these recommendations. In the LAC region, the share of free sugar
availability is well above the recommended WHO threshold although it has decreased from
around 16% of total available calories in 1998 to 13% in 2018 (Figure 2.5.a). Brazil
witnessed the strongest reduction in free sugar availability, with the share decreasing from
17% of total calories in 1998 to around 12% in 2018. However, this downward trend did
not occur in all LAC countries. Other countries experienced a slight increase, for example
in Argentina the availability increased from 13.5% to 14% in 20 years, while in other
countries such as Mexico the share of free sugar availability in diets did not change.
There is rising trend across the LAC region in the percentage of fat based available calories,
rising from about 26% to 29.5% over the last two decades and almost reaching the 30%
maximum threshold recommended by WHO. Some countries in the region such as
Argentina, Brazil and Chile are already above this threshold.
25.8
27.0
38.9
43.3
57.6
59.7
6.8
7.6
13.1
13.8
24.6
24.7
9.2
10.8
21.5
20.8
35.7
33.4
0.9
1.9
4.7
4.3
8.6
7.8
Low-income
Lower-middle-income
Global
Upper-middle-income
High-income
Latin America and Caribbean
Obesity 1975 Overweight 1975 Obesity 2016 Overweight 2016
2. LATIN AMERICAN AGRICULTURE: PROSPECTS AND CHALLENGES 81
OECD-FAO AGRICULTURAL OUTLOOK 2019-2028 © OECD/FAO 2019
With regard to proteins, two decades ago the protein-based share of available calories in
the LAC region was similar to the world average at almost 11%. However, about 45% of
those protein calories were animal-based compared to only one third at the world level. A
shift away from a traditional diet rich in cereals, roots, tubers and pulses towards more
animal-based proteins has occurred in the region (Figure 2.5.c).
Figure 2.5. Focus on the shares of fats, free sugar and proteins
in the nutritional composition of diets in the Latin America and the Caribbean region
Note: Free sugar is the aggregate for sugar and high-fructose corn syrup. Animal protein are proteins from meat, fish, dairy and eggs; LAC is Latin American and the Caribbean.
Source: OECD/FAO (2019), “OECD-FAO Agricultural Outlook”, OECD Agriculture statistics (database), http://dx.doi.org/10.1787/agr-outl-data-en.
StatLink 2 http://dx.doi.org/10.1787/888933957935
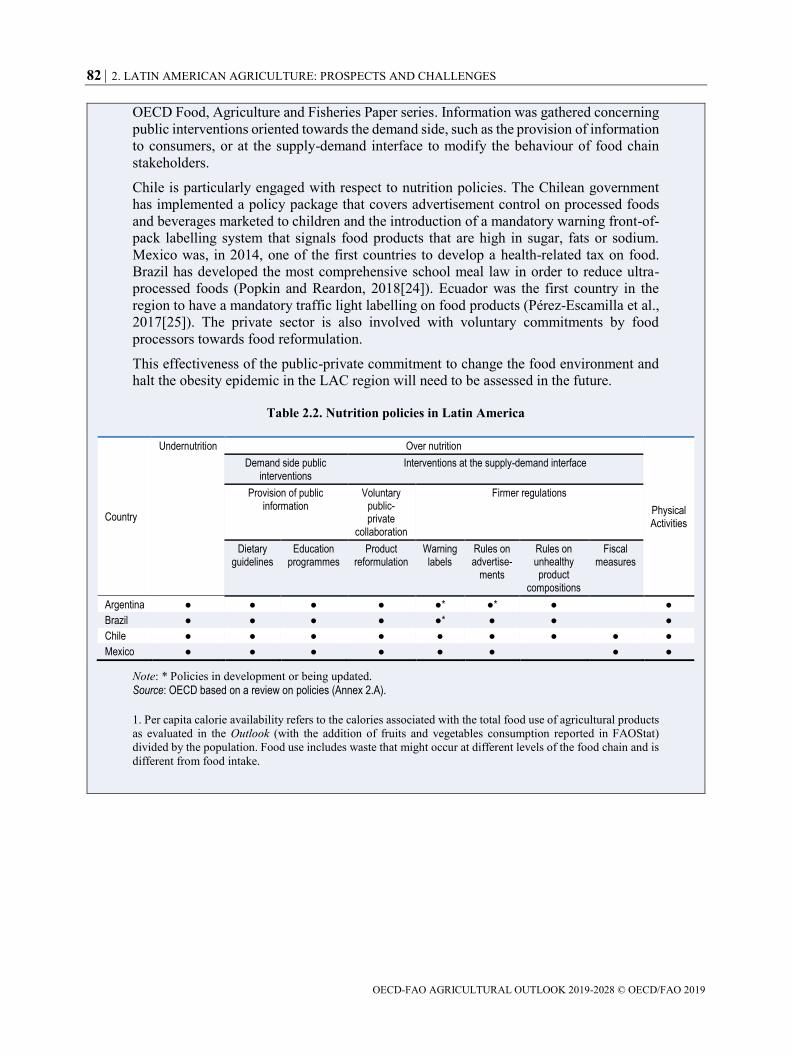
Given the alarming trends in the development of the prevalence of people being overweight
and obese and the specificities of the diets in the LAC region, several countries in the region
have introduced over the last five years policies to change consumers’ behaviour in terms
of food choices. Table 2.2 provides an overview of the policies that are currently in place
in four major countries in the region: Brazil, Argentina, Mexico and Chile. The
classification of the policies in the table reflects the policy approach to encourage healthier
food choices proposed in Towards Policies Encouraging Healthier Food, published in the
a) Free sugar in total calories available b) Fats in total calories available
d) Evolution of calorie availabilityc) Animal based proteins in total calories available
0
2
4
6
8
10
12
14
16
18
20
1998 2018
Free Sugars % of calories
% WHO max World Argentina Brazil Chile Mexico LAC
0
5
10
15
20
25
30
35
40
1998 2018
Fats % of calories
% WHO max World Argentina Brazil Chile Mexico LAC
0
1
2
3
4
5
6
7
8
9
10
1998 2018
Animal based proteins % of calories
%World Argentina Brazil Chile Mexico LAC
1900
2100
2300
2500
2700
2900
3100
3300
3500
1998 2018
Calories
kcal/day/person
2000 kcal World Argentina Brazil Chile Mexico LAC
82 2. LATIN AMERICAN AGRICULTURE: PROSPECTS AND CHALLENGES
OECD-FAO AGRICULTURAL OUTLOOK 2019-2028 © OECD/FAO 2019
OECD Food, Agriculture and Fisheries Paper series. Information was gathered concerning
public interventions oriented towards the demand side, such as the provision of information
to consumers, or at the supply-demand interface to modify the behaviour of food chain
stakeholders.
Chile is particularly engaged with respect to nutrition policies. The Chilean government
has implemented a policy package that covers advertisement control on processed foods
and beverages marketed to children and the introduction of a mandatory warning front-of-
pack labelling system that signals food products that are high in sugar, fats or sodium.
Mexico was, in 2014, one of the first countries to develop a health-related tax on food.
Brazil has developed the most comprehensive school meal law in order to reduce ultra-
processed foods (Popkin and Reardon, 2018[24]). Ecuador was the first country in the
region to have a mandatory traffic light labelling on food products (Pérez-Escamilla et al.,
2017[25]). The private sector is also involved with voluntary commitments by food
processors towards food reformulation.
This effectiveness of the public-private commitment to change the food environment and
halt the obesity epidemic in the LAC region will need to be assessed in the future.
Table 2.2. Nutrition policies in Latin America
Country
Undernutrition Over nutrition
Physical Activities
Demand side public interventions
Interventions at the supply-demand interface
Provision of public information
Voluntary public-private
collaboration
Firmer regulations
Dietary guidelines
Education programmes
Product reformulation
Warning labels
Rules on advertise-
ments
Rules on unhealthy product
compositions
Fiscal measures
Argentina ● ● ● ● ●* ●* ● ●
Brazil ● ● ● ● ●* ● ● ●
Chile ● ● ● ● ● ● ● ● ●
Mexico ● ● ● ● ● ● ● ●
Note: * Policies in development or being updated.
Source: OECD based on a review on policies (Annex 2.A).
1. Per capita calorie availability refers to the calories associated with the total food use of agricultural products
as evaluated in the Outlook (with the addition of fruits and vegetables consumption reported in FAOStat)
divided by the population. Food use includes waste that might occur at different levels of the food chain and is
different from food intake.
2. LATIN AMERICAN AGRICULTURE: PROSPECTS AND CHALLENGES 83
OECD-FAO AGRICULTURAL OUTLOOK 2019-2028 © OECD/FAO 2019
2.3. Medium-term outlook
The foregoing projections for agricultural markets in Latin America and the Caribbean
reflect the structural determinants described previously. These projections could be
affected by further actions to raise productivity, manage environmental resources
sustainably and to make agricultural growth more inclusive. Strategic responses to these
challenges and policy options are discussed, at the sectoral level, in Section 2.4.
Demand
The demand for Latin American agricultural and food products will be mainly determined
by population and income growth in the region and in its major markets. With 656.6 million
inhabitants, LAC accounts for 8.5% of the world’s total population. South America is the
most populous sub-region, with 65.6% of the total LAC population; Central America and
Mexico account for 27.6% and the Caribbean for the remaining 6.7%. Population growth
in the region has been declining over the past two decades, as the fertility rate in the region
dropped from 3.06 births per woman in 1995 to 2.12 in recent years, and due to the net out-
migration of the region. In 2005, for instance, emigration to developed countries peaked at
1.1 million people, and has stabilised at around 350 000 migrants per year in recent years.
Annual average population growth in the region is expected to decline from 1.3% in the
past two decades to 0.8% over the next decade. Population growth in the largest economy
and most populous country of the region, Brazil (with a population of 212 million in 2019)
is expected to halve in the next decade, to 0.6% per year, compared with other 1.1% over
the past two decades. Mexico (with second largest population at 132 million) will also see
a decline in population growth, going from 1.4% in 1995-2018 to 1.0% per year in 2019-
2028.
Real per capita GDP in the LAC region is expected to grow by an average of 1.9% per year
in the next decade, 0.3 percentage points higher than in OECD economies. This will bring
about changes in the composition of demand for LAC agricultural and food products.
Increased demand for animal-based proteins, for example, could be expected. In addition,
domestically, increased consumption of fruits, vegetables, meats, dairy, and fish could be
expected relative to staples such as maize (whose per capita food consumption is expected
to decline by 4.3% in the coming decade), wheat, rice and beans. Annual consumption of
dairy products in the LAC region is projected to grow by 1.2% in the case of butter, 1.4%
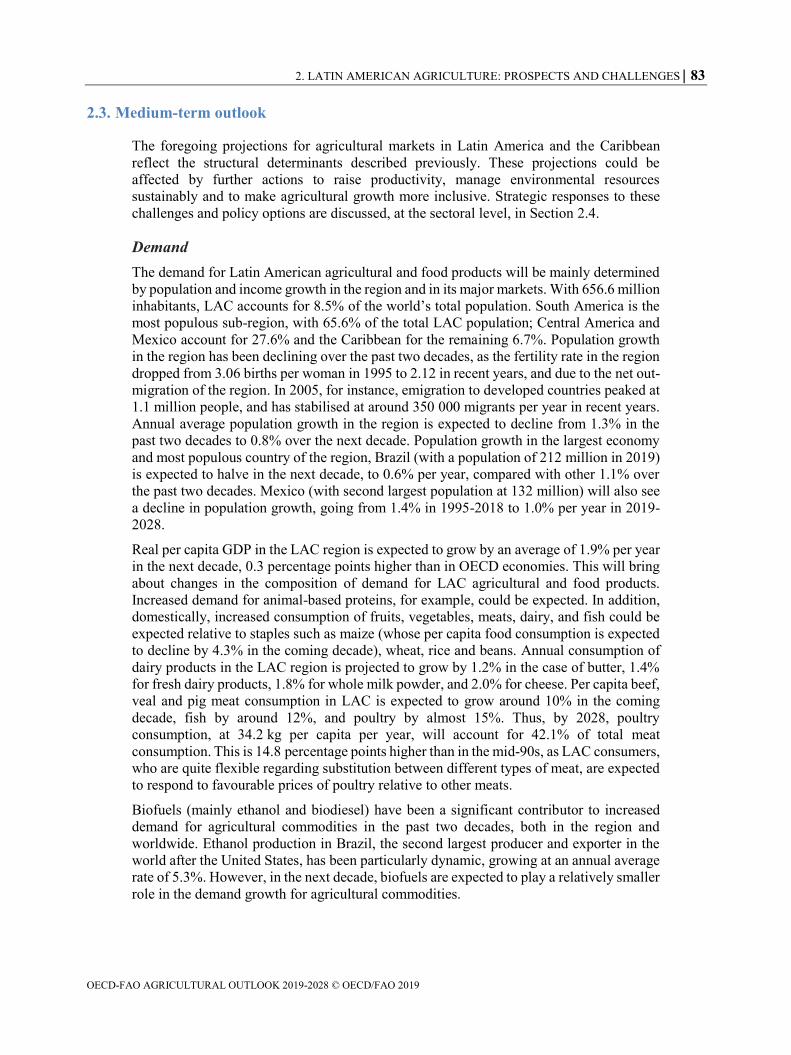
for fresh dairy products, 1.8% for whole milk powder, and 2.0% for cheese. Per capita beef,
veal and pig meat consumption in LAC is expected to grow around 10% in the coming
decade, fish by around 12%, and poultry by almost 15%. Thus, by 2028, poultry
consumption, at 34.2 kg per capita per year, will account for 42.1% of total meat
consumption. This is 14.8 percentage points higher than in the mid-90s, as LAC consumers,
who are quite flexible regarding substitution between different types of meat, are expected
to respond to favourable prices of poultry relative to other meats.
Biofuels (mainly ethanol and biodiesel) have been a significant contributor to increased
demand for agricultural commodities in the past two decades, both in the region and
worldwide. Ethanol production in Brazil, the second largest producer and exporter in the
world after the United States, has been particularly dynamic, growing at an annual average
rate of 5.3%. However, in the next decade, biofuels are expected to play a relatively smaller
role in the demand growth for agricultural commodities.
84 2. LATIN AMERICAN AGRICULTURE: PROSPECTS AND CHALLENGES
OECD-FAO AGRICULTURAL OUTLOOK 2019-2028 © OECD/FAO 2019
Average annual growth in biodiesel and ethanol consumption in LAC is expected to drop
from 10.8% and 7.2% in the previous decade to 1.6% and 1.3% in the coming decade,
respectively. Developments in international biofuel policy will largely determine future
biofuel performance. On the one hand, blending mandates, such those recently enacted in
Argentina, Brazil, Colombia and Mexico, and programmes such as Brazil’s RENOVABIO
initiative, will stimulate the market for biofuels. On the other hand, the policy debate that
has started in Europe on “food-based” biofuels as a sustainable energy source, which has
countries such as Norway considering the removal of the 20% ethanol blend achieved in
2017, could negatively impact biofuels market development (Renewable Energy Policy
Network for the 21st century (REN21), 2018[27]). This policy debate could reach Latin
American countries at some point, especially those that are net cereal and oilseed importers.
While demand growth for Latin American agricultural and food products is expected to
slow, countries with more diversified trade partners or who can better respond to export
opportunities in countries where food demand will continue to be dynamic (Sub-Saharan
Africa, India, the People’s Republic of China – hereafter “China”) will be less affected.
Furthermore, possible appreciation of China’s yuan and India’s rupee could boost the
demand for Latin American agricultural exports. The baseline Aglink-Cosimo model
macroeconomic projections assume an 11.2% depreciation of the yuan and a 22.7%
depreciation of the rupee by 2028.
Figure 2.6. Per capital meat consumption in Latin America and the Caribbean
Source: OECD/FAO (2019), “OECD-FAO Agricultural Outlook”, OECD Agriculture statistics (database),
http://dx.doi.org/10.1787/agr-outl-data-en.
StatLink 2 http://dx.doi.org/10.1787/888933957954
0
10
20
30
40
50
60
70
80
kg/capita/year
Beef and Veal Pork Poultry Fish
2. LATIN AMERICAN AGRICULTURE: PROSPECTS AND CHALLENGES 85
OECD-FAO AGRICULTURAL OUTLOOK 2019-2028 © OECD/FAO 2019
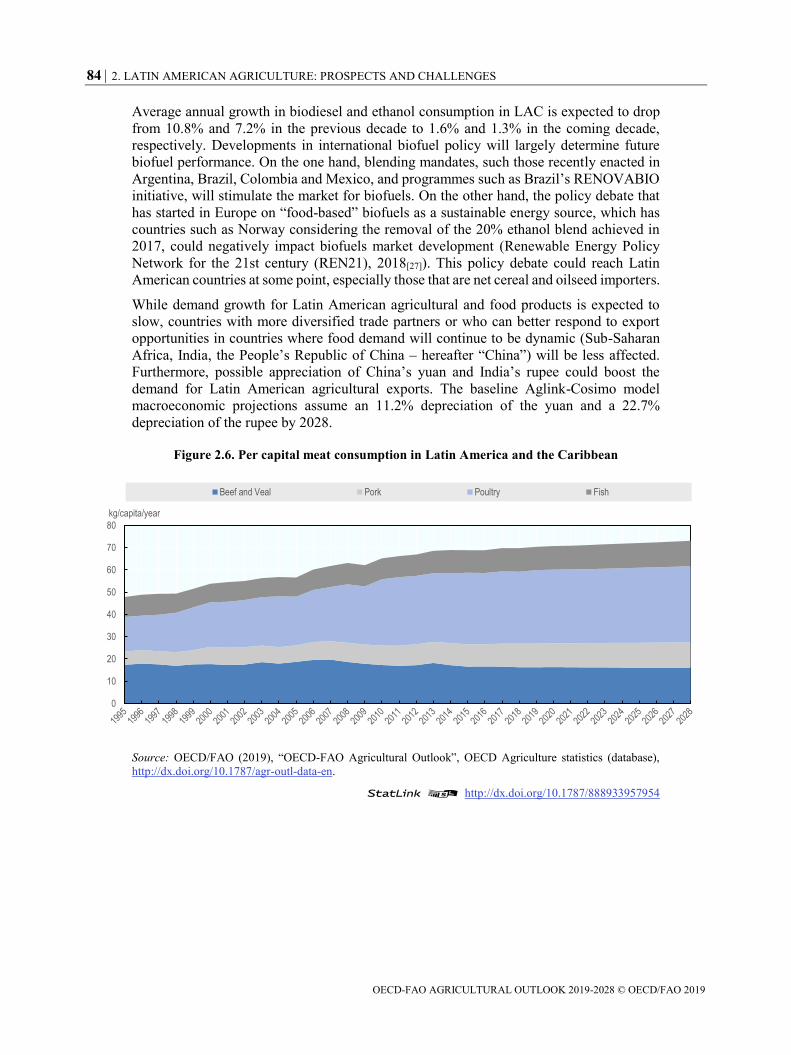
Figure 2.7. Annual growth in demand for key commodity groups in Latin America
and the Caribbean
Note: The population growth component is calculated assuming per capita demand remains constant at the level
of the year preceding the decade. Growth rates refer to total demand (for food, feed and other uses).
Source: OECD/FAO (2018), “OECD-FAO Agricultural Outlook”, OECD Agriculture statistics (database),
http://dx.doi.org/10.1787/agr-outl-data-en.
StatLink 2 http://dx.doi.org/10.1787/888933957973
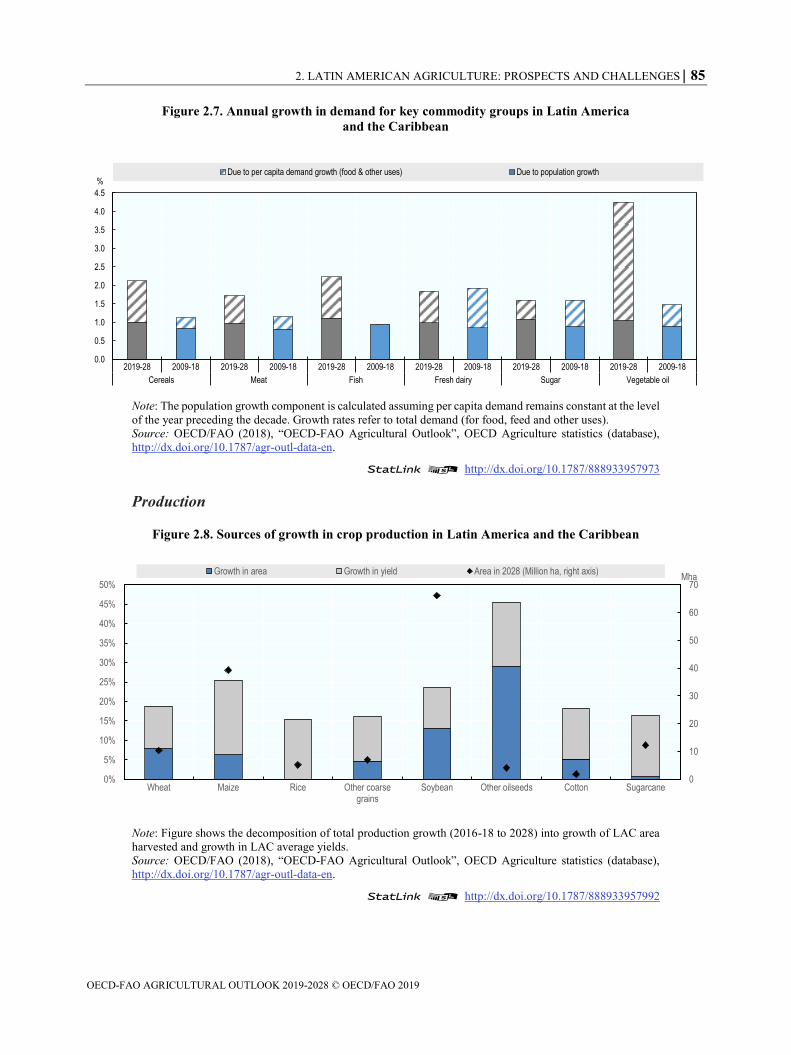
Production
Figure 2.8. Sources of growth in crop production in Latin America and the Caribbean
Note: Figure shows the decomposition of total production growth (2016-18 to 2028) into growth of LAC area
harvested and growth in LAC average yields.
Source: OECD/FAO (2018), “OECD-FAO Agricultural Outlook”, OECD Agriculture statistics (database),
http://dx.doi.org/10.1787/agr-outl-data-en.
StatLink 2 http://dx.doi.org/10.1787/888933957992
0.0
0.5
1.0
1.5
2.0
2.5
3.0
3.5
4.0
4.5
2019-28 2009-18 2019-28 2009-18 2019-28 2009-18 2019-28 2009-18 2019-28 2009-18 2019-28 2009-18
Cereals Meat Fish Fresh dairy Sugar Vegetable oil
%Due to per capita demand growth (food & other uses) Due to population growth
0
10
20
30
40
50
60
70
0%
5%
10%
15%
20%
25%
30%
35%
40%
45%
50%
Wheat Maize Rice Other coarsegrains
Soybean Other oilseeds Cotton Sugarcane
MhaGrowth in area Growth in yield Area in 2028 (Million ha, right axis)
86 2. LATIN AMERICAN AGRICULTURE: PROSPECTS AND CHALLENGES
OECD-FAO AGRICULTURAL OUTLOOK 2019-2028 © OECD/FAO 2019
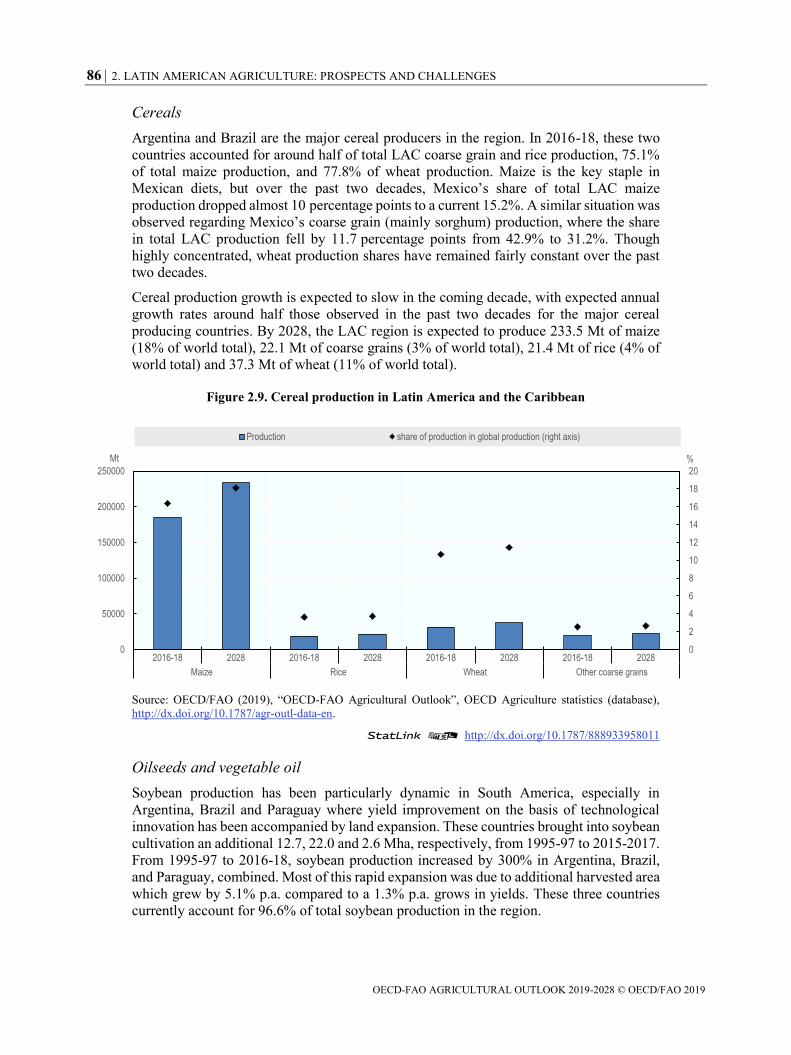
Cereals
Argentina and Brazil are the major cereal producers in the region. In 2016-18, these two
countries accounted for around half of total LAC coarse grain and rice production, 75.1%
of total maize production, and 77.8% of wheat production. Maize is the key staple in
Mexican diets, but over the past two decades, Mexico’s share of total LAC maize
production dropped almost 10 percentage points to a current 15.2%. A similar situation was
observed regarding Mexico’s coarse grain (mainly sorghum) production, where the share
in total LAC production fell by 11.7 percentage points from 42.9% to 31.2%. Though
highly concentrated, wheat production shares have remained fairly constant over the past
two decades.
Cereal production growth is expected to slow in the coming decade, with expected annual
growth rates around half those observed in the past two decades for the major cereal
producing countries. By 2028, the LAC region is expected to produce 233.5 Mt of maize
(18% of world total), 22.1 Mt of coarse grains (3% of world total), 21.4 Mt of rice (4% of
world total) and 37.3 Mt of wheat (11% of world total).
Figure 2.9. Cereal production in Latin America and the Caribbean
Source: OECD/FAO (2019), “OECD-FAO Agricultural Outlook”, OECD Agriculture statistics (database),
http://dx.doi.org/10.1787/agr-outl-data-en.
StatLink 2 http://dx.doi.org/10.1787/888933958011
Oilseeds and vegetable oil
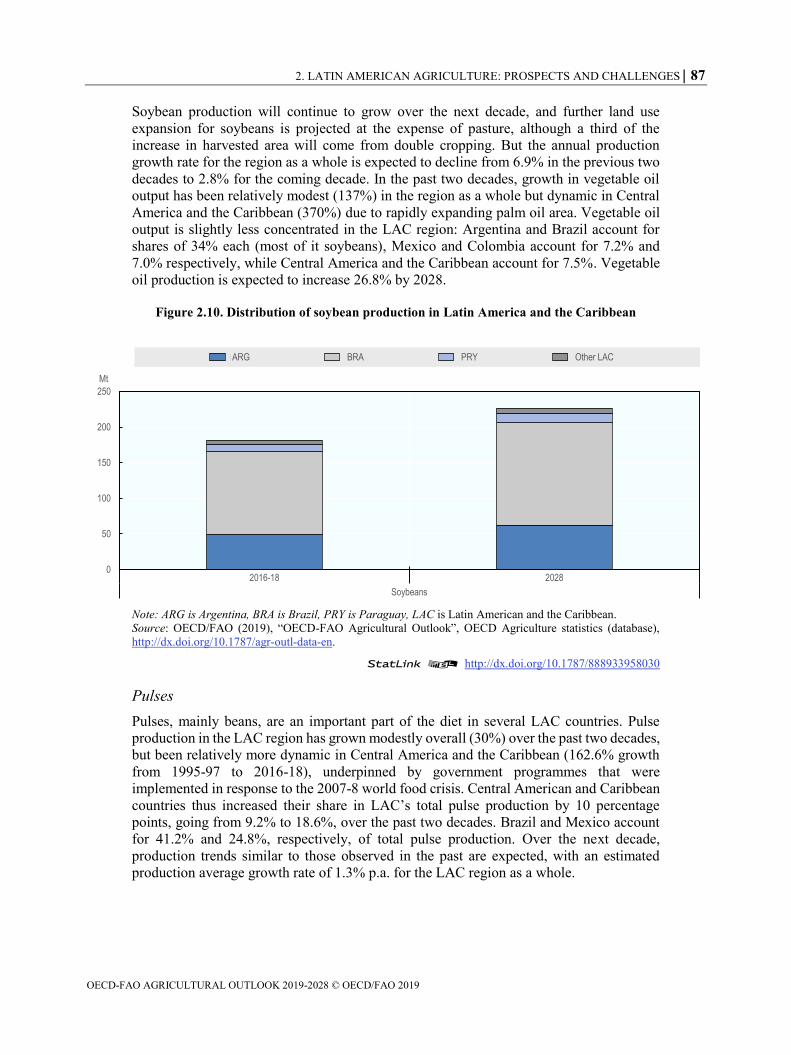
Soybean production has been particularly dynamic in South America, especially in
Argentina, Brazil and Paraguay where yield improvement on the basis of technological
innovation has been accompanied by land expansion. These countries brought into soybean
cultivation an additional 12.7, 22.0 and 2.6 Mha, respectively, from 1995-97 to 2015-2017.
From 1995-97 to 2016-18, soybean production increased by 300% in Argentina, Brazil,
and Paraguay, combined. Most of this rapid expansion was due to additional harvested area
which grew by 5.1% p.a. compared to a 1.3% p.a. grows in yields. These three countries
currently account for 96.6% of total soybean production in the region.
0
2
4
6
8
10
12
14
16
18
20
0
50000
100000
150000
200000
250000
2016-18 2028 2016-18 2028 2016-18 2028 2016-18 2028
Maize Rice Wheat Other coarse grains
%Mt
Production share of production in global production (right axis)
2. LATIN AMERICAN AGRICULTURE: PROSPECTS AND CHALLENGES 87
OECD-FAO AGRICULTURAL OUTLOOK 2019-2028 © OECD/FAO 2019
Soybean production will continue to grow over the next decade, and further land use
expansion for soybeans is projected at the expense of pasture, although a third of the
increase in harvested area will come from double cropping. But the annual production
growth rate for the region as a whole is expected to decline from 6.9% in the previous two
decades to 2.8% for the coming decade. In the past two decades, growth in vegetable oil
output has been relatively modest (137%) in the region as a whole but dynamic in Central
America and the Caribbean (370%) due to rapidly expanding palm oil area. Vegetable oil
output is slightly less concentrated in the LAC region: Argentina and Brazil account for
shares of 34% each (most of it soybeans), Mexico and Colombia account for 7.2% and
7.0% respectively, while Central America and the Caribbean account for 7.5%. Vegetable
oil production is expected to increase 26.8% by 2028.
Figure 2.10. Distribution of soybean production in Latin America and the Caribbean
Note: ARG is Argentina, BRA is Brazil, PRY is Paraguay, LAC is Latin American and the Caribbean.
Source: OECD/FAO (2019), “OECD-FAO Agricultural Outlook”, OECD Agriculture statistics (database),
http://dx.doi.org/10.1787/agr-outl-data-en.
StatLink 2 http://dx.doi.org/10.1787/888933958030
Pulses
Pulses, mainly beans, are an important part of the diet in several LAC countries. Pulse
production in the LAC region has grown modestly overall (30%) over the past two decades,
but been relatively more dynamic in Central America and the Caribbean (162.6% growth
from 1995-97 to 2016-18), underpinned by government programmes that were
implemented in response to the 2007-8 world food crisis. Central American and Caribbean
countries thus increased their share in LAC’s total pulse production by 10 percentage
points, going from 9.2% to 18.6%, over the past two decades. Brazil and Mexico account
for 41.2% and 24.8%, respectively, of total pulse production. Over the next decade,
production trends similar to those observed in the past are expected, with an estimated
production average growth rate of 1.3% p.a. for the LAC region as a whole.
0
50
100
150
200
250
2016-18 2028
Soybeans
Mt
ARG BRA PRY Other LAC
88 2. LATIN AMERICAN AGRICULTURE: PROSPECTS AND CHALLENGES
OECD-FAO AGRICULTURAL OUTLOOK 2019-2028 © OECD/FAO 2019
Cotton
Cotton production doubled in the region over the past two decades. Brazil leads cotton
production in LAC, with 78.4% of total production in 2016-18, followed by Mexico, which
managed to increase its share from 5.8% in 2000-02 to 11% in 2016-18, and Argentina,
with a total production share of 8.8%. Brazil is the world´s fifth largest cotton producer
with around 6% of global production; its cotton exports represent around 10% of the global
total. In the coming decade, LAC cotton production is projected to grow 0.9% per year,
underpinned by growing demand for the fibre and the recent favourable relative prices of
cotton with respect to competing crops such as wheat, soybeans, rice, maize and sugarcane.
This growth, however, will be 3.5 percentage points lower than that in the previous two
decades. Brazil’s export share in total world exports is projected to reach 14.7% by 2028.
Sugar
As in other developing countries, per capita sugar consumption will continue to grow in
LAC countries. Because of socio-economic changes, increased demand for processed food
will stimulate sugar production and thus contribute to the expected 2.6% average annual
growth over the coming decade. Brazil will continue to be LAC’s main sugar producer,
with an expected 62.4% share in total production by 2028, followed by Central American
and Caribbean countries (13.6% of total), and Mexico (9.5% of total). But, after 15
consecutive years as the world’s main sugar producer, Brazil will be overtaken by India in
2019. As Brazil diverts more sugarcane toward ethanol production, Brazil’s share in world
exports is expected to fall from 38.7% in 2016-2018 to 37.6% in 2028.
Roots and tubers
Root and tuber production in the LAC region grew relatively slowly (13.8% over the past
two decades), compared to other agricultural products. Brazil is the main root and tuber
producer in the region, but the area harvested to those products declined by 15.6% over the
past two decades as Brazil’s share of the region’s root and tuber production declined from
56.9% to 46.0%. In contrast, Central American and Caribbean countries and Peru increased
their production share by 5 percentage points, accounting for 10.3% and 11.4% of total,
respectively, in 2016-18. Root and tuber production is expected to grow at an average of
1.4% per year over the coming decade.
Coffee
Brazil is the world’s leading coffee producer and exporter, while Colombia, Honduras, Peru
and Mexico are also among the top ten coffee producers. Five LA countries are top-ten
coffee exporters. Whereas coffee harvested area has remained relatively unchanged in
Brazil over the past two decades, in Colombia and Mexico it has declined by 6.0% and
9.8%, respectively. In contrast, Honduras and Peru have more than doubled coffee
harvested area. These production changes in the region have repositioned countries in
export markets. Brazil increased its export market share from 23% to 29% over the past
two decades while Colombia lost 8 percentage points, going from 17% to 9%. Mexico
accounted for 5% of world coffee exports two decades ago, but now has lost its net exporter
status. Guatemala remains among the major top coffee exporters with 3% market share
(2 percentage points less than two decades ago); Costa Rica is no longer a major exporter,
while Honduras and Peru have export market shares of 4% and 3%, respectively. Latin
American countries will continue to play an important role in world coffee markets, despite
the rising presence of Asian suppliers. The region’s favourable production potential is
2. LATIN AMERICAN AGRICULTURE: PROSPECTS AND CHALLENGES 89
OECD-FAO AGRICULTURAL OUTLOOK 2019-2028 © OECD/FAO 2019
underpinned by growing consumption in emerging markets such as China, the Russian
Federation and Korea, and in current exporting countries such as India, Indonesia and
Viet Nam. However, in order to maintain market share, LA coffee producers will have to
deal with changing climate conditions which will make some regions unsuitable for coffee
production and facilitate the spread of pest and diseases, such as the Coffee Leaf Rust
(Sänger, 2018[28]).
Fruits and vegetables
Underpinned by Free Trade Agreements, LAC production and exports of fruits and
vegetables have grown considerably with most bound for the United States and Canada.
Mexico has traditionally been the main fruit and vegetable supplier to its northern
neighbour, but Central American countries and Chile, taking advantage of their FTAs with
the United States, have also played an increasingly important role in the US winter fruit
and vegetable import market. In 2017, Mexico, Peru, Guatemala and Costa Rica accounted
for 75.4% of US total fresh vegetable imports. In the case of fresh fruits, nine LA countries
accounted for 92.3% of total US imports, with Mexico, Chile, Guatemala and Costa Rica
the main suppliers. Over the past two decades, harvested area of fruits and vegetables in
Mexico increased 26.2%, reaching 1.9 Mha in 2015-17; this compares with increases of
42.2% in Chile and 45.8% in Central America. The region’s traditional fruit and vegetable
production and exports (Mexican tomatoes and avocados, Chilean grapes and peaches,
Central American bananas and pineapples, for example) have risen considerably and have
expanded to include, for example, Chilean cherries and cranberries; Central American
chillies and peppers, and eggplant; and Mexican blueberries and raspberries. Thanks to
favourable climate conditions, and reflecting the labour-intensive nature of production,
LAC countries may continue to enjoy a comparative advantage in fruit and vegetable
production in the future which could be further strengthened by improving storage
technology, infrastructure and production practices.
Box 2.3. Bananas and tropical fruits in Latin America and the Caribbean
Bananas and tropical fruits1 constitute increasingly important commodities to both food
security and rural sector growth of Latin America and the Caribbean (LAC). Predominantly
cultivated within the tropical zones, these fruits first and foremost provide ready sources
of vital calories and nutrients to the growing consumption needs of the region. Beyond
domestic markets, international trade in bananas and tropical fruits has been gaining in
importance as a source of export earnings for many producing countries in LAC. Rapidly
growing demand in burgeoning import markets has bolstered high export prices for the
majority of tropical fruits, making this group an attractive choice in export diversification
away from lower-valued agricultural products.
Abundantly endowed with tropical land that features highly favourable agro-climatic
conditions for the cultivation of tropical products, LAC ranks as the second leading
production zone of bananas and tropical fruits globally, behind Asia. Between 2016 and
2018, LAC accounted for approximately 25% of total global production on average, which
translates into roughly 54 Mt. In terms of individual fruits, bananas constitute the most
important type for the region, displaying an annual production volume of approximately
90 2. LATIN AMERICAN AGRICULTURE: PROSPECTS AND CHALLENGES
OECD-FAO AGRICULTURAL OUTLOOK 2019-2028 © OECD/FAO 2019
30 Mt. At a per capita consumption of 55 kg of bananas and tropical fruits per annum, LAC
also ranks as one of the major consumers of these fruits globally.
The importance of LAC to world fruit supply is further evident in the magnitude of the
region’s trade volumes of unprocessed, fresh or dried bananas and tropical fruits. Aided by
the region’s proximity to the United States of America, one of the largest importers of fruits
globally, LAC has firmly established itself as the world’s primary supplier of both bananas
and tropical fruits in recent decades, accounting for approximately 80% of global
shipments of bananas, pineapples, papayas and avocados, and for approximately 50% of
global mango exports on average.
On account of briskly expanding global demand, the pace of growth in exports of bananas
and tropical fruits from the region shows to have accelerated ahead of production over the
past decade. Building on a large and longstanding indigenous sector – with many tropical
fruits being native to the region – national and multinational enterprises have invested
heavily to capitalize on rising export prospects. While the commercialisation of banana and
pineapple is well established, opportunities for substantial expansion have recently arisen
for the other tropical fruits, which have been subject to rapidly growing consumer interest.
Total shipments of all five fruit commodities combined are estimated to have reached
approximately 20 Mt on average over the three year period from 2016 to 2018. Assessing
net trade of bananas and tropical fruits by region, LAC firmly ranks as the principal
supplier to developed markets. Approximately 86% of EU pineapple imports are sourced
from Costa Rica, and some 70% of EU banana imports from Ecuador, Colombia and Costa
Rica combined. Virtually all banana and avocado imports to the United States originate in
LAC, with Guatemala and Mexico the key suppliers respectively.
Although tropical fruits play a comparatively small role in overall agricultural trade in
volume terms, their high average export unit value of well above USD 1 000 per tonne
places them as the most valuable fruit group in absolute terms, behind bananas. Estimates
point to a total export value of around USD 15.5 billion for bananas and tropical fruits from
LAC combined in 2016-18, of which bananas and avocados accounted for some USD 6
billion and USD 3.5 billion, respectively.2 In some of the key producing countries, export
earnings from bananas and tropical fruits weigh significantly in agricultural GDP. For
example, Costa Rica’s exports of tropical fruits account for approximately one-third of its
entire agricultural export earnings.
Beyond contributing to export earnings, trade in tropical fruits generates substantial income
to smallholder producers in the region, contingent on fair and inclusive trade conditions.
An estimated 80% of avocado cultivation in Mexico is carried out by smallholder farmers
who are endowed with land of 5 ha or less. In many producing zones of the LAC region,
tropical fruits furthermore continue to be cultivated mainly at the subsistence rather than
commercial level, thereby contributing vitally to food security.
Outlook3
Underpinned by global population growth, improvements in per capita incomes in many
consuming regions and associated shifts in diets, banana and tropical fruit production in
Latin America and the Caribbean is projected to grow by 1.4% p.a. in the next decade.
Total combined production is expected to rise by 9 Mt to reach 63 Mt by 2028, with
bananas accounting for 50% of total supply. Encouraged by growing demand, incentives
for higher production of tropical fruits are anticipated to be driven by strong profit margins
and trend growth in crop yields as the sectors become more commercialized. Within the
2. LATIN AMERICAN AGRICULTURE: PROSPECTS AND CHALLENGES 91
OECD-FAO AGRICULTURAL OUTLOOK 2019-2028 © OECD/FAO 2019
region, the largest suppliers of bananas and tropical fruits are Brazil, Colombia, Costa Rica,
Ecuador, Guatemala and Mexico.
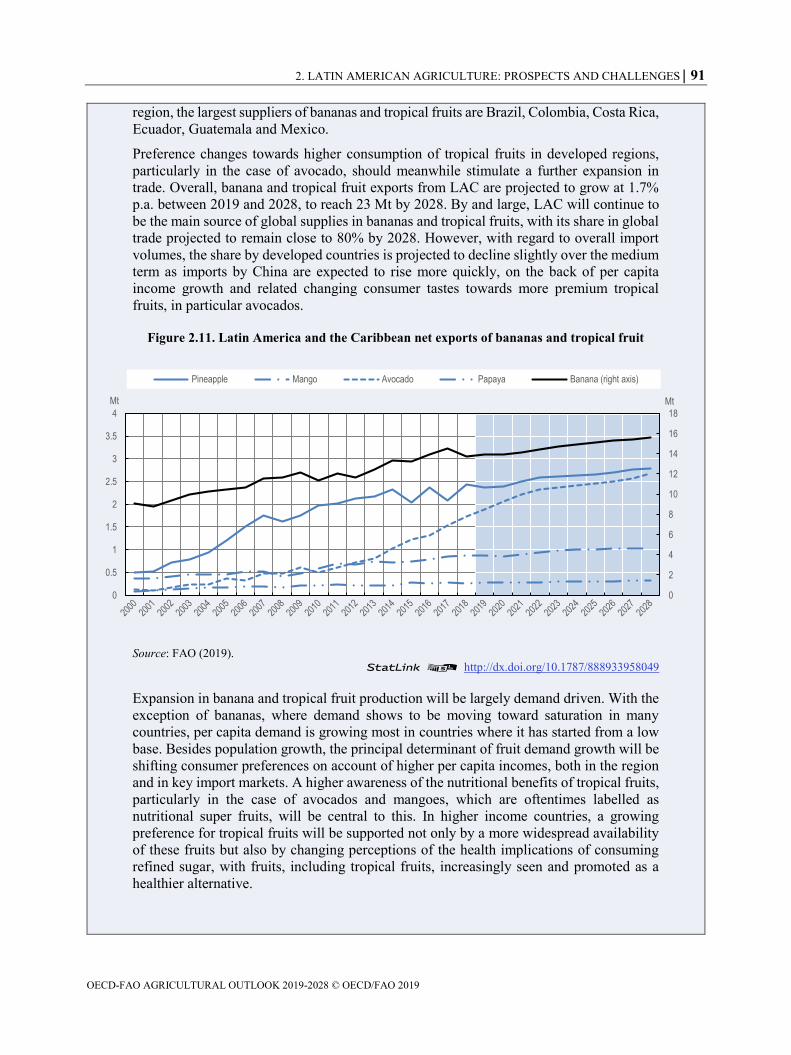
Preference changes towards higher consumption of tropical fruits in developed regions,
particularly in the case of avocado, should meanwhile stimulate a further expansion in
trade. Overall, banana and tropical fruit exports from LAC are projected to grow at 1.7%
p.a. between 2019 and 2028, to reach 23 Mt by 2028. By and large, LAC will continue to
be the main source of global supplies in bananas and tropical fruits, with its share in global
trade projected to remain close to 80% by 2028. However, with regard to overall import
volumes, the share by developed countries is projected to decline slightly over the medium
term as imports by China are expected to rise more quickly, on the back of per capita
income growth and related changing consumer tastes towards more premium tropical
fruits, in particular avocados.
Figure 2.11. Latin America and the Caribbean net exports of bananas and tropical fruit
Source: FAO (2019).
StatLink 2 http://dx.doi.org/10.1787/888933958049
Expansion in banana and tropical fruit production will be largely demand driven. With the
exception of bananas, where demand shows to be moving toward saturation in many
countries, per capita demand is growing most in countries where it has started from a low
base. Besides population growth, the principal determinant of fruit demand growth will be
shifting consumer preferences on account of higher per capita incomes, both in the region
and in key import markets. A higher awareness of the nutritional benefits of tropical fruits,
particularly in the case of avocados and mangoes, which are oftentimes labelled as
nutritional super fruits, will be central to this. In higher income countries, a growing
preference for tropical fruits will be supported not only by a more widespread availability
of these fruits but also by changing perceptions of the health implications of consuming
refined sugar, with fruits, including tropical fruits, increasingly seen and promoted as a
healthier alternative.
0
2
4
6
8
10
12
14
16
18
0
0.5
1
1.5
2
2.5
3
3.5
4
Mt
Tho
usan
ds
Mt
Pineapple Mango Avocado Papaya Banana (right axis)
92 2. LATIN AMERICAN AGRICULTURE: PROSPECTS AND CHALLENGES
OECD-FAO AGRICULTURAL OUTLOOK 2019-2028 © OECD/FAO 2019
The projections affirm the view that bananas and tropical fruits will be among the fastest
growing sectors in agriculture, and as such deserve attention from policymakers looking
for sources of economic growth, nutrition and poverty alleviation in rural sectors. This will
be particularly true for countries in LAC, which are supplying a large part of the global
excess demand for these commodities. However, the threat of climate change and
associated erratic and extreme weather events looms heavily over the sector, given that
many production zones in the LAC region, particularly those located in the Caribbean, have
acute vulnerability to the phenomenon. Detrimental environmental repercussions arising
from issues such as land clearing, deforestation and irrigation as well as perils from pests
and diseases, inter alia, add further stress to production and trade, threatening not only
food security in the region but also the commercial viability of the sector. Trade tensions,
phytosanitary restrictions, volatile freight costs and mounting price pressure in import
markets additionally complicate a sustainable development of the sector in Latin America
and the Caribbean.
1. Tropical fruits included in this analysis are pineapples, mangoes, avocados and papayas.
2. As indicated by reported export values from the region.
3. The projections are dependent on critically important assumptions concerning the growth of key driving
factors such as incomes, population, and input costs, as well as the specific conditions surrounding tropical
fruit production in the rural sector; these include opportunity costs for land, which are affected in turn by the
prices of other agricultural commodities, rural activities and ownership structures. The agricultural conditions
that are also likely to affect the sector were drawn from the OECD-FAO Agricultural Outlook 2019-28.
Livestock
Livestock production has also grown substantially in LAC: during the past two decades,
beef production increased by 33%, pork by 111% and poultry by 302%. This growth has
been driven by an expansion of the aviculture, swine and cattle ranching sectors and by
technological innovation in all livestock sectors.
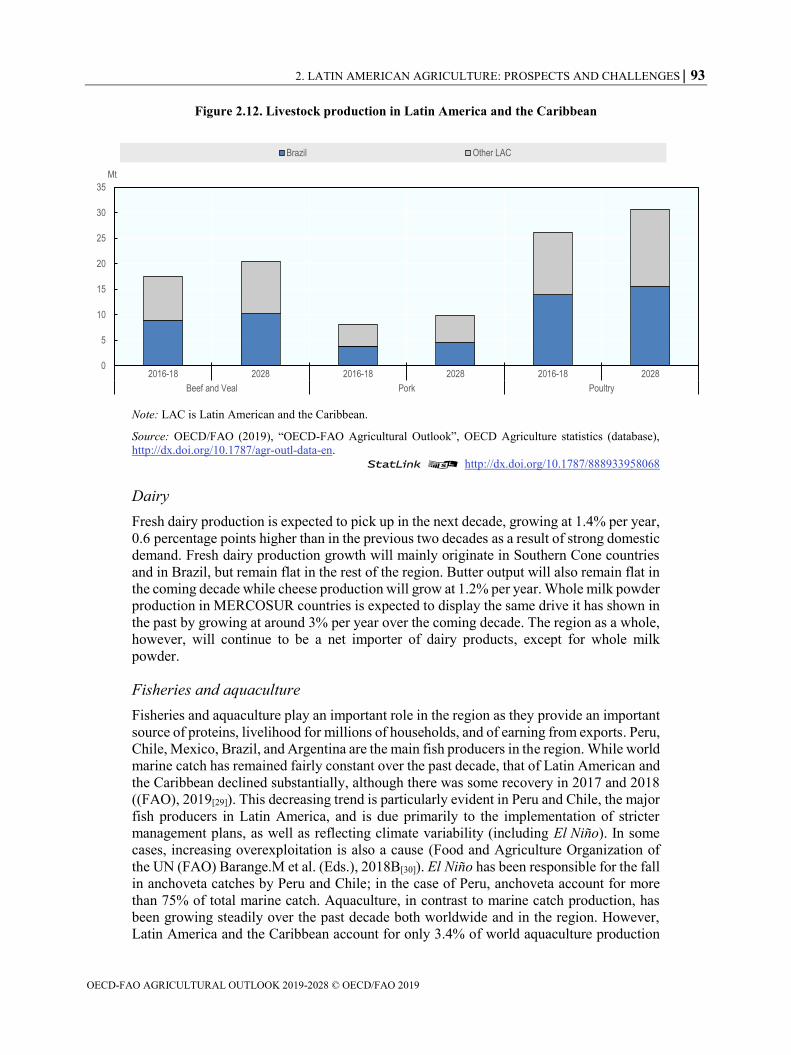
Average annual growth in beef and veal production will slow slightly in the coming decade
to 1.2% compared to 1.4% in the previous two decades. This slowdown is less severe than
that of domestic demand, as a rising share of LAC production will be destined for export.
As in other regions, per capita demand growth is expected to slow as income rise. Brazil
will continue to be the main beef producer in the region; with a projected two additional Mt,
the country will account for 56.9% of total LAC beef production by 2028. Pork and poultry
production will continue to be more dynamic than beef, growing at 2.2% per year in the
coming decade. Brazil’s share in total pork and poultry production is expected to remain at
around 50% in the coming decade.
2. LATIN AMERICAN AGRICULTURE: PROSPECTS AND CHALLENGES 93
OECD-FAO AGRICULTURAL OUTLOOK 2019-2028 © OECD/FAO 2019
Figure 2.12. Livestock production in Latin America and the Caribbean
Note: LAC is Latin American and the Caribbean.
Source: OECD/FAO (2019), “OECD-FAO Agricultural Outlook”, OECD Agriculture statistics (database),
http://dx.doi.org/10.1787/agr-outl-data-en.
StatLink 2 http://dx.doi.org/10.1787/888933958068
Dairy
Fresh dairy production is expected to pick up in the next decade, growing at 1.4% per year,
0.6 percentage points higher than in the previous two decades as a result of strong domestic
demand. Fresh dairy production growth will mainly originate in Southern Cone countries
and in Brazil, but remain flat in the rest of the region. Butter output will also remain flat in
the coming decade while cheese production will grow at 1.2% per year. Whole milk powder
production in MERCOSUR countries is expected to display the same drive it has shown in
the past by growing at around 3% per year over the coming decade. The region as a whole,
however, will continue to be a net importer of dairy products, except for whole milk
powder.
Fisheries and aquaculture
Fisheries and aquaculture play an important role in the region as they provide an important
source of proteins, livelihood for millions of households, and of earning from exports. Peru,
Chile, Mexico, Brazil, and Argentina are the main fish producers in the region. While world
marine catch has remained fairly constant over the past decade, that of Latin American and
the Caribbean declined substantially, although there was some recovery in 2017 and 2018
((FAO), 2019[29]). This decreasing trend is particularly evident in Peru and Chile, the major
fish producers in Latin America, and is due primarily to the implementation of stricter
management plans, as well as reflecting climate variability (including El Niño). In some
cases, increasing overexploitation is also a cause (Food and Agriculture Organization of
the UN (FAO) Barange.M et al. (Eds.), 2018B[30]). El Niño has been responsible for the fall
in anchoveta catches by Peru and Chile; in the case of Peru, anchoveta account for more
than 75% of total marine catch. Aquaculture, in contrast to marine catch production, has
been growing steadily over the past decade both worldwide and in the region. However,
Latin America and the Caribbean account for only 3.4% of world aquaculture production
0
5
10
15
20
25
30
35
2016-18 2028 2016-18 2028 2016-18 2028
Beef and Veal Pork Poultry
Mt
Brazil Other LAC
94 2. LATIN AMERICAN AGRICULTURE: PROSPECTS AND CHALLENGES
OECD-FAO AGRICULTURAL OUTLOOK 2019-2028 © OECD/FAO 2019
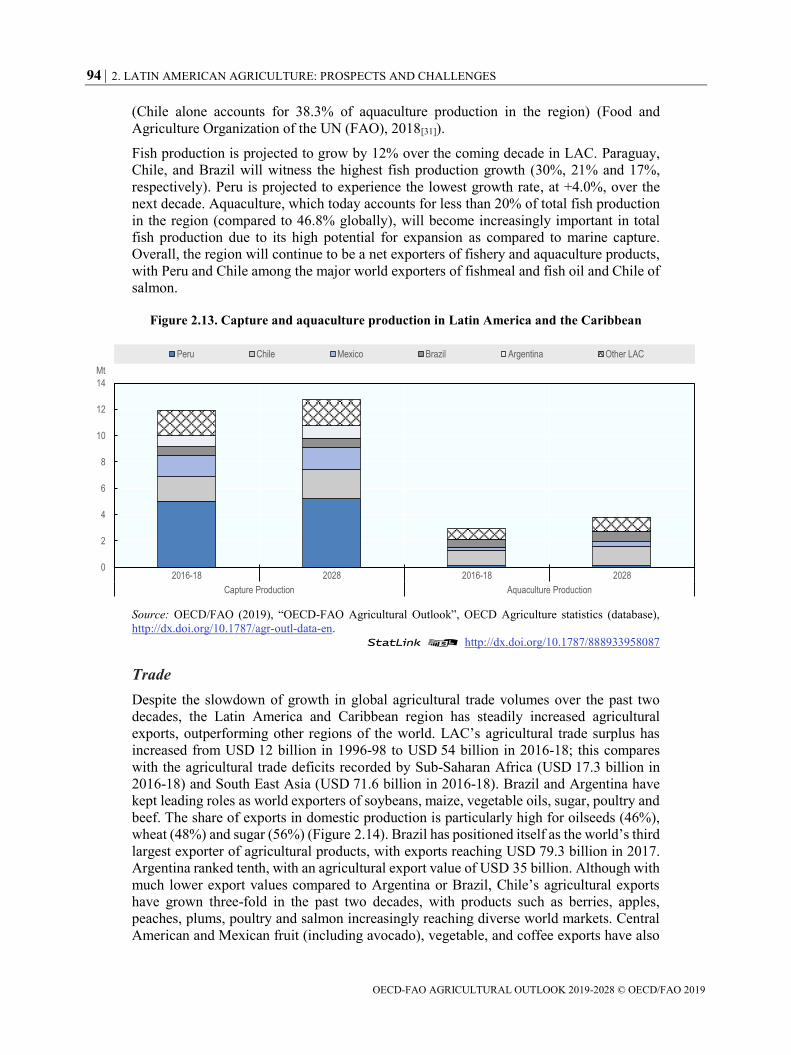
(Chile alone accounts for 38.3% of aquaculture production in the region) (Food and
Agriculture Organization of the UN (FAO), 2018[31]).
Fish production is projected to grow by 12% over the coming decade in LAC. Paraguay,
Chile, and Brazil will witness the highest fish production growth (30%, 21% and 17%,
respectively). Peru is projected to experience the lowest growth rate, at +4.0%, over the
next decade. Aquaculture, which today accounts for less than 20% of total fish production
in the region (compared to 46.8% globally), will become increasingly important in total
fish production due to its high potential for expansion as compared to marine capture.
Overall, the region will continue to be a net exporters of fishery and aquaculture products,
with Peru and Chile among the major world exporters of fishmeal and fish oil and Chile of
salmon.
Figure 2.13. Capture and aquaculture production in Latin America and the Caribbean
Source: OECD/FAO (2019), “OECD-FAO Agricultural Outlook”, OECD Agriculture statistics (database),
http://dx.doi.org/10.1787/agr-outl-data-en.
StatLink 2 http://dx.doi.org/10.1787/888933958087
Trade
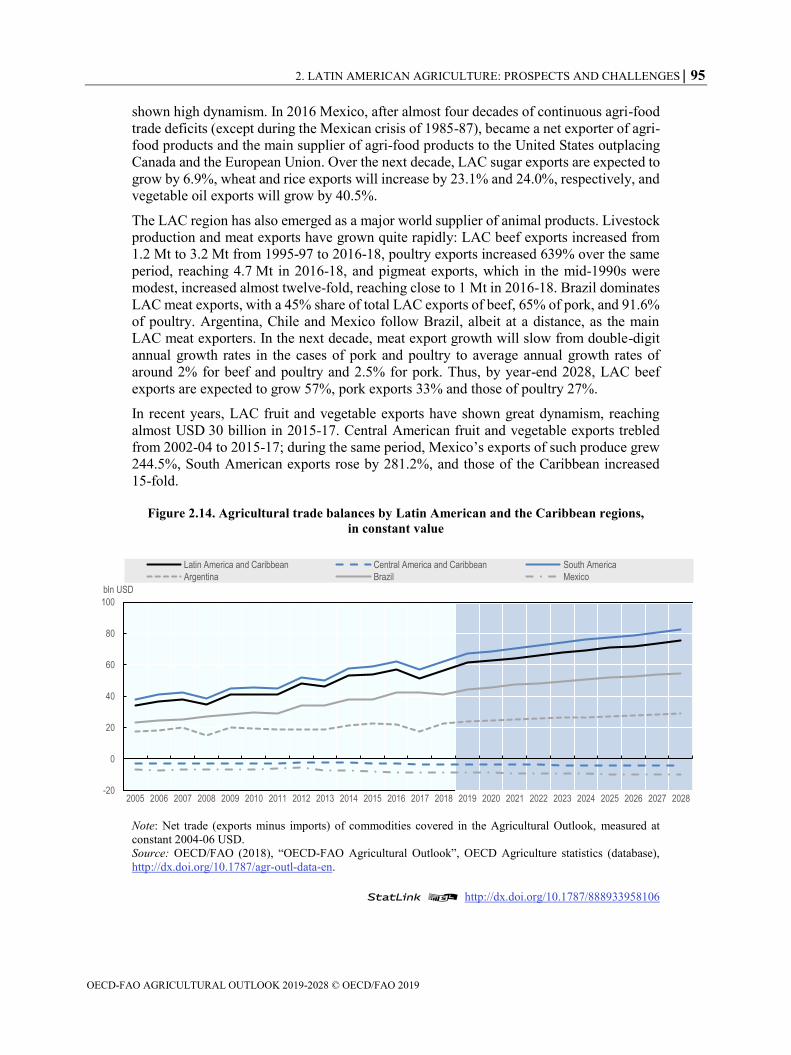
Despite the slowdown of growth in global agricultural trade volumes over the past two
decades, the Latin America and Caribbean region has steadily increased agricultural
exports, outperforming other regions of the world. LAC’s agricultural trade surplus has
increased from USD 12 billion in 1996-98 to USD 54 billion in 2016-18; this compares
with the agricultural trade deficits recorded by Sub-Saharan Africa (USD 17.3 billion in
2016-18) and South East Asia (USD 71.6 billion in 2016-18). Brazil and Argentina have
kept leading roles as world exporters of soybeans, maize, vegetable oils, sugar, poultry and
beef. The share of exports in domestic production is particularly high for oilseeds (46%),
wheat (48%) and sugar (56%) (Figure 2.14). Brazil has positioned itself as the world’s third
largest exporter of agricultural products, with exports reaching USD 79.3 billion in 2017.
Argentina ranked tenth, with an agricultural export value of USD 35 billion. Although with
much lower export values compared to Argentina or Brazil, Chile’s agricultural exports
have grown three-fold in the past two decades, with products such as berries, apples,
peaches, plums, poultry and salmon increasingly reaching diverse world markets. Central
American and Mexican fruit (including avocado), vegetable, and coffee exports have also
0
2
4
6
8
10
12
14
2016-18 2028 2016-18 2028
Capture Production Aquaculture Production
Mt
Peru Chile Mexico Brazil Argentina Other LAC
2. LATIN AMERICAN AGRICULTURE: PROSPECTS AND CHALLENGES 95
OECD-FAO AGRICULTURAL OUTLOOK 2019-2028 © OECD/FAO 2019
shown high dynamism. In 2016 Mexico, after almost four decades of continuous agri-food
trade deficits (except during the Mexican crisis of 1985-87), became a net exporter of agri-
food products and the main supplier of agri-food products to the United States outplacing
Canada and the European Union. Over the next decade, LAC sugar exports are expected to
grow by 6.9%, wheat and rice exports will increase by 23.1% and 24.0%, respectively, and
vegetable oil exports will grow by 40.5%.
The LAC region has also emerged as a major world supplier of animal products. Livestock
production and meat exports have grown quite rapidly: LAC beef exports increased from
1.2 Mt to 3.2 Mt from 1995-97 to 2016-18, poultry exports increased 639% over the same
period, reaching 4.7 Mt in 2016-18, and pigmeat exports, which in the mid-1990s were
modest, increased almost twelve-fold, reaching close to 1 Mt in 2016-18. Brazil dominates
LAC meat exports, with a 45% share of total LAC exports of beef, 65% of pork, and 91.6%
of poultry. Argentina, Chile and Mexico follow Brazil, albeit at a distance, as the main
LAC meat exporters. In the next decade, meat export growth will slow from double-digit
annual growth rates in the cases of pork and poultry to average annual growth rates of
around 2% for beef and poultry and 2.5% for pork. Thus, by year-end 2028, LAC beef
exports are expected to grow 57%, pork exports 33% and those of poultry 27%.
In recent years, LAC fruit and vegetable exports have shown great dynamism, reaching
almost USD 30 billion in 2015-17. Central American fruit and vegetable exports trebled
from 2002-04 to 2015-17; during the same period, Mexico’s exports of such produce grew
244.5%, South American exports rose by 281.2%, and those of the Caribbean increased
15-fold.
Figure 2.14. Agricultural trade balances by Latin American and the Caribbean regions,
in constant value
Note: Net trade (exports minus imports) of commodities covered in the Agricultural Outlook, measured at
constant 2004-06 USD.
Source: OECD/FAO (2018), “OECD-FAO Agricultural Outlook”, OECD Agriculture statistics (database),
http://dx.doi.org/10.1787/agr-outl-data-en.
StatLink 2 http://dx.doi.org/10.1787/888933958106
-20
0
20
40
60
80
100
2005 2006 2007 2008 2009 2010 2011 2012 2013 2014 2015 2016 2017 2018 2019 2020 2021 2022 2023 2024 2025 2026 2027 2028
bln USD
Latin America and Caribbean Central America and Caribbean South America
Argentina Brazil Mexico
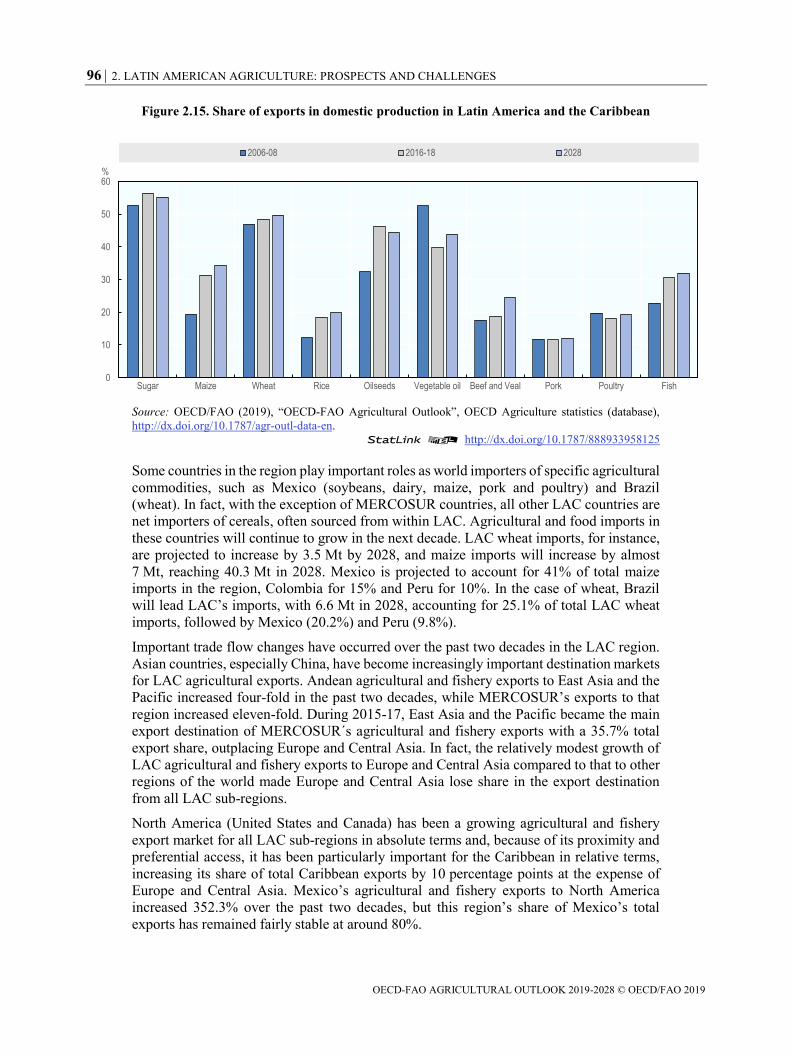
96 2. LATIN AMERICAN AGRICULTURE: PROSPECTS AND CHALLENGES
OECD-FAO AGRICULTURAL OUTLOOK 2019-2028 © OECD/FAO 2019
Figure 2.15. Share of exports in domestic production in Latin America and the Caribbean
Source: OECD/FAO (2019), “OECD-FAO Agricultural Outlook”, OECD Agriculture statistics (database),
http://dx.doi.org/10.1787/agr-outl-data-en.
StatLink 2 http://dx.doi.org/10.1787/888933958125
Some countries in the region play important roles as world importers of specific agricultural
commodities, such as Mexico (soybeans, dairy, maize, pork and poultry) and Brazil
(wheat). In fact, with the exception of MERCOSUR countries, all other LAC countries are
net importers of cereals, often sourced from within LAC. Agricultural and food imports in
these countries will continue to grow in the next decade. LAC wheat imports, for instance,
are projected to increase by 3.5 Mt by 2028, and maize imports will increase by almost
7 Mt, reaching 40.3 Mt in 2028. Mexico is projected to account for 41% of total maize
imports in the region, Colombia for 15% and Peru for 10%. In the case of wheat, Brazil
will lead LAC’s imports, with 6.6 Mt in 2028, accounting for 25.1% of total LAC wheat
imports, followed by Mexico (20.2%) and Peru (9.8%).
Important trade flow changes have occurred over the past two decades in the LAC region.
Asian countries, especially China, have become increasingly important destination markets
for LAC agricultural exports. Andean agricultural and fishery exports to East Asia and the
Pacific increased four-fold in the past two decades, while MERCOSUR’s exports to that
region increased eleven-fold. During 2015-17, East Asia and the Pacific became the main
export destination of MERCOSUR´s agricultural and fishery exports with a 35.7% total
export share, outplacing Europe and Central Asia. In fact, the relatively modest growth of
LAC agricultural and fishery exports to Europe and Central Asia compared to that to other
regions of the world made Europe and Central Asia lose share in the export destination
from all LAC sub-regions.
North America (United States and Canada) has been a growing agricultural and fishery
export market for all LAC sub-regions in absolute terms and, because of its proximity and
preferential access, it has been particularly important for the Caribbean in relative terms,
increasing its share of total Caribbean exports by 10 percentage points at the expense of
Europe and Central Asia. Mexico’s agricultural and fishery exports to North America
increased 352.3% over the past two decades, but this region’s share of Mexico’s total
exports has remained fairly stable at around 80%.
0
10
20
30
40
50
60
Sugar Maize Wheat Rice Oilseeds Vegetable oil Beef and Veal Pork Poultry Fish
%
2006-08 2016-18 2028
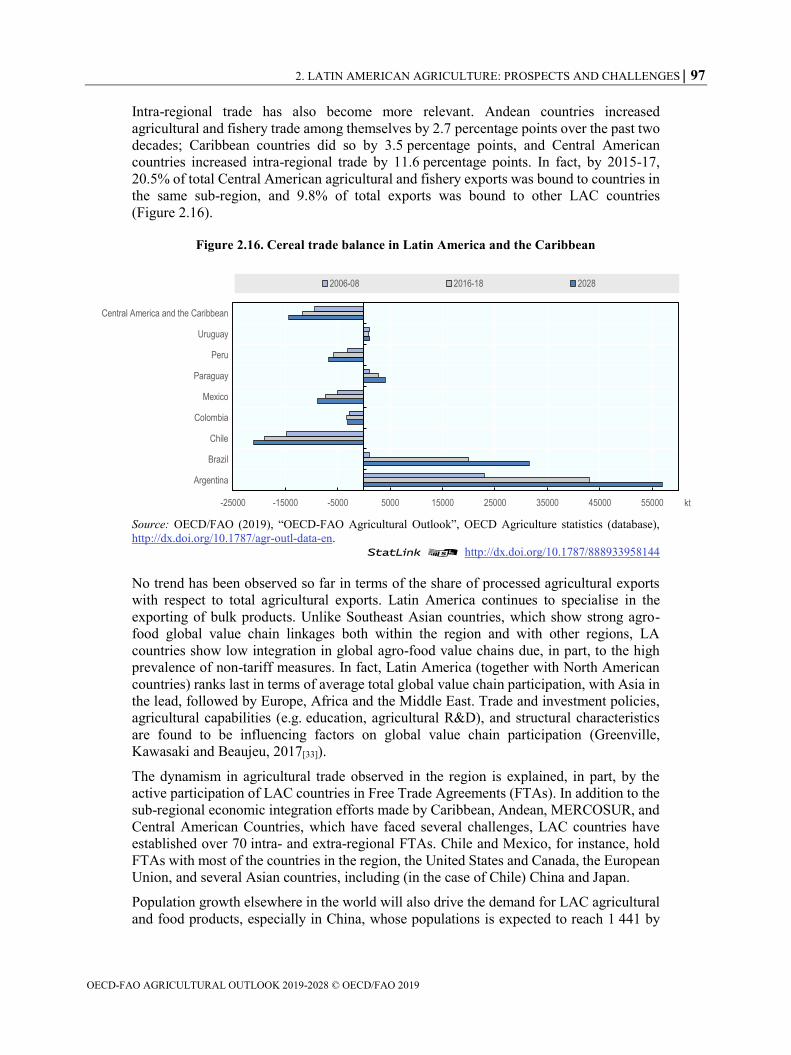
2. LATIN AMERICAN AGRICULTURE: PROSPECTS AND CHALLENGES 97
OECD-FAO AGRICULTURAL OUTLOOK 2019-2028 © OECD/FAO 2019
Intra-regional trade has also become more relevant. Andean countries increased
agricultural and fishery trade among themselves by 2.7 percentage points over the past two
decades; Caribbean countries did so by 3.5 percentage points, and Central American
countries increased intra-regional trade by 11.6 percentage points. In fact, by 2015-17,
20.5% of total Central American agricultural and fishery exports was bound to countries in
the same sub-region, and 9.8% of total exports was bound to other LAC countries
(Figure 2.16).
Figure 2.16. Cereal trade balance in Latin America and the Caribbean
Source: OECD/FAO (2019), “OECD-FAO Agricultural Outlook”, OECD Agriculture statistics (database),
http://dx.doi.org/10.1787/agr-outl-data-en.
StatLink 2 http://dx.doi.org/10.1787/888933958144
No trend has been observed so far in terms of the share of processed agricultural exports
with respect to total agricultural exports. Latin America continues to specialise in the
exporting of bulk products. Unlike Southeast Asian countries, which show strong agro-
food global value chain linkages both within the region and with other regions, LA
countries show low integration in global agro-food value chains due, in part, to the high
prevalence of non-tariff measures. In fact, Latin America (together with North American
countries) ranks last in terms of average total global value chain participation, with Asia in
the lead, followed by Europe, Africa and the Middle East. Trade and investment policies,
agricultural capabilities (e.g. education, agricultural R&D), and structural characteristics
are found to be influencing factors on global value chain participation (Greenville,
Kawasaki and Beaujeu, 2017[33]).
The dynamism in agricultural trade observed in the region is explained, in part, by the
active participation of LAC countries in Free Trade Agreements (FTAs). In addition to the
sub-regional economic integration efforts made by Caribbean, Andean, MERCOSUR, and
Central American Countries, which have faced several challenges, LAC countries have
established over 70 intra- and extra-regional FTAs. Chile and Mexico, for instance, hold
FTAs with most of the countries in the region, the United States and Canada, the European
Union, and several Asian countries, including (in the case of Chile) China and Japan.
Population growth elsewhere in the world will also drive the demand for LAC agricultural
and food products, especially in China, whose populations is expected to reach 1 441 by
-25000 -15000 -5000 5000 15000 25000 35000 45000 55000
Argentina
Brazil
Chile
Colombia
Mexico
Paraguay
Peru
Uruguay
Central America and the Caribbean
kt
2006-08 2016-18 2028
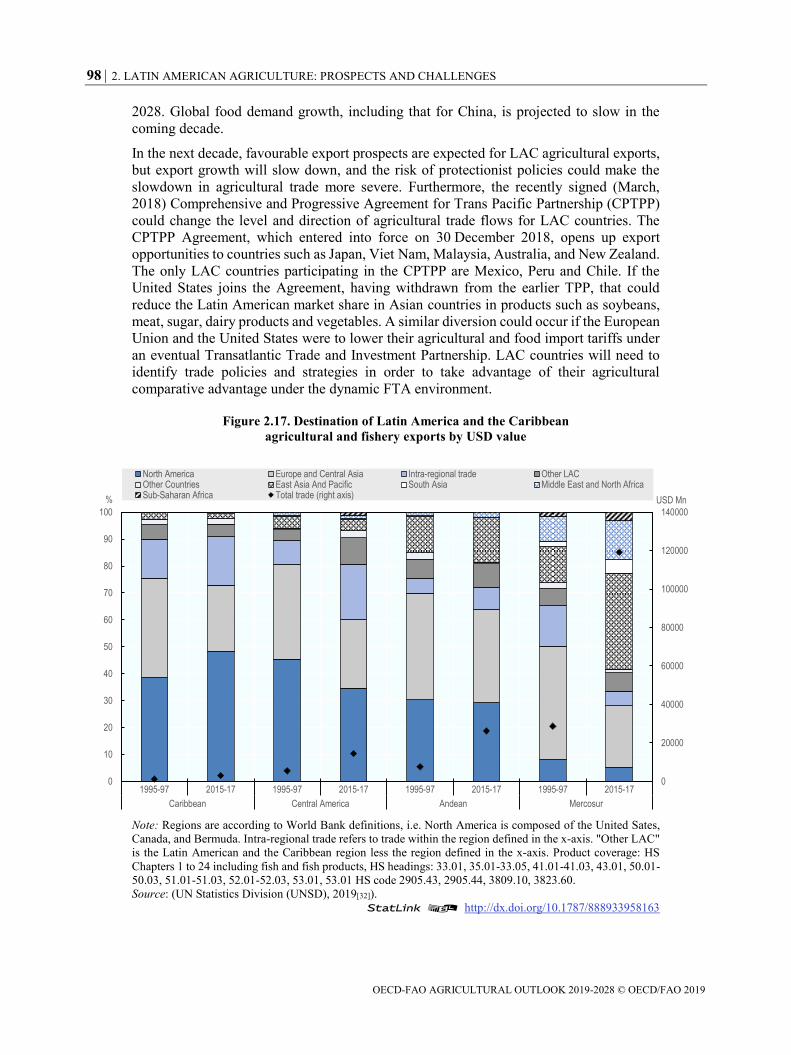
98 2. LATIN AMERICAN AGRICULTURE: PROSPECTS AND CHALLENGES
OECD-FAO AGRICULTURAL OUTLOOK 2019-2028 © OECD/FAO 2019
2028. Global food demand growth, including that for China, is projected to slow in the
coming decade.
In the next decade, favourable export prospects are expected for LAC agricultural exports,
but export growth will slow down, and the risk of protectionist policies could make the
slowdown in agricultural trade more severe. Furthermore, the recently signed (March,
2018) Comprehensive and Progressive Agreement for Trans Pacific Partnership (CPTPP)
could change the level and direction of agricultural trade flows for LAC countries. The
CPTPP Agreement, which entered into force on 30 December 2018, opens up export
opportunities to countries such as Japan, Viet Nam, Malaysia, Australia, and New Zealand.
The only LAC countries participating in the CPTPP are Mexico, Peru and Chile. If the
United States joins the Agreement, having withdrawn from the earlier TPP, that could
reduce the Latin American market share in Asian countries in products such as soybeans,
meat, sugar, dairy products and vegetables. A similar diversion could occur if the European
Union and the United States were to lower their agricultural and food import tariffs under
an eventual Transatlantic Trade and Investment Partnership. LAC countries will need to
identify trade policies and strategies in order to take advantage of their agricultural
comparative advantage under the dynamic FTA environment.
Figure 2.17. Destination of Latin America and the Caribbean
agricultural and fishery exports by USD value
Note: Regions are according to World Bank definitions, i.e. North America is composed of the United Sates,
Canada, and Bermuda. Intra-regional trade refers to trade within the region defined in the x-axis. "Other LAC"
is the Latin American and the Caribbean region less the region defined in the x-axis. Product coverage: HS
Chapters 1 to 24 including fish and fish products, HS headings: 33.01, 35.01-33.05, 41.01-41.03, 43.01, 50.01-
50.03, 51.01-51.03, 52.01-52.03, 53.01, 53.01 HS code 2905.43, 2905.44, 3809.10, 3823.60.
Source: (UN Statistics Division (UNSD), 2019[32]).
StatLink 2 http://dx.doi.org/10.1787/888933958163
0
20000
40000
60000
80000
100000
120000
140000
0
10
20
30
40
50
60
70
80
90
100
1995-97 2015-17 1995-97 2015-17 1995-97 2015-17 1995-97 2015-17
Caribbean Central America Andean Mercosur
USD Mn%
North America Europe and Central Asia Intra-regional trade Other LACOther Countries East Asia And Pacific South Asia Middle East and North AfricaSub-Saharan Africa Total trade (right axis)
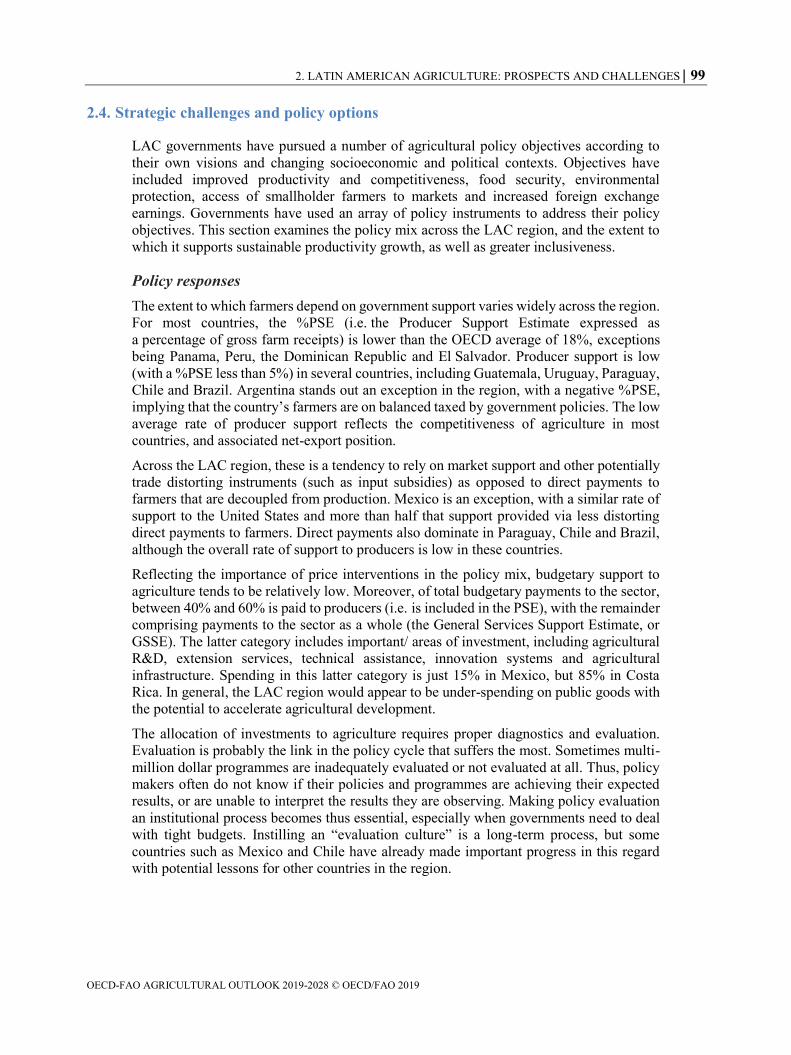
2. LATIN AMERICAN AGRICULTURE: PROSPECTS AND CHALLENGES 99
OECD-FAO AGRICULTURAL OUTLOOK 2019-2028 © OECD/FAO 2019
2.4. Strategic challenges and policy options
LAC governments have pursued a number of agricultural policy objectives according to
their own visions and changing socioeconomic and political contexts. Objectives have
included improved productivity and competitiveness, food security, environmental
protection, access of smallholder farmers to markets and increased foreign exchange
earnings. Governments have used an array of policy instruments to address their policy
objectives. This section examines the policy mix across the LAC region, and the extent to
which it supports sustainable productivity growth, as well as greater inclusiveness.
Policy responses
The extent to which farmers depend on government support varies widely across the region.
For most countries, the %PSE (i.e. the Producer Support Estimate expressed as
a percentage of gross farm receipts) is lower than the OECD average of 18%, exceptions
being Panama, Peru, the Dominican Republic and El Salvador. Producer support is low
(with a %PSE less than 5%) in several countries, including Guatemala, Uruguay, Paraguay,
Chile and Brazil. Argentina stands out an exception in the region, with a negative %PSE,
implying that the country’s farmers are on balanced taxed by government policies. The low
average rate of producer support reflects the competitiveness of agriculture in most
countries, and associated net-export position.
Across the LAC region, these is a tendency to rely on market support and other potentially
trade distorting instruments (such as input subsidies) as opposed to direct payments to
farmers that are decoupled from production. Mexico is an exception, with a similar rate of
support to the United States and more than half that support provided via less distorting
direct payments to farmers. Direct payments also dominate in Paraguay, Chile and Brazil,
although the overall rate of support to producers is low in these countries.
Reflecting the importance of price interventions in the policy mix, budgetary support to
agriculture tends to be relatively low. Moreover, of total budgetary payments to the sector,
between 40% and 60% is paid to producers (i.e. is included in the PSE), with the remainder
comprising payments to the sector as a whole (the General Services Support Estimate, or
GSSE). The latter category includes important/ areas of investment, including agricultural
R&D, extension services, technical assistance, innovation systems and agricultural
infrastructure. Spending in this latter category is just 15% in Mexico, but 85% in Costa
Rica. In general, the LAC region would appear to be under-spending on public goods with
the potential to accelerate agricultural development.
The allocation of investments to agriculture requires proper diagnostics and evaluation.
Evaluation is probably the link in the policy cycle that suffers the most. Sometimes multi-
million dollar programmes are inadequately evaluated or not evaluated at all. Thus, policy
makers often do not know if their policies and programmes are achieving their expected
results, or are unable to interpret the results they are observing. Making policy evaluation
an institutional process becomes thus essential, especially when governments need to deal
with tight budgets. Instilling an “evaluation culture” is a long-term process, but some
countries such as Mexico and Chile have already made important progress in this regard
with potential lessons for other countries in the region.
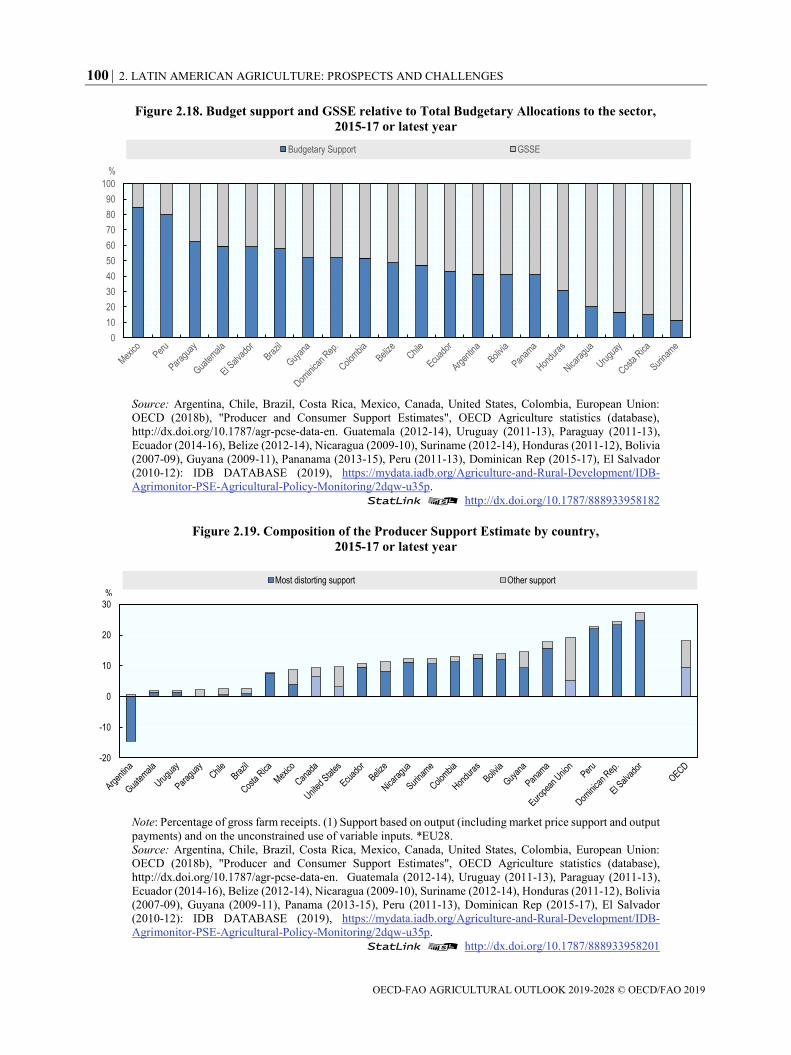
100 2. LATIN AMERICAN AGRICULTURE: PROSPECTS AND CHALLENGES
OECD-FAO AGRICULTURAL OUTLOOK 2019-2028 © OECD/FAO 2019
Figure 2.18. Budget support and GSSE relative to Total Budgetary Allocations to the sector,
2015-17 or latest year
Source: Argentina, Chile, Brazil, Costa Rica, Mexico, Canada, United States, Colombia, European Union:
OECD (2018b), "Producer and Consumer Support Estimates", OECD Agriculture statistics (database),
http://dx.doi.org/10.1787/agr-pcse-data-en. Guatemala (2012-14), Uruguay (2011-13), Paraguay (2011-13),
Ecuador (2014-16), Belize (2012-14), Nicaragua (2009-10), Suriname (2012-14), Honduras (2011-12), Bolivia
(2007-09), Guyana (2009-11), Pananama (2013-15), Peru (2011-13), Dominican Rep (2015-17), El Salvador
(2010-12): IDB DATABASE (2019), https://mydata.iadb.org/Agriculture-and-Rural-Development/IDB-
Agrimonitor-PSE-Agricultural-Policy-Monitoring/2dqw-u35p.
StatLink 2 http://dx.doi.org/10.1787/888933958182
Figure 2.19. Composition of the Producer Support Estimate by country,
2015-17 or latest year
Note: Percentage of gross farm receipts. (1) Support based on output (including market price support and output
payments) and on the unconstrained use of variable inputs. *EU28.
Source: Argentina, Chile, Brazil, Costa Rica, Mexico, Canada, United States, Colombia, European Union:
OECD (2018b), "Producer and Consumer Support Estimates", OECD Agriculture statistics (database),
http://dx.doi.org/10.1787/agr-pcse-data-en. Guatemala (2012-14), Uruguay (2011-13), Paraguay (2011-13),
Ecuador (2014-16), Belize (2012-14), Nicaragua (2009-10), Suriname (2012-14), Honduras (2011-12), Bolivia
(2007-09), Guyana (2009-11), Panama (2013-15), Peru (2011-13), Dominican Rep (2015-17), El Salvador
(2010-12): IDB DATABASE (2019), https://mydata.iadb.org/Agriculture-and-Rural-Development/IDB-
Agrimonitor-PSE-Agricultural-Policy-Monitoring/2dqw-u35p.
StatLink 2 http://dx.doi.org/10.1787/888933958201
0
10
20
30
40
50
60
70
80
90
100
%
Budgetary Support GSSE
-20
-10
0
10
20
30
Most distorting support Other support
%
2. LATIN AMERICAN AGRICULTURE: PROSPECTS AND CHALLENGES 101
OECD-FAO AGRICULTURAL OUTLOOK 2019-2028 © OECD/FAO 2019
Raising productivity and the necessary enabling policy environment
For Latin America to remain competitive in world markets, agricultural productivity needs
to grow further, in a sustainable manner. This will require an appropriate channelling of
resources into agricultural research, complementary investments in the sector, well-
functioning credit and insurance markets, and improved coordination across policies.
Agricultural research
Agricultural research spending in Latin American countries has grown steadily over the
past decades. The region was able to achieve the minimum UN target of investment at least
1% of agricultural GDP in agricultural R&D. However, there are considerable differences
across countries: while Brazil, Uruguay, Argentina and Chile spend well above 1% of their
agricultural GDP on agricultural R&D, Nicaragua, Peru, Venezuela, Dominican Republic,
Paraguay, Ecuador, Honduras and Guatemala spend 0.4% or less (Stads et al., 2016[7]).
Increasing investment in agricultural R&D is a prerequisite but may still be insufficient to
increase productivity while facing future climate and food security challenges. It may be
necessary to look at how current available resources for agricultural R&D are being
invested. Are LA countries investing in the “right” type of research? To what extent do
climate smart agriculture (CSA) technologies comprise part of their agricultural research
agenda? Is combatting antimicrobial resistance (AMR) sufficiently high in the crop and
livestock research agenda? In order to tackle AMR, research is needed on the economic
costs of transitioning to lower levels of antibiotic use in farming, the potential of alternative
products, and ways of improving the hygiene of animal husbandry (O’Neill, 2016[34]).
Three additional challenges also need to be confronted. First, countries will need to identify
succession strategies for their ageing scientists, as 40% of the region’s agricultural
researches were in their 50s and 60s in 2012/13 (Stads et al., 2016[7]). Second, effective
ways of coordinating and strengthening synergies will need to be identified in order to
overcome the complex institutional arrangements in which agricultural research is
conducted (federal government agencies, local government institutions, universities,
private sector, farmers organisations, NGOs). Third, financing mechanisms need to be
assured. Regarding the latter, competitive government funds, and taxes on
production/exports, already used in some LA countries, are financing options that
governments could explore building on country experiences in Latin America and
elsewhere.
Investment in agriculture
Productivity growth and competitiveness in world markets will demand, in addition to
increased and better targeted investment in agricultural research, continued investments in
infrastructure, extension services, and smallholder targeted initiatives, while ensuring an
enabling environment to foster private investment.
Public investment in infrastructure is not only subject to economic cycles but also depend
on priorities set by governments. In general terms, investment in infrastructure tends to be
a low priority in total public expenditure. In the case of the agricultural sector, over the past
two decades investment in infrastructure (including maintenance) increased modestly in
Chile (7.2% annual average growth), Colombia (8.5%) and Mexico (7.0%), and
substantially in Argentina (14.0%) and Costa Rica (10.9%). In Brazil, agriculture related
infrastructure investment has been quite erratic and suffered greatly the effects of the
country’s recent economic crisis. When adding up the resources invested in infrastructure
102 2. LATIN AMERICAN AGRICULTURE: PROSPECTS AND CHALLENGES
OECD-FAO AGRICULTURAL OUTLOOK 2019-2028 © OECD/FAO 2019
for all these six countries, there is a significant net decline between 1997-99 and 2015-
2017. This is explained by the large sums Brazil invested in the 1990s, which represented
82.6% of total investment in infrastructure in 1997-99 in these six countries. In 2015-17,
Brazil’s share had fallen to 11.9%.
Poor irrigation, rural road, logistics and port facility infrastructure represent, in several
cases, key bottlenecks to agricultural development. Poor roads, for instance, reduce the
competitiveness of the lowest-cost producing region in Brazil, Mato Grosso, and make
logistic costs account for 32% of total soybean export costs. Soybean transport costs in
Brazil are estimated to be seven times larger than those in the United States (Arias et al.,
2017[2]). Nevertheless, Brazil increased exports of soybeans much faster than the United
States over the past decade.
The World Economic Forum’s Competitiveness Report captures competitiveness issues
related to infrastructure. According to the 2017-18 issue, out of a total of 137 countries,
most Latin American countries fell below the mean score for infrastructure, except for
Chile and Uruguay, which ranked 41 and 45, respectively. Brazil for instance ranked 73,
Argentina, 81, Colombia, 87, and Honduras, 104.
The public sector is far from being the largest investment source in the agricultural sector.
It is farmers that invest the most, exceeding government investment in a proportion of 4
to 1 (FAO, 2012). However, public investment has a catalytic role, not only through
infrastructure development, but also when supporting smallholder family farmer initiatives.
The low adoption rate of CSA practices mentioned above, for instance, may be explained
by weak extension services directed to smallholder farmers and lack of appropriate
approaches for this type of farmers such as Farmers Field Schools.
Governments have also the responsibility of assuring an enabling environment to
encourage private investment in agriculture. Infrastructure certainly plays a key role, but
so do property rights, contract enforcement, improving regulation and taxation, well-
functioning labour markets, and financial market institutions (Food and Agriculture
Organization of the UN (FAO), 2012[35]). A policy framework for investment in agriculture
was developed by OECD (2014[36]), which could serve as an important reference for
countries in Latin America.
Agricultural credit and insurance
Competitive credit and insurance schemes need to be available for the various types of
farmers for the private sector to invest in agriculture. Latin American rural financial
markets have undergone important structural changes as governments have greatly reduced
their participation as direct providers of credit services or through the elimination of interest
rate subsidies and commercial bank operating cost subsidies. Smallholders’ access to
financial services has suffered particularly because of their perceived higher risk, lack of
insurance schemes, relatively higher operating costs for banks (client dispersion, poor
communication systems, inadequate legal systems, etc.), and lack of information regarding
the productive sector in which they operate. However, both long-term and short-term credit
and insurance schemes become essential if Latin American agricultural productivity is to
grow in a sustainable way.
The macroeconomic and financial environment has evolved positively in the region, laying
the foundation for the development of competitive rural financial markets. Large or export-
oriented farmers’ access to financial services seem to be assured. In some cases, because
of high rates of return in the production of some specific agricultural products, it is actually
2. LATIN AMERICAN AGRICULTURE: PROSPECTS AND CHALLENGES 103
OECD-FAO AGRICULTURAL OUTLOOK 2019-2028 © OECD/FAO 2019
investment funds that seek out farmers to offer financial resources. Yet, despite the
existence of government-supported credit programs in various Latin American countries,
there is broad consensus that credit and insurance needs are not being met for more than
80% of total landholdings in the region.
There is a rich history of rural micro-finance institutions in the region (International
Finance Cooperation (IFC), 2014[37]), as well as innovative insurance schemes for
smallholders (Celaya et al., 2014[38]) where lessons can be drawn from to improve risk
assessment, lower transaction costs and improve delivery channels. But, for those schemes
to be effective governments need to assure that the legal and regulatory framework is in
place. Governments also need to invest in financial, physical and communication
infrastructure, and design programmes for rural financial institutional strengthening. To
encourage private sector participation in rural micro-finance, governments need to consider
incentives such as credit guarantees, risk sharing facilities, and joint credit product design
for the small and medium landholder. Collection and dissemination of data is another key
area for government intervention, as it will facilitate financial institutions’ understanding
of the sector or value chain in which the farmer participate and will allow for more realistic
risk assessments. Special attention should be paid when intervening in financial markets to
avoid market distortions.
Policy coherence and coordination
A set of sectoral policies of different origin and scope converge in agriculture and the rural
sector. Different line ministries (agriculture, environment, social development, economy,
etc.) design and implement policies and programmes that interact with regional/state and
municipal programmes at the local level. In addition, NGOs and multilateral agencies
operate programmes that can be of considerable importance in some countries.
Some countries have undertaken important initiatives to coordinate policies and
programmes at the various government levels, with varying degrees of success. Facilitating
such coordination is regarded as a key challenge given the decentralisation of government
that has taken place in various Latin American countries in the past two decades, and
because of the potential synergies that could be created by having an effective coordination
of policies and programmes.
Farmers organisations have also been influential in agricultural policy making in the region.
Mexico’s Consejo Nacional Agropecuario, for instance, played a key role during the
agricultural policy reform process undertaken by the country in the 1990s, when price
support instruments were replaced by income support mechanisms. The Confederation of
Family Farmers Organizations of MERCOSUR (COPROFAM) stands out as an example
of how policy dialogue forums can be created and sustained in time. With the creation of
the Reunión Especializada en Agricultura Familiar, REAF (Specialised Forum on Family
Farming), family farmers organisations have been able to sit together with government
under MERCOSUR’s framework to discuss family farming policy issues. REAF has played
an important role in the creation of national registries of family farmers in MERCOSUR
countries, which have been the basis for targeted family farming policies (Food and
Agriculture Organization of the UN (FAO) and Reunión Especializada en Agricultura
Familiar (REF)/MERCOSUR, 2016[39]).
104 2. LATIN AMERICAN AGRICULTURE: PROSPECTS AND CHALLENGES
OECD-FAO AGRICULTURAL OUTLOOK 2019-2028 © OECD/FAO 2019
Environmental and resource challenges
Land
Latin America is one of the few regions in the world with substantial land resources,
relatively low population density, and the potential to bring unexploited land into
cultivation, especially in South America. Brazil’s and Argentina’s land endowments are
well known, but there are other countries that could further expand agricultural land, such
as Colombia, which could release in the near future an additional 3 to 4 Mha under-utilised
because of the armed conflict.
Over 90% of LA’s cultivated land is considered as good and prime land, highly suitable for
agriculture, a figure above the world average (80%). However, the region has also
experienced land degradation issues such as the loss of natural soil nutrients, salinisation,
erosion and desertification (Food and Agriculture Organization of the UN (FAO), 2011[40]).
Close to 20% of LA’s soils are at risk of erosion. In Argentina, erosion affects 25 Mha, and
humid plains farmers often incur huge economic losses because of soil salinisation. Erosion
also represents a major challenge for 19% of Mexico’s territory, 43% of Cuba’s, 30% of
Uruguay’s, 50% of Ecuador’s, and 75% of El Salvador’s. Because of its large share of
agricultural land located on hillsides, Central America has been particularly vulnerable to
erosion. Desertification affects 17% of Colombia’s territory, 28% of Ecuador’s, 62% of
Chile’s, and poses significant challenges to some vulnerable regions, such as Brazil’s
Northeast (Vargas et al., 2015[41]). Natural factors (rainfall, wind) explain part of the land
degradation problem, but so does human action such as land use changes (mainly
deforestation), overgrazing, and mismanagement of the arable land.
In order to deal with land degradation, several farmers have adopted Conservation
Agriculture (CA), an approach that follows three main principles: a) no or minimum tillage,
b) soil cover (e.g. retaining crop biomass, root stocks), and c) crop diversification / crop
rotation. Conservation Agriculture has been growing exponentially worldwide, but the
uptake of this approach has been particularly significant in South America (it is worth
noting that the third principle on crop diversification / rotation may not be followed in full).
It is estimated that 70% of the total cropland of MERCOSUR countries (Argentina, Brazil,
Paraguay and Uruguay) is farmed under Conservation Agriculture (Kassam, Friedrich and
Derpsch, 2019[42]).
Conservation Agriculture, however, has posed additional challenges to farmers and
governments. For farmers, this approach, being capital intensive, demands having access
to sufficient financial resources. Also, CA is heavily dependent on herbicides, especially
on the use of glyphosate, and some governments are now considering the possibility of
banning the use of this herbicide. This could have adverse short-term impacts on farmers’
profitability, soil erosion and GHG emissions.
Aware of the possibility of a ban on glyphosate, but also because some weed species have
become resistant to it, farmers in Australia, the United States, and the United Kingdom
have been trying alternative weed control methods, something likely to be replicated in
Latin America. Whatever alternative weed control method is adopted, it will demand
additional capital investments for Latin American farmers currently engaged in
Conservation Agriculture.
Conservation Agriculture is not limited to large commercial farmers. Several weed control
mechanisms (mechanical, biological and integrated weed management strategies) have
been identified for small farmers interested in the adoption of the CA approach (Sims et al.,
2. LATIN AMERICAN AGRICULTURE: PROSPECTS AND CHALLENGES 105
OECD-FAO AGRICULTURAL OUTLOOK 2019-2028 © OECD/FAO 2019
2018[43]). However, in contrast to the rapid expansion of CA in Latin America’s large,
capital intensive landholdings, smallholder CA seems to have lagged behind, compared to
other regions of the world (Asia and Africa), which presents an opportunity for agricultural
policy.
Water
Latin America is relatively well-endowed with water resources and more than 90% of
agriculture is rain-fed. However, population growth and urbanisation have been putting
considerable pressure on water available for irrigation, and climate change could pose
additional pressure on water resources as precipitation is expected to decrease across the
region.
Agriculture accounts for 68% of fresh water withdrawals in Latin America and the
Caribbean and, through its internationally traded products (mainly agricultural), LAC is a
net virtual water exporter to other regions of the world (United Nations Environment
Programme (UNEP), 2016[44]). Irrigated land accounts for 8% of total cultivated land in
South America and 7% in Central America, compared to 17% in the world (Food and
Agriculture Organization of the UN (FAO), 2011[40]). Irrigation subsidies have been greatly
reduced as irrigation management units were decentralised to its users in Latin American
countries. Investment in irrigation has declined steadily over the years, and large irrigation
projects that were undertaken in past decades are rarely seen nowadays. Current irrigation
infrastructure is sometimes poorly managed, resulting in water loss. Water management,
water policy, and investments in small irrigation systems (an area largely overlooked by
government policy) seem to be the relevant issues to improve efficiency and equity of
irrigation in the region (Salcedo et al., 2011[18]).
Forests and deforestation
Latin America has lost considerable forested area during the past three decades. From 1990
to 2015 deforestation affected 9% of the tree-covered land, that is, 90.3 Mha. Almost 60%
of this loss occurred in Brazil. Although not as large in absolute terms, Central America
lost 25% of its forests during this period; South America lost 9.5%, whereas the Caribbean
increased its forested area by 43.4% (Food and Agriculture Organization of the UN (FAO),
2015[45]).
The rate of deforestation has declined over the years, and policies have been introduced to
reduce it further. Nevertheless, Brazil showed a net loss in forested area of almost one
million hectares between 2010 and 2015, while Paraguay, Argentina and Bolivia lost
around 300 000 hectares each. Forest area as a percentage of total land area in the region
thus decreased from 51.3% in 1990 to 46.4% in 2015 (Food and Agriculture Organization
of the UN (FAO), 2018[46]).
Agricultural growth has contributed, either directly or indirectly, to deforestation.
Agricultural and environmental policy and regulations, legislation, and lack of adequate
surveillance and enforcement capacity have also played a role in deforestation. Thus, any
relaxation of environmental regulations could pose a deforestation risk.
Besides their contribution to the environment, policy makers may not always perceive
forests’ economic benefits. Thus, raising awareness about forests’ contribution to economic
development and their potential in integrated agro-forestry systems is key as it will
contribute to fighting deforestation. FAO considers as critical policy principles (a) creating
an enabling environment for private sector participation, with the right mix of regulatory
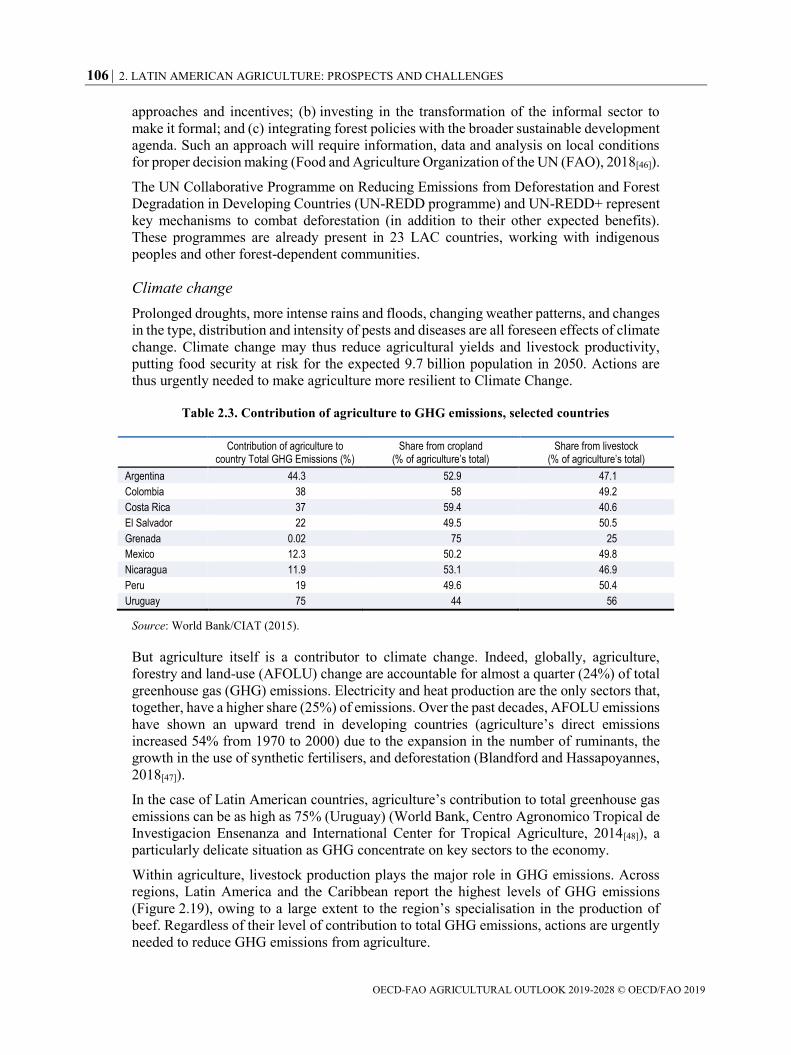
106 2. LATIN AMERICAN AGRICULTURE: PROSPECTS AND CHALLENGES
OECD-FAO AGRICULTURAL OUTLOOK 2019-2028 © OECD/FAO 2019
approaches and incentives; (b) investing in the transformation of the informal sector to
make it formal; and (c) integrating forest policies with the broader sustainable development
agenda. Such an approach will require information, data and analysis on local conditions
for proper decision making (Food and Agriculture Organization of the UN (FAO), 2018[46]).
The UN Collaborative Programme on Reducing Emissions from Deforestation and Forest
Degradation in Developing Countries (UN-REDD programme) and UN-REDD+ represent
key mechanisms to combat deforestation (in addition to their other expected benefits).
These programmes are already present in 23 LAC countries, working with indigenous
peoples and other forest-dependent communities.
Climate change
Prolonged droughts, more intense rains and floods, changing weather patterns, and changes
in the type, distribution and intensity of pests and diseases are all foreseen effects of climate
change. Climate change may thus reduce agricultural yields and livestock productivity,
putting food security at risk for the expected 9.7 billion population in 2050. Actions are
thus urgently needed to make agriculture more resilient to Climate Change.
Table 2.3. Contribution of agriculture to GHG emissions, selected countries
Contribution of agriculture to
country Total GHG Emissions (%) Share from cropland
(% of agriculture’s total) Share from livestock
(% of agriculture’s total)
Argentina 44.3 52.9 47.1
Colombia 38 58 49.2
Costa Rica 37 59.4 40.6
El Salvador 22 49.5 50.5
Grenada 0.02 75 25
Mexico 12.3 50.2 49.8
Nicaragua 11.9 53.1 46.9
Peru 19 49.6 50.4
Uruguay 75 44 56
Source: World Bank/CIAT (2015).
But agriculture itself is a contributor to climate change. Indeed, globally, agriculture,
forestry and land-use (AFOLU) change are accountable for almost a quarter (24%) of total
greenhouse gas (GHG) emissions. Electricity and heat production are the only sectors that,
together, have a higher share (25%) of emissions. Over the past decades, AFOLU emissions
have shown an upward trend in developing countries (agriculture’s direct emissions
increased 54% from 1970 to 2000) due to the expansion in the number of ruminants, the
growth in the use of synthetic fertilisers, and deforestation (Blandford and Hassapoyannes,
2018[47]).
In the case of Latin American countries, agriculture’s contribution to total greenhouse gas
emissions can be as high as 75% (Uruguay) (World Bank, Centro Agronomico Tropical de
Investigacion Ensenanza and International Center for Tropical Agriculture, 2014[48]), a
particularly delicate situation as GHG concentrate on key sectors to the economy.
Within agriculture, livestock production plays the major role in GHG emissions. Across
regions, Latin America and the Caribbean report the highest levels of GHG emissions
(Figure 2.19), owing to a large extent to the region’s specialisation in the production of
beef. Regardless of their level of contribution to total GHG emissions, actions are urgently
needed to reduce GHG emissions from agriculture.
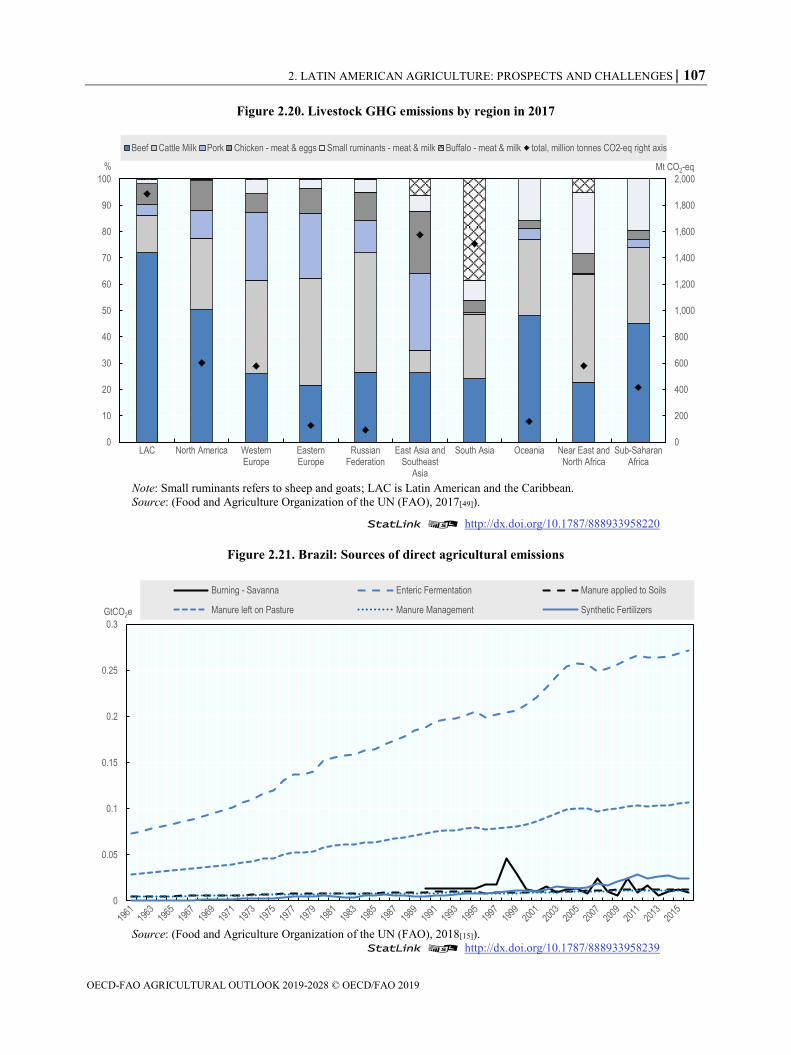
2. LATIN AMERICAN AGRICULTURE: PROSPECTS AND CHALLENGES 107
OECD-FAO AGRICULTURAL OUTLOOK 2019-2028 © OECD/FAO 2019
Figure 2.20. Livestock GHG emissions by region in 2017
Note: Small ruminants refers to sheep and goats; LAC is Latin American and the Caribbean.
Source: (Food and Agriculture Organization of the UN (FAO), 2017[49]).
StatLink 2 http://dx.doi.org/10.1787/888933958220
Figure 2.21. Brazil: Sources of direct agricultural emissions
Source: (Food and Agriculture Organization of the UN (FAO), 2018[15]).
StatLink 2 http://dx.doi.org/10.1787/888933958239
0
200
400
600
800
1,000
1,200
1,400
1,600
1,800
2,000
0
10
20
30
40
50
60
70
80
90
100
LAC North America WesternEurope
EasternEurope
RussianFederation
East Asia andSoutheast
Asia
South Asia Oceania Near East andNorth Africa
Sub-SaharanAfrica
Mt CO2-eq%
Beef Cattle Milk Pork Chicken - meat & eggs Small ruminants - meat & milk Buffalo - meat & milk total, million tonnes CO2-eq right axis
0
0.05
0.1
0.15
0.2
0.25
0.3
GtCO2e
Burning - Savanna Enteric Fermentation Manure applied to Soils
Manure left on Pasture Manure Management Synthetic Fertilizers
108 2. LATIN AMERICAN AGRICULTURE: PROSPECTS AND CHALLENGES
OECD-FAO AGRICULTURAL OUTLOOK 2019-2028 © OECD/FAO 2019
Significant increases in agricultural GHG emissions have been recorded in the region’s
largest agricultural powerhouse, Brazil, due mainly to the country’s substantial beef herd
expansion, which has increased methane emissions from enteric fermentation, and nitrous
oxide emissions through increased manure left on pasture. Other sources of GHG emissions
have played a relative minor role (Figure 2.20). Despite increased direct emissions from
agriculture, overall emissions from Agriculture, Forestry and Other Land Use (AFOLU)
have declined due to a slowing in the rate of deforestation.
Attaining sustainable agricultural growth while meeting climate change
mitigation objectives
In the past, Latin American countries have prioritised agricultural production targets over
reduced pollution or lower GHG emissions. However, not all countries have followed the
exact same path. Argentina, Belize, Bolivia, Brazil, Costa Rica, and Mexico have been able
to attain a more environmentally-friendly agriculture while maintaining productivity
growth (Moreno-Moreno, Velasco Morente and Sanz Diaz, 2018[50]).
There are several examples of how agricultural productivity can grow in a sustainable
manner, following Climate-Smart Agriculture (CSA) practices. Climate Smart Agriculture
rests on three pillars: a) sustainably increasing productivity and incomes, b) adapting and
building resilience to climate change, and c) reducing and/or removing greenhouse gas
emissions, where possible (Food and Agriculture Organization of the UN (FAO), 2013[51]).
According to this definition, it is estimated that hundreds of CSA practices already exist
and are being used to some degree.
Some CSA practices have been studied in detail, assessing their “smartness” with respect
to six key categories: water use efficiency, impact on carbon stocks, nitrogen use efficiency,
energy use from fossil fuels, weather-related risk reduction, and local knowledge
promotion. The adoption of these CSA practices has been assessed in relevant production
systems and, in some cases, by type of farmer (size of landholding). The work undertaken
by the World Bank, CIAT and several national institutions in ten countries in Latin America
and the Caribbean identified and ranked, according to their “smartness”, 304 CSA practices
for 68 relevant agricultural production systems. Water management, crop tolerance to
stress, and intercropping were among the CSA practices most frequently identified in the
region. Thirty three percent of CSA practices in LAC were identified in cash crops, 28%
in grain crops, 21% in livestock, 15% in mixed systems, and 3% in tubers (Sova et al.,
2018[52]).
In the case of Brazil, CSA practices that have proved effective in reducing GHG emissions
have also been identified under the “Low Carbon Agriculture Plan (ABC Plan). The Plan
consists of seven policies, such as reforestation of degraded pastures, crop-livestock-
forestry integrated systems, planting over straw, biological nitrogen fixation, planted
forests, treatment of animal waste and other measures to adapt to climate change. In the
case of the Brazilian livestock sector, this approach entails “shifting to more intensive
pasture management and meat production systems, adopting improved crop varieties, and
improving forage for cattle [which] will reduce methane emissions from digestive
processes without reducing total meat production” (Arias et al., 2017[2]).
Overall, however, CSA practice availability does not assure proper access and adoption by
farmers. Highly ranked CSAs in the ten LAC countries studied by World Bank/CIAT
(2014[48]), for instance, had low to moderate rates of adoption in the majority of cases.
Small family farmers are less likely to adopt these kinds of technologies and regional
differences are also observed within countries.
2. LATIN AMERICAN AGRICULTURE: PROSPECTS AND CHALLENGES 109
OECD-FAO AGRICULTURAL OUTLOOK 2019-2028 © OECD/FAO 2019
Governments need to ensure access to CSA technologies, especially for smallholder
farmers, and design the right incentives for larger farmers to adopt these types of practices.
The starting point seems to be strong political commitment to addressing climate change,
which LAC governments have shown in multilateral forums and expressed through their
national legislation and institutional arrangements.
Fully mainstreaming climate change in agricultural policy and designing CSA strategies
and programmes is no easy task technically, institutionally or financially (for a
comprehensive approach to climate change mitigation in agriculture, see (Blandford and
Hassapoyannes, 2018[47])). Available CSAs may need to be adapted to specific local
conditions. Traditional institutions dealing with productivity concerns may find it difficult
to integrate environmental issues and vice-versa. Moreover, governments may face budget
constraints when trying to implement CSA programmes.
The Green Climate Fund has opened up important opportunities for financing CSA
initiatives. The Fund has already started to finance CSA projects in Latin America, with
projects approved in Mexico, Guatemala, the Dominican Republic and Paraguay. Other
international financial sources need to be explored and approached, while governments
may also need to reallocate resources internally in order for agriculture to play an effective
role in climate change mitigation.
Making agricultural growth more inclusive
Foreseen Latin American economic and agricultural growth, per se, will not necessarily
assure that smallholder family farmers benefit from such growth. Inclusive growth will
depend on the extent to which smallholders currently participate in dynamic and export
oriented agricultural sectors. In general, smallholder participation is low in the production
of soybeans, wheat, beef, pork, poultry and dairy, and high in the production of coffee,
cocoa and some tropical fruit production. In addition, several barriers, including some
structural, still impede effective inclusion of small family farmers in dynamic agricultural
markets, a challenge Governments will need to address by improving small farmers’ access
to public and private services, and to input and product markets.
Governments may need to follow different strategies for effective inclusive agricultural
growth, ranging from the continuation of social protection programmes, to smallholder
family farmer specific programmes, in addition to strengthening links to global value
chains, reducing the inequalities between male and female farmers, and raising
opportunities for the rural youth.
Social protection programmes, particularly conditional cash-transfer programmes, have
proven to be very successful in reducing rural poverty, and governments will very likely
continue to have them in place in the future. However, these programmes need to be
accompanied with differentiated policies and strategies according to the socioeconomic
characteristics of each agricultural sector and its degree of integration into global value
chains. In this regard, four broad agricultural sector categories can be envisaged:
(A) dynamic, export oriented, capital intensive, with low smallholder participation
(e.g. soybeans, wheat, meat); (B) dynamic, export oriented, labour intensive (e.g. some
fruits and vegetables), with low smallholder participation; (C) dynamic, export oriented,
labour intensive, with high smallholder participation (e.g. coffee, cocoa, some tropical
fruits); and, (D) relatively less dynamic, domestic market oriented, with high smallholder
participation (e.g. cereals, pulses, tubers, fruits, vegetables, meat, dairy).
110 2. LATIN AMERICAN AGRICULTURE: PROSPECTS AND CHALLENGES
OECD-FAO AGRICULTURAL OUTLOOK 2019-2028 © OECD/FAO 2019
Regarding category A “dynamic, export oriented, capital intensive, with low smallholder
participation”, the strengthening of emerging agri-food global value chains, with a
“clusters” approach, may be an option for inclusive agricultural growth. Engagement of the
rural population through this approach will require specialised and targeted training,
according to current value chain needs, as well as supporting entrepreneurial initiatives for
the establishment of small and medium rural enterprises that will provide competitive
services to the export-oriented agricultural sectors and agri-food value chains. The World
Bank has funded several small and medium enterprise (SME) programmes in the region
and worldwide, and has conducted impact evaluations and drawn several lessons on SME
programme effectiveness. Also, one of IFAD’s Agribusiness Capital Fund objectives is to
finance SME’s and young rural entrepreneurs. Under the strategy for category A,
innovation, where local universities should play a key role, and investments in
infrastructure will also be important components in order to increase productivity of export-
oriented sectors and to transform them into competitive global value chains.
For category B “dynamic, export oriented, labour intensive with low smallholder
participation”, inclusive agricultural growth may mean fostering decent rural employment.
LAC rural laborers, especially the youth, have traditionally held precarious and poorly
remunerated jobs, often lack formal contracts, and do not have social security. Fostering
decent rural employment (Goal 8 of the SDGs refers specifically to decent work) should
help reduce the current urban-rural wage gap and improve in general the quality of existing
jobs in rural areas. In addition, for the smallholder farmers participating under this category,
the strengthening of social capital and farmers organisations will be relevant to assure
increased inclusion.
The strengthening of farmer organisations also becomes crucial under category C
“dynamic, export oriented, labour intensive, with high smallholder participation”. In
addition, strategies focusing on this category will need to consider the possible impact of
climate change as some regions will no longer be suitable for production in the future, as
well as finding ways in which to better deal with new pests and diseases. In addition to
improving agricultural productivity, marketing, product differentiation (organic, fair trade,
geographic denomination), and vertical integration will be key areas for these strategies.
Most smallholder farmers, however, fall under category D “relatively less dynamic,
domestic market oriented”, covering a wide range of agricultural products. Inclusive
agricultural growth in this case will not necessarily mean having smallholders switch from
their current category to the dynamic export-oriented ones. Instead, inclusive growth will
require that small family-farming sector specific programmes are put in place to raise
productivity in a sustainable manner and to improve access to input, service and product
markets. In many cases, this will mean reducing the high transaction costs traditionally
faced by smallholders and implementing sustainable credit and insurance mechanisms for
this type of farmers. Multiple successful experiences have been documented on how Latin
American small family farmers have been able to increase production in a sustainable
manner, increase access to local and national markets, and even engage in ventures with
large agribusinesses (Food and Agriculture Organization of the UN (FAO), 2014[53]). These
successful initiatives, however, have had a relatively limited scope as there has not been,
in most cases, solid nor long-lasting institutional arrangements supporting their scaling up.
Institutional arrangements focusing on small family farmers need to be designed and put in
place. Two examples stand out in the region on this regard. Brazil implemented
comprehensive family farming programmes (e.g. credit, insurance, marketing support),
legislation (for example, a certain proportion of food government purchases for school
2. LATIN AMERICAN AGRICULTURE: PROSPECTS AND CHALLENGES 111
OECD-FAO AGRICULTURAL OUTLOOK 2019-2028 © OECD/FAO 2019
feeding programs had to come from family farmers), and set up institutions at the highest
levels (up until 2018, Brazil had a Ministry specifically devoted to smallholder farmers and
agrarian reform). The successful performance of Brazil’s family farming sector over the
past two decades could not be explained without these institutional arrangements. Chile’s
INDAP, under the Ministry of Agriculture, has been supporting small farmers for almost
six decades with a variety of instruments (e.g. credit, technical assistance, investment
subsidies, improving access to markets, training, irrigation infrastructure), which have
evolved over time to adjust to changing contexts.
Specific institutional arrangements should follow each country’s own characteristics;
however, agricultural growth in the next decade is not likely to be inclusive without
institutional arrangements specifically oriented to small family farmers, and which follow
an integrated approach but with a strong focus on the areas of agricultural research (Climate
Smart Agriculture), extension (making use of local knowledge and Farmers Field Schools),
and credit and insurance.
The strengthening of social capital is also regarded as a necessary means not only to be
able to participate in dynamic agricultural sectors, but to assure more favourable patterns
of inclusiveness. Inclusion of small family farmers in agricultural value-chains can take on
different forms. Stronger small farmers organisations will be more likely to influence
technology transfer (avoiding top-down approaches), adopt better crop management
practices, and have better benefits in general than weaker organisations (Ramirez et al.,
2018[54]). Thus, building/strengthening social capital, an area that was a component of large
rural development programmes in the past but with time became increasingly neglected
except for multilateral organisation projects, acquires more relevance for government
intervention.
Feminisation of agriculture is likely to continue in the future, as males continue to migrate
to larger cities or abroad. Government will need to implement actions to close the gender
gap as it has significant impact on productivity. Compared to male farmers, female farmers
have less education and less access to extension services and agricultural information;
female farmers use less inputs and credit than males. Should the gender gap be closed,
agricultural yields could be increased by as much as 20-30% (Food and Agriculture
Organization of the UN (FAO), 2011[40]). Making agricultural growth more inclusive would
thus require closing the gender gap in agriculture by mainstreaming gender in agricultural
policy, fighting discrimination against women, and designing gender specific interventions
to raise education of women farmers and increase their access to agricultural input, service
and product markets.
Because of the ageing farm population in Latin America, youth is another particularly
vulnerable segment of the rural population requiring special government attention. Out of
the 30.9 million rural youth population (15 to 29 years of age), 11.9 million do not have a
job. But even those with a job often find themselves poorly remunerated, lacking social
security and other benefits enjoyed by the urban employed youth (Dirven, 2016). Several
successful initiatives have been documented on how the rural youth can increase access to
land (Mexico has a relevant experience through its “Young Rural Entrepreneur and Land
Fund Programme), knowledge, information, education, financial services, and markets
(Food and Agriculture Organization of and the United Nations (FAO), 2014[55]); currently,
IFAD and FAO conduct projects focusing on rural youth in the region. Furthermore, there
are some innovative initiatives such as the Chilean programme “I, Rural and Young”,
supported by INDAP and implemented through Facebook, which is building a virtual
community that brings together rural young farmers, engineers, entrepreneur, professors,

112 2. LATIN AMERICAN AGRICULTURE: PROSPECTS AND CHALLENGES
OECD-FAO AGRICULTURAL OUTLOOK 2019-2028 © OECD/FAO 2019
etc., to share experiences, ask questions, share information, innovate and develop new
ventures.
Building the bridge between projects or initiatives with a limited scope to nation-wide
comprehensive strategies seems to be the missing link to appropriately address the rural
youth challenge. And even though there have been regional and national initiatives trying
to bring the rural youth into the political agenda, their impact has been quite limited.
Political commitment then seems to be the key starting point. Finally, because of the huge
regional disparities within a country, making agricultural growth more inclusive may
require governments to follow a territorial approach to rural development.
2.5. Conclusion
Agriculture is a major sector for the LAC region, in terms of its contribution to output and
employment, and as a source of foreign exchange earnings. In most LAC countries, the
sector has grown rapidly over the past two decades, but slowing demand from both
domestic sources and foreign markets is expected to contribute to slower production growth
over the next decade.
Trade will temper the slowdown in production. While global trade in agricultural products
is expected to slow, the LAC region’s comparative advantage in many of these products
means it stands to capture a greater share of global markets. For several commodities, such
as maize, rice and beef, stronger demand growth overseas than domestically means that a
greater share of production will be destined for export. For most exported commodities, the
majority of exports are destined for markets outside the LAC region, underscoring the
importance to LAC countries of trade openness at the global level.
Agricultural growth can be supported by policies that support sustainable productivity
growth. However, less than half of all budgetary support provided to the sector comes in
the form of strategic investments that could raise agricultural productivity sustainably, such
as R&D, rural infrastructure and other investments in agriculture’s enabling environment.
Several governments are under-spending on such public goods.
At the same time, agricultural growth needs to be made more environmentally sustainable.
The LAC region is abundant in land and water, but environmental problems persist, in
particular soil erosion, while deforestation continues to be a major challenge. A range of
policies have been adopted to improve the environmental performance of LAC agriculture,
such as conservation agriculture. These work alongside policies to mitigate climate change,
such as climate smart agriculture. A stronger emphasis on programme evaluation would
help guide these initiatives over the longer term.
The benefits of agricultural growth can also be spread more widely. Strong growth
opportunities in high value fruit and vegetable crops provide opportunities for smaller
farmers, but policies toward smallholders will need to be differentiated according to their
resource endowments and market potential. Similarly differentiated policies are needed to
address the “feminisation” of agriculture, as males leave the sector. Women typically have
less access to services that would increase their productivity, such as education, credit and
extension services.
Food security continues to be a concern in the region, with many households unable to
afford the food they need. This is primarily a question of ensuring income growth among
the poorest communities – a challenge where agricultural development has an important
role to play. The LAC region is simultaneously experiencing a particularly rapid
2. LATIN AMERICAN AGRICULTURE: PROSPECTS AND CHALLENGES 113
OECD-FAO AGRICULTURAL OUTLOOK 2019-2028 © OECD/FAO 2019
development in the number of people who are overweight and obese, which represents a
growing public health problem. Several initiatives have been introduced to counter these
trends, and there is a pressing need to evaluate these policies so that successful initiatives
can be scaled up within countries and extended to other countries.
Note
1 In this chapter, the Andean region includes Bolivia, Colombia, Ecuador and Peru; the Central
American Region includes Costa Rica, El Salvador Guatemala, Honduras, Nicaragua, and Panama;
MERCOSUR includes Argentina, Brazil, Paraguay and Uruguay; the Caribbean region includes
Belize, Antigua and Barbuda, Bahamas, Barbados, Cuba, Dominica, Dominican Republic, Jamaica,
Grenada, Haiti, Saint Kitts and Nevis, Saint Lucia, Saint Vincent and the Grenadines, and Trinidad
and Tobago. The Southern Cone region includes Argentina, Chile, Paraguay and Uruguay. South
America includes Brazil, Venezuela, Southern Cone and Andean countries.
114 2. LATIN AMERICAN AGRICULTURE: PROSPECTS AND CHALLENGES
OECD-FAO AGRICULTURAL OUTLOOK 2019-2028 © OECD/FAO 2019
References
(FAO), F. (2019), Fishery and Aquaculture Statistics, Global Production by production source
1950-2017 (FishstatJ), FAO Fisheries and Aquaculture Deparment [online]. Rome. Updated
2019, http://www.fao.org/fishery/statistics/software/fishstatj/en.
[29]
(UN), U. (2017), “Department of Economic and Social Affairs, Population Division”, World
Population Prospects: The 2017 Revision, DVD Edition..
[25]
Arias, D. et al. (2017), Agriculture Productivity Growth in Brazil: Recent Trends and Future
Prospects, http://dx.doi.org/10.1596/29437.
[2]
Bisang, R., G. Anlló and M. Campi (2015), “Políticas Tecnológicas para la Innovación: La
Producción Agrícola Argentina”, http://www.scioteca.caf.com/handle/123456789/773
(accessed on 1 April 2019).
[9]
Blandford, D. and K. Hassapoyannes (2018), “The role of agriculture in global GHG mitigation”,
OECD Food, Agriculture and Fisheries Papers, No. 112, OECD Publishing, Paris,
https://dx.doi.org/10.1787/da017ae2-en.
[47]
Celaya, V. et al. (2014), “La gestión de riesgos climáticos catastróficos para el sector
agropecuario en México: Caso del Componente para la Atención a Desastres Naturales para
el Sector Agropecuario”, in Salcedo, S. and L. Guzmán (eds.), Agricultura Familiar en
América Latina y el Caribe: Recomendaciones de Política, FAO, Santiago, Chile,
http://www.fao.org/3/i3788s/i3788s.pdf (accessed on 1 April 2019).
[38]
CEPAL (2018), Panorama Social de América Latina 2017,
http://www.cepal.org/es/suscripciones (accessed on 1 April 2019).
[3]
Chang, H. and L. Zepeda (2001), “Agricultural Productivity for Sustainable Food Security in
Asia and the Pacific: the Role of Investment”, in Zepeda, L. (ed.), Agricultural investment
and productivity in developing countries, Food and Agriculture Organization of the United
Nations, Rome, Italy, http://www.fao.org/3/x9447e/x9447e00.htm (accessed on
1 April 2019).
[13]
Devaux, M. and F. Sassi (2015), OECD iLibrary | The Labour Market Impacts of Obesity,
Smoking, Alcohol Use and Related Chronic Diseases, https://www.oecd-ilibrary.org/social-
issues-migration-health/the-labour-market-impacts-of-obesity-smoking-alcohol-use-and-
related-chronic-diseases_5jrqcn5fpv0v-en (accessed on 4 November 2018).
[22]
Food and Agriculture Organization of the UN (FAO) (2018), FAOSTAT Database,
http://www.fao.org/faostat/en/#data.
[15]
Food and Agriculture Organization of the UN (FAO) (2018), Panorama de la Pobreza Rural en
América Latina y el Caribe, FAO, Santiago, Chile,
http://www.fao.org/3/CA2275ES/ca2275es.pdf (accessed on 4 April 2019).
[4]
2. LATIN AMERICAN AGRICULTURE: PROSPECTS AND CHALLENGES 115
OECD-FAO AGRICULTURAL OUTLOOK 2019-2028 © OECD/FAO 2019
Food and Agriculture Organization of the UN (FAO) (2018), The State of the World’s Forests
2018 - Forest pathways to sustainable development.,
http://www.fao.org/3/I9535EN/i9535en.pdf (accessed on 4 April 2019).
[46]
Food and Agriculture Organization of the UN (FAO) (2018), The State of World Fisheries and
Aquaculture 2018 - Meeting the sustainable development goals, FAO, Rome, Italy,
http://www.fao.org/3/i9540en/I9540EN.pdf (accessed on 4 April 2019).
[31]
Food and Agriculture Organization of the UN (FAO) (2017), Global Livestock Environmental
Assessment Model (GLEAM), http://www.fao.org/gleam/en/.
[49]
Food and Agriculture Organization of the UN (FAO) (2015), Global Forest Resources
Assessment 2015, http://www.fao.org/3/a-i4808e.pdf (accessed on 4 April 2019).
[45]
Food and Agriculture Organization of the UN (FAO) (2013), Climate-Smart Agriculture Source
Book, http://www.fao.org/3/i3325e/i3325e.pdf (accessed on 4 April 2019).
[51]
Food and Agriculture Organization of the UN (FAO) (2012), The State of Food and Agriculture
2012, http://www.fao.org/3/a-i3028e.pdf (accessed on 4 April 2019).
[35]
Food and Agriculture Organization of the UN (FAO) (2011), Fortalecimiento de Organizaciones
Indígenas y Rescate de sus Productos Tradicionales (2007-2011): Evaluación de Impacto,
http://www.fao.org/3/as403s/as403s.pdf (accessed on 5 April 2019).
[58]
Food and Agriculture Organization of the UN (FAO) (2011), The State of Food and Agriculture:
Closing the gender gap for development 2010-11, Food and Agriculture Organization of the
UN (FAO), Rome, Italy, https://www.mendeley.com/viewer/?fileId=4aafad0d-7f82-62e7-
7e86-c291f4f87137&documentId=4776fea6-aa4c-352c-88b8-a0776d359175 (accessed on
4 April 2019).
[40]
Food and Agriculture Organization of the UN (FAO) Barange.M et al. (Eds.) (2018B), Impacts
of Climate Change on fisheries and Aquaculture: Synthesis of Current Knowledge,
Adaptation and Mitigation Options, FAO Fisheries Technical Paper 627,
http://www.fao.org/3/I9705EN/i9705en.pdf.
[30]
Food and Agriculture Organization of the UN (FAO) et al. (2018), Panorama de la Seguridad
Alimentaria y Nutricional en America Latina y el Caribe 2018,
http://www.fao.org/3/CA2127ES/CA2127ES.pdf (accessed on 4 April 2019).
[5]
Food and Agriculture Organization of the UN (FAO) and Reunión Especializada en Agricultura
Familiar (REF)/MERCOSUR (2016), REAF (Reunión Especializada en Agricultura
Familiar) MERCOSUR: una Década de Coproducción de Políticas Públicas entre el Estado
y la Sociedad Civil, http://www.fao.org/3/a-i5749s.pdf (accessed on 4 April 2019).
[39]
Food and Agriculture Organization of and the United Nations (FAO) (2014), Youth and
Agriculture: Key Challenges and Concrete Solutions, http://www.fao.org/3/a-i3947e.pdf
(accessed on 6 April 2019).
[55]
116 2. LATIN AMERICAN AGRICULTURE: PROSPECTS AND CHALLENGES
OECD-FAO AGRICULTURAL OUTLOOK 2019-2028 © OECD/FAO 2019
Fuglie, K. and S. Wang (2012), Productivity Growth in Global Agriculture Shifting to
Developing Countries, Agricultural and Applied Economics Association (AAEA),
http://www.choicesmagazine.org/choices-magazine/submitted-articles/productivity-growth-
in-global-agriculture-shifting-to-developing-countries (accessed on 4 April 2019).
[12]
González-Estrada, A. (2016), Contribuciones Económicas y Sociales del INIFAP al Desarrollo
de la Agricultura Mexicana, Instituto Nacional de Investigaciones Forestales, Agricolas y
Pecuarias, https://www.redalyc.org/articulo.oa?id=263149504008 (accessed on 4 April 2019).
[11]
Graf, S. and M. Cecchini (2017), “Diet, physical activity and sedentary behaviours: Analysis of
trends, inequalities and clustering in selected oecd countries”, OECD Health Working Papers,
No. 100, OECD Publishing, Paris, https://dx.doi.org/10.1787/54464f80-en.
[20]
Greenville, J., K. Kawasaki and R. Beaujeu (2017), “How policies shape global food and
agriculture value chains”, OECD Food, Agriculture and Fisheries Papers, No. 100, OECD
Publishing, Paris, https://dx.doi.org/10.1787/aaf0763a-en.
[33]
International Finance Cooperation (IFC) (2014), Acceso a las finanzas para pequeños
productores agropecuarios:Lecciones de las Experiencias Microfinancieras en América
Latina, International Finance Cooperation (IFC), Washington, D.C.,
https://www.ifc.org/wps/wcm/connect/977afa004605b289b9b1b99916182e35/A2F+for+Smal
lholder+Farmers-Final+Spanish+Publication.pdf?MOD=AJPERES (accessed on
4 April 2019).
[37]
Kassam, A., T. Friedrich and R. Derpsch (2019), “Global spread of Conservation Agriculture”,
International Journal of Environmental Studies, Vol. 76/1, pp. 29-51,
http://dx.doi.org/10.1080/00207233.2018.1494927.
[42]
Leporati, M. et al. (2014), “La agricultura familiar en cifras”, in Salcedo, S. and L. Guzmán
(eds.), , Agricultura Familiar en América Latina y el Caribe: Recomendaciones de Política,
Food and Agriculture Organization of the UN (FAO), Santiago, Chile,
http://www.fao.org/3/i3788s/i3788s.pdf (accessed on 4 April 2019).
[14]
Moreno-Moreno, J., F. Velasco Morente and M. Sanz Diaz (2018), “Assessment of the
operational and environmental efficiency of agriculture in Latin America and the Caribbean”,
Agricultural Economics Czech Republic, Vol. 64/2, pp. 74-88,
http://dx.doi.org/10.17221/260/2016-AGRICECON.
[50]
OECD (2014), Policy Framework for Investment in Agriculture, OECD Publishing, Paris,
https://dx.doi.org/10.1787/9789264212725-en.
[36]
OECD/FAO (2015), OECD-FAO Agricultural Outlook 2015, OECD Publishing, Paris,
https://dx.doi.org/10.1787/agr_outlook-2015-en.
[8]
O’Neill, J. (2016), Tackling Drug-Resistant Infections Globally: Final Report and
Recommendations, The review on antimicrobial resistance, London, United Kingdom,
https://amr-review.org/sites/default/files/160525_Final%20paper_with%20cover.pdf
(accessed on 4 April 2019).
[34]
2. LATIN AMERICAN AGRICULTURE: PROSPECTS AND CHALLENGES 117
OECD-FAO AGRICULTURAL OUTLOOK 2019-2028 © OECD/FAO 2019
Pérez-Escamilla, R. et al. (2017), “Prevention of childhood obesity and food policies in Latin
America: from research to practice”, Obesity Reviews, Vol. 18, pp. 28-38,
http://dx.doi.org/10.1111/obr.12574.
[57]
Popkin, B. and T. Reardon (2018), “Obesity and the food system transformation in Latin
America.”, Obesity reviews : an official journal of the International Association for the Study
of Obesity, Vol. 19/8, pp. 1028-1064, http://dx.doi.org/10.1111/obr.12694.
[56]
Rada, N., S. Helfand and M. Magalhães (2018), “Agricultural productivity growth in Brazil:
Large and small farms excel”, Food Policy,
http://dx.doi.org/10.1016/J.FOODPOL.2018.03.014.
[6]
Ramirez, M. et al. (2018), “The role of social networks in the inclusion of small-scale producers
in agri-food developing clusters”, Food Policy, Vol. 77, pp. 59-70,
http://dx.doi.org/10.1016/J.FOODPOL.2018.04.005.
[54]
Renewable Energy Policy Network for the 21st century (REN21) (2018), Renewables 2018
Global Status Report, http://www.ren21.net/wp-content/uploads/2018/06/17-
8652_GSR2018_FullReport_web_-1.pdf/ (accessed on 5 April 2019).
[27]
Romero Galaz, M. and M. Solar García (eds.) (2014), 50 Años del Instituto de Investigaciones
Agropecuarias: Liderando el Desarrollo de la Agricultura de Chile, Instituto de
Investigaciones Agropecuarias (INIA), Santiago, Chile.
[10]
Salcedo, S. and L. Guzmán (eds.) (2014), Agricultura Familiar en América Latina y el Caribe:
Recomendaciones de Política, Food and Agriculture Organization of the UN (FAO) ,
Santiago, Chile, http://www.fao.org/3/i3788s/i3788s.pdf (accessed on 5 April 2019).
[53]
Salcedo, S. et al. (2011), “Agricultural and Rural Development”, in Ocampo, J. and J. Ros (eds.),
The Oxford Handbook of Latin American Economics, Oxford University Press,
http://dx.doi.org/10.1093/oxfordhb/9780199571048.013.0024.
[18]
Sänger, C. (2018), State of the global coffee market, United Nations Conference on Trade and
Development (UNCTAD), Geneva, Switzerland,
https://unctad.org/meetings/en/Presentation/MYEM2018_Christoph%20Saenger_25042018.p
df (accessed on 5 April 2019).
[28]
Sims, B. et al. (2018), “Sustainable Weed Management for Conservation Agriculture: Options
for Smallholder Farmers”, Agriculture, Vol. 8/8,
http://dx.doi.org/10.3390/agriculture8080118.
Soto Baquero, F. and S. Gómez (eds.) (2014), Reflexiones sobre la concentración y
extranjerización de la tierra en América Latina y el Caribe, Food and Agricultural Organization
of the UN (FAO), Santiago, Chile, http://www.fao.org/3/a-i3075s.pdf (accessed on 5 April 2019).
[43]
Sotomayor, O. and M. Namdar-Irani (2016), “Tendencias Estructurales en la Agricultura de
América Latina y Desafíos para la Política Pública”, mimeo.
[16]
118 2. LATIN AMERICAN AGRICULTURE: PROSPECTS AND CHALLENGES
OECD-FAO AGRICULTURAL OUTLOOK 2019-2028 © OECD/FAO 2019
Sova, C. et al. (2018), Bringing the Concept of Climate-Smart Agriculture to Lige: Insights from
CSA Country Profiles Across Africa, Asia and Latin America, World Bank, and the
International Centre for Tropical Agriculture,
https://reliefweb.int/sites/reliefweb.int/files/resources/132672-WP-P168692-PUBLIC-4-12-
2018-12-27-47-CSAInsightsfromCSAProfiles.pdf (accessed on 5 April 2019).
[52]
Stads, G. et al. (2016), A Cross-Country Analysis of Institutions, Investment, and Capacities,
Inter-American Development Bank (IDB), International Food Policy Research Institute
(IFPRI), https://www.asti.cgiar.org/sites/default/files/pdf/LACRegionalReport2016.pdf
(accessed on 5 April 2019).
[7]
UN Economic Commission for Latin America and the Caribbean (UNECLAC); Food and
Agriculture Organization of the UN (FAO); Inter-American Institute for Cooperation on
Agriculture (IICA) (2017), Perspectivas de la agricultura y del desarrollo rural en las
Américas: una mirada hacia América Latina y el Caribe 2017-2018,
http://www.fao.org/3/i8048es/I8048ES.pdf (accessed on 1 April 2019).
[17]
UN Statistics Division (UNSD) (2019), UN Comtrade, https://comtrade.un.org/data. [32]
United Nations Environment Programme (UNEP) (2016), Global environment outlook : GEO-6 :
regional assessment for Latin America and the Caribbean, United Nations Environment
Programme (UNEP), Nairobi, Kenya.
[44]
USDA, Economic Research Service (2018), International Agricultural Productivity,
https://www.ers.usda.gov/data-products/international-agricultural-productivity.aspx.
[59]
Vargas, R. et al. (2015), Atlas de suelos de America Latina y el Caribe - Publications Office of
the EU, European Union, Luxembourg, http://dx.doi.org/10.2788/37334.
[41]
WFP-ECLAC (2017), Economic Commission for Latin America and the Caribbean The cost of
the double burden of malnutrition: Social and economic impact,
http://www.cepal.org/es/areas-de-trabajo/desarrollo-social (accessed on 15 March 2019).
[19]
WHO (2019), Global Health Observatory data repository | By category | Overweight / Obesity,
WHO, http://apps.who.int/gho/data/node.main.A896?lang=en (accessed on 15 March 2019).
[23]
WHO (2019), Healthy diet, https://www.who.int/news-room/fact-sheets/detail/healthy-diet
(accessed on 7 February 2019).
[26]
WHO (2019), http://www.who.int/en/news-room/fact-sheets/detail/obesity-and-overweight,
http://www.who.int/en/news-room/fact-sheets/detail/obesity-and-overweight (accessed on
8 November 2018).
[21]
World Bank (2019), World Development Indicators (WDI), World Bank, Washington, D.C.,
https://datacatalog.worldbank.org/dataset/world-development-indicators (accessed on
5 April 2019).
[1]
2. LATIN AMERICAN AGRICULTURE: PROSPECTS AND CHALLENGES 119
OECD-FAO AGRICULTURAL OUTLOOK 2019-2028 © OECD/FAO 2019
World Bank, Centro Agronomico Tropical de Investigacion Ensenanza and International Center
for Tropical Agriculture (2014), Climate-smart agriculture country profiles: Latin America
and the Caribbean | CCAFS: CGIAR research program on Climate Change, Agriculture and
Food Security, The World Bank Group, Washington, D.C.,
https://ccafs.cgiar.org/publications/climate-smart-agriculture-country-profiles-latin-america-
and-caribbean#.XKeHopgzaUk (accessed on 5 April 2019).
[48]
World Health Organization (WHO) (2019), “Global Health Observatory data repository”,
Prevalance of overweight and obesity, age-standardized,
http://apps.who.int/gho/data/node.main.A896?lang=en.
[24]
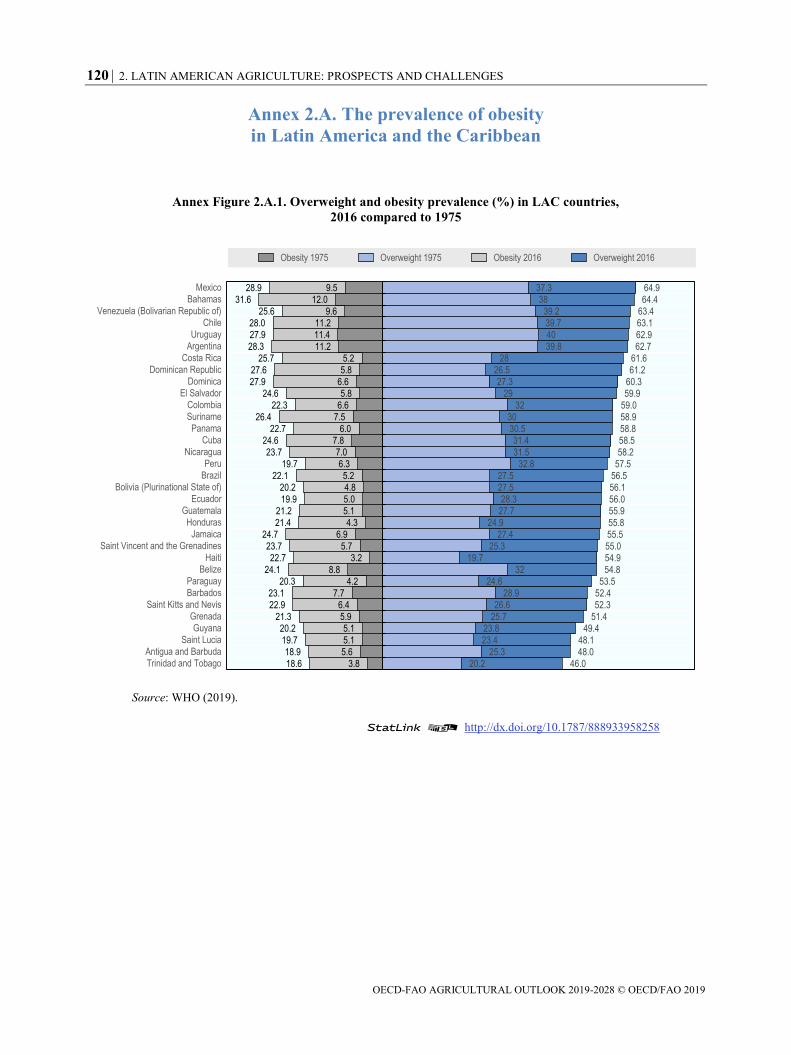
120 2. LATIN AMERICAN AGRICULTURE: PROSPECTS AND CHALLENGES
OECD-FAO AGRICULTURAL OUTLOOK 2019-2028 © OECD/FAO 2019
Annex 2.A. The prevalence of obesity
in Latin America and the Caribbean
Annex Figure 2.A.1. Overweight and obesity prevalence (%) in LAC countries,
2016 compared to 1975
Source: WHO (2019).
StatLink 2 http://dx.doi.org/10.1787/888933958258
46.0
48.0
48.1
49.451.4
52.352.4
53.554.8
54.955.0
55.5
55.8
55.9
56.0
56.1
56.5
57.5
58.2
58.5
58.8
58.9
59.0
59.9
60.3
61.2
61.6
62.7
62.9
63.1
63.4
64.4
64.9
18.6
18.9
19.7
20.221.3
22.923.1
20.324.1
22.723.7
24.7
21.4
21.2
19.9
20.2
22.1
19.7
23.7
24.6
22.7
26.4
22.3
24.6
27.9
27.6
25.7
28.3
27.9
28.0
25.6
31.6
28.9
20.2
25.3
23.4
23.825.7
26.628.9
24.632
19.725.3
27.4
24.9
27.7
28.3
27.5
27.5
32.8
31.5
31.4
30.5
30
32
29
27.3
26.5
28
39.8
40
39.7
39.2
38
37.3
3.8
5.6
5.1
5.15.9
6.47.7
4.28.8
3.25.7
6.9
4.3
5.1
5.0
4.8
5.2
6.3
7.0
7.8
6.0
7.5
6.6
5.8
6.6
5.8
5.2
11.2
11.4
11.2
9.6
12.0
9.5
Trinidad and Tobago
Antigua and Barbuda
Saint Lucia
Guyana
Grenada
Saint Kitts and Nevis
Barbados
Paraguay
Belize
Haiti
Saint Vincent and the Grenadines
Jamaica
Honduras
GuatemalaEcuador
Bolivia (Plurinational State of)Brazil
PeruNicaragua
CubaPanama
Suriname
Colombia
El Salvador
Dominica
Dominican Republic
Costa Rica
Argentina
Uruguay
Chile
Venezuela (Bolivarian Republic of)
Bahamas
Mexico
Obesity 1975 Overweight 1975 Obesity 2016 Overweight 2016
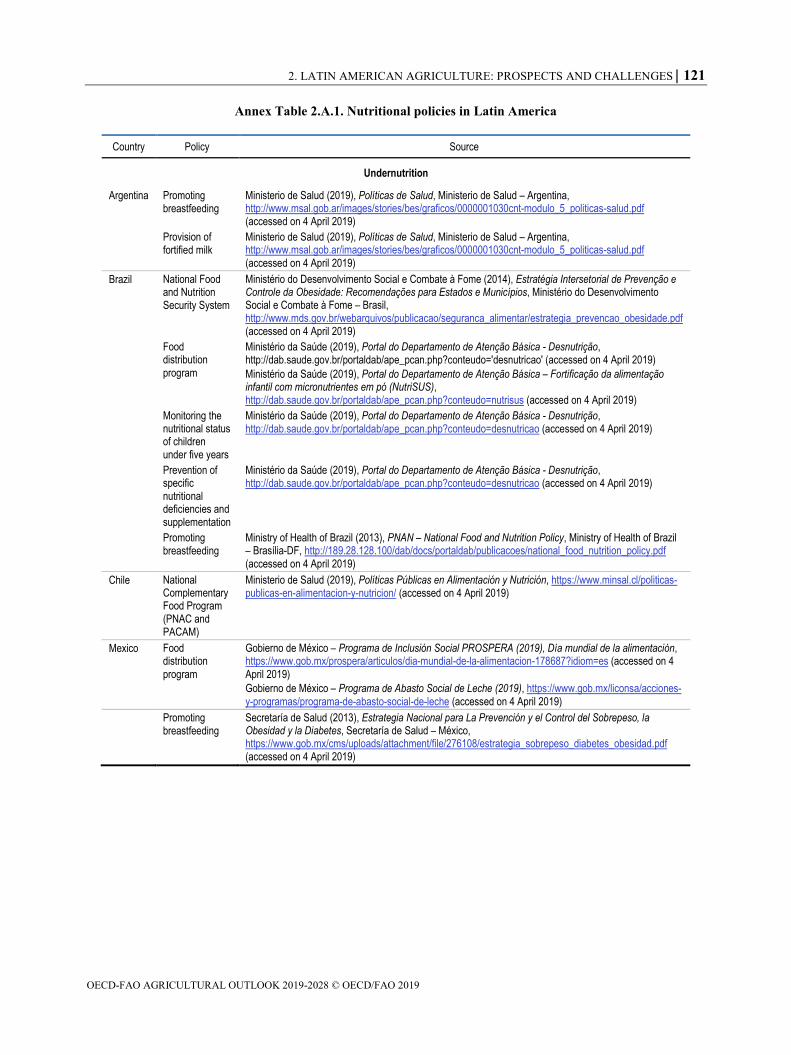
2. LATIN AMERICAN AGRICULTURE: PROSPECTS AND CHALLENGES 121
OECD-FAO AGRICULTURAL OUTLOOK 2019-2028 © OECD/FAO 2019
Annex Table 2.A.1. Nutritional policies in Latin America
Country Policy Source
Undernutrition
Argentina Promoting breastfeeding
Ministerio de Salud (2019), Políticas de Salud, Ministerio de Salud – Argentina, http://www.msal.gob.ar/images/stories/bes/graficos/0000001030cnt-modulo_5_politicas-salud.pdf (accessed on 4 April 2019)
Provision of fortified milk
Ministerio de Salud (2019), Políticas de Salud, Ministerio de Salud – Argentina, http://www.msal.gob.ar/images/stories/bes/graficos/0000001030cnt-modulo_5_politicas-salud.pdf (accessed on 4 April 2019)
Brazil National Food and Nutrition Security System
Ministério do Desenvolvimento Social e Combate à Fome (2014), Estratégia Intersetorial de Prevenção e Controle da Obesidade: Recomendações para Estados e Municípios, Ministério do Desenvolvimento Social e Combate à Fome – Brasil, http://www.mds.gov.br/webarquivos/publicacao/seguranca_alimentar/estrategia_prevencao_obesidade.pdf (accessed on 4 April 2019)
Food distribution program
Ministério da Saúde (2019), Portal do Departamento de Atenção Básica - Desnutrição, http://dab.saude.gov.br/portaldab/ape_pcan.php?conteudo='desnutricao' (accessed on 4 April 2019)
Ministério da Saúde (2019), Portal do Departamento de Atenção Básica – Fortificação da alimentação infantil com micronutrientes em pó (NutriSUS), http://dab.saude.gov.br/portaldab/ape_pcan.php?conteudo=nutrisus (accessed on 4 April 2019)
Monitoring the nutritional status of children under five years
Ministério da Saúde (2019), Portal do Departamento de Atenção Básica - Desnutrição, http://dab.saude.gov.br/portaldab/ape_pcan.php?conteudo=desnutricao (accessed on 4 April 2019)
Prevention of specific nutritional deficiencies and supplementation
Ministério da Saúde (2019), Portal do Departamento de Atenção Básica - Desnutrição, http://dab.saude.gov.br/portaldab/ape_pcan.php?conteudo=desnutricao (accessed on 4 April 2019)
Promoting breastfeeding
Ministry of Health of Brazil (2013), PNAN – National Food and Nutrition Policy, Ministry of Health of Brazil – Brasília-DF, http://189.28.128.100/dab/docs/portaldab/publicacoes/national_food_nutrition_policy.pdf (accessed on 4 April 2019)
Chile National Complementary Food Program (PNAC and PACAM)
Ministerio de Salud (2019), Políticas Públicas en Alimentación y Nutrición, https://www.minsal.cl/politicas-publicas-en-alimentacion-y-nutricion/ (accessed on 4 April 2019)
Mexico Food distribution program
Gobierno de México – Programa de Inclusión Social PROSPERA (2019), Día mundial de la alimentación, https://www.gob.mx/prospera/articulos/dia-mundial-de-la-alimentacion-178687?idiom=es (accessed on 4 April 2019)
Gobierno de México – Programa de Abasto Social de Leche (2019), https://www.gob.mx/liconsa/acciones-y-programas/programa-de-abasto-social-de-leche (accessed on 4 April 2019)
Promoting breastfeeding
Secretaría de Salud (2013), Estrategia Nacional para La Prevención y el Control del Sobrepeso, la Obesidad y la Diabetes, Secretaría de Salud – México, https://www.gob.mx/cms/uploads/attachment/file/276108/estrategia_sobrepeso_diabetes_obesidad.pdf (accessed on 4 April 2019)
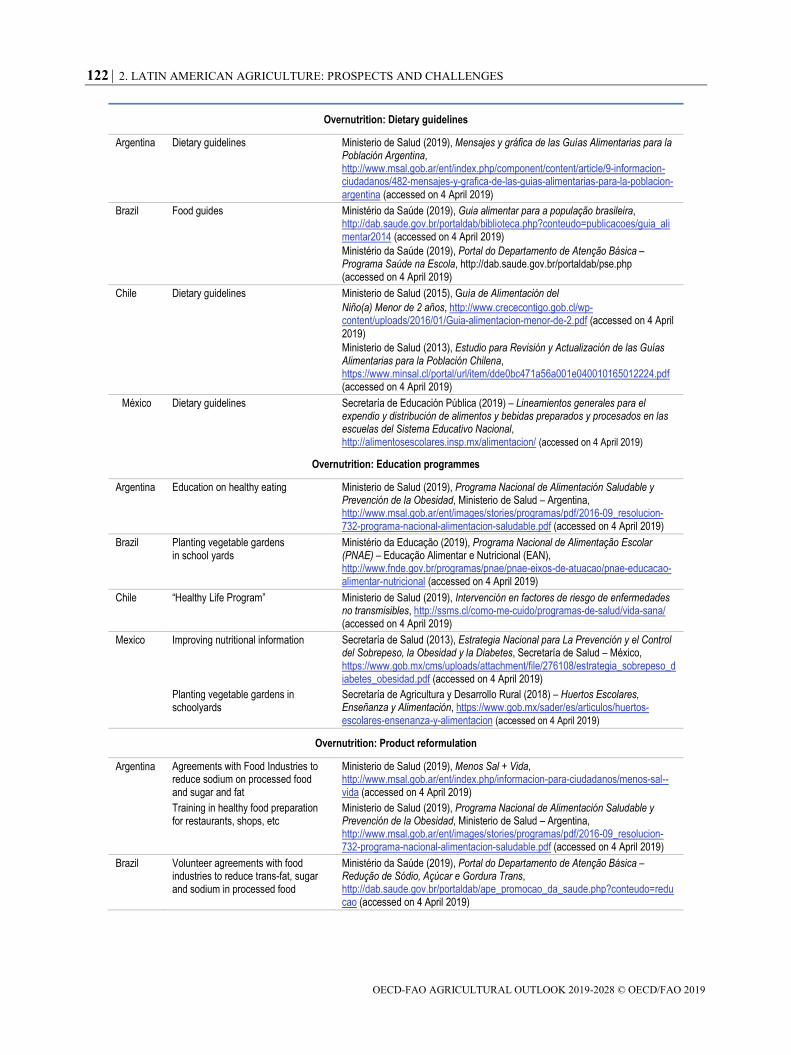
122 2. LATIN AMERICAN AGRICULTURE: PROSPECTS AND CHALLENGES
OECD-FAO AGRICULTURAL OUTLOOK 2019-2028 © OECD/FAO 2019
Overnutrition: Dietary guidelines
Argentina Dietary guidelines Ministerio de Salud (2019), Mensajes y gráfica de las Guías Alimentarias para la Población Argentina, http://www.msal.gob.ar/ent/index.php/component/content/article/9-informacion-ciudadanos/482-mensajes-y-grafica-de-las-guias-alimentarias-para-la-poblacion-argentina (accessed on 4 April 2019)
Brazil Food guides Ministério da Saúde (2019), Guia alimentar para a população brasileira, http://dab.saude.gov.br/portaldab/biblioteca.php?conteudo=publicacoes/guia_alimentar2014 (accessed on 4 April 2019)
Ministério da Saúde (2019), Portal do Departamento de Atenção Básica – Programa Saúde na Escola, http://dab.saude.gov.br/portaldab/pse.php (accessed on 4 April 2019)
Chile Dietary guidelines Ministerio de Salud (2015), Guía de Alimentación del
Niño(a) Menor de 2 años, http://www.crececontigo.gob.cl/wp-content/uploads/2016/01/Guia-alimentacion-menor-de-2.pdf (accessed on 4 April 2019)
Ministerio de Salud (2013), Estudio para Revisión y Actualización de las Guías Alimentarias para la Población Chilena, https://www.minsal.cl/portal/url/item/dde0bc471a56a001e040010165012224.pdf (accessed on 4 April 2019)
México Dietary guidelines Secretaría de Educación Pública (2019) – Lineamientos generales para el expendio y distribución de alimentos y bebidas preparados y procesados en las escuelas del Sistema Educativo Nacional, http://alimentosescolares.insp.mx/alimentacion/ (accessed on 4 April 2019)
Overnutrition: Education programmes
Argentina Education on healthy eating Ministerio de Salud (2019), Programa Nacional de Alimentación Saludable y Prevención de la Obesidad, Ministerio de Salud – Argentina, http://www.msal.gob.ar/ent/images/stories/programas/pdf/2016-09_resolucion-732-programa-nacional-alimentacion-saludable.pdf (accessed on 4 April 2019)
Brazil Planting vegetable gardens in school yards
Ministério da Educação (2019), Programa Nacional de Alimentação Escolar (PNAE) – Educação Alimentar e Nutricional (EAN), http://www.fnde.gov.br/programas/pnae/pnae-eixos-de-atuacao/pnae-educacao-alimentar-nutricional (accessed on 4 April 2019)
Chile “Healthy Life Program” Ministerio de Salud (2019), Intervención en factores de riesgo de enfermedades no transmisibles, http://ssms.cl/como-me-cuido/programas-de-salud/vida-sana/ (accessed on 4 April 2019)
Mexico Improving nutritional information Secretaría de Salud (2013), Estrategia Nacional para La Prevención y el Control del Sobrepeso, la Obesidad y la Diabetes, Secretaría de Salud – México, https://www.gob.mx/cms/uploads/attachment/file/276108/estrategia_sobrepeso_diabetes_obesidad.pdf (accessed on 4 April 2019)
Planting vegetable gardens in schoolyards
Secretaría de Agricultura y Desarrollo Rural (2018) – Huertos Escolares, Enseñanza y Alimentación, https://www.gob.mx/sader/es/articulos/huertos-escolares-ensenanza-y-alimentacion (accessed on 4 April 2019)
Overnutrition: Product reformulation
Argentina Agreements with Food Industries to reduce sodium on processed food and sugar and fat
Ministerio de Salud (2019), Menos Sal + Vida, http://www.msal.gob.ar/ent/index.php/informacion-para-ciudadanos/menos-sal--vida (accessed on 4 April 2019)
Training in healthy food preparation for restaurants, shops, etc
Ministerio de Salud (2019), Programa Nacional de Alimentación Saludable y Prevención de la Obesidad, Ministerio de Salud – Argentina, http://www.msal.gob.ar/ent/images/stories/programas/pdf/2016-09_resolucion-732-programa-nacional-alimentacion-saludable.pdf (accessed on 4 April 2019)
Brazil Volunteer agreements with food industries to reduce trans-fat, sugar and sodium in processed food
Ministério da Saúde (2019), Portal do Departamento de Atenção Básica – Redução de Sódio, Açúcar e Gordura Trans, http://dab.saude.gov.br/portaldab/ape_promocao_da_saude.php?conteudo=reducao (accessed on 4 April 2019)
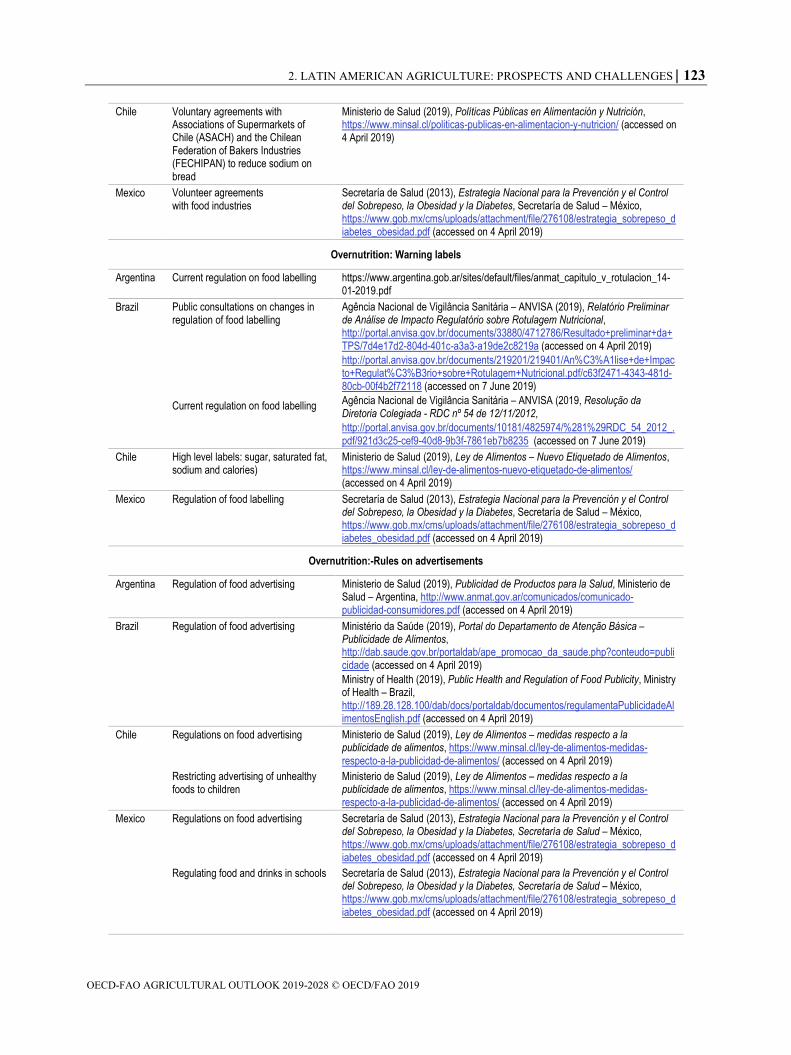
2. LATIN AMERICAN AGRICULTURE: PROSPECTS AND CHALLENGES 123
OECD-FAO AGRICULTURAL OUTLOOK 2019-2028 © OECD/FAO 2019
Chile Voluntary agreements with Associations of Supermarkets of Chile (ASACH) and the Chilean Federation of Bakers Industries (FECHIPAN) to reduce sodium on bread
Ministerio de Salud (2019), Políticas Públicas en Alimentación y Nutrición, https://www.minsal.cl/politicas-publicas-en-alimentacion-y-nutricion/ (accessed on 4 April 2019)
Mexico Volunteer agreements with food industries
Secretaría de Salud (2013), Estrategia Nacional para la Prevención y el Control del Sobrepeso, la Obesidad y la Diabetes, Secretaría de Salud – México, https://www.gob.mx/cms/uploads/attachment/file/276108/estrategia_sobrepeso_diabetes_obesidad.pdf (accessed on 4 April 2019)
Overnutrition: Warning labels
Argentina Current regulation on food labelling https://www.argentina.gob.ar/sites/default/files/anmat_capitulo_v_rotulacion_14-01-2019.pdf
Brazil Public consultations on changes in regulation of food labelling
Current regulation on food labelling
Agência Nacional de Vigilância Sanitária – ANVISA (2019), Relatório Preliminar de Análise de Impacto Regulatório sobre Rotulagem Nutricional, http://portal.anvisa.gov.br/documents/33880/4712786/Resultado+preliminar+da+TPS/7d4e17d2-804d-401c-a3a3-a19de2c8219a (accessed on 4 April 2019)
http://portal.anvisa.gov.br/documents/219201/219401/An%C3%A1lise+de+Impacto+Regulat%C3%B3rio+sobre+Rotulagem+Nutricional.pdf/c63f2471-4343-481d-80cb-00f4b2f72118 (accessed on 7 June 2019)
Agência Nacional de Vigilância Sanitária – ANVISA (2019, Resolução da Diretoria Colegiada - RDC nº 54 de 12/11/2012,
http://portal.anvisa.gov.br/documents/10181/4825974/%281%29RDC_54_2012_.pdf/921d3c25-cef9-40d8-9b3f-7861eb7b8235 (accessed on 7 June 2019)
Chile High level labels: sugar, saturated fat, sodium and calories)
Ministerio de Salud (2019), Ley de Alimentos – Nuevo Etiquetado de Alimentos, https://www.minsal.cl/ley-de-alimentos-nuevo-etiquetado-de-alimentos/ (accessed on 4 April 2019)
Mexico Regulation of food labelling Secretaría de Salud (2013), Estrategia Nacional para la Prevención y el Control del Sobrepeso, la Obesidad y la Diabetes, Secretaría de Salud – México, https://www.gob.mx/cms/uploads/attachment/file/276108/estrategia_sobrepeso_diabetes_obesidad.pdf (accessed on 4 April 2019)
Overnutrition:-Rules on advertisements
Argentina Regulation of food advertising Ministerio de Salud (2019), Publicidad de Productos para la Salud, Ministerio de Salud – Argentina, http://www.anmat.gov.ar/comunicados/comunicado-publicidad-consumidores.pdf (accessed on 4 April 2019)
Brazil Regulation of food advertising Ministério da Saúde (2019), Portal do Departamento de Atenção Básica – Publicidade de Alimentos, http://dab.saude.gov.br/portaldab/ape_promocao_da_saude.php?conteudo=publicidade (accessed on 4 April 2019)
Ministry of Health (2019), Public Health and Regulation of Food Publicity, Ministry of Health – Brazil, http://189.28.128.100/dab/docs/portaldab/documentos/regulamentaPublicidadeAlimentosEnglish.pdf (accessed on 4 April 2019)
Chile Regulations on food advertising Ministerio de Salud (2019), Ley de Alimentos – medidas respecto a la publicidade de alimentos, https://www.minsal.cl/ley-de-alimentos-medidas-respecto-a-la-publicidad-de-alimentos/ (accessed on 4 April 2019)
Restricting advertising of unhealthy foods to children
Ministerio de Salud (2019), Ley de Alimentos – medidas respecto a la publicidade de alimentos, https://www.minsal.cl/ley-de-alimentos-medidas-respecto-a-la-publicidad-de-alimentos/ (accessed on 4 April 2019)
Mexico Regulations on food advertising Secretaría de Salud (2013), Estrategia Nacional para la Prevención y el Control del Sobrepeso, la Obesidad y la Diabetes, Secretaría de Salud – México, https://www.gob.mx/cms/uploads/attachment/file/276108/estrategia_sobrepeso_diabetes_obesidad.pdf (accessed on 4 April 2019)
Regulating food and drinks in schools Secretaría de Salud (2013), Estrategia Nacional para la Prevención y el Control del Sobrepeso, la Obesidad y la Diabetes, Secretaría de Salud – México, https://www.gob.mx/cms/uploads/attachment/file/276108/estrategia_sobrepeso_diabetes_obesidad.pdf (accessed on 4 April 2019)
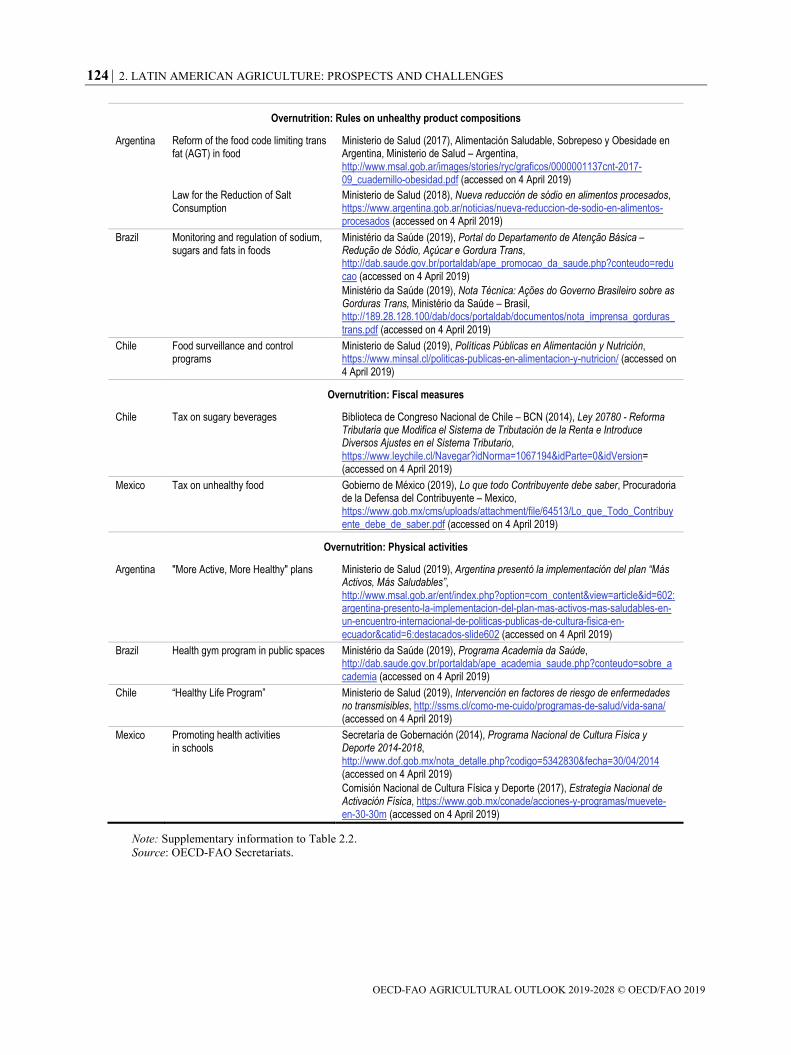
124 2. LATIN AMERICAN AGRICULTURE: PROSPECTS AND CHALLENGES
OECD-FAO AGRICULTURAL OUTLOOK 2019-2028 © OECD/FAO 2019
Overnutrition: Rules on unhealthy product compositions
Argentina Reform of the food code limiting trans fat (AGT) in food
Ministerio de Salud (2017), Alimentación Saludable, Sobrepeso y Obesidade en Argentina, Ministerio de Salud – Argentina, http://www.msal.gob.ar/images/stories/ryc/graficos/0000001137cnt-2017-09_cuadernillo-obesidad.pdf (accessed on 4 April 2019)
Law for the Reduction of Salt Consumption
Ministerio de Salud (2018), Nueva reducción de sódio en alimentos procesados, https://www.argentina.gob.ar/noticias/nueva-reduccion-de-sodio-en-alimentos-procesados (accessed on 4 April 2019)
Brazil Monitoring and regulation of sodium, sugars and fats in foods
Ministério da Saúde (2019), Portal do Departamento de Atenção Básica – Redução de Sódio, Açúcar e Gordura Trans, http://dab.saude.gov.br/portaldab/ape_promocao_da_saude.php?conteudo=reducao (accessed on 4 April 2019)
Ministério da Saúde (2019), Nota Técnica: Ações do Governo Brasileiro sobre as Gorduras Trans, Ministério da Saúde – Brasil, http://189.28.128.100/dab/docs/portaldab/documentos/nota_imprensa_gorduras_trans.pdf (accessed on 4 April 2019)
Chile Food surveillance and control programs
Ministerio de Salud (2019), Políticas Públicas en Alimentación y Nutrición, https://www.minsal.cl/politicas-publicas-en-alimentacion-y-nutricion/ (accessed on 4 April 2019)
Overnutrition: Fiscal measures
Chile Tax on sugary beverages Biblioteca de Congreso Nacional de Chile – BCN (2014), Ley 20780 - Reforma Tributaria que Modifica el Sistema de Tributación de la Renta e Introduce Diversos Ajustes en el Sistema Tributario, https://www.leychile.cl/Navegar?idNorma=1067194&idParte=0&idVersion= (accessed on 4 April 2019)
Mexico Tax on unhealthy food Gobierno de México (2019), Lo que todo Contribuyente debe saber, Procuradoria de la Defensa del Contribuyente – Mexico, https://www.gob.mx/cms/uploads/attachment/file/64513/Lo_que_Todo_Contribuyente_debe_de_saber.pdf (accessed on 4 April 2019)
Overnutrition: Physical activities
Argentina "More Active, More Healthy" plans Ministerio de Salud (2019), Argentina presentó la implementación del plan “Más Activos, Más Saludables”, http://www.msal.gob.ar/ent/index.php?option=com_content&view=article&id=602:argentina-presento-la-implementacion-del-plan-mas-activos-mas-saludables-en-un-encuentro-internacional-de-politicas-publicas-de-cultura-fisica-en-ecuador&catid=6:destacados-slide602 (accessed on 4 April 2019)
Brazil Health gym program in public spaces Ministério da Saúde (2019), Programa Academia da Saúde, http://dab.saude.gov.br/portaldab/ape_academia_saude.php?conteudo=sobre_academia (accessed on 4 April 2019)
Chile “Healthy Life Program” Ministerio de Salud (2019), Intervención en factores de riesgo de enfermedades no transmisibles, http://ssms.cl/como-me-cuido/programas-de-salud/vida-sana/ (accessed on 4 April 2019)
Mexico Promoting health activities in schools
Secretaría de Gobernación (2014), Programa Nacional de Cultura Física y Deporte 2014-2018, http://www.dof.gob.mx/nota_detalle.php?codigo=5342830&fecha=30/04/2014 (accessed on 4 April 2019)
Comisión Nacional de Cultura Física y Deporte (2017), Estrategia Nacional de Activación Física, https://www.gob.mx/conade/acciones-y-programas/muevete-en-30-30m (accessed on 4 April 2019)
Note: Supplementary information to Table 2.2.
Source: OECD-FAO Secretariats.