Embed Size (px)
Citation preview
CChhaapptteerr 22 ______________________
Ionic Liquid as extractant in Liquid Liquid Extraction
51
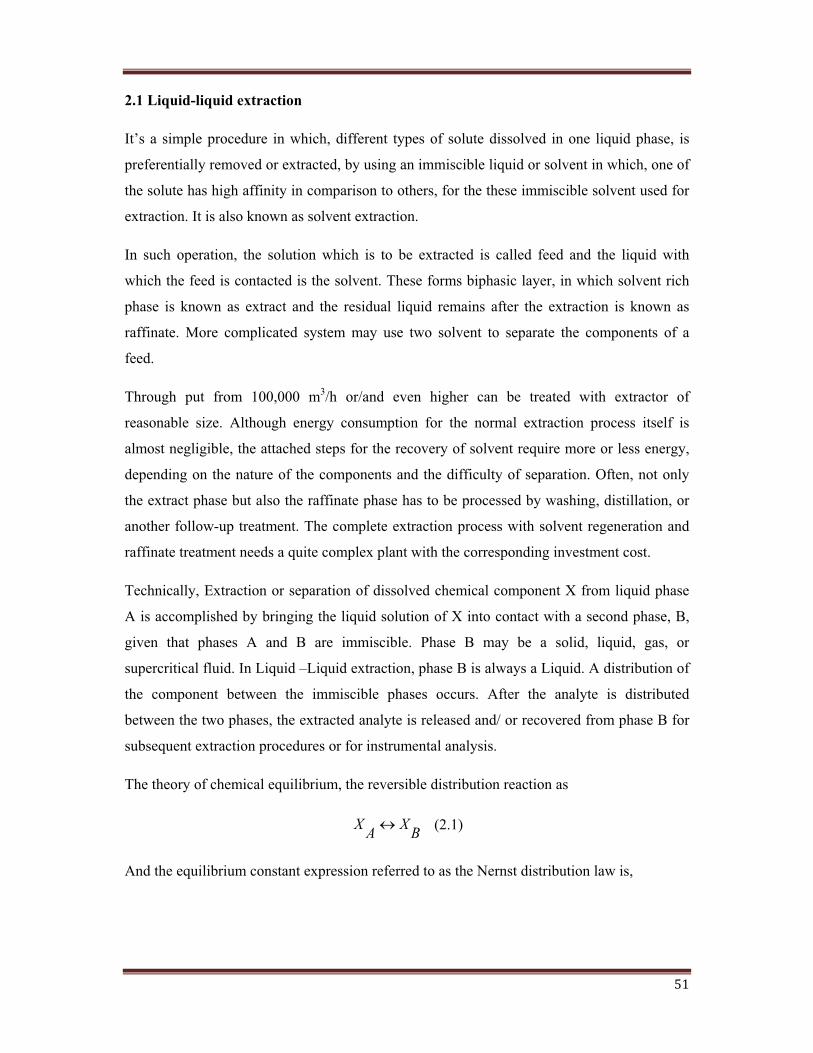
2.1 Liquid-liquid extraction
It’s a simple procedure in which, different types of solute dissolved in one liquid phase, is
preferentially removed or extracted, by using an immiscible liquid or solvent in which, one of
the solute has high affinity in comparison to others, for the these immiscible solvent used for
extraction. It is also known as solvent extraction.
In such operation, the solution which is to be extracted is called feed and the liquid with
which the feed is contacted is the solvent. These forms biphasic layer, in which solvent rich
phase is known as extract and the residual liquid remains after the extraction is known as
raffinate. More complicated system may use two solvent to separate the components of a
feed.
Through put from 100,000 m3/h or/and even higher can be treated with extractor of
reasonable size. Although energy consumption for the normal extraction process itself is
almost negligible, the attached steps for the recovery of solvent require more or less energy,
depending on the nature of the components and the difficulty of separation. Often, not only
the extract phase but also the raffinate phase has to be processed by washing, distillation, or
another follow-up treatment. The complete extraction process with solvent regeneration and
raffinate treatment needs a quite complex plant with the corresponding investment cost.
Technically, Extraction or separation of dissolved chemical component X from liquid phase
A is accomplished by bringing the liquid solution of X into contact with a second phase, B,
given that phases A and B are immiscible. Phase B may be a solid, liquid, gas, or
supercritical fluid. In Liquid –Liquid extraction, phase B is always a Liquid. A distribution of
the component between the immiscible phases occurs. After the analyte is distributed
between the two phases, the extracted analyte is released and/ or recovered from phase B for
subsequent extraction procedures or for instrumental analysis.
The theory of chemical equilibrium, the reversible distribution reaction as
X XA B� (2.1)
And the equilibrium constant expression referred to as the Nernst distribution law is,
52
XXK
A
BD � (2.2)
Where, the brackets denote the concentration of X in each phase at constant temperature (or
the activity of X for non ideal solution). By convention, the concentration extracted into
phase B appears in the numerator of equation 2.2. The equilibrium constant is independent of
the rate at which it is achieved.
The analyst’s function is to optimise extracting conditions so that the distribution of solute
between phases lies far to the right in Equation 2.1, and the resulting value of K D is large,
indicating a high degree of extraction from phase A into phase B. Conversely, if K D is small,
less chemical X is transferred from phase A into phase B. If K D is equal to 1, equivalent
concentration exist in each phase.
More solvent combination are miscible than immiscible, and more solvents are immiscible
with water than with any other solvent. Solvents miscible with water in all proportion include
acetone, acetonitrile, dimethyl acetamide, N, N-dimethylformamide, dimethyl sulphoxide, 1,
4-dioxane, ethyl alcohol, glyme, isopropyl alcohol, methanol, 2-metoxyethanol, N-
methylpyrrolidone, tetrahydrofuran, and trifluoroacetic acid.
Another consideration when selecting an extraction solvent is its density. This will help us to
determine the position of the layer. Solubility of the solvent also plays a major role in
extraction. Solvents may form two visibly distinct phase when mixed together, they are often
somewhat soluble in each other and will, in fact, become mutually saturated when mixed with
each other.
As in many separation processes, the pressure and temperature conditions play a large role in
the effectiveness of the separation. In order for a good split of the feed the pressure and
temperature must be such so as to ensure that all components remains in the liquid phase. The
process will be adversely affected if one or more of the component is allowed to become a
vapour, or the extraction may not occur at all if large enough portions of components are
allowed to vaporise. In addition, the temperature should be high enough that the components
are all soluble with one another. If extremes in temperature are present, finding a suitable
solvent for extraction can be problematic. This is however, generally not the case, since one
of the biggest in the extraction process is that it can be done at ambient pressure and
temperatures.
53
In many applications, a separation process is desired where an extreme temperature will
destroy the desired products such as the pharmaceutical industry. For these applications,
extraction is ideally suited, since the only temperature requirement is that dictated by the
solubility. At this point the biggest challenges would be finding a suitable solvent for
extraction.
Temperature plays a smaller role in extraction than in other separation process. It is only
dependent upon the temperature of the streams fed in to the column. There is not a heating
requirement for the process and Heat of enthalpy is generally insignificant. For these reason,
extraction can be considered as an isothermal process.
Pressure also plays only a small role in extraction. When combined with the temperature
consideration it is only necessary that the mixture remain in the two-phase liquid region. The
fact that extraction process can be run at isothermal and isobaric conditions is quite beneficial
to the phase stability of the system. Phase stability from a thermodynamic standpoint is
temperature and pressure dependent and since these are not changing the stability of the
phase will not change.
Activity coefficients are the most important physical property in the extraction process. The
reason for this is that these are used to determine the miscibility of the solute in both of the
solvents involved. While there are many different equations available to determine a
particular activity some are better than others for extraction purpose. When working with
liquid –liquid systems the NRTL and the UNIFAC models are the most accurate in predicting
the activities of the liquids involved according to Medersema et al. (2008). Although better
than such predictive models such as Van Laar or Margules they still fall short of perfection.
Once a predictive model has been plotted on a diagram it will most likely be necessary to fix
the exact equilibrium line experimentally for the most accurate data. The activity coefficients
also determine the partition factor which will determine whether or not a good separation is
possible.
Viscosity is a property that cannot be overlooked, its presence in two different areas, flooding
and choice of equipments. Flooding is a phenomenon that can occur in extraction just as it
can for other unit operation. Viscosity is also valuable in the determination type of system to
use for extraction. Components having a high viscosity cannot be used in spray or packed
columns.
54
2.1.1 Limitations
One must consider the extremes conditions which can be used as separation process
1. Suitable solvent
� Solvent, partially soluble with the carrier used.
� Feed components immiscible with the solvent.
� Solute is soluble in the carrier and at the same time completely or partially
soluble in the solvent.
� Different densities than the feed components for a phase separation to
facilitate and maintain the capacity of the extractor is high.
� Extremely high selectivity, for the solute for the solvent to dissolve the
maximum amount, of solute and the minimum amount of the carrier.
� Large distribution coefficient to reduce the theoretical number of stages.
� Low viscosity increases the capacity of the extraction column and does not
allow for the settling rate of dispersion to be slow.
� Chemically stable and inert toward other component of the systems.
� Low cost, non toxic and non-flammable
2. Equipment
Interfacial tension and viscosity
High interfacial tension and viscosity leads to more power being supplied to maintain
rapid mass transfer throughout the extraction process.
Low interfacial tension and viscosity leads to the formation of an emulsion.
3. Temperature preferred to be higher since solubility increases, but temperature not
higher than the critical solution temperature
4. Pressure for condensed systems must be maintained below the vapour pressure of the
solution such that a vapour phase will not appear and interrupt liquid equilibrium
5. Separation may only occur for composition in the region between the feed
composition and that apex of the carrier used.
55
2.2 What is Naphtha cracker?
Cracking is the process whereby complex organic molecules such as kerogens or heavy
hydrocarbon are broken down into simpler molecules such as light hydrocarbons by the
breaking of carbon-carbon bonds in the precursor. The rate of cracking and the end products
are strongly dependent on the temperature and presence of catalysts. Cracking is the
breakdown of large alkane into smaller, more useful alkanes and alkenes.
The thermal cracking method (also known as “Shukhov cracking process”) was invented by
Russian engineer Vladimir Shukhov and patented in 1891 in the Russia Empire, patent no.
12926, Nov. 27; 1891.This process was modified by American engineer William Merriam
Burton and patented as U.S. patent 1049667 on June 8, 1908.
In 1942, the delegation of the American “Sinclair Oil Corporation” paid a visit to Shukhov.
Sinclair Oil protested the personal right appropriated by the Rockefeller “Standard Oil”
concern on the discovery of oil cracking. It indicated that Burton’s patent used by the
“Standard Oil” concern was the modified patent of Shukhov proved to the Americans that the
Burton’s method was just the slightly changed modification of his 1891 patent.
Number of flammable liquid mixture of hydrocarbon i.e., a component of natural gas
condensate or a distillation product form petroleum, coal tar or peat boiling in a certain range
and containing certain hydrocarbon are normally refers to as Naphtha. It contains volatile
aromatic similar to gasoline; its colour differs from colourless to reddish brown.
Naphtha is a generic term applied to refined, partly refined or unrefined petroleum products
and liquid products of natural gas which distil below 240OC; the volatile fraction of the
petroleum, which is used as a solvent or as a precursor to gasoline. In fact, not less than 10%
of material should distil below 75oC ; not less than 95% of the material should distil below
240oC under standard distillation conditions by James G. Handbook of petroleum product
analysis, by James G Speight (John Wiley & sons Inc, New Jersey, USA ) 2002. Naphtha
resembles gasoline in terms of boiling range and carbon number, being a precursor to
gasoline. Naphtha is used as automotive fuel, engine fuel, and jet-B. Broadly, naphtha is
56
classified as Light Naphtha and Heavy Naphtha. Light naphtha is used as rubber solvent,
lacquer diluents, while heavy naphtha finds its application as varnish solvent, dyer naphtha,
and cleaner naphtha.
Volatility, solvent properties purity and odour determine the suitability of naphtha for a
particular use. The use of naphtha as an incendiary get in warfare, and as an illuminant dates
back to 1200 AD. Naphtha is characterised as lean (high paraffin content) or rich (low
paraffin content). The rich naphtha with higher proportion of naphthene content is easier to
process in the platforming unit. A rich naphthene produces greater volumetric yield of
reformate than does a lean charge. The wide range of naphtha available from ordinary
paraffinic straight run to highly aromatic type and the varying degree of volatility offer
products suitable for many uses. Naphtha solvents may belong to categories such as, special
boiling spirits having distillation range 30-165oC, White spirit boiling within 150-210oC, and
high boiling petroleum fractions. In aromatic complexes, naphtha is converted into basic
petrochemical intermediates; Benzene, toluene and xylene (BTX). Petroleum naphtha is by
far most popular feedstock for aromatic production.
Most ethylene cracker feeds contain 10- 25% of aromatic components, depending on the
source of the feed. The aromatic compounds are not converted to olefins and even small
amounts are formed during the cracking process in the cracker furnaces stated by
Zimmermann et al. (2005) therefore, they occupy a part of the capacity of the furnaces and
they put an extra load on the separation section of the C5 aliphatic compounds. If a major part
of the aromatic compound present in the feed to the cracker could be separated up stream of
the furnaces, it would offer several advantages: higher capacity, higher thermal efficiency
and less fouling.
The current processes for the separation of aromatic and aliphatic and aliphatic hydrocarbon
are either suitable for aromatic concentration of 20% or more, such as extraction, extractive
distillation and azeotropic distillation, or show low aromatic/ aliphatic selectivity and/or have
low capacities, Therefore it was whether and how the performance of adsorption, membrane
separation and extraction could be drastically improved at low aromatics content by using
new separating agents.
57
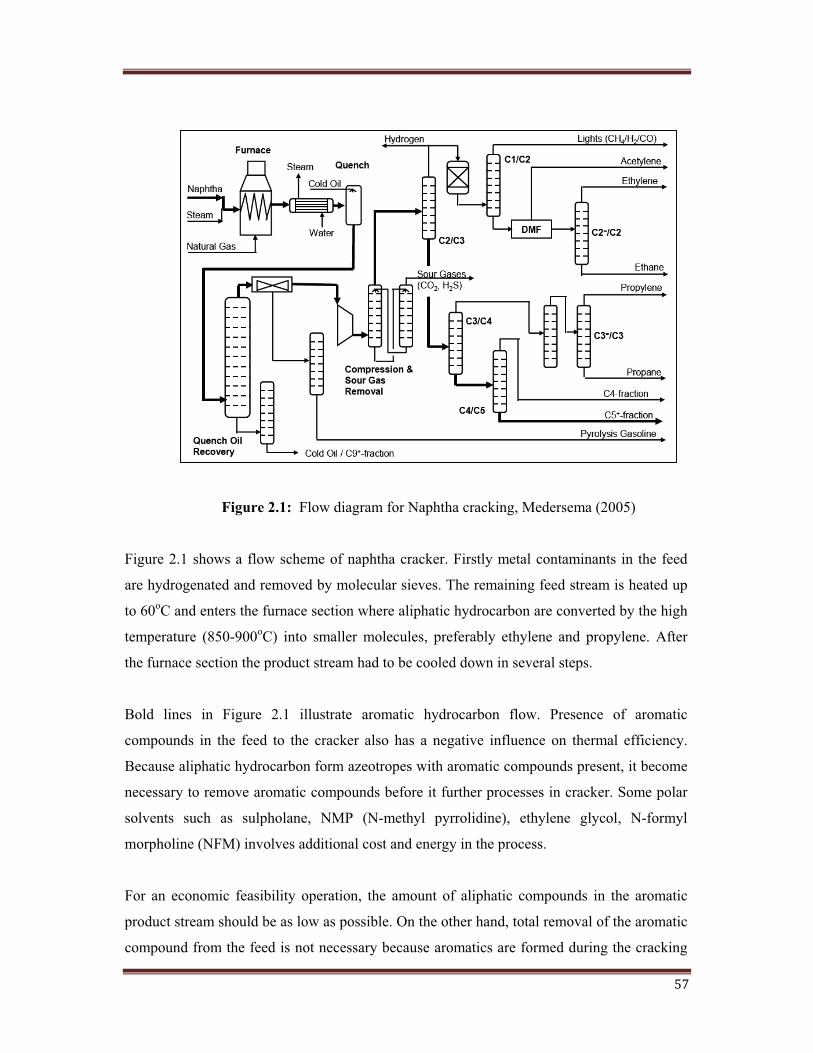
Figure 2.1: Flow diagram for Naphtha cracking, Medersema (2005)
Figure 2.1 shows a flow scheme of naphtha cracker. Firstly metal contaminants in the feed
are hydrogenated and removed by molecular sieves. The remaining feed stream is heated up
to 60oC and enters the furnace section where aliphatic hydrocarbon are converted by the high
temperature (850-900oC) into smaller molecules, preferably ethylene and propylene. After
the furnace section the product stream had to be cooled down in several steps.
Bold lines in Figure 2.1 illustrate aromatic hydrocarbon flow. Presence of aromatic
compounds in the feed to the cracker also has a negative influence on thermal efficiency.
Because aliphatic hydrocarbon form azeotropes with aromatic compounds present, it become
necessary to remove aromatic compounds before it further processes in cracker. Some polar
solvents such as sulpholane, NMP (N-methyl pyrrolidine), ethylene glycol, N-formyl
morpholine (NFM) involves additional cost and energy in the process.
For an economic feasibility operation, the amount of aliphatic compounds in the aromatic
product stream should be as low as possible. On the other hand, total removal of the aromatic
compound from the feed is not necessary because aromatics are formed during the cracking
58
process. Therefore, the recovery of the aromatics hydrocarbon is set to be at least 98% and
the purity of the generated hydrocarbon is also set to be at least 98%. If the aromatic
hydrocarbon can be removed from the feed to the naphtha cracker, the energy efficiency of
the cracker will be improved. Since not the complete cracker will be affected by the removal
of the aromatic hydrocarbon, an energy saving of 5-10% is expected.
59
2.3 Various processes used for separation in naphtha cracker
The separation of aromatic hydrocarbon such as benzene, toluene, ethylbenzene and xylenes,
i.e. from C4 TO C10 aliphatic hydrocarbon mixture is challenging since these hydrocarbon
have boiling points in a close range and several combinations from azeotropes. The
separation of benzene and cyclohexane is one of the most important and most difficult
processes in the chemical industry. Since benzene and cyclohexane form close boiling point
mixture at the entire range of their composition, the separation is difficult by means of a
standard distillation process.
Since distillation is not feasible option for the separation of aromatic hydrocarbon from C4-
C10 aliphatic due to their boiling in a close range and the formation of several azeotropes,
separation process based on differences in interaction or affinity must be used. Examples of
few processes are extraction, adsorption, membrane permeation, extractive distillation. For
each process option, the criterion with regard must be fixed. The capacity in an extraction
process is determined by the distribution coefficient of the aromatics and the capacity of a
membrane process is determined by the flux rate through the membrane. The benchmark for
the selectivity (> 30) is the selectivity obtained in the sulpholane extraction process, which is
the most used process for separating aromatic and aliphatic hydrocarbons. The recovery of
the aromatics needs not to be complete because of the formation of aromatics during the
cracking process. Therefore recovery of the aromatics needs not to be complete because of
the formation of aromatics during the cracking process. Therefore, the value of 98% is an
arbitrary value, just as the requirements of both product streams.
For process like extraction and extractive distillation, the investment cost scale with the
capacity to the power 0.6 – 0.6 while the adsorption / desorption and membrane processes are
scaled up with a power of 0.85-0.95. The higher scale up factor for adsorption /desorption
and membrane processes is caused by the fact that the capacity of these processes is directly
related to the amount of adsorbent or membrane area. Generally it can be stated that
adsorption and membrane process are most suitable for small scale processes than for large
scale ones. Unless the unit price of the adsorbent or membrane is very low.
60
2.3.1 Membrane permeation
According to Garcia et al. (2000) for membrane separation of aromatics and aliphatic
hydrocarbon a large number of polymeric membrane are possible. Some of the studied
systems are the separation of benzene and cyclohexane or toluene and n-octane. In recent
years, pervaporation separation, and to a lesser extent also vapour permeation, have emerged
as relatively simple alternatives to many water/organic and organic/water separation
applications, Wang et al. (2001) and Kita et al. (2001), Pervaporation and vapour permeation
are especially attractive in azeotropic and close boiling point separation applications, since
these processes are not based on the relatives volatilities of components, but on the difference
in sorption and diffusion properties of the feed substance as well as the permselectivity of the
membrane. If pervaporation or vapour permeation with high selectivity membrane produces
permeates and retentate streams with a high purity, no additional separation processes are
required. On the other hand, application of pervaporation or vapour permeation in organic
separation with organic membrane is still very limited because of their stability, a low
selectivity and/ or low flux rates. Polymeric membrane shows low flux rate, and have limited
thermal stability, especially in the presence of organic solvents. Therefore, use of polymeric
membranes for organic/organic separation in rare in industrial processes. For these reasons,
polymeric membrane will not be considered for this separation.
In comparison to polymeric membranes, some zeolite, like faujasite with a low Si/Al ratio,
exhibit relatively high separation factors varying from 20 up to 260 for the separation of
benzene/hexane and benzene/ cyclohexane, depending on the temperature. For
organic/organic separation, zeolite membranes are to be preferred because of their robustness
in organic solvents and their application at higher temperatures. Another advantage of using
zeolite membrane is that these can be easily regenerated by calcinations. Desorption in
zeolite membrane is not difficult as in
But the application of a zeolite membrane installation will only become economically
feasible if the membrane module cost price is reduced and higher aromatic fluxes are
obtained. Therefore, zeolite membrane must have higher flux by reducing the zeolite layer
61
thickness of the membrane, while maintaining selectivity and technologies to achieve
reduction in the manufacturing costs of zeolite membrane modules.
2.3.2 Adsorption
A suitable adsorbent for the separation of aromatic and aliphatic and hydrocarbon from a
process stream such as naphtha, which contains 10-25% aromatics, must absorb the aromatic
hydrocarbon. Most zeolite, because of the presence of the exchangeable cations, is polar
adsorbent. Molecules such as water or ammonia, CO2, N2 or aromatic hydrocarbon are
therefore adsorbed more strongly than non-polar species of comparable molecular weight
was stated by Ruthven (1998). Suitable zeolite for the adsorption of aromatic compounds
have a low Si/Al rario, for instance X and Y types. However, since aromatic hydrocarbon are
srongly adsorbed on zeolite, desorption is a difficult step. Desortion by pressure sing is
difficult when the process streams are in the fluid phase and with thermal swing desorption
the activity of the zeolite decreases with timw. Steam stripping is not suitable because zeolite
with a low Si/Al ratio quickly loose their stability in contact with water or steam. Suitbale
compounds for desorption by displacement are polar or polarisable compounds, which musst
have a large interaction with the zeolite than the aromatic compounds, for instance alcohols,
like methanol, ethanol, proponal or propylene glycol. A disadvantages is, of course, that a
second separation step is required to remove the dispalcement liquid. Other alternative way
of desorbing benzene from a NaX zeolite is described by Bellows et al. (1993) i.e by
hydrogenation of benzene to cyclohexne
with a feed containing a mixture of aromatic and aliphatic hydrocarbons, the aromatic
hydrocrbon can be hydrogenated and be desorbed in a similar way. The disavantages of this
method is that the aromatic compounds are converted to cyclo alkanes and that they are not
avilable as feedstock for other compounds. However due to the foreseen difficulties with
desorption in comparison with zeolite membrane, the adsorption/ desorption option was not
pursued further.
62
2.3.3 Extraction and extractive distillation
The conventional processes for the separation of aromatic and aliphatic hydrocarbon are
liquid extraction, suitable for the range of 20 -65% aromatic content, extractive distillations,
for the range of 65-90% aromatics, and azeotropic distillation for high aromatic content, >
90%. For the extraction of aromatic hydrocarbon, a solvent system must be designed. The
solvents selected must preferably extract the aromatic hydrocarbon from the feed, since these
are present in a relatively low concentration. For solvent selection, the following are of
importance in extraction processes;
� Group selectivity must be high
� Selectivity usually decreases with increasing temperature
� Selectivity can be increased by addition of an anti solvent
� Selectivity decreases as more and more hydrocarbon are dissolved in solvent.
These are several commercial extraction processes available for the selective separation of
aromatics from naphtha or gas condensates. Typical solvents used are polar components such
as sulpholane used by Chen et al. (2000), N-methyl pyrrolidone (NMP) by Krishna et al.
(1987), N-formyl morpholine (NFM) by (Krupp Udhe, Snamprogetti), ethylene glycols by
Yorulmaz et al. (1985), propylene carbonate by Ali et al.(2003), furfural (Texaco) or DMSO
(IFP).Where as Hamid et al. (1996) describe the usual solvent feed ration is 1.5-4, which
means that a large amount of solvent will be required for the feed to the ethylene crackers.
The raffinate stream from the extractor contains aliphatic hydrocarbons and a small amount
of the solvent, which can be washed out by water. The aliphatic product stream can then be
processed further. The extract contains aromatic and some light paraffins, which can be
recovered and recycled to the extraction column as backwash. In commercial processes,
solvent recovery can be carried out by
� Flashing or evaporation
� Flashing followed by stripping
� Extractive stripping followed by distillation.
63
No extraction process is in operation for removing aromatic compounds anywhere. The only
way to improve the economic feasibility of extraction technology at low aromatics content is
the development of new solvents systems that exhibit a dramatically higher aromatic
distribution coefficient and / or a higher aromatic/aliphatic selectivity than sulpholane.
Literature information indicated that aqueous cyclodextrin solution and ionic liquid could
have the potential to fulfil these requirements. The separation of aromatic compounds from
aliphatic hydrocarbons with aqueous solution of cyclodextrin (CD) is an option, because
cyclodextrin can incorporate several organic compounds and the separation of the aqueous
solution of complexed cyclodextrin derivatives are highly soluble in water by Szejtli (1998)
Therefore, aqueous cyclodextrin solution could be used as extraction solvents for the
separation of aromatic compounds from cracker feeds stated by Uemasu et al. (2004). Room
temperature ionic liquid (RTIL) are liquids that are composed entirely of ions and in this
sense alone resemble the ionic melt which may be produced by heating normal metallic salts
such as sodium chloride to high temperature (e.g. NaCl is liquid above 800 oC). In fact, ionic
liquid can now be produced which remain liquid at room temperature and below (even as low
as -96oC). Ionic liquid possess of a number of properties, which may be of importance in
their application as extractive media in liquid/liquid extraction processes. They are liquid at
room temperature and, in fact, they have an enormous liquid temperature range of 300oC,
which is large than that of water (100oC) and this offers the potential for considerable kinetic
control of extractive processes. They are good solvents for a wide range of inorganic, organic
and polymeric materials. The composition of ionic liquid may be adjusted enabling control of
their acidity or basicity. Several ionic liquids are known which is neither air nor water
sensitive or miscible with water, thus enabling the concept of liquid/liquid extraction from
aqueous media.
Aromatic hydrocarbon are reported to have low activity coefficients at infinite dilution in
several ionic liquids, while aliphatic hydrocarbons show high activity coefficients in the
same ionic liquid stated by Huddleston et al.(1998). This means that ionic liquid can indeed
be used as extractants for aromatic hydrocarbons from a mixture of aromatic and aliphatic
hydrocarbons, the use of aromatic cations and possibly aromatic anions will have a positive
effect on the extraction of aromatic hydrocarbons from the mixture.

64
The constituents of ionic liquids (being ionic) are constrained by high Coulombic forces and
thus, exert practically no vapour pressure above the liquid surface. This property may allow
the development of novel recovery schemes for certain organic species in relation to normal
liquid/liquid extraction in which product recovery could be affected by distillation or
pervaporation. The application of ionic liquid for extraction processes is promising because
of their non-volatile nature explained by DuPont et al. (2000). This facilitates solvent
recovery using techniques as simple as flash distillation or stripping.
65
2.4 Literature survey
Rogers et al. (1998) were the first to report that ionic liquids can be considered as a
replacement for volatile organic compounds in their paper titled “Room temperature ionic
liquids as novel media for ‘clean’ liquid-liquid extraction”. The partitioning of simple
substituted benzene derivatives like aniline, toluene, salicylic acid etc. between water and the
[RTIL BMIM] PF6 was carried out. The partition coefficient derived was compared to that
obtained by using 1-octanol as an extraction solvent. The effect of pH on the partition
coefficient was also measured.
Selvan et al. (2000) reported the liquid - liquid equilibrium data for the systems,
heptane+toluene+1-ethyl-3-methylimidazoliumriiodide [EMIM]I3- & heptanes +toluene+1-
utyl-3-methylimidazolium Triiodide [BMIM]I3-. Tie line compositions were measured and
values for Selectivity ‘S’ were calculated. The analysis of both the phases was done using
Gas Chromatography (GC). The column contained a precolumn to trap the IL as it does not
elute in the GC. There was no IL present in the upper organic layer for all the different
concentrations tried out. A system involving an IL as an extractant could potentially reduce
the costs of solvent recovery as the IL will have to be recovered only from the extract. Non
Random Two Liquid (NRTL) thermodynamic model was used to correlate the experimental
data. The tie line compositions fitted well with the NRTL model.
Holbrey et al. (2003) reported the formation of inclusion compounds in ionic liquid-aromatic
compound mixtures. Benzene, toluene and xylenes are remarkably soluble but rarely
completely soluble in IL’s. The lower IL phase displayed a low viscosity in comparison with
the IL ‘neat’, which suggests the formation of a clathrate having non stoichiometric but
reproducible compositions. NMR and neutron scattering data were used to prove the
formation of liquid clathrates. This paper gave a significant bearing to investigations
regarding the extraction of aromatics from aliphatics using IL’s.
Meindersma (2005) investigated the extraction of aromatics from naptha using IL’s.
Separation of aromatics from the C4 to C 10 aliphatics in naphtha is difficult as all the
components have close boiling points and many of the combinations form azeotropes. An
alternative, greener and more efficient extraction process was developed using IL’s as
extraction solvents in place of Sulpholane, which is commonly used by the petrochemical
industry for this process. The values for Selectivity ‘S’ and partition co�������������� ����
toluene-heptane model was used to simulate the actual industrial separation involved. The
66
ionic liquids 1-ethyl-3-mehtylimidazolium ethylsulphate and 3-methyl-N-butylpyridinium
tetrafluoroborate were utilised for the separations of toluene from heptanes at 40 ��������������
�� ��� ���� ���� ������ ����� � ���� �� ������� ������������ �� �� ��������� �� � �� ����� ������ ���
toluene to heptanes in the feed. These values were also determined as a function of
temperature. It was found that these IL’s gave a higher selectivity than sulpholane. The mole
fractions of toluene and heptane in the raffinate were obtained using GC while a mass
balance was used to calculate the mole fractions of the components in the extract.
Urszula et al. (2007) in this work, a systematic study of the impact of different factors on the
phase behaviour of alkoxy-imidazolium-based ionic liquids with hydrocarbons has been
presented. All systems examined showed upper critical solution temperature (UCST)
behaviour, with low solubility of the ionic liquid in n-alkanes and cycloalkanes and high
solubility in aromatic hydrocarbons. An increase in the alkyl chain length of n-alkane, or at
benzene ring resulted in an increase in the UCST. The choice of anion was shown to have
large impact on the UCST of the system: by changing the anion [BF4]� to [Tf2N]�, the
solubility dramatically increased. The relative hydrocarbon affinity for different anions
observed was [BF4]� < [Tf2N]�.The experimental results of LLE have been correlated using
the binary parameters of NRTL equation. The average root-mean-square deviation of the
equilibrium mole fraction for all the calculated values was 0.0044
Ternary systems 1-hydroxyethyl-3-methylimidazolium based ionic liquids with
dichloromethane or 1, 2-dichloroethane, and 2-propanol were investigated by Vesna et al.
(2007). For the first time, phase splitting in a (IL + dichloromethane) system was found and
the related temperature–composition phase diagrams for all aforementioned ILs were
determined. In the case of 2-propanol, partial miscibility was observed only for ILs
containing the [PF6]� and [BF4]� anions. For the ternary mixture ([C2OHmim]
[PF6] + dichloromethane + 2-propanol), a moderate pressure effect on the cloud point with a
negative pressure–temperature slope was detected.
Mara et al. (2008) calculated the predictive capability of COSMO-RS, a predictive model
based on unimolecular quantum chemistry calculations, was evaluated for the description of
the liquid–liquid equilibrium (LLE) and the vapour–liquid equilibrium (VLE) of diverse binary
mixtures of water and ILs. The effect of the ions conformers on the quality of the predictions
67
was assessed and the quantum chemical COSMO calculation at the BP/TZVP level derived
from the lowest energy conformations was adopted. While the LLE predictions degrade with
increasing the hydrophilic IL anion character, in general a good qualitative agreement
between the model predictions and experimental VLE and LLE data was obtained.
Anjte et al. (2010) studied the Liquid - liquid equilibrium data for ternary systems of several
aromatic and aliphatic hydrocarbons with the ionic liquid 3-methyl-N-butylpyridinium
dicyanamide were determined at T = 303.15 K and 328.15 K and atmospheric pressure. As
aromatics benzene, cumene and p-xylene have been chosen, as paraffins n-hexane and n-
nonane were used. A logical order in the extraction capacity of 3-methyl-N-butylpyridinium
dicyanamide for the different aromatics is obtained: benzene > p-xylene > cumene.
Gonzalez et al. (2010) studied the separation of toluene from aliphatic hydrocarbons
(heptane, or octane, or nonane) was analysed by solvent extraction with 1-ethyl-3-
methylpyridinium ethylsulphate ionic liquid, [EMpy][ESO4]. Liquid�������� ������ ����
(LLE) data for the ternary systems {heptane (1) + toluene (2) + [EMpy] [ESO4] (3)}, {octane
(1) + toluene (2) + [EMpy] [ESO4] (3)}, and {nonane (1) + toluene (2) + [EMpy] [ESO4] (3)}
were obtained by measurements at T = 298.15 K and atmospheric pressure. The selectivity, %
removal of aromatic, and solute distribution ratio, obtained from experimental equilibrium
results, were used to determine the ability of [EMpy] [ESO4] as a solvent. The experimental
results for the ternary systems were correlated with the NRTL model. Finally, the results
obtained were compared with other ionic liquids and other solvents.
Dominguez et al. (2011) studied the extraction of toluene from cyclic hydrocarbons
(cyclohexane, or methylcyclohexane, or cyclooctane, or cyclohexene) was analysed by liquid
extraction with 1-butyl-3-methylimidazolium methylsulphate ionic liquid, [Bmim] [MSO4], as
solvent. The experimental (liquid + liquid) equilibrium (LLE) data were determined at
T = 298.15 K and atmospheric pressure. Solubility curves were obtained by the cloud point
method and tie-line compositions were determined by density measurement. An analysis of
the influence of different cyclic hydrocarbons on the extraction was performed.
68
Raquel et al. (2012) studied various IL such as Liquid -liquid equilibrium data for the ionic
liquids 1-ethyl-3-methylimidazolium bis(trifluoromethylsulphonyl)imide, [EMim][NTf2], 1-
propyl-3-methylimidazolium bis(trifluoromethylsulphonyl)imide, [PMim][NTf2], 1-butyl-3-
methylimidazolium bis(trifluoromethylsulphonyl)imide, [BMim][NTf2], and 1-hexyl-3-
methylimidazoliumbis(trifluoromethylsulphonyl)imide, [HMim][NTf2], mixed with ethanol
and heptane were studied at T = 298.15 K and atmospheric pressure. The ability of these
ionic liquids as solvents for the extraction of ethanol from heptane was evaluated in terms of
selectivity and solute distribution ratio. Moreover, density and refractive index values over
the miscible region for the ternary mixtures were also measured at T = 313.15 K. Finally, the
experimental data were correlated with the Non Random Two Liquids (NRTL) and Universal
Quasi Chemical (UNIQUAC) thermodynamic models, and an exhaustive comparison with
available literature data of the studied systems was carried out.
Garcia et al. (2012) the use of binary mixture of ionic liquids N-butylpyridinium
tetrafluoroborate ([bpy] [BF4]), and 1-butyl-4-methylpyridinium bis
(trifluoromethylsulphonyl) imide ([4bmpy] [Tf2N]) in the liquid–liquid extraction of toluene
from n-heptane has been investigated at 313.2 K and atmospheric pressure. The experimental
capacity of extraction and selectivity for this binary mixture has proved to be intermediate to
those corresponding to the pure ionic liquids, and they can be predicted using a logarithmic–
linear model of solubility. Furthermore, the results showed that the use of binary mixture of
{[bpy][BF4] + [4bmpy][Tf2N]} at a mole solvent composition around 0.7 for [bpy][BF4]
improves both the capacity of extraction of toluene and the selectivity with respect to those
of sulpholane, the organic solvent taken as a benchmark. Thus, this mixed ionic liquid could
be likely to be used in the extraction of aromatic from aliphatic in replacement to sulpholane.
69
2.5 Experimental Procedure
2.5.1 Materials and Methods
Methanol (AR grade), n-heptane (AR grade), toluene rectified (AR grade), potassium
hydrogensulphate (AR grade), and ethyl acetate (AR grade) were obtained from S. D. Fine
Chemicals Limited, Mumbai. 1-methylimidazole (99%) and n-butyl chloride (99%) was
obtained from Spectrochem Private Limited, Mumbai. 1-methylimidazole and n-butyl
chloride was distilled once before use. All the ionic liquids were prepared in the laboratory
following standard procedures as mentioned later in this section.
Contech CA series precision balance (accuracy �10–3 g) was used to measure the mass of all
chemicals used in the extraction process. The densities of the raffinate were measured by
using a DA-100 Densitometer (accuracy of �10–3 g/ml) manufactured by Kyoto Electronics,
Japan. Solvent were removed during the preparation of the ionic liquid using a rotary
evaporator (Yamato RE300). Spectrascan UV2700 of Chemito make were used for obtaining
the UV-Visible spectrum of the raffinate in order to prove the absence of IL.
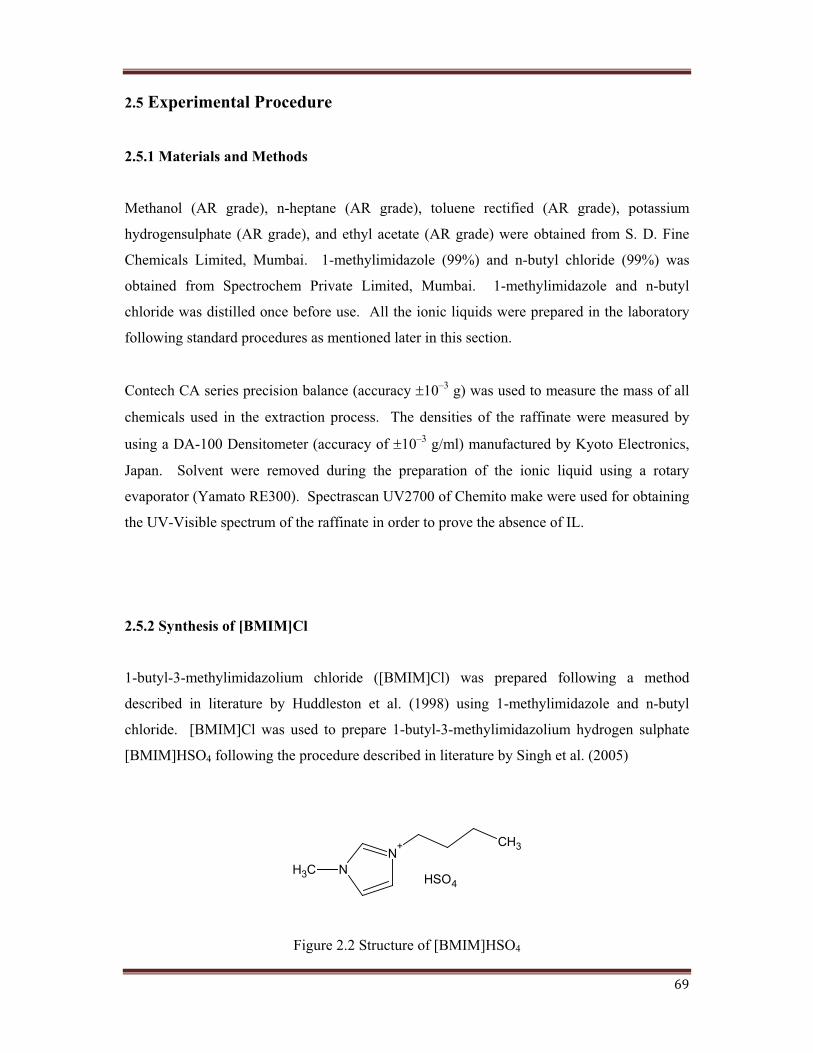
2.5.2 Synthesis of [BMIM]Cl
1-butyl-3-methylimidazolium chloride ([BMIM]Cl) was prepared following a method
described in literature by Huddleston et al. (1998) using 1-methylimidazole and n-butyl
chloride. [BMIM]Cl was used to prepare 1-butyl-3-methylimidazolium hydrogen sulphate
[BMIM]HSO4 following the procedure described in literature by Singh et al. (2005)
NN
+
CH3
CH3
HSO4
Figure 2.2 Structure of [BMIM]HSO4
70
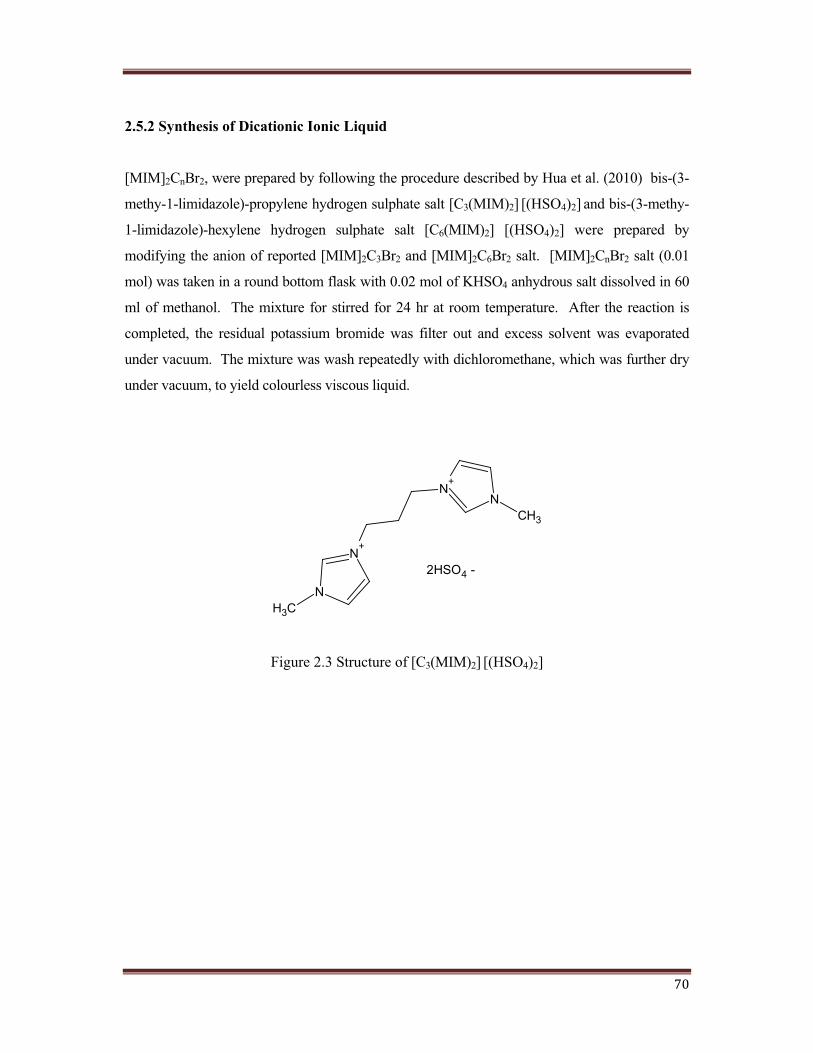
2.5.2 Synthesis of Dicationic Ionic Liquid
[MIM]2CnBr2, were prepared by following the procedure described by Hua et al. (2010) bis-(3-
methy-1-limidazole)-propylene hydrogen sulphate salt [C3(MIM)2] [(HSO4)2] and bis-(3-methy-
1-limidazole)-hexylene hydrogen sulphate salt [C6(MIM)2] [(HSO4)2] were prepared by
modifying the anion of reported [MIM]2C3Br2 and [MIM]2C6Br2 salt. [MIM]2CnBr2 salt (0.01
mol) was taken in a round bottom flask with 0.02 mol of KHSO4 anhydrous salt dissolved in 60
ml of methanol. The mixture for stirred for 24 hr at room temperature. After the reaction is
completed, the residual potassium bromide was filter out and excess solvent was evaporated
under vacuum. The mixture was wash repeatedly with dichloromethane, which was further dry
under vacuum, to yield colourless viscous liquid.
N
N+
CH3
N+
NCH3
2HSO4 -
Figure 2.3 Structure of [C3(MIM)2] [(HSO4)2]

71
2HSO4 -N
N+
CH3
N+
NCH3
Figure 2.4 Structure of [C6(MIM)2] [(HSO4)2]
2.5.3 Experimental procedure
The extraction of toluene from n-heptane was carried out in a 25 ml round bottom flask (J-Sil
borosilicate glass). Various ratios of toluene to n-heptane were taken in a round bottom flask
and 1 ml of the ionic liquids [BMIM][HSO4] , [HMIM][HSO4], [C3(MIM)2] [(HSO4)2] and
[C6(MIM)2][(HSO4)2] were separately added to it. The volumes of the chemicals were
accurately measured using a micro-pipette. The mixture was stirred with a magnetic stirrer in
constant temperature water bath maintained at 30º C at atmospheric pressure. For the first
batch, the n-heptane-rich (raffinate layer) was analysed using Gas Chromatography after
every 30 minutes and the areas under the toluene peaks were found to be almost constant
after a period of 1 hour. Thus, it were concluded that the time required to reach liquid-liquid
equilibrium was about 1 hour. All the further batches was stirred for more than 1 hour and
then allowed to settle. The amount of toluene present in raffinate was analysed with a Gas
Chromatograph. A Chromline Equipment GC-100 Gas Chromatograph with SE-30 packed
column and FID detector were used for this analysis. Whereas toluene present in the extract
was analysed by using a pre-column 5M Z-Guard column (which retains ionic liquids), the
organic layer was analysed with the GC column using FID detector.
72
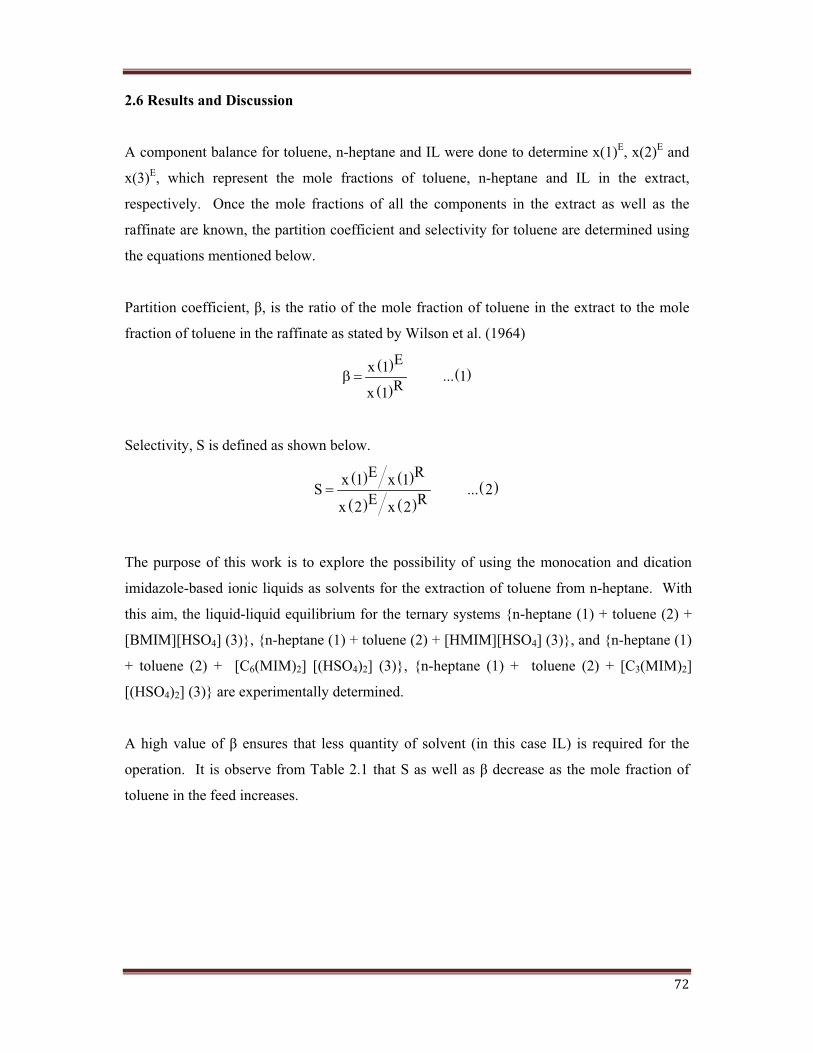
2.6 Results and Discussion
A component balance for toluene, n-heptane and IL were done to determine x(1)E, x(2)E and
x(3)E, which represent the mole fractions of toluene, n-heptane and IL in the extract,
respectively. Once the mole fractions of all the components in the extract as well as the
raffinate are known, the partition coefficient and selectivity for toluene are determined using
the equations mentioned below.
!� ������������������"�"�������� ������������������ ��������������������������#� ����������������
fraction of toluene in the raffinate as stated by Wilson et al. (1964)
� �
� �� �
Ex 1 ... 1Rx 1� �
Selectivity, S is defined as shown below.
� � � �
� � � �� �
E Rx 1 x 1S ... 2E Rx 2 x 2�
The purpose of this work is to explore the possibility of using the monocation and dication
imidazole-based ionic liquids as solvents for the extraction of toluene from n-heptane. With
this aim, the liquid-liquid equilibrium for the ternary systems {n-heptane (1) + toluene (2) +
[BMIM][HSO4] (3)}, {n-heptane (1) + toluene (2) + [HMIM][HSO4] (3)}, and {n-heptane (1)
+ toluene (2) + [C6(MIM)2] [(HSO4)2] (3)}, {n-heptane (1) + toluene (2) + [C3(MIM)2]
[(HSO4)2] (3)} are experimentally determined.
$���%������������ ���� ��� ����� ������������&���� �������� '��� ����� ����� ()*� ��� ���� ed for the
operation. It is observe from Table 2.+������,���������������� ������������������ ����������
toluene in the feed increases.
73
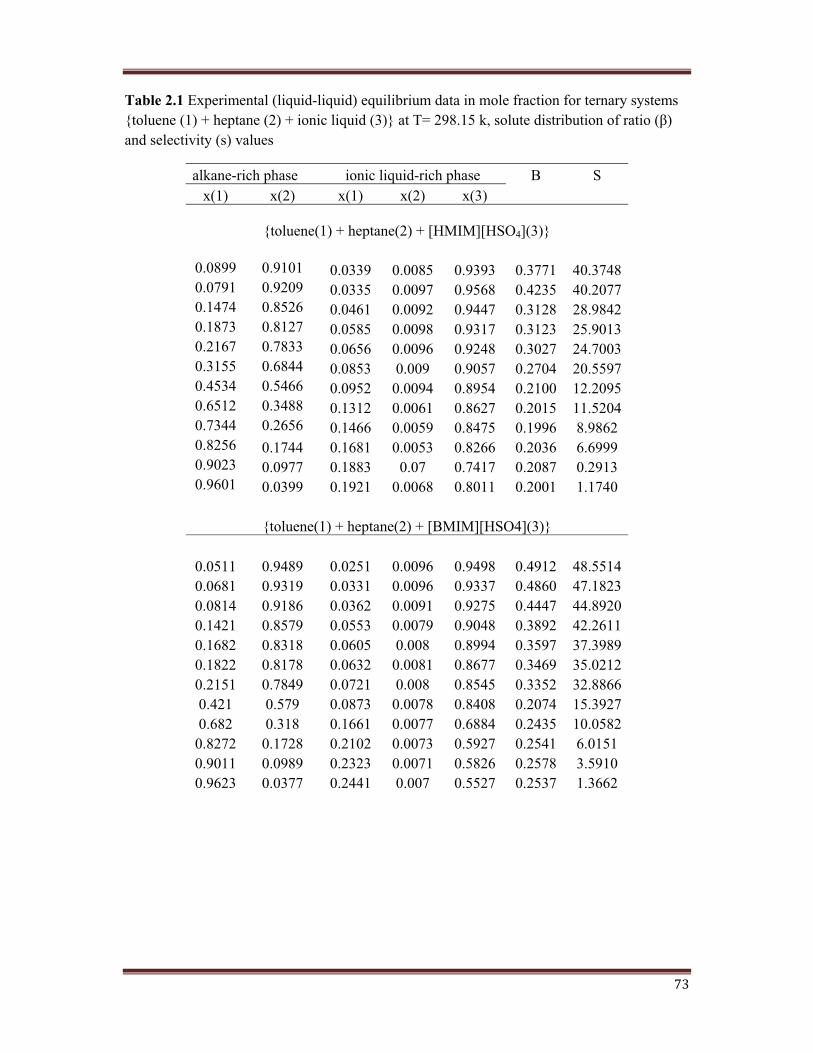
Table 2.1 Experimental (liquid-liquid) equilibrium data in mole fraction for ternary systems -��������'+*�.���������'/*�.��������������'0*1�����2�/34�+5�6"������������ � ��������� �����'*�and selectivity (s) values
alkane-rich phase ionic liquid-rich phase 7 Sx(1) x(2) x(1) x(2) x(3)
{toluene(1) + heptane(2) + [HMIM][HSO4](3)}
0.0899 0.9101 0.0339 0.0085 0.9393 0.3771 40.37480.0791 0.9209 0.0335 0.0097 0.9568 0.4235 40.20770.1474 0.8526 0.0461 0.0092 0.9447 0.3128 28.98420.1873 0.8127 0.0585 0.0098 0.9317 0.3123 25.90130.2167 0.7833 0.0656 0.0096 0.9248 0.3027 24.70030.3155 0.6844 0.0853 0.009 0.9057 0.2704 20.55970.4534 0.5466 0.0952 0.0094 0.8954 0.2100 12.20950.6512 0.3488 0.1312 0.0061 0.8627 0.2015 11.52040.7344 0.2656 0.1466 0.0059 0.8475 0.1996 8.98620.8256 0.1744 0.1681 0.0053 0.8266 0.2036 6.69990.9023 0.0977 0.1883 0.07 0.7417 0.2087 0.29130.9601 0.0399 0.1921 0.0068 0.8011 0.2001 1.1740
{toluene(1) + heptane(2) + [BMIM][HSO4](3)}
0.0511 0.9489 0.0251 0.0096 0.9498 0.4912 48.55140.0681 0.9319 0.0331 0.0096 0.9337 0.4860 47.18230.0814 0.9186 0.0362 0.0091 0.9275 0.4447 44.89200.1421 0.8579 0.0553 0.0079 0.9048 0.3892 42.26110.1682 0.8318 0.0605 0.008 0.8994 0.3597 37.39890.1822 0.8178 0.0632 0.0081 0.8677 0.3469 35.02120.2151 0.7849 0.0721 0.008 0.8545 0.3352 32.88660.421 0.579 0.0873 0.0078 0.8408 0.2074 15.39270.682 0.318 0.1661 0.0077 0.6884 0.2435 10.0582
0.8272 0.1728 0.2102 0.0073 0.5927 0.2541 6.01510.9011 0.0989 0.2323 0.0071 0.5826 0.2578 3.59100.9623 0.0377 0.2441 0.007 0.5527 0.2537 1.3662
74
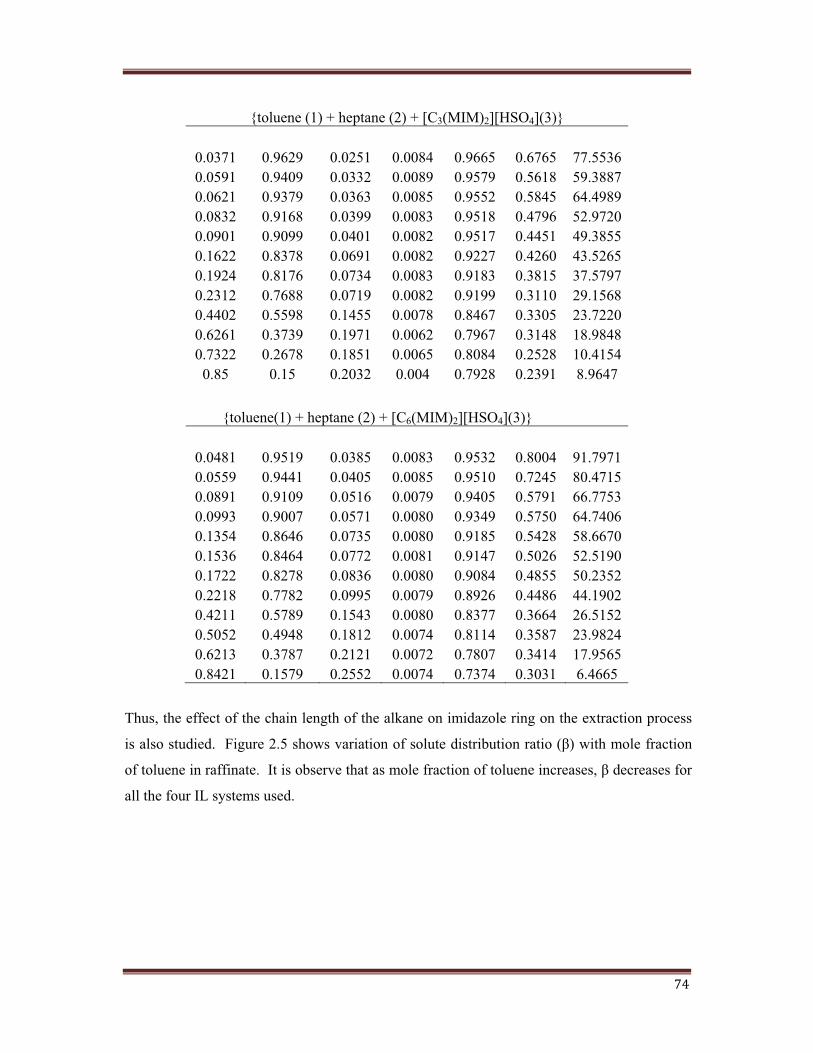
{toluene (1) + heptane (2) + [C3(MIM)2][HSO4](3)}
0.0371 0.9629 0.0251 0.0084 0.9665 0.6765 77.55360.0591 0.9409 0.0332 0.0089 0.9579 0.5618 59.38870.0621 0.9379 0.0363 0.0085 0.9552 0.5845 64.49890.0832 0.9168 0.0399 0.0083 0.9518 0.4796 52.97200.0901 0.9099 0.0401 0.0082 0.9517 0.4451 49.38550.1622 0.8378 0.0691 0.0082 0.9227 0.4260 43.52650.1924 0.8176 0.0734 0.0083 0.9183 0.3815 37.57970.2312 0.7688 0.0719 0.0082 0.9199 0.3110 29.15680.4402 0.5598 0.1455 0.0078 0.8467 0.3305 23.72200.6261 0.3739 0.1971 0.0062 0.7967 0.3148 18.98480.7322 0.2678 0.1851 0.0065 0.8084 0.2528 10.4154
0.85 0.15 0.2032 0.004 0.7928 0.2391 8.9647
{toluene(1) + heptane (2) + [C6(MIM)2][HSO4](3)}
0.0481 0.9519 0.0385 0.0083 0.9532 0.8004 91.79710.0559 0.9441 0.0405 0.0085 0.9510 0.7245 80.47150.0891 0.9109 0.0516 0.0079 0.9405 0.5791 66.77530.0993 0.9007 0.0571 0.0080 0.9349 0.5750 64.74060.1354 0.8646 0.0735 0.0080 0.9185 0.5428 58.66700.1536 0.8464 0.0772 0.0081 0.9147 0.5026 52.51900.1722 0.8278 0.0836 0.0080 0.9084 0.4855 50.23520.2218 0.7782 0.0995 0.0079 0.8926 0.4486 44.19020.4211 0.5789 0.1543 0.0080 0.8377 0.3664 26.51520.5052 0.4948 0.1812 0.0074 0.8114 0.3587 23.98240.6213 0.3787 0.2121 0.0072 0.7807 0.3414 17.95650.8421 0.1579 0.2552 0.0074 0.7374 0.3031 6.4665
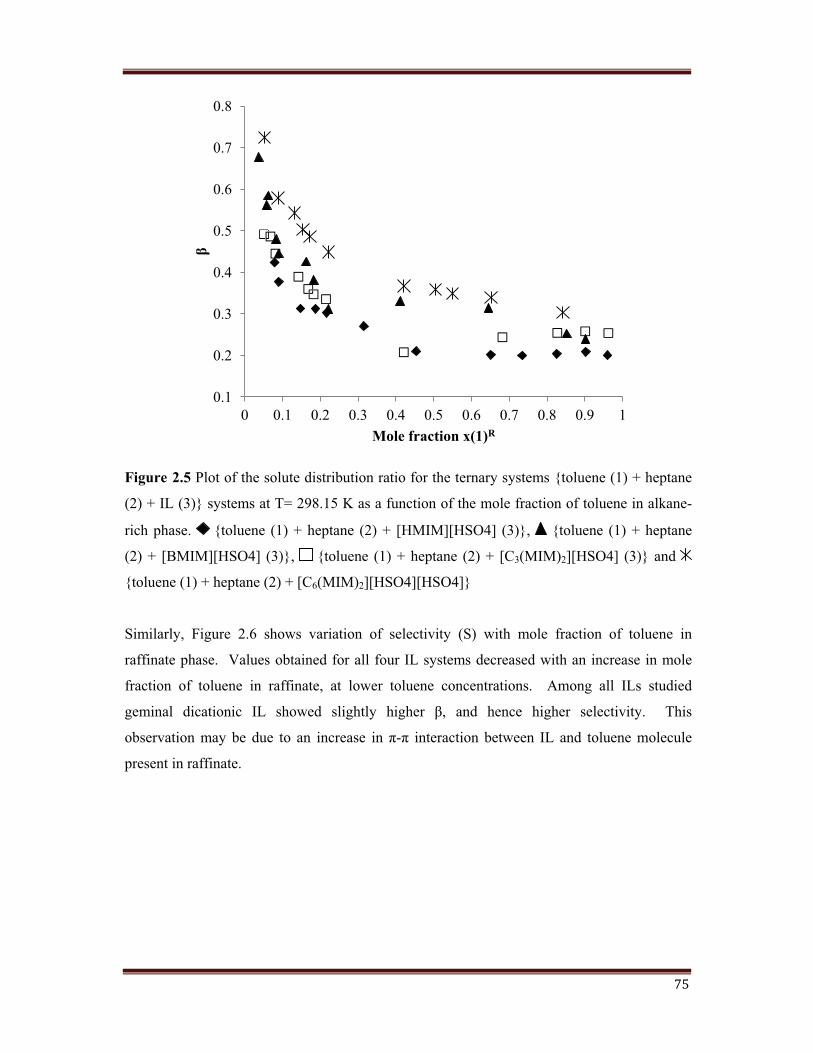
Thus, the effect of the chain length of the alkane on imidazole ring on the extraction process
is also studied. Figure 2.5 sh������ ��������������������� � ������ �����'*������������ �������
of toluene in raffinate. It is observe �������������� ��������������������� �����"����� �������� �
all the four IL systems used.
75
Figure 2.5 Plot of the solute distribution ratio for the ternary systems {toluene (1) + heptane
(2) + IL (3)} systems at T= 298.15 K as a function of the mole fraction of toluene in alkane-
rich phase. {toluene (1) + heptane (2) + [HMIM][HSO4] (3)}, {toluene (1) + heptane
(2) + [BMIM][HSO4] (3)}, {toluene (1) + heptane (2) + [C3(MIM)2][HSO4] (3)} and
{toluene (1) + heptane (2) + [C6(MIM)2][HSO4][HSO4]}
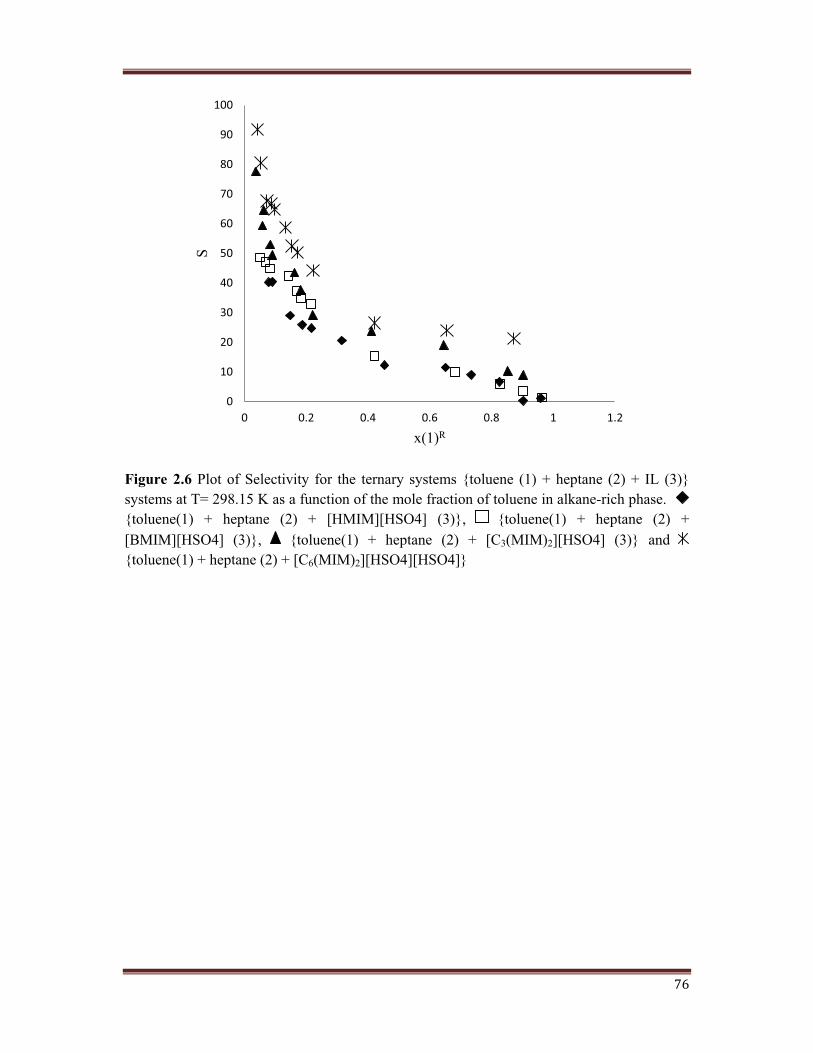
Similarly, Figure 2.6 shows variation of selectivity (S) with mole fraction of toluene in
raffinate phase. Values obtained for all four IL systems decreased with an increase in mole
fraction of toluene in raffinate, at lower toluene concentrations. Among all ILs studied
geminal dicationic IL showed ���%���&� ��%�� � "� ���� ������ ��%�� � ����������&�� � �����
� �� ���������&� �� ���� ��� ��� ��� ����� ��� 8-8� ���� ������� ������� ()� ���� �����������������
present in raffinate.
0.1
0.2
0.3
0.4
0.5
0.6
0.7
0.8
0 0.1 0.2 0.3 0.4 0.5 0.6 0.7 0.8 0.9 1
�
Mole fraction x(1)R
76
Figure 2.6 Plot of Selectivity for the ternary systems {toluene (1) + heptane (2) + IL (3)} systems at T= 298.15 K as a function of the mole fraction of toluene in alkane-rich phase.{toluene(1) + heptane (2) + [HMIM][HSO4] (3)}, {toluene(1) + heptane (2) + [BMIM][HSO4] (3)}, {toluene(1) + heptane (2) + [C3(MIM)2][HSO4] (3)} and{toluene(1) + heptane (2) + [C6(MIM)2][HSO4][HSO4]}
0
10
20
30
40
50
60
70
80
90
100
0 0.2 0.4 0.6 0.8 1 1.2
S
x(1)R
77
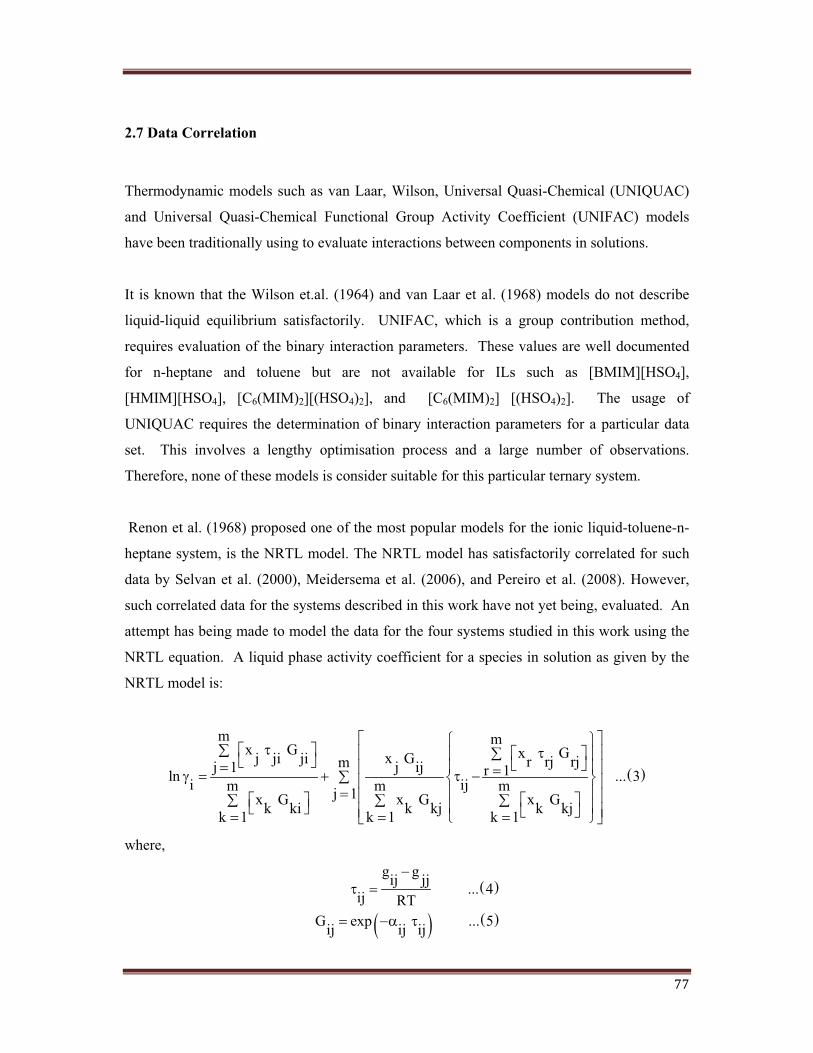
2.7 Data Correlation
Thermodynamic models such as van Laar, Wilson, Universal Quasi-Chemical (UNIQUAC)
and Universal Quasi-Chemical Functional Group Activity Coefficient (UNIFAC) models
have been traditionally using to evaluate interactions between components in solutions.
It is known that the Wilson et.al. (1964) and van Laar et al. (1968) models do not describe
liquid-liquid equilibrium satisfactorily. UNIFAC, which is a group contribution method,
requires evaluation of the binary interaction parameters. These values are well documented
for n-heptane and toluene but are not available for ILs such as [BMIM][HSO4],
[HMIM][HSO4], [C6(MIM)2][(HSO4)2], and [C6(MIM)2] [(HSO4)2]. The usage of
UNIQUAC requires the determination of binary interaction parameters for a particular data
set. This involves a lengthy optimisation process and a large number of observations.
Therefore, none of these models is consider suitable for this particular ternary system.
Renon et al. (1968) proposed one of the most popular models for the ionic liquid-toluene-n-
heptane system, is the NRTL model. The NRTL model has satisfactorily correlated for such
data by Selvan et al. (2000), Meidersema et al. (2006), and Pereiro et al. (2008). However,
such correlated data for the systems described in this work have not yet being, evaluated. An
attempt has being made to model the data for the four systems studied in this work using the
NRTL equation. A liquid phase activity coefficient for a species in solution as given by the
NRTL model is:
� �
m mx G x Gx Gj ji ji r rj rjmj 1 j ij r 1ln ... 3i ijm m mj 1x G x G x Gk ki k kj k kjk 1 k 1 k 1
� � � � �� � �� � � �� � �� ��� � � �� � �� �
� �� � �� � � � �� � � �� �� � � � �� �
where,
� �
� � � �
g gij jj ... 4ij RTG exp ... 5ij ij ij
� �
� ��
78
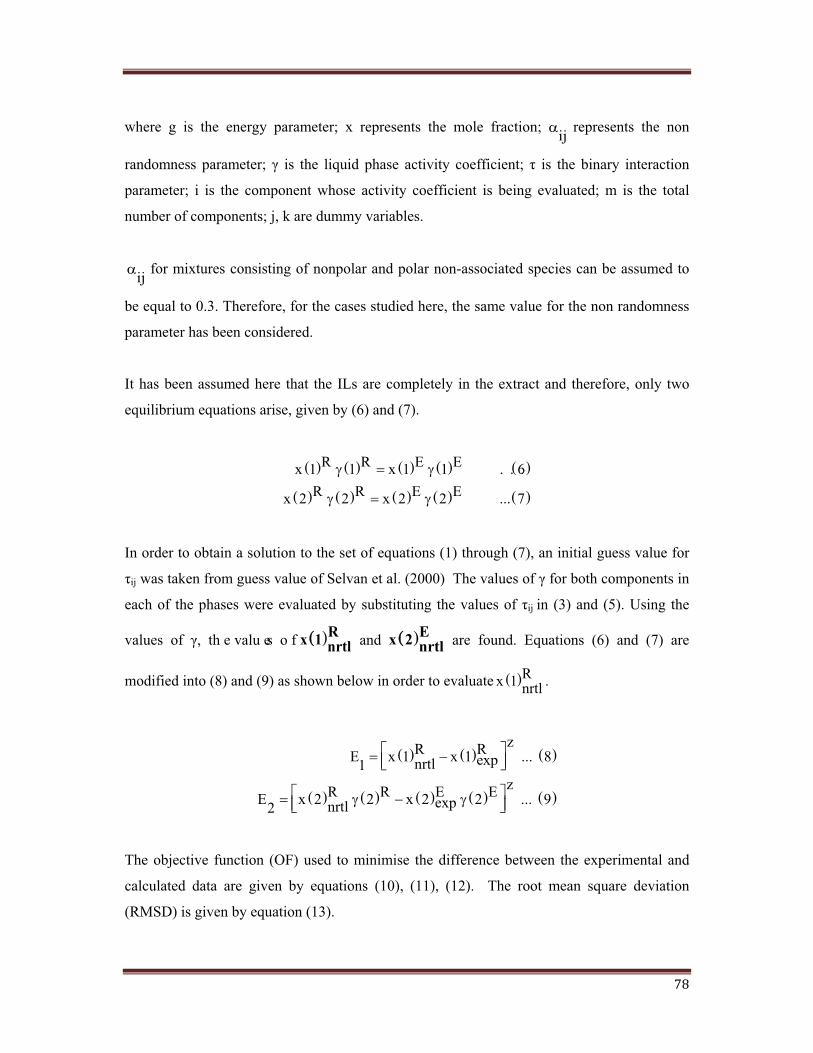
where g is the energy parameter; x represents the mole fraction; ij� represents the non
���������� �� ����� 9� :� ��� ���� ������� ������ �������&� �����������9� ;� ��� ���� ��� &� ���� �������
parameter; i is the component whose activity coefficient is being evaluated; m is the total
number of components; j, k are dummy variables.
ij� for mixtures consisting of nonpolar and polar non-associated species can be assumed to
be equal to 0.3. Therefore, for the cases studied here, the same value for the non randomness
parameter has been considered.
It has been assumed here that the ILs are completely in the extract and therefore, only two
equilibrium equations arise, given by (6) and (7).
� � � � � � � � � �
� � � � � � � � � �
R R E Ex 1 1 x 1 1 . . .6R R E Ex 2 2 x 2 2 ... 7
� � �
� � �
In order to obtain a solution to the set of equations (1) through (7), an initial guess value for
;ij was taken from guess value of Selvan et al. (2000) ��������������:��� � ������������������
�������� ������������� ������������ &��� ��������%� ��������������;ij in (3) and (5). Using the
values o�� :"� �� �� ���� ��� � �� �� �Rx 1 nrtl and �� �Ex 2 nrtl are found. Equations (6) and (7) are
modified into (8) and (9) as shown below in order to evaluate � �Rx 1 nrtl .
� � � � � �
� � � � � � � � � �
zR RE x 1 x 1 ... 8expnrtl1zR R E EE x 2 2 x 2 2 ... 9expnrtl2
� �� �� �
� � � �� �� �
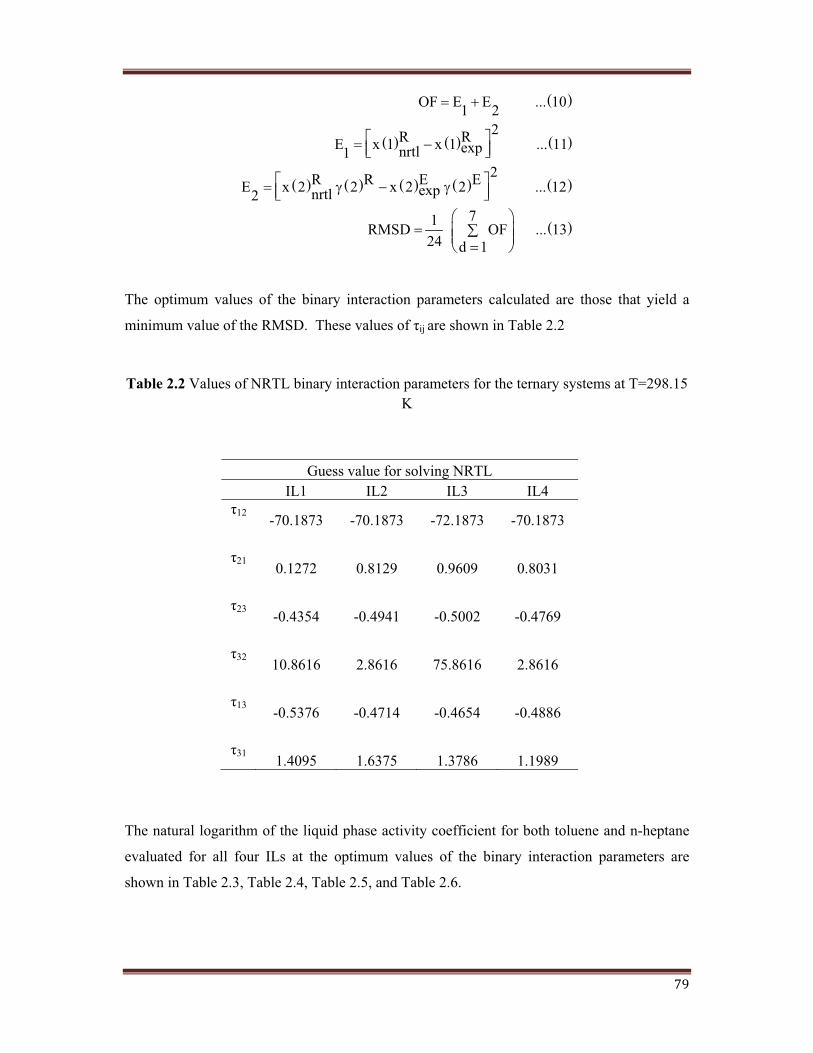
The objective function (OF) used to minimise the difference between the experimental and
calculated data are given by equations (10), (11), (12). The root mean square deviation
(RMSD) is given by equation (13).
79
� �
� � � � � �
� � � � � � � � � �
� �
OF E E ... 101 22R RE x 1 x 1 ... 11expnrtl12R R E EE x 2 2 x 2 2 ... 12expnrtl2
71RMSD OF ... 1324 d 1
� �
� �� �� �
� � � �� �� �� �
� �� �� �� !
The optimum values of the binary interaction parameters calculated are those that yield a
���������������������<=,>�������������������;ij are shown in Table 2.2
Table 2.2 Values of NRTL binary interaction parameters for the ternary systems at T=298.15 K
Guess value for solving NRTLIL1 IL2 IL3 IL4
;12 -70.1873 -70.1873 -72.1873 -70.1873
;21 0.1272 0.8129 0.9609 0.8031
;23 -0.4354 -0.4941 -0.5002 -0.4769
;32 10.8616 2.8616 75.8616 2.8616
;13 -0.5376 -0.4714 -0.4654 -0.4886
;31 1.4095 1.6375 1.3786 1.1989
The natural logarithm of the liquid phase activity coefficient for both toluene and n-heptane
evaluated for all four ILs at the optimum values of the binary interaction parameters are
shown in Table 2.3, Table 2.4, Table 2.5, and Table 2.6.
80
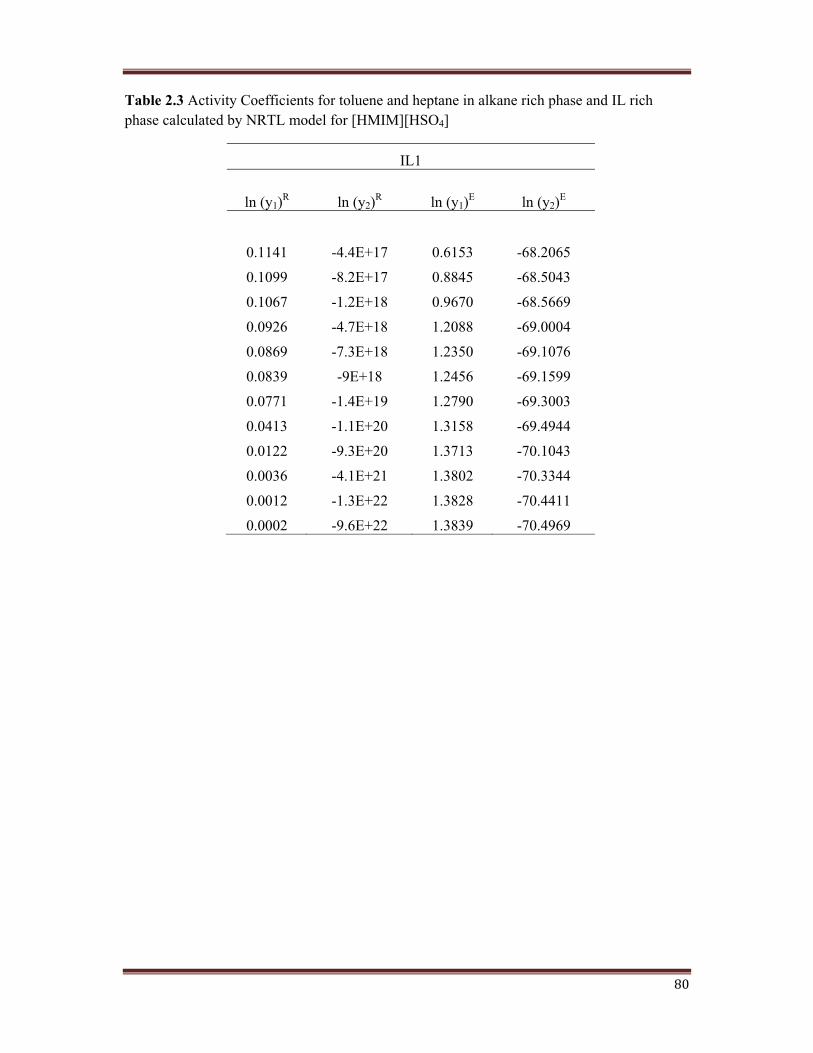
Table 2.3 Activity Coefficients for toluene and heptane in alkane rich phase and IL rich phase calculated by NRTL model for [HMIM][HSO4]
IL1
ln (y1)R ln (y2)R ln (y1)E ln (y2)E
0.1141 -4.4E+17 0.6153 -68.2065
0.1099 -8.2E+17 0.8845 -68.5043
0.1067 -1.2E+18 0.9670 -68.5669
0.0926 -4.7E+18 1.2088 -69.0004
0.0869 -7.3E+18 1.2350 -69.1076
0.0839 -9E+18 1.2456 -69.1599
0.0771 -1.4E+19 1.2790 -69.3003
0.0413 -1.1E+20 1.3158 -69.4944
0.0122 -9.3E+20 1.3713 -70.1043
0.0036 -4.1E+21 1.3802 -70.3344
0.0012 -1.3E+22 1.3828 -70.4411
0.0002 -9.6E+22 1.3839 -70.4969
81
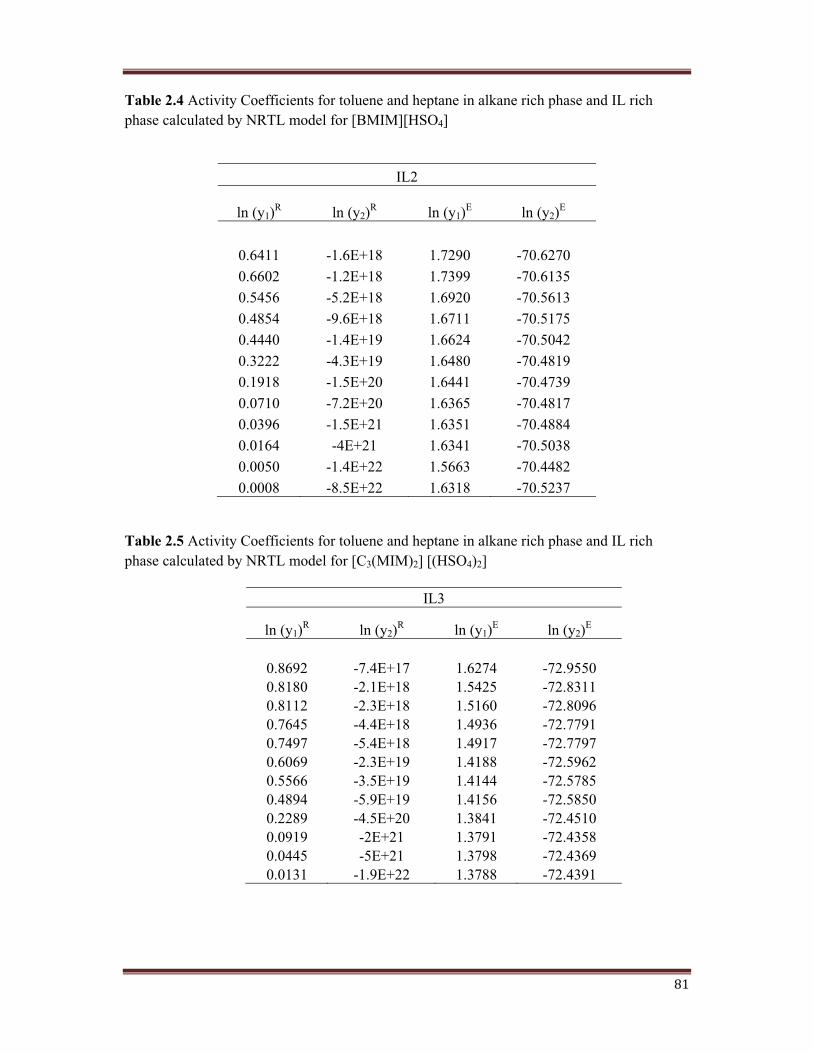
Table 2.4 Activity Coefficients for toluene and heptane in alkane rich phase and IL rich phase calculated by NRTL model for [BMIM][HSO4]
Table 2.5 Activity Coefficients for toluene and heptane in alkane rich phase and IL rich phase calculated by NRTL model for [C3(MIM)2] [(HSO4)2]
IL2
ln (y1)R ln (y2)R ln (y1)E ln (y2)E
0.6411 -1.6E+18 1.7290 -70.62700.6602 -1.2E+18 1.7399 -70.61350.5456 -5.2E+18 1.6920 -70.56130.4854 -9.6E+18 1.6711 -70.51750.4440 -1.4E+19 1.6624 -70.50420.3222 -4.3E+19 1.6480 -70.48190.1918 -1.5E+20 1.6441 -70.47390.0710 -7.2E+20 1.6365 -70.48170.0396 -1.5E+21 1.6351 -70.48840.0164 -4E+21 1.6341 -70.50380.0050 -1.4E+22 1.5663 -70.44820.0008 -8.5E+22 1.6318 -70.5237
IL3
ln (y1)R ln (y2)R ln (y1)E ln (y2)E
0.8692 -7.4E+17 1.6274 -72.95500.8180 -2.1E+18 1.5425 -72.83110.8112 -2.3E+18 1.5160 -72.80960.7645 -4.4E+18 1.4936 -72.77910.7497 -5.4E+18 1.4917 -72.77970.6069 -2.3E+19 1.4188 -72.59620.5566 -3.5E+19 1.4144 -72.57850.4894 -5.9E+19 1.4156 -72.58500.2289 -4.5E+20 1.3841 -72.45100.0919 -2E+21 1.3791 -72.43580.0445 -5E+21 1.3798 -72.43690.0131 -1.9E+22 1.3788 -72.4391
82
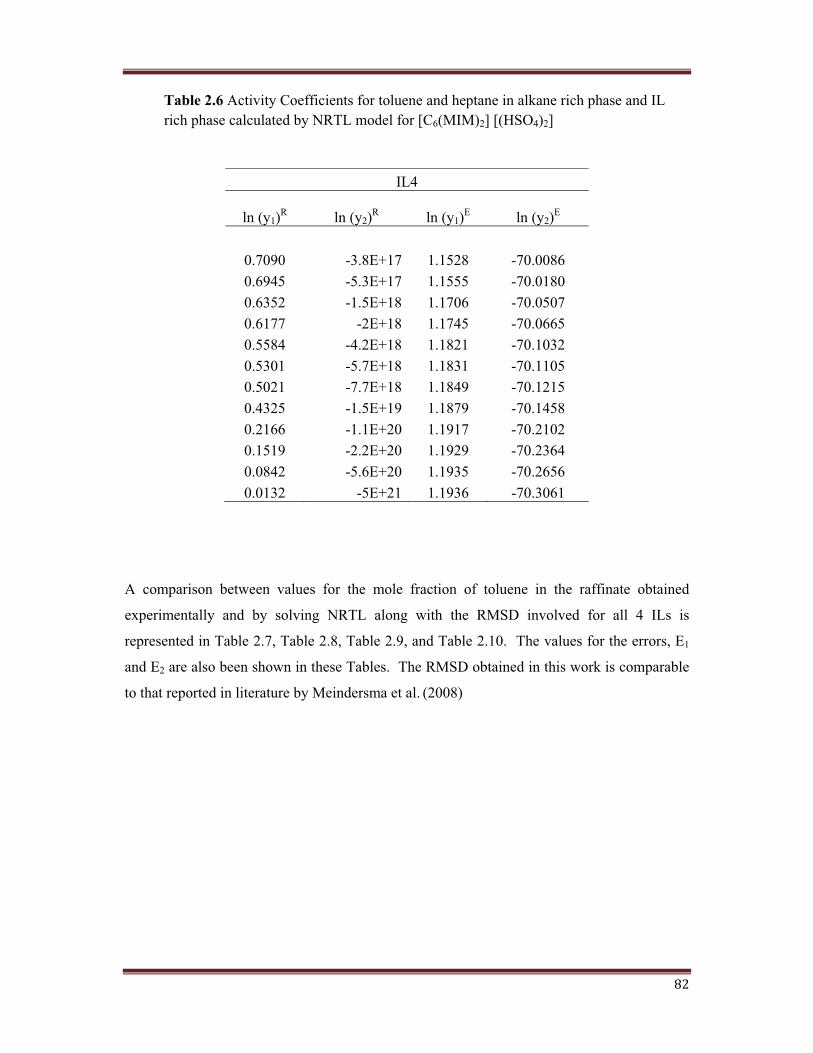
Table 2.6 Activity Coefficients for toluene and heptane in alkane rich phase and IL rich phase calculated by NRTL model for [C6(MIM)2] [(HSO4)2]
A comparison between values for the mole fraction of toluene in the raffinate obtained
experimentally and by solving NRTL along with the RMSD involved for all 4 ILs is
represented in Table 2.7, Table 2.8, Table 2.9, and Table 2.10. The values for the errors, E1
and E2 are also been shown in these Tables. The RMSD obtained in this work is comparable
to that reported in literature by Meindersma et al. (2008)
IL4
ln (y1)R ln (y2)R ln (y1)E ln (y2)E
0.7090 -3.8E+17 1.1528 -70.00860.6945 -5.3E+17 1.1555 -70.01800.6352 -1.5E+18 1.1706 -70.05070.6177 -2E+18 1.1745 -70.06650.5584 -4.2E+18 1.1821 -70.10320.5301 -5.7E+18 1.1831 -70.11050.5021 -7.7E+18 1.1849 -70.12150.4325 -1.5E+19 1.1879 -70.14580.2166 -1.1E+20 1.1917 -70.21020.1519 -2.2E+20 1.1929 -70.23640.0842 -5.6E+20 1.1935 -70.26560.0132 -5E+21 1.1936 -70.3061
83
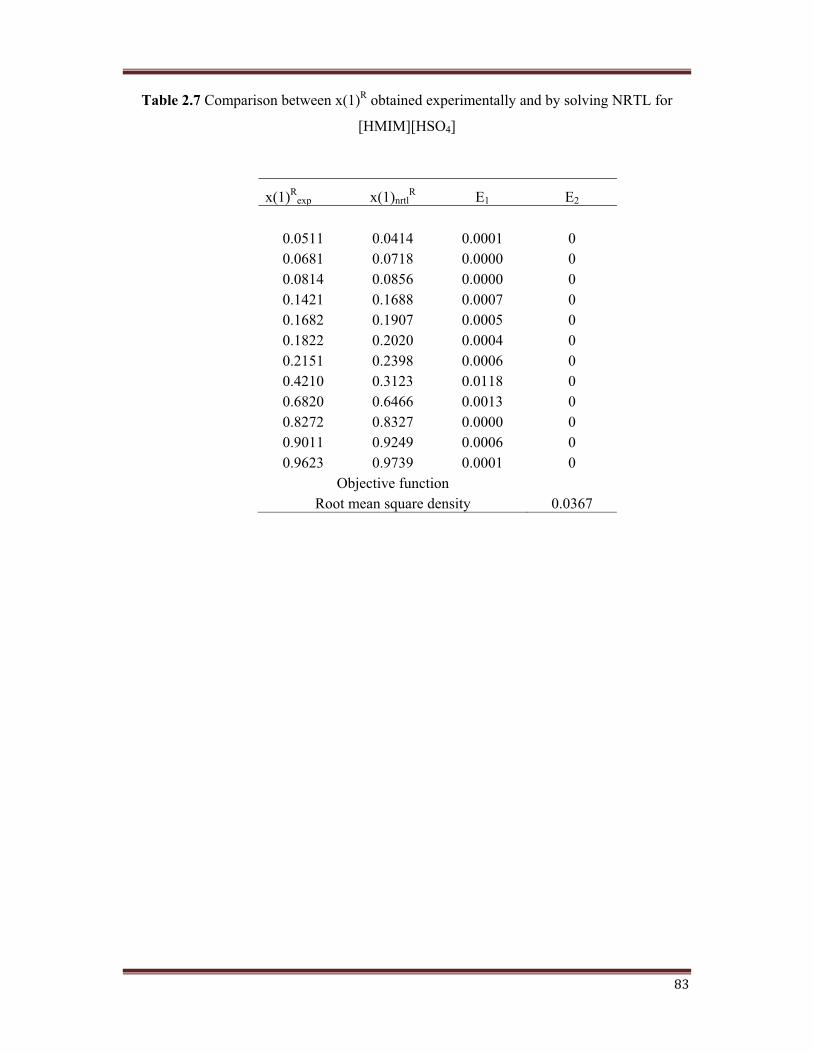
Table 2.7 Comparison between x(1)R obtained experimentally and by solving NRTL for
[HMIM][HSO4]
x(1)Rexp x(1)nrtl
R E1 E2
0.0511 0.0414 0.0001 00.0681 0.0718 0.0000 00.0814 0.0856 0.0000 00.1421 0.1688 0.0007 00.1682 0.1907 0.0005 00.1822 0.2020 0.0004 00.2151 0.2398 0.0006 00.4210 0.3123 0.0118 00.6820 0.6466 0.0013 00.8272 0.8327 0.0000 00.9011 0.9249 0.0006 00.9623 0.9739 0.0001 0
Objective function Root mean square density 0.0367
84
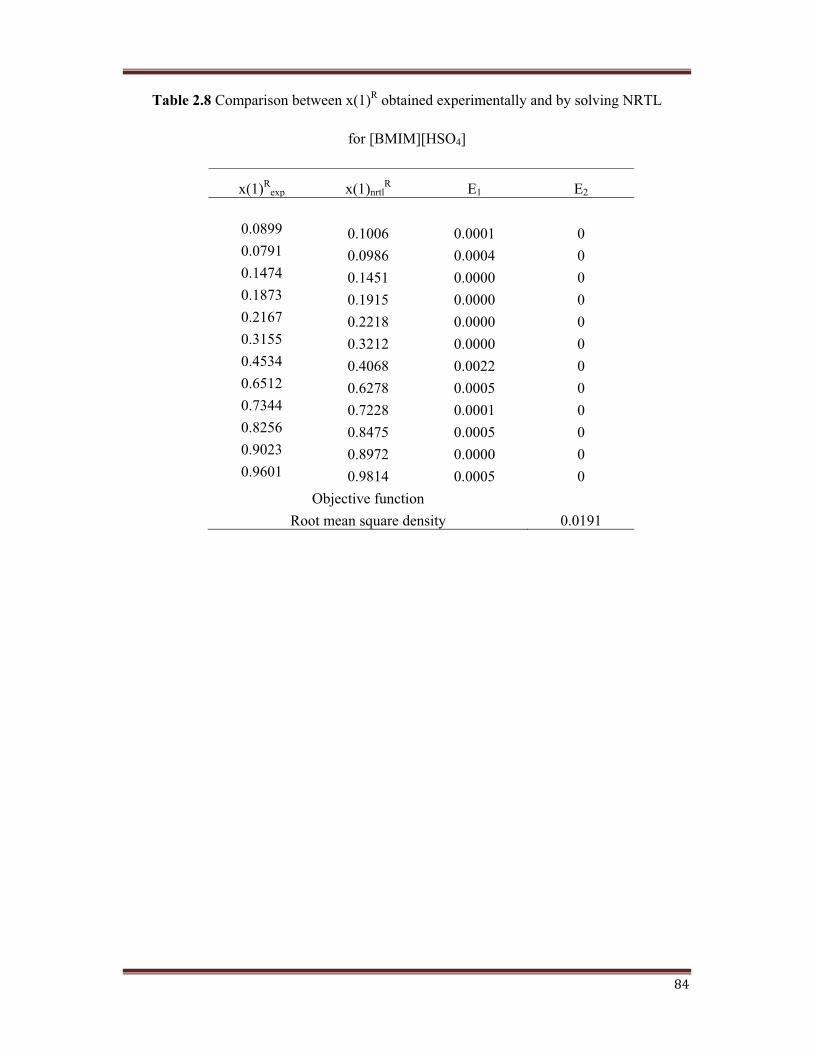
Table 2.8 Comparison between x(1)R obtained experimentally and by solving NRTL
for [BMIM][HSO4]
x(1)Rexp x(1)nrtl
R E1 E2
0.0899 0.1006 0.0001 00.0791 0.0986 0.0004 00.1474 0.1451 0.0000 00.1873 0.1915 0.0000 00.2167 0.2218 0.0000 00.3155 0.3212 0.0000 00.4534 0.4068 0.0022 00.6512 0.6278 0.0005 00.7344 0.7228 0.0001 00.8256 0.8475 0.0005 00.9023 0.8972 0.0000 00.9601 0.9814 0.0005 0
Objective function Root mean square density 0.0191
85
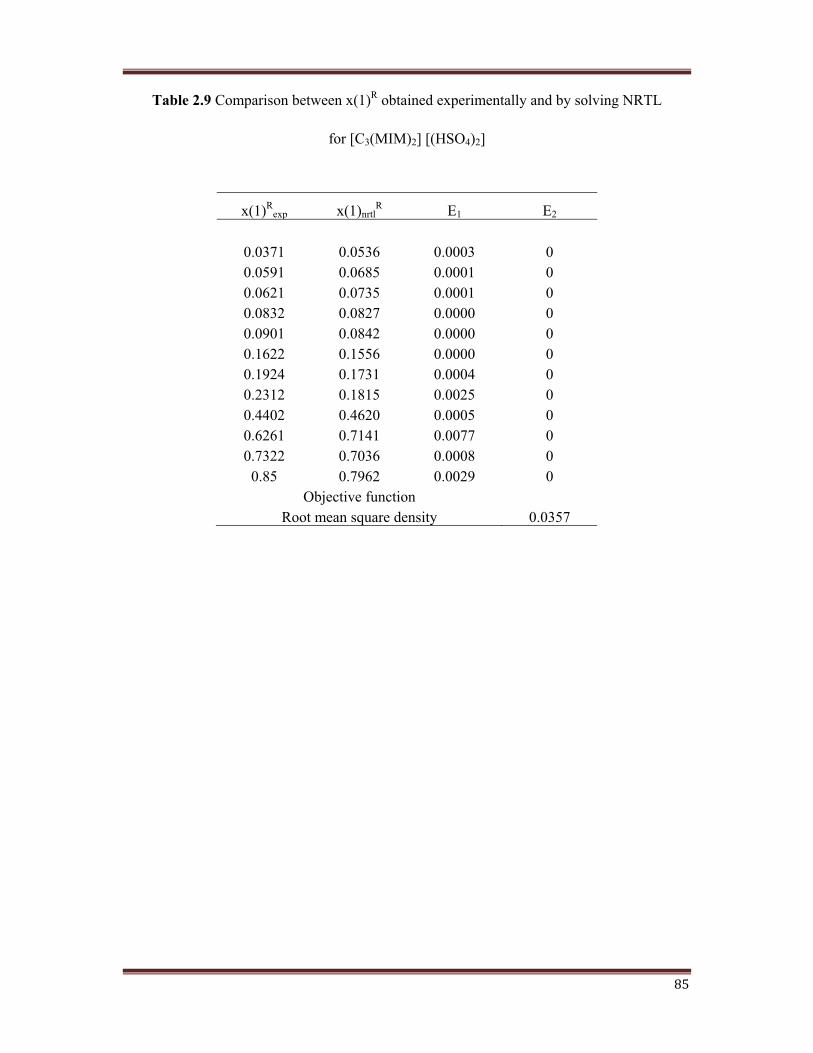
Table 2.9 Comparison between x(1)R obtained experimentally and by solving NRTL
for [C3(MIM)2] [(HSO4)2]
x(1)Rexp x(1)nrtl
R E1 E2
0.0371 0.0536 0.0003 00.0591 0.0685 0.0001 00.0621 0.0735 0.0001 00.0832 0.0827 0.0000 00.0901 0.0842 0.0000 00.1622 0.1556 0.0000 00.1924 0.1731 0.0004 00.2312 0.1815 0.0025 00.4402 0.4620 0.0005 00.6261 0.7141 0.0077 00.7322 0.7036 0.0008 0
0.85 0.7962 0.0029 0Objective function
Root mean square density 0.0357
86
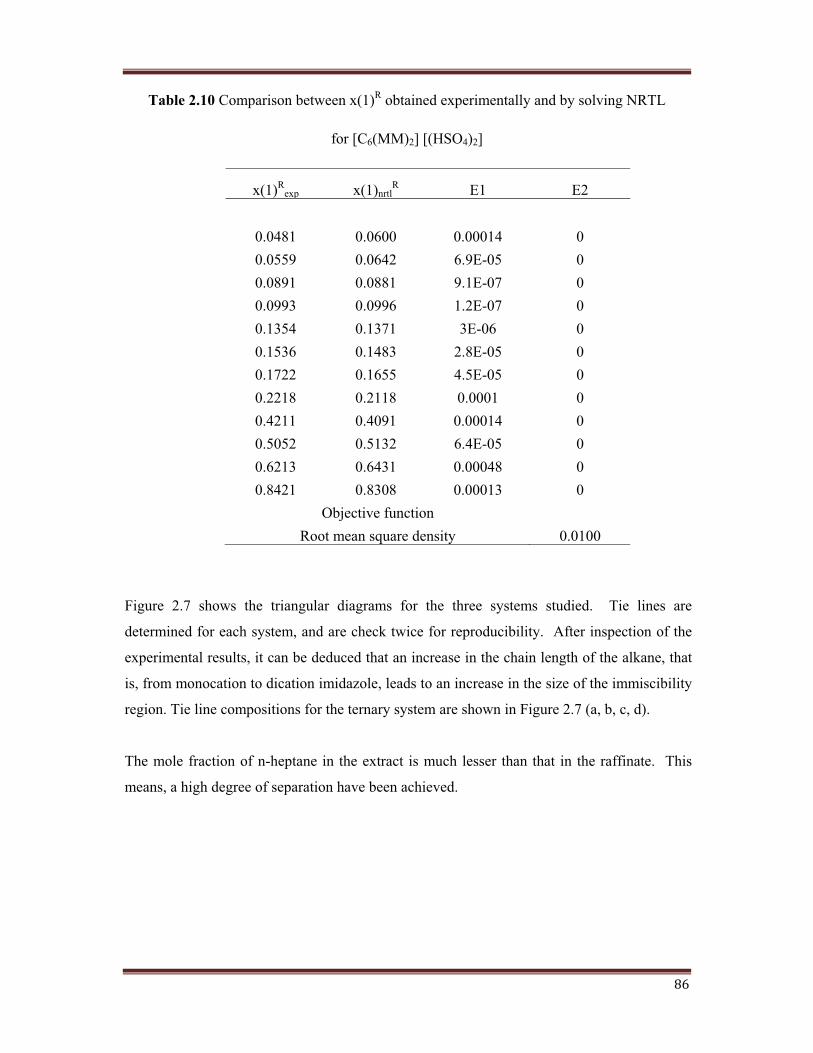
Table 2.10 Comparison between x(1)R obtained experimentally and by solving NRTL
for [C6(MM)2] [(HSO4)2]
x(1)Rexp x(1)nrtl
R E1 E2
0.0481 0.0600 0.00014 00.0559 0.0642 6.9E-05 00.0891 0.0881 9.1E-07 00.0993 0.0996 1.2E-07 00.1354 0.1371 3E-06 00.1536 0.1483 2.8E-05 00.1722 0.1655 4.5E-05 00.2218 0.2118 0.0001 00.4211 0.4091 0.00014 00.5052 0.5132 6.4E-05 00.6213 0.6431 0.00048 00.8421 0.8308 0.00013 0
Objective function Root mean square density 0.0100
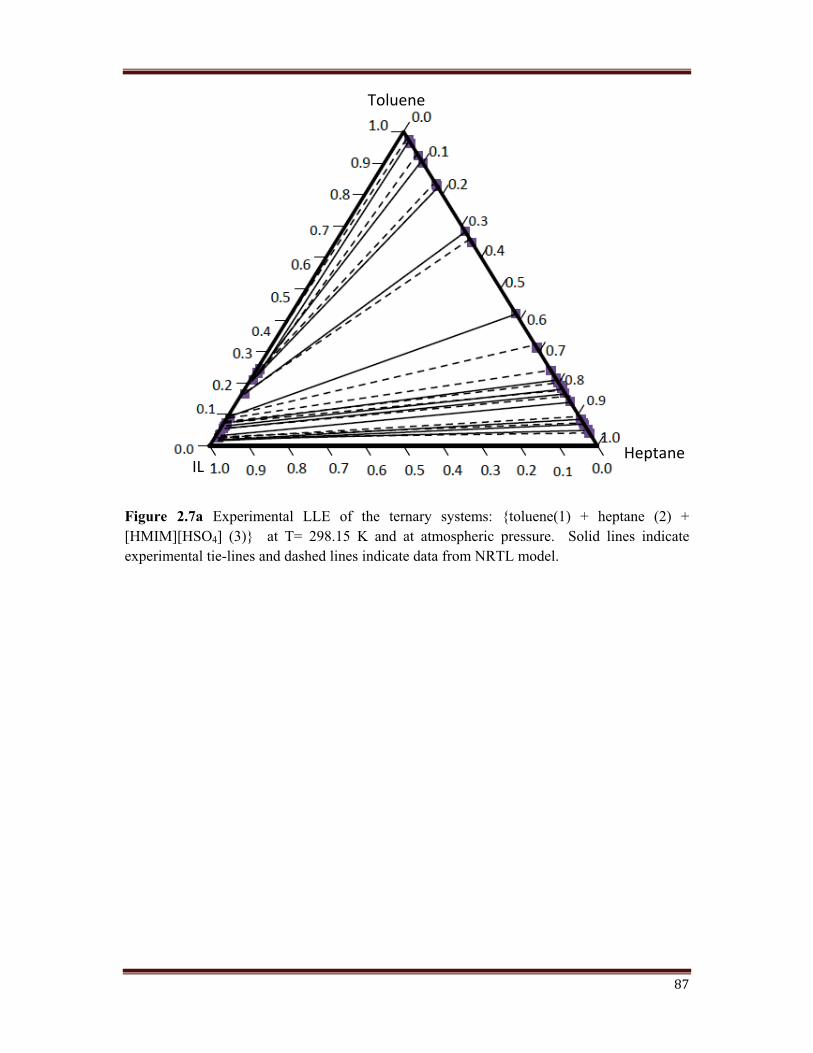
Figure 2.7 shows the triangular diagrams for the three systems studied. Tie lines are
determined for each system, and are check twice for reproducibility. After inspection of the
experimental results, it can be deduced that an increase in the chain length of the alkane, that
is, from monocation to dication imidazole, leads to an increase in the size of the immiscibility
region. Tie line compositions for the ternary system are shown in Figure 2.7 (a, b, c, d).
The mole fraction of n-heptane in the extract is much lesser than that in the raffinate. This
means, a high degree of separation have been achieved.
87
Figure 2.7a Experimental LLE of the ternary systems: {toluene(1) + heptane (2) + [HMIM][HSO4] (3)} at T= 298.15 K and at atmospheric pressure. Solid lines indicate experimental tie-lines and dashed lines indicate data from NRTL model.
Toluene
Heptane IL
88
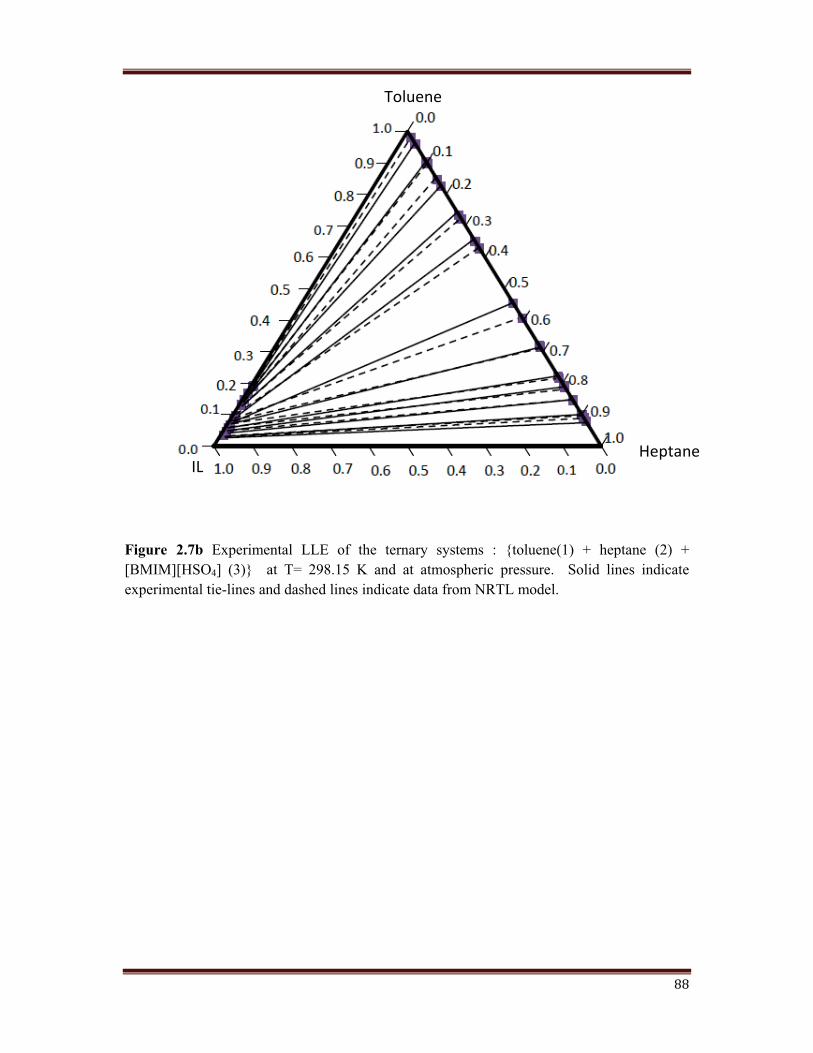
Figure 2.7b Experimental LLE of the ternary systems : {toluene(1) + heptane (2) + [BMIM][HSO4] (3)} at T= 298.15 K and at atmospheric pressure. Solid lines indicate experimental tie-lines and dashed lines indicate data from NRTL model.
Toluene
Heptane IL
89
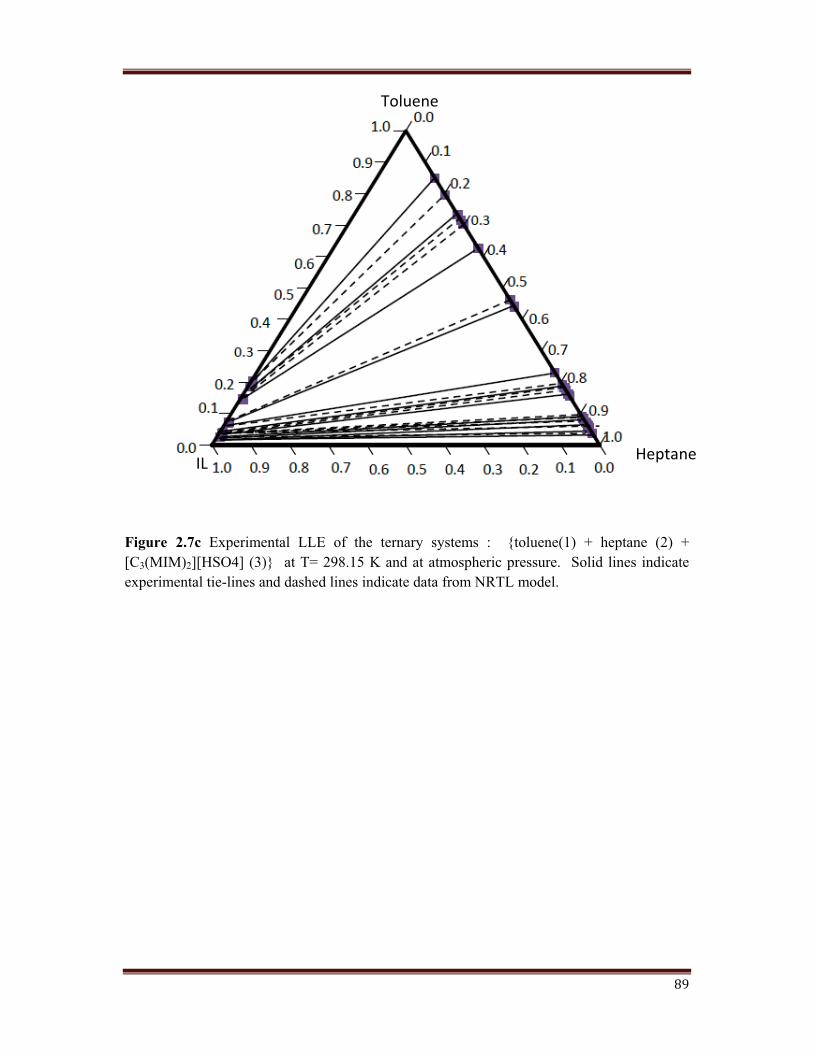
Figure 2.7c Experimental LLE of the ternary systems : {toluene(1) + heptane (2) + [C3(MIM)2][HSO4] (3)} at T= 298.15 K and at atmospheric pressure. Solid lines indicate experimental tie-lines and dashed lines indicate data from NRTL model.
Toluene
Heptane IL

90
Figure 2.7d Experimental LLE of the ternary systems : {toluene(1) + heptane (2) + [C6(MIM)2][HSO4][HSO4]} at T= 298.15 K and at atmospheric pressure. Solid lines indicate experimental tie-lines and dashed lines indicate data from NRTL model.
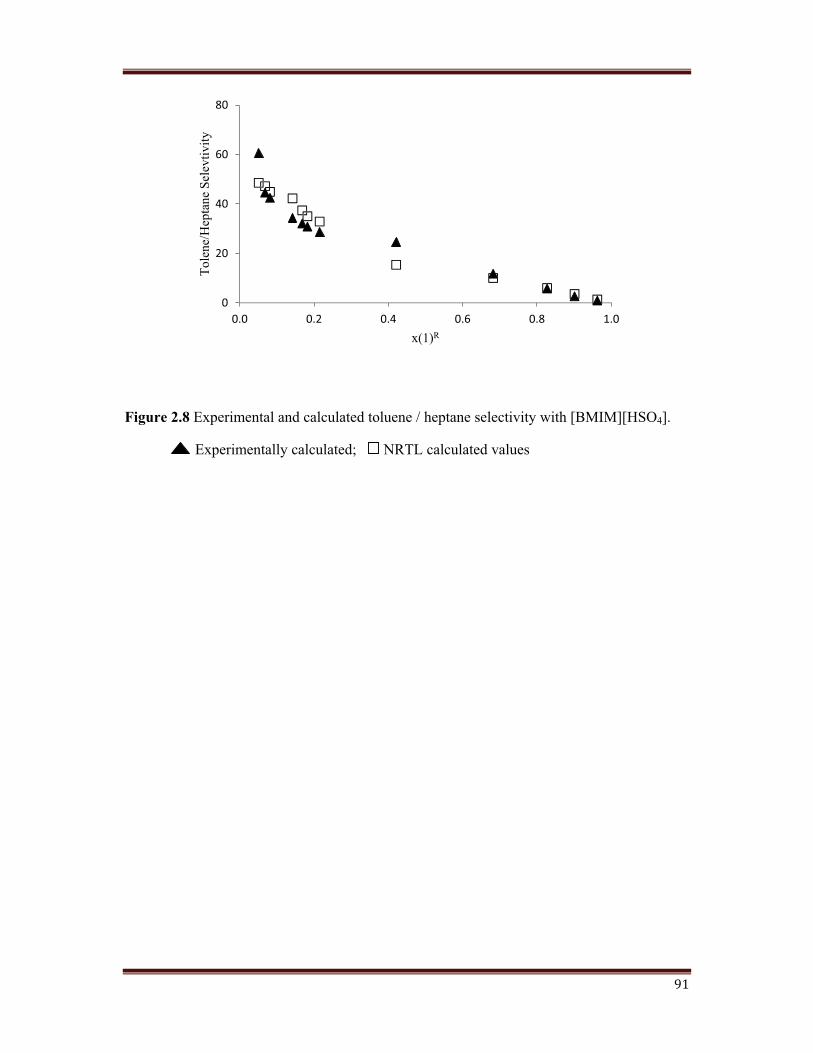
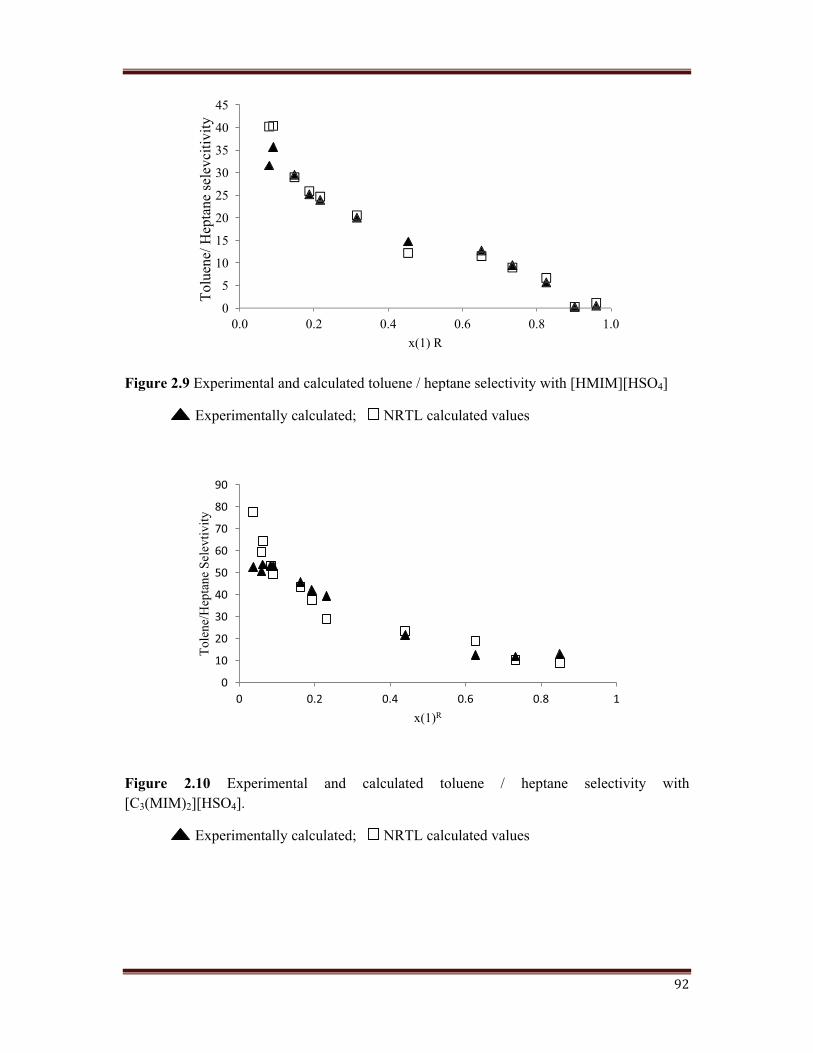
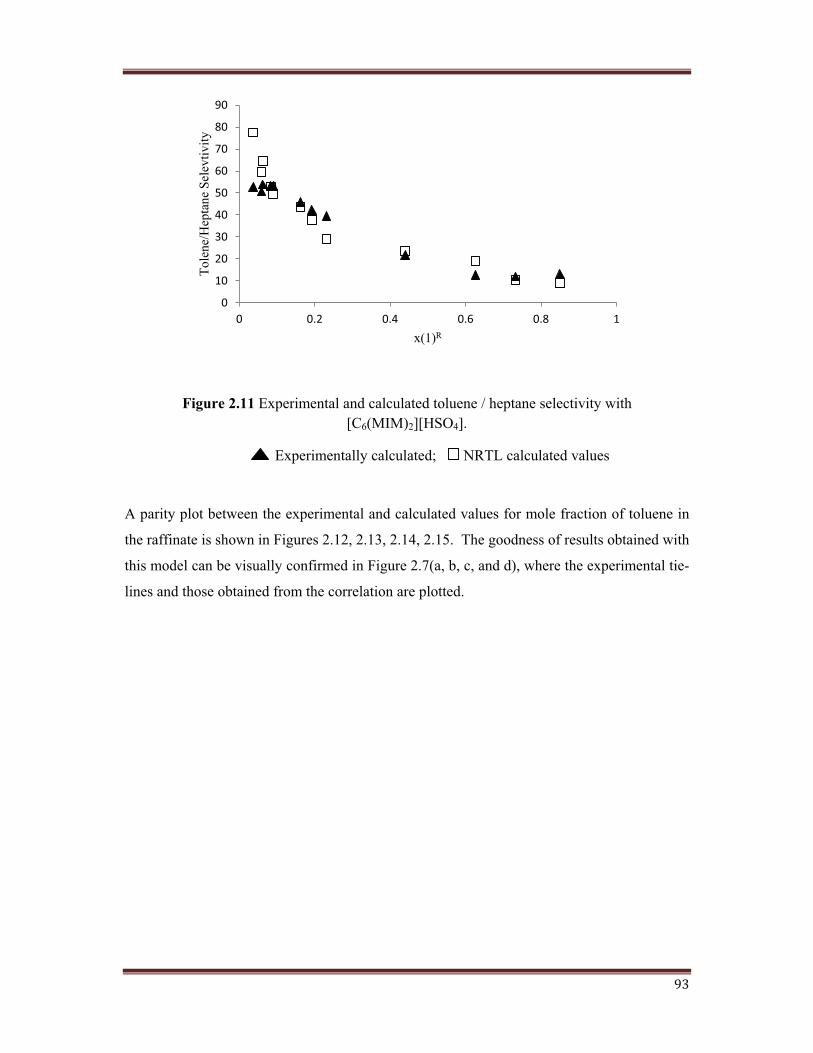
The selectivity of the ternary systems studied and calculated using NRTL model are plotted
in Figures 2.8, 2.9, 2.10, 2.11. For the ternary systems studied in this work, the selectivity
has found to decrease as the toluene concentration in the raffinate phase increased. This has
also being reported in published literature. Considering the type of ternary diagrams and that
small variation in the compositions has a great effect on selectivity, this parameter need to
have been interpreted as a range. It has being observed that the values of the selectivity for
the ternary systems containing monocation IL are good enough, while for the systems with
dicationic IL, the selectivity is clearly higher. The usual behaviour is that the selectivity
increases as the length of the alkyl chain present on imidazole ring increases in dicationic IL.
In any case, the selectivity values are higher than unity for all the studied systems, confirming
the extraction efficiency of the tested ionic liquid.
Toluene
Heptane IL
91
Figure 2.8 Experimental and calculated toluene / heptane selectivity with [BMIM][HSO4].
Experimentally calculated; NRTL calculated values
0
20
40
60
80
0.0 0.2 0.4 0.6 0.8 1.0
Tole
ne/H
epta
ne S
elev
tivity
x(1)R
92
Figure 2.9 Experimental and calculated toluene / heptane selectivity with [HMIM][HSO4]
Experimentally calculated; NRTL calculated values
Figure 2.10 Experimental and calculated toluene / heptane selectivity with [C3(MIM)2][HSO4].
Experimentally calculated; NRTL calculated values
0
5
10
15
20
25
30
35
40
45
0.0 0.2 0.4 0.6 0.8 1.0x(1) R
Tolu
ene/
Hep
tane
sele
vciti
vity
0
10
20
30
40
50
60
70
80
90
0 0.2 0.4 0.6 0.8 1
Tole
ne/H
epta
ne S
elev
tivity
x(1)R
93
Figure 2.11 Experimental and calculated toluene / heptane selectivity with[C6(MIM)2][HSO4].
Experimentally calculated; NRTL calculated values
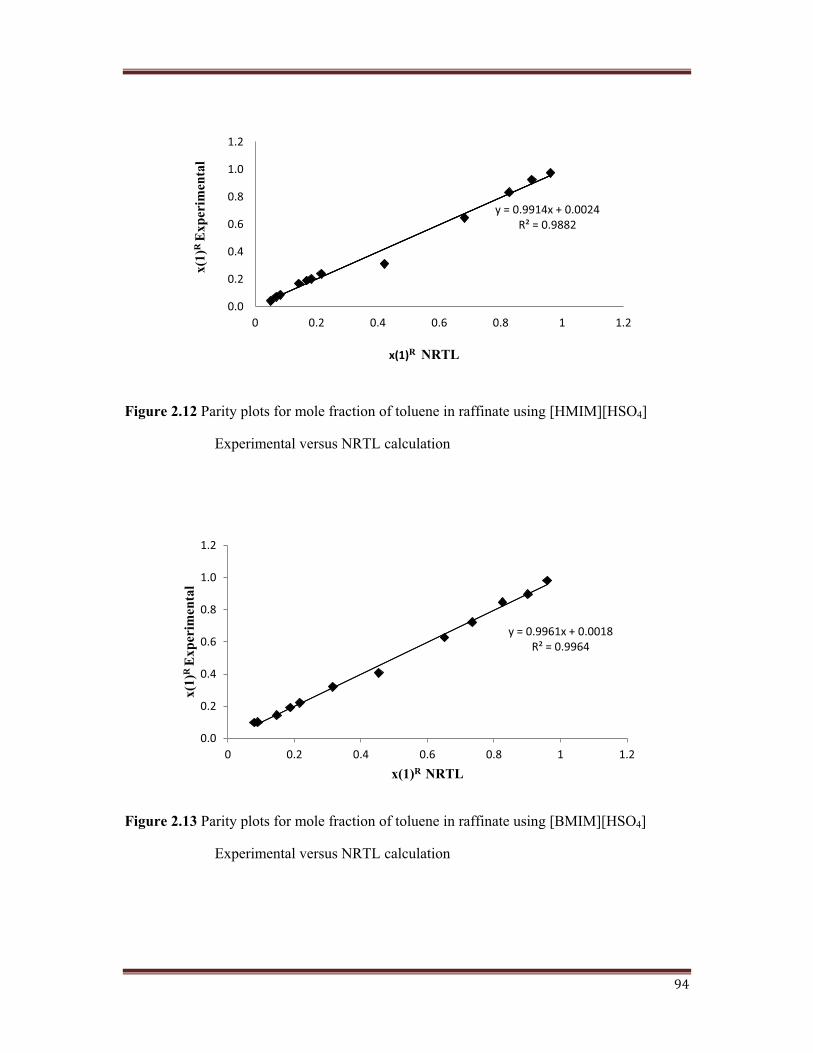
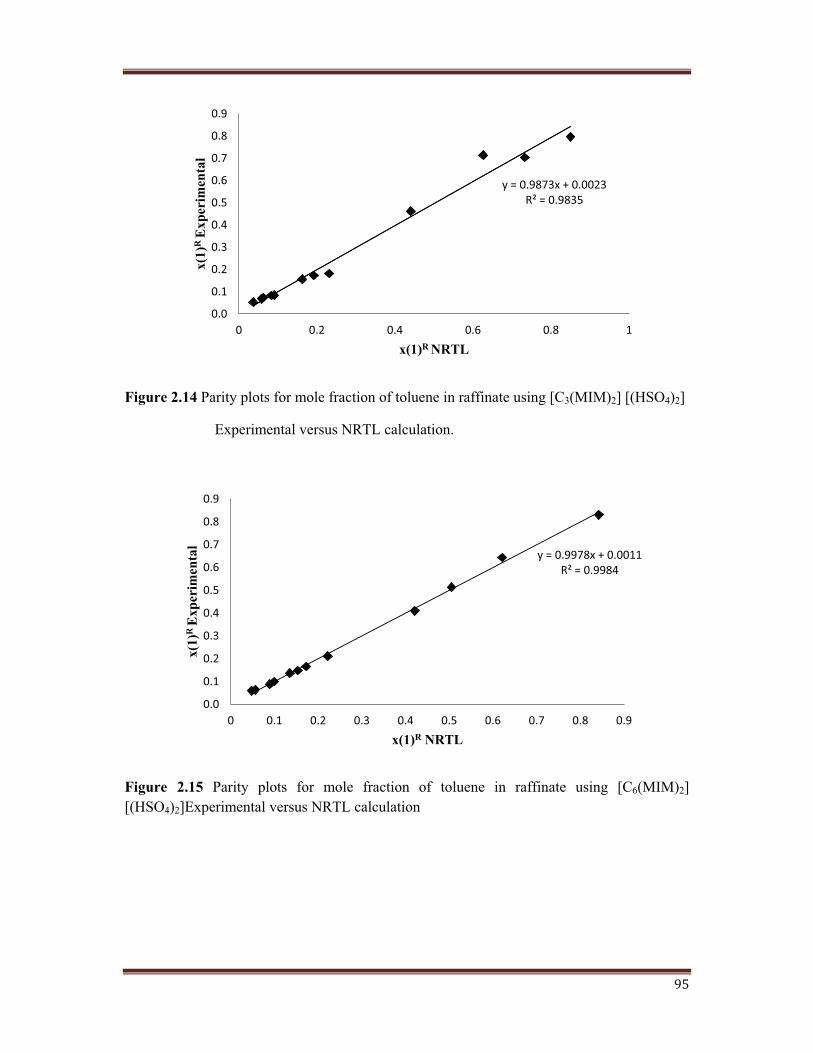
A parity plot between the experimental and calculated values for mole fraction of toluene in
the raffinate is shown in Figures 2.12, 2.13, 2.14, 2.15. The goodness of results obtained with
this model can be visually confirmed in Figure 2.7(a, b, c, and d), where the experimental tie-
lines and those obtained from the correlation are plotted.
0
10
20
30
40
50
60
70
80
90
0 0.2 0.4 0.6 0.8 1
Tole
ne/H
epta
ne S
elev
tivity
x(1)R
94
Figure 2.12 Parity plots for mole fraction of toluene in raffinate using [HMIM][HSO4]
Experimental versus NRTL calculation
Figure 2.13 Parity plots for mole fraction of toluene in raffinate using [BMIM][HSO4]
Experimental versus NRTL calculation
y = 0.9914x + 0.0024 R² = 0.9882
0.0
0.2
0.4
0.6
0.8
1.0
1.2
0 0.2 0.4 0.6 0.8 1 1.2
x(1)
RE
xper
imen
tal
x(1)R NRTL
y = 0.9961x + 0.0018 R² = 0.9964
0.0
0.2
0.4
0.6
0.8
1.0
1.2
0 0.2 0.4 0.6 0.8 1 1.2
x(1)
RE
xper
imen
tal
x(1)R NRTL
95
Figure 2.14 Parity plots for mole fraction of toluene in raffinate using [C3(MIM)2] [(HSO4)2]
Experimental versus NRTL calculation.
Figure 2.15 Parity plots for mole fraction of toluene in raffinate using [C6(MIM)2][(HSO4)2]Experimental versus NRTL calculation
y = 0.9873x + 0.0023 R² = 0.9835
0.0
0.1
0.2
0.3
0.4
0.5
0.6
0.7
0.8
0.9
0 0.2 0.4 0.6 0.8 1
x(1)
RE
xper
imen
tal
x(1)R NRTL
y = 0.9978x + 0.0011 R² = 0.9984
0.0
0.1
0.2
0.3
0.4
0.5
0.6
0.7
0.8
0.9
0 0.1 0.2 0.3 0.4 0.5 0.6 0.7 0.8 0.9
x(1)
RE
xper
imen
tal
x(1)R NRTL
96
2.8 Conclusions
From the experimental LLE data, the selectivity and solute distribution ratio were calculated.
The selectivity values found to be higher than unity for all the studied systems, confirming
that the studied ionic liquids can be good choices for extraction processes. Selectivity
increases as the size of the chain-length of alkane connecting the imidazole ring. With an
increase in chain length of IL, immiscibility zone increases for heptane, hence selectivity
increases. On the other hand, the chain-length of alkane has small influence on solute
distribution ratio, and the values of this parameter found to be lower than unity for all the
studied systems, which imply that higher quantities of ionic liquid are required. This should
not be considered as a disadvantage taking into account that IL can be recovered and reused.
The uniformity of the tie-lines was ascertained by correlating the experimental LLE data of
satisfactorily by the NRTL model.