Embed Size (px)
Citation preview

National Science Board | 2 | 1Science & Engineering Indicators 2018
Table of Contents
Highlights................................................................................................................................................................................. 2-4
Characteristics of the U.S. Higher Education System ....................................................................................................... 2-4Undergraduate Education, Enrollment, and Degrees ...................................................................................................... 2-5Graduate Education, Enrollment, and Degrees................................................................................................................. 2-6International S&E Higher Education................................................................................................................................... 2-8
Introduction............................................................................................................................................................................. 2-8
Chapter Overview ................................................................................................................................................................. 2-8Chapter Organization ........................................................................................................................................................... 2-9
The U.S. Higher Education System...................................................................................................................................... 2-10
Institutions Providing S&E Education ............................................................................................................................... 2-10Trends in Higher Education Expenditures and Revenues ............................................................................................. 2-27Financing Higher Education............................................................................................................................................... 2-35
Undergraduate Education, Enrollment, and Degrees in the United States .................................................................. 2-47
Undergraduate Enrollment in the United States ............................................................................................................ 2-47Undergraduate Degree Awards ........................................................................................................................................ 2-53
Graduate Education, Enrollment, and Degrees in the United States............................................................................. 2-61
Graduate Enrollment by Field............................................................................................................................................ 2-61S&E Master’s Degrees......................................................................................................................................................... 2-62S&E Doctoral Degrees ........................................................................................................................................................ 2-67
International S&E Higher Education................................................................................................................................... 2-86
Higher Education Expenditures ........................................................................................................................................ 2-86Educational Attainment ..................................................................................................................................................... 2-86First University Degrees in S&E Fields .............................................................................................................................. 2-88S&E First University Degrees by Sex ................................................................................................................................. 2-92International Comparison of S&E Doctoral Degrees ...................................................................................................... 2-92International Student Mobility ......................................................................................................................................... 2-95
Conclusion .......................................................................................................................................................................... 2-102
Glossary ............................................................................................................................................................................... 2-102
Definitions.......................................................................................................................................................................... 2-102Key to Acronyms and Abbreviations............................................................................................................................... 2-103
References .......................................................................................................................................................................... 2-104
List of Sidebars
Carnegie Classification of Academic Institutions ....................................................................................................................... 2-12Historically Black Colleges and Universities ............................................................................................................................... 2-14High-Hispanic-Enrollment Institutions: A Typology ................................................................................................................... 2-15Comparability of International Data in Tertiary Education....................................................................................................... 2-89
CHAPTER 2
Higher Education in Science and Engineering

National Science Board | 2 | 2Science & Engineering Indicators 2018
List of Tables
List of Figures
Degree-granting institutions, by control and level of institution: 2015–16.................................................... 2-10Table 2-1
Degree awards, by degree level and institutional control: 2015..................................................................... 2-11Table 2-2
Distribution of U.S. citizen and permanent resident S&E doctorate recipients whosebaccalaureate origin is a high-Hispanic-enrollment institution, by ethnicity and race: 2011–15 ............... 2-17
Table 2-3
U.S. citizen and permanent resident S&E doctorate recipients whose baccalaureate originis an HBCU, by ethnicity and race: 2011–15 ...................................................................................................... 2-18
Table 2-4
U.S. citizen and permanent resident S&E doctorate recipients who reported earning collegecredit from a community or 2-year college, by ethnicity and race: 2011–15................................................. 2-20
Table 2-5
Recent recipients of S&E degrees who attended community college, by sex, race andethnicity, citizenship status, and parents' education level: 2015 .................................................................... 2-22
Table 2-6
Enrollment in Title IV institutions, by distance education enrollment status, control,and level of institution: Fall 2015 ........................................................................................................................ 2-25
Table 2-7
Net tuition and fees for full-time undergraduate students by institutional control:2006–07 and 2011–12 through 2016–17............................................................................................................ 2-36
Table 2-8
Primary support mechanisms for S&E doctorate recipients, by 2010 Carnegie classificationof doctorate-granting institution: 2015.............................................................................................................. 2-42
Table 2-9
International students enrolled in U.S. higher education institutions, by broad fieldand academic level: 2012–17............................................................................................................................... 2-50
Table 2-10
Retention and attainment of postsecondary students at the first academic institutionattended through June 2014, by level of first institution and major field category: 2013–14 ..................... 2-52
Table 2-11
Major switching among first-time postsecondary students beginning 4-year colleges anduniversities in 2011–12: 2013–14 ........................................................................................................................ 2-53
Table 2-12
Median number of years from entering graduate school to receipt of S&E doctorate, by2010 Carnegie classification of doctorate-granting institution: 2000–15 ...................................................... 2-70
Table 2-13
Recipients of U.S. S&E doctorates on temporary visas, by country or economy of origin:1995–2015 ............................................................................................................................................................. 2-75
Table 2-14
Asian recipients of U.S. S&E doctorates on temporary visas, by field and country oreconomy of origin: 1995–2015............................................................................................................................ 2-77
Table 2-15
European recipients of U.S. S&E doctorates on temporary visas, by field and region orcountry of origin: 1995–2015............................................................................................................................... 2-79
Table 2-16
North American, South American, and Middle Eastern recipients of U.S. S&E doctorates ontemporary visas, by field and region and country of origin: 1995–2015........................................................ 2-83
Table 2-17
Selected average revenues and expenditures per FTE at public very high researchuniversities: 2000–15............................................................................................................................................ 2-28
Figure 2-1
Average expenditures per FTE on research at public and private very high researchuniversities: 2000–15............................................................................................................................................ 2-30
Figure 2-2
Average expenditures per FTE on instruction at public and private very high researchuniversities: 2000–15............................................................................................................................................ 2-31
Figure 2-3
Selected average revenues and expenditures at public 4-year and other postsecondaryinstitutions: 2000–15 ............................................................................................................................................ 2-32
Figure 2-4
Selected average revenues and expenditures per FTE at community colleges: 2000–15 ........................... 2-34Figure 2-5
Full-time S&E graduate students, by source of primary support: 2000–15 ................................................... 2-38Figure 2-6

National Science Board | 2 | 3Science & Engineering Indicators 2018
Full-time S&E graduate students with primary support from federal government, by field:2015........................................................................................................................................................................ 2-39
Figure 2-7
Full-time S&E graduate students, by field and mechanism of primary support: 2015 ................................ 2-40Figure 2-8
Share of full-time undergraduate enrollment among U.S. citizens and permanent residents,by race and ethnicity: 2000–15............................................................................................................................ 2-48
Figure 2-9
S&E bachelor’s degrees, by field: 2000–15......................................................................................................... 2-55Figure 2-10
Women's share of S&E bachelor's degrees, by field: 2000–15 ........................................................................ 2-56Figure 2-11
Share of S&E bachelor’s degrees among U.S. citizens and permanent residents, by race andethnicity: 2000–15 ................................................................................................................................................. 2-58
Figure 2-12
S&E master's degrees, by field: 2000–15 ........................................................................................................... 2-63Figure 2-13
S&E master’s degrees, by sex of recipient: 2000–15......................................................................................... 2-64Figure 2-14
S&E master’s degrees, by race, ethnicity, and citizenship: 2000–15 ............................................................... 2-66Figure 2-15
S&E doctoral degrees earned in U.S. universities, by field: 2000–15.............................................................. 2-68Figure 2-16
S&E doctoral degrees earned by U.S. citizen and permanent resident underrepresentedminorities, by race and ethnicity: 2000–15 ........................................................................................................ 2-72
Figure 2-17
S&E doctoral degrees, by race, ethnicity, and citizenship: 2000–15 ............................................................... 2-73Figure 2-18
U.S. S&E doctoral degree recipients, by selected Asian country or economy of origin:1995–2015 ............................................................................................................................................................. 2-78
Figure 2-19
U.S. S&E doctoral degree recipients, by selected European country: 1995–2015......................................... 2-80Figure 2-20
U.S. S&E doctoral degree recipients from Europe, by region: 1995–2015 ..................................................... 2-81Figure 2-21
U.S. S&E doctoral degree recipients from Canada, Mexico, and Brazil: 1995–2015 ..................................... 2-82Figure 2-22
Attainment of bachelor's or higher degrees, by country and age group: 2015 ............................................ 2-87Figure 2-23
First university natural sciences and engineering degrees, by selected country oreconomy: 2000–14................................................................................................................................................ 2-91
Figure 2-24
Natural sciences and engineering doctoral degrees, by selected country: 2000–14 ................................... 2-94Figure 2-25
Internationally mobile students enrolled in tertiary education, by selected country:2014........................................................................................................................................................................ 2-98
Figure 2-26
National Science Board | 2 | 4
CHAPTER 2 | Higher Education in Science and Engineering
Science & Engineering Indicators 2018
Highlights
Characteristics of the U.S. Higher Education System
A disproportionate number of S&E bachelor’s, master’s, and doctorate degree holders graduate from a small number of
universities with very high levels of research activity. But other types of institutions are making substantial contributions
to educating the nation’s S&E graduates. In 2015:
• Institutions with very high research activity awarded 72% of doctoral degrees, 42% of master’s degrees, and 37% of bachelor’s degrees in S&E fields.
• Master’s-level colleges and universities awarded 28% of S&E bachelor’s degrees and 25% of S&E master’s degrees; 4-year colleges supplied the rest.
• Minority-serving institutions play an important role in underrepresented minorities’ educational and career pathways. About 30% of Hispanic S&E doctorate recipients who earned their doctorates between 2011 and 2015 had obtained their baccalaureate credential at a high-Hispanic-enrollment institution, and 24% of black S&E doctorate recipients who received their doctorates in the same period had obtained their baccalaureate degree at a historically black college or university.
• Nearly one in five U.S. citizens or permanent residents who received an S&E doctoral degree from 2011 to 2015 had earned some college credit from a community or 2-year college.
Higher education spending and revenue patterns and trends continue to undergo substantial changes with a higher
share of total costs borne by students and parents.
• Between 2000 and 2015, average revenue per full-time equivalent (FTE) student from net tuition at public very high research universities nearly doubled, whereas state and local appropriations fell by 34%.
• Although tuition remained lower at public very high research universities than at their private counterparts, average revenue from student tuition increased more rapidly at public institutions.
• In public very high research universities, revenues from federal appropriations, grants, and contracts per FTE student grew by 11% between 2000 and 2015, and research expenditures per FTE student grew by the same percentage (11%). In private very high research universities, revenues from federal appropriations, grants, and contracts per FTE student grew by 14%, and research expenditures per FTE student increased by 25%.
• Between 2008 and 2010, during a period largely coinciding with the economic recession, expanding enrollment in community colleges, coupled with reductions in state and local appropriations, contributed to a 9% reduction in instructional spending per FTE student. Instructional spending per FTE student continued to decline in 2011 but increased by 14% between 2012 and 2015, while enrollment declined as the U.S. economy improved.
Between 2006–07 and 2016–17, estimated average net tuition and fees paid by full-time undergraduate students in
public 4-year colleges increased by about 30% after adjusting for inflation.
• With rising tuition, students rely on financial aid and loans to fund their education. Undergraduate debt varies by type of institution and state. Overall, it does not vary much by field of study.
• Levels of debt among doctorate recipients vary by field. In S&E fields, high levels of graduate debt were most common among doctorate recipients in social sciences, psychology, and medical and other health sciences.

National Science Board | 2 | 5
CHAPTER 2 | Higher Education in Science and Engineering
Science & Engineering Indicators 2018
• At the time of doctoral degree conferral, 43% of 2015 S&E doctorate recipients had debt related to their undergraduate or graduate education.
Undergraduate Education, Enrollment, and Degrees
Undergraduate enrollment in U.S. higher education rose from 13.3 million in 2000 to 17.3 million in 2015. The largest
increases occurred in 2000–02 and 2008–10 and thus coincided with the two economic downturns, continuing a well-
established pattern seen in earlier economic downturns. Enrollment peaked at 18.3 million in 2010 but has since
declined.
• Associate’s colleges enroll the largest number of students, followed by master’s colleges and universities and doctorate-granting institutions with very high research activity.
• Increased enrollment in higher education is projected to come mainly from minority groups, particularly Hispanics.
The number of S&E associate’s degrees increased from 38,000 to 91,000 between 2000 and 2015. During this period, the
growth of S&E degrees at the associate’s level (136%) was higher than growth at the bachelor’s (63%), master’s (88%), and
doctoral levels (60%).
• In 2015, about 9% of the associate’s degrees awarded were in S&E, and another 14% were awarded in S&E technologies.
• Since 2000, the number of associate’s degrees in S&E technologies, which have a more applied focus, grew by 72%, to 144,000. Nearly three-quarters of these associate’s degrees are in health technologies, and close to one-quarter are in engineering technologies.
The number of S&E bachelor’s degrees has risen steadily in the United States over the past 15 years, peaking at more
than 650,000 in 2015. S&E degrees continued to account for about one-third of all bachelor’s degree awards during this
period.
• All S&E fields experienced increases in the numbers of bachelor’s degrees awarded in 2015, including computer sciences, which had declined sharply in the mid-2000s and had remained flat through 2009.
• Women have earned about 57% of all bachelor’s degrees and about half of all S&E bachelor’s degrees since the late 1990s. Men earn the majority of bachelor’s degrees in engineering, computer sciences, mathematics and statistics, and physics, and women earn the majority in the biological, agricultural, and social sciences and in psychology.
The racial and ethnic composition of those earning S&E bachelor’s degrees is changing, reflecting population changes
and increases in college attendance among members of minority groups.
• For all racial and ethnic groups, the total number of bachelor’s degrees earned, the number of S&E bachelor’s degrees earned, and the number of bachelor’s degrees in most broad S&E fields have increased since 2000.
• Between 2000 and 2015, the share of bachelor’s degrees awarded to Hispanics among U.S. citizens and permanent residents increased from 7% to 13%, in S&E and in all fields combined, and remained steady at about 1% for American Indians and Alaska Natives. In the same period, the share of bachelor’s degrees awarded to blacks remained stable at 9% in S&E fields but increased from 9% to 10% in all fields.

National Science Board | 2 | 6
CHAPTER 2 | Higher Education in Science and Engineering
Science & Engineering Indicators 2018
The number of international undergraduate student enrollment in U.S. academic institutions increased consistently
between fall 2012 and fall 2016 but fell 2% between fall 2016 and fall 2017.
• The decline in international undergraduate enrollment between 2016 and 2017 is due solely to a decline in enrollment in non-S&E fields—enrollment in S&E fields held steady over this time.
• In the most recent academic year, the number of international visa holders increased in computer sciences and mathematics (by 11% and 5% respectively) but declined in engineering (5%), social sciences (3%), and non-S&E fields (4%).
• In fall 2017, China, Saudi Arabia, India, South Korea, and Kuwait were the top countries sending S&E undergraduates to the United States, as in the previous year. Compared to fall 2016, the number of undergraduates from China, India, and Kuwait enrolled in fall 2017 declined (by 3%, 11%, and 4% respectively) while the number from Saudi Arabia and South Korea declined (by 18% and 7% respectively).
Among students who began postsecondary education in 4-year colleges and universities in 2011–12, about 76% were still
enrolled 3 years later, either at their first institution or at another and 6% had earned either an associate’s or a
bachelor’s degree.
• Among students in 4-year institutions, those who had declared an S&E major were more likely to be enrolled 3 years later than those who had declared a non-S&E major.
• Among students in 2-year institutions, the level of degree attainment or continued enrollment did not vary much by the broad field of major that beginning students had declared in their first year of postsecondary study. However, students who had been undecided about their major early on were more likely than other students to have dropped out 3 years later.
Graduate Education, Enrollment, and Degrees
Graduate enrollment in S&E increased from about 493,000 to almost 668,000 between 2000 and 2015.
• Graduate enrollment grew in most S&E fields, with particularly strong growth in computer sciences, mathematics and statistics, medical sciences, and engineering.
• Since 2008, enrollment of international students in S&E fields has been rising, while graduate enrollment of U.S. citizens and permanent residents has declined overall. In 2015, international students accounted for 36% of S&E graduate students, compared with 26% in 2008.
In 2015, the federal government was the primary source of financial support for 15% of full-time S&E graduate students,
the lowest proportion since at least 2000.
• The recent decline in the share of S&E graduate students who rely primarily on federal financial support was especially pronounced in the biological sciences (from 36% in 2000 to 26% in 2015), the physical sciences (from 35% in 2000 to 27% in 2015), and the medical sciences (from 22% in 2000 to 9% in 2015).
• In 2015, the federal government funded 55% of S&E graduate students who were primarily supported with traineeships, 45% of those with research assistantships, and 22% of those with fellowships.
• Graduate students in the biological sciences, the physical sciences, and engineering received relatively more federal financial support than those in computer sciences, mathematics and statistics, medical and other health sciences, psychology, and social sciences.

National Science Board | 2 | 7
CHAPTER 2 | Higher Education in Science and Engineering
Science & Engineering Indicators 2018
The number of international graduate students in U.S. academic institutions had increased consistently between fall
2012 and fall 2016 but declined by 6% in S&E fields and by 5% in non-S&E fields by fall 2017.
• Between fall 2016 and fall 2017, the number of international graduate students enrolled in S&E fields declined in computer sciences and engineering, increased in mathematics, and remained stable in other S&E fields.
• A larger proportion of international graduate students than international undergraduate students enrolled in S&E. More than 6 in 10 international graduate students in the United States in fall 2017 were enrolled in S&E fields, compared with about 4 in 10 international undergraduates.
• In fall 2017, 69% of the international S&E graduate students in the United States came from China and India, similar to prior years.
Master’s degrees awarded in S&E fields increased from about 96,000 in 2000 to more than 180,000 in 2015.
• The number of master’s degrees awarded in engineering in 2015 was the highest in the last 16 years. The number of master’s degrees in computer sciences awarded in 2015 surpassed its peak in 2004.
• Increases occurred in most major S&E fields, with the largest in mathematics and statistics, biological sciences, computer sciences, and engineering.
• The number and percentage of master’s degrees awarded to women in most major S&E fields have increased since 2000.
• The number of S&E master’s degrees awarded increased for all racial and ethnic groups from 2000 to 2015. While the proportion of degrees earned by blacks and Hispanics increased, that of American Indians or Alaska Natives remained flat, and those of whites and Asians and Pacific Islanders declined.
In 2015, U.S. academic institutions awarded about 45,000 S&E doctorates, up from nearly 28,000 in 2000.
• The number of S&E doctorates conferred annually by U.S. universities increased among U.S. citizens and permanent residents and among temporary visa holders.
• Among fields that award large numbers of doctorates, the largest increases in degrees awarded between 2000 and 2015 were in engineering and in computer sciences.
Students on temporary visas continue to earn high proportions of U.S. S&E doctorates, including the majority of degrees
in some fields. They also earned large shares of the master’s degrees in S&E fields. In contrast, they earn smaller shares
of undergraduate S&E degrees.
• In 2015, international students earned more than half of the doctoral degrees awarded in engineering, economics, computer sciences, and mathematics and statistics. Their overall share of S&E degrees was 34%.
• The number of temporary visa holders earning S&E doctoral degrees grew consistently between 2011 and 2014 but remained flat in 2015.
• Students on temporary visas earned 2% of the associate’s and 5% of the bachelor’s degree in S&E fields in 2015.

National Science Board | 2 | 8
CHAPTER 2 | Higher Education in Science and Engineering
Science & Engineering Indicators 2018
International S&E Higher Education
In 2014, more than 7.5 million first university degrees, broadly equivalent to a bachelor’s degree, were awarded in S&E
worldwide. Students in India earned about 25% of those degrees, those in China earned about 22%, those in the
European Union earned about 12%, and those in the United States earned about 10%.
• S&E degrees continue to account for about one-third of all bachelor’s degrees awarded in the United States. In Japan, more than half of the first university degrees were awarded in S&E fields in 2014; in China, nearly half.
• In the United States, about 6% of all bachelor’s degrees awarded in 2014 were in engineering. This compares with about 18% throughout Asia and 33% in China.
In 2014, the United States awarded the largest number of S&E doctoral degrees of any individual country, followed by
China, Russia, Germany, the United Kingdom, and India.
• The numbers of S&E doctoral degrees awarded in China and the United States have risen substantially in recent years. S&E doctorates awarded in South Korea and in many European countries have risen more modestly. S&E doctorates awarded in Japan increased fairly steadily through 2006 but have declined since then.
• As a result of large government investments in higher education, in 2007 China overtook the United States as the world leader in the number of doctoral degrees awarded in the natural sciences and engineering (which includes agricultural, biological, and physical sciences, mathematics and statistics, and computer sciences and excludes social and behavioral sciences). Since 2010, this number in China has risen more slowly.
International student mobility expanded over the past two decades as countries increasingly compete for international
students.
• The United States remains the destination for the largest number of internationally mobile undergraduate and graduate students worldwide, although its share decreased from 25% in 2000 to 19% in 2014.
• Other top destinations for international students include the United Kingdom, Australia, France, and Germany.
Introduction
Chapter Overview
This chapter focuses on the development of human capital in S&E through higher education. Postsecondary education
provides the advanced skills needed for an educated citizenry, a competitive workforce, and—in the case of graduate-level
S&E education—the research capability necessary for innovation.
Indicators presented in this chapter are discussed in the context of national and global developments, including changing
demographics, increasing international student mobility, and increasing global competition in higher education. The
composition of the U.S. college-age population is becoming more diverse as the Asian and Hispanic shares of the population
increase. During the latest economic downturn, public institutions of higher education faced unique pressures from a
combination of increasing enrollments and tight state budgets. Private institutions likewise experienced financial challenges
stemming from declining incomes and the effects of stock market fluctuations on endowment growth. Technology has
enabled rapid growth in the delivery of online courses; the consequences of these changes are not well understood.

National Science Board | 2 | 9
CHAPTER 2 | Higher Education in Science and Engineering
Science & Engineering Indicators 2018
Over the past decade and a half, governments around the globe have increasingly regarded higher education as an
essential national resource. Although the United States has historically been a world leader in providing broad access to
higher education and in attracting international students, many other countries are providing expanded educational access to
their own populations and are attracting growing numbers of international students. Nevertheless, in recent years, increases
in international students contributed to most of the growth in overall S&E graduate enrollment in the United States. After a
decline in the number of international students coming to the United States after 11 September 2001, international student
enrollment in S&E had recovered, but in the last year their numbers have dropped once again.
Chapter Organization
This chapter begins with an overview of the characteristics of U.S. higher education institutions that provide instruction in
S&E, followed by a discussion of characteristics of U.S. undergraduate and graduate education.[1] Trends are discussed by field and demographic group, with attention to the flow of international students into the United States by country of origin.
Various international higher education indicators include comparative S&E degree production in several world regions and
measures of the growing dependence of industrialized countries on international S&E students.
The chapter draws on a variety of federal and nonfederal sources, primarily surveys conducted by the National Center for
Science and Engineering (NCSES) within the National Science Foundation (NSF) and by the National Center for Education
Statistics (NCES) at the Department of Education. International data come from the Organisation for Economic Co-operation
and Development (OECD); the United Nations Educational, Scientific and Cultural Organization (UNESCO) Institute for Statistics
(UIS); and individual country sources. Most of the data in this chapter are from censuses of the relevant population—for
example, all students receiving degrees from U.S. academic institutions—and are not subject to sampling variability.
[1] For data on postdoctoral scientists and engineers see Chapter 3 and Chapter 5. For data on stay rates of doctorate recipients see Chapter 3.

National Science Board | 2 | 10
CHAPTER 2 | Higher Education in Science and Engineering
Science & Engineering Indicators 2018
The U.S. Higher Education System
This section discusses the characteristics of U.S. higher education institutions that provide S&E education and various
aspects of and trends in their finances.
Institutions Providing S&E Education
The U.S. higher education system consists of many diverse academic institutions that vary in their missions, learning
environments, selectivity levels, religious affiliations, types of students served, types of degrees offered, sectors (public, private
nonprofit, or private for-profit), and costs (Kena et al. 2016). During the 2015–16 academic year, there were approximately
4,600 postsecondary degree-granting institutions in the United States; about two-thirds (66%) of these offered 4-year or higher
degrees, and the remainder offered 2-year degrees ( Table 2-1). More than half of the 4-year institutions are private
nonprofit, 24% are public, and 23% are private for-profit. Most 2-year institutions are public (58%), but a large proportion
(36%) are private for-profit ( Table 2-1).
Degree-granting institutions, by control and level of institution: 2015–16
(Number)
Highest degree awarded All degree-granting institutions Public Private nonprofit Private for-profit
Total 4,583 1,620 1,701 1,262
2-year 1,579 910 107 562
4-year 3,004 710 1,594 700
Source(s)
National Center for Education Statistics, Integrated Postsecondary Education Data System (IPEDS), Institutional Characteristics
component, 2015–16.
Science and Engineering Indicators 2018
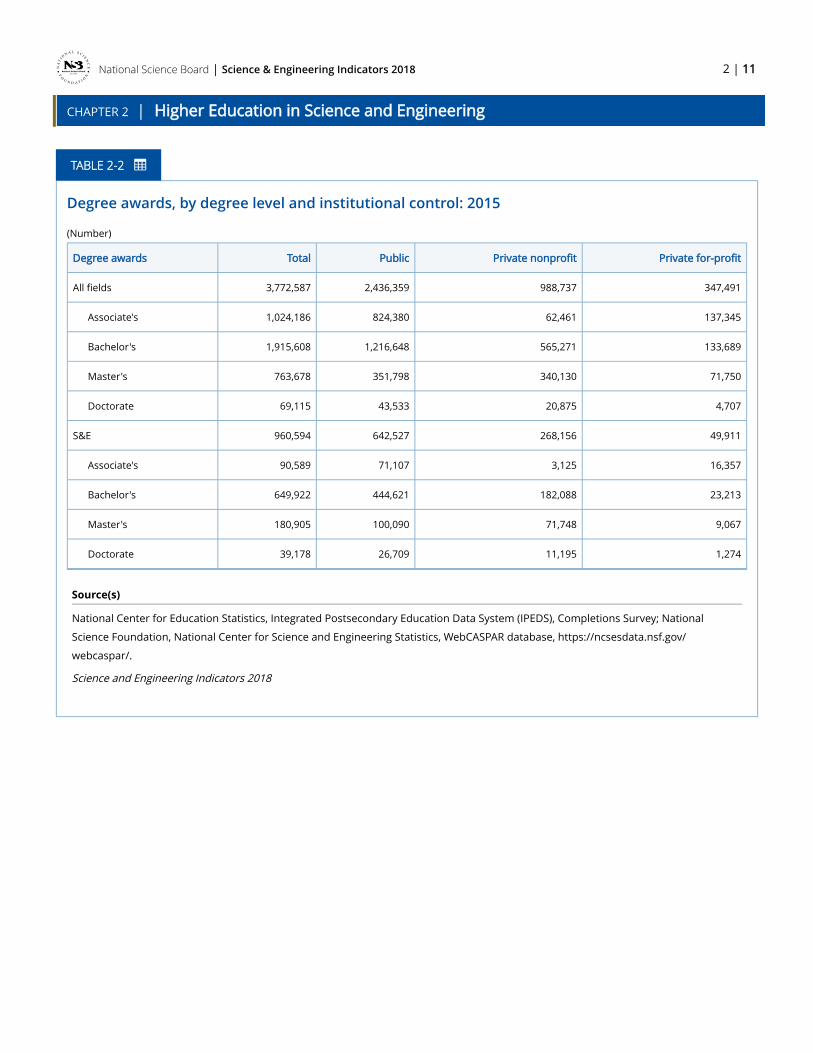
In 2015, U.S. academic institutions awarded nearly 3.8 million associate’s, bachelor’s, master’s, and doctoral degrees, 25%
of them in S&E fields (Appendix Table 2-1).[1] Public institutions produced the bulk of S&E and non-S&E degrees ( Table 2-2).
For example, public institutions awarded nearly 70% of S&E bachelor’s and doctoral degrees and 55% of S&E master’s degrees.
Although relatively few (97), doctorate-granting institutions with very high research activity—public and private—are the
leading producers of S&E degrees: these research institutions awarded 72% of doctoral degrees, 42% of master’s degrees, and
37% of bachelor’s degrees in S&E fields in 2015 (Appendix Table 2-1) (see sidebar Carnegie Classification of Academic
Institutions). Master’s colleges and universities awarded another 28% of S&E bachelor’s degrees and 25% of S&E master’s
degrees in 2015.
TABLE 2-1
National Science Board | 2 | 11
CHAPTER 2 | Higher Education in Science and Engineering
Science & Engineering Indicators 2018
Degree awards, by degree level and institutional control: 2015
(Number)
Degree awards Total Public Private nonprofit Private for-profit
All fields 3,772,587 2,436,359 988,737 347,491
Associate's 1,024,186 824,380 62,461 137,345
Bachelor's 1,915,608 1,216,648 565,271 133,689
Master's 763,678 351,798 340,130 71,750
Doctorate 69,115 43,533 20,875 4,707
S&E 960,594 642,527 268,156 49,911
Associate's 90,589 71,107 3,125 16,357
Bachelor's 649,922 444,621 182,088 23,213
Master's 180,905 100,090 71,748 9,067
Doctorate 39,178 26,709 11,195 1,274
Source(s)
National Center for Education Statistics, Integrated Postsecondary Education Data System (IPEDS), Completions Survey; National
Science Foundation, National Center for Science and Engineering Statistics, WebCASPAR database, https://ncsesdata.nsf.gov/
webcaspar/.
Science and Engineering Indicators 2018
TABLE 2-2

National Science Board | 2 | 12
CHAPTER 2 | Higher Education in Science and Engineering
Science & Engineering Indicators 2018
Carnegie Classification of Academic InstitutionsThe Carnegie Classification of Institutions of Higher Education is widely used in higher education research to characterize
and control for differences in academic institutions.
The 2010 classification update retains the structure adopted in 2005 and classified about 4,200 institutions. More than
three-quarters of the institutions added in that update (77%) were from the private for-profit sector, 19% were from the
private nonprofit sector, and 4% were from the public sector.
The Carnegie classification categorizes academic institutions primarily on the basis of highest degree conferred, level of
degree production, and research activity.* In this report, several Carnegie categories have been aggregated for statistical
purposes. The characteristics of those aggregated groups are as follows:
• Doctorate-granting universities include institutions that award at least 20 doctoral degrees per year. They include three subgroups based on level of research activity: very high research activity (97 institutions), high research activity (103 institutions), and doctoral/research universities (82 institutions). Because doctorate-granting institutions with very high research activity are central to S&E education and research, data on these institutions are reported separately.
• Master’s colleges and universities include the 652 institutions that award at least 50 master’s degrees and fewer than 20 doctoral degrees per year.
• Baccalaureate colleges include the 749 institutions at which baccalaureate degrees represent at least 10% of all undergraduate degrees and that award fewer than 50 master’s degrees or 20 doctoral degrees per year.
• Associate’s colleges include the 1,692 institutions at which all degrees awarded are associate’s degrees or at which bachelor’s degrees account for less than 10% of all undergraduate degrees.
• Special-focus institutions are the 744 institutions at which at least 75% of degrees are concentrated in a single field or a set of related fields (e.g., medical schools and medical centers, schools of engineering, schools of business and management).
• Tribal colleges are the 33 colleges and universities that are members of the American Indian Higher Education Consortium.
* Research activity is based on two indexes (aggregate level of research and per capita research activity) derived from a
principal components analysis of data on research and development expenditures, S&E research staff, and field of
doctoral degree. See http://carnegieclassifications.iu.edu/ for more information on the classification system and on the
methodology used in defining the categories.
Baccalaureate colleges were the source of relatively few S&E bachelor’s degrees (11%) (Appendix Table 2-1), but they
produce 13% of future S&E doctorate recipients (NSF/NCSES 2013). When adjusted by the number of bachelor’s degrees
awarded in all fields, the top 50 baccalaureate colleges as a group yield more future S&E doctorates per 100 bachelor’s
degrees awarded than all other types of institutions except very high research universities.[2]
SIDEBAR

National Science Board | 2 | 13
CHAPTER 2 | Higher Education in Science and Engineering
Science & Engineering Indicators 2018
Minority-serving Institutions
Minority-serving academic institutions (MSIs) can be defined by legislation or by the proportion of minority student
enrollment in them (Li 2007). Examples of MSIs established by legislation include historically black colleges or universities
(HBCUs, see sidebar Historically Black Colleges and Universities) and tribal colleges or universities[3] (TCUs). Given their
legal definition, the number of institutions in these groups cannot increase in number unless Congress acts to designate
additional institutions in those groups. In contrast, high-Hispanic-enrollment institutions[4] (HHEs, see sidebar High-
Hispanic-Enrollment Institutions: A Typology) are a type of MSI based on the percentage of minority student enrollment. The
number of institutions in these groups vary from year to year based on the enrollment of students in their respective minority
groups.[5]
MSIs enroll a substantial fraction of underrepresented minority undergraduates (NSF/NCSES 2017a). In 2015, HBCUs
awarded 16% of the 54,000 S&E bachelor’s degrees earned by black U.S. citizens and permanent residents, and HHEs awarded
about 34% of the 79,000 S&E bachelor’s degrees earned by Hispanics. The proportion of blacks earning S&E bachelor’s
degrees from HBCUs has been declining in recent years. The proportion of Hispanics earning S&E bachelor’s degrees from
HHEs declined through 2011 but has been stable at about 34% since then. Tribal colleges, which mainly offer 2-year degrees,
account for about 4% of the nearly 3,000 S&E bachelor’s degrees awarded to American Indians; this proportion has increased
slightly in the last 5 years.[6]
National Science Board | 2 | 14
CHAPTER 2 | Higher Education in Science and Engineering
Science & Engineering Indicators 2018
Historically Black Colleges and UniversitiesThe Higher Education Act of 1965, as amended, defines a historically black college or university (HBCU) as “any
historically black college or university that was established prior to 1964, whose principal mission was, and is, the
education of black Americans.” These institutions were established and developed in an environment of legal
segregation and greatly contributed to the progress of blacks by providing access to higher education (Hill, 1985). In
2015–16, there were 102 HBCUs in operation in 19 states, the District of Columbia, and the U.S. Virgin Islands. Half of
these institutions were public and half were private nonprofit institutions. The number of students enrolled at HBCUs
increased by 32% between 1976 and 2015 to about 293,000. In comparison, the number of students enrolled in degree-
granting institutions increased by 84%, to about 20 million during the same period (NCES 2017). In 2015, the majority of
HBCU students were enrolled in 4-year institutions (89%) and the remainder were enrolled in 2-year institutions. More
than three-quarters of HBCU students attended public institutions (75%) and 25% attended private nonprofit
institutions.*
Although HBCUs were originally established to educate black or African American students, they enroll a diverse student
body. In 2015, students who were not black or African American were 24% of total enrollment in HBCUs, up from 15% in
1976 (NCES 2017).†
* Special tabulation from the 2015 Fall Enrollment survey in https://ncsesdata.nsf.gov/webcaspar/.
† Special tabulation from the 2015 Fall Enrollment survey in https://ncsesdata.nsf.gov/webcaspar/.
SIDEBAR

National Science Board | 2 | 15
CHAPTER 2 | Higher Education in Science and Engineering
Science & Engineering Indicators 2018
High-Hispanic-Enrollment Institutions: A TypologyThe demographic composition of the United States has been changing. According to the latest Census Bureau
projections, the proportion of Hispanics between the ages of 20 and 24 is expected to grow from 22% in 2015 to 32% in
2060 (National Science Board 2016). Along these demographic trends, the number of colleges and universities serving
large numbers of Hispanic students has increased considerably.
High-Hispanic-enrollment institutions (HHEs) are degree-granting, nonprofit colleges and universities where full-time
equivalent undergraduate enrollment is at least 25% Hispanic students.* The number of HHEs has more than doubled
from 189 in 1994 to 432 in 2015, accounting now for 13% of all degree-granting public and private nonprofit institutions.
In addition, about 300 institutions enroll between 15% and 24% Hispanic students; these institutions are considered
“emerging HHEs.” In 2015, HHEs enrolled a total of 3.9 million students; nearly half of them were Hispanic, but more than
one-quarter were white, and nearly 1 in 10 was black. About 53% of the students enrolled in an HHE were attending part
time.
HHEs are diverse. In 2014, about half of them were 2-year institutions, half of them were 4-year institutions, and most
were public.
Núñez, Crisp, and Elizondo (2016) conducted an empirical analysis of HHEs with data from the Integrated Postsecondary
Education Data System (IPEDS), the Census Bureau, and the American Community Survey. The study was based on the
2008–09 IPEDS data because the data for that academic year contained the most complete information on HHEs. In
2008–09, the data included 268 accredited HHEs. Using cluster analysis, they classified HHEs into six somewhat
homogeneous groups as follows:
1. Urban enclave community colleges represented 37% of all HHEs and include public institutions that offer associate’s degrees and certificates as their highest degrees. The institutions in this group enroll large numbers of students, the vast majority of whom are in cities or suburbs, and more than half are in the West. More than two-thirds of the students were enrolled part time, and a similar proportion of the faculty worked part time.
2. Rural dispersed community colleges represented 13% of all HHEs. They also include public institutions offering associate’s degrees and certificates as their highest degrees; however, in this case, they were mostly in rural and isolated areas and had lower student enrollment than the community colleges in the first group. About two-thirds of them were in the South, particularly in the Southwest. About 65% of the students were enrolled part time, and 41% of their faculty worked part time.
3. Big system 4 years represented 21% of the HHEs and had the highest student enrollment of all the clusters. These institutions tended to be in a state public institution system (e.g., the California State University system, the City University of New York, the University of Texas System). The vast majority offered bachelor’s degrees or higher, and more than three-quarters were public. These institutions provide broad access to students, admitting a higher proportion of students than the other 4-year institutions in the groups below. The majority of students in these institutions were enrolled full time, and more than half of the faculty worked full time.
4. Small community 4 years were smaller than the others, representing 9% of HHEs. Nearly all of them were private and offered bachelor’s or higher degrees. They included some small liberal arts institutions and several religious ones. They were mostly in urban and suburban areas with high levels of educational attainment in the West and the
SIDEBAR

National Science Board | 2 | 16
CHAPTER 2 | Higher Education in Science and Engineering
Science & Engineering Indicators 2018
South. Compared with the previous clusters, this group included more selective institutions. This group also employed a lower proportion of Hispanic faculty members. Two-thirds of the students in these institutions were enrolled full time, and only 46% of the faculty worked full time.
5. Puerto Rican institutions represented 19% of all HHEs, and the vast majority were in cities and suburbs in Puerto Rico. More than two-thirds of these HHEs were private, and nearly 90% offered bachelor’s degrees or higher. Three-quarters of the students are enrolled full time; most of the faculty worked part-time.
6. Health sciences schools represented the only two HHEs focused on health sciences, the University of Texas Health Science Center and the University of Puerto Rico Medical School. These institutions had low enrollment, a higher proportion of female students, a higher proportion of full-time students and faculty, and selective admission requirements.
This classification shows the diversity of HHEs in terms of their geographic locations, faculty and student body, and
academic programs offered.
* Many researchers use the term “high-Hispanic enrollment” and “Hispanic-serving institution” (HSI) interchangeably.
HSIs meet the federally designated criterion (i.e., public and private nonprofit institutions whose undergraduate, full-time
equivalent student enrollment is at least 25% Hispanic) and are therefore eligible to apply for Hispanic-serving institution
status. Based on the Title V program under the Higher Education Act (also known as the “Developing Hispanic-Serving
Institutions Program”) these institutions are eligible for federal grants, contracts, or benefits to expand educational
opportunities and improve the educational attainment of Hispanic students. Because there is no information on whether
institutions apply for the HSI designation, NCSES uses the 25% enrollment criterion to determine which institutions have
high-Hispanic enrollment. For additional information, see https://www2.ed.gov/about/offices/list/ope/idues/
hsidivision.html, accessed 15 May 2017.
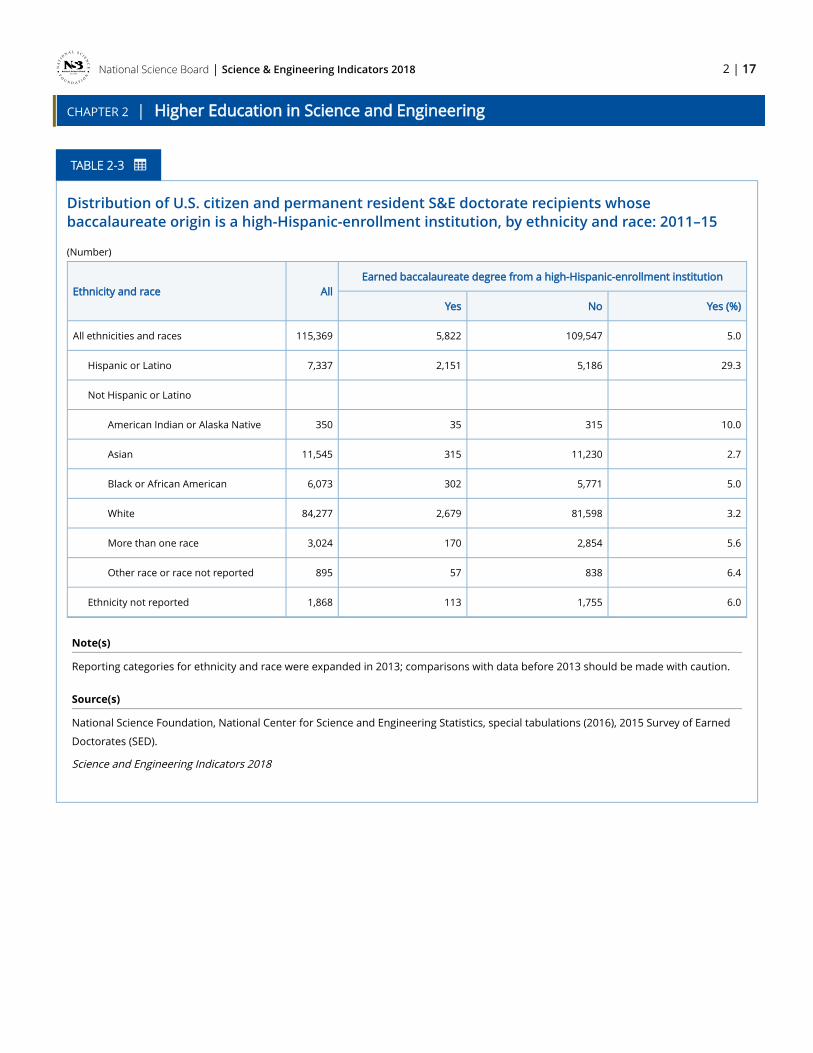
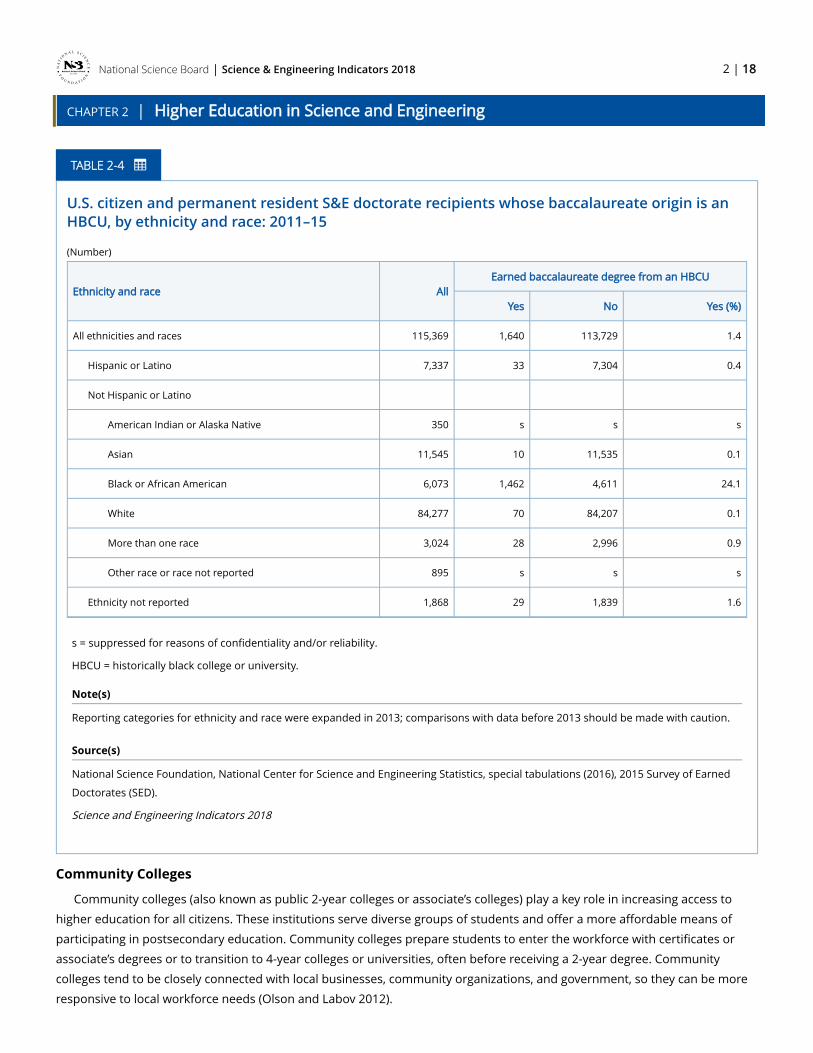
HHEs and HBCUs also play an important role in training Hispanic and black students for doctoral-level study in S&E fields.
Of Hispanics who earned an S&E doctorate between 2011 and 2015, nearly 30% had obtained their baccalaureate at an HHE
( Table 2-3). Similarly, 24% of black S&E doctorate recipients had an HBCU baccalaureate ( Table 2-4). HBCUs were the
second-largest contributor of black S&E doctorate recipients, behind only institutions with very high research activity (NSF/
NCSES 2013).
National Science Board | 2 | 17
CHAPTER 2 | Higher Education in Science and Engineering
Science & Engineering Indicators 2018
Distribution of U.S. citizen and permanent resident S&E doctorate recipients whose baccalaureate origin is a high-Hispanic-enrollment institution, by ethnicity and race: 2011–15
(Number)
Ethnicity and race AllEarned baccalaureate degree from a high-Hispanic-enrollment institution
Yes No Yes (%)
All ethnicities and races 115,369 5,822 109,547 5.0
Hispanic or Latino 7,337 2,151 5,186 29.3
Not Hispanic or Latino
American Indian or Alaska Native 350 35 315 10.0
Asian 11,545 315 11,230 2.7
Black or African American 6,073 302 5,771 5.0
White 84,277 2,679 81,598 3.2
More than one race 3,024 170 2,854 5.6
Other race or race not reported 895 57 838 6.4
Ethnicity not reported 1,868 113 1,755 6.0
Note(s)
Reporting categories for ethnicity and race were expanded in 2013; comparisons with data before 2013 should be made with caution.
Source(s)
National Science Foundation, National Center for Science and Engineering Statistics, special tabulations (2016), 2015 Survey of Earned
Doctorates (SED).
Science and Engineering Indicators 2018
TABLE 2-3
National Science Board | 2 | 18
CHAPTER 2 | Higher Education in Science and Engineering
Science & Engineering Indicators 2018
U.S. citizen and permanent resident S&E doctorate recipients whose baccalaureate origin is an HBCU, by ethnicity and race: 2011–15
(Number)
Ethnicity and race AllEarned baccalaureate degree from an HBCU
Yes No Yes (%)
All ethnicities and races 115,369 1,640 113,729 1.4
Hispanic or Latino 7,337 33 7,304 0.4
Not Hispanic or Latino
American Indian or Alaska Native 350 s s s
Asian 11,545 10 11,535 0.1
Black or African American 6,073 1,462 4,611 24.1
White 84,277 70 84,207 0.1
More than one race 3,024 28 2,996 0.9
Other race or race not reported 895 s s s
Ethnicity not reported 1,868 29 1,839 1.6
s = suppressed for reasons of confidentiality and/or reliability.
HBCU = historically black college or university.
Note(s)
Reporting categories for ethnicity and race were expanded in 2013; comparisons with data before 2013 should be made with caution.
Source(s)
National Science Foundation, National Center for Science and Engineering Statistics, special tabulations (2016), 2015 Survey of Earned
Doctorates (SED).
Science and Engineering Indicators 2018
Community Colleges
Community colleges (also known as public 2-year colleges or associate’s colleges) play a key role in increasing access to
higher education for all citizens. These institutions serve diverse groups of students and offer a more affordable means of
participating in postsecondary education. Community colleges prepare students to enter the workforce with certificates or
associate’s degrees or to transition to 4-year colleges or universities, often before receiving a 2-year degree. Community
colleges tend to be closely connected with local businesses, community organizations, and government, so they can be more
responsive to local workforce needs (Olson and Labov 2012).
TABLE 2-4

National Science Board | 2 | 19
CHAPTER 2 | Higher Education in Science and Engineering
Science & Engineering Indicators 2018
In the 2015–16 academic year, there were 910 community colleges in the United States, enrolling 6.2 million students, or
nearly one-third of all postsecondary students (NCES 2017). Most (62%) community college students enrolled part time.
Responding to the economic recession in the late 2000s, enrollment in community colleges peaked in 2010 at 7.2 million but
has declined with improving labor markets (Ginder and Kelly-Reid 2017; Ginder, Kelly-Reid, and Mann 2014; Knapp, Kelly-Reid,
and Ginder 2009, 2011).
Community colleges play a significant role in educating students who go on to acquire advanced S&E degrees. About 19%
of U.S. citizens and permanent residents with S&E doctoral degrees earned between 2011 and 2015 reported having some
college credit from a community or 2-year college ( Table 2-5). In fact, 47% of all recent S&E graduates had done some
coursework at a community college (in 2003, it was 48%, according to the National Survey of College Graduates).[7] Graduates in the biological and social sciences were more likely than those in the physical and computer sciences and in engineering to
have attended a community college.

National Science Board | 2 | 20
CHAPTER 2 | Higher Education in Science and Engineering
Science & Engineering Indicators 2018
U.S. citizen and permanent resident S&E doctorate recipients who reported earning college credit from a community or 2-year college, by ethnicity and race: 2011–15
(Number)
Ethnicity and race AllEarned college credit from a community or 2-year college
Yes No Yes (%)
All ethnicities and races 113,942 21,185 92,757 18.6
Hispanic or Latino 7,142 1,640 5,502 23.0
Not Hispanic or Latino
American Indian or Alaska Native 335 117 218 34.9
Asian 11,671 1,498 10,173 12.8
Black or African American 6,067 1,132 4,935 18.7
White 83,965 15,785 68,180 18.8
More than one race 3,035 657 2,378 21.6
Other race or race not reported 857 191 666 22.3
Ethnicity not reported 870 165 705 19.0
Note(s)
Includes only respondents to the community college question. Reporting categories for ethnicity and race were expanded in 2013;
comparisons with data before 2013 should be made with caution.
Source(s)
National Science Foundation, National Center for Science and Engineering Statistics, special tabulations (2016), 2015 Survey of Earned
Doctorates (SED).
Science and Engineering Indicators 2018
Female S&E bachelor’s and master’s degree recipients were more likely than males to have attended a community college
( Table 2-6). Attendance levels as measured by the proportion who took courses at a community college were highest among
U.S. citizens, followed by permanent visa holders, and were much lower among temporary visa holders. Among racial and
ethnic groups, attendance levels were highest among Hispanics and lowest among Asians. Attendance fell with rising parental
education level, illustrating the special access function of these institutions.
Recent S&E graduates (1.3 million) who took courses in community colleges (nearly 600,000) report doing so at different
points in their educational careers. Nearly half of them reported doing so after high school but before enrolling in a 4-year
college or university or while enrolled in college but before receiving a bachelor’s degree. About one in three used a
community college as a bridge between high school and college enrollment. One in five attended a community college after
TABLE 2-5

National Science Board | 2 | 21
CHAPTER 2 | Higher Education in Science and Engineering
Science & Engineering Indicators 2018
receiving their first bachelor’s degree. One in 10 reported taking courses at a community college after leaving a 4-year college
without receiving their first bachelor’s degree.[8]
Recent S&E graduates took courses at community colleges for various reasons. The most prevalent reason was to earn
credits toward a bachelor’s degree (30%), followed by preparation for college to increase the chance of acceptance at a 4-year
institution (17%), for financial reasons (14%), and to earn college credits while still attending high school (13%). Other reasons
mentioned included to complete an associate’s degree (6%); to gain further skills or knowledge in their academic or
occupational fields (6%); to facilitate a change in their academic or occupational fields (5%); for leisure or personal interest
(4%); to increase opportunities for promotion, advancement, or higher salary (3%); and for other reasons (4%).[9]

National Science Board | 2 | 22
CHAPTER 2 | Higher Education in Science and Engineering
Science & Engineering Indicators 2018
Recent recipients of S&E degrees who attended community college, by sex, race and ethnicity, citizenship status, and parents' education level: 2015
(Number and percent)
Characteristic Number Percent
All recent S&E degree recipients who attended community college 1,262,000 47
Degree level
Bachelor's 983,000 52
Master’s 279,000 36
Sex
Female 657,000 50
Male 604,000 44
Race or ethnicity
American Indian or Alaska Native 2,000 33
Asian 141,000 28
Black or African American 129,000 56
Hispanic or Latinoa 231,000 64
Native Hawaiian or Other Pacific Islander 2,000 50
White 708,000 48
More than one race 49,000 62
Citizenship status
U.S. citizen 1,214,000 53
Permanent visa 33,000 38
Temporary visa 15,000 5
Father’s education
Less than high school 114,000 59
High school diploma or equivalent 265,000 53
Some college, vocational, or trade school 298,000 56
Bachelor’s 277,000 39
TABLE 2-6

National Science Board | 2 | 23
CHAPTER 2 | Higher Education in Science and Engineering
Science & Engineering Indicators 2018
Characteristic Number Percent
Master’s 173,000 47
Professional degree 62,000 39
Doctorate 47,000 31
Not applicable 26,000 51
Mother’s education
Less than high school 117,000 56
High school diploma or equivalent 272,000 53
Some college, vocational, or trade school 270,000 43
Bachelor’s 366,000 47
Master’s 165,000 46
Professional degree 26,000 41
Doctorate 22,000 32
Not applicable 23,000 61
a Hispanic may be any race. American Indian or Alaska Native, Asian, black or African American, Native Hawaiian or Other Pacific Islander, white, and more than one race refer to individuals who are not of Hispanic origin.
Note(s)
Recent S&E degree recipients are those who earned their bachelor's or master's degrees between 1 July 2008 and 30 June 2013. Data
are rounded to the nearest 1,000.
Source(s)
National Science Foundation, National Center for Science and Engineering Statistics, special tabulations (2017), 2015 National Survey of
College Graduates (NSCG).
Science and Engineering Indicators 2018
For-Profit Institutions
In 2015–16, about 1,300 degree-granting institutions in the United States operated on a for-profit basis; this number
peaked at 1,451 in 2012–13 but has declined to 1,262 since then (NCES 2017). Four-year institutions accounted for slightly
more than half of these institutions (55%) in 2015–16 ( Table 2-1).
For-profit institutions enroll considerably fewer students than public ones, particularly at the 2-year level—nearly 120,000
versus nearly 6.6 million in community colleges in 2015.[10] Enrollment and degrees awarded in for-profit institutions rose dramatically throughout the 2000s but declined in recent years (Appendix Table 2-2).[11]

National Science Board | 2 | 24
CHAPTER 2 | Higher Education in Science and Engineering
Science & Engineering Indicators 2018
Enrollment patterns differ among racial and ethnic groups. For-profit institutions play a disproportionate role in the
education of blacks and Native Hawaiians or other Pacific Islanders, who are more likely than other racial or ethnic groups to
enroll in private for-profit academic institutions (NSF/NCSES 2017a).
For-profit academic institutions are not large producers of S&E degrees: they awarded between 3% and 5% of S&E degrees
at the bachelor’s, master’s, and doctoral levels, as well as 18% of S&E degrees at the associate’s level in 2015 (Appendix Table
2-2). Computer sciences accounted for three-quarters of the associate’s degrees and nearly half of the bachelor’s degrees
awarded by for-profit institutions in S&E fields in 2015 (Appendix Table 2-3). At the master’s level, S&E degrees were mainly in
psychology (38%), social sciences (32%), and computer sciences (27%); at the doctoral level, they were almost exclusively in
psychology (79%) and social sciences (17%).
Distance and Online Education
Distance and online education enable institutions of higher education to reach a wider audience by expanding access for
students in remote locations while providing greater flexibility for students who face time constraints, physical impairments,
responsibility to care for dependents, and other challenges. Distance education has been around for more than 100 years
(Perna et al. 2014), whereas online education is a relatively new phenomenon. Online education can serve individuals’ needs
for lifelong learning and skill retooling during times of rapid technological change.
Distance education uses technology to deliver instruction to students who are separated from the instructor and to
support regular and substantive interaction between the students and the instructor, synchronously or asynchronously (Kena
et al. 2016). Distance education enrollment has grown in recent years, given the growth of Internet technologies to deliver
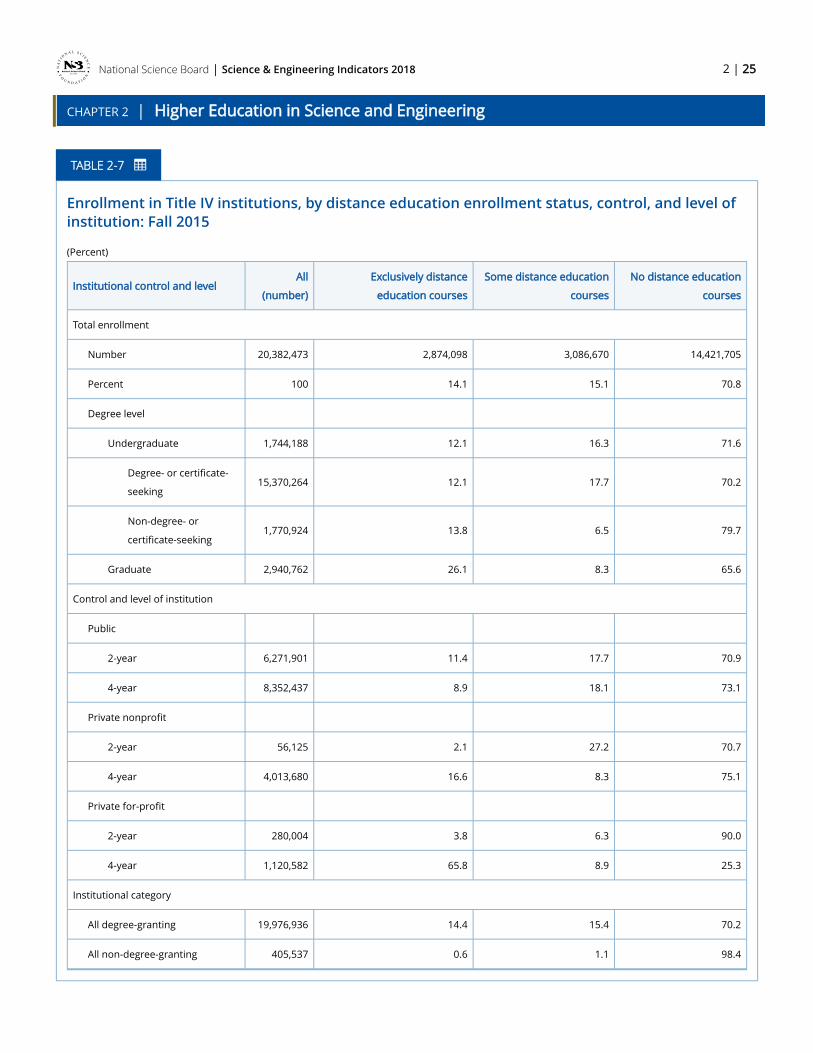
content. According to nationally representative data from the Integrated Postsecondary Education Data System (IPEDS) 2015
Fall Enrollment survey, 14% of all students in 4-year Title IV institutions (i.e., institutions that participate in federal financial aid
programs) were enrolled exclusively in distance education courses, and another 15% were enrolled in distance education and
regular on-campus courses; whereas the remaining 71% of these students were not enrolled in any distance education course
( Table 2-7).[12] Exclusive enrollment in distance education courses was considerably higher at private for-profit 4-year
institutions than at either 2- or 4-year public or private nonprofit institutions or at private for-profit 2-year institutions.
Enrollment in some distance education courses was highest at public institutions. Exclusive enrollment in distance education
courses was higher at the graduate level than at the undergraduate level, whereas enrollment in some distance education
courses was higher at the undergraduate level than at the graduate level.
National Science Board | 2 | 25
CHAPTER 2 | Higher Education in Science and Engineering
Science & Engineering Indicators 2018
Enrollment in Title IV institutions, by distance education enrollment status, control, and level of institution: Fall 2015
(Percent)
Institutional control and levelAll
(number)
Exclusively distance
education courses
Some distance education
courses
No distance education
courses
Total enrollment
Number 20,382,473 2,874,098 3,086,670 14,421,705
Percent 100 14.1 15.1 70.8
Degree level
Undergraduate 1,744,188 12.1 16.3 71.6
Degree- or certificate-
seeking15,370,264 12.1 17.7 70.2
Non-degree- or
certificate-seeking1,770,924 13.8 6.5 79.7
Graduate 2,940,762 26.1 8.3 65.6
Control and level of institution
Public
2-year 6,271,901 11.4 17.7 70.9
4-year 8,352,437 8.9 18.1 73.1
Private nonprofit
2-year 56,125 2.1 27.2 70.7
4-year 4,013,680 16.6 8.3 75.1
Private for-profit
2-year 280,004 3.8 6.3 90.0
4-year 1,120,582 65.8 8.9 25.3
Institutional category
All degree-granting 19,976,936 14.4 15.4 70.2
All non-degree-granting 405,537 0.6 1.1 98.4
TABLE 2-7

National Science Board | 2 | 26
CHAPTER 2 | Higher Education in Science and Engineering
Science & Engineering Indicators 2018
Note(s)
Title IV institutions are those with a written agreement with the Secretary of Education that allows the institution to participate in any of
the Title IV federal student financial assistance programs. Percentages may not add to 100% because of rounding.
Source(s)
National Center for Education Statistics, Integrated Postsecondary Education Data System (IPEDS), Fall 2015, Fall Enrollment
component.
Science and Engineering Indicators 2018
Nationally representative data collected by the 2015 IPEDS Completions Survey also show that, regardless of the degree
level, the proportion of distance education programs in S&E was highest at private for-profit 4-year institutions, ranging from
nearly 30% of the S&E programs in these institutions at the associate’s level to more than two-thirds of those at the master’s
level (Appendix Table 2-4). In general, computer sciences and psychology were the two fields where distance education
programs were most prevalent, irrespective of institution type and degree level. In addition, engineering, engineering
technologies, health technologies, and social sciences fields also had considerable utilization of distance education programs.
(Between 18% and 25% of the master’s programs in engineering, engineering technologies, and health technologies at public
4-year institutions and the majority of social sciences programs at private for-profit 4-year institutions had distance
education.)
A recent study provided evidence that at a for-profit university with an undergraduate enrollment of more than 100,000
students where most of them were pursuing bachelor’s degrees, taking a course online instead of in-person reduced student
success and progress in college. Grades were lower not only in the course students took online but also in future courses. In
addition, students who took a course online were less likely to remain enrolled a year later (Bettinger et al. 2017).
Allen et al.’s (2016) most recent survey showed that a small segment of higher education institutions had massive open
online courses (MOOCs; see Glossary) (11%) or were planning one in 2015 (2%); however, most institutions decided against
having a MOOC (59%) or remained undecided about it (28%). MOOCs can provide broad access to higher education for free or
at a very low cost, facilitating lifelong learning and continuing education. Through their online platforms, MOOCs also have the
potential to collect massive amounts of information that can be used to conduct experimental research on how people learn
and to identify online practices that improve learning (ED/OET 2013).
Nationally representative data on MOOCs are not available. However, research conducted on the first 4 years of open
online courses offered by HarvardX and MITx on the edX platform reveals that during that time, the platform included 290
courses, granted 245,000 certificates (including free and paid certificates), and had 4.5 million participants (Chuang and Ho
2016).[13] The survey of MOOCs showed that participants’ median age was 29, two-thirds of them were males, 71% were from countries other than the United States, and 73% were bachelor’s degree holders. The largest MOOCs were in computer
sciences.
Overall completion rates in MOOCs are low; however, they varied according to participants’ intentions at the start of the
course. Some MOOC participants indicated that they intended to obtain a free certificate, others reported that they were
exploring a subject, and others reported paying in order to verify their identity and obtain a formal certificate. Students who
paid for a certificate verifying their completion of the MOOC were much more likely to obtain a certificate than those who took
a class that offered a free certificate (60% compared with 8%).
National Science Board | 2 | 27
CHAPTER 2 | Higher Education in Science and Engineering
Science & Engineering Indicators 2018
Online education companies offering MOOCs have also expanded their offerings of certificate programs. For instance,
Udacity partnered with AT&T to offer technology-focused “nanodegrees” teaching students a specific set of skills that can be
applied to a job. These courses have been developed in partnership with employers. For example, Udacity developed a course
on Android technology with Google and another on self-driving car engineering with Mercedes-Benz, NVIDIA, and Otto (The Economist 2017). For students, these courses are much more affordable than attending a college or university and provide the
flexibility they need to complete them while balancing other family and job responsibilities. For businesses, these types of
classes provide a quick response to market demand for niche technological specializations.
In 2014, the Georgia Institute of Technology (Georgia Tech), in collaboration with Udacity and AT&T, began to offer an online
master’s program in computer science, which combines MOOC-like course videos and assessments with a support system
that works directly with students. The university’s goal was to create a master’s degree program that was just as rigorous as
the one offered on campus but at a much lower cost. A recent study focusing on the students who applied to this program
showed that access to this online option increased overall enrollment in higher education, rather than substitute for the brick-
and-mortar university options (Goodman et al. 2016). The researchers found that online students in this program were older
than students in the on-campus program and that the vast majority of them were employed. They also found that the demand
for Georgia Tech’s online degree satisfied previously unmet demand for mid-career training and could increase the production
of computer sciences master’s degrees in the United States. Overall, their results also suggested that high-quality online
education may open opportunities for people who otherwise would not be pursuing a degree.
Changing modes of online education are prompting questions about how the use of this technology will affect the higher
education sector. In particular, it is not yet clear how many students can sustain commitment to learning in the absence of
more personal contact and to what extent the growing access to higher education facilitated by MOOCs will translate into
learning and, in the long run, to higher levels of educational achievement. It is also not clear how these models can be applied
in a wider range of disciplines and higher education institutions.
Trends in Higher Education Expenditures and Revenues
Higher education spending and revenue patterns have changed substantially since 2000, in trends that intensified during
the economic downturn of the late 2000s. Although all types of higher education institutions faced competing demands in a
stringent budget environment, each type faced unique challenges. Through 2010, increases in the number of students seeking
an affordable college education compounded the challenges created by tight budgets. Despite declines in enrollment between
2011 and 2015 (Appendix Table 2-5), the same challenges have remained. This section shows trends in inflation-adjusted
average spending and revenue per full-time equivalent (FTE) student from 2000 to 2015,[14] based on data from the Delta Cost Project.[15]
Very High Research Universities—Public and Private Institutions
Revenues
Net tuition and federal appropriations, grants, and contracts are two large sources of revenues for public and private very
high research institutions (Appendix Table 2-6).[16] For public institutions, state and local appropriations are also critical, supplying an amount of revenue just under three-quarters of net tuition ($9,200 per FTE in 2015); in contrast, they are a small
source of revenue for their private counterparts (about $1,100 per FTE in 2015 and only about 4% of net tuition). Much more
important for private institutions are private and affiliated gifts, investment returns,[17] and endowment income, which are usually the largest sources of revenue other than funds from hospitals and other independent operations.[18]
State and local appropriations for public very high research universities have declined since 2000, with a particularly steep
drop between 2008 and 2012 ( Figure 2-1). This decline coincided with a compensating increase in net tuition. In 2000,

National Science Board | 2 | 28
CHAPTER 2 | Higher Education in Science and Engineering
Science & Engineering Indicators 2018
average state appropriations per FTE at public very high research institutions were more than twice the amount of net tuition
($13,900 versus $6,500). By 2015, however, appropriations had dropped to $9,200 per FTE, whereas net tuition had increased
from about $6,500 to more than $12,700 per FTE (Appendix Table 2-6). This change represents a downward shift in higher
education investment by state and local governments, resulting in a higher financial burden for individual students and their
families. Starting at a higher level, net tuition at private very high research universities also increased during this 15-year
period. But the increase, from about $22,700 to almost $27,700, was proportionally much smaller.
Year
2015
dol
lars
Expenditures, instruction Revenues, net tuition Revenues, state and local appropriations
2000 2001 2002 2003 2004 2005 2006 2007 2008 2009 2010 2011 2012 2013 2014 20150
2,500
5,000
7,500
10,000
12,500
15,000
17,500
FTE = full-time equivalent.
Source(s)
Integrated Postsecondary Education Data System (IPEDS) Analytics: Delta Cost Project Database, 2000–15 (16-year matched set),
special tabulations (2017).
Science and Engineering Indicators 2018
Revenue from federal appropriations, grants, and contracts, the source used for most research expenditures, is highest at
the most research-intensive universities (Appendix Table 2-6), particularly the private ones. These revenues increased steadily
from 2000 to 2005, dipped as the economy entered the recession at the end of the decade, increased somewhat with
American Recovery and Reinvestment Act (ARRA) funding, then dipped again between 2011 and 2015. Between 2000 and
FIGURE 2-1
Selected average revenues and expenditures per FTE at public very high research universities: 2000–15

National Science Board | 2 | 29
CHAPTER 2 | Higher Education in Science and Engineering
Science & Engineering Indicators 2018
2015, revenue per FTE from these funds increased by 11% at public very high research institutions to just under $8,000 per
FTE and by 14% to $25,700 per FTE at their private counterparts.
Expenditures
Research and instruction are the two largest core education expenditures at public and private very high research
universities. Between 2000 and 2015, research expenditures per FTE increased substantially at both types of institutions—by
25% at private universities and by 11% at their public counterparts ( Figure 2-2; Appendix Table 2-7). For public and private
institutions, research expenditures per FTE peaked in 2011 (coinciding with the year of greatest ARRA research spending);
since then, they have declined by about 8%. See Chapter 5 section Academic R&D, by Public and Private Institutions for greater
detail on university research spending.
Instructional spending per FTE followed a pattern similar to that of research expenditures, increasing at a higher rate at
private very high research institutions than at their public counterparts. Between 2000 and 2015, instructional expenditures
per FTE increased by 43% at private universities compared to 18% at public universities. Moreover, for the past decade,
instructional spending at private very high research universities has been three times that of the public universities ( Figure
2-3).

National Science Board | 2 | 30
CHAPTER 2 | Higher Education in Science and Engineering
Science & Engineering Indicators 2018
Year
2015
dol
lars
Private very high research universities Public very high research universities
2000 2001 2002 2003 2004 2005 2006 2007 2008 2009 2010 2011 2012 2013 2014 20150
10,000
20,000
30,000
40,000
FTE = full-time equivalent.
Source(s)
Integrated Postsecondary Education Data System (IPEDS) Analytics: Delta Cost Project Database, 2000–15 (16-year matched set),
special tabulations (2017).
Science and Engineering Indicators 2018
FIGURE 2-2
Average expenditures per FTE on research at public and private very high research universities: 2000–15

National Science Board | 2 | 31
CHAPTER 2 | Higher Education in Science and Engineering
Science & Engineering Indicators 2018
Year
2015
dol
lars
Private very high research universities Public very high research universities
2000 2001 2002 2003 2004 2005 2006 2007 2008 2009 2010 2011 2012 2013 2014 20150
10,000
20,000
30,000
40,000
50,000
FTE = full-time equivalent.
Source(s)
Integrated Postsecondary Education Data System (IPEDS) Analytics: Delta Cost Project Database, 2000–15 (16-year matched set),
special tabulations (2017).
Science and Engineering Indicators 2018
Four-Year and Other Graduate Public Institutions
Revenues
From 2000 to 2015, state and local appropriations and net student tuition were the largest sources of revenues centrally
involved with education at other public institutions offering 4-year and graduate degrees (Appendix Table 2-6).[19] At these institutions, total revenues from these two sources were lower than those at public very high research universities. In 2015,
net student tuition per FTE was higher at public 4-year institutions than at community colleges but state and local
appropriations per FTE were lower. From 2000 through 2015, the percentage drop in revenue per FTE from state and local
appropriations (25%) was somewhat less than that experienced at the public very high research institutions (34%). In 2010, net
student tuition replaced state and local appropriations as the largest source of revenue in the public 4-year institutions.
Average state appropriations per FTE in 2000 ($8,800) were almost twice as large as tuition revenue ($4,600). By 2010, average
revenues from net student tuition, at $7,200 per FTE, exceeded average revenues from state appropriations per FTE by about
FIGURE 2-3
Average expenditures per FTE on instruction at public and private very high research universities: 2000–15

National Science Board | 2 | 32
CHAPTER 2 | Higher Education in Science and Engineering
Science & Engineering Indicators 2018
$450. By 2015, average revenues from net tuition increased even further, to more than $1,500 over the average revenues from
state appropriations ( Figure 2-4). As in the case of public very high research institutions, this change represents a shift in
financial investment from state and local governments to individual students and their families.
Year
2015
dol
lars
Expenditures, instruction Revenues, net tuition Revenues, state and local appropriations
2000 2001 2002 2003 2004 2005 2006 2007 2008 2009 2010 2011 2012 2013 2014 20150
2,500
5,000
7,500
10,000
Note(s)
Data are per full-time equivalent. Four-year and other postsecondary institutions include doctorate-granting universities—high
research activity, doctoral/research universities, master’s colleges and universities, and baccalaureate colleges, according to the 2010
Carnegie Classification of Institutions of Higher Education.
Source(s)
Integrated Postsecondary Education Data System (IPEDS) Analytics: Delta Cost Project Database, 2000–15 (16-year matched set),
special tabulations (2017).
Science and Engineering Indicators 2018
Expenditures
Spending on instruction at 4-year and other graduate public institutions has been at least three times as high as almost all
the other standard expense categories. It increased from an average of nearly $7,000 per FTE in 2000 to about $7,800 per FTE
in 2015 (Appendix Table 2-7). Other expenditures represented much smaller shares of total spending; most of these
FIGURE 2-4
Selected average revenues and expenditures at public 4-year and other postsecondary institutions: 2000–15
National Science Board | 2 | 33
CHAPTER 2 | Higher Education in Science and Engineering
Science & Engineering Indicators 2018
expenditures increased, with average increases between 2000 and 2015 ranging from 5% for spending on plant operation and
maintenance to 28% for student services.
Community Colleges
Revenues
Revenues are much lower for community colleges than for other public institutions of higher education, particularly public
very high research institutions.[20] As in the other public institutions, the main sources of revenue at community colleges are state and local appropriations and net student tuition (Appendix Table 2-6). In 2015, average revenues from state and local
appropriations at community colleges were about $7,200 per FTE, compared with about $9,200 at public very high research
institutions; average revenues from net tuition were about $4,100 per FTE, compared with about $12,700 at public very high
research institutions. Unlike other public institutions, revenue from state and local appropriations at community colleges still
exceeded net tuition revenue in 2015.
Even so, community colleges have experienced the same decline in state and local government support that other public
institutions have seen. Between 2000 and 2015, revenues from state and local appropriations at community colleges
decreased from an average of about $7,700 per FTE to $7,200 per FTE, with a steady decline from 2008 to 2012. This trend has
since begun to reverse, although state and local support remain below their prerecession levels ( Figure 2-5). As state support
declined from 2008 to 2012, revenues from net tuition increased by 17%. In 2000, revenues from state and local
appropriations represented 56% of total revenues at community colleges, and tuition accounted for 18%. By 2015, state and
local appropriations had dropped to 48% of total revenues, whereas the proportion of revenues from tuition increased to 28%
of total revenues.

National Science Board | 2 | 34
CHAPTER 2 | Higher Education in Science and Engineering
Science & Engineering Indicators 2018
Year
2015
dol
lars
Expenditures, instruction Revenues, net tuition Revenues, state and local appropriations
2000 2001 2002 2003 2004 2005 2006 2007 2008 2009 2010 2011 2012 2013 2014 20150
2,000
4,000
6,000
8,000
10,000
FTE = full-time equivalent.
Note(s)
Community colleges are public associate's colleges according to the 2010 Carnegie Classification of Institutions of Higher Education.
Source(s)
Integrated Postsecondary Education Data System (IPEDS) Analytics: Delta Cost Project Database, 2000–15 (16-year matched set),
special tabulations (2017).
Science and Engineering Indicators 2018
Expenditures
Expenditures are also much lower for community colleges than for other public institutions of higher education. In
community colleges, instruction is by far the largest expenditure (Appendix Table 2-7). In 2000, spending on instruction was
about $5,900 per FTE, about 40% of total expenditures. In 2015, average instructional spending per FTE ($6,000) was very
similar in size to the 2000 level. Overall, these expenditures went up and down between 2000 and 2015, declining from 2001
to 2005 and 2008 to 2012 but increasing during other years ( Figure 2-5).[21] Expenditures on student services and
institutional and academic support declined in the late 2000s but increased somewhat in 2012–15. Expenditures in plant
operation and maintenance also declined between 2008 and 2011 and have risen slightly since then. As a percentage of total
expenditures, each spending stream remained relatively constant from 2000 through 2015.
FIGURE 2-5
Selected average revenues and expenditures per FTE at community colleges: 2000–15
National Science Board | 2 | 35
CHAPTER 2 | Higher Education in Science and Engineering
Science & Engineering Indicators 2018
Public Institutions Comparison
Revenues
Between 2000 and 2015, revenues from state and local appropriations and net tuition, the main two revenue sources at
public institutions, when added together increased by similar amounts at community colleges (10%) and 4-year institutions
(9%); they increased a little less at very high research institutions (8%). States and localities cut funding for all three categories
of institutions, but the reduction was smaller in the community colleges (7%) than in the public very high research institutions
(34%) and the public 4-year and other graduate public institutions (25%). Unlike community colleges, however, the other two
types of public institutions were able to increase revenues from net tuition to a greater extent. FTE net tuition revenues
increased by 97% at the public very high research universities and by 75% at the 4-year and other graduate public institutions,
compared with 62% at community colleges (Appendix Table 2-6).
Expenditures
Instruction expenditures followed a different pattern. They rose most rapidly at the public very high research institutions
(18%), where there was pressure to keep faculty salaries (a major component of instructional expenses) competitive with
those of their private counterparts, which spent more on instruction to begin with and were increasing these expenses even
more rapidly (43%) (Appendix Table 2-7). At community colleges, FTE instructional expenses increased by 2% over the period
from 2000 to 2015,[22] whereas in 4-year and other graduate institutions, they increased by 12%. Overall, during this period, community colleges had more limited resources and less flexibility to draw on alternate revenue sources to support their
instructional expenses. However, given the decline in enrollment in fall 2012 through fall 2015 after the recession, average
expenditures in instruction increased more substantially (14%) at community colleges and in 2015 were at their highest level
since 2001 (see section Undergraduate Enrollment in the United States).
Financing Higher Education
Cost of Higher Education
Affordability and access to U.S. higher education institutions are continuing concerns (Sullivan et al. 2012; GAO 2014).
According to the College Board (2016a), the estimated average net tuition and fees (i.e., the published prices minus grant aid
and tax benefits) vary by institution type.
In the last 10-year period ending in 2016–17, net tuition and fees paid by full-time, in-state undergraduate students in
public 4-year colleges increased by about 30% in constant 2016 U.S. dollars (College Board 2016a; Table 2-8). Net tuition and
fees at these institutions had dipped during the recessionary period between 2007–08 and 2009–10, but they increased by
70% since then and nearly 10% in the last 2 years.
At private nonprofit institutions, net tuition and fees followed a similar path in the last 10 years, declining between 2007–08
and 2011–12 but rising since then, gradually approaching its highest point 10 years earlier.
At public 2-year colleges, net tuition and fees have overall declined by more than 200% in the last 10 years, but they have
increased by about 35% since 2011–12 ( Table 2-8). On average, since 2009–10, undergraduate students enrolled full time at
public 2-year colleges have received enough funding through grant aid and federal education tax credits and deductions to
cover tuition and fees, and they can use the rest of those funds to cover books or living expenses (their net tuition was –$500
in 2016–17) (College Board 2016a). Despite large percentage tuition increases in public institutions, they are still more
affordable than their private counterparts.

National Science Board | 2 | 36
CHAPTER 2 | Higher Education in Science and Engineering
Science & Engineering Indicators 2018
Net tuition and fees for full-time undergraduate students by institutional control: 2006–07 and 2011–12 through 2016–17
(2016 U.S. dollars)
Institutional control 2006–07 2011–12 2012–13 2013–14 2014–15 2015–16 2016–17a
Public 2-year 420 -770 -610 -620 -620 -560 -500
Public 4-yearb 2,910 3,100 3,410 3,370 3,430 3,620 3,770
Private nonprofit 4-year 14,900 12,770 13,000 12,980 13,050 13,310 14,190
a Estimated value.
b In-state students.
Note(s)
Prices have been rounded to the nearest $10. Net tuition and fees equal published tuition and fees minus total grant aid and tax
benefits.
Source(s)
The College Board, Annual Survey of Colleges, Trends in College Pricing (2016).
Science and Engineering Indicators 2018
Between 1999–2000 and 2011–12, changes in the net cost of higher education for dependent undergraduates varied by
family income level and type of institution they attended (Table NSB 2016 2-9; the NCES National Postsecondary Student Aid
Study [NPSAS] is conducted every 4 years, so there are no new data). For students from higher-income families, net tuition
and fees increased across all types of institutions. Students from lower-income families experienced declining or stable net
tuition in certain types of institutions while seeing increases in others. (On average, these students experienced declines at
public 2-year institutions; saw no changes at public and private nonprofit 4-year master’s and baccalaureate institutions, as
well as at private nonprofit 4-year research and doctoral institutions; and saw a rise at public 4-year research and doctoral
institutions.)
Research suggests that the vast majority of low-income, high-achieving high school seniors do not apply to any selective
college, although selective institutions cost them less than nonselective ones because of the large amounts of financial aid
they are able to offer (Hoxby and Avery 2013).[23]
Undergraduate Financial Support Patterns and Debt
Financial Support for Undergraduate Education
With rising tuition, students increasingly rely on financial aid to fund their education. Financial aid for undergraduate
students comes mainly in the form of student loans (federal and nonfederal), grants (federal, state, institutional, and private),
and tuition tax credits. A financial aid package may contain one or more of these kinds of support. In 2016–17, undergraduate
students received $184 billion in federal, state, institutional, and other aid, excluding nonfederal loans (College Board 2016b).
TABLE 2-8

National Science Board | 2 | 37
CHAPTER 2 | Higher Education in Science and Engineering
Science & Engineering Indicators 2018
In the last 10 years, federal financial aid has constituted about two-thirds of the undergraduate student aid package;
federal loans have been the main component, followed by federal grants, although the proportion of undergraduate students
receiving federal loans declined (from 42% in 2005–06 to 33% in 2016–17), whereas the proportion receiving federal grants
increased (from 18% to 23%). In addition, institutional grants increased (from 20% to 23%), and private and employer grants
and state grants rose slightly as well (6% versus 7% in both cases).
According to the latest data available from the NPSAS, a higher proportion of undergraduates in private institutions than
those in public institutions received some type of financial aid and incurred student loans (Ifill and Shaw 2013).[24]
Undergraduate Debt
Among recent graduates with S&E bachelor’s degrees, the level of undergraduate debt does not vary much by
undergraduate major, although it is somewhat lower for recent recipients of engineering bachelor’s degrees than for recent
recipients of bachelor’s degrees in social and related sciences and in physical and related sciences.[25]
Levels of debt vary to a greater extent by type of institution. The extent of undergraduate indebtedness of students from
public colleges and universities is almost as high as that for students from private nonprofit universities (about 60% at
graduation). The level of debt differs, however: about $26,800 per borrower for those graduating from a public institution and
$31,400 for those graduating from private nonprofits. Students who attend private for-profit institutions are more likely to
borrow, and to borrow larger amounts, than those who attend public and private nonprofit institutions (College Board 2016b).
Levels of debt varied widely by state. Average debt for 2014 graduates of public 4-year colleges and universities ranged
from $18,800 in New Mexico to $35,000 in New Hampshire. Average debt for graduates of private nonprofit colleges and
universities ranged from $8,900 in Alaska to $36,200 in Connecticut (Institute for College Access & Success, College InSight
2016). Cost of living may account for some of the differences by state.[26]
Graduate Financial Support Patterns and Debt
Financial Support for S&E Graduate Education
In 2015, nonfederal funds were the main source of funding of full-time S&E graduate students (45%), followed by self-
support (41%), and federal funds (15%) (Appendix Table 2-8). Nonfederal sources include state funds and funding from
universities, employers, nonprofit organizations, and foreign governments. Particularly in the large public university systems,
state funds are affected by the condition of overall state budgets. Self-supporting graduate students rely primarily on loans,
their own funds, or family funds for financial support.
The number of full-time graduate students supported primarily by nonfederal sources or through self-support has
increased in the last 15 years, with the steepest increase in 2014 ( Figure 2-6).[27] The proportion of self-supporting graduate
S&E students gradually rose from 33% to 41% between 2000 and 2015, primarily because of increasing enrollment of master’s
students on temporary visas who are mostly self-supporting (IIE 2016; NSF/NCSES 2016).[28] Self-support was highest (60% or higher) among full-time graduate students in computer sciences and in medical and other health sciences (Appendix Table
2-9).
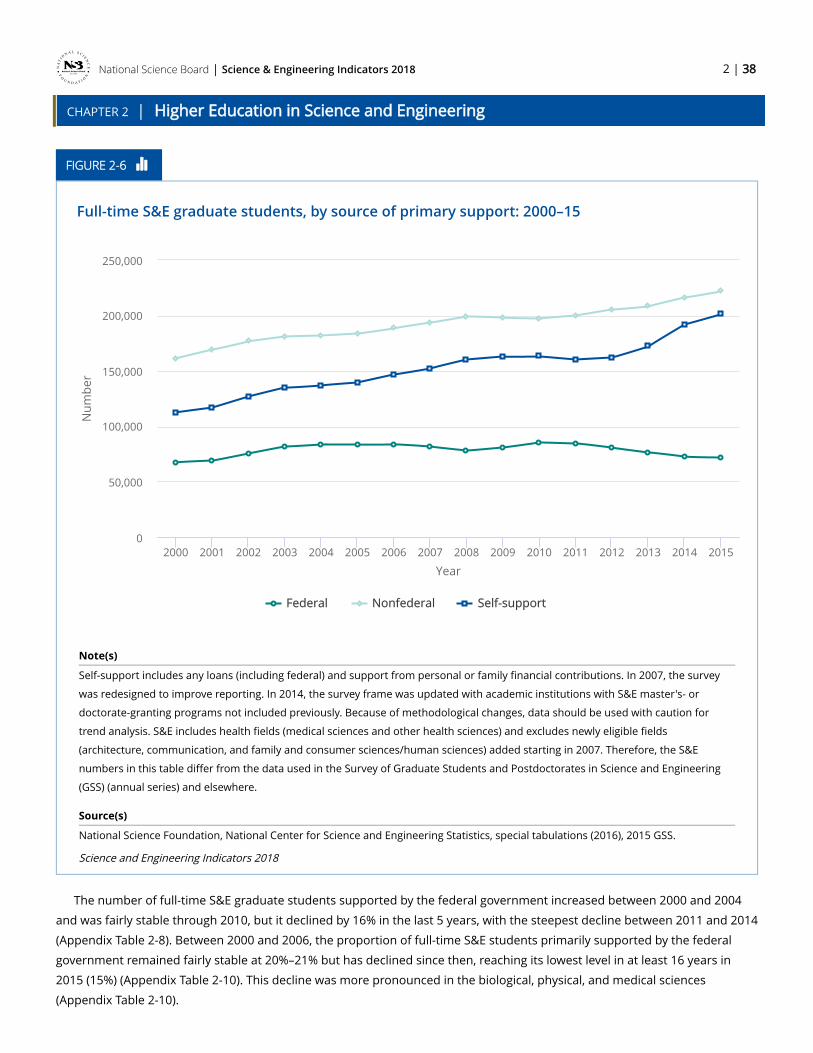
National Science Board | 2 | 38
CHAPTER 2 | Higher Education in Science and Engineering
Science & Engineering Indicators 2018
Year
Num
ber
Federal Nonfederal Self-support
2000 2001 2002 2003 2004 2005 2006 2007 2008 2009 2010 2011 2012 2013 2014 20150
50,000
100,000
150,000
200,000
250,000
Note(s)
Self-support includes any loans (including federal) and support from personal or family financial contributions. In 2007, the survey
was redesigned to improve reporting. In 2014, the survey frame was updated with academic institutions with S&E master's- or
doctorate-granting programs not included previously. Because of methodological changes, data should be used with caution for
trend analysis. S&E includes health fields (medical sciences and other health sciences) and excludes newly eligible fields
(architecture, communication, and family and consumer sciences/human sciences) added starting in 2007. Therefore, the S&E
numbers in this table differ from the data used in the Survey of Graduate Students and Postdoctorates in Science and Engineering
(GSS) (annual series) and elsewhere.
Source(s)
National Science Foundation, National Center for Science and Engineering Statistics, special tabulations (2016), 2015 GSS.
Science and Engineering Indicators 2018
The number of full-time S&E graduate students supported by the federal government increased between 2000 and 2004
and was fairly stable through 2010, but it declined by 16% in the last 5 years, with the steepest decline between 2011 and 2014
(Appendix Table 2-8). Between 2000 and 2006, the proportion of full-time S&E students primarily supported by the federal
government remained fairly stable at 20%–21% but has declined since then, reaching its lowest level in at least 16 years in
2015 (15%) (Appendix Table 2-10). This decline was more pronounced in the biological, physical, and medical sciences
(Appendix Table 2-10).
FIGURE 2-6
Full-time S&E graduate students, by source of primary support: 2000–15

National Science Board | 2 | 39
CHAPTER 2 | Higher Education in Science and Engineering
Science & Engineering Indicators 2018
The federal government plays a substantial role in supporting full-time S&E graduate students in some fields but a smaller
role in others. Federal financial support for graduate education reaches a larger proportion of students in the physical
sciences; the biological sciences; the earth, atmospheric, and ocean sciences; and engineering ( Figure 2-7; Appendix Table
2-11). For some mechanisms of support, the federal role is fairly large. In 2015, the federal government funded 55% of full-
time S&E graduate students who were on traineeships, 45% of those with research assistantships (RAs), and 22% of those with
fellowships (Appendix Table 2-11).
Fiel
d
Percent
Students
All S&E
Physical sciences
Biological sciences
Earth, atmospheric, and ocean sciences
Agricultural sciences
Engineering
Computer sciences
Medical sciences
Psychology
Mathematics and statistics
Other health sciences
Social sciences
0 5 10 15 20 25 30
Source(s)
National Science Foundation, National Center for Science and Engineering Statistics, special tabulations (2016), 2015 Survey of
Graduate Students and Postdoctorates in Science and Engineering (GSS).
Science and Engineering Indicators 2018
Teaching assistantships (TAs) are generally institutionally funded. Most graduate students, especially those who pursue
doctoral degrees, are supported by more than one source or mechanism during their time in graduate school, and some
receive support from several different sources and mechanisms in any given academic year. Primary mechanisms of support
differ widely by S&E field of study ( Figure 2-8; Appendix Table 2-9). In 2015, full-time graduate students in physical sciences
were financially supported mainly through TAs (40%) and RAs (37%). RAs were also important in agricultural sciences (47%);
FIGURE 2-7
Full-time S&E graduate students with primary support from federal government, by field: 2015
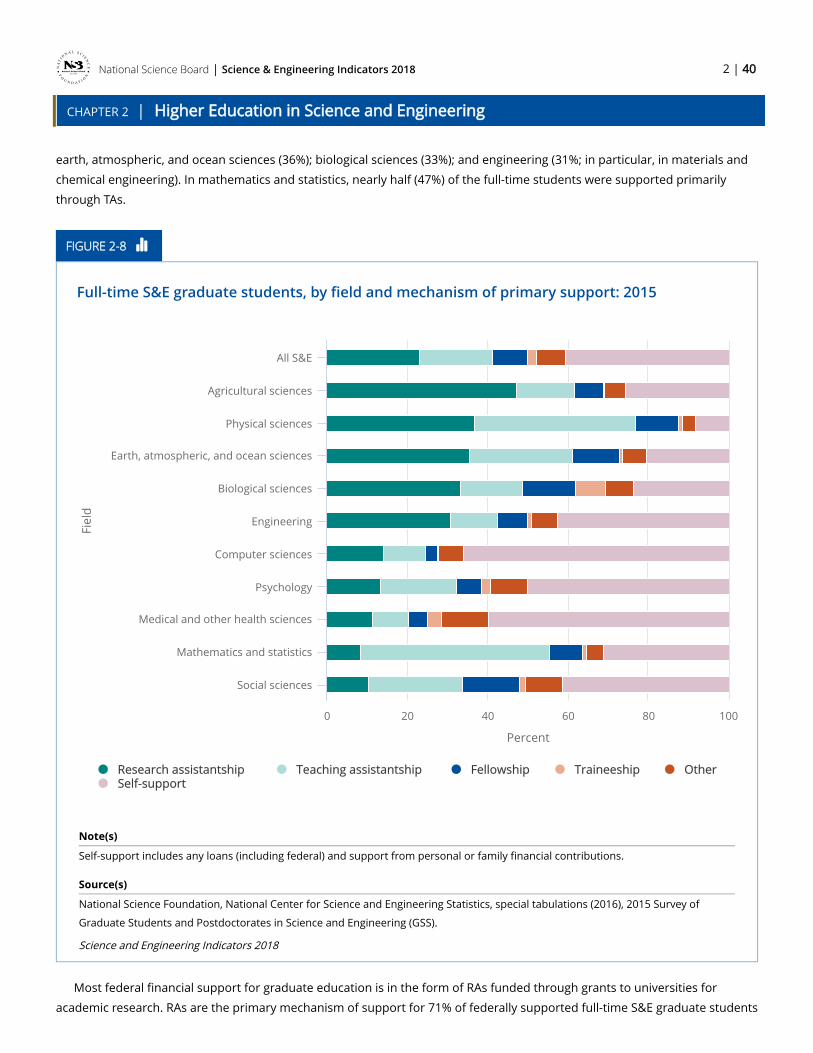
National Science Board | 2 | 40
CHAPTER 2 | Higher Education in Science and Engineering
Science & Engineering Indicators 2018
earth, atmospheric, and ocean sciences (36%); biological sciences (33%); and engineering (31%; in particular, in materials and
chemical engineering). In mathematics and statistics, nearly half (47%) of the full-time students were supported primarily
through TAs.
Fiel
d
Percent
Research assistantship Teaching assistantship Fellowship Traineeship OtherSelf-support
All S&E
Agricultural sciences
Physical sciences
Earth, atmospheric, and ocean sciences
Biological sciences
Engineering
Computer sciences
Psychology
Medical and other health sciences
Mathematics and statistics
Social sciences
0 20 40 60 80 100
Note(s)
Self-support includes any loans (including federal) and support from personal or family financial contributions.
Source(s)
National Science Foundation, National Center for Science and Engineering Statistics, special tabulations (2016), 2015 Survey of
Graduate Students and Postdoctorates in Science and Engineering (GSS).
Science and Engineering Indicators 2018
Most federal financial support for graduate education is in the form of RAs funded through grants to universities for
academic research. RAs are the primary mechanism of support for 71% of federally supported full-time S&E graduate students
FIGURE 2-8
Full-time S&E graduate students, by field and mechanism of primary support: 2015
National Science Board | 2 | 41
CHAPTER 2 | Higher Education in Science and Engineering
Science & Engineering Indicators 2018
(Appendix Table 2-8). Fellowships and traineeships are the means of funding for 22% of the federally funded full-time S&E
graduate students. For students supported through nonfederal sources in 2015, TAs (i.e., institutional funds) were the most
prominent mechanism (40%), followed by RAs (29%).
NSF and the National Institutes of Health (NIH) support most of the full-time S&E graduate students whose primary
support comes from the federal government, followed by the Department of Defense (DOD) (Appendix Table 2-12). In 2015,
NSF supported about 23,000 S&E graduate students, NIH about 21,000, and DOD about 8,000. Trends in federal agency
support of graduate students show considerable increases from 2000 to 2015 in the proportion of students funded by NSF,
from 22% to 32% (Appendix Table 2-12). NSF supported 58% of students in computer sciences or mathematics whose primary
support comes from the federal government; 51% of those in earth, atmospheric, and ocean sciences; 42% of those in the
physical sciences; and 39% of those in engineering overall (about 49% of those in electrical engineering and 48% of those in
chemical engineering) (Appendix Table 2-13). The proportion of students funded by NIH increased from 29% to 33% between
2000 and 2008 but has since decreased to 29%. In 2015, NIH funded about 70% of such students in the biological sciences,
57% of those in the medical sciences, and 36% of those in psychology. The proportion of graduate students supported by DOD
has been relatively stable around 10%–12% in the last 15 years. In 2015, DOD supported 47% of the S&E graduate students in
aerospace engineering, 31% of those in industrial engineering, 27% of those in electrical engineering, and 22%–23% of those
in materials and mechanical engineering and in computer sciences.
For doctoral degree students, notable differences exist in primary support mechanisms by type of doctorate-granting
institution ( Table 2-9). In 2015, RAs were the primary support mechanism for S&E doctorate recipients from research
universities (i.e., doctorate-granting institutions with very high research activity, that receive the most federal funding, and
those with high research activity). For those from medical schools, which are heavily funded by NIH, fellowships or
traineeships accounted for the main mechanism of support. Students at less research-intensive universities relied mostly on
personal funds.
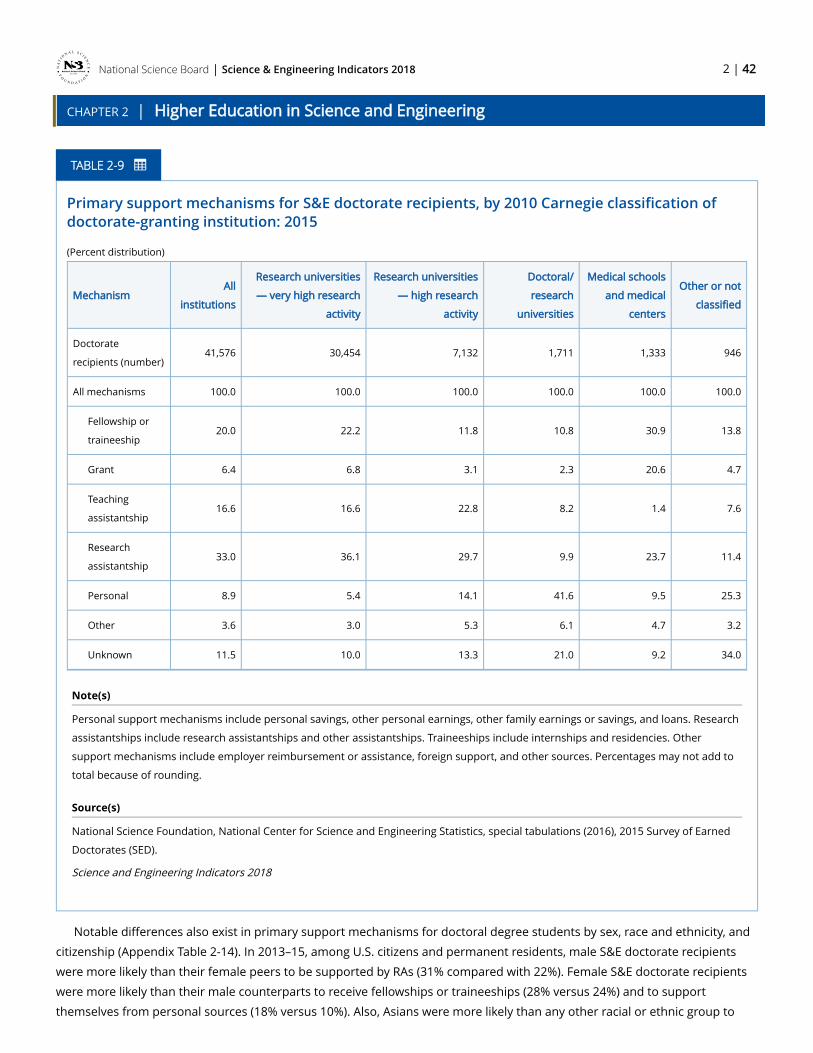
National Science Board | 2 | 42
CHAPTER 2 | Higher Education in Science and Engineering
Science & Engineering Indicators 2018
Primary support mechanisms for S&E doctorate recipients, by 2010 Carnegie classification of doctorate-granting institution: 2015
(Percent distribution)
MechanismAll
institutions
Research universities
— very high research
activity
Research universities
— high research
activity
Doctoral/
research
universities
Medical schools
and medical
centers
Other or not
classified
Doctorate
recipients (number)41,576 30,454 7,132 1,711 1,333 946
All mechanisms 100.0 100.0 100.0 100.0 100.0 100.0
Fellowship or
traineeship20.0 22.2 11.8 10.8 30.9 13.8
Grant 6.4 6.8 3.1 2.3 20.6 4.7
Teaching
assistantship16.6 16.6 22.8 8.2 1.4 7.6
Research
assistantship33.0 36.1 29.7 9.9 23.7 11.4
Personal 8.9 5.4 14.1 41.6 9.5 25.3
Other 3.6 3.0 5.3 6.1 4.7 3.2
Unknown 11.5 10.0 13.3 21.0 9.2 34.0
Note(s)
Personal support mechanisms include personal savings, other personal earnings, other family earnings or savings, and loans. Research
assistantships include research assistantships and other assistantships. Traineeships include internships and residencies. Other
support mechanisms include employer reimbursement or assistance, foreign support, and other sources. Percentages may not add to
total because of rounding.
Source(s)
National Science Foundation, National Center for Science and Engineering Statistics, special tabulations (2016), 2015 Survey of Earned
Doctorates (SED).
Science and Engineering Indicators 2018
Notable differences also exist in primary support mechanisms for doctoral degree students by sex, race and ethnicity, and
citizenship (Appendix Table 2-14). In 2013–15, among U.S. citizens and permanent residents, male S&E doctorate recipients
were more likely than their female peers to be supported by RAs (31% compared with 22%). Female S&E doctorate recipients
were more likely than their male counterparts to receive fellowships or traineeships (28% versus 24%) and to support
themselves from personal sources (18% versus 10%). Also, Asians were more likely than any other racial or ethnic group to
TABLE 2-9
National Science Board | 2 | 43
CHAPTER 2 | Higher Education in Science and Engineering
Science & Engineering Indicators 2018
have primary RA support (32%), followed by whites (28%). Compared with other racial and ethnic groups, Hispanic and
American Indian or Alaska Native S&E doctorate recipients depended more on fellowships or traineeships (34% and 38%,
respectively), and blacks and American Indians or Alaska Natives were more likely to use personal sources (28% and 19%,
respectively). S&E doctorate recipients on temporary visas were more likely to have an RA (51%) than their U.S. citizen and
permanent resident peers (27%); this has been a long-standing pattern. S&E doctorate recipients who were temporary visa
holders were also less likely than U.S. citizens and permanent residents to use personal funds.
To some extent, the sex, citizenship, and racial and ethnic differences in types of support mechanisms are related to
differences in field of study. White and Asian men, as well as international doctoral degree students, are more likely than white
and Asian women, along with underrepresented minority students of both sexes, to receive doctorates in engineering and
physical sciences (see Appendix Table 2-14), fields that are largely supported by RAs. In turn, women and underrepresented
minorities are more likely to receive doctorates in social sciences (except for economics) and psychology, in which self-support
is prevalent. However, some differences in type of support by sex, race and ethnicity, or citizenship remain after accounting for
these doctoral field patterns. In 7 out of the 10 broad S&E fields presented in Appendix Table 2-14, men were more likely than
women to have had RA as primary sources of support during their doctoral studies. In contrast, in 7 out of the 10 broad S&E
fields, women were more likely to have used personal funds as a source of support. When looking at race and ethnicity
patterns in primary source of support among U.S. citizen and permanent residents, in 8 out of the 10 S&E broad fields, Asians
and whites were more likely to have used RA as primary source of support than underrepresented minorities.
Underrepresented minorities (blacks in particular) were more likely than Asians and whites to have used personal funds as
primary source of support in all the broad S&E fields (Appendix Table 2-14).
Overall, the variation in the use of RAs and personal funds as primary sources of support among doctorate recipients was
also largely visible at very high research intensive institutions.[29]
Graduate Debt
At the time of doctoral degree conferral, 43% of 2015 S&E doctorate recipients had debt related to their undergraduate or
graduate education. In 2015, 29% of S&E doctorate recipients reported having undergraduate debt and 32% reported having
graduate debt. For some S&E doctorate recipients, debt levels were high, especially for graduate debt: 6% reported more than
$40,000 of undergraduate debt, 13% reported more than $40,000 of graduate debt, and 18% reported more than $40,000 in
cumulative undergraduate and graduate debt (Appendix Table 2-15).
Levels of debt vary widely by doctoral field. A higher percentage of doctorate recipients in non-S&E fields (52%) than those
in S&E fields (32%) reported graduate debt. In 2015, within S&E, high levels of graduate debt were most common among
doctorate recipients in the social sciences, psychology, and the medical and other health sciences. The proportion of doctorate
recipients in these fields who reported graduate debt has increased since 2003.[30] Psychology doctorate recipients were
most likely to report having graduate debt and high levels of debt.[31] In 2015, 27% of doctorate recipients in psychology reported graduate debt of more than $70,000 (Appendix Table 2-15). Doctorate recipients in mathematics, computer sciences,
and physical sciences were the least likely to report graduate debt.
Men and women differed little in level of undergraduate debt, but women were more likely to have accumulated higher
graduate debt. U.S. doctorate holders accumulated more debt than temporary visa holders. Regardless of broad field of
doctorate, among U.S. citizen and permanent resident doctorate recipients with graduate-school debt, blacks, Hispanics, and
American Indians and Alaska Natives were more likely to have debt over $30,000 than Asians and whites (NSF/NCSES 2017b,
table 41). In all broad fields of study, blacks were more likely to have reported graduate-school debt higher than U.S. $30,000,
followed by Hispanics and American Indian or Alaska Natives. In contrast, Asians and whites were the least likely racial group
to report more than U.S. $30,000 in graduate-school debt. A higher level of graduate-school debt among underrepresented

National Science Board | 2 | 44
CHAPTER 2 | Higher Education in Science and Engineering
Science & Engineering Indicators 2018
minority doctorate recipients than among their Asian and white counterparts, in all broad fields of study, was also observed at
very high research intensive institutions.[32]
[1] For a crosswalk between the Classification of Instructional Programs codes and the academic fields in completion tables, see https://webcaspar.nsf.gov/Help/dataMapHelpDisplay.jsp?subHeader=DataSourceBySubject&type=DS&abbr=DEGS&noHeader=1&JS=No, accessed 1 March 2017.
[2] Special tabulation from the Survey of Earned Doctorates.
[3] Tribal colleges and universities (TCUs) are fully accredited academic institutions designated by law. TCUs include institutions cited in the Equity and in Educational Land-Grant Status Act of 1994 and any other institution that qualifies for funding under the Tribally Controlled Community College Assistance Act of 1978.
[4] Being a high-Hispanic-enrollment institution (public and private nonprofit institutions whose undergraduate, full-time equivalent student enrollment is at least 25% Hispanic) is a factor in determining whether an institution is eligible for federal grants, contracts, or benefits to expand educational opportunities and improve the educational attainment of Hispanic students based on the Title V program under the Higher Education Act (also known as the Developing Hispanic-Serving Institutions Program). Institutions participating in this federal program are called “Hispanic-Serving Institutions,” a term used by many scholars in this field. For additional information, see https://www2.ed.gov/about/offices/list/ope/idues/hsidivision.html (accessed 15 May 2017) and Núñez et al. (2015).
[5] In addition to HHE, other MSIs defined by the proportion of students enrolled in them are Asian-serving; American Indian-serving; other minority-serving; and non-minority serving. For more detail on all these categories, see Li 2007.
[6] See NSF/NCSES 2017a, Table 5-8, Table 5-9, and Table 5-10 for additional details.
[7] For the 2015 National Survey of College Graduates (NSCG), recent graduates include those who received their most recent degree in the 5 years between 1 July 2008 and 30 June 2013.
[8] Special tabulation from the 2015 NSCG.
[9] Special tabulation from the 2015 NSCG.
[10] Special tabulation from the 2015 Fall Enrollment survey in https://ncsesdata.nsf.gov/webcaspar/
[11] Special tabulation from the 2015 Fall Enrollment survey in https://ncsesdata.nsf.gov/webcaspar/
[12] In 2011–12, IPEDS began asking institutions whether they were exclusively a distance education institution (i.e., whether all their programs were offered via distance education, defined as “education that uses one or more technologies to deliver instruction to students who are separated from the instructor and to support regular and substantive interaction between the students and the instructor synchronously or asynchronously”). A distance education course is a course in which the instructional content is delivered exclusively via distance education. A distance education program is a program for which all the required coursework for program completion can be completed via distance education courses. Examinations, orientation, and practical experience components of courses or programs are not considered instructional content. For more details, see the IPEDS online glossary at https://nces.ed.gov/ipeds/glossary/.

National Science Board | 2 | 45
CHAPTER 2 | Higher Education in Science and Engineering
Science & Engineering Indicators 2018
[13] HarvardX and MITx are “collaborative institutional efforts between Harvard University and MIT to enhance campus-based education, advance educational research, and increase access to online learning opportunities worldwide” (Chuang and Ho 2016).
[14] FTE enrollments are derived from the “Enrollment by Race/Ethnicity” section of the IPEDS Fall Enrollment survey. The FTE of an institution’s part-time enrollment is estimated by multiplying part-time enrollment by factors that vary by control and level of institution and level of student; the estimated FTE of part-time enrollment is then added to the institution’s FTE. The Department of Education uses this formula to produce the FTE enrollment data published annually in the Digest of Education Statistics.
[15] For the definition of “net tuition revenue,” see Glossary. Definitions of standard revenue and expenditure categories are available in the Delta Cost Project data dictionary, available at http://www.deltacostproject.org/delta-cost-project-database.
[16] Another large source of revenue for very high research institutions is “hospitals, independent operations, and other sources,” which includes revenue generated by hospitals operated by the institution and revenues independent of or unrelated to instruction, research, or public services.
[17] Investment returns include realized and unrealized gains and losses. Institutions report the change in the value of their investment account, which is the reason behind the negative values under this category in Appendix Table 2-5. Thus, investment returns may not always represent revenue for the institution.
[18] In 2015, income from private and affiliated gifts, investment returns, and endowment income at private very high research institutions was about $66,700 per FTE compared with about $27,700 in income from net tuition and $25,700 in income from federal appropriations (Appendix Table 2-5).
[19] The 4-year and graduate institutions category includes the following 2010 Carnegie institution types: doctorate-granting universities—high research activity, doctoral/research universities, master’s colleges and universities, and baccalaureate colleges. The data in this section correspond to the public institutions.
[20] Community colleges are the public “associate’s colleges” in the 2010 Carnegie Classification of Institutions of Higher Education.
[21] Despite this variability in spending from year to year, as a percent of each year’s total expenditures, instruction and all other spending streams remained relatively constant between 2000 and 2015 for not only community colleges but all institution types.
[22] The proportion of U.S.-trained doctorate holders employed at community colleges in adjunct positions grew from 12% in 1993 to 30% in 2015, according to estimates from the Survey of Doctorate Recipients. This suggests that one of the ways community colleges may have reined in expenses during this period was to increase their reliance on adjuncts.
[23] In this study, “low-income” referred to high school seniors whose families are in the bottom quartile of the income distribution. “High-achieving” referred to a student who scores at or above the 90th percentile on the ACT comprehensive or the SAT I (math and verbal) and whose high school grade point average is A- or higher. In this research, a “selective college” meant colleges and universities included in the categories from “Very Competitive Plus” to “Most Competitive” in Barron’s Profiles of American Colleges (Hoxby and Avery 2013).
National Science Board | 2 | 46
CHAPTER 2 | Higher Education in Science and Engineering
Science & Engineering Indicators 2018
[24] These percentages include students whose financial aid package included student loans in combination with grants or other student aid, as well as those who only had student loans.
[25] Based on a special tabulation of the 2015 NSCG. A recent graduate is a respondent who received his or her most recent bachelor’s degree between 1 July 2008 and 30 June 2013.
[26] In the case of public 4-year institutions, data were not available for the District of Columbia. In the case of private nonprofit 4-year or higher institutions, data were not available for Delaware, the District of Columbia, Hawaii, Idaho, Nevada, North Dakota, Utah, and Wyoming.
[27] Although the survey frame included new institutions during this period, the impact of the new institutions was very small and did not affect the overall trends. For additional information, see https://nsf.gov/statistics/2016/nsf16314/.
[28] The NSF/NCSES Survey of Graduate Students and Postdoctorates in Science and Engineering does not collect separate data for the master’s and the doctoral level. For data on the primary source of financial support of doctorate recipients by broad field of study, see Appendix Table 2-14.
[29] Special tabulations from the Survey of Earned Doctorates.
[30] For the proportions corresponding to the 2003 Survey of Earned Doctorates please see Appendix Table NSB 2006 2-23 at https://nsf.gov/statistics/seind06/.
[31] Clinical psychology programs and programs that emphasize professional practice (professional schools and PsyD programs) are associated with higher debt, but even in the more research-focused subfields of psychology, lower percentages of doctorate recipients were debt free, and higher percentages had higher levels of debt, than those in other S&E fields. For information on debt levels of clinical versus nonclinical psychology doctorates in 1993–96, see Psychology Doctorate Recipients: How Much Financial Debt at Graduation? (NSF 00-321) at https://www.nsf.gov/statistics/issuebrf/sib00321.htm. Accessed 5 May 2017.
[32] Special tabulations from the Survey of Earned Doctorates.

National Science Board | 2 | 47
CHAPTER 2 | Higher Education in Science and Engineering
Science & Engineering Indicators 2018
Undergraduate Education, Enrollment, and Degrees in the United States
Undergraduate education in S&E courses prepares students majoring in S&E for the workforce. It also prepares nonmajors
to become knowledgeable citizens with a basic understanding of science and mathematics concepts. This section includes
indicators related to enrollment by type of institution, field, and demographic characteristics; intentions to major in S&E fields;
and recent trends in the number of earned S&E degrees.
Undergraduate Enrollment in the United States
Overall Undergraduate Enrollment
Enrollment in U.S. institutions of higher education at all levels rose from 15.5 million students in fall 2000 to more than 20.2
million in fall 2015, with two main periods of high growth—between 2000 and 2002 and between 2007 and 2010, following a
pattern of rising enrollments when there are economic downturns. Undergraduate enrollment typically represents about 85%
of all postsecondary enrollment (Appendix Table 2-5).
Undergraduate enrollment peaked at 18.3 million in 2010 but declined to 17.3 million in 2015, still about 30% higher than
in 2000 (Appendix Table 2-5). As in previous years, the types of institutions enrolling the largest numbers of students at the
undergraduate level in 2015 were associate’s colleges (7.2 million, 42% of all undergraduates enrolled), master’s colleges/
universities (3.7 million, 21%), and doctorate-granting universities with very high research activity (2.1 million, 12%). Between
2000 and 2015, undergraduate enrollment increased consistently at most types of institutions (ranging between 22% and 35%
at research universities, master’s colleges, and baccalaureate colleges). (See sidebar Carnegie Classification of Academic
Institutions for definitions of the types of academic institutions.)
Between 2000 and 2015, among U.S. citizens and permanent residents, the share of Hispanics and blacks enrolled full time
in undergraduate programs increased (from 10% to 17% and from 11% to 13%, respectively); the shares of Asians and Pacific
Islanders and of American Indians or Alaska Natives remained stable at about 6% and 1%, respectively; the share of whites
declined (from 68% to 55%) ( Figure 2-9). The most recent data show that about 3% of undergraduate students enrolled
report being of more than one race. In general, enrollment is higher among black, Hispanic, and white women than among
their male counterparts (special tabulation, IPEDS Fall Enrollment data; for additional data on undergraduate enrollment
patterns by sex and race and ethnicity, see NSF/NCSES 2017a).[1]

National Science Board | 2 | 48
CHAPTER 2 | Higher Education in Science and Engineering
Science & Engineering Indicators 2018
Year
Perc
ent
Asian or Pacific Islander Black or African American Hispanic or LatinoAmerican Indian or Alaska Native White
20002001
20022003
20042005
20062007
20082009
20102011
20122013
20142015
0
4
8
12
16
20
52
56
60
64
68
72
Note(s)
Hispanic may be any race. American Indian or Alaska Native, Asian or Pacific Islander, black or African American, and white refer to
individuals who are not of Hispanic origin. Percentages do not add to total because data do not include individuals who did not
report their race and ethnicity.
Source(s)
National Center for Education Statistics, Integrated Postsecondary Education Data System (IPEDS), Fall Enrollment Survey; National
Science Foundation, National Center for Science and Engineering Statistics, WebCASPAR database, https://ncsesdata.nsf.gov/
webcaspar/.
Science and Engineering Indicators 2018
FIGURE 2-9
Share of full-time undergraduate enrollment among U.S. citizens and permanent residents, by race and ethnicity: 2000–15
National Science Board | 2 | 49
CHAPTER 2 | Higher Education in Science and Engineering
Science & Engineering Indicators 2018
According to the latest Census Bureau projections, increased enrollment in higher education is expected to come mainly from
minority groups, particularly Hispanics (for details, see in Science and Engineering Indicators 2016 Chapter 2 [2016] section
Undergraduate Education Enrollment and Degrees in the United States [NSB 2016]). This increase may result in a larger
number of academic institutions becoming high Hispanic enrollment and in considerable increases in the overall enrollment in
community colleges, because nearly half of all Hispanic undergraduates are enrolled in community colleges.[2]
Undergraduate Enrollment in S&E
Freshmen Intentions to Major in S&E
The enrollment data presented in the previous section are not available by field of study because academic institutions
vary in terms of when undergraduates declare a major, making it difficult to consistently measure enrollment by field. Since
1971, the annual The American Freshman: National Norms survey, administered by the Higher Education Research Institute at
the University of California, Los Angeles, has asked freshmen at a large number of universities and colleges about their
intended majors. Data show that in 2000, about one-third of all freshmen planned to study S&E; this proportion gradually rose
to 45% by 2016 (Eagan et al. 2017). [3] Increases in the proportion of freshmen planning to major in biological and agricultural sciences and in engineering account for most of this growth. In 2016 about 45% of freshmen indicated they planned to major
in an S&E field (up from about 8% in 2000); about 16% in the biological and agricultural sciences; 11% in engineering; 10% in
the social and behavioral sciences; 6% in mathematics, statistics, or computer sciences; and 3% in the physical sciences.
International Undergraduate Enrollment
Based on recent data collected in the Student and Exchange Visitor Information System (SEVIS) at the Department of
Homeland Security, international undergraduate enrollment increased consistently from nearly 350,000 in fall 2012 to nearly
451,000 in fall 2016 but dropped to about 441,000 by fall 2017 ( Table 2-10).[4] ,[5] Between 2016 and 2017, international
undergraduate enrollment in S&E fields remained steady, rising only 0.2% or 360 students, while declining 3.8% in non-S&E
fields during this time. The decline may reflect a smaller influx of international students in the United States, a declining
proportion of them staying in the United States than in the past, or a combination of these two factors.
In fall 2017, the top five countries sending S&E undergraduates to the United States were the same as in the previous year:
China, Saudi Arabia, India, South Korea, and Kuwait (Appendix Table 2-16). Compared to fall 2016, the number of S&E
undergraduates from China, India, and Kuwait enrolled in fall 2017 increased (by 3%, 11%, and 4% respectively) while the
number from Saudi Arabia and South Korea declined (by 18% and 7% respectively).
At the undergraduate level, in 2017 40% of international students were enrolled in S&E fields ( Table 2-10; Appendix Table
2-16). Within S&E, the broad fields with the highest enrollment of international students are engineering, computer sciences,
and the social sciences (particularly economics). In the most recent academic year, the number of visa holders increased in
computer sciences and mathematics (by 11% and 5% respectively). The largest declines in international student enrollment
were in engineering and social sciences (5% and 3% respectively) and also in non-S&E (4%). In 2017, the proportion of
undergraduate students enrolled in S&E fields was 50% or higher among students from Kuwait, Turkey, Malaysia, India, Nepal,
and Pakistan, similar overall to previous years.

National Science Board | 2 | 50
CHAPTER 2 | Higher Education in Science and Engineering
Science & Engineering Indicators 2018
International students enrolled in U.S. higher education institutions, by broad field and academic level: 2012–17
(Number)
Field and level 2012 2013 2014 2015 2016 2017
All fields
All levels 633,070 673,480 747,400 776,720 840,160 808,640
Undergraduate 349,400 371,990 405,930 416,350 450,850 440,720
Graduate 283,680 301,490 341,470 360,380 389,310 367,920
S&E fields
All levels 278,180 305,610 355,910 384,540 420,610 406,240
Undergraduate 115,800 130,050 147,790 157,820 176,570 176,930
Graduate 162,390 175,570 208,110 226,720 244,040 229,310
Non-S&E fields
All levels 354,890 367,870 391,500 392,190 419,550 402,400
Undergraduate 233,600 241,950 258,140 258,520 274,280 263,790
Graduate 121,290 125,920 133,360 133,660 145,270 138,610
Note(s)
Data include active foreign national students on F-1 visas and exclude those on optional practical training. Undergraduate level includes
associate’s and bachelor’s degrees; graduate level includes master’s and doctoral degrees. Numbers are rounded to the nearest 10.
Detail may not add to total because of rounding. Fall data include students who are in the SEVIS database between 16 April and 15
November of each year.
Source(s)
U.S. Department of Homeland Security, U.S. Immigration and Customs Enforcement, special tabulations (2017), Student and Exchange
Visitor Information System (SEVIS) database.
Science and Engineering Indicators 2018
Engineering Enrollment
For the most part, U.S. undergraduates do not declare majors until their sophomore year, but engineering is an exception,
generally requiring students to declare a major in their freshman year. Thus, engineering enrollment data compiled by the
American Society for Engineering Education provides a glimpse into future undergraduate engineering degrees and student
interest in the field (Yoder 2017). In the last 10 years, undergraduate engineering enrollment has been on the rise. The
number of full-time undergraduate engineering students enrolled increased by 63% between 2006 and 2015, to about 610,000
TABLE 2-10

National Science Board | 2 | 51
CHAPTER 2 | Higher Education in Science and Engineering
Science & Engineering Indicators 2018
(Appendix Table 2-17). Full-time freshman enrollment followed a similar pattern, peaking at 150,000 in 2015, the highest since
1982, indicating that interest in an engineering career is high.
Attainment and Retention in Undergraduate Education
One concern about the United States’ ability to produce and retain talent in science and engineering is that students who
start undergraduate programs in these fields do not complete them (President’s Council of Advisors on Science and
Technology 2012). Some drop out and do not complete any degree and others complete their degrees after switching to non–
science, technology, engineering, and mathematics (STEM) majors. Degree attainment and retention are best measured by the
Beginning Postsecondary Students (BPS) survey, which examined a nationally representative cohort of first-time, beginning
students at the end of their first year in 2011–12, followed up with them 3 years later, and will contact them 6 years later.[6]
Of the students surveyed in 2011–12, 43% enrolled in 2-year institutions, 53% enrolled in 4-year institutions, and 5% in less
than 2-year institutions.[7] Overall, the data provide limited evidence that retention patterns vary across S&E and non-S&E fields of study.
Three years after enrolling in a 2-year institution in the 2011–12 academic year, about 55% of students had either
completed an associate’s degree (12%) or remained enrolled in school (at the same or another institution) without having
earned a degree (43%); the remaining 45% were no longer enrolled at any institution and had not attained a degree ( Table
2-11). Overall, the level of degree attainment or continued enrollment did not vary much by students’ declared major field of
study. However, students who had been undecided about their major in 2011–12 were more likely to be no longer enrolled at
any institution without having earned a degree by the spring of 2014: 55% of those with undecided majors were no longer
enrolled compared to 43% of those with majors in the natural sciences and engineering, 40% of those in the social and
behavioral sciences, and 45% of those in the non-S&E fields respectively.
In 4-year colleges and universities, 3 years after enrolling, the vast majority of students, were still enrolled either at their
first institution or at another institution without having earned a credential (76%) or had attained an associate’s or bachelor’s
degree (6%); about 18% had not earned a degree and were no longer enrolled at any institution. Overall those who had
declared a major in S&E fields (natural sciences, engineering, and social and behavioral sciences) were slightly more likely to
be enrolled 3 years later than students who had declared a non-S&E major (78% for natural sciences and engineering and 80%
for social sciences compared to 74% for non-S&E majors). In addition, a higher proportion of students who declared a non-
S&E major were somewhat more likely to be no longer enrolled at any institution (20%) than those who had declared a natural
sciences and engineering (16%) or a social and behavioral sciences major (15%) ( Table 2-11).

National Science Board | 2 | 52
CHAPTER 2 | Higher Education in Science and Engineering
Science & Engineering Indicators 2018
Retention and attainment of postsecondary students at the first academic institution attended through June 2014, by level of first institution and major field category: 2013–14
(Percent distribution)
Type of institution and major in 2011–12a Number Bachelor's Associate's No degree, still enrolled No degree, left
2-year institutions
All majors 1,697,800 s 12.1 43.4 44.5
Natural sciences and engineeringb 224,600 s 13.3 44.0 42.7
Social and behavioral sciences 63,800 s 15.4 44.6 40.0
Non-S&E 1,283,000 s 12.3 43.2 44.5
Undecided 69,700 s s 34.7 54.7
4-year institutions
All majors 2,224,700 2.7 3.2 76.0 18.1
Natural sciences and engineeringb 504,800 2.4 3.4 77.9 16.3
Social and behavioral sciences 227,200 2.8 2.0 80.3 14.9
Non-S&E 1,357,200 2.9 3.6 74.0 19.5
Undecided 117,900 s s 85.2 12.8
s = suppressed for reasons of confidentiality and/or reliability.
a Refers to the first major declared by students.
b Includes engineering technologies and science technologies.
Note(s)
Percentages may not add to total because of rounding.
Source(s)
National Center for Education Statistics, 2011–12 Beginning Postsecondary Students Longitudinal Study First Follow-up (BPS:12/14).
Science and Engineering Indicators 2018
Field Switching
Among undergraduates who began postsecondary education in a 4-year institution, the majority who had declared a major
during their first year in 2011–12 continued in the same major 3 years later. A larger proportion of students who declared a
major in a non-S&E field (82%) than students who declared a natural sciences and engineering (69%) or social and behavioral
sciences (67%) major remained in their field 3 years after beginning their postsecondary education ( Table 2-12). Of the
TABLE 2-11
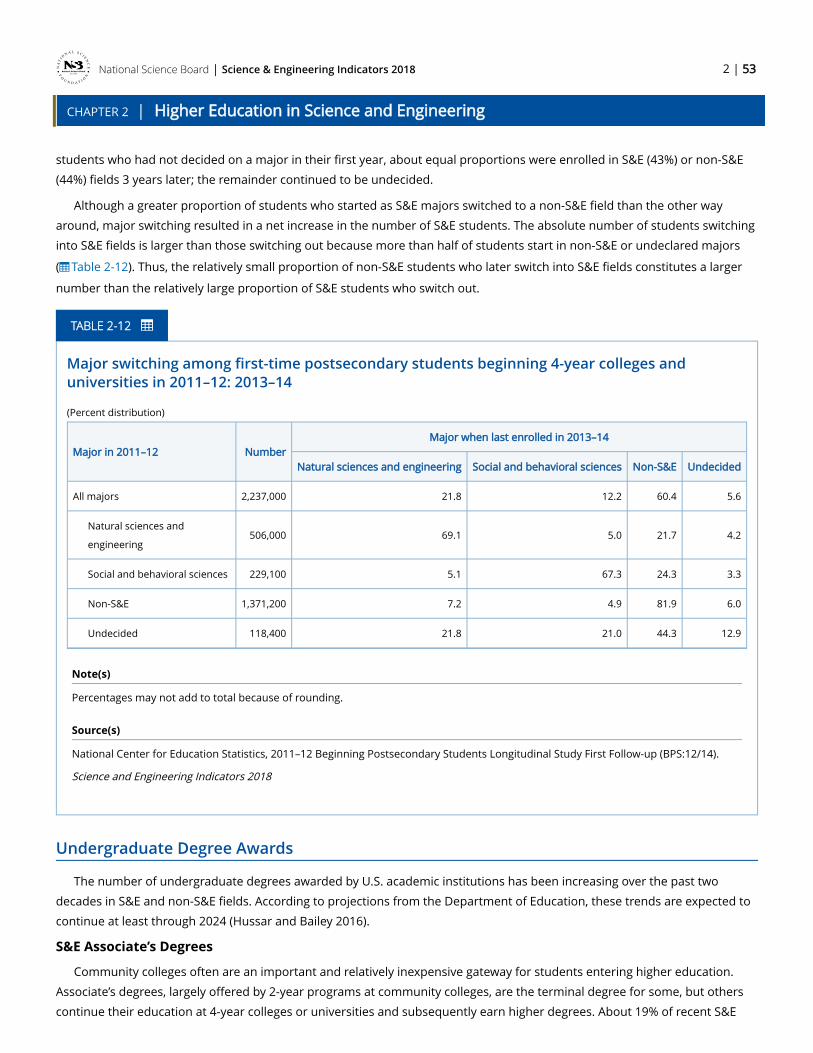
National Science Board | 2 | 53
CHAPTER 2 | Higher Education in Science and Engineering
Science & Engineering Indicators 2018
students who had not decided on a major in their first year, about equal proportions were enrolled in S&E (43%) or non-S&E
(44%) fields 3 years later; the remainder continued to be undecided.
Although a greater proportion of students who started as S&E majors switched to a non-S&E field than the other way
around, major switching resulted in a net increase in the number of S&E students. The absolute number of students switching
into S&E fields is larger than those switching out because more than half of students start in non-S&E or undeclared majors
( Table 2-12). Thus, the relatively small proportion of non-S&E students who later switch into S&E fields constitutes a larger
number than the relatively large proportion of S&E students who switch out.
Major switching among first-time postsecondary students beginning 4-year colleges and universities in 2011–12: 2013–14
(Percent distribution)
Major in 2011–12 NumberMajor when last enrolled in 2013–14
Natural sciences and engineering Social and behavioral sciences Non-S&E Undecided
All majors 2,237,000 21.8 12.2 60.4 5.6
Natural sciences and
engineering506,000 69.1 5.0 21.7 4.2
Social and behavioral sciences 229,100 5.1 67.3 24.3 3.3
Non-S&E 1,371,200 7.2 4.9 81.9 6.0
Undecided 118,400 21.8 21.0 44.3 12.9
Note(s)
Percentages may not add to total because of rounding.
Source(s)
National Center for Education Statistics, 2011–12 Beginning Postsecondary Students Longitudinal Study First Follow-up (BPS:12/14).
Science and Engineering Indicators 2018
Undergraduate Degree Awards
The number of undergraduate degrees awarded by U.S. academic institutions has been increasing over the past two
decades in S&E and non-S&E fields. According to projections from the Department of Education, these trends are expected to
continue at least through 2024 (Hussar and Bailey 2016).
S&E Associate’s Degrees
Community colleges often are an important and relatively inexpensive gateway for students entering higher education.
Associate’s degrees, largely offered by 2-year programs at community colleges, are the terminal degree for some, but others
continue their education at 4-year colleges or universities and subsequently earn higher degrees. About 19% of recent S&E
TABLE 2-12
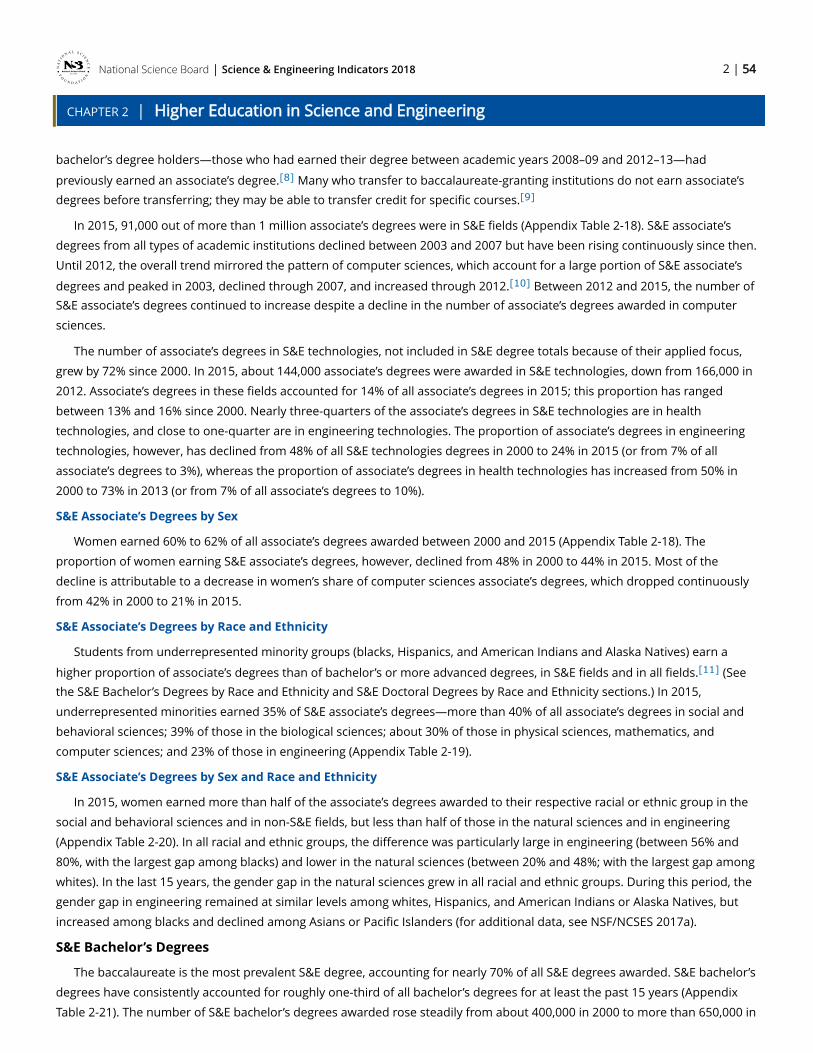
National Science Board | 2 | 54
CHAPTER 2 | Higher Education in Science and Engineering
Science & Engineering Indicators 2018
bachelor’s degree holders—those who had earned their degree between academic years 2008–09 and 2012–13—had
previously earned an associate’s degree.[8] Many who transfer to baccalaureate-granting institutions do not earn associate’s degrees before transferring; they may be able to transfer credit for specific courses.[9]
In 2015, 91,000 out of more than 1 million associate’s degrees were in S&E fields (Appendix Table 2-18). S&E associate’s
degrees from all types of academic institutions declined between 2003 and 2007 but have been rising continuously since then.
Until 2012, the overall trend mirrored the pattern of computer sciences, which account for a large portion of S&E associate’s
degrees and peaked in 2003, declined through 2007, and increased through 2012.[10] Between 2012 and 2015, the number of S&E associate’s degrees continued to increase despite a decline in the number of associate’s degrees awarded in computer
sciences.
The number of associate’s degrees in S&E technologies, not included in S&E degree totals because of their applied focus,
grew by 72% since 2000. In 2015, about 144,000 associate’s degrees were awarded in S&E technologies, down from 166,000 in
2012. Associate’s degrees in these fields accounted for 14% of all associate’s degrees in 2015; this proportion has ranged
between 13% and 16% since 2000. Nearly three-quarters of the associate’s degrees in S&E technologies are in health
technologies, and close to one-quarter are in engineering technologies. The proportion of associate’s degrees in engineering
technologies, however, has declined from 48% of all S&E technologies degrees in 2000 to 24% in 2015 (or from 7% of all
associate’s degrees to 3%), whereas the proportion of associate’s degrees in health technologies has increased from 50% in
2000 to 73% in 2013 (or from 7% of all associate’s degrees to 10%).
S&E Associate’s Degrees by Sex
Women earned 60% to 62% of all associate’s degrees awarded between 2000 and 2015 (Appendix Table 2-18). The
proportion of women earning S&E associate’s degrees, however, declined from 48% in 2000 to 44% in 2015. Most of the
decline is attributable to a decrease in women’s share of computer sciences associate’s degrees, which dropped continuously
from 42% in 2000 to 21% in 2015.
S&E Associate’s Degrees by Race and Ethnicity
Students from underrepresented minority groups (blacks, Hispanics, and American Indians and Alaska Natives) earn a
higher proportion of associate’s degrees than of bachelor’s or more advanced degrees, in S&E fields and in all fields.[11] (See the S&E Bachelor’s Degrees by Race and Ethnicity and S&E Doctoral Degrees by Race and Ethnicity sections.) In 2015,
underrepresented minorities earned 35% of S&E associate’s degrees—more than 40% of all associate’s degrees in social and
behavioral sciences; 39% of those in the biological sciences; about 30% of those in physical sciences, mathematics, and
computer sciences; and 23% of those in engineering (Appendix Table 2-19).
S&E Associate’s Degrees by Sex and Race and Ethnicity
In 2015, women earned more than half of the associate’s degrees awarded to their respective racial or ethnic group in the
social and behavioral sciences and in non-S&E fields, but less than half of those in the natural sciences and in engineering
(Appendix Table 2-20). In all racial and ethnic groups, the difference was particularly large in engineering (between 56% and
80%, with the largest gap among blacks) and lower in the natural sciences (between 20% and 48%; with the largest gap among
whites). In the last 15 years, the gender gap in the natural sciences grew in all racial and ethnic groups. During this period, the
gender gap in engineering remained at similar levels among whites, Hispanics, and American Indians or Alaska Natives, but
increased among blacks and declined among Asians or Pacific Islanders (for additional data, see NSF/NCSES 2017a).
S&E Bachelor’s Degrees
The baccalaureate is the most prevalent S&E degree, accounting for nearly 70% of all S&E degrees awarded. S&E bachelor’s
degrees have consistently accounted for roughly one-third of all bachelor’s degrees for at least the past 15 years (Appendix
Table 2-21). The number of S&E bachelor’s degrees awarded rose steadily from about 400,000 in 2000 to more than 650,000 in

National Science Board | 2 | 55
CHAPTER 2 | Higher Education in Science and Engineering
Science & Engineering Indicators 2018
2015 (Appendix Table 2-21).[12] During this period, the number of bachelor’s degrees awarded increased fairly consistently, although to different extents, in all S&E fields. The exception was computer sciences, where the number increased sharply
from 2000 to 2004, dropped as sharply through 2009, but has been increasing again since then ( Figure 2-10; Appendix Table
2-21).
Year
Thou
sand
s
Social sciences Biological and agricultural sciences Psychology EngineeringComputer sciences Physical sciences Mathematics and statistics
2000 2001 2002 2003 2004 2005 2006 2007 2008 2009 2010 2011 2012 2013 2014 20150
50
100
150
200
Note(s)
Physical sciences include earth, atmospheric, and ocean sciences.
Source(s)
National Center for Education Statistics, Integrated Postsecondary Education Data System (IPEDS), Completions Survey; National
Science Foundation, National Center for Science and Engineering Statistics, WebCASPAR database, https://ncsesdata.nsf.gov/
webcaspar/.
Science and Engineering Indicators 2018
S&E Bachelor’s Degrees by Sex
Since 1982, women have outnumbered men in undergraduate education. Since the late 1990s, they have earned about
57% of all bachelor’s degrees and half of all S&E bachelor’s degrees (NSF/NCSES 2017a).
Men and women prefer different fields of study; these tendencies continue at the master’s and doctoral levels. In 2015,
men earned the vast majority of bachelor’s degrees awarded in engineering, computer sciences, and physics and more than
FIGURE 2-10
S&E bachelor’s degrees, by field: 2000–15
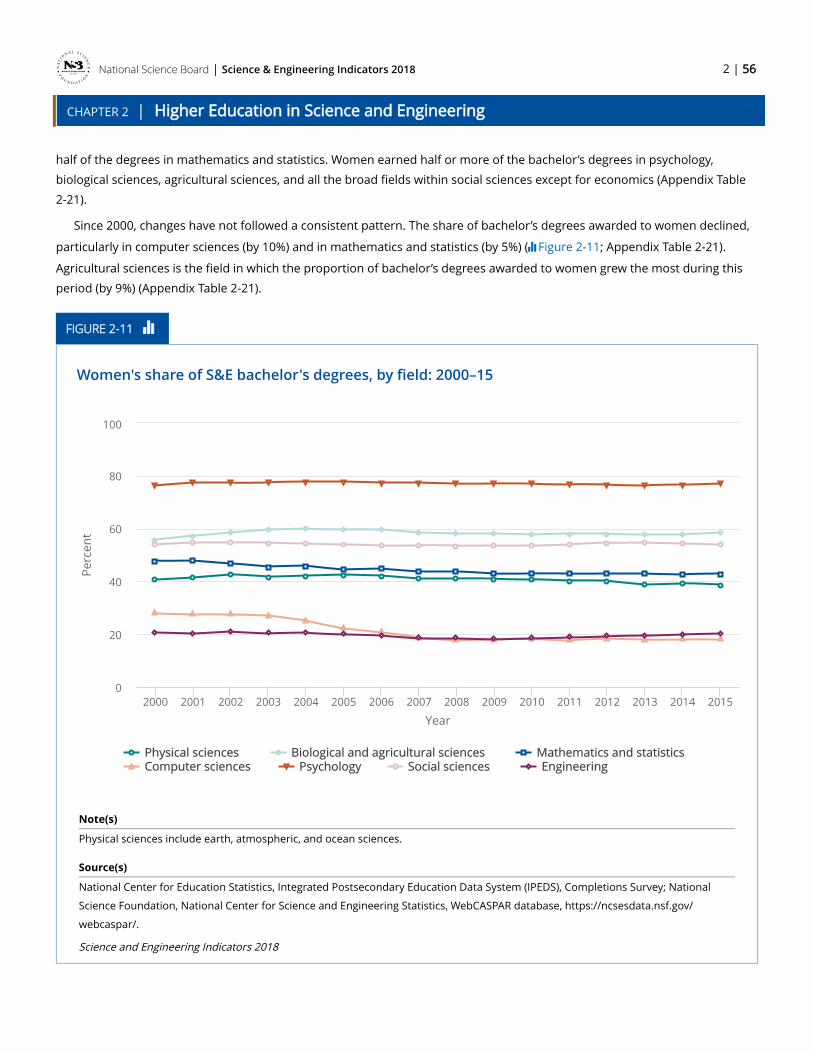
National Science Board | 2 | 56
CHAPTER 2 | Higher Education in Science and Engineering
Science & Engineering Indicators 2018
half of the degrees in mathematics and statistics. Women earned half or more of the bachelor’s degrees in psychology,
biological sciences, agricultural sciences, and all the broad fields within social sciences except for economics (Appendix Table
2-21).
Since 2000, changes have not followed a consistent pattern. The share of bachelor’s degrees awarded to women declined,
particularly in computer sciences (by 10%) and in mathematics and statistics (by 5%) ( Figure 2-11; Appendix Table 2-21).
Agricultural sciences is the field in which the proportion of bachelor’s degrees awarded to women grew the most during this
period (by 9%) (Appendix Table 2-21).
Year
Perc
ent
Physical sciences Biological and agricultural sciences Mathematics and statisticsComputer sciences Psychology Social sciences Engineering
2000 2001 2002 2003 2004 2005 2006 2007 2008 2009 2010 2011 2012 2013 2014 20150
20
40
60
80
100
Note(s)
Physical sciences include earth, atmospheric, and ocean sciences.
Source(s)
National Center for Education Statistics, Integrated Postsecondary Education Data System (IPEDS), Completions Survey; National
Science Foundation, National Center for Science and Engineering Statistics, WebCASPAR database, https://ncsesdata.nsf.gov/
webcaspar/.
Science and Engineering Indicators 2018
FIGURE 2-11
Women's share of S&E bachelor's degrees, by field: 2000–15

National Science Board | 2 | 57
CHAPTER 2 | Higher Education in Science and Engineering
Science & Engineering Indicators 2018
S&E Bachelor’s Degrees by Race and Ethnicity
The racial and ethnic composition of the cohort of S&E bachelor’s degree recipients has changed over time, reflecting
population changes and increasing rates of college attendance by members of minority groups.[13]
Excluding temporary visa holders, between 2000 and 2015, the number of S&E bachelor’s degrees earned by white
students increased, but their share declined from 71% to 61% ( Figure 2-12; Appendix Table 2-22). The share awarded to
Hispanic students increased from 7% to 13%, and the share awarded to Asians increased from 9% to 10%. The share awarded
to blacks (9%) has remained flat since 2000, and the share awarded to American Indians or Alaska Natives dropped from 0.7%
to 0.5% in this period. The number of S&E bachelor’s degrees earned by students of other or unknown race or ethnicity nearly
doubled to about 27,000 in 2015 (about 4% of all S&E bachelor’s degree recipients), suggesting that the specific percentages
just cited are best viewed as approximations.
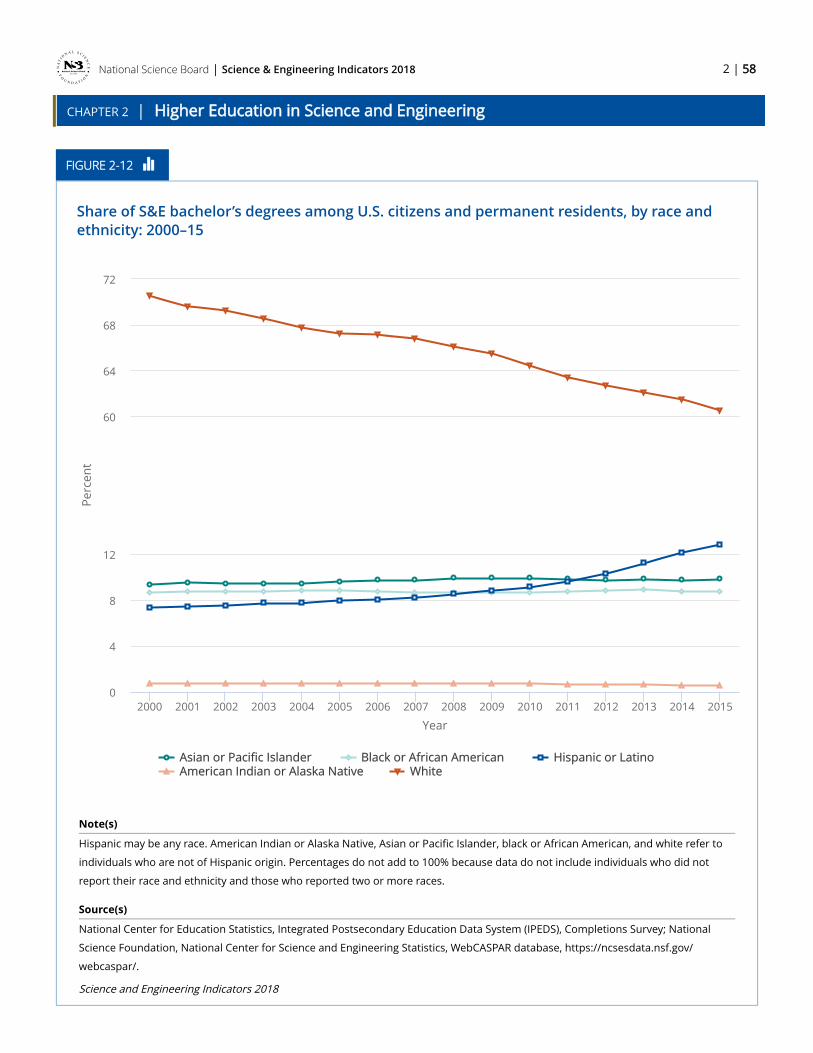
National Science Board | 2 | 58
CHAPTER 2 | Higher Education in Science and Engineering
Science & Engineering Indicators 2018
Year
Perc
ent
Asian or Pacific Islander Black or African American Hispanic or LatinoAmerican Indian or Alaska Native White
2000 2001 2002 2003 2004 2005 2006 2007 2008 2009 2010 2011 2012 2013 2014 20150
4
8
12
60
64
68
72
Note(s)
Hispanic may be any race. American Indian or Alaska Native, Asian or Pacific Islander, black or African American, and white refer to
individuals who are not of Hispanic origin. Percentages do not add to 100% because data do not include individuals who did not
report their race and ethnicity and those who reported two or more races.
Source(s)
National Center for Education Statistics, Integrated Postsecondary Education Data System (IPEDS), Completions Survey; National
Science Foundation, National Center for Science and Engineering Statistics, WebCASPAR database, https://ncsesdata.nsf.gov/
webcaspar/.
Science and Engineering Indicators 2018
FIGURE 2-12
Share of S&E bachelor’s degrees among U.S. citizens and permanent residents, by race and ethnicity: 2000–15

National Science Board | 2 | 59
CHAPTER 2 | Higher Education in Science and Engineering
Science & Engineering Indicators 2018
Some of these trends may reflect changes in the way NCES and other federal statistical agencies began collecting race and
ethnicity data under the Office of Management and Budget’s most recent guidelines, which include students of multiple races
starting with the data from the 2011 IPEDS Completions survey.[14] The new race and ethnicity categories now allow students who in the past may have reported their race or ethnicity to be American Indian or Alaska Native, Asian or Other Pacific
Islander, black, Hispanic, or white, to be classified as a student of multiple races. As a result, this category reached about
20,000 bachelor’s degree awards in 2015. However, because the trends discussed previously had also been observed before
2011, it is unlikely that the changes in the racial or ethnic categories contributed to the declines or increases to a very large
extent.
Over more than three decades, the gap in educational attainment at the bachelor’s level between young minorities and
whites has narrowed but continues to be wide. From 1980 to 2015, the percentage of the population ages 25–29 with a
bachelor’s or higher degree in any field changed from 12% to 21% for blacks, 8% to 16% for Hispanics, and 25% to 43% for
whites (NCES 2017). Their continuing differences with whites reflect lower rates of high school completion, college enrollment,
and college persistence and attainment. (For information on immediate post–high school college enrollment rates, see
Chapter 1 section Transition to Higher Education.)
Among those who did graduate from college in 2015, all groups but Asians and Pacific Islanders shared a similar
distribution across broad S&E fields. Between 10% and 13% of all baccalaureate degrees were in the natural sciences, and 2%–
5% were in in engineering. In contrast, Asians and Pacific Islanders were more likely than any of the other groups to earn
degrees in the natural sciences (24%) and engineering fields (9%) (Appendix Table 2-22).
Since 2000, the total number of bachelor’s degrees in all fields and in S&E fields overall increased for most racial and ethnic
groups (Appendix Table 2-22). The exception was computer sciences. Degrees in this field increased considerably through
2003–04, sharply declined through 2008–09, then started to increase again, with degrees earned by Hispanics and whites
exceeding their previous 2004 highs (57% higher for Hispanics, 6% higher for whites).[15]
S&E Bachelor’s Degrees by Sex and Race and Ethnicity
In 2015, underrepresented minority women earned more than half of all S&E bachelor’s degrees in their respective racial
or ethnic groups, whereas white and Asian women earned close to half of them (Appendix Table 2-20). Women in all racial and
ethnic groups earned the majority of bachelor’s degrees in the social and behavioral sciences and in non-S&E fields, and about
half of those in the natural sciences. In all racial and ethnic groups, the differences in the number of bachelor’s degree awards
between women and men is particularly high in engineering. Among underrepresented minority groups, gender gaps in
engineering and the natural sciences became more pronounced between 2000 and 2015, particularly among blacks. The
proportion of bachelor’s degree awards in engineering to black women declined from 36% to 25% between 2000 and 2015; in
the natural sciences, they declined from nearly 60% in 2000 to 52% in 2015 (for additional data by field of study, see NSF/
NCSES 2017a).
S&E Bachelor’s Degrees by Citizenship
Students on temporary visas in the United States have consistently earned a small share (about 4%–5%) of S&E degrees at
the bachelor’s level. In 2015, these students earned a substantially larger share of bachelor’s degrees awarded in economics
(17%); mathematics and statistics (14%); and in industrial, electrical, and chemical engineering (11%–13%). The total number of
S&E bachelor’s degrees awarded to students on temporary visas increased from about 15,000 in 2000 to about 19,000 in 2004,
then declined to less than 17,000 by 2008, but it has increased continuously since then, peaking at almost 33,000 in 2015
(Appendix Table 2-22).
[1] For the most recent nationally representative data on undergraduate student enrollment by disability status, see NSB 2016 and NSF/NCSES 2017a.
National Science Board | 2 | 60
CHAPTER 2 | Higher Education in Science and Engineering
Science & Engineering Indicators 2018
[2] Special tabulation from the IPEDS Fall Enrollment survey, available at https://ncsesdata.nsf.gov/webcaspar/.
[3] For details on freshmen intention to major in S&E by demographics, see NSB 2016.
[4]The data in this section include international students pursuing both bachelor’s and associate’s degrees. The data come from the Student and Exchange Visitor Information System (SEVIS). SEVIS collects administrative data, including the numbers of all international students enrolled in colleges and universities in the United States. Data include students who are in the SEVIS database between April 16 and November 15 of each year.
[5] The data include active foreign national students on F-1 visas in the SEVIS database, excluding those participating in optional practical training (OPT). Students with F visas have the option of working in the United States by engaging in OPT, temporary employment directly related to the student’s major area of study, during or after completion of the degree program. Students can apply for 12 months of OPT at each level of education. Starting in 2008, students in certain STEM fields became eligible for an additional 17 months of OPT. The number of students in OPT varies according to labor market conditions.
[6] See https://nces.ed.gov/surveys/bps/about.asp. Accessed 8 May 2017.
[7] Special tabulation from the Beginning Postsecondary Student survey.
[8] Based on a special tabulation of the 2015 NSCG. A recent graduate is a respondent who received his or her most recent degree between 1 July 2008 and 30 June 2013.
[9] Some credentials in the form of certificates take up to a year to complete. Recent research on licenses and certification from the Census Bureau’s Survey of Income and Program Participation shows that the vast majority of these types of credentials are in health care, education, and trades; business/finance management; legal/social services; and other non-S&E fields. Only 2% of the licenses and certifications are in S&E, specifically in computer sciences (Ewert and Kominski 2014).
[10] Data on degree completion from NCES were obtained from WebCASPAR (https://webcaspar.nsf.gov/). Data uploaded in WebCASPAR correspond to NCES provisional data, which undergo all NCES data quality control procedures and are imputed for nonresponding institutions. These data are used by NCES in its First Look (Provisional Data) publications.
[11] Data for racial and ethnic groups are for U.S. citizens and permanent residents only.
[12] Data on degree completion from NCES were obtained from WebCASPAR (https://webcaspar.nsf.gov/). Data uploaded in WebCASPAR correspond to NCES provisional data, which undergo all NCES data quality control procedures and are imputed for nonresponding institutions. These data are used by NCES in its First Look (Provisional Data) publications.
[13] Data for racial and ethnic groups are for U.S. citizens and permanent residents only.
[14] For details on the changes in the race and ethnicity categories in IPEDS, see https://nces.ed.gov/ipeds/Section/ana_Changes_to_25_2007_169. Accessed 21 August 2017.
[15] For patterns on S&E bachelor’s degrees awarded to minority men and minority women, see NSF/NCSES 2017a.

National Science Board | 2 | 61
CHAPTER 2 | Higher Education in Science and Engineering
Science & Engineering Indicators 2018
Graduate Education, Enrollment, and Degrees in the United States
Graduate education in S&E contributes to a country’s global competitiveness by producing the highly skilled workers of the
future and the research needed for a knowledge-based economy. This section includes indicators related to S&E graduate
enrollment and degree awards in the United States including participation by women, minorities, and international students in
U.S. graduate education.
Graduate Enrollment by Field
S&E graduate enrollment in the United States reached nearly 668,000 in 2015, an increase of about 35% since 2000
(Appendix Table 2-23).[1] Most of the growth in this period occurred in the 2000s, with stable enrollment between 2008 and 2013 and resumed growth in 2014 and 2015. The highest enrollment growth was recorded in computer sciences, mathematics
and statistics, medical sciences, and engineering. Most other S&E fields also had substantial growth. Enrollment in the social
sciences grew from 83,000 in 2000 to 111,000 in 2011, then declined to 103,000 by 2015.
Enrollment in computer sciences had increased gradually or remained stable through 2012, then accelerated from 52,000
to more than 86,000 in only 3 years. Temporary visa students accounted for most of this growth (Appendix Table 2-23). Along
the same lines, the number of first-time, full-time graduate students in computer sciences, an indicator of developing trends,
nearly doubled in the last 3 years (Appendix Table 2-24).
In 2015, first-time, full-time graduate enrollees accounted for 24% of total S&E graduate enrollment. These students are
typically pursuing a master’s or a doctoral degree right after or within about a year after earning their undergraduate degree.
This indicator can be sensitive to economic conditions; for example, high unemployment tends to lead to an increase in first-
time, full-time graduate enrollment. Between 2000 and 2015, first-time, full-time graduate S&E enrollment has increased fairly
steadily in most broad S&E fields while peaking in engineering, computer sciences, mathematics and statistics, agricultural,
and biological sciences. In psychology and in the social sciences, the number of first-time, full-time graduate students had
declined slightly in recent years but the numbers in these two broad fields increased in 2015 (Appendix Table 2-24).[2]
Graduate Enrollment of International Students
Since 2008, S&E graduate students with temporary visas have kept U.S. graduate enrollment in these fields from shrinking.
Since that year, these students’ share has risen from 26% to 36% of the total, making them an ever more vital part of this
critical enterprise. Although enrollment of international students in S&E fields has been on the rise, graduate enrollment of
U.S. citizens and permanent residents declined between 2008 and 2013 but slowly started growing again in 2014 (Appendix
Table 2-25). In 2015, about 240,000 international students on temporary visas were enrolled in S&E graduate programs,
representing 36% of total U.S. graduate enrollment. The proportion of international enrollment was highest—47% or higher—
in computer sciences, engineering (particularly high in electrical engineering), mathematics and statistics, and economics.[3]
After a post-9/11 decline, the numbers of first-time, full-time international graduate students enrolled increased steadily in
most broad fields through 2015 (Appendix Table 2-24). Declines and subsequent increases in number were concentrated in
engineering and computer sciences, the fields heavily favored by international students. Between 2000 and 2015, the
proportion of first-time, full-time S&E international students increased, particularly in computer sciences and mathematics
and statistics.
Most recently, data from SEVIS show an overall 6% decline in international graduate students from fall 2016 to fall 2017
( Table 2-10; Appendix Table 2-26).[4] As stated previously, this decline may reflect a smaller influx of international students
in the United States, and given the way these data are collected, it may also reflect a smaller portion of international students

National Science Board | 2 | 62
CHAPTER 2 | Higher Education in Science and Engineering
Science & Engineering Indicators 2018
staying in the United States to pursue another degree.[5] In 2017, 62% of all international students in graduate programs at U.S. institutions were enrolled in S&E fields. Between fall 2016 and fall 2017, the number of international graduate students
enrolled in S&E fields decreased most in computer sciences (from 70,600 to 61,500) and engineering (from 96,300 to 89,000).
The number of international students enrolled in mathematics increased (from 15,800 to 18,100) and remained at fairly
similar levels in other S&E fields.
The top sending locations in 2017 continued to be India and China, accounting for 69% of the international S&E graduate
students in the United States, followed by Iran, South Korea, Saudi Arabia, and Taiwan (Appendix Table 2-26). Compared to
2016, the number of graduate S&E students from India, Saudi Arabia, Iran, and South Korea declined in 2017 (by 19%, 11%,
1%, and 1% respectively) while the number from China and Taiwan increased (by 4% and 5% respectively).
About 8 in 10 graduate students from India, Iran, Bangladesh, and Sri Lanka and more than 6 in 10 of graduate students
from China, Pakistan, and Nepal were enrolled in an S&E field. In the case of Iran, more than half of them were enrolled in
engineering; in the case of Bangladesh, 42%. In contrast, more than 60% of the international students from Canada, South
Korea, Brazil and Japan were enrolled in non-S&E fields.
S&E Master’s Degrees
In some fields, such as engineering and geosciences, a master’s degree can fully prepare students for an established career
track. In other fields, master’s degrees primarily mark a step toward doctoral degrees. Master’s degrees awarded in S&E fields
nearly doubled from about 96,000 in 2000 to about 181,000 in 2015 (Appendix Table 2-27).[6] Increases occurred in all major science fields and were strongest in mathematics and statistics, biological sciences, computer sciences, and engineering
(Appendix Table 2-27). In computer sciences and engineering, the number of master’s degrees awarded declined between
2004 and 2007, similar to bachelor’s degrees, but it has since increased and in 2015 was the highest in the last 16 years
( Figure 2-13).

National Science Board | 2 | 63
CHAPTER 2 | Higher Education in Science and Engineering
Science & Engineering Indicators 2018
Year
Thou
sand
s
Engineering Social sciences Psychology Computer sciencesBiological and agricultural sciences Physical sciences Mathematics and statistics
2000 2001 2002 2003 2004 2005 2006 2007 2008 2009 2010 2011 2012 2013 2014 20150
10
20
30
40
50
60
Note(s)
Physical sciences include earth, atmospheric, and ocean sciences.
Source(s)
National Center for Education Statistics, Integrated Postsecondary Education Data System (IPEDS), Completions Survey; National
Science Foundation, National Center for Science and Engineering Statistics, WebCASPAR database, https://ncsesdata.nsf.gov/
webcaspar/.
Science and Engineering Indicators 2018
Professional Science Master’s (PSM) programs, which stress interdisciplinary training, are a relatively new direction in
graduate education. PSM degrees provide advanced training in an S&E field beyond the bachelor’s degree level while also
developing administrative and business skills that are valued by employers, such as leadership, project management,
teamwork, and communication (for details on PSM degrees, see NSB 2014:2–30). As of January 2017, there were 355 PSM
programs within 165 institutions; the most popular PSM programs were in the fields of biotechnology, biomedical, and
pharmaceuticals; environmental science, ocean science, sustainability, and geographic information systems; and computer
sciences, analytics, and big data or statistics (PSM 2017).
FIGURE 2-13
S&E master's degrees, by field: 2000–15
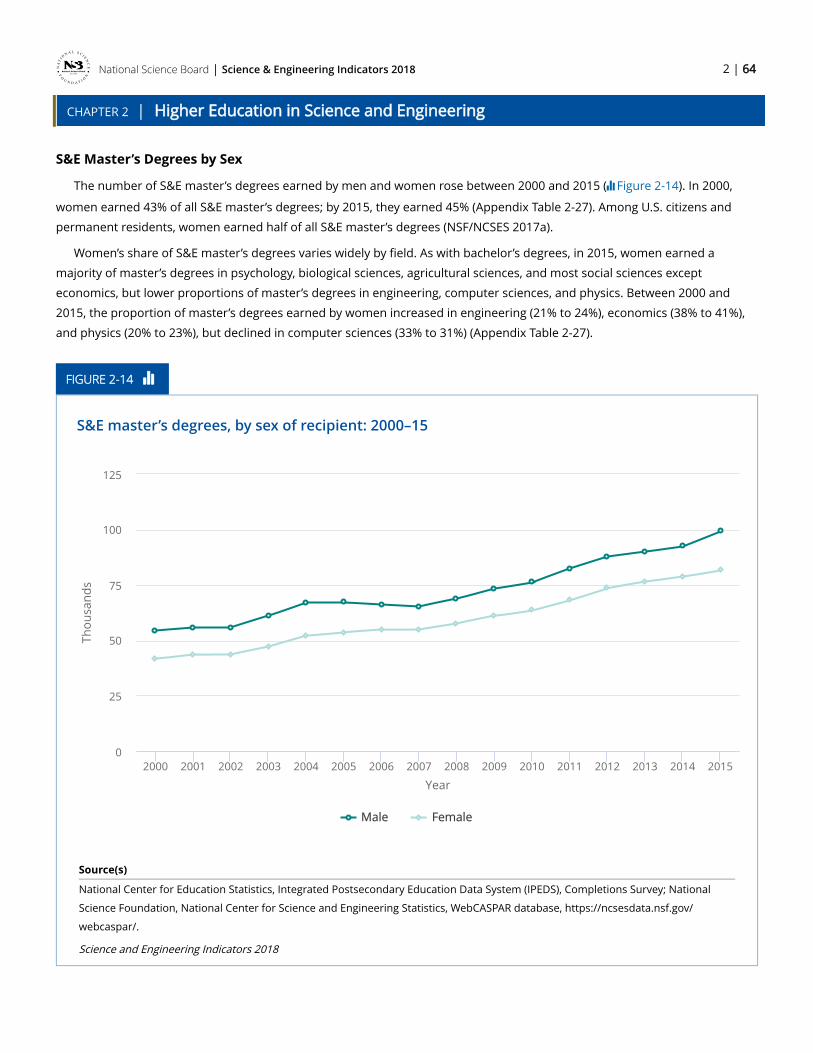
National Science Board | 2 | 64
CHAPTER 2 | Higher Education in Science and Engineering
Science & Engineering Indicators 2018
S&E Master’s Degrees by Sex
The number of S&E master’s degrees earned by men and women rose between 2000 and 2015 ( Figure 2-14). In 2000,
women earned 43% of all S&E master’s degrees; by 2015, they earned 45% (Appendix Table 2-27). Among U.S. citizens and
permanent residents, women earned half of all S&E master’s degrees (NSF/NCSES 2017a).
Women’s share of S&E master’s degrees varies widely by field. As with bachelor’s degrees, in 2015, women earned a
majority of master’s degrees in psychology, biological sciences, agricultural sciences, and most social sciences except
economics, but lower proportions of master’s degrees in engineering, computer sciences, and physics. Between 2000 and
2015, the proportion of master’s degrees earned by women increased in engineering (21% to 24%), economics (38% to 41%),
and physics (20% to 23%), but declined in computer sciences (33% to 31%) (Appendix Table 2-27).
Year
Thou
sand
s
Male Female
2000 2001 2002 2003 2004 2005 2006 2007 2008 2009 2010 2011 2012 2013 2014 20150
25
50
75
100
125
Source(s)
National Center for Education Statistics, Integrated Postsecondary Education Data System (IPEDS), Completions Survey; National
Science Foundation, National Center for Science and Engineering Statistics, WebCASPAR database, https://ncsesdata.nsf.gov/
webcaspar/.
Science and Engineering Indicators 2018
FIGURE 2-14
S&E master’s degrees, by sex of recipient: 2000–15

National Science Board | 2 | 65
CHAPTER 2 | Higher Education in Science and Engineering
Science & Engineering Indicators 2018
S&E Master’s Degrees by Race and Ethnicity
The number of S&E master’s degrees awarded to U.S. citizens and permanent residents increased for all racial and ethnic
groups between 2000 and 2015 ( Figure 2-15; Appendix Table 2-28).[7] The number of S&E master’s degrees earned by
underrepresented minorities (25,200) is less than half the number earned by temporary visa holders (59,000).
The proportion of U.S. S&E master’s degrees earned by underrepresented racial and ethnic minorities increased from 14%
to 21% between 2000 and 2015; the proportion earned by whites fell from 70% to 60%. The trends are similar to those found
in the data on bachelor’s degree awards among racial and ethnic groups. Blacks accounted for 11% of S&E master’s degree
recipients in 2015, up from 8% in 2000; Hispanics accounted for 9%, up from 5%; and American Indians and Alaska Natives
accounted for 0.4%, similar to the proportion in 2000. The proportion of Asian and Pacific Islander S&E recipients declined
from 10% to 9% in this period.
Some of the changes by race and ethnicity over time may reflect changes in the way NCES and other federal statistical
agencies collect information on this topic. Beginning in 2011, some students may be classified as multiracial who in the past
may have been reported as American Indian or Alaska Native, Asian and Pacific Islander, black, Hispanic, or white. The number
of students with a multiracial identity accounted for about 13,000 master’s degree awards in 2015. However, because the
trends by race and ethnicity discussed here had also been observed before 2011, it is unlikely that the changes in the racial or
ethnic categories contributed to the declines or increases to a very large extent.
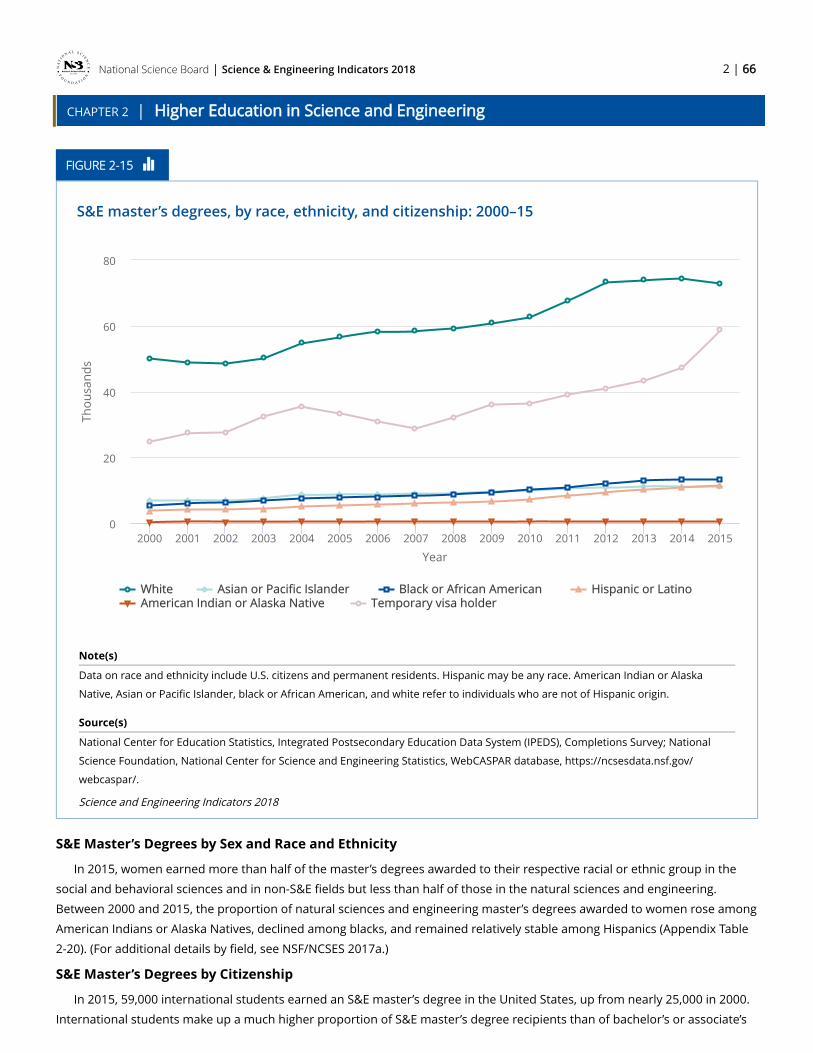
National Science Board | 2 | 66
CHAPTER 2 | Higher Education in Science and Engineering
Science & Engineering Indicators 2018
Year
Thou
sand
s
White Asian or Pacific Islander Black or African American Hispanic or LatinoAmerican Indian or Alaska Native Temporary visa holder
2000 2001 2002 2003 2004 2005 2006 2007 2008 2009 2010 2011 2012 2013 2014 20150
20
40
60
80
Note(s)
Data on race and ethnicity include U.S. citizens and permanent residents. Hispanic may be any race. American Indian or Alaska
Native, Asian or Pacific Islander, black or African American, and white refer to individuals who are not of Hispanic origin.
Source(s)
National Center for Education Statistics, Integrated Postsecondary Education Data System (IPEDS), Completions Survey; National
Science Foundation, National Center for Science and Engineering Statistics, WebCASPAR database, https://ncsesdata.nsf.gov/
webcaspar/.
Science and Engineering Indicators 2018
S&E Master’s Degrees by Sex and Race and Ethnicity
In 2015, women earned more than half of the master’s degrees awarded to their respective racial or ethnic group in the
social and behavioral sciences and in non-S&E fields but less than half of those in the natural sciences and engineering.
Between 2000 and 2015, the proportion of natural sciences and engineering master’s degrees awarded to women rose among
American Indians or Alaska Natives, declined among blacks, and remained relatively stable among Hispanics (Appendix Table
2-20). (For additional details by field, see NSF/NCSES 2017a.)
S&E Master’s Degrees by Citizenship
In 2015, 59,000 international students earned an S&E master’s degree in the United States, up from nearly 25,000 in 2000.
International students make up a much higher proportion of S&E master’s degree recipients than of bachelor’s or associate’s
FIGURE 2-15
S&E master’s degrees, by race, ethnicity, and citizenship: 2000–15
National Science Board | 2 | 67
CHAPTER 2 | Higher Education in Science and Engineering
Science & Engineering Indicators 2018
degree recipients, but they make up a smaller proportion of S&E doctoral degrees. In 2015, international students earned 35%
of S&E master’s degrees, up from 26% in 2000. Their degrees were heavily concentrated in computer sciences, economics,
mathematics and statistics, and engineering, where they received about half or more of all master’s degrees awarded in 2015
(Appendix Table 2-28). Within engineering, students on temporary visas earned 70% of the master’s degrees awarded in
electrical engineering and more than half of the master’s degrees in chemical and materials engineering.
In 2015, the number of S&E master’s degrees awarded to students on temporary visas reached its highest point in recent
years (59,000), after a sharp decline between 2004 and 2007. Most of the drop during this period was accounted for by
decreasing numbers of temporary visa holders in the computer sciences and engineering fields, but in both fields, numbers
rebounded by more than 50% in the following years.
S&E Doctoral Degrees
Doctoral education in the United States generates new knowledge by closely linking specialized education and hands-on
research experience. The results are important for the society as a whole and for U.S. competitiveness in a global knowledge-
based economy, as they prepare a new generation of researchers and a highly skilled workforce for various sectors of the
economy including academia, industry, government, and nonprofit organizations. Decades-long participation of large and
growing numbers of temporary visa holders attests to the attractiveness of U.S. doctoral education.
The number of S&E doctorates conferred annually by U.S. universities increased from nearly 28,000 in 2000 to 45,000 in
2015 (Appendix Table 2-29). U.S. citizens and permanent residents as well as temporary visa holders contributed to this
growth (for a discussion on international doctoral recipients who stay in the United States after obtaining their degree, see
Chapter 3).[8] The largest increases in S&E doctorates between 2000 and 2015 were in engineering and computer sciences
( Figure 2-16).[9]

National Science Board | 2 | 68
CHAPTER 2 | Higher Education in Science and Engineering
Science & Engineering Indicators 2018
Year
Thou
sand
s
Engineering Biological sciences Physical sciences Social sciences PsychologyMedical sciences Mathematics Computer sciences Agricultural sciences
2000 2001 2002 2003 2004 2005 2006 2007 2008 2009 2010 2011 2012 2013 2014 20150
2
4
6
8
10
12
Note(s)
Physical sciences include earth, atmospheric, and ocean sciences. Data differ from doctoral degree data in other tables and figures in
this report that are based on the National Science Foundation Survey of Earned Doctorates and that refer to research doctorates
only. Greatest differences are in psychology and medical sciences.
Source(s)
National Center for Education Statistics, Integrated Postsecondary Education Data System (IPEDS), Completions Survey; National
Science Foundation, National Center for Science and Engineering Statistics, WebCASPAR database, https://ncsesdata.nsf.gov/
webcaspar/.
Science and Engineering Indicators 2018
Time to Doctoral Degree Completion
The time required to earn a doctoral degree and the success rates of those entering doctoral programs are important for
those pursuing a degree, the universities awarding the degree, and the agencies and organizations funding doctoral study.
Longer times to degree mean lost earnings and a higher risk of attrition. Median time to degree (as measured by time from
graduate school entry to doctorate receipt) increased through the mid-1990s but has since decreased in all S&E fields from 7.7
to 6.8 years (Appendix Table 2-30). The physical sciences and mathematics had the shortest time to degree, whereas the social
sciences and medical and other health sciences had the longest.
FIGURE 2-16
S&E doctoral degrees earned in U.S. universities, by field: 2000–15

National Science Board | 2 | 69
CHAPTER 2 | Higher Education in Science and Engineering
Science & Engineering Indicators 2018
Time to degree varied among institution types (see sidebar Carnegie Classification of Academic Institutions) and was
typically longer at universities that were less strongly oriented toward research ( Table 2-13). Consequently, time to degree
was shortest at research universities with very high research activity (6.7 years in 2015, down from 7.2 years in 2000).
Doctorate recipients at medical schools also finished relatively quickly (6.7 years in 2015).
The median time to degree varies by demographic groups, but these variations reflect differences among broad fields of
study. In 2015, across all doctorate recipients, women had a longer time to degree than men (7.7 versus 7.2 years,
respectively) (Appendix Table 2-31). However, with few exceptions, these differences were very small when comparing men
and women within broad S&E fields. In engineering, women took slightly less time than men (6.3 versus 6.7 years,
respectively), and in medical and other health sciences, the difference reversed and was considerably larger (9.7 for women
versus 7.7 years for men).
In most natural sciences and engineering fields, time to degree was longer for temporary visa holders than for U.S.
students, particularly in the physical sciences (6.7 versus 5.7 years, respectively). However, in the medical and other health
sciences, as in computer sciences, temporary visa holders finished faster. Among U.S. citizen and permanent resident
students, in most broad S&E fields, median time to degree was shorter for whites than for other groups.

National Science Board | 2 | 70
CHAPTER 2 | Higher Education in Science and Engineering
Science & Engineering Indicators 2018
Median number of years from entering graduate school to receipt of S&E doctorate, by 2010 Carnegie classification of doctorate-granting institution: 2000–15
(Median number of years)
YearAll
institutions
Research universities —
very high research activity
Research universities —
high research activity
Doctoral/ research
universities
Medical schools
and medical
centers
Other or not
classified
2000 7.5 7.2 8.2 9.2 7.2 7.9
2001 7.2 7.2 8.2 9.7 6.9 7.7
2002 7.5 7.2 8.1 9.9 6.9 8.2
2003 7.6 7.2 8.2 9.7 6.9 9.0
2004 7.2 7.0 8.0 9.3 6.9 7.7
2005 7.3 7.2 7.9 9.4 7.0 8.2
2006 7.2 7.0 7.9 9.0 6.9 7.7
2007 7.0 7.0 7.7 8.9 6.9 7.7
2008 7.0 6.9 7.7 8.9 6.7 7.7
2009 7.0 6.9 7.7 9.2 6.8 7.7
2010 7.0 6.9 7.7 8.9 6.7 7.3
2011 7.0 6.9 7.7 8.8 6.7 7.7
2012 7.0 6.8 7.7 8.9 6.7 7.9
2013 6.9 6.7 7.4 9.3 6.7 7.7
2014 6.9 6.7 7.3 9.4 6.7 7.7
2015 6.8 6.7 7.3 9.4 6.7 7.7
Note(s)
Includes only doctorate recipients who reported year of entry to first graduate school or program.
Source(s)
National Science Foundation, National Center for Science and Engineering Statistics, special tabulations (2016), 2015 Survey of Earned
Doctorates (SED).
Science and Engineering Indicators 2018
TABLE 2-13
National Science Board | 2 | 71
CHAPTER 2 | Higher Education in Science and Engineering
Science & Engineering Indicators 2018
S&E Doctoral Degrees by Sex
Women have reached parity among S&E doctoral degree recipients: among U.S. citizens and permanent residents,
women’s proportion of S&E doctoral degrees was 51% in 2015, up from 45% in 2000 (Appendix Table 2-29). During this period,
women made gains in most major fields, among continuing disparities in other fields. In 2015, women earned half or more of
doctorates in non-S&E fields, in most social and behavioral sciences except for economics, in the biological sciences, and in the
medical and other health sciences. They earned less than one-third of the doctorates awarded in mathematics and statistics,
computer sciences, and engineering (Appendix Table 2-29). Although low, the proportions of degrees earned by women in
these fields and the physical sciences (particularly in physics) were higher than they were in 2000.
Between 2000 and 2015, the number of S&E doctorates earned by women grew faster (from nearly 11,000 to nearly
20,000) than the number earned by men (from almost 17,000 to 24,000), increasing women’s proportion of S&E doctoral
degrees during this period (Appendix Table 2-29). The increase among women occurred in most major S&E fields. For
example, the number of engineering doctorates earned by U.S. women more than doubled from approximately 500 in 2000 to
nearly 1,200 in 2015. Similar growth patterns occurred in women’s biological sciences doctorates from 1,700 to 3,000, and in
physical sciences doctorates from 600 to nearly 1,000.
S&E Doctoral Degrees by Disability Status
In 2014, 7% of S&E doctorate recipients reported having a disability; they were fairly similar to those who did not report a
disability in terms of broad field of study. Nearly half of the S&E doctorate recipients who reported one or more disabilities of
any type indicated that they had visual disabilities, 40% reported cognitive disabilities, 18% reported hearing disabilities, 10%
reported lifting disabilities, and 6% reported walking disabilities (NSF/NCSES 2017a).
S&E Doctoral Degrees by Race and Ethnicity
The number and the proportion of doctoral degrees in S&E fields earned by underrepresented minorities increased
between 2000 and 2015. In 2015, blacks earned 1,855 S&E doctorates, Hispanics earned 2,019, and American Indians and
Alaska Natives earned 137—altogether accounting for 9% of all S&E doctoral degrees awarded that year, up from 6% in 2000
(Appendix Table 2-32).[10] The share of the S&E doctorates earned by U.S. citizen and permanent resident underrepresented minority doctorate recipients rose from 9% to 14% in the same period. Gains by all groups contributed to this rise, although
blacks and Hispanics saw larger gains than American Indians or Alaska Natives ( Figure 2-17). Asians and Pacific Islanders
(citizens and permanent residents) earned 6% of all S&E doctorates in 2015, similar to 2000. Although whites (including U.S.
citizens and permanent residents) saw a rise in the number of S&E doctorates ( Figure 2-18), their share of all U.S. S&E
doctorates fell from 54% in 2000 to 44% in 2015 (Appendix Table 2-32).
Some of the changes by race and ethnicity over time may reflect changes in the way NCES and other federal statistical
agencies collect information on this topic. Beginning in 2011, some students may be classified as multiracial who in the past
may have been reported as American Indian or Alaska Native, Asian and Pacific Islander, black, Hispanic, or white. The number
of students with a multiracial identity accounted for about 500 doctoral degree awards in 2015. However, because the trends
by race and ethnicity discussed here had also been observed before 2011, it is unlikely that the changes in the racial or ethnic
categories contributed to the declines or increases to a very large extent.

National Science Board | 2 | 72
CHAPTER 2 | Higher Education in Science and Engineering
Science & Engineering Indicators 2018
Year
Num
ber
Black or African American Hispanic or Latino American Indian or Alaska Native
2000 2001 2002 2003 2004 2005 2006 2007 2008 2009 2010 2011 2012 2013 2014 20150
500
1,000
1,500
2,000
2,500
Note(s)
Data differ from doctoral degree data in other tables and figures in this report that are based on the National Science Foundation
Survey of Earned Doctorates and that refer to research doctorates only. Greatest differences are in psychology and medical or other
health sciences. Hispanic may be any race. American Indian or Alaska Native and black or African American refer to individuals who
are not of Hispanic origin. The large drop in 2009 is due to the change in doctoral categories in the survey.
Source(s)
National Center for Education Statistics, Integrated Postsecondary Education Data System (IPEDS), Completions Survey; National
Science Foundation, National Center for Science and Engineering Statistics, WebCASPAR database, https://ncsesdata.nsf.gov/
webcaspar/.
Science and Engineering Indicators 2018
FIGURE 2-17
S&E doctoral degrees earned by U.S. citizen and permanent resident underrepresented minorities, by race and ethnicity: 2000–15

National Science Board | 2 | 73
CHAPTER 2 | Higher Education in Science and Engineering
Science & Engineering Indicators 2018
Year
Thou
sand
s
U.S. citizen or permanent resident, white Temporary visa holderU.S. citizen or permanent resident, underrepresented minorityU.S. citizen or permanent resident, Asian or Pacific IslanderU.S. citizen or permanent resident, other or unknown race or ethnicity
2000 2001 2002 2003 2004 2005 2006 2007 2008 2009 2010 2011 2012 2013 2014 20150
5
10
15
20
25
Note(s)
Minority includes American Indian or Alaska Native, Asian or Pacific Islander, black or African American, and Hispanic or Latino. Data
differ from doctoral degree data in other tables and figures in this report that are based on the National Science Foundation Survey
of Earned Doctorates and that refer to research doctorates only. Greatest differences are in psychology and medical or other health
sciences. The large drop in U.S. data in 2009 is due to the change in doctoral categories in the survey.
Source(s)
National Center for Education Statistics, Integrated Postsecondary Education Data System (IPEDS), Completions Survey; National
Science Foundation, National Center for Science and Engineering Statistics, WebCASPAR database, https://ncsesdata.nsf.gov/
webcaspar/.
Science and Engineering Indicators 2018
S&E Doctoral Degrees by Sex and Race and Ethnicity
In 2015, women earned half or more of the doctoral degrees awarded to their respective racial or ethnic groups in the
natural sciences, the social and behavioral sciences, and in non-S&E fields. Since 2000, the proportion of women earning
doctorates increased in the natural sciences, social and behavioral sciences, and engineering in all racial and ethnic groups
except for American Indians or Alaska Natives (Appendix Table 2-20). (For additional data by field of study, see NSF/NCSES
2017a.)
FIGURE 2-18
S&E doctoral degrees, by race, ethnicity, and citizenship: 2000–15
National Science Board | 2 | 74
CHAPTER 2 | Higher Education in Science and Engineering
Science & Engineering Indicators 2018
International S&E Doctorate Recipients
International students on temporary visas earned more than 15,000 S&E doctorates in 2015, up from about 8,000 in 2000,
with a rising share from 30% to 34% over the period. In engineering, they earned more than half of the degrees in any
subspecialty; the same for mathematics and computer sciences and for economics (Appendix Table 2-34). They earned
relatively lower proportions of doctoral degrees in some S&E fields—for example, 28% in biological sciences, 20% in medical
sciences, 6% in psychology, and between 12% and 22% in most social sciences except economics (Appendix Table 2-34).
Countries and Economies of Origin
Since 1995, U.S. universities have awarded a total of almost 221,000 S&E doctorates to temporary visa holders. Over that
period, the top 10 countries and economies of origin accounted for 70% of all international recipients of these degrees
( Table 2-14). Six out of those top 10 locations are in Asia.

National Science Board | 2 | 75
CHAPTER 2 | Higher Education in Science and Engineering
Science & Engineering Indicators 2018
Recipients of U.S. S&E doctorates on temporary visas, by country or economy of origin: 1995–2015
(Number and percent)
Country or economy Number Percent
All recipients on temporary visas 220,684 100.0
Top 10 total 155,259 70.4
Chinaa 63,576 28.8
India 30,251 13.7
South Korea 20,626 9.3
Taiwan 13,001 5.9
Turkey 6,610 3.0
Canada 6,350 2.9
Thailand 4,564 2.1
Mexico 3,502 1.6
Japan 3,473 1.6
Iran 3,306 1.5
All others 65,425 29.6
a Includes Hong Kong.
Note(s)
Data include non-U.S. citizens with unknown visa status.
Source(s)
National Science Foundation, National Center for Science and Engineering Statistics, special tabulations (2016), 2015 Survey of Earned
Doctorates (SED).
Science and Engineering Indicators 2018
Asia
From 1995 to 2015, students from four Asian locations (China, India, South Korea, and Taiwan, in descending order) earned
more than half of all U.S. S&E doctoral degrees awarded to international students (127,000 of 221,000)—nearly five times the
number of doctoral recipients from Europe (26,000). China accounted for more than one-quarter of all these international S&E
doctorates (64,000), followed by India (30,000), South Korea (21,000), and Taiwan (13,000). Most of these degrees were
TABLE 2-14

National Science Board | 2 | 76
CHAPTER 2 | Higher Education in Science and Engineering
Science & Engineering Indicators 2018
awarded in engineering, biological sciences, and physical sciences ( Table 2-15). A larger proportion of South Korean and
Taiwanese students (exceeding 25%) than Chinese and Indian (approaching 10%) earned a doctorate in a non-S&E field.
The number of S&E doctorates earned by students from China has increased more than seven times in the last 20 years,
from 675 to nearly 5,000, whereas the numbers from India nearly tripled between 2002 and 2009 but have since remained
stable at 2,100. In the last 10 years, the numbers of S&E doctorates from South Korea and Taiwan have been broadly stable
but remain low (about 900 and 500, respectively) ( Figure 2-19).
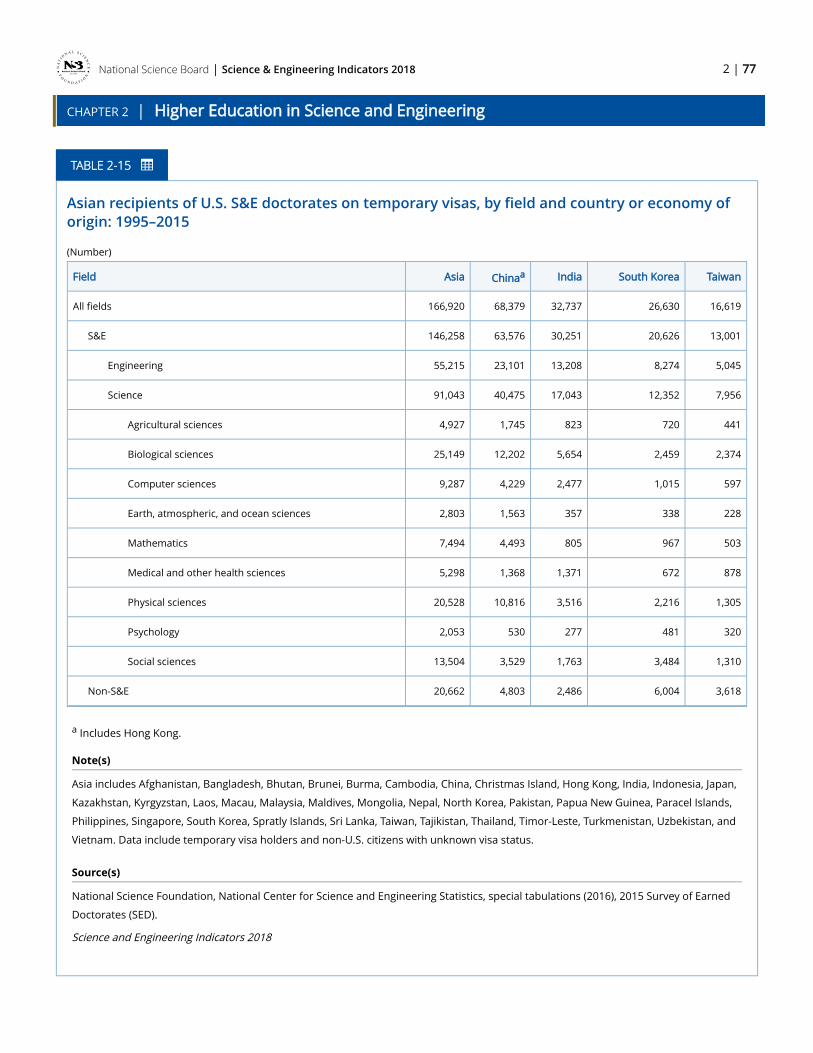
National Science Board | 2 | 77
CHAPTER 2 | Higher Education in Science and Engineering
Science & Engineering Indicators 2018
Asian recipients of U.S. S&E doctorates on temporary visas, by field and country or economy of origin: 1995–2015
(Number)
Field Asia Chinaa India South Korea Taiwan
All fields 166,920 68,379 32,737 26,630 16,619
S&E 146,258 63,576 30,251 20,626 13,001
Engineering 55,215 23,101 13,208 8,274 5,045
Science 91,043 40,475 17,043 12,352 7,956
Agricultural sciences 4,927 1,745 823 720 441
Biological sciences 25,149 12,202 5,654 2,459 2,374
Computer sciences 9,287 4,229 2,477 1,015 597
Earth, atmospheric, and ocean sciences 2,803 1,563 357 338 228
Mathematics 7,494 4,493 805 967 503
Medical and other health sciences 5,298 1,368 1,371 672 878
Physical sciences 20,528 10,816 3,516 2,216 1,305
Psychology 2,053 530 277 481 320
Social sciences 13,504 3,529 1,763 3,484 1,310
Non-S&E 20,662 4,803 2,486 6,004 3,618
a Includes Hong Kong.
Note(s)
Asia includes Afghanistan, Bangladesh, Bhutan, Brunei, Burma, Cambodia, China, Christmas Island, Hong Kong, India, Indonesia, Japan,
Kazakhstan, Kyrgyzstan, Laos, Macau, Malaysia, Maldives, Mongolia, Nepal, North Korea, Pakistan, Papua New Guinea, Paracel Islands,
Philippines, Singapore, South Korea, Spratly Islands, Sri Lanka, Taiwan, Tajikistan, Thailand, Timor-Leste, Turkmenistan, Uzbekistan, and
Vietnam. Data include temporary visa holders and non-U.S. citizens with unknown visa status.
Source(s)
National Science Foundation, National Center for Science and Engineering Statistics, special tabulations (2016), 2015 Survey of Earned
Doctorates (SED).
Science and Engineering Indicators 2018
TABLE 2-15

National Science Board | 2 | 78
CHAPTER 2 | Higher Education in Science and Engineering
Science & Engineering Indicators 2018
Year
Num
ber
China India South Korea Taiwan
19951996
19971998
19992000
20012002
20032004
20052006
20072008
20092010
20112012
20132014
20150
1,000
2,000
3,000
4,000
5,000
6,000
Note(s)
Degree recipients include temporary visa holders and non-U.S. citizens with unknown visa status. Data for China include Hong Kong.
Source(s)
National Science Foundation, National Center for Science and Engineering Statistics, special tabulations (2016), 2015 Survey of
Earned Doctorates (SED).
Science and Engineering Indicators 2018
Europe
European students earned far fewer U.S. S&E doctorates than Asian students between 1995 and 2015, and they tended to
focus less on engineering than did their Asian counterparts ( Table 2-15 and Table 2-16). European countries whose
students earned the largest number of U.S. S&E doctorates from 1995 to 2015 were Turkey, Germany, Russia, Italy, Romania,
Greece, and France, in that order. Trends in doctorate recipients from individual Western European countries vary widely
( Figure 2-20). The number of Central and Eastern European students earning S&E doctorates at U.S. universities nearly
doubled between 1995 and 2007, but it has declined since then; the number of doctorate recipients from Western Europe and
Scandinavia has been more stable overall ( Figure 2-21). A higher proportion of doctorate recipients from Russia, Romania,
Greece, and Turkey than from France, Italy, and Germany earned their doctorates in S&E. Russian and Romanian doctorate
recipients were more likely than those from Western European countries to earn their doctorates in mathematics and physical
FIGURE 2-19
U.S. S&E doctoral degree recipients, by selected Asian country or economy of origin: 1995–2015
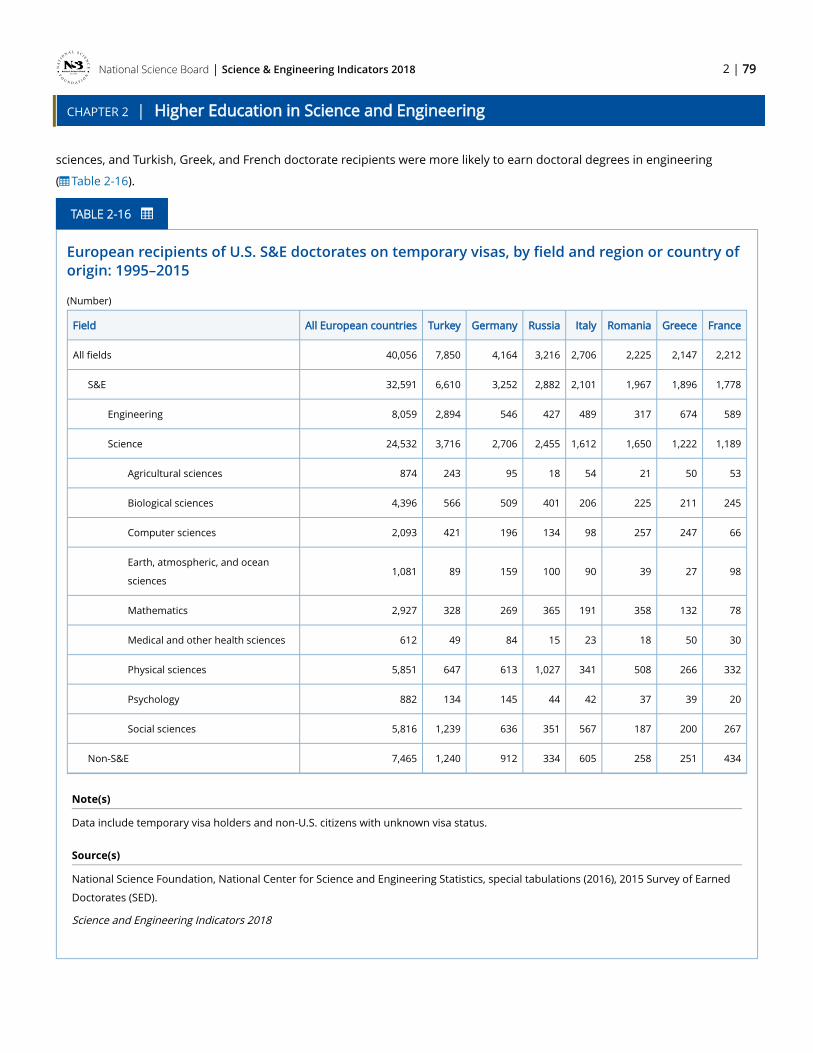
National Science Board | 2 | 79
CHAPTER 2 | Higher Education in Science and Engineering
Science & Engineering Indicators 2018
sciences, and Turkish, Greek, and French doctorate recipients were more likely to earn doctoral degrees in engineering
( Table 2-16).
European recipients of U.S. S&E doctorates on temporary visas, by field and region or country of origin: 1995–2015
(Number)
Field All European countries Turkey Germany Russia Italy Romania Greece France
All fields 40,056 7,850 4,164 3,216 2,706 2,225 2,147 2,212
S&E 32,591 6,610 3,252 2,882 2,101 1,967 1,896 1,778
Engineering 8,059 2,894 546 427 489 317 674 589
Science 24,532 3,716 2,706 2,455 1,612 1,650 1,222 1,189
Agricultural sciences 874 243 95 18 54 21 50 53
Biological sciences 4,396 566 509 401 206 225 211 245
Computer sciences 2,093 421 196 134 98 257 247 66
Earth, atmospheric, and ocean
sciences1,081 89 159 100 90 39 27 98
Mathematics 2,927 328 269 365 191 358 132 78
Medical and other health sciences 612 49 84 15 23 18 50 30
Physical sciences 5,851 647 613 1,027 341 508 266 332
Psychology 882 134 145 44 42 37 39 20
Social sciences 5,816 1,239 636 351 567 187 200 267
Non-S&E 7,465 1,240 912 334 605 258 251 434
Note(s)
Data include temporary visa holders and non-U.S. citizens with unknown visa status.
Source(s)
National Science Foundation, National Center for Science and Engineering Statistics, special tabulations (2016), 2015 Survey of Earned
Doctorates (SED).
Science and Engineering Indicators 2018
TABLE 2-16

National Science Board | 2 | 80
CHAPTER 2 | Higher Education in Science and Engineering
Science & Engineering Indicators 2018
Year
Num
ber
Turkey Germany Italy United Kingdom Greece France
19951996
19971998
19992000
20012002
20032004
20052006
20072008
20092010
20112012
20132014
20150
100
200
300
400
500
Note(s)
Degree recipients include temporary visa holders and non-U.S. citizens with unknown visa status.
Source(s)
National Science Foundation, National Center for Science and Engineering Statistics, special tabulations (2016), 2015 Survey of
Earned Doctorates (SED).
Science and Engineering Indicators 2018
FIGURE 2-20
U.S. S&E doctoral degree recipients, by selected European country: 1995–2015

National Science Board | 2 | 81
CHAPTER 2 | Higher Education in Science and Engineering
Science & Engineering Indicators 2018
Year
Num
ber
Western Europe Central and Eastern Europe Scandinavia
19951996
19971998
19992000
20012002
20032004
20052006
20072008
20092010
20112012
20132014
20150
250
500
750
1,000
1,250
1,500
Note(s)
Degree recipients include temporary visa holders and non-U.S. citizens with unknown visa status. Western Europe includes Andorra,
Austria, Belgium, France, Gibraltar, Germany, Holy See (Vatican City), Ireland, Italy, Liechtenstein, Luxembourg, Malta, Monaco,
Netherlands, Portugal, San Marino, Spain, Switzerland, and United Kingdom. Central and Eastern Europe includes Albania, Belarus,
Bosnia-Herzegovina, Bulgaria, Croatia, Cyprus, Czech Republic, Estonia, Greece, Hungary, Kosovo, Latvia, Lithuania, Macedonia,
Moldova, Montenegro, Poland, Romania, Russia, Serbia, Slovakia, Slovenia, Turkey, and Ukraine. Scandinavia includes Denmark,
Finland, Iceland, Norway, and Sweden. Data are not comparable with data presented in earlier years because a slightly different
geographic taxonomy was used.
Source(s)
National Science Foundation, National Center for Science and Engineering Statistics, special tabulations (2016), 2015 Survey of
Earned Doctorates (SED).
Science and Engineering Indicators 2018
The Americas
Despite the proximity of Canada and Mexico to the United States, the shares of U.S. S&E doctoral degrees awarded to
residents of these countries were small compared with those awarded to students from Asia and Europe. The number of U.S.
S&E doctoral degrees earned by students from Canada increased from about 219 in 1995 to 390 in 2009, but it has overall
FIGURE 2-21
U.S. S&E doctoral degree recipients from Europe, by region: 1995–2015

National Science Board | 2 | 82
CHAPTER 2 | Higher Education in Science and Engineering
Science & Engineering Indicators 2018
declined in the last 6 years. The overall numbers of doctoral degree recipients from Mexico and Brazil peaked earlier (2003
and 1996, respectively) and have been relatively stable in recent years ( Figure 2-22).
A higher proportion of Mexican and Brazilian students earned U.S. doctorates in S&E fields than the comparable
proportion for Canadians ( Table 2-17); this pattern was particularly strong in engineering and agricultural sciences.
Year
Num
ber
Canada Mexico Brazil
19951996
19971998
19992000
20012002
20032004
20052006
20072008
20092010
20112012
20132014
20150
100
200
300
400
500
Note(s)
Degree recipients include temporary visa holders and non-U.S. citizens with unknown visa status.
Source(s)
National Science Foundation, National Center for Science and Engineering Statistics, special tabulations (2016), 2015 Survey of
Earned Doctorates (SED).
Science and Engineering Indicators 2018
FIGURE 2-22
U.S. S&E doctoral degree recipients from Canada, Mexico, and Brazil: 1995–2015

National Science Board | 2 | 83
CHAPTER 2 | Higher Education in Science and Engineering
Science & Engineering Indicators 2018
North American, South American, and Middle Eastern recipients of U.S. S&E doctorates on temporary visas, by field and region and country of origin: 1995–2015
(Number)
FieldNorth and South Americaa Middle Eastb
All countries Canada Mexico Brazil All countries Iran Jordan Saudi Arabia
All fields 25,338 9,194 4,103 3,457 11,444 3,434 1,872 1,800
S&E 19,796 6,350 3,502 2,888 9,388 3,306 1,624 1,302
Engineering 4,241 1,023 887 625 4,486 2,347 693 487
Science 15,555 5,327 2,615 2,263 4,902 959 931 815
Agricultural sciences 1,860 211 522 392 285 42 78 59
Biological sciences 3,647 1,333 509 504 916 177 170 114
Computer sciences 720 228 124 167 635 186 118 120
Earth, atmospheric, and ocean sciences 681 209 133 107 143 26 11 42
Mathematics 997 320 205 153 403 119 90 41
Medical and other health sciences 844 388 91 171 522 40 175 146
Physical sciences 1,824 765 297 137 820 256 168 70
Psychology 940 720 41 55 191 15 7 12
Social sciences 4,042 1,153 693 577 987 98 114 211
Non-S&E 5,542 2,844 601 569 2,056 128 248 498
a North America includes Bermuda, Canada, Clipperton Island, Greenland, Mexico, and Saint Pierre and Miquelon. South America includes Argentina, Bolivia, Brazil, Chile, Colombia, Ecuador, Falkland Islands (Islas Malvinas), French Guyana, Guyana, Paraguay, Peru,
South Georgia and South Sandwich Islands, Suriname, Uruguay, and Venezuela.
b Middle East includes Akrotiri, Armenia, Azerbaijan, Bahrain, Dhekelia, Gaza Strip, Georgia, Iran, Iraq, Israel, Jordan, Kuwait, Lebanon, Oman, Qatar, Saudi Arabia, Syria, United Arab Emirates, West Bank, and Yemen.
Note(s)
Data include temporary visa holders and non-U.S. citizens with unknown visa status.
Source(s)
National Science Foundation, National Center for Science and Engineering Statistics, special tabulations (2016), 2015 Survey of Earned
Doctorates (SED).
TABLE 2-17

National Science Board | 2 | 84
CHAPTER 2 | Higher Education in Science and Engineering
Science & Engineering Indicators 2018
Science and Engineering Indicators 2018
The Middle East
Between 1995 and 2015, Middle Eastern students earned fewer U.S. S&E doctorates (about 9,000) than did students from
Asia, Europe, or the Americas ( Table 2-15, Table 2-16, and Table 2-17). Students from Iran earned the largest number of
U.S. S&E doctorates from this region, followed by those from Jordan and Saudi Arabia. A larger proportion of Iranian doctorate
recipients (68%) than of Jordanian or Saudi Arabian doctorate recipients (37% and 27%, respectively) earned their degrees in
engineering. A larger proportion of doctorate recipients from Saudi Arabia than from Jordan or Iran earned their doctorates in
the social sciences or in non-S&E fields.
[1] The Survey of Graduate Students and Postdoctorates in Science and Engineering (GSS) was redesigned in 2007. Because of methodological changes, the data collected after 2007 are not strictly comparable with those collected before 2007. To maintain some data continuity, the S&E data in this chapter excludes three new fields added in 2007 for all subsequent years. Beginning in 2008, a more rigorous follow-up was conducted with institutions to exclude reporting of practitioner-oriented graduate degree programs. Some or most of the declines in psychology and other health fields after 2008 are likely due to this increased effort rather than changes in actual enrollments. In 2014, the survey frame was updated, which resulted in adding 151 newly eligible institutions, and excluding two private for-profit institutions offering mostly practitioner-based graduate degrees because they were determined to be no longer eligible. This frame update increased the total number of science, engineering, and health graduate students by 2.5%, postdoctorates by 1.9%, and nonfaculty researchers by 1.9% over the previous frame. Because of these survey changes over time, data comparisons across years should be made with caution. For more information, please see Technical Notes, Data Comparability in the Survey of Graduate Students and Postdoctorates in Science and Engineering, Fall 2015 (https://ncsesdata.nsf.gov/datatables/gradpostdoc/2015/#tabs-2/).
[2] For additional data on graduate enrollment by sex and by race and ethnicity, please see data tables under Graduate enrollment in Women, Minorities, and Persons with Disabilities in Science and Engineering (https://nsf.gov/statistics/2017/nsf17310/data.cfm/) and data tables in the GSS (https://nsf.gov/statistics/srvygradpostdoc/#tabs-2/).
[3] See NSF/NCSES 2017a for more detail on enrollment of international students by sex.
[4]The data include active foreign national students on F-1 visas in the SEVIS database, excluding those on OPT (temporary employment directly related to the student’s major area of study during or after completing the degree program).
[5] For example, an international student who is about to earn a master’s degree and stays in the United States to pursue a doctoral degree would remain in the SEVIS database. It is not possible to determine the extent to which international students stay to pursue another degree because of the way the data are collected.
[6] Data on degree completion from NCES were obtained from WebCASPAR (https://webcaspar.nsf.gov/). Data uploaded in WebCASPAR correspond to NCES provisional data, which undergo all NCES data quality control procedures and are imputed for nonresponding institutions. These data are used by NCES in its First Look (Provisional Data) publications.
[7] Data for racial and ethnic groups are for U.S. citizens and permanent residents only.

National Science Board | 2 | 85
CHAPTER 2 | Higher Education in Science and Engineering
Science & Engineering Indicators 2018
[8] Data on degree completion from NCES were obtained from WebCASPAR (https://webcaspar.nsf.gov/). Data uploaded in WebCASPAR correspond to NCES provisional data, which undergo all NCES data quality control procedures and are imputed for nonresponding institutions. These data are used by NCES in its First Look (Provisional Data) publications.
[9] In 2008, NCES allowed optional reporting in three new doctoral degree categories: doctor’s—research/scholarship, doctor’s—professional practice, and doctor’s—other. Degrees formerly classified as professional degrees (e.g., MDs, JDs) could then be reported as doctoral degrees, most often as doctor’s—professional practice. Data for 2008 and 2009 included only those doctorates reported under the old category plus those reported as doctor’s—research/scholarship. Data for 2010 and 2011 included data reported as doctor’s—research/scholarship because the old category was eliminated. As a result of these methodological changes, doctor’s—research/scholarship degrees in other health sciences declined sharply between 2009 and 2010.
[10] For the corresponding proportion in the 1990s, see NSB 2008.
National Science Board | 2 | 86
CHAPTER 2 | Higher Education in Science and Engineering
Science & Engineering Indicators 2018
International S&E Higher Education
In the 1990s, many countries, coming to view an educated population and workforce as a valuable national resource,
began to expand their higher education systems and broaden participation in higher education. At the same time, flows of
students worldwide increased, often reflecting government incentives and programs. More recently, several countries have
adopted policies to encourage the return of students who studied abroad, to attract international students, or both. As the
world becomes more interconnected, students who enroll in tertiary (postsecondary) institutions outside their own countries
have opportunities to expand their knowledge of other societies and languages and improve their employability in globalized
labor markets.
Higher Education Expenditures
One indicator of the importance of higher education is the percentage of a nation’s resources devoted to it as measured by
the ratio of expenditures on tertiary education institutions to gross domestic product (GDP). This indicator varies widely
among members of the OECD, an intergovernmental group of developed economies. Nearly half of OECD members spend
more than the average of 1.5% of a nation’s GDP on tertiary education institutions, and only Canada, the United States, South
Korea, Chile, and Estonia spend 2% or more.[1] According to the most recently available data from the OECD, in 2013, the United States spent the highest proportion of GDP on tertiary education institutions compared with all other OECD countries,
followed by Canada,[2] South Korea, Chile, and Estonia (Appendix Table 2-33). Between 2005 and 2013, U.S. expenditures on tertiary education as a percentage of GDP were about 70% higher than the OECD average and about 90% higher than the
European Union (see Glossary for member countries) average. Between 2000 and 2015, expenditures on tertiary education
institutions as a percentage of GDP rose in most OECD countries, particularly in Estonia, Russia, Chile, and the Czech Republic
(40% growth or higher).
Higher education financing data are not always fully comparable across different nations. They can vary between countries
for reasons unrelated to actual expenditures, such as differences in measurement, types and levels of government funding
included, types and levels of education included, and the prevalence of public versus private institutions.[3]
Educational Attainment
Educational attainment, measured as the proportion of a population that has reached a specific level of education, is often
used as a proxy for human capital and the skill levels associated with that particular education level (OECD 2016). Higher
education in the United States expanded greatly after World War II. As a result, the U.S. population led the world in
educational attainment for several decades. Because of this, the United States offered clear advantages for firms whose work
would benefit from the availability of a highly educated workforce. In the 1990s, however, many countries in Europe and Asia
began to expand their higher education systems. Some of them have now surpassed the United States in the attainment of
bachelor’s or higher-level degrees among their younger cohorts. The generational shift in attainment so visible in many
systems is not visible in the United States. Over time, the expansion of higher education elsewhere has substantially
diminished the U.S. educational advantage.
Although the United States continues to be among the top countries with the highest percentage of the population ages
25–64 with a bachelor’s degree or higher, many countries have surpassed the United States in the percentage of the younger
population (ages 25–34) with a bachelor’s degree or higher ( Figure 2-23).[4]

National Science Board | 2 | 87
CHAPTER 2 | Higher Education in Science and Engineering
Science & Engineering Indicators 2018Co
untr
y
Percent
25–34 years old 25–64 years old
LithuaniaSouth KoreaLuxembourgNetherlands
PolandBelgium
United KingdomDenmark
FinlandIrelandEstonia
JapanGreece
AustraliaIceland
United StatesNew Zealand
OECD averageSweden
LatviaIsrael
CanadaNorway
SloveniaPortugalSlovakia
Czech RepublicHungary
GermanySpain
France (2014)Italy
AustriaMexicoTurkey
Chile (2013)Costa Rica
China (2010)
0 10 20 30 40 50 60
FIGURE 2-23
Attainment of bachelor's or higher degrees, by country and age group: 2015

National Science Board | 2 | 88
CHAPTER 2 | Higher Education in Science and Engineering
Science & Engineering Indicators 2018
OECD = Organisation for Economic Co-operation and Development.
Note(s)
Data include degrees at International Standard Classification of Education (ISCED) 2011 levels 6 (bachelor's or equivalent), 7 (master's
or equivalent), and 8 (doctorate or equivalent). Data are not comparable with data presented in earlier years because of a change to
ISCED 2011. Countries for which data at the short-cycle tertiary level (ISCED 5) were not available independently are not included.
Source(s)
OECD, Education at a Glance 2016: OECD Indicators (2016).
Science and Engineering Indicators 2018
First University Degrees in S&E Fields
More than 22 million students worldwide earned first university degrees in 2014 (see sidebar Comparability of
International Data in Tertiary Education and Glossary), with more than 7.5 million of these in S&E fields (Appendix Table
2-34).[5]

National Science Board | 2 | 89
CHAPTER 2 | Higher Education in Science and Engineering
Science & Engineering Indicators 2018
Comparability of International Data in Tertiary EducationEducation systems differ widely across the world. To ensure that international statistics and indicators are comparable,
most countries collect and report their education data under the United Nations Educational, Scientific and Cultural
Organization (UNESCO) International Standard Classification of Education (ISCED), developed in collaboration with
different countries and international organizations such as the Organisation for Economic Co-operation and
Development (OECD) and Eurostat (OECD, European Union [EU], UNESCO Institute for Statistics [UIS] 2015). Mapping a
country’s educational programs into the ISCED structure helps ensure that the international comparisons are more
transparent and consistent.
The first ISCED classification was developed by UNESCO in the mid-1970s and was first revised in 1997. The most recent
revision, the ISCED 2011, incorporated the major changes in the structure of degree levels brought in by the Bologna
Process in Europe in terms of degree levels. In the ISCED 1997, tertiary programs had been grouped into levels 5A
(programs leading to entry to advanced research programs) and 5B (programs not leading to entry to advanced research
programs (see Glossary) and doctoral level 6. The new ISCED 2011 allocates four different levels to tertiary education:
levels 5–8. Level 5 includes short-cycle tertiary education, level 6 includes the bachelor’s or equivalent level, level 7
includes the master’s or equivalent level, and level 8 includes the doctoral or equivalent level.
In addition, a separate but related process redesigned the fields of study classifications in the ISCED Fields of Education
and Training (ISCED-F); these new standards were adopted in 2013 (UNESCO Institute for Statistics 2014).
Science and Engineering Indicators 2018 is the first edition to present statistics collected under the ISCED 2011 and the
ISCED-F; previous editions had presented data collected under the ISCED 1997. As a result of these changes, there are
several differences between the higher education international data reported in this volume and in past volumes.
At the undergraduate level, the international comparisons in this volume present first degree data corresponding to
ISCED 2011 level 6 (first degrees) and level 7 (long first degrees). Some countries (e.g., Germany, Belgium, Switzerland)
reclassified some vocationally oriented programs previously classified as ISCED level 5B. As a result, the total numbers of
first university degrees for these countries are different under the new classification compared with the previous
classification. At the doctoral level, the data corresponding to the ISCED 2011 level 8 are similar to the doctoral degrees
reported in the past.
The changes in ISCED-F affect the following fields:
• The data for engineering in this volume correspond to the ISCED-F 2013 “engineering, manufacturing, and construction,” which includes engineering and engineering trades, manufacturing and processing, and architecture and construction. In addition, “environmental protection” was a newly added discipline to this broad field of engineering.
• The data for agriculture include “veterinary.”
• The data for social and behavioral sciences include “journalism and information.”
Because of these changes, the international higher education data have a higher degree of international comparability
than in the past. This is because (1) the data for the majority of the countries were collected under the same OECD, EU,
and UIS guidelines; and (2) the field groupings in the ISCED-F now have more in common with the aggregation of fields
SIDEBAR

National Science Board | 2 | 90
CHAPTER 2 | Higher Education in Science and Engineering
Science & Engineering Indicators 2018
used in China, a major degree producer. For example, China statistics include “architecture” and “landscape architecture”
under “engineering” and “veterinary” under “agricultural sciences” (China Ministry of Education 2011).
For comparability purposes, U.S. data in the international tables correspond to the ISCED-F classification of fields and, as
a result, the numbers reported in each of the broad fields are different from those reported in tables and graphics that
examine domestic trends in higher education.
These worldwide totals include only countries for which relatively recent data are available (primarily countries in Asia,
Europe, and the Americas) and are therefore underestimates of the global total. Asian universities accounted for more than 4
million of the world’s S&E first university degrees in 2014, with more than half of them in engineering. Students across Europe
(including Eastern Europe and Russia) earned more than 1.5 million S&E first university degrees (about 40% of them in
engineering), and students in North America earned nearly 1 million S&E first university degrees in 2014 (24% in engineering).
In terms of individual countries, India and China awarded the largest numbers of first university degrees in S&E (1.9 and 1.7
million, respectively), followed by the United States (742,000), Russia (429,000), and Japan (316,000).
In several countries around the world, the proportion of first university degrees in S&E fields was higher than in the United
States. Nearly half or more of all first university degrees in Japan, Iran, China, and Israel were in S&E fields, compared with
nearly 40% in the United States. In 2014, about 14% of all bachelor’s degrees awarded in the United States and worldwide
were in the natural sciences (physical, biological, computer, and agricultural sciences, as well as mathematics and statistics).
This proportion was similar to the proportions of first university degrees awarded in the natural sciences in Canada, New
Zealand, the Czech Republic, South Africa, Germany, and Armenia, but it was lower than the proportion awarded in the United
Kingdom (21%).
Between 2000 and 2014, the number of S&E first university degrees awarded in China, Taiwan, Germany,[6] Turkey, and
Romania at least doubled; it also grew, albeit at a slower rate, in Australia,[7] Mexico, the United Kingdom, and the United States; in France and Japan, it declined (by 5% and 11%, respectively) (Appendix Table 2-35).
In China, first university degrees increased greatly in all fields, with a larger increase in non-S&E than in S&E fields. Growth
in natural sciences and engineering degrees in China accounted for most of the country’s increase in S&E first university
degrees: an increase of almost 1.2 million degrees and up more than 400% from 2000 to 2014 ( Figure 2-24; Appendix Table
2-35). China has traditionally awarded a large proportion of its first university degrees in engineering, but the percentage
declined from 43% in 2000 to 33% in 2014 (Appendix Table 2-35).

National Science Board | 2 | 91
CHAPTER 2 | Higher Education in Science and Engineering
Science & Engineering Indicators 2018
Year
Thou
sand
s
China United States EU-Top 8 Japan Mexico South Korea Taiwan
2000 2001 2002 2003 2004 2005 2006 2007 2008 2009 2010 2011 2012 2013 20140
250
500
750
1,000
1,250
1,500
1,750
EU = European Union.
Note(s)
Natural sciences include agricultural sciences; biological sciences; computer sciences; earth, atmospheric, and ocean sciences; and
mathematics. Data are not comparable with data presented in earlier years because of a change to International Standard
Classification of Education 2011 and to a more aggregated taxonomy of fields. To facilitate international comparison, data for the
United States reflect the most recent classification in the International Standard Classification of Education Fields of Education and
Training (ISCED-F), which varies slightly from the National Science Foundation classification of fields presented in other sections of
the chapter. Data are not available for all countries or economies for all years. The EU-Top 8 total includes aggregated data for the
eight EU countries producing the highest number of S&E first university degrees in 2014: UK, Germany, France, Poland, Italy, Spain,
Romania, and the Netherlands.
Source(s)
FIGURE 2-24
First university natural sciences and engineering degrees, by selected country or economy: 2000–14
National Science Board | 2 | 92
CHAPTER 2 | Higher Education in Science and Engineering
Science & Engineering Indicators 2018
National Bureau of Statistics of China, China Statistical Yearbook, annual series (Beijing) (various years); Government of Japan,
Ministry of Education, Culture, Sports, Science and Technology, Survey of Education (2014); Ministry of Education, Educational
Statistics of the Republic of China (Taiwan): 2015 (2016); United Nations Educational, Scientific and Cultural Organization (UNESCO)
Institute for Statistics database, special tabulations (2016); Organisation for Economic Co-operation and Development (OECD),
OECD.Stat, https://stats.oecd.org/; National Center for Education Statistics, Integrated Postsecondary Education Data System (IPEDS),
Completions Survey; National Science Foundation, National Center for Science and Engineering Statistics, WebCASPAR database,
https://ncsesdata.nsf.gov/webcaspar/.
Science and Engineering Indicators 2018
In 1999, 29 European countries, through the Bologna Declaration, initiated a system of reforms in higher education
throughout Europe. The goal of the Bologna Process was to harmonize certain aspects of higher education within participating
countries so that degrees were comparable; credits were transferable; and students, teachers, and researchers could move
freely from institution to institution across national borders. Ten years later, 48 countries launched the European Higher
Education Area to implement these higher education reforms in Europe. In recent years, countries have made considerable
changes: they have modified higher education structures by implementing three degree cycles (bachelor’s, master’s, and
doctorate), developed quality assurance systems, and established mechanisms to facilitate mobility (Education, Audiovisual
and Culture Executive Agency [EACEA] 2012). A recent report that examined data in the areas of access, retention, and
employability across 36 education systems, however, indicated that most European countries have been slow to set clear
goals or monitor progress in those areas (EACEA 2014).
S&E First University Degrees by Sex
Women earned half or more of first university degrees in S&E in many countries around the world in 2014, including the
United States, Canada, and several smaller countries. Most large countries in Europe are not far behind, with women earning
more than 40% of S&E first university degrees. In most countries in the Middle East, except for Iran, women earned nearly half
or more of the S&E first university degrees. In Asia, women generally earn about one-third or fewer of the first university
degrees awarded in S&E fields. For example, in Taiwan, women earn 26% of the S&E first university degrees; in Japan, 29%; in
South Korea, 34%; in Singapore, 36%. Malaysia is the exception, with 55% of its S&E first university degrees awarded to women
in 2015 (Appendix Table 2-36).
In the United States and Canada, more than half of the S&E first university degrees earned by women were in the social
and behavioral sciences, and less than 10% were in engineering. In contrast, in South Korea and Singapore, nearly half of the
S&E first university degrees earned by women were in engineering. Among the largest producers of S&E degrees (those in
which 40% of their first university degrees were in S&E), other countries with relatively high proportions of women earning
first university degrees in engineering include Portugal (37%), Iran (35%), Romania (35%), and Malaysia (33%).
International Comparison of S&E Doctoral Degrees
More than 230,000 S&E doctoral degrees were awarded worldwide in 2014.[8] The United States awarded the largest number of S&E doctoral degrees of any country (about 40,000), followed by China (about 34,000), Russia (about 19,000),
Germany (about 15,000), the United Kingdom (about 14,000), and India (about 13,000) (Appendix Table 2-37). About 73,000
S&E doctoral degrees were earned in the EU (including the United Kingdom and Germany).
The number of S&E doctoral degrees awarded in China rose steeply between 2000 and 2009, but the increase has slowed
since then. Although the rise was steeper in China, doctoral production also increased in the United States (Appendix Table

National Science Board | 2 | 93
CHAPTER 2 | Higher Education in Science and Engineering
Science & Engineering Indicators 2018
2-38 and Appendix Table 2-39). In the United States, about 37% of these doctorates were awarded to temporary visa
holders.[9] Many of these doctorate recipients stay in the United States after obtaining their degree (for a discussion on “stay rates” of doctorate recipients who are temporary visa holders, see Chapter 3)
In 2007, China surpassed the United States as the world’s largest producer of natural sciences and engineering doctoral
degrees, but the numbers of doctoral degrees in these fields in these two countries remain close ( Figure 2-25). The high
growth of graduate education in China has been the result of large government investments in higher education over the last
20 years, intended to establish world-class universities in this country. Project 211 and Project 985 are examples of programs
launched by the Chinese government in the mid-1990s to establish and strengthen institutions of higher education and key
fields of study as a national priority (Lixu 2004).[10]

National Science Board | 2 | 94
CHAPTER 2 | Higher Education in Science and Engineering
Science & Engineering Indicators 2018
Year
Thou
sand
s
United States EU-Top 8 China India Japan South Korea
2000 2001 2002 2003 2004 2005 2006 2007 2008 2009 2010 2011 2012 2013 20140
10
20
30
40
50
60
EU = European Union.
Note(s)
Natural sciences and engineering include biological, physical, earth, atmospheric, ocean, and agricultural sciences; computer
sciences; mathematics; and engineering. To facilitate international comparison, data for the United States reflect the most recent
classification in the International Standard Classification of Education Fields of Education and Training (ISCED-F), which varies slightly
from the National Science Foundation classification of fields presented in other sections of the chapter. Data are not available for all
countries for all years. The Top 8 EU total includes aggregated data for the eight EU countries with the highest number of S&E
doctoral degree awards in 2014: UK, Germany, France, Spain, Italy, Portugal, Sweden, and Romania.
Source(s)
China—National Bureau of Statistics of China, China Statistical Yearbook, annual series (Beijing) (various years); India—Government
of India, Ministry of Human Resource Development, Department of Higher Education, All India Survey on Higher Education (2014);
Japan—Government of Japan, Ministry of Education, Culture, Sports, Science and Technology, Survey of Education (2014); United
Nations Educational, Scientific and Cultural Organization (UNESCO), Institute for Statistics database, special tabulations (2016);
United States—National Center for Education Statistics, Integrated Postsecondary Education Data System (IPEDS), Completions
Survey; National Science Foundation, National Center for Science and Engineering Statistics, WebCASPAR database, https://
ncsesdata.nsf.gov/webcaspar/.
Science and Engineering Indicators 2018
FIGURE 2-25
Natural sciences and engineering doctoral degrees, by selected country: 2000–14

National Science Board | 2 | 95
CHAPTER 2 | Higher Education in Science and Engineering
Science & Engineering Indicators 2018
In the United States, as well as in the United Kingdom, France, Germany, Italy, Spain, Switzerland, Poland, Ireland, and
Estonia, the largest numbers of S&E doctoral degrees were awarded in the natural sciences, including the physical and
biological sciences, and mathematics and statistics (Appendix Table 2-38). In many other countries, the proportion of S&E
doctoral degrees in engineering is 40% or greater; that is the case, for example, in Sweden, Slovakia, Latvia, Greece, Finland,
Bulgaria, Belgium, and Austria.
In Asia, China has been the largest producer of S&E doctoral degrees since 2000 (Appendix Table 2-39). As China’s capacity
for advanced S&E education increased, the number of S&E doctorates awarded rose from about 8,000 in 2000 to more than
34,000 in 2014. Despite the growth in the quantity of doctorate recipients, some question the quality of the doctoral programs
in China (Cyranoski et al. 2011). The rate of growth in doctoral degrees in S&E and in all fields has considerably slowed starting
in 2010 (Appendix Table 2-39), after an announcement by the Chinese Ministry of Education indicating that China would begin
to limit admissions to doctoral programs and focus more on the quality of graduate education (Mooney 2007).
Between 2000 and 2014, the number of S&E doctorates awarded in India, South Korea, and Taiwan more than doubled; in
Japan, the numbers rose consistently through 2006 but declined since then). In China, Japan, South Korea, and Taiwan, more
than half of S&E doctorates were awarded in engineering. In India, 58% of the S&E doctorates were awarded in the natural
sciences, computer sciences and agricultural sciences, 22% in the social and behavioral sciences, and 20% in engineering
(Appendix Table 2-39).
Women earned 42% of S&E doctoral degrees awarded in the United States in 2014, about the same percentage earned by
women in Canada and the EU (Appendix Table 2-40).[11] Women earned more than half of S&E doctoral degrees in Bulgaria, Croatia, Latvia, Lithuania, Poland, Slovenia, and Argentina but less than 25% of those in South Korea and Taiwan.
International Student Mobility
Governments around the world have increasingly come to regard movement toward a knowledge-based economy as key
to economic progress. Realizing that this requires a well-trained workforce, they have invested in upgrading and expanding
their higher education systems and broadening participation in them. In most instances, government spending underwrites
these initiatives.
Recent investments by several governments to send large numbers of their students to study abroad are a strategy for
workforce and economic development. Examples include the Brazil Scientific Mobility Program (also known as Science without
Borders), launched officially in July 2011, which provides scholarships to Brazilian students to study in STEM fields in
universities in the United States.[12] In 2013, the Mexican government announced its Proyecta 100,000 program, which plans to send 100,000 students to study in the United States and to welcome 50,000 U.S. citizens to study in Mexico by 2018 (Helms
and Griffin 2017; Lloyd 2014). The Chinese government has established the China Scholarship Council, a nonprofit affiliated
with the Ministry of Education with the goal to provide financial assistance to Chinese citizens to study abroad, as well as to
foreign citizens to study in China (China Scholarship Council 2017). Similarly, the government of Saudi Arabia has invested
considerably in a scholarship program launched in 2005 that has supported study abroad programs for more than 100,000
Saudi students throughout the world, at an estimated cost of at least $5 billion since the program’s inception. In 2016,
however, a tighter national budget in Saudi Arabia has resulted in a 12% reduction in financial support for this initiative
(Knickmeyer 2012; Walcutt 2016). The EU set the goal that 20% of its higher education graduates should have experienced
tertiary-level study or training abroad by 2020 (OECD 2016).
Students have become more internationally mobile in the past two decades, and countries are increasingly competing for
them. According to data from UNESCO/UIS, the number of internationally mobile students who pursued a higher education
degree more than doubled between 2000 and 2014, to 4.3 million.[13] In general, students migrate from developing countries
National Science Board | 2 | 96
CHAPTER 2 | Higher Education in Science and Engineering
Science & Engineering Indicators 2018
to the more developed countries and from Europe and Asia to the United States. However, a few countries have emerged as
regional hubs for certain geographic regions—for example, Australia, China, and South Korea for East Asia and South Africa
for sub-Saharan Africa (Bhandari, Belyavina, and Gutierrez 2011; UNESCO 2009). In Asia, two new programs, ASEAN
International Mobility for Students and Passage to ASEAN, encourage student mobility within Asia, although the level of
student mobility within the region is still low, except for the student exchanges between Malaysia and Indonesia. In addition,
several countries have set targets for increasing the numbers of international students they host; among these are Jordan
(which plans to host 100,000 students by 2020), Singapore (150,000 by 2015), Japan (300,000 by 2025), and China (500,000 by
2020) (Bhandari and Belyavina 2012).
Decisions about whether and where to study abroad are complex (OECD 2016). Some students migrate temporarily for
education, whereas others remain abroad permanently after completing their studies. Some factors influencing the decision
to seek a degree abroad include the policies of the countries of origin regarding sponsoring their citizens’ studies abroad, the
tuition fee policies of the countries of destination, the financial support the countries of destination offer to international
students, the cost of living and exchange rates that affect the cost of international education, and the quality of the programs
and the perceived value of obtaining a foreign credential. The long-term return on investment from international education
also depends on how international degrees are recognized by the labor market in the country of origin or elsewhere. For host
countries, enrolling international students can help raise revenues from higher education and can be part of a larger strategy
to attract highly skilled workers, particularly as demographic changes in many developed countries cause their own
populations of college-age students to decrease (OECD 2012) (Appendix Table 2-41).
In recent years, many countries have expanded their provision of transnational education. One growing trend is the
establishment of branch campuses: offshore programs established by higher education institutions in foreign countries. For
local students, branch campuses provide the opportunity to earn degrees from foreign universities without leaving their home
countries. For the institution venturing into a new country, meeting enrollment and financial goals without diluting quality
standards is often a challenge. Branch campuses that bring in faculty from other countries can also fulfill some of the demand
for highly qualified instructors that local higher education institutions cannot meet (UNESCO/UIS 2014).
According to the State University of New York at Albany’s Cross-Border Education Research Team (C-BERT 2017), a
clearinghouse of information and research on transnational education, as of January 2017, there were 310 international
branch campuses in operation. C-BERT defines a branch campus as “an entity that is owned, at least in part, by a foreign
higher education provider; operated in the name of the foreign education provider; and provides an entire academic program,
substantially on site, leading to a degree awarded by the foreign education provider.” Exporting countries (i.e., home countries
of the institutions establishing branch campuses) totaled 34, and importing countries (i.e., host countries for branch
campuses) totaled 84. The largest exporters of branch campuses, in order of the number of branch campuses established,
were the United States (109 branch campuses), the United Kingdom (45), France (31), Russia (22), and Australia (21). The
largest importers of branch campuses, in order of the number of branch campuses they hosted, were China (38 branch
campuses), the United Arab Emirates (33), United Arab Emirates at Dubai (32), Malaysia (16), Singapore (15), and Qatar (12). In
some cases, branch campuses are a part of what countries designate as an international “education hub.” C-BERT defines an
education hub as “a designated region intended to attract foreign investment, retain local students, build a regional reputation
by providing access to high-quality education and training for both international and domestic students, and create a
knowledge-based economy.” An education hub can include different combinations of domestic and international institutions,
branch campuses, and foreign partnerships within the designated region. Examples of education hubs include Qatar, the
United Arab Emirates, Abu Dhabi, Dubai, Hong Kong, Malaysia, Singapore, and Botswana (C-BERT 2017; Knight 2014).
More internationally mobile students (undergraduate and graduate) go to the United States than to any other country (19%
of internationally mobile students worldwide) ( Figure 2-26). Other top destinations for international students include the

National Science Board | 2 | 97
CHAPTER 2 | Higher Education in Science and Engineering
Science & Engineering Indicators 2018
United Kingdom (10%), Australia (6%), France (5%), Russia (5%), and Germany (5%). Together with the United States, these
countries receive about half of all internationally mobile students worldwide. Although the United States remains the
destination for the largest number of internationally mobile students worldwide, its overall share has declined from 25% in
2000 to 19% in 2014 (OECD 2016). As in other countries, the proportion of internationally mobile students in the United States
is higher at the graduate than at the undergraduate level (see Appendix Table 2-18, Appendix Table 2-21, Appendix Table 2-27,
and Appendix Table 2-29).
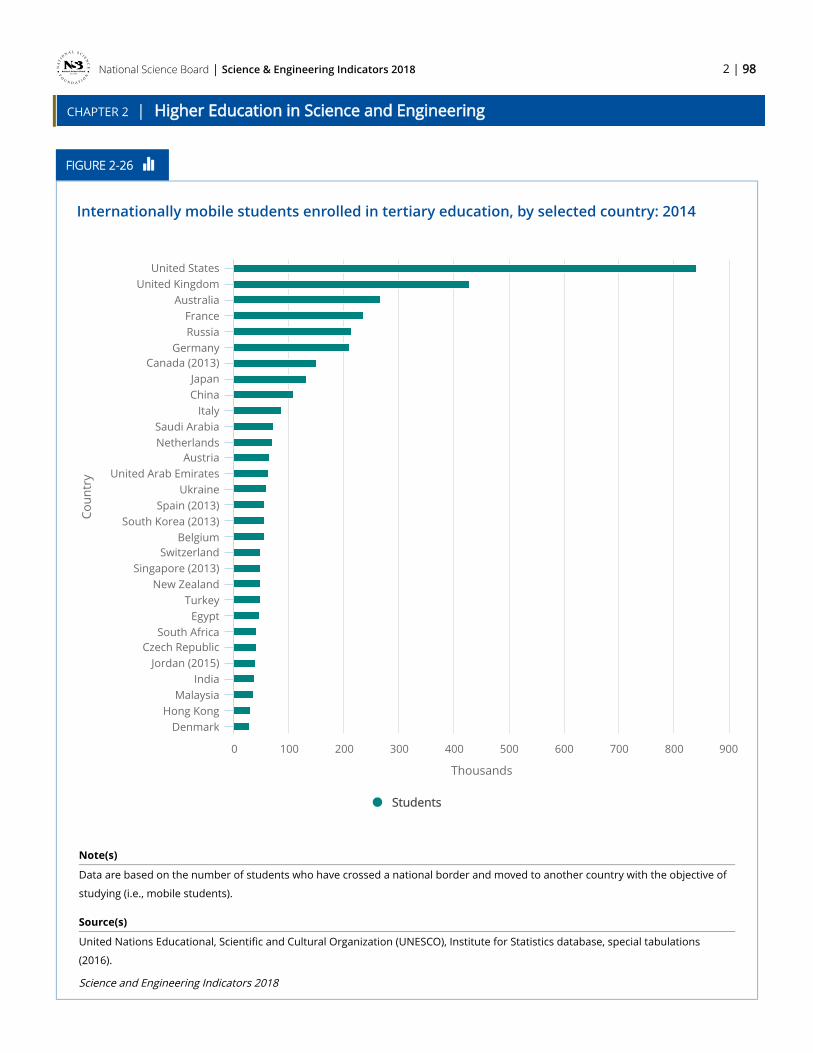
National Science Board | 2 | 98
CHAPTER 2 | Higher Education in Science and Engineering
Science & Engineering Indicators 2018Co
untr
y
Thousands
Students
United StatesUnited Kingdom
AustraliaFranceRussia
GermanyCanada (2013)
JapanChina
ItalySaudi ArabiaNetherlands
AustriaUnited Arab Emirates
UkraineSpain (2013)
South Korea (2013)Belgium
SwitzerlandSingapore (2013)
New ZealandTurkey
EgyptSouth Africa
Czech RepublicJordan (2015)
IndiaMalaysia
Hong KongDenmark
0 100 200 300 400 500 600 700 800 900
Note(s)
Data are based on the number of students who have crossed a national border and moved to another country with the objective of
studying (i.e., mobile students).
Source(s)
United Nations Educational, Scientific and Cultural Organization (UNESCO), Institute for Statistics database, special tabulations
(2016).
Science and Engineering Indicators 2018
FIGURE 2-26
Internationally mobile students enrolled in tertiary education, by selected country: 2014

National Science Board | 2 | 99
CHAPTER 2 | Higher Education in Science and Engineering
Science & Engineering Indicators 2018
International Student Enrollment in Selected Countries
United Kingdom
Since the late 1990s, the United Kingdom has been actively working to improve its position in international education, by
recruiting international students to study in the country and by expanding its provision of transnational education (British
Council 2015; United Kingdom Council for International Student Affairs [UKCISA] 2017). Between 2006 and 2016, international
student enrollment in S&E fields in the United Kingdom increased by about 36,000 international students at the
undergraduate level and by about 18,000 at the graduate level (Appendix Table 2-42). As in other countries, the proportion of
international students in S&E is much higher at the graduate than at the undergraduate level. For example, in 2015–16,
international students were 14% of all undergraduates in the United Kingdom (an increase from 10% in 2005–06), compared
with 47% at the graduate level (an increase from 43% in 2005–06). Within S&E, international students were particularly
prevalent in engineering. At the undergraduate level, international students were close to one-quarter of all engineering
students in 2016; at the graduate level, they accounted for the majority of the students in engineering and in mathematics and
computer sciences. China has been the main country sending S&E students to the United Kingdom during this period.
However, the number of S&E students from Hong Kong, Romania, and the United States grew considerably at the
undergraduate level. In 2016, the United States was among the top 5 countries sending undergraduates studying S&E to the
United Kingdom; it was not among the top 10 countries a decade earlier. At the graduate level, in this 10-year period, the
number of S&E students from Nigeria nearly doubled, and Italy and Saudi Arabia became 2 of the top 10 countries sending
S&E students to the United Kingdom (Appendix Table 2-42).
Japan
In the context of slowing student enrollment, in 2008, the Japanese government announced plans to triple international
enrollment within 12 years (McNeil 2008, 2010). Although Japan succeeded in increasing its enrollment of international
students between 2004 and 2016 (in S&E and in all fields), growth has slowed considerably in the last 4 years (Appendix Table
2-43; Appendix Table NSB 2012 2-42; Appendix Table NSB 2014 2-46), perhaps caused in part by the March 2011 earthquake
and tsunami (McNeil 2012). In 2016, nearly 70,000 international students were enrolled in S&E programs in Japanese
universities, similar to the preceding 4 years and up from 57,000 in 2004. As in other countries, international students
accounted for a smaller proportion of students at the undergraduate than at the graduate level in 2014 (3% of undergraduate
and 19% of graduate S&E students). The vast majority of the international students were from Asia. In 2016, Chinese students
accounted for slightly more than half of the international S&E undergraduate students and graduate students in Japan. South
Koreans were 16% of the international undergraduates and 6% of the international graduate students. Vietnam, Malaysia,
Indonesia, Thailand, and Taiwan are among the top 10 locations of origin that send both undergraduate and graduate
students to Japan (Appendix Table 2-43).
Canada
International students also constitute a larger share of enrollment at the graduate than at the undergraduate level in
Canada (Appendix Table 2-44). Between 2004 and 2014, the proportion of international enrollment in Canadian universities
grew slightly, from 6% to 7% at the undergraduate level and from 20% to 21% at the graduate level. In 2014, the highest
percentages of international S&E students were in mathematics and computer sciences and in engineering, at both degree
levels. At the undergraduate level, China was the top country of origin of international S&E students in Canada, accounting for
29% of international undergraduate students, followed by France and the United States (14% and 10%, respectively). The
proportion of international undergraduate S&E students in Canada from China and France increased considerably between
2004 and 2014, while the proportion of students from the United States declined. At the graduate level, the top country of
origin of international S&E students was also China with close to 3,700 students, but the country of origin of graduate S&E
students was diverse. For example, France and India each sent about 2,500 S&E students to Canada, and Iran sent about

National Science Board | 2 | 100
CHAPTER 2 | Higher Education in Science and Engineering
Science & Engineering Indicators 2018
1,900. Unlike undergraduate students, during 2004 and 2014, the proportion of international graduate students from China
declined slightly, and the proportion of those from France and the United States increased. The proportion of Indian S&E
graduate students studying in Canada increased from 5% to 13% between 2004 and 2014, and the proportion of Iranian S&E
students doubled to 10% in 2014.
U.S. Students Studying Abroad
Although the United States hosts the largest number of international students worldwide, U.S. students constitute a
relatively small share of international students worldwide. About 70,000 U.S. students (in all fields) were reported as
international students by OECD and OECD partner countries in 2012, far fewer than the number of international students
from China, India, South Korea, Germany, Turkey, or France. The main destinations of U.S. students were the United Kingdom
(about 16,600), Canada (about 9,600), Germany (about 4,300), France (about 3,900), New Zealand (about 3,200), and Australia
(about 2,900)—mostly English-speaking OECD countries (OECD 2014). Given the relatively low number of U.S. students who
study abroad and the importance of international experience in a globalized world, in 2014, the Institute of International
Education (IIE) established Generation Study Abroad. This 5-year initiative has the goal to increase the number of U.S. students
studying abroad, in credit and degree programs, to about 600,000 by 2019 (IIE 2017b).
About 300,000 U.S. university students enrolled in study abroad programs in the 2014–15 academic year (credit mobility—
see Glossary), a 3% increase from the preceding year but almost double the number from 2000–01 (IIE 2016). Nearly 40% were
enrolled in programs during the summer term, about one-third enrolled in programs lasting one semester, and nearly a
quarter enrolled in short-term programs lasting up to 8 weeks. Only 3% enrolled for the full academic year, and very few
enrolled for one or two quarters. The vast majority were undergraduates, primarily juniors and seniors; about 10% were
master’s students; and 1% were doctoral students. Two-thirds of the U.S. students studying abroad were women, and nearly
three-quarters were white. More than one-third were studying in S&E fields: 17% in social sciences, 8% in physical or life
sciences, 5% in engineering, 2% in mathematics or computer sciences, and 2% in agricultural sciences; these proportions have
been fairly stable since 2000–01. The leading destinations for study abroad programs in the 2014–15 academic year were the
United Kingdom, Italy, and Spain, followed by France and China.[14]
[1] For most countries, the data in Appendix Table 2-33 include public and private sources.
[2] The most recent data available from Canada correspond to 2012.
[3] According to an international database compiled by the State University of New York at Albany’s Program for Research on Private Higher Education (2011), the United States and Japan have long-standing private higher education sectors, and Western Europe has an almost completely public higher education sector. Eastern and Central Europe and several African countries have recently seen growth in private higher education. In most countries in Latin America, more than half of all higher education institutions are private. In Asia, many governments have encouraged the expansion of private higher education as one of the strategies to deal with high enrollment growth (see sidebar Trends in Higher Education in Asia in NSB 2016). In 2011, about 80% of the students in South Korea and Japan and 60%–64% of the students in Singapore, the Philippines, Nepal, Indonesia, and Cambodia were enrolled in private institutions (UNESCO/UIS 2014).
[4] These data are based on ISCED 2011 and are thus not comparable with data presented in earlier volumes based on ISCED 1997. These data are based on national labor force surveys and are subject to sampling error; therefore, small differences between countries may not be meaningful (OECD 2016).

National Science Board | 2 | 101
CHAPTER 2 | Higher Education in Science and Engineering
Science & Engineering Indicators 2018
[5] Data in the international tables are not strictly comparable with those in previous editions of Science and Engineering Indicators because of a change in the aggregation of fields of study in data collected by UNESCO/UIS, OECD, and Eurostat. Data for the United States and other countries have been aggregated to match as much as possible.
[6] Comparison with Germany covers 2005–14 because of ISCED 2011 changes.
[7] Comparison for Australia covers 2000–11.
[8] In international degree comparisons, S&E does not include medical or other health fields. This is because international sources cannot separate the MD degrees from degrees in the health fields, and the MDs are professional or practitioner degrees, not research degrees.
[9] For international comparability, the estimated proportion of temporary residents here is based on the U.S. doctoral degree totals in Appendix Table 2-38, which are based on the ISCED 2011 taxonomy of fields (denominator). The numerator comes from the number of temporary residents in Appendix Table 2-32 but excludes the medical fields which are not included in international comparisons because some countries include medical degrees, which are professional rather than research degrees, under this category.
[10] For a discussion on trends in higher education in Asia, see Indicators 2016 Chapter 2 [2016] section International S&E Higher Education [2016] at https://nsf.gov/statistics/2016/nsb20161/#/report/chapter-2/international-s-e-higher-education.
[11] In the United States, women earned nearly half of the S&E doctoral degrees awarded to U.S. citizens and permanent residents in 2012 (Appendix Table 2-31).
[12] This initiative is part of a broader effort from the Brazilian government to grant 100,000 scholarships to the best students to study abroad at the top universities around the world (IIE 2017a).
[13] Internationally mobile students are those who have crossed a national or territorial border for the purposes of education and are now enrolled outside their country of origin. This concept is different from “foreign students,” who are those who are not citizens of the country where they are enrolled but may, in some cases, be long-term residents or have been born in the country (OECD 2012).
[14] For the most recent data available on degree mobility, please see NSB 2016 for a discussion of this subject in Belyavina, Li, and Bhandari 2013.

National Science Board | 2 | 102
CHAPTER 2 | Higher Education in Science and Engineering
Science & Engineering Indicators 2018
Conclusion
S&E higher education in the United States is attracting growing numbers of students. The number of associate’s, bachelor’s,
master’s, and doctoral degrees awarded in all fields and in S&E fields continues to rise, having reached new peaks in 2015. At
the associate’s level, the number of S&E associate’s degrees more than doubled; growth was also high in associate’s degrees in
health technologies. At the bachelor’s level, most of the growth in S&E education occurred in the social sciences and in the
biological sciences, followed by engineering. In engineering, bachelor’s degrees have increased consistently for the last 10
years and have surpassed the record high numbers attained in the mid-1980s; graduate enrollment in engineering has also
reached record numbers. Computer sciences degree awards have increased continuously since 2009, after a steep decline in
the mid- to late 2000s. The number of master’s and doctoral degrees awarded grew in all major S&E fields. In the last decade,
growth in doctoral degrees awarded occurred mostly in the natural sciences and engineering fields.
Community colleges play a key role in increasing access to higher education for all citizens. Many U.S. citizen and
permanent resident degree holders report earning college credit from a community college. Nearly half of Hispanic
undergraduates are enrolled in them. The expected demographic growth in the number of Hispanic students between 20 and
24 years of age will affect community colleges and HHEs.
Over the last two decades, higher education spending and revenue patterns and trends have undergone substantial
changes, which intensified during the recent economic downturn. Public institutions faced competing demands in a tight
budget environment, caught between declining state appropriations and the need to maintain educational quality and access.
Despite the decline in enrollment in 2013–14, net tuition per FTE student continued to increase with the decrease in revenues
from state and local appropriations in public institutions, so challenges remain.
Globalization of higher education continues. Universities in several other countries have expanded their enrollment of
international S&E students. In the United States, international student enrollment in S&E has recovered since the post-9/11
decline, increasing considerably at the undergraduate and graduate levels in S&E and non-S&E fields, but in the last year
international enrollment declined. Overall, the United States continues to attract the largest number of internationally mobile
students worldwide, although its share of international students in all fields has dropped since the turn of the century. The
U.S. proportion may decrease further if the declining trend in international enrollment continues.
Higher education is facing rapid technological transformations. The growth of distance and online education through
MOOCs and similar innovations expands access to knowledge and has the potential to decrease the cost of some degrees, at
the same time as pressures have been increasing to reduce rising costs. In computer sciences in particular, students can now
obtain certificates that provide them with a specific set of skills they can apply to the job; these provide an affordable and
flexible alternative to students’ training. However, it is too early to assess whether different types of institutions will widely
adopt MOOCs, whether increased access will be accompanied by increased learning, and what consequences distance and
online innovations will bring to the higher education landscape.
Glossary
Definitions
Credit mobility: Temporary tertiary education within the framework of enrollment in a tertiary education program at a home
institution (usually) for the purpose of gaining academic credit (i.e., credit that will be recognized in that home institution). It is
mostly used for study, but it can also take other forms, such as traineeships.

National Science Board | 2 | 103
CHAPTER 2 | Higher Education in Science and Engineering
Science & Engineering Indicators 2018
Degree mobility: The physical crossing of a national border to enroll in a degree program at the tertiary level in the country of
destination. The degree program would require the students’ presence for the majority of courses taught.
European Union (EU): The EU comprises 28 member nations: Austria, Belgium, Bulgaria, Croatia, Cyprus, Czech Republic,
Denmark, Estonia, Finland, France, Germany, Greece, Hungary, Ireland, Italy, Latvia, Lithuania, Luxembourg, Malta, the
Netherlands, Poland, Portugal, Romania, Slovakia, Slovenia, Spain, Sweden, and the United Kingdom. Unless otherwise noted,
Organisation for Economic Co-operation and Development data on the EU include all 28 nations.
First university degree: A terminal undergraduate degree program; these degrees are classified as “level 6” or “level 7” in the
2011 International Standard Classification of Education, which was developed by UNESCO. Individual countries use different
names for the first university degree (e.g., corso di Laurea in Italy, diplom in Germany, licence in France, and bachelor’s degreein the United States and in Asian countries).
Internationally mobile students: Students who have crossed a national or territorial border for purposes of education and are
now enrolled outside their countries of origin. This term refers to degree mobility in data collected by UNESCO/UIS, OECD, and
Eurostat and excludes students who travel for credit mobility.
Massive Open Online Course (MOOC): An online course made available over the Internet without charge to an unlimited
number of people.
Natural sciences: Include agricultural; biological; computer; earth, atmospheric, and ocean; and physical sciences and
mathematics.
Net tuition revenue: Total revenue from tuition and fees (including grant and loan aid students use to pay tuition); excludes
institutional student aid that is applied to tuition and fees.
Science and engineering fields: Degree award data from the Department of Education cover degrees in the following science
and engineering fields: astronomy, chemistry, physics, atmospheric sciences, earth sciences, ocean sciences, mathematics and
statistics, computer sciences, agricultural sciences, biological sciences, psychology, social sciences, and engineering. At the
doctoral level, the medical and health sciences are included under science and engineering because these data correspond to
the doctor’s-research/scholarship degree level which are research-focused degrees.
Underrepresented minorities: Blacks, Hispanics, and American Indians and Alaska Natives are considered to be
underrepresented minorities in S&E.
Key to Acronyms and Abbreviations
ARRA: American Recovery and Reinvestment Act
BPS: Beginning Postsecondary Students
C-BERT: Cross-Border Education Research Team
DOD: Department of Defense
EACEA: Education, Audiovisual and Culture Executive Agency
EU: European Union
FTE: full-time equivalent
GAO: U.S. Government Accountability Office
GDP: gross domestic product
GSS: Survey of Graduate Students and Postdoctorates in Science and Engineering

National Science Board | 2 | 104
CHAPTER 2 | Higher Education in Science and Engineering
Science & Engineering Indicators 2018
HBCU: historically black college or university
HHE: high Hispanic enrollment
HSI: Hispanic-serving institution
IIE: Institute of International Education
IPEDS: Integrated Postsecondary Education Data System
ISCED: International Standard Classification of Education
ISCED-F: ISCED Fields of Education and Training
MIT: Massachusetts Institute of Technology
MOOC: massive open online course
MSI: minority-serving institution
NCES: National Center for Education Statistics
NCSES: National Center for Science and Engineering Statistics
NIH: National Institutes of Health
NPSAS: National Postsecondary Student Aid Study
NSB: National Science Board
NSCG: National Survey of College Graduates
NSF: National Science Foundation
OECD: Organisation for Economic Co-operation and Development
OPT: optional practical training
PSM: Professional Science Master’s
R&D: research and development
RA: research assistantship
S&E: science and engineering
SEVIS: Student and Exchange Visitor Information System
STEM: science, technology, engineering, and mathematics
TA: teaching assistantship
TCU: tribal college or university
UIS: UNESCO Institute for Statistics
UNESCO: United Nations Educational, Scientific and Cultural Organization
References
Allen IE, Seaman J, Poulin R, Straut TT. 2016. Online report card: Tracking online education in the United States. https://
onlinelearningsurvey.com/reports/onlinereportcard.pdf. Accessed 11 September 2017.

National Science Board | 2 | 105
CHAPTER 2 | Higher Education in Science and Engineering
Science & Engineering Indicators 2018
Belyavina R, Li J, Bhandari R. 2013. New frontiers: U.S. students pursuing degrees abroad: A 2-year analysis of key destinations and fields of study. https://www.iie.org/Research-and-Insights/Publications/New-Frontiers. Accessed 11 September 2017.
Bettinger EP, Fox L, Loeb S, Taylor ES. 2017. Virtual classrooms: How online college courses affect student success. American Economic Review 107(9):2855–2875. https://www.aeaweb.org/articles?id=10.1257/aer.20151193.
Bhandari R, Belyavina R. 2012. Global student mobility: Trends and new directions. International Higher Education 66(Winter):
14–15.
Bhandari R, Belyavina R, Gutierrez R, editors. 2011. Student Mobility and the Internationalization of Higher Education: National Policies and Strategies from Six World Regions. 1st ed. New York, NY: Institute of International Education. http://
www.iiebooks.org/stmoandinofh.html. Accessed 11 September 2017.
British Council. 2015. The Prime Minister’s initiative for international education. http://webarchive.nationalarchives.gov.uk/+/
http:/www.dius.gov.uk/dius_international/education/prime_ministers_initiative. Accessed 11 September 2017.
China Ministry of Education. 2011. List of disciplines for the granting of degrees and talent development. http://
www.moe.edu.cn/ewebeditor/uploadfile/20110401155223935.doc. Accessed 11 September 2017.
China Scholarship Council. 2017. About us: China Scholarship Council. http://en.csc.edu.cn/About/
c309df7fb3fa40b3a179a7ad93f11988.shtml. Accessed 11 September 2017.
Chuang I, Ho AD. 2016. HarvardX and MITx: Four years of open online courses—fall 2012–summer 2016. https://ssrn.com/
abstract=2889436. Accessed 11 September 2017.
College Board. 2016a. Trends in college pricing: 2016. https://trends.collegeboard.org/college-pricing. Accessed 11 September
2017.
College Board. 2016b. Trends in student aid: 2016. https://trends.collegeboard.org/student-aid. Accessed 11 September 2017.
Cross-Border Education Research Team (C-BERT). 2017. http://cbert.org/. Accessed 11 September 2017.
Cyranoski D, Gilbert N, Ledford H, Nayar A, Yahia M. 2011. The PhD factory. Nature 472:276–9.
Eagan K, Stolzenberg EB, Zimmerman HB, Aragon MC, Sayson HW, Rios-Aguilar C. 2017. The American freshman: National norms fall 2016. Los Angeles, CA: Higher Education Research Institute, UCLA.
Education, Audiovisual and Culture Executive Agency (EACEA), Eurydice, Eurostat, Eurostudent. 2012. The European higher education area in 2012: Bologna Process implementation report. Brussels, Belgium: EACEA P9 Eurydice. https://
media.ehea.info/file/2012_Bucharest/79/5/Bologna_Process_Implementation_Report_607795.pdf. Accessed 11 September
2017.
Education, Audiovisual and Culture Executive Agency (EACEA), Eurydice. 2014. Modernisation of higher education in Europe: Access, retention and employability 2014. Eurydice report. Luxembourg: Publications Office of the European Union. http://
eacea.ec.europa.eu/education/eurydice/documents/thematic_reports/165EN.pdf. Accessed 11 September 2017.
Ewert S, Kominski R. 2014. Measuring alternative educational credentials: 2012. U.S. Department of Commerce, Economics
and Statistics Administration, U.S. Census Bureau. https://www.census.gov/prod/2014pubs/p70-138.pdf. Accessed 11
September 2017.

National Science Board | 2 | 106
CHAPTER 2 | Higher Education in Science and Engineering
Science & Engineering Indicators 2018
Ginder SA, Kelly-Reid JE. 2017. Enrollment in Postsecondary Institutions, Fall 2015; Financial Statistics, Fiscal Year 2015; and Academic Libraries, Fiscal Year 2015. First Look (Provisional Data). NCES 2017-024. U.S. Department of Education. Washington,
DC: National Center for Education Statistics (NCES).
Ginder SA, Kelly-Reid JE, Mann FB. 2014. Enrollment in Postsecondary Institutions, Fall 2013; Financial Statistics, Fiscal Year 2013; and Employees in Postsecondary Institutions, Fall 2013. First Look (Provisional Data). NCES 2015-012. U.S. Department
of Education. Washington, DC: National Center for Education Statistics (NCES).
Goodman J, Melders J, Pallais A. 2016. Can online delivery increase access to education? Faculty Research Working Paper
Series, RWP16-035. https://research.hks.harvard.edu/publications/workingpapers/citation.aspx?PubId=11348&type=WPN.
Accessed 11 September 2017.
Helms RM, Griffin J. 2017. U.S.–Mexico higher education engagement: Current activities, future directions. http://
www.acenet.edu/news-room/Documents/US-Mexico-Higher-Education-Engagement.pdf. Accessed 11 September 2017.
Hill, ST. 1985. The traditionally black institutions of higher education: 1860 to 1982. National Center for Education Statistics,
NCES 84308, September 26, 1985. https://nces.ed.gov/pubsearch/pubsinfo.asp?pubid=84308. Accessed 15 August 2017.
Hoxby C, Avery C. 2013. The missing “one-offs”: The hidden supply of high-achieving, low-income students. Brookings Papers on Economic Activity 2013 (Spring). https://www.brookings.edu/~/media/projects/bpea/spring-2013/2013a_hoxby.pdf.
Accessed 11 September 2017.
Hussar WJ, Bailey TM. 2016. Projections of education statistics to 2024. NCES 2016-013. U.S. Department of Education.
Washington, DC: National Center for Education Statistics (NCES).
Ifill N, Shaw S. 2013. Web tables: Undergraduate financial aid estimates by type of institution in 2011-12. NCES 2014-169. U.S.
Department of Education. Washington, DC: National Center for Education Statistics (NCES). https://nces.ed.gov/pubsearch/
pubsinfo.asp?pubid=2014169. Accessed 11 September 2017.
Institute for College Access & Success, College InSight. 2016. http://college-insight.org/#explore/
go&h=7fa4d1b802454bcc5bc5e80c433621eb. Accessed 11 September 2017.
Institute of International Education (IIE). 2016. Open doors 2016: A report on international education exchange. https://
www.iie.org/opendoors. Accessed 11 September 2017.
Institute of International Education (IIE). 2017a. Ciência: Brazil scientific mobility program. https://www.iie.org/Programs/Brazil-
Scientific-Mobility. Accessed 11 September 2017.
Institute of International Education (IIE). 2017b. Generation study abroad. https://www.iie.org/Programs/Generation-Study-
Abroad. Accessed 11 September 2017.
Kena G, Hussar W, McFarland J, de Brey C, Musu Musu-Gillette L, Wang X, Zhang J, Rathbun A, Wilkinson-Flicker S, Diliberti M,
Barmer A, Bullock Mann F, Dunlop Velez E. 2016. The condition of education 2016. NCES 2016-144. U.S. Department of
Education. Washington, DC: National Center for Education Statistics (NCES).
Knapp LG, Kelly-Reid JE, Ginder SA. 2009. Enrollment in Postsecondary Institutions, Fall 2007; Graduation Rates, 2001 & 2004 Cohorts; and Financial Statistics, Fiscal Year 2007. NCES 2009-155. U.S. Department of Education. Washington, DC: National
Center for Education Statistics (NCES).

National Science Board | 2 | 107
CHAPTER 2 | Higher Education in Science and Engineering
Science & Engineering Indicators 2018
Knapp LG, Kelly-Reid JE, Ginder SA. 2011. Enrollment in Postsecondary Institutions, Fall 2009; Graduation Rates, 2003 & 2006 Cohorts; and Financial Statistics, Fiscal Year 2009. NCES 2011-230. U.S. Department of Education. Washington, DC: National
Center for Education Statistics (NCES).
Knickmeyer E. 2012. Saudi students flood in as U.S. reopens door. Wall Street Journal November 8. https://www.wsj.com/
articles/SB10001424052702304830704577492450467667154. Accessed 11 September 2017.
Knight J, editor. 2014. International Education Hubs: Student, Talent, Knowledge-Innovation Models. Dordrecht, Heidelberg,
New York, London: Springer.
Li X. 2007. Characteristics of Minority-Serving Institutions and Minority Undergraduates Enrolled in These Institutions. NCES
2008-156. U.S. Department of Education. Washington, DC: National Center for Education Statistics (NCES). https://nces.ed.gov/
pubs2008/2008156.pdf. Accessed 15 August 2017.
Lixu L. 2004. China’s higher education reform 1998–2003: A summary. Asia Pacific Education Review 5(1):14–22. http://
files.eric.ed.gov/fulltext/EJ720523.pdf. Accessed 11 September 2017.
Lloyd M. 2014. Mexico gets serious about R&D. Chronicle of Higher Education June 13.
McNeil D. 2008. Japan announces plan to enroll more foreign students. Chronicle of Higher Education July 29.
McNeil D. 2010. Japan’s globalization project stalls as some criticize focus on elite universities. Chronicle of Higher EducationSeptember 8.
McNeil D. 2012. Foreign-student numbers start to recover in Japan, one year after the disaster. Chronicle of Higher EducationApril 3.
Mooney P. 2007. China limits growth of universities. Chronicle of Higher Education February 9.
National Center for Education Statistics (NCES). 2017. Digest of Education Statistics. U.S. Department of Education.
Washington, DC: Author. https://nces.ed.gov/programs/digest/current_tables.asp. Accessed 11 September 2017.
National Science Board (NSB). 2006. Science and Engineering Indicators 2006. Two volumes (vol. 1, NSB 06-01; vol. 2, NSB
06-01A). Arlington, VA: National Science Foundation. Available at https://www.nsf.gov/statistics/seind06/.
National Science Board (NSB). 2008. Science and Engineering Indicators 2008. Two volumes (vol. 1, NSB 08-01; vol. 2, NSB
08-01A). Arlington, VA: National Science Foundation. Available at https://www.nsf.gov/statistics/seind08/.
National Science Board (NSB). 2012. Science and Engineering Indicators 2012. NSB 12-01. Arlington, VA: National Science
Foundation. Available at https://www.nsf.gov/statistics/seind12/.
National Science Board (NSB). 2014. Science and Engineering Indicators 2014. NSB 14-01. Arlington, VA: National Science
Foundation. Available at https://www.nsf.gov/statistics/seind14/.
National Science Board (NSB). 2016. Science and Engineering Indicators 2016. NSB-2016-1. Arlington, VA: National Science
Foundation: Available at https://www.nsf.gov/statistics/2016/nsb20161/#/.
National Science Foundation, Division of Science Resources Studies (NSF/SRS). 2000. Psychology Doctorate Recipients: How Much Financial Debt at Graduation? Issue Brief NSF 00-321. Arlington, VA. Available at http://www.nsf.gov/statistics/issuebrf/
sib00321.htm. Accessed 11 September 2017.

National Science Board | 2 | 108
CHAPTER 2 | Higher Education in Science and Engineering
Science & Engineering Indicators 2018
National Science Foundation, Division of Science Resources Statistics (NSF/SRS). 2007. Graduate Students and Postdoctorates in Science and Engineering: Fall 2007. Detailed Statistical Tables NSF 10-307. Arlington, VA. Available at https://www.nsf.gov/
statistics/nsf10307/pdf/nsf10307.pdf. Accessed 23 October 2017.
National Science Foundation, National Center for Science and Engineering Statistics (NSF/NCSES). 2013. Baccalaureate Origins of U.S.-Trained S&E Doctorate Recipients. InfoBrief NSF 13-323. Arlington, VA. Available at https://www.nsf.gov/statistics/
infbrief/nsf13323/. Accessed 11 September 2017.
National Science Foundation, National Center for Science and Engineering Statistics (NSF/NCSES). 2016. Influx of Foreign Graduate Students and Inclusion of Newly Eligible Institutions Lead to a Significant Increase in U.S. Graduate Enrollment in Science and Engineering. InfoBrief NSF 16-310. Arlington, VA. Available at https://www.nsf.gov/statistics/2016/nsf16310/.
Accessed 11 September 2017.
National Science Foundation, National Center for Science and Engineering Statistics (NSF/NCSES). 2017a. Women, Minorities, and Persons with Disabilities in Science and Engineering: 2015. Special Report NSF 15-311. Arlington, VA. Available at https://
www.nsf.gov/statistics/wmpd/. Accessed 11 September 2017.
National Science Foundation, National Center for Science and Engineering Statistics (NSF/NCSES). 2017b. Doctorate Recipients from U.S. Universities: 2016. Special Report NSF 17-306. https://nsf.gov/statistics/2017/nsf17306. Accessed 11 September
2017.
Núñez AM, Hurtado S, Calderon Galeano E. 2015. Hispanic-Serving Institutions: Advancing Research and Transformative Practice. New York: Routledge.
Núñez AM, Crisp G, Elizondo E. 2016. Mapping Hispanic-serving institutions: A typology of institutional diversity. Journal of Higher Education 87(1):55–83.
Olson S, Labov JB, rapporteurs. 2012. Community Colleges in the Evolving STEM Education Landscape: Summary of a Summit. National Research Council and National Academy of Engineering. Washington, DC: The National Academies Press. https://
www.nap.edu/catalog.php?record_id=13399. Accessed 11 September 2017.
Organisation for Economic Co-operation and Development (OECD). 2012. Education at a Glance: 2012. Paris, France. https://
www.oecd.org/edu/EAG%202012_e-book_EN_200912.pdf. Accessed 11 September 2017.
Organisation for Economic Co-operation and Development (OECD). 2014. Education at a Glance: 2014. Paris, France. https://
www.oecd.org/edu/Education-at-a-Glance-2014.pdf. Accessed 11 September 2017.
Organisation for Economic Co-operation and Development (OECD). 2016. Education at a Glance: 2016. Paris, France. https://
www.oecd-ilibrary.org/docserver/download/9616041e.pdf?
expires=1488556989&id=id&accname=guest&checksum=FE74694BD34679F6AF51E824C5B889BC. Accessed 11 September
2017.
Organisation for Economic Co-operation and Development (OECD), Eurostat, UNESCO Institute for Statistics. 2015. ISCED 2011 Operational Manual: Guidelines for Classifying National Education Programmes and Related Qualifications. http://www.oecd-
ilibrary.org/education/isced-2011-operational-manual_9789264228368-en. Accessed 11 September 2017.
Perna LW, Ruby A, Boruch RF, Wang N, Scull J, Ahmad S, Evans C. 2014. Moving through MOOCs: Understanding the
progression of users in massive open online courses. Educational Researcher 43(9):421–32.
National Science Board | 2 | 109
CHAPTER 2 | Higher Education in Science and Engineering
Science & Engineering Indicators 2018
President’s Council of Advisors on Science and Technology (PCAST). 2012. Report to the President: Engage to Excel: Producing One Million Additional College Graduates with Degrees in Science, Technology, Engineering, and Mathematics. https://
obamawhitehouse.archives.gov/sites/default/files/microsites/ostp/pcast-engage-to-excel-final_2-25-12.pdf. Accessed 11
September 2017.
Professional Science Master’s (PSM). 2017. Outcomes for PSM Alumni: 2015/17. https://www.professionalsciencemasters.org/
sites/default/files/outcomes_for_psm_alumni_2015-16.pdf . Accessed 18 October 2017.
Program for Research on Private Higher Education. 2011. Europe’s private and public higher education shares (2002–2009). http://www.albany.edu/dept/eaps/prophe/data/International_Data/Europe's%20Private%20and%20Public%20Higher
%20Education%20Shares(2002-2009)-Updated%20March%202011.doc. Accessed 11 September 2017.
Sullivan TA, Mackie C, Massy WF, Sinha E. 2012. Improving Measurement of Productivity in Higher Education: Panel on Measuring Higher Education Productivity: Conceptual Framework and Data Needs. Washington, DC: The National Academies
Press, National Research Council. https://www.nap.edu/download.php?record_id=13417#. Accessed 11 September 2017.
The Economist. 2017. Established education providers v new contenders. January 14. http://www.economist.com/news/
special-report/21714173-alternative-providers-education-must-solve-problems-cost-and. Accessed 11 September 2017.
United Kingdom Council for International Student Affairs (UKCISA). 2013. Policy, research & statistics. https://
institutions.ukcisa.org.uk/Info-for-universities-colleges--schools/Policy-research--statistics/Student-experience-projects--
research/. Accessed 11 September 2017.
United Nations Educational, Scientific and Cultural Organization (UNESCO). 2009. Global Education Digest 2009: Comparing Education Statistics Across the World. http://unesdoc.unesco.org/images/0018/001832/183249e.pdf. Accessed 11 September
2017.
UNESCO Institute for Statistics. 2014. ISCED Fields of Education and Training 2013 (ISCED-F 2013). http://eqe.ge/res/docs/
228085e.pdf. Accessed 23 October 2017.
United Nations Educational, Scientific and Cultural Organization, Institute for Statistics (UNESCO/UIS). 2014. Higher Education in Asia: Expanding Out, Expanding Up: The Rise of Graduate Education and University Research. Montreal, Quebec, Canada:
Author. http://unesdoc.unesco.org/images/0022/002275/227516e.pdf Accessed 18 September 2017.
U.S. Department of Education, Office of Educational Technology (ED/OET). 2013. Expanding evidence approaches for learning in a digital world. Washington, DC.
U.S. Government Accountability Office (GAO). 2014. State funding trends and policies on affordability. GAO-15-151.
Washington, DC.
Walcutt L 2016. The scholarship struggle Saudi Arabian students are facing. Forbes. https://www.forbes.com/sites/leifwalcutt/
2016/09/28/the-scholarship-struggle-saudi-arabian-students-are-facing/#76fa71551cd9. Accessed 11 September 2017.
Yoder BL. 2017. Engineering by the numbers. Washington, DC: American Society for Engineering Education. https://
www.asee.org/papers-and-publications/publications/college-profiles/15EngineeringbytheNumbersPart1.pdf. Accessed 11
September 2017.