Embed Size (px)
Citation preview

1
Chapter 2 Fiscal Consolidation, Economic Growth and the Financial System
Section 1 Worldwide Expansion of Fiscal Deficits Mainly in Developed
Countries 1. Current Expansion of Fiscal Deficits and its Background Fiscal deficits have expanded significantly mainly in developed countries since the global
financial crisis. Fiscal deficits expanded due to the economic recession after the oil crisis in the 1970s
and the long-term stagnation in the 1980s. In the 1990s, fiscal consolidations were sought by introducing fiscal rule and other measures, which led to the improvement of the fiscal balances.
The fiscal balances once again worsened in the 2000s due to the global recession triggered by the IT bubble burst in 2001, and the tax cuts and increases in expenditures on targeted fields to revitalize the economy in the U.S. and other major countries. The balances were then on the trend of improvement partly due to the global economic recovery.
In many developed countries, however, a sharp increase in fiscal deficits and a marked expansion of public debts arose as a result of tax revenue decrease and large-scale fiscal stimulus measures in the economic recession after the global financial crisis in 2008.
Figure 2-1-1 General Government Fiscal Balance in Major Developed Countries
(% of GDP)
(1) Fiscal balance
Japan
U.S.
Euro area
G7
-12
-10
-8
-6
-4
-2
0
2
1992 95 98 01 04 07 10
(% of GDP)
(Year)
(2) Structural fiscal balance
Japan
U.S.
Euro area
G7
-12
-10
-8
-6
-4
-2
0
2
1992 95 98 01 04 07 10
(% of GDP)
(Year)
(Notes) 1. Source: OECD "Economic Outlook 87 Database". 2. Figures for 2010 are estimates.

2
General government gross debt in major developed countries as a whole increased by 7 trillion dollars, from 25 trillion dollars in 2007 to 32 trillion dollars in 2009. There is a concern whether the financial markets can absorb all these government bonds.
Figure 2-1-3 General Government Gross Debt in Major Developed Countries Overview of the fiscal structure in developed countries: diversified
Revenues as a percentage of GDP vary from country to country ranging from above 40% level to below 30% level. Consumption tax revenues account for about 25-30% of total revenues except in the U.S. and Japan. Revenues from income tax and corporate tax vary greatly from country to country. Corporate tax revenues account for about less than 10% in Europe and the U.S., which means that corporate taxes are not major revenue sources.
(1) Percentage of GDP
Canada
France
Germany
Italy
UK
U.S.
G7Average
Japan(right scale)
20
40
60
80
100
120
140
1991 93 95 97 99 01 03 05 07 09
0
50
100
150
200
250(% of GDP)
(Year)
(% of GDP)
(Notes) 1. Source: IMF "World Economic Outlook Database October 2010". 2. G7 Average is calculated by obtaining a weighted average of GDP based on PPP.
(2) Value (on a dollar basis)
CanadaFranceGermanyItalyUK
Japan
U.S.
0
5
10
15
20
25
30
35
1991 93 95 97 99 01 03 05 07 09
(Trillion dollars)
(Year)

3
Figure 2-1-4 Revenue Structure of Major Developed Countries (2008) (1) Breakdown of the revenues (% of GDP) (2) Breakdown of the revenues from taxes and social
insurance premiums
Expenditures as a percentage of GDP vary greatly from country to country, and those of France and Italy account for around 50% and those of Korea above 30%. In many countries, social security costs account for the largest portion of expenditures, such as unemployment insurance and pension (other than health care expenditure), followed by health care expenditure.
Figure 2-1-5 Expenditure Structure of Major Developed Countries (% of GDP) (2008)
19.4
27.5
21.1
18.0
27.5
28.7
23.8
29.8
11.3
8.4
16.4
13.8
18.026.7
4.5
6.1
6.9
0 10 20 30 40 50
U.S.
Australia
Korea
Japan
Canada
UK
Germany
Italy
France
(%)
Social contribution Others
(Notes) 1. Source: OECD "National Accounts Statistics". 2. Others include grants from foreign governments, international organizations, etc., property revenues and commission revenues.
Taxes other than Social contribution
37.9
36.7
15.0
19.6
37.3
29.9
26.8
26.8
17.4
8.9
23.1
15.9
16.8
10.7
9.9
8.6
6.8
17.0
26.6
31.6
18.0
23.4
28.8
28.9
24.4
24.5
11.7
8.9
11.9
9.0
7.8
24.5
21.9
36.4
14.5
19.2
36.4
31.1
5.2
4.3
2.3
11.6
10.2
37.2
0 20 40 60 80 100
U.S.
Australia
Korea
Japan
Canada
UK
Germany
Italy
France
(%)
Corporate tax Social securitycontribution
Property taxIndividual tax OthersGoods and serivices tax
(Notes) 1. Source: OECD "Revenue Statistics". 2. Data of Japan and Australia are those of 2007.
3.8
12.4
7.6
9.2
10.8
19.8
15.9
18.8
21.8
3.9
7.2
8.0
7.3
7.1
6.3
7.4
7.1
7.8
5.0
3.9
6.5
7.2
5.7
4.0
6.3
4.6
5.9
4.3
4.7
5.0
7.3
6.0
9.0
7.1
6.6
4.1
4.9
4.8
3.7
4.5
4.5
3.8
2.8
3.4
3.4
0 10 20 30 40 50 60
Korea
Japan
U.S.
Canada
Australia
Germany
UK
Italy
France
HealthEconomic affairs
Education
Social protection
Recreation,culture and
religionEnvironmentprotection
Defense
Public orderand safety
Housing and communityamenities
General publicservice
(%)
39.6%
39.2%
39.0%
36.3%
30.4%
48.9%
47.3%
44.0%
(Notes) 1. Source: OECD. 2. Data for Australia is from IMF "Government Finance Statistics Yearbook". 3. Data for Australia, Canada and Japan are that of 2007, that of 2006 and that of 2007, respectively.
52.7% (General governmentexpenditure as % of GDP)

4
Aging continues to push up expenditures in the future. It is the aging of the population that pushes up expenditures for pension and health care.
In the future, the aging is expected to cause further expansion of the expenditures. Substantial reforms, especially in the pension program have been started in many
countries, such as securing financial resources, raising pension eligibility age and reducing the amount of the pension.
In addition to the effect of the aging of the population, health care expenditures are expected to increase considerably affected by the rise in the per capita health care expenditure due to progress in medical technology.
Figure 2-1-7 Forecast for Social Security Expenditures (pension and public healthcare)
Major Developed Countries (by the IMF)
Average of Social Security Expenditures in Developed Countries
7.4 7.6 7.9 8.5 8.9 9.0
6.9 7.5 8.510.5
12.2 13.5
0
5
10
15
20
25
2010 15 20 30 40 50
(% of GDP)
Healthcare
Pension
(Year)
Pension
0
2
4
6
8
10
12
14
16
France
German
yJa
pan
UKU.S
.
Canad
a
Austra
lia
Korea
(% of GDP)
2010 2030
2050
Healthcare2010
20302050
0
2
4
6
8
10
12
14
16
France
German
yJa
pan
UKU.S
.
Canad
a
Austra
lia
Korea
(% of GDP)
(Note) Source: IMF "From Stimulus to Consolidation: Revenue and Expenditure Policies in Advanced and EmergingEconomies".
5
2. Fiscal Consolidation, Economic Growth and the Financial System Under the crisis, public expenditure is supposed to make up for the slump in private
demand. However, the large amounts of government bonds issued for financing the expanded fiscal deficits gradually crowd out the demand for funds for private investment along with the economic recovery. In addition, if concern arises over fiscal sustainability due to the expansion of fiscal deficits and the accumulation of public debt, the growing uncertainty about the future could restrain household consumption and corporate investment.
When concern arises about fiscal sustainability, its impact on financial conditions can be
seen in the way that the interest rate on government bonds rises (the price of government bonds falls). If the interest rate on government bonds rises sharply to cause concern about a default, in severe cases the financial institutions that hold such bonds could be perceived to be unstable and thus face difficulties in financing, and there would be a fear of confusion in the financial system. The Greek financial crisis is the example.
For those reasons, it is extremely important to adopt a policy of ensuring fiscal
sustainability.
(1) Relationship between fiscal consolidation and economic growth The effect of fiscal consolidation on economic growth (short-term perspective)
There would be a negative effect based on traditional Keynesian theory. Any reduction in government expenditures and increase in taxes would have impact to decrease aggregate demand, including private consumption and investment, etc., due to the multiplier effect.
The effect of fiscal consolidation on economic growth (medium- to long-term
perspective) Decision-making on household consumption and corporate investment is based not only on the current economic and fiscal conditions, but also on their future prospects. Accordingly, with confidence in the continuity of fiscal consolidation and the government’s efforts, reduction in government expenditures and increase in taxes might boost consumption (Non-Keynesian Effects).
Effect of factors other than fiscal policies
In advancing fiscal consolidation, the impact of decreasing aggregate demand due to fiscal contraction would be relieved when it is expected that monetary easing support domestic demand or an increase in exports leads to the expansion of foreign demand.
At present, policy interest rates are already at an extremely low level in the U.S. and major European countries, and economic recovery in the developed countries is still moderate. Under these circumstances, implementing their fiscal consolidation simultaneously would worsen the negative impact of fiscal consolidation on economic growth, since it would not likely be expected that the aggregate demand is supported by monetary easing or foreign demand.
6
G20 agreement for global fiscal soundness Carrying out “growth-friendly” fiscal consolidation was agreed at G20 Toronto Summit
in June 2010, while the market was concerned about a risk to the fiscal sustainability of the developed countries with the Greek financial crisis behind.
Advanced economies have committed to at least halve their deficits by 2013 and stabilize or reduce government debt-to-GDP ratios by 2016.
“Growth-friendly” fiscal consolidation: Conditions for making fiscal consolidation
compatible with economic growth It is necessary to pay attention to the timing and speed of fiscal consolidation. It is also effective to combine it with monetary easing, structural reforms and other
economic policies. In order to ensure the confidence, it is effective to improve the fiscal system, such as
formulating medium- to long-term consolidation plans, and making fiscal consolidation measures legally binding.
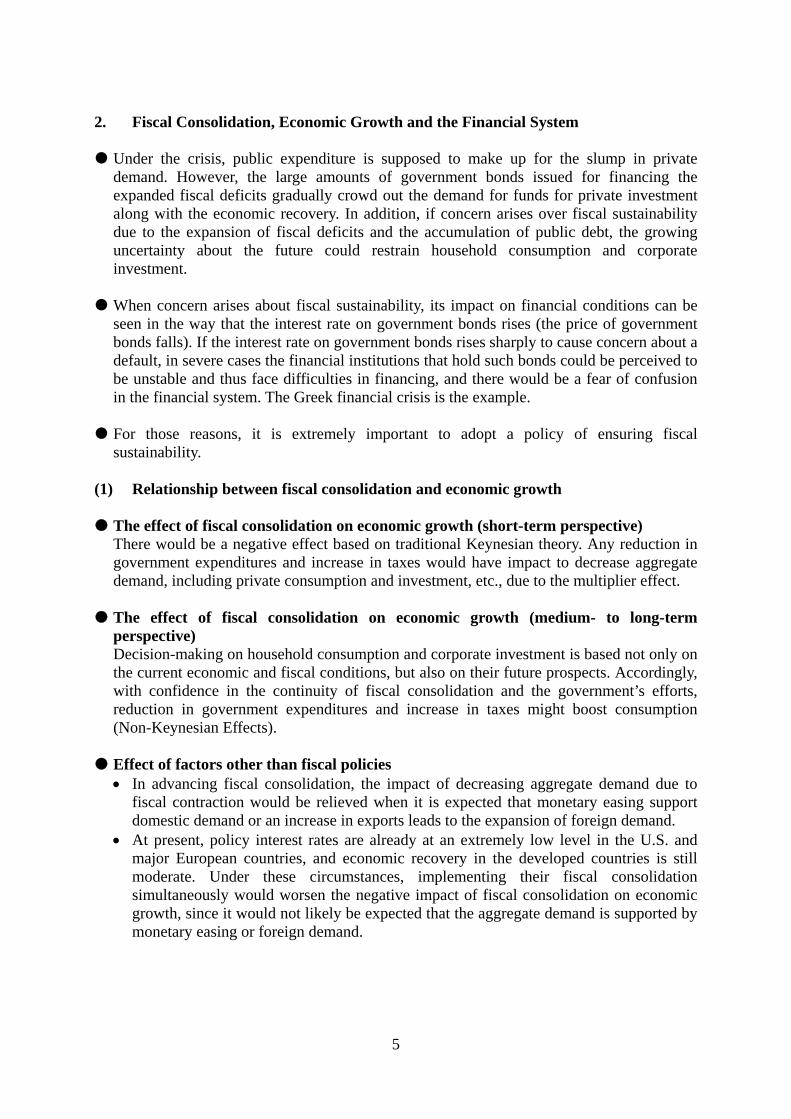
(2) Public finance and the financial system The contagion of fiscal concern to Portugal, Ireland, Italy and Spain was seen when the
Greek fiscal crisis occurred. The yield spreads on the German government bonds of those countries sharply widened. Since the financial institutions in France, Germany and other European countries held a large amount of the government bonds of the countries above, the CDS spreads surged and stock prices fell across the board. In addition, counterparty risks among banks increased.
Figure 2-1-8 Yield Spread of the Government Bonds of European Countries on
German Government Bonds
Figure 2-1-9 Impact of the Greek Financial Crisis on the Financial System
(2) CDS spread of European Major Financial Institutions
(Note) Source: Bloomberg.
0
2
4
6
8
10
12
1 3 5 7 9 11 1 3 5 7 9 11 1 3 5 7 9 11
2008 09 10
(%)
(Month)(Year)
Greece
Ireland
Portugal
Spain
Italy
0
50
100
150
200
250
1 3 5 7 9 11 1 3 5 7 9 11 1 3 5 7 9 11
2008 09 10
(bps)
(Month)(Year)
(Notes) 1. Source: Bloomberg. 2. Surveyed are 12 financial institutions below: HSBC, HBOS, Barclays, RBS, Deutsche Bank, Commerzbank, BNP Paribas, Societe Generale, UBS, Credit Suisse, Santander and UniCredit.
Greek Financial Crisis

7
It may take some time for the market to recognize fiscal deterioration as a fiscal crisis. When the sovereign credit ratings are maintained at high grades, the market’s recognition of fiscal deterioration may possibly be delayed. Once the credit ratings are downgraded, the rise in interest rates may cause concern about further fiscal deterioration and a downgrading spiral may be initiated.
When the market recognizes that there is a fiscal crisis, market adjustment can proceed
rapidly, such as a plunge in stock prices.
Figure 2-1-10 Changes in the Credit Ratings of Greek Government Bonds in the Greek Financial Crisis
(Note) Source: Bloomberg.
2008 09 10
Aa2/AA
Aa3/A
A1/A+
A2/A
A3/A-
Baa1/BBB+
Baa2/BBB
Baa3/BBB-
Ba1/BB+
Ba2/BB
S&PFitch
Moody's
(Year)
8
Section 2 Examples of Fiscal Policy Failure There have been 310 or more cases of sovereign defaults in the world when focusing on
the period after the 19th century. Sovereign defaults tend to occur in large numbers just after a global financial crisis.
The UK-IMF crisis (1976) is shown below as an example of a mismanagement of fiscal
policies, which did not cause a default, but an economic crisis. The default of Russia (1998), an emerging but relatively mature economy, is also examined since it had a huge impact on global financial markets at that time.
Those crises were caused when fiscal conditions rapidly worsened due to some
macroeconomic shocks over considerable delay in structural reforms, implying such crises could occur in developed countries.
1. The UK-IMF Crisis (1976) (1) Background to the crisis and key events After the World War II, the UK government provided generous welfare services called
cradle-to-grave services, nationalized key industries and enforced other relevant policies by advocating more government intervention. In the 1970s, such economic policies resulted in deadlock, while structural problems emerged and international competitiveness weakened due to an increase in wages (the British disease).
The oil shock occurred in 1973, which accelerated an inflationary trend that had appeared
in the latter half of the 1960s. The rate of increase in consumer prices exceeded 10% in 1974 and 1975, while the real economic growth rate became negative for the two consecutive years. The UK fell into a period of stagflation. Output fell and imports expanded, which resulted in a current account deficit. The UK ran a fiscal deficit in FY1972, which further worsened due to an increase in the unemployment benefits payment. The value of sterling pound depreciated.
Since the UK government ran out of foreign currency reserves in order to protect the
pound from depreciating further (pound-buying intervention), it applied for urgent support of 3.9 billion dollars from the IMF in December 1976.
(2) Lessons from the crisis Since there had been strong opposition among people against structural changes in the
generous welfare policies, the government had been putting off solving the problem. The oil shock was major shock that brought about economic difficulties in all the developed countries equally. However, its impact in the UK was more serious since it was already faced with such structural problems.
9
2. Russian Financial Crisis (1998) (1) Background to the crisis Russia saw fiscal deterioration since its revenues decreased due to a decline in crude oil
prices and there was an increase in the amount of subsidies for corporations with low productivity under the socialist economic regime during and after the latter half of the 1980s. Russia failed to implement substantial structural reforms, which prevented improvement of fiscal deficit until the latter half of the 1990s.
After the transition to a market economy, many commercial banks were established in
Russia. However, loan demand was weak due to high interest rates, and thus banks tended to invest in government bonds. On the other hand, they financed in foreign currencies at low interest rates. The financial system became structurally unstable against capital outflows and Ruble depreciation.
(2) Key events of the crisis Fiscal deficits expanded since export taxes were abolished in July 1996 and tax revenues
decreased due to a decline in profits of the energy industry, which was caused by a drop in crude oil prices in 1997.
The Asian currency crisis occurred in July 1997. The government continued to purchase
ruble and raised policy interest rates substantially in order to prevent capital outflows and depreciation of ruble. However, the interest rates on short-term government bonds surged significantly more than government’s intentions. Russia fell into default on August 17, 1998.
Commercial banks collapsed one after another due to turmoil in the short-term government
bond market caused by financial crisis, an increase in debts held in foreign currencies and financial difficulties.
(3) Lessons from the crisis Russia put off the drastic reform of its low-productive corporations that had been protected
under the socialist economic regime by providing government subsidies. Accordingly, Russia depended on chronic fiscal deficits and inflexible fiscal management. The Russian financial crisis is the example that the postponement of solving structural problems weakened resilience to a crisis.

10
Section 3 Cases of Successful Fiscal Consolidation 1. Relationship between the Real Economy and Fiscal Management Fiscal consolidation, in the short term, would have downward impact on economy.
Accordingly, it is essential that fiscal consolidation be pursued with the economic fluctuation risk taken into consideration.
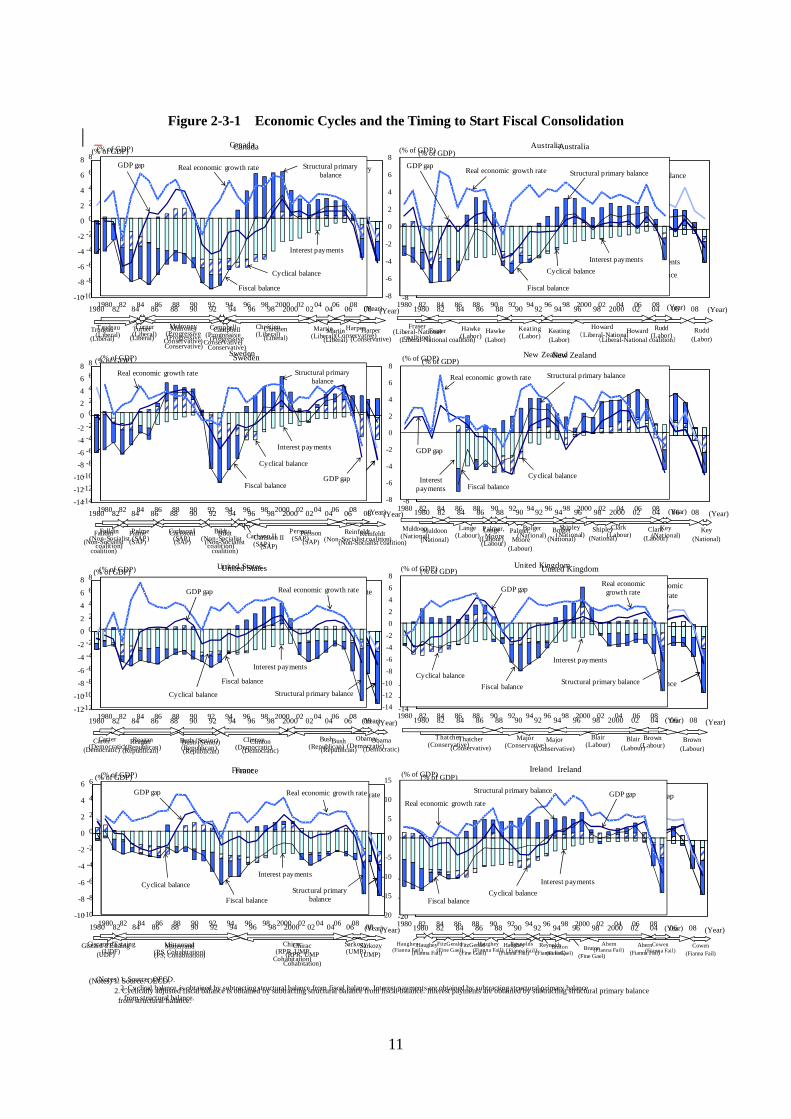
(1) Economic cycles and the timing to start fiscal consolidation Cases where fiscal consolidation started in a recovery phase: Desirable timing
After the end of the recession in Canada in April 1992, the administration came into power in October 1993 and promoted drastic reforms based on the expenditure cuts. It succeeded in reducing fiscal deficits at a faster pace than intended and achieved a fiscal surplus in 1997.
In Sweden, krona depreciated due to a currency crisis under the critical economic and financial situation in the early 1990s, enabling an export-led recovery to occur. Rapid fiscal consolidation in recovery phase resulted in a fiscal surplus in 1998.
Australia saw a rapid expansion in fiscal deficits during recessions in the first half of the 1980s and the first half of the 1990s. However, Australia was not driven to such a critical situation as seen in Europe and other countries. Therefore, reforms were implemented gradually, improving the fiscal balance significantly along with an economic recovery.
Cases where fiscal consolidation started in a recession phase: In urgent needs
In New Zealand, the Lange administration came into power as a result of a general election under the economic crisis. During the recession phase, the administration carried out fiscal consolidation including economic, administrative and fiscal reform such as the abolishment of conventional government controls to widely liberalize the economy.
In Ireland, stagflation continued until the mid-1980s, expanding fiscal deficits. Fiscal consolidation was implemented by tax increase and expenditure cut amid stagnant economic recovery.
In European countries that were required to meet the euro convergence criteria for joining the euro area under the Maastricht Treaty, large-scale fiscal consolidation including temporary measures was carried out under severe economic conditions. Along with fiscal consolidation mainly by expenditure cut, Spain attempted to raise its potential growth rate by restraining inflation, easing regulations and reforming the labor market. While in Italy, doubt about the prospect of achieving the convergence criteria caused speculation selling-off of lira and made Italy suspend from the Exchange Rate Mechanism (ERM). However, Italy carried out fiscal consolidation, implementing a temporary tax increase equivalent to 1% of GDP and other tax hikes, expenditure cut and structural reforms.
11
Figure 2-3-1 Economic Cycles and the Timing to Start Fiscal Consolidation
United States
-12
-10
-8
-6
-4
-2
0
2
4
6
8
1980 82 84 86 88 90 92 94 96 98 2000 02 04 06 08
(% of GDP)
Australia
-8
-6
-4
-2
0
2
4
6
8
1980 82 84 86 88 90 92 94 96 98 2000 02 04 06 08
(% of GDP)Canada
-10
-8
-6
-4
-2
0
2
4
6
8
1980 82 84 86 88 90 92 94 96 98 2000 02 04 06 08
Sweden
-14
-12
-10
-8
-6
-4
-2
0
2
4
6
8
1980 82 84 86 88 90 92 94 96 98 2000 02 04 06 08
(% of GDP)
Ireland
-20
-15
-10
-5
0
5
10
15
1980 82 84 86 88 90 92 94 96 98 2000 02 04 06 08
(% of GDP)France
-10
-8
-6
-4
-2
0
2
4
6
1980 82 84 86 88 90 92 94 96 98 2000 02 04 06 08
(% of GDP)
United Kingdom
-14
-12
-10
-8
-6
-4
-2
0
2
4
6
8
1980 82 84 86 88 90 92 94 96 98 2000 02 04 06 08
(% of GDP)
Fiscal balance
Structural primary balance
Cyclically adjusted fiscal balance
GDP gap
(Year)
Interest payments
(Notes) 1. Source: OECD. 2. Cyclically adjusted fiscal balance is obtained by subtracting structural balance from fiscal balance. Interest payments are obtained by subtracting structural primary balance from structural balance.
(Year)
(Year)
(Year)(Year)
(Year)
Fiscal balance
Structural primarybalance
Cyclically adjustedfiscal balance
Interest payments
Fiscal balance
Structural primarybalance
Cyclicallly adjustedfiscal balance
GDP gap
Interest payments
Fiscal balance
Structural primary balance
Cyclically adjustedfiscal balance
GDP gap
Interest payments
Fiscal balanceStructural primary
balance
Cyclically adjustedfiscal balance
GDP gap
Interest payments
New Zealand
-8
-6
-4
-2
0
2
4
6
8
1980 82 84 86 88 90 92 94 96 98 2000 02 04 06 08
(% of GDP)
(Year)
(% of GDP)
Fiscal balance
Structural primary balance
Cyclically adjustedfiscal balance
GDP gap
Interestpayments
GDP gap Real economic growth rate
(Year)
Fiscal balance
Structural primary balanceCyclically adjusted fiscal balance
GDP gap
Interest payments
Fiscal balanceStructural primary balance
Cyclically adjustedfiscal balance
GDP gap
Interest payments
Chrétien(Liberal)
Mulroney(Progressive
Conservative)
Campbell(Progressive
Conservative)
Martin(Liberal)
Harper(Conservative)
Real economic growth rate
Real economic growth rateReal economic growth rate
Real economic growth rateReal economic
growth rate
Real economic growth rateReal economic growth rate
Trudeau(Liberal)
Turner(Liberal)
Hawke(Labor)
Keating(Labor)
Howard(Liberal-National coalition)
Rudd(Labor)
Fraser(Liberal-National coalition)
Bildt(Non-Socialist
coalition)
Palme(SAP)
CarlssonI(SAP)
Carlsson II(SAP)
Reinfeldt(Non-Socialist coalition)
Persson(SAP)
Falldin(Non-Socialist
coalition)
Lange(Labour)
Palmer, Moore
(Labour)
Bolger(National)
Clark(Labour)
Shipley(National)
Muldoon(National)
Key(National)
Clinton(Democratic)
Bush (Senior)(Republican)
Reagan(Republican)
Bush(Republican)
Obama(Democratic)
Carter(Democratic)
Blair(Labour)
Thatcher(Conservative)
Major(Conservative)
Brown(Labour)
Sarkozy(UMP)
Mitterrand(PS, Cohabitation)
Chirac(RPR, UMP
Cohabitation)
Giscard d'Estaing(UDF)
Reynolds(Fianna Fail)
FitzGerald(Fine Gael)
Haughey(Fianna Fail)
Bruton(Fine Gael)
Ahern(Fianna Fail)
Cowen(Fianna Fail)
Haughey(Fianna Fail)
-12
-10
-8
-6
-4
-2
0
2
4
6
8
1980 82 84 86 88 90 92 94 96 98 2000 02 04 06 08
United States(% of GDP)
Cyclical balance
-8
-6
-4
-2
0
2
4
6
8
1980 82 84 86 88 90 92 94 96 98 2000 02 04 06 08
Australia(% of GDP)
Cyclical balance
-10
-8
-6
-4
-2
0
2
4
6
8
1980 82 84 86 88 90 92 94 96 98 2000 02 04 06 08
Canada
-14
-12
-10
-8
-6
-4
-2
0
2
4
6
8
1980 82 84 86 88 90 92 94 96 98 2000 02 04 06 08
Sweden(% of GDP)
Cyclical balance
-20
-15
-10
-5
0
5
10
15
1980 82 84 86 88 90 92 94 96 98 2000 02 04 06 08
Ireland(% of GDP)
Cyclical balance
-10
-8
-6
-4
-2
0
2
4
6
1980 82 84 86 88 90 92 94 96 98 2000 02 04 06 08
France(% of GDP)
Cyclical balance
-14
-12
-10
-8
-6
-4
-2
0
2
4
6
8
1980 82 84 86 88 90 92 94 96 98 2000 02 04 06 08
United Kingdom(% of GDP)
Cyclical balance
Fiscal balance
Structural primary balanceGDP gap
(Year)
Interest payments
(Notes) 1. Source: OECD.2. Cyclical balance is obtained by subtracting structural balance from fiscal balance. Interest payments are obtained by subtracting structural primary balance
from structural balance.
(Year)
(Year)
(Year)(Year)
(Year)
Fiscal balance
Structural primary balance
Cyclical balance
Interest payments
Fiscal balance
Structural primary balance
GDP gap
Interest payments
Fiscal balance
Structural primary balance GDP gap
Interest payments
Fiscal balanceStructural primary
balance
GDP gap
Interest payments
-8
-6
-4
-2
0
2
4
6
8
1980 82 84 86 88 90 92 94 96 98 2000 02 04 06 08
New Zealand(% of GDP)
Cyclical balance
(Year)
(% of GDP)
Fiscal balance
Structural primary balance
GDP gap
Interest payments
GDP gap Real economic growth rate
(Year)
Fiscal balance
Structural primary balance
GDP gap
Interest payments
Fiscal balanceStructural primary balance
GDP gap
Interest payments
Chrétien(Liberal)
Mulroney(Progressive
Conservative)
Campbell(Progressive
Conservative)
Martin(Liberal)
Harper(Conservative)
Real economic growth rate
Real economic growth rateReal economic growth rate
Real economic growth rateReal economic
growth rate
Real economic growth rate
Real economic growth rate
Trudeau(Liberal)
Turner(Liberal)
Hawke(Labor)
Keating(Labor)
Howard(Liberal-National
Rudd(Labor)
Fraser (Liberal-National
coalition)
Bildt(Non-Socialist
coalition)
Palme(SAP)
CarlssonI(SAP) Carlsson II
(SAP)
Reinfeldt(Non-Socialist coalition)
Persson(SAP)
Falldin(Non-Socialist
coalition)
Lange(Labour)
Palmer,Moore
(Labour)
Bolger(National)
Clark(Labour)
Shipley(National)
Muldoon(National)
Key(National)
Clinton(Democratic)
Bush (Senior)(Republican)
Reagan(Republican)
Bush(Republican)
Obama(Democratic)
Carter(Democratic)
Blair(Labour)
Thatcher(Conservative)
Major(Conservative)
Brown(Labour)
Sarkozy(UMP)
Mitterrand(PS, Cohabitation)
Chirac(RPR, UMP
Cohabitation)
Giscard d'Estaing(UDF)
Reynolds(Fianna Fail)
FitzGerald(Fine Gael)
Haughey(Fianna Fail)
Bruton(Fine Gael)
Ahern(Fianna Fail)
Cowen(Fianna Fail)
Haughey(Fianna Fail)
12
(2) Pace of fiscal consolidation
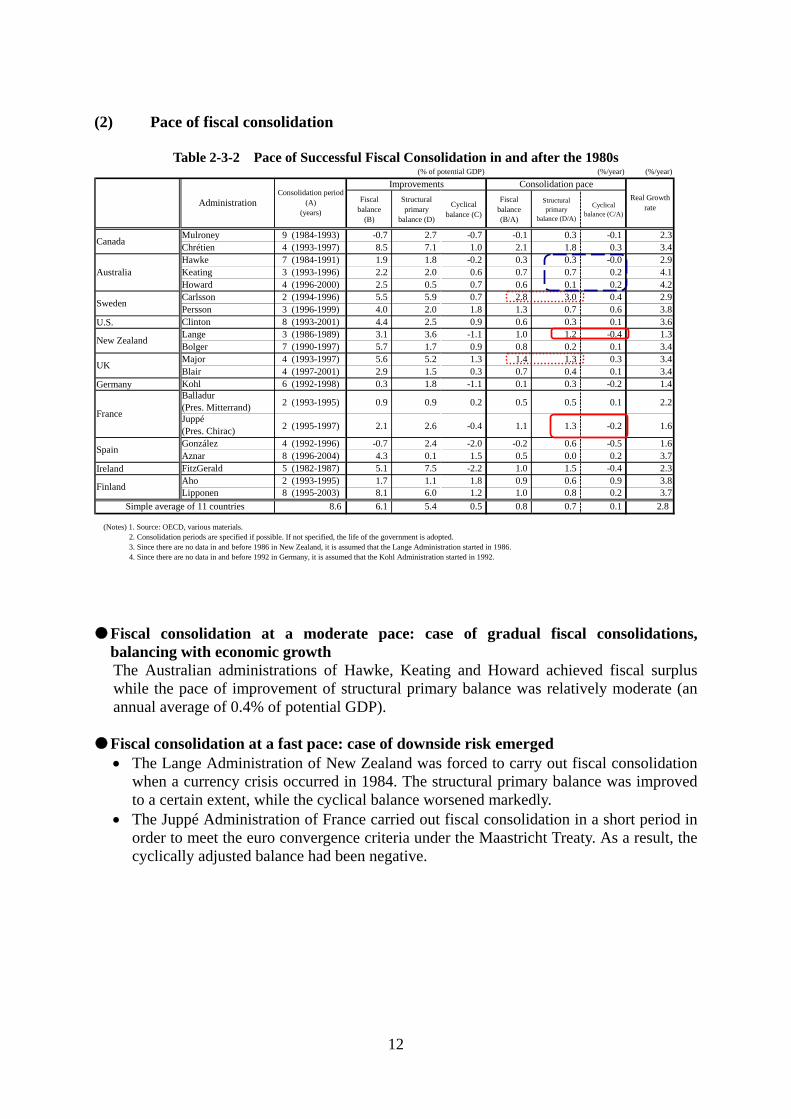
Table 2-3-2 Pace of Successful Fiscal Consolidation in and after the 1980s Fiscal consolidation at a moderate pace: case of gradual fiscal consolidations,
balancing with economic growth The Australian administrations of Hawke, Keating and Howard achieved fiscal surplus while the pace of improvement of structural primary balance was relatively moderate (an annual average of 0.4% of potential GDP).
Fiscal consolidation at a fast pace: case of downside risk emerged
The Lange Administration of New Zealand was forced to carry out fiscal consolidation when a currency crisis occurred in 1984. The structural primary balance was improved to a certain extent, while the cyclical balance worsened markedly.
The Juppé Administration of France carried out fiscal consolidation in a short period in order to meet the euro convergence criteria under the Maastricht Treaty. As a result, the cyclically adjusted balance had been negative.
(% of potential GDP) (%/year) (%/year)
Fiscalbalance
(B)
Structuralprimary
balance (D)
Cyclicalbalance (C)
Fiscalbalance(B/A)
Structuralprimary
balance (D/A)
Cyclicalbalance (C/A)
Mulroney 9 (1984-1993) -0.7 2.7 -0.7 -0.1 0.3 -0.1 2.3Chrétien 4 (1993-1997) 8.5 7.1 1.0 2.1 1.8 0.3 3.4Hawke 7 (1984-1991) 1.9 1.8 -0.2 0.3 0.3 -0.0 2.9Keating 3 (1993-1996) 2.2 2.0 0.6 0.7 0.7 0.2 4.1Howard 4 (1996-2000) 2.5 0.5 0.7 0.6 0.1 0.2 4.2Carlsson 2 (1994-1996) 5.5 5.9 0.7 2.8 3.0 0.4 2.9Persson 3 (1996-1999) 4.0 2.0 1.8 1.3 0.7 0.6 3.8
U.S. Clinton 8 (1993-2001) 4.4 2.5 0.9 0.6 0.3 0.1 3.6Lange 3 (1986-1989) 3.1 3.6 -1.1 1.0 1.2 -0.4 1.3Bolger 7 (1990-1997) 5.7 1.7 0.9 0.8 0.2 0.1 3.4Major 4 (1993-1997) 5.6 5.2 1.3 1.4 1.3 0.3 3.4Blair 4 (1997-2001) 2.9 1.5 0.3 0.7 0.4 0.1 3.4
Germany Kohl 6 (1992-1998) 0.3 1.8 -1.1 0.1 0.3 -0.2 1.4Balladur(Pres. Mitterrand) 2 (1993-1995) 0.9 0.9 0.2 0.5 0.5 0.1 2.2
Juppé(Pres. Chirac) 2 (1995-1997) 2.1 2.6 -0.4 1.1 1.3 -0.2 1.6
González 4 (1992-1996) -0.7 2.4 -2.0 -0.2 0.6 -0.5 1.6Aznar 8 (1996-2004) 4.3 0.1 1.5 0.5 0.0 0.2 3.7
Ireland FitzGerald 5 (1982-1987) 5.1 7.5 -2.2 1.0 1.5 -0.4 2.3Aho 2 (1993-1995) 1.7 1.1 1.8 0.9 0.6 0.9 3.8Lipponen 8 (1995-2003) 8.1 6.0 1.2 1.0 0.8 0.2 3.7
8.6 6.1 5.4 0.5 0.8 0.7 0.1 2.8
France
Spain
Finland
Simple average of 11 countries
Sweden
New Zealand
UK
Consolidation paceReal Growth
rate
Canada
Australia
AdministrationConsolidation period
(A)(years)
Improvements
(Notes) 1. Source: OECD, various materials. 2. Consolidation periods are specified if possible. If not specified, the life of the government is adopted. 3. Since there are no data in and before 1986 in New Zealand, it is assumed that the Lange Administration started in 1986. 4. Since there are no data in and before 1992 in Germany, it is assumed that the Kohl Administration started in 1992.
13
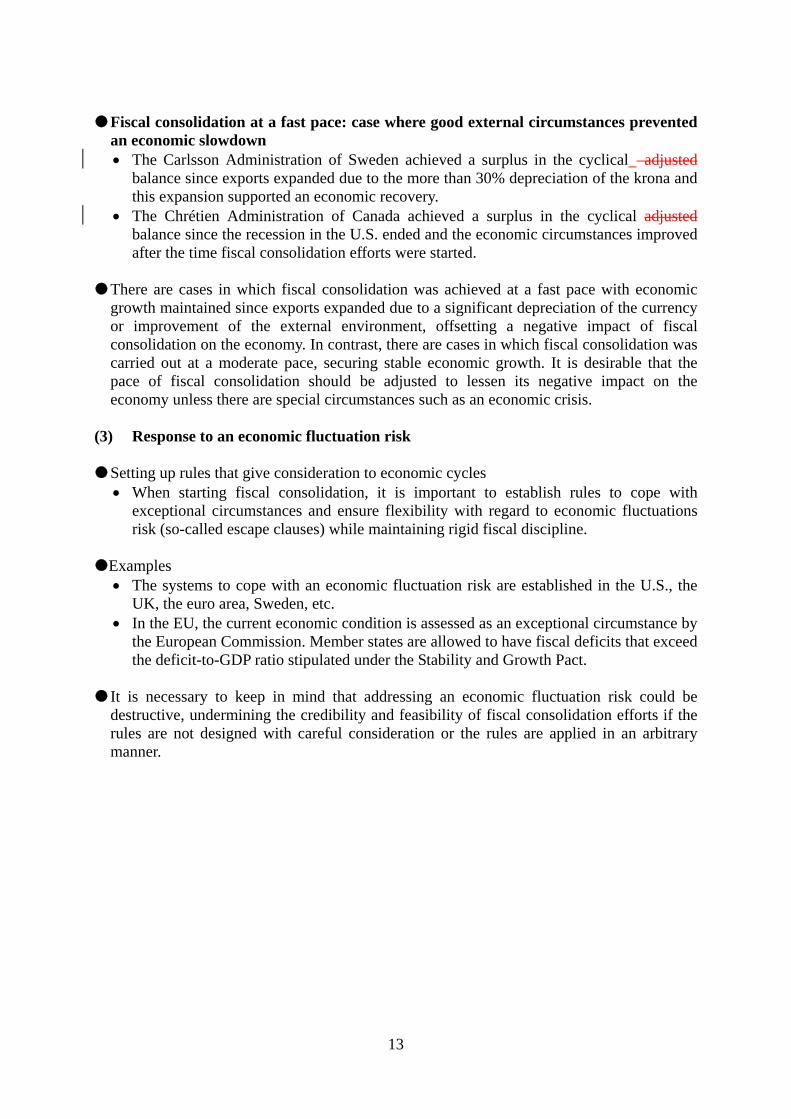
Fiscal consolidation at a fast pace: case where good external circumstances prevented an economic slowdown The Carlsson Administration of Sweden achieved a surplus in the cyclical adjusted
balance since exports expanded due to the more than 30% depreciation of the krona and this expansion supported an economic recovery.
The Chrétien Administration of Canada achieved a surplus in the cyclical adjusted balance since the recession in the U.S. ended and the economic circumstances improved after the time fiscal consolidation efforts were started.
There are cases in which fiscal consolidation was achieved at a fast pace with economic
growth maintained since exports expanded due to a significant depreciation of the currency or improvement of the external environment, offsetting a negative impact of fiscal consolidation on the economy. In contrast, there are cases in which fiscal consolidation was carried out at a moderate pace, securing stable economic growth. It is desirable that the pace of fiscal consolidation should be adjusted to lessen its negative impact on the economy unless there are special circumstances such as an economic crisis.
(3) Response to an economic fluctuation risk Setting up rules that give consideration to economic cycles
When starting fiscal consolidation, it is important to establish rules to cope with exceptional circumstances and ensure flexibility with regard to economic fluctuations risk (so-called escape clauses) while maintaining rigid fiscal discipline.
Examples
The systems to cope with an economic fluctuation risk are established in the U.S., the UK, the euro area, Sweden, etc.
In the EU, the current economic condition is assessed as an exceptional circumstance by the European Commission. Member states are allowed to have fiscal deficits that exceed the deficit-to-GDP ratio stipulated under the Stability and Growth Pact.
It is necessary to keep in mind that addressing an economic fluctuation risk could be
destructive, undermining the credibility and feasibility of fiscal consolidation efforts if the rules are not designed with careful consideration or the rules are applied in an arbitrary manner.
14
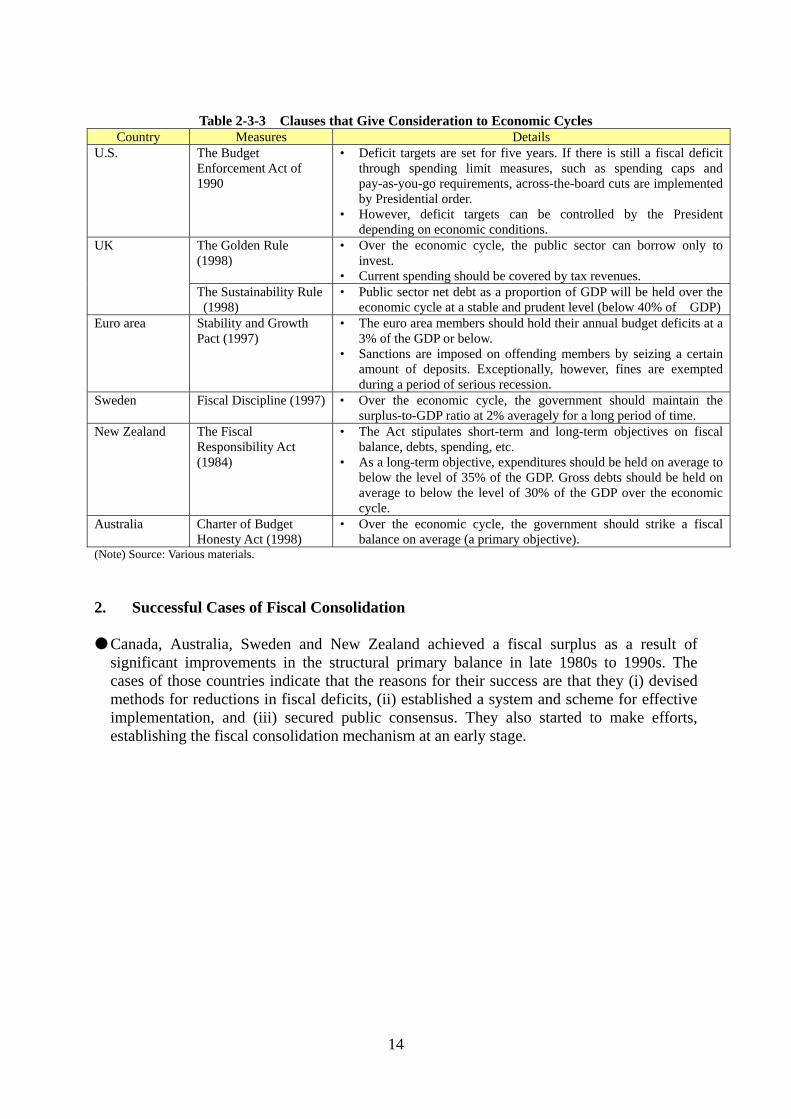
Table 2-3-3 Clauses that Give Consideration to Economic Cycles Country Measures Details
U.S. The Budget Enforcement Act of 1990
• Deficit targets are set for five years. If there is still a fiscal deficit through spending limit measures, such as spending caps and pay-as-you-go requirements, across-the-board cuts are implemented by Presidential order.
• However, deficit targets can be controlled by the President depending on economic conditions.
UK The Golden Rule (1998)
• Over the economic cycle, the public sector can borrow only to invest.
• Current spending should be covered by tax revenues. The Sustainability Rule (1998)
• Public sector net debt as a proportion of GDP will be held over the economic cycle at a stable and prudent level (below 40% of GDP)
Euro area Stability and Growth Pact (1997)
• The euro area members should hold their annual budget deficits at a 3% of the GDP or below.
• Sanctions are imposed on offending members by seizing a certain amount of deposits. Exceptionally, however, fines are exempted during a period of serious recession.
Sweden Fiscal Discipline (1997) • Over the economic cycle, the government should maintain the surplus-to-GDP ratio at 2% averagely for a long period of time.
New Zealand The Fiscal Responsibility Act (1984)
• The Act stipulates short-term and long-term objectives on fiscal balance, debts, spending, etc.
• As a long-term objective, expenditures should be held on average to below the level of 35% of the GDP. Gross debts should be held on average to below the level of 30% of the GDP over the economic cycle.
Australia Charter of Budget Honesty Act (1998)
• Over the economic cycle, the government should strike a fiscal balance on average (a primary objective).
(Note) Source: Various materials.
2. Successful Cases of Fiscal Consolidation Canada, Australia, Sweden and New Zealand achieved a fiscal surplus as a result of
significant improvements in the structural primary balance in late 1980s to 1990s. The cases of those countries indicate that the reasons for their success are that they (i) devised methods for reductions in fiscal deficits, (ii) established a system and scheme for effective implementation, and (iii) secured public consensus. They also started to make efforts, establishing the fiscal consolidation mechanism at an early stage.
15
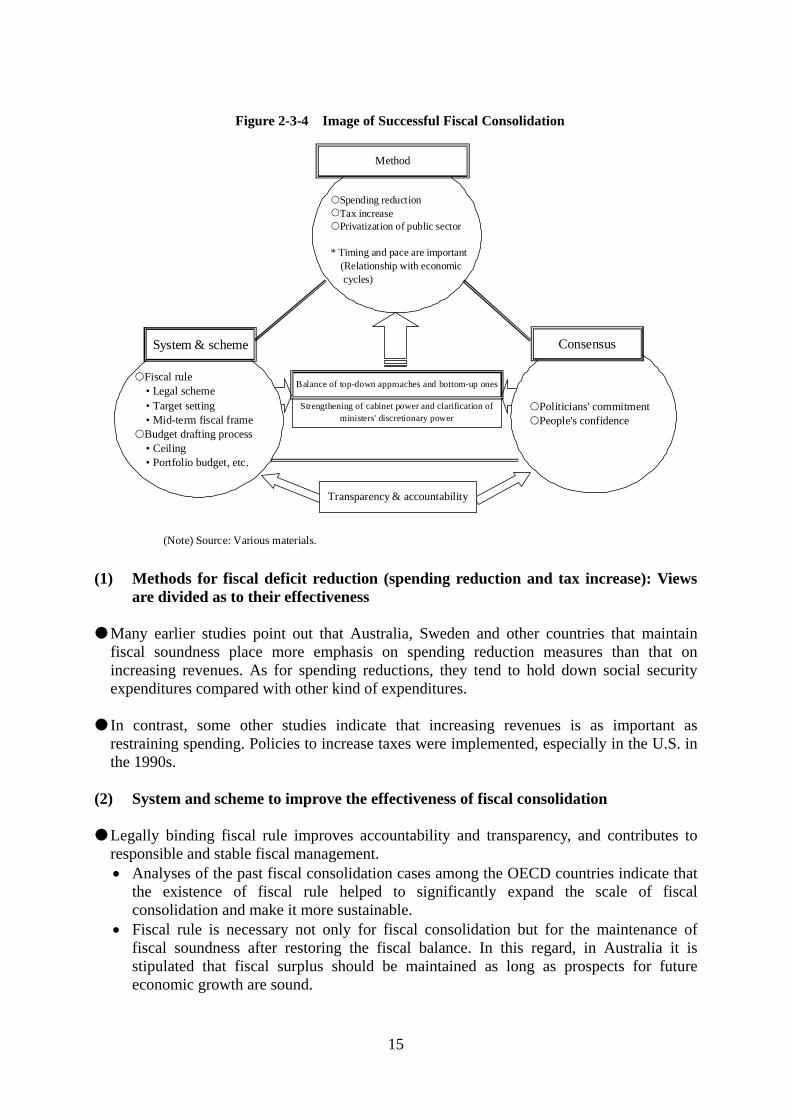
Figure 2-3-4 Image of Successful Fiscal Consolidation (1) Methods for fiscal deficit reduction (spending reduction and tax increase): Views
are divided as to their effectiveness Many earlier studies point out that Australia, Sweden and other countries that maintain
fiscal soundness place more emphasis on spending reduction measures than that on increasing revenues. As for spending reductions, they tend to hold down social security expenditures compared with other kind of expenditures.
In contrast, some other studies indicate that increasing revenues is as important as
restraining spending. Policies to increase taxes were implemented, especially in the U.S. in the 1990s.
(2) System and scheme to improve the effectiveness of fiscal consolidation Legally binding fiscal rule improves accountability and transparency, and contributes to
responsible and stable fiscal management. Analyses of the past fiscal consolidation cases among the OECD countries indicate that
the existence of fiscal rule helped to significantly expand the scale of fiscal consolidation and make it more sustainable.
Fiscal rule is necessary not only for fiscal consolidation but for the maintenance of fiscal soundness after restoring the fiscal balance. In this regard, in Australia it is stipulated that fiscal surplus should be maintained as long as prospects for future economic growth are sound.
Fiscal rule • Legal scheme • Target setting • Mid-term fiscal frameBudget drafting process • Ceiling • Portfolio budget, etc.
System & scheme
Spending reductionTax increasePrivatization of public sector
* Timing and pace are important (Relationship with economic cycles)
Method
Consensus
Politicians' commitmentPeople's confidence
Strengthening of cabinet power and clarification ofministers' discretionary power
Transparency & accountability
Balance of top-down approaches and bottom-up ones
(Note) Source: Various materials.
16
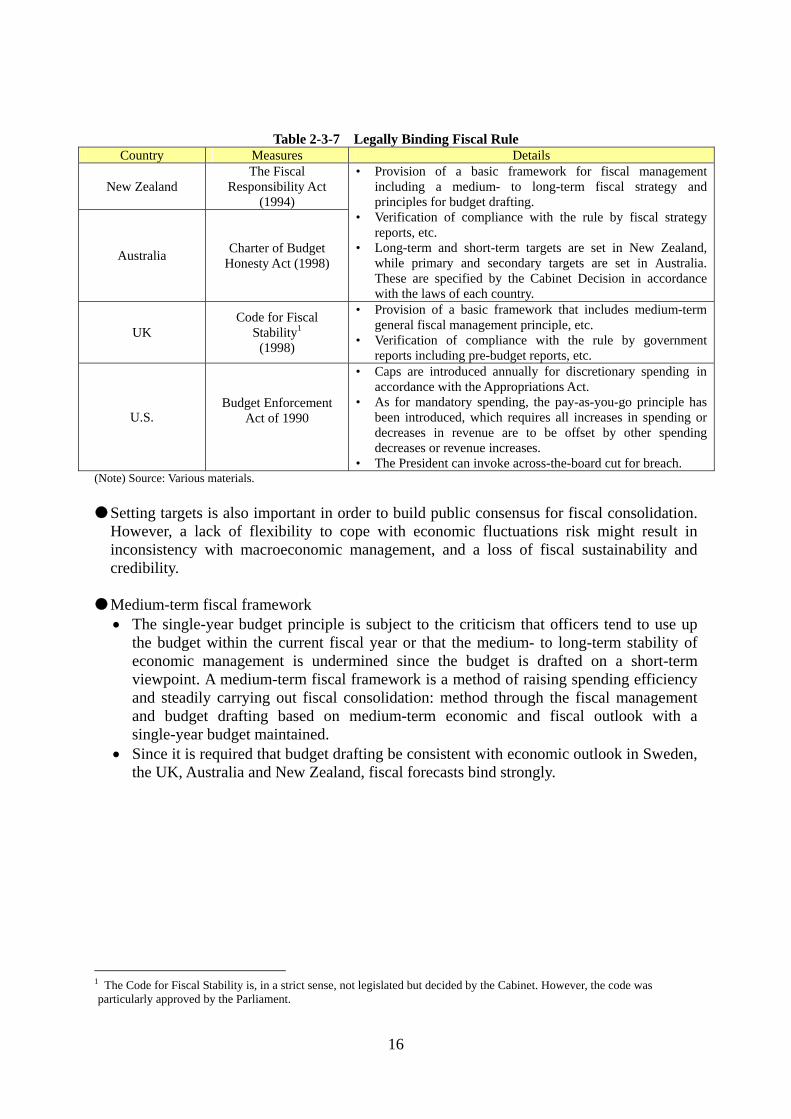
Table 2-3-7 Legally Binding Fiscal Rule
Country Measures Details
New Zealand The Fiscal
Responsibility Act (1994)
• Provision of a basic framework for fiscal management including a medium- to long-term fiscal strategy and principles for budget drafting.
• Verification of compliance with the rule by fiscal strategy reports, etc.
• Long-term and short-term targets are set in New Zealand, while primary and secondary targets are set in Australia. These are specified by the Cabinet Decision in accordance with the laws of each country.
Australia Charter of Budget
Honesty Act (1998)
UK Code for Fiscal
Stability1 (1998)
• Provision of a basic framework that includes medium-term general fiscal management principle, etc.
• Verification of compliance with the rule by government reports including pre-budget reports, etc.
U.S. Budget Enforcement
Act of 1990
• Caps are introduced annually for discretionary spending in accordance with the Appropriations Act.
• As for mandatory spending, the pay-as-you-go principle has been introduced, which requires all increases in spending or decreases in revenue are to be offset by other spending decreases or revenue increases.
• The President can invoke across-the-board cut for breach. (Note) Source: Various materials.
Setting targets is also important in order to build public consensus for fiscal consolidation.
However, a lack of flexibility to cope with economic fluctuations risk might result in inconsistency with macroeconomic management, and a loss of fiscal sustainability and credibility.
Medium-term fiscal framework
The single-year budget principle is subject to the criticism that officers tend to use up the budget within the current fiscal year or that the medium- to long-term stability of economic management is undermined since the budget is drafted on a short-term viewpoint. A medium-term fiscal framework is a method of raising spending efficiency and steadily carrying out fiscal consolidation: method through the fiscal management and budget drafting based on medium-term economic and fiscal outlook with a single-year budget maintained.
Since it is required that budget drafting be consistent with economic outlook in Sweden, the UK, Australia and New Zealand, fiscal forecasts bind strongly.
1 The Code for Fiscal Stability is, in a strict sense, not legislated but decided by the Cabinet. However, the code was particularly approved by the Parliament.
17
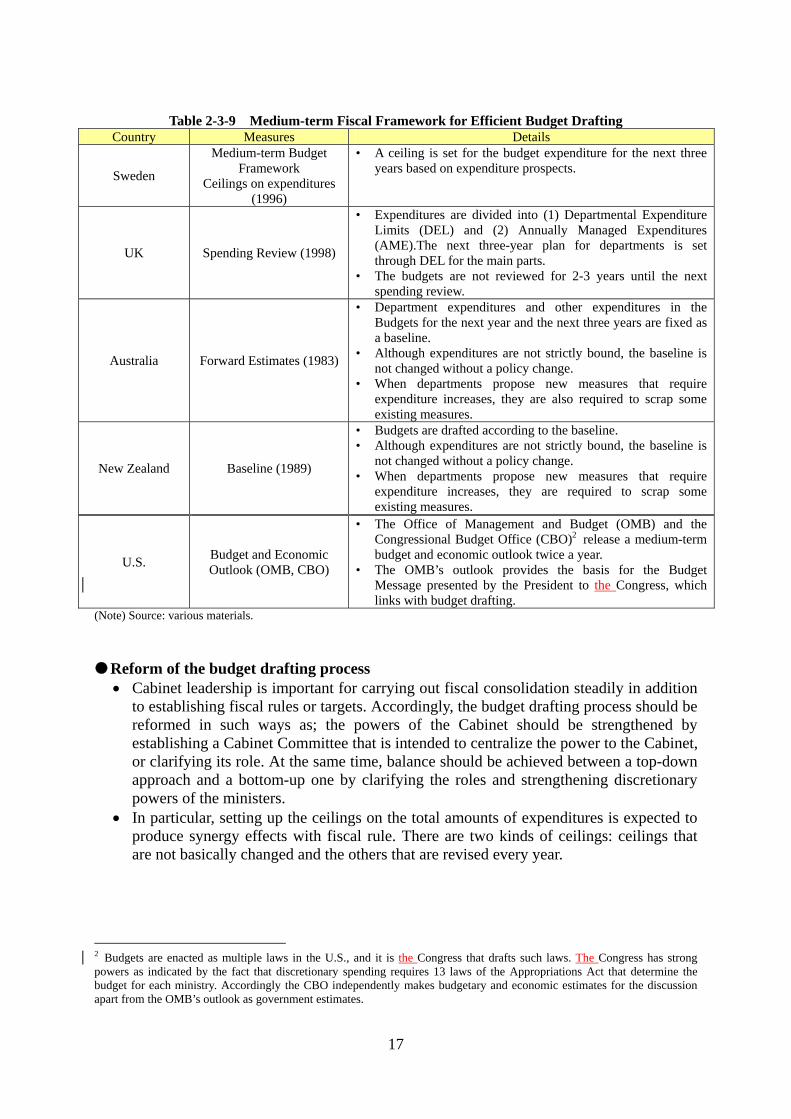
Table 2-3-9 Medium-term Fiscal Framework for Efficient Budget Drafting Country Measures Details
Sweden
Medium-term Budget Framework
Ceilings on expenditures (1996)
• A ceiling is set for the budget expenditure for the next three years based on expenditure prospects.
UK Spending Review (1998)
• Expenditures are divided into (1) Departmental Expenditure Limits (DEL) and (2) Annually Managed Expenditures (AME).The next three-year plan for departments is set through DEL for the main parts.
• The budgets are not reviewed for 2-3 years until the next spending review.
Australia Forward Estimates (1983)
• Department expenditures and other expenditures in the Budgets for the next year and the next three years are fixed as a baseline.
• Although expenditures are not strictly bound, the baseline is not changed without a policy change.
• When departments propose new measures that require expenditure increases, they are also required to scrap some existing measures.
New Zealand Baseline (1989)
• Budgets are drafted according to the baseline. • Although expenditures are not strictly bound, the baseline is
not changed without a policy change. • When departments propose new measures that require
expenditure increases, they are required to scrap some existing measures.
U.S. Budget and Economic Outlook (OMB, CBO)
• The Office of Management and Budget (OMB) and the Congressional Budget Office (CBO)2 release a medium-term budget and economic outlook twice a year.
• The OMB’s outlook provides the basis for the Budget Message presented by the President to the Congress, which links with budget drafting.
(Note) Source: various materials.
Reform of the budget drafting process
Cabinet leadership is important for carrying out fiscal consolidation steadily in addition to establishing fiscal rules or targets. Accordingly, the budget drafting process should be reformed in such ways as; the powers of the Cabinet should be strengthened by establishing a Cabinet Committee that is intended to centralize the power to the Cabinet, or clarifying its role. At the same time, balance should be achieved between a top-down approach and a bottom-up one by clarifying the roles and strengthening discretionary powers of the ministers.
In particular, setting up the ceilings on the total amounts of expenditures is expected to produce synergy effects with fiscal rule. There are two kinds of ceilings: ceilings that are not basically changed and the others that are revised every year.
2 Budgets are enacted as multiple laws in the U.S., and it is the Congress that drafts such laws. The Congress has strong powers as indicated by the fact that discretionary spending requires 13 laws of the Appropriations Act that determine the budget for each ministry. Accordingly the CBO independently makes budgetary and economic estimates for the discussion apart from the OMB’s outlook as government estimates.

18
Table 2-3-10 Measures for Budget Drafting Process Reforms Country Measures Details
UK (1981) Australia (1984)
Establishment of a Cabinet Committee
• Scheme to secure the centralization of powers in the Cabinet.
• Composed of a few members, including ministers such as the Prime Minister and the Finance Minister.
• Centralized decision-making on budget principles, priority fields, etc.
Australia
Portfolio budget (1984)
• Under a certain ceiling, resources are reallocated by the Minister within the fields which he or she takes charge of.
• Reallocation within portfolios is broadly left to the minister’s discretion.
Running Cost System (1987)
• Budgets for running costs, which were previously allocated one by one in each item of budget, are allocated to each department as a whole.
• How to allocate the budget is broadly left to the discretion of each department.
Sweden
Setting ceilings on total expenditures
• Ceilings are set on total expenditures that extend over three years through a framework budgeting system specified under the Finance Act (1995).
• Ceilings once set are not changed unless revised in the Parliament.
Australia
• Ceilings are revised every year. The Forward Estimates (1983) actually play the role of ceilings.
• Modification of the ceilings requires a cut in other expenditures or an increase in revenues.
New Zealand
• Ceilings are revised every year. The Baseline (1983) described above actually plays the role of ceilings.
• A cap is set on total increases in discretionary expenditures that extend over three years during the life of the administration (1996).
(Note) Source: Various materials.
(3) Ensuring public understanding of fiscal consolidation (securing transparency and
strengthening accountability)
During a fiscal consolidation period, the public are obliged to bear the burden, whether expenditures are reduced or taxes are raised. Improving transparency as to information on fiscal conditions, etc. and strengthening accountability are prerequisite to public understanding of fiscal consolidation. (4) Recent trend: establishment of a highly professional fiscal policy organization that is
independent of the budget drafting organization Demand for a highly professional organization that can draft fiscal policy rules
Mainly in Europe, many opinions have been expressed recently that a highly professional fiscal policy organization that is independent of the budget drafting organization is an effective means of implementing fiscal consolidation.
Many countries experience a political bias towards fiscal deficit expansion and an optimistic economic outlook which provides the basis for budget. Accordingly, in addition to fiscal policy rules, a scheme should be devised to lessen political influence on the fiscal policy stance for steadily implementing fiscal consolidation; it is important for the fiscal policy organization that makes highly professional analyses to prepare the

19
economic outlook required as the basis for budget, and evaluate the short-term, as well as the medium- to long-term fiscal outlook and fiscal policies.
Netherlands Bureau for Economic Policy Analysis
The Netherlands Bureau for Economic Policy Analysis releases a quarterly short-term economic outlook, prepares a medium- to long-term economic and fiscal outlook and assesses various economic policies.
Requested by political parties in an election, the Bureau analyzes and releases the effects that their manifesto would have on the economy and public finances (fiscal deficits, employment, etc.).
UK Office for Budget Responsibility
In the UK, the Office for Budget Responsibility (OBR) was newly formed when the administration changed in the general election held in May 2010.
While preparing an economic outlook that provides the basis for budget, the OBR assesses the effects that the budget draft would have on the economy and also the consistency between the budget draft and fiscal targets, from the independent viewpoint of HM Treasury. The OBR presents the relationship between the budget draft and the future economic and fiscal outlook, as well as fiscal targets, using fan charts.
Figure 2-3-13 Outlook for Economic Growth Rates and Fiscal Balance in the UK
(% of GDP) (% of GDP)
(Year) (FY)
(1) Outlook for real economic growth rates (2) Outlook for fiscal balance
(Note) Source: Office for Budget Responsibility.
Mandate: Balancing structuralfiscal balance (excludinginvestment expenses) by FY2015
20
3. Relationship between Fiscal Consolidation and other Policies (1) Fiscal consolidation and monetary policies In enhancing the feasibility and sustainability of fiscal consolidation it is effective to
implement an accommodative monetary policy that alleviates the short-term negative effects of fiscal consolidation on the economy.
The cases described above include the efforts of the Clinton Administration in the U.S.
Fiscal consolidation was supported by an accommodative monetary policy. After the economy entered into the recovery phase, a prudent attitude was adopted for the time being in raising interest rates, while fiscal consolidation measures were vigorously implemented.
Fiscal consolidation got under way, achieving a fiscal surplus from FY1998 to FY 2001. (2) Fiscal consolidation accompanied by regulatory reform of Regulation to raise
potential growth rates Structural reforms not only relate to each fiscal consolidation plan designed to cut
expenditures, but also contribute to a reduction in the fiscal deficit-to-GDP ratio by raising potential growth rates.
Australia took the measures described below. The government has privatized state-owned companies, mainly in electricity,
telecommunication, airlines and railways industries, and sold their assets since the 1980s.
The National Competition Policy has been implemented since 1995. The policy is the introduction of public and private competitive bidding in fields that have been monopolized by the public sector. It aims at reducing public service costs.
Owing to the structural reforms above, TFP growth rate in Australia increased from 0.75% in the 1970s and 1980s to 2% in the 1990s (OECD, 1999).
A rise in the TFP growth rate pushed up the potential growth rates of Australia. Accordingly, a series of structural reforms are evaluated as being positive in the sense that they eventually contributed to fiscal consolidation.

21
4. Assessment of Fiscal Consolidation: Points Required for the Successful Fiscal Consolidation
(1) Steady consolidation at a moderate pace compatible with growth
Steadily reducing structural fiscal deficits through proceeding with expenditure cuts and revenue increase firmly.
It is desirable to start fiscal consolidation in a recovery phase. It is necessary to choose the appropriate timing and pace for the consolidation while paying sufficient attention to economic conditions.
(2) Setting up system and scheme for enhancing the effectiveness and sustainability of
fiscal consolidation It is helpful to establish a legal scheme for the steady implementation of fiscal deficit
reduction plans. Also, it is important to set up emergency measures, such as escape clauses, to work on
fiscal consolidation continuously, and it is necessary to ensure that the effectiveness of fiscal consolidation is not undermined by the loose or arbitrary application of such measures.
It is important to reform the budget drafting process to strengthen the leadership of the Cabinet, while broadening ministerial discretion as to budget allocations in the fields which ministers are in charge of.
Recent trends show that, a highly professional fiscal policy organization, which is independent of the budget drafting organization, prepares the economic outlook and assesses fiscal policies.
(3) Ensuring public understanding of fiscal consolidation (securing transparency,
strengthening accountability) It is important to secure market confidence for fiscal consolidation by clarifying the
targets, processes and rules, and demonstrating the government’s strong commitment. It is also expected that the negative effects of consolidation measures on the economy
can be alleviated through decrease of uncertainty of the future prospect for households or corporations and decrease of risk premiums as well.
(4) Support by regulatory reform of regulation and monetary easing
Efforts should be made to raise the potential GDP through regulatory reform of regulation and so on.
It is expected that easing monetary policies can supplement fiscal consolidation.