Embed Size (px)
Citation preview

1
Chapter 2. Failure Assessment of Brazed Structures
Dr. Y. Flom
NASA Goddard Space Flight Center
Code 541, Greenbelt
Maryland, 20771
USA
e-mail: [email protected]
List of Chapter Headings:
2.1 Introduction
2.2 Applicability of Common Failure Criteria to Analysis of Brazed Joints
2.2.1 Maximum Normal Stress
2.2.2 Maximum Shear and Octahedral Stress
2.2.3 Interaction Equations
2.2.4 Coulomb-Mohr Failure Criterion
2.2.5 Fitness-For-Service (FFS) Approach
2.3 Alternative Approach
2.4 Conclusions
Abstract: Despite the great advances in analytical methods available to structural engineers, designers
of brazed structures have great difficulties in addressing fundamental questions related to the load-
carrying capabilities of brazed assemblies. In this chapter we will review why such common engineering
tools as Finite Element Analysis (FEA) as well as many well-established theories (Tresca, von Mises,
Highest Principal Stress, etc) don’t work well for the brazed joints. This chapter will show how the classic
https://ntrs.nasa.gov/search.jsp?R=20120008193 2018-05-04T09:29:46+00:00Z
2
approach of using interaction equations and the less known Coulomb-Mohr failure criterion can be
employed to estimate Margins of Safety (MS) in brazed joints
Key words: brazed joints; margins of safety; failure assessment diagram; interaction equations;
Coulomb-Mohr failure criterion.
2.1 Introduction
It is hard to overestimate an importance of brazing in modern manufacturing processes.
Sophisticated designs of structures and mechanisms used in airspace, aircraft,
automotive, power and medical industries quite often expect various brazed joints to
perform under complicated multi-axial loading conditions.
Despite great advances in brazing technology and applications, reliability of brazed
joints remains to be one of the least developed fields of structural analysis. Mechanical,
welded or adhesively bonded joints in metallic and composite structures are routinely
assessed for their load-carrying capabilities in accordance with widely accepted
engineering analysis techniques and failure criteria (Blodgett, 1963; Bruhn, 1973;
Astronautic Structures manual, 1973; Hart-Smith, 1973; Shingley et al, 1989; Tong et al,
1999). An effort to find any information on engineering practice of estimating or
predicting load carrying capability of brazed, however, produces almost no results.
Consequently, there is a need for a simple engineering methodology that would enable
designers and structural analysts to evaluate strength margins of the brazed joints
exposed to combined shear and normal stresses.

3
This chapter reviews the challenges of using common failure criteria in predicting failure
of the brazed joints and offers an alternative approach based on developing failure
assessment diagrams (FAD). First step in constructing FADs is to identify or develop
brazed joint failure criteria. It would be highly desirable for such criteria to satisfy the
following conditions:
criteria should be applicable to any brazed joint geometry
it should be fairly conservative to account for the many uncertainties associated
with the brazing process, properties and analysis of the joints.
it should be sufficiently simple and easy to use so designers and structural
engineers find it helpful for practical applications.
it should be based on clearly defined properties of the brazed joints that can be
determined in a fairly straightforward manner.
For now, this Chapter is limited only to static loading of the brazed assemblies. As our
knowledge expands, future revisions and/or updates of this chapter may address the
brazed joints subjected to dynamic loading.
2.2 Applicability of Common Failure Criteria to Analysis of Brazed Joints
2.2.1 Maximum Normal Stress
This criterion predicts failure when the largest normal principal stress reaches the
uniaxial tensile strength of the material (Dieter, 1976; Dowling, 1993). This criterion is
commonly used in predicting failure of brittle materials. It is perhaps the simplest failure
criterion around and can be expressed as:
[1.1]
4
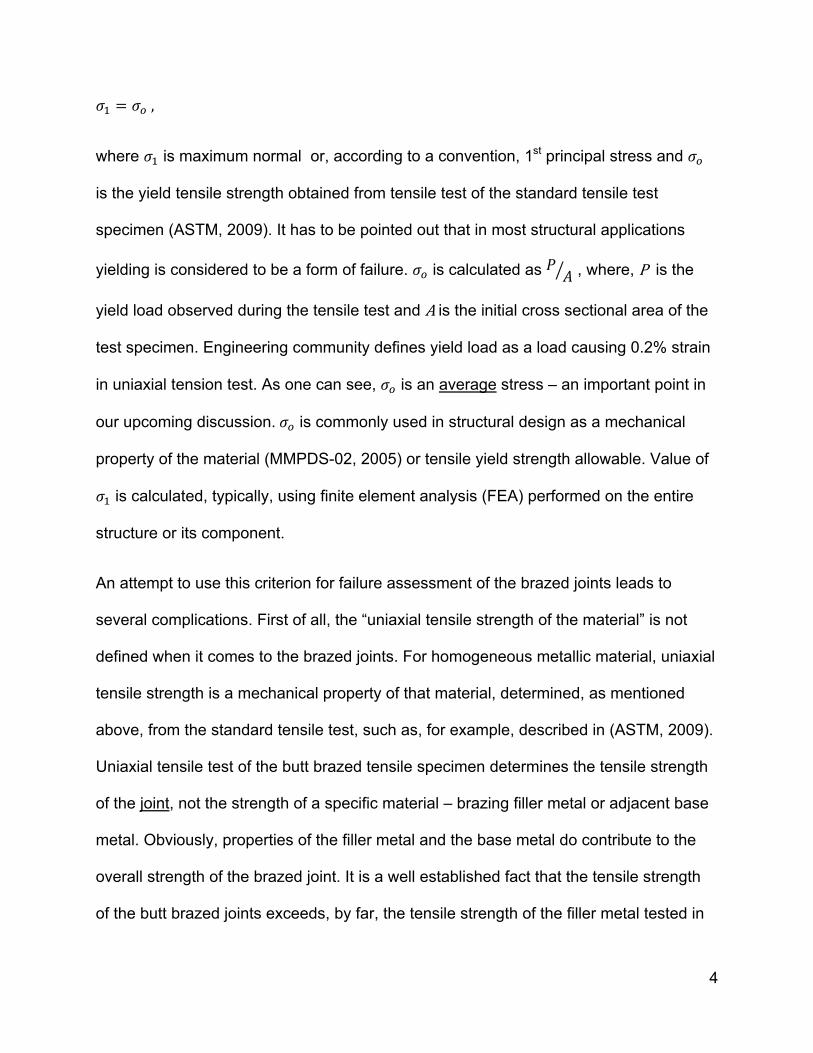
,
where is maximum normal or, according to a convention, 1st principal stress and
is the yield tensile strength obtained from tensile test of the standard tensile test
specimen (ASTM, 2009). It has to be pointed out that in most structural applications
yielding is considered to be a form of failure. is calculated as , where, P is the
yield load observed during the tensile test and A is the initial cross sectional area of the
test specimen. Engineering community defines yield load as a load causing 0.2% strain
in uniaxial tension test. As one can see, is an average stress – an important point in
our upcoming discussion. is commonly used in structural design as a mechanical
property of the material (MMPDS-02, 2005) or tensile yield strength allowable. Value of
is calculated, typically, using finite element analysis (FEA) performed on the entire
structure or its component.
An attempt to use this criterion for failure assessment of the brazed joints leads to
several complications. First of all, the “uniaxial tensile strength of the material” is not
defined when it comes to the brazed joints. For homogeneous metallic material, uniaxial
tensile strength is a mechanical property of that material, determined, as mentioned
above, from the standard tensile test, such as, for example, described in (ASTM, 2009).
Uniaxial tensile test of the butt brazed tensile specimen determines the tensile strength
of the joint, not the strength of a specific material – brazing filler metal or adjacent base
metal. Obviously, properties of the filler metal and the base metal do contribute to the
overall strength of the brazed joint. It is a well established fact that the tensile strength
of the butt brazed joints exceeds, by far, the tensile strength of the filler metal tested in
5
bulk form (Brazing Handbook, 2007; Rosen et al, 1993). Second problem with this
criterion is when it is applied to ductile and lap shear brazed joints. Such joints undergo
relatively large plastic deformation prior to failure, which is quite different from the brittle
behavior. Consequently, if selected, maximum normal stress criterion may be applicable
only to a case of uniaxially loaded butt brazed joints where filler metal constraint results
a highly triaxial stress state causing the braze joint to behave in quasi-brittle manner.
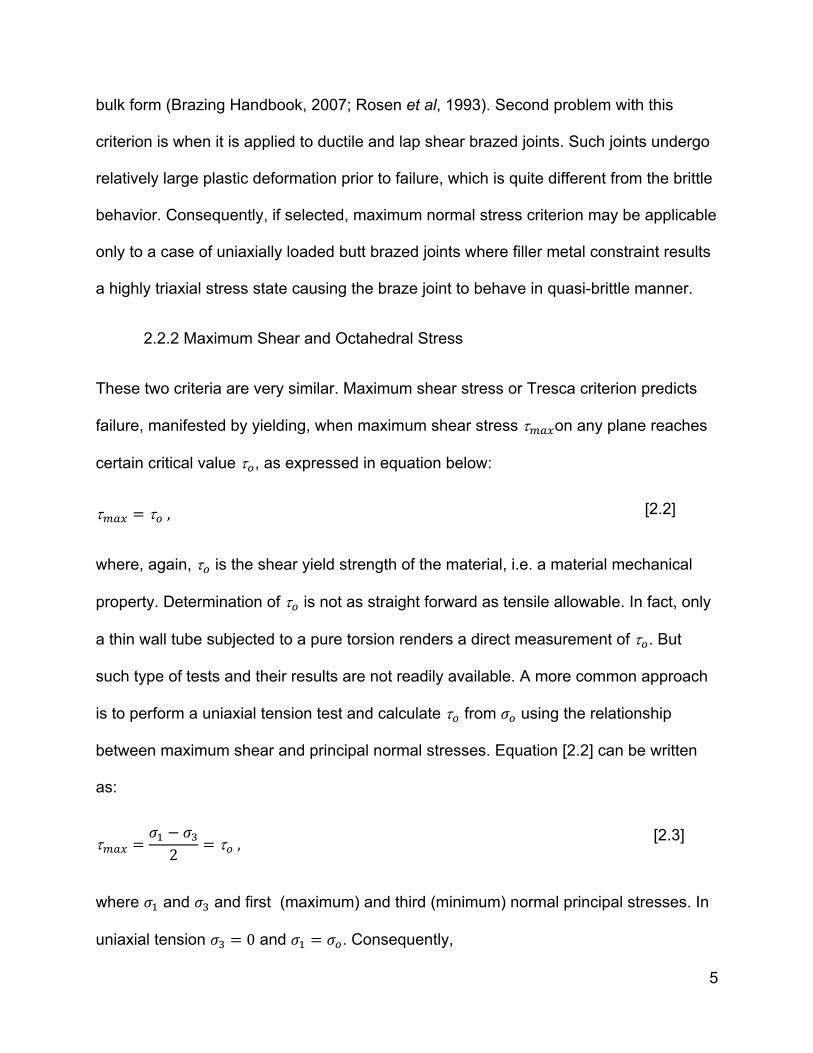
2.2.2 Maximum Shear and Octahedral Stress
These two criteria are very similar. Maximum shear stress or Tresca criterion predicts
failure, manifested by yielding, when maximum shear stress on any plane reaches
certain critical value , as expressed in equation below:
,
where, again, is the shear yield strength of the material, i.e. a material mechanical
property. Determination of is not as straight forward as tensile allowable. In fact, only
a thin wall tube subjected to a pure torsion renders a direct measurement of . But
such type of tests and their results are not readily available. A more common approach
is to perform a uniaxial tension test and calculate from using the relationship
between maximum shear and principal normal stresses. Equation [2.2] can be written
as:
2
,
where and and first (maximum) and third (minimum) normal principal stresses. In
uniaxial tension 0 and . Consequently,
[2.2]
[2.3]

6
,
As we can see, according to the maximum shear stress theory, maximum value of is
0.5 of .
Maximum octahedral (von Mises) or maximum distortion energy criterion predicts failure
when shear stress in octahedral plane reaches critical value (Dowling,
1993), or:
,
where is also a material property that now represents a critical value of shear stress
on octahedral plane that causes yielding. The shear stress on octahedral plane can be
expressed in terms of principal stresses as (Dowling, 1993):
Again, applying von Mises criterion to uniaxial tension test, and 0, we
obtain:
13
From equation [2.7] the value of can be also obtained from the uniaxial tension test
as:
√
[2.4]
[2.5]
[2.6]
[2.7]
[2.8]
7
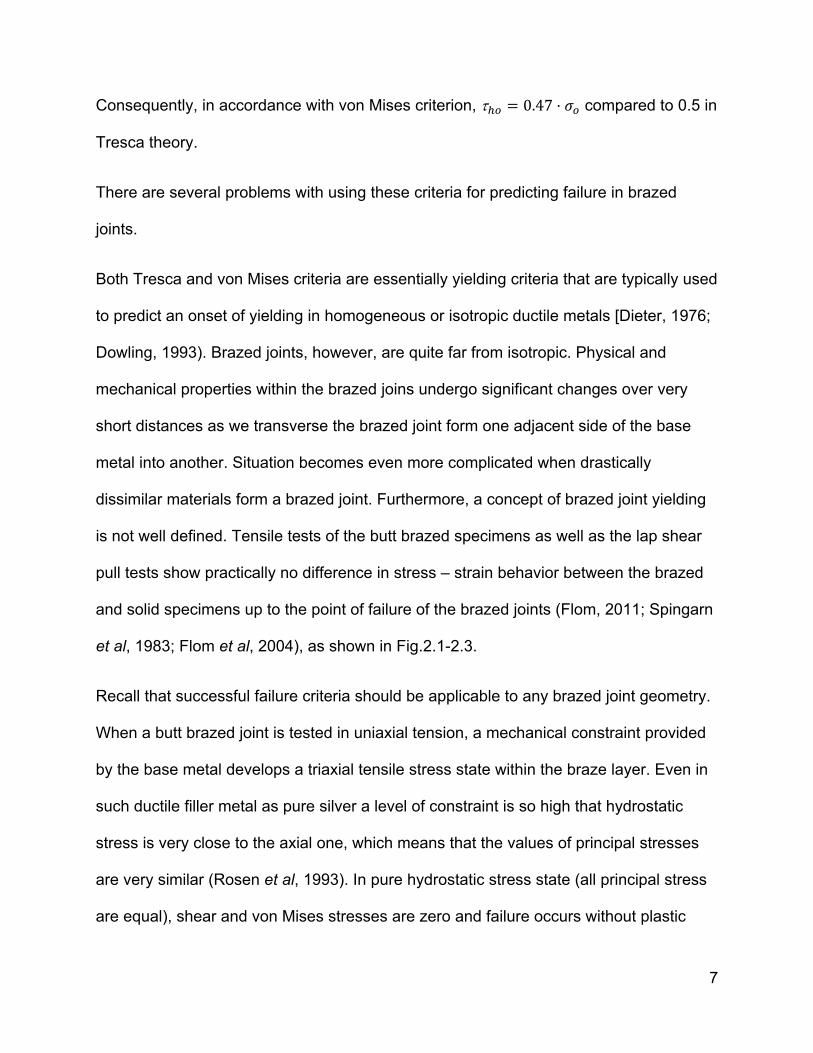
Consequently, in accordance with von Mises criterion, 0.47 compared to 0.5 in
Tresca theory.
There are several problems with using these criteria for predicting failure in brazed
joints.
Both Tresca and von Mises criteria are essentially yielding criteria that are typically used
to predict an onset of yielding in homogeneous or isotropic ductile metals [Dieter, 1976;
Dowling, 1993). Brazed joints, however, are quite far from isotropic. Physical and
mechanical properties within the brazed joins undergo significant changes over very
short distances as we transverse the brazed joint form one adjacent side of the base
metal into another. Situation becomes even more complicated when drastically
dissimilar materials form a brazed joint. Furthermore, a concept of brazed joint yielding
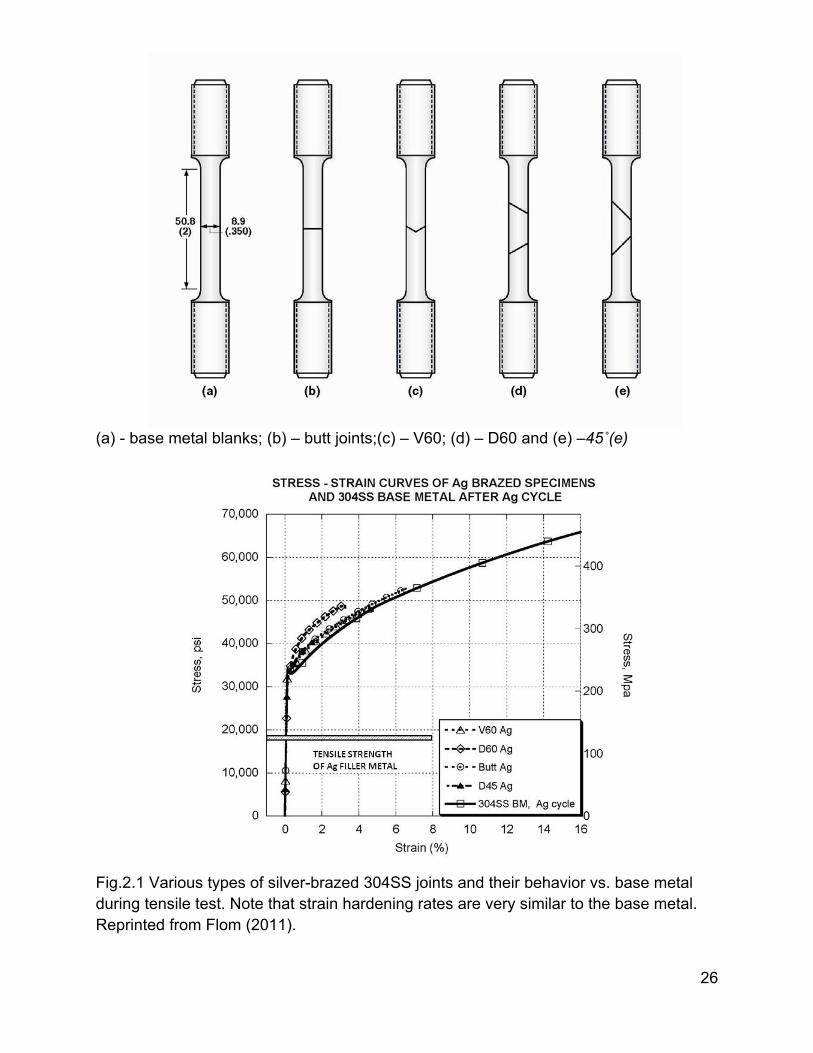
is not well defined. Tensile tests of the butt brazed specimens as well as the lap shear
pull tests show practically no difference in stress – strain behavior between the brazed
and solid specimens up to the point of failure of the brazed joints (Flom, 2011; Spingarn
et al, 1983; Flom et al, 2004), as shown in Fig.2.1-2.3.
Recall that successful failure criteria should be applicable to any brazed joint geometry.
When a butt brazed joint is tested in uniaxial tension, a mechanical constraint provided
by the base metal develops a triaxial tensile stress state within the braze layer. Even in
such ductile filler metal as pure silver a level of constraint is so high that hydrostatic
stress is very close to the axial one, which means that the values of principal stresses
are very similar (Rosen et al, 1993). In pure hydrostatic stress state (all principal stress
are equal), shear and von Mises stresses are zero and failure occurs without plastic

8
deformation. Similarly, in butt brazed joint under uniaxial tension, shear or von Mises
stresses are quite low. Consequently, these stresses would not be good criteria in
brazed joints with high mechanical constraint and would result in under-prediction of
failure.
Let’s consider lap shear brazed joints in which both base and filler metals are ductile. It
would appear that shear or distortion energy criteria would be much better suited for this
type of joints, which are typically undergoing large plastic deformation prior to failure.
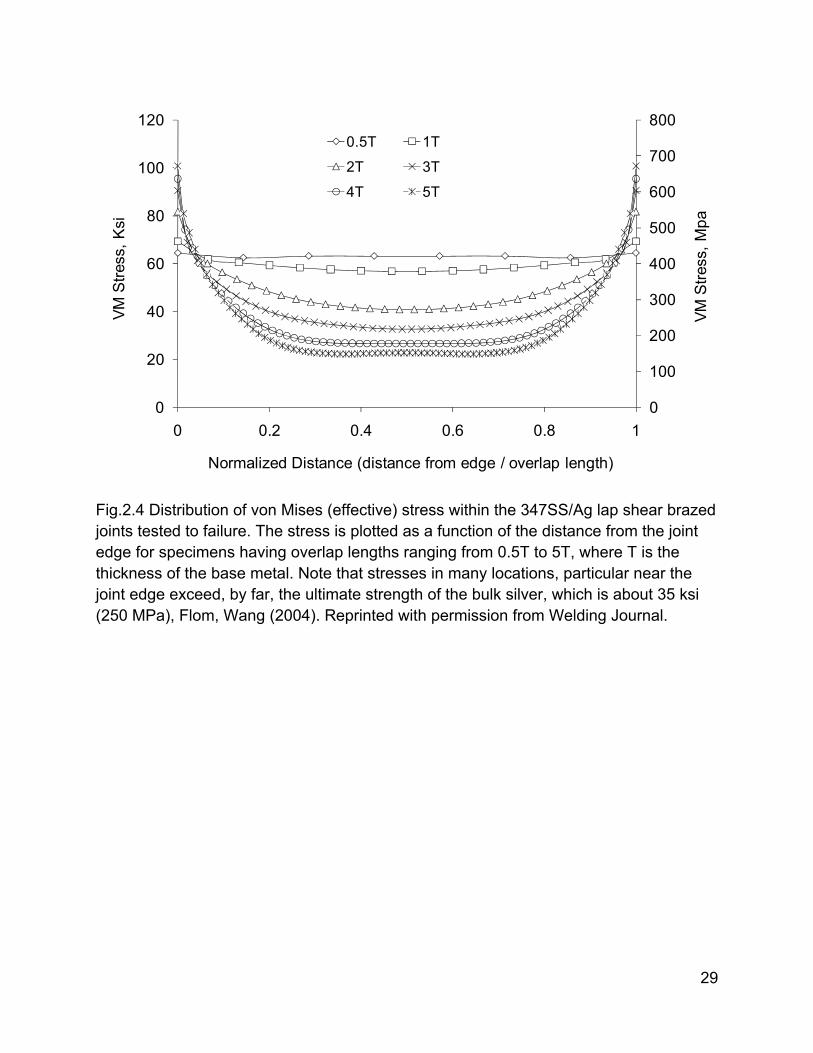
However, due to non-uniform distribution of shear stresses within the lap shear joints,
the values of the shear and von Mises stresses could be quite high, particular at the
joint ends (Flom et al, 2004), as shown in Fig.2.4. Experimental results indicate that
such values could exceed the strength of the filler metal by 2 or 3 times. If one attempts
to correlate the highest von Mises stress values with the event of failure in lap shear
joints, such values are going to be much greater than those observed in butt-brazed
specimens, as shown in Fig.2.5. Consequently, von Mises stress is not a very good
choice for failure criterion due to its great variation with brazed joint geometry. In
addition, a major difficulty in estimating von Mises stress in the brazed joint is a reliance
on our knowledge of the elastic modulus and the yield strength properties of the braze
layer within the brazed joint. Without such knowledge, the use of Finite Element
Analysis (FEA) in calculating von Mises stress within the filer metal layer is very limited,
if not impossible.
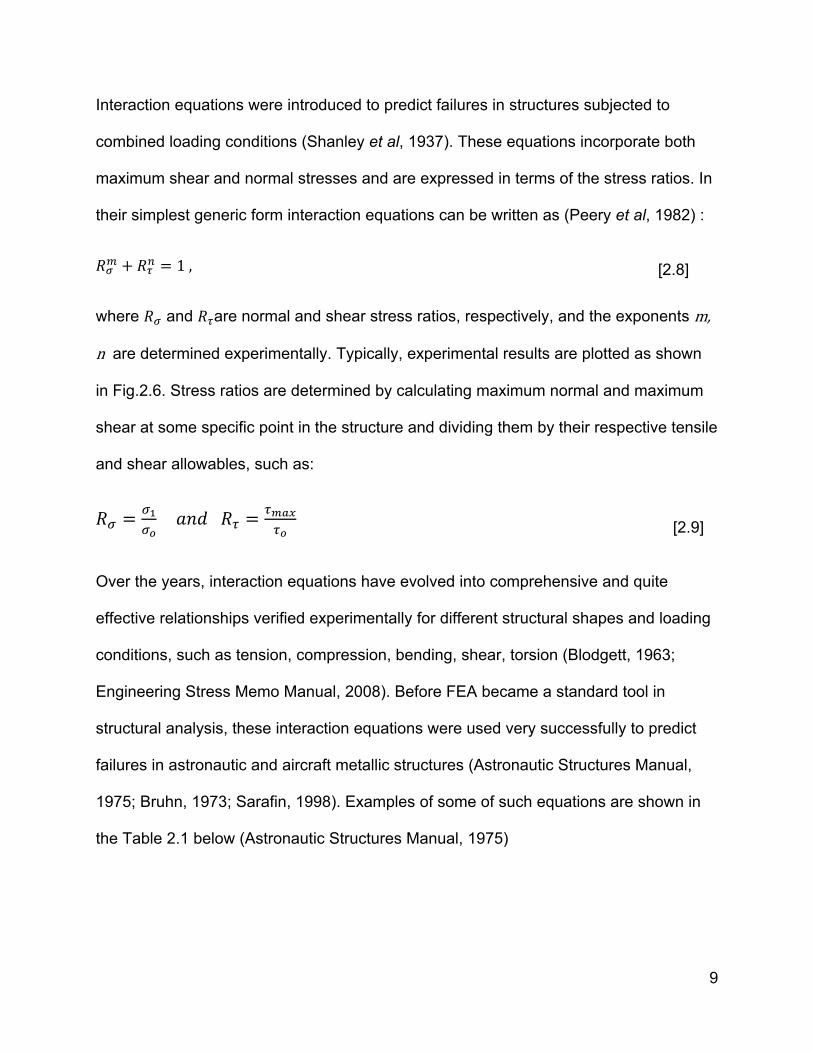
2.2.3 Interaction Equations
9
[2.8]
Interaction equations were introduced to predict failures in structures subjected to
combined loading conditions (Shanley et al, 1937). These equations incorporate both
maximum shear and normal stresses and are expressed in terms of the stress ratios. In
their simplest generic form interaction equations can be written as (Peery et al, 1982) :
1 ,
where and are normal and shear stress ratios, respectively, and the exponents m,
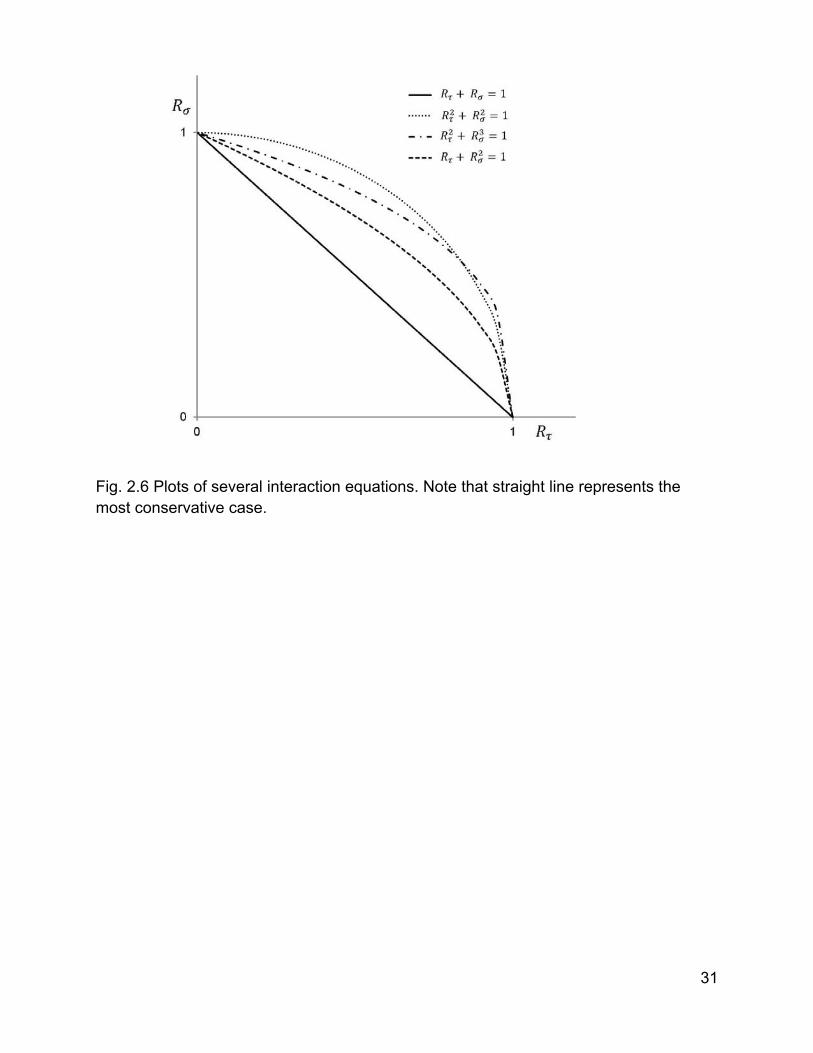
n are determined experimentally. Typically, experimental results are plotted as shown
in Fig.2.6. Stress ratios are determined by calculating maximum normal and maximum
shear at some specific point in the structure and dividing them by their respective tensile
and shear allowables, such as:
Over the years, interaction equations have evolved into comprehensive and quite
effective relationships verified experimentally for different structural shapes and loading
conditions, such as tension, compression, bending, shear, torsion (Blodgett, 1963;
Engineering Stress Memo Manual, 2008). Before FEA became a standard tool in
structural analysis, these interaction equations were used very successfully to predict
failures in astronautic and aircraft metallic structures (Astronautic Structures Manual,
1975; Bruhn, 1973; Sarafin, 1998). Examples of some of such equations are shown in
the Table 2.1 below (Astronautic Structures Manual, 1975)
[2.9]
10
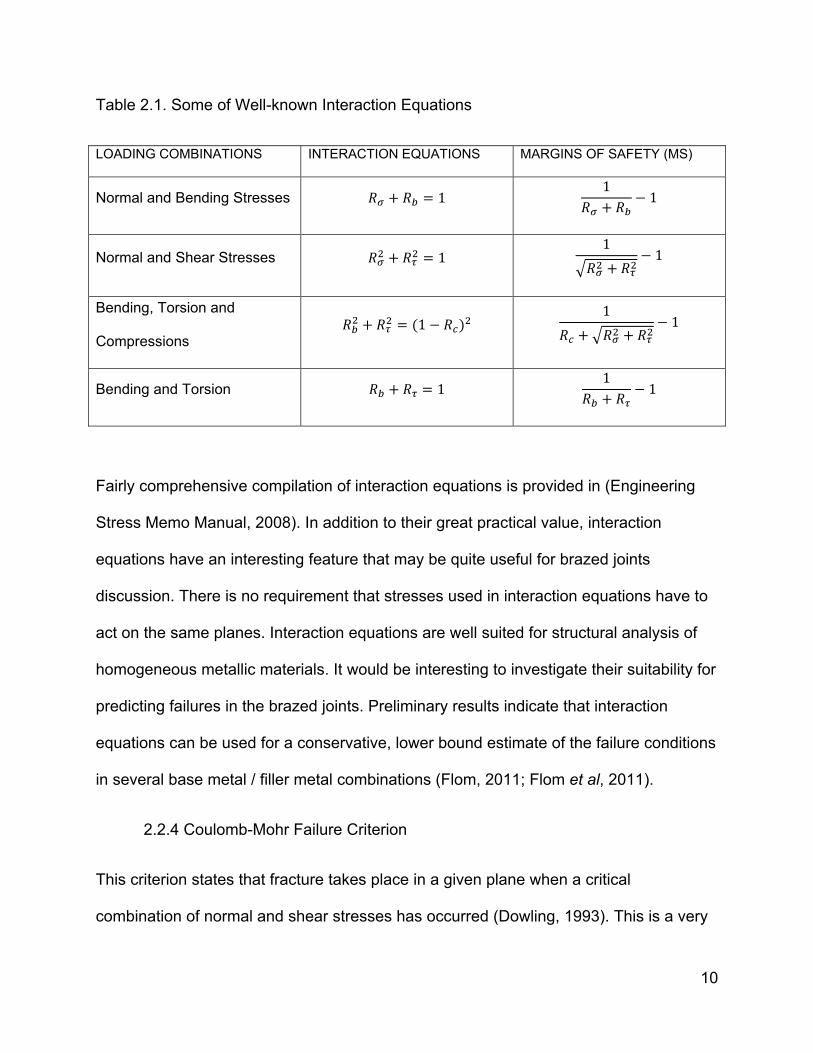
Table 2.1. Some of Well-known Interaction Equations
LOADING COMBINATIONS INTERACTION EQUATIONS MARGINS OF SAFETY (MS)
Normal and Bending Stresses 1 1
1
Normal and Shear Stresses 1 1
1
Bending, Torsion and
Compressions 1
11
Bending and Torsion 1 1
1
Fairly comprehensive compilation of interaction equations is provided in (Engineering
Stress Memo Manual, 2008). In addition to their great practical value, interaction
equations have an interesting feature that may be quite useful for brazed joints
discussion. There is no requirement that stresses used in interaction equations have to
act on the same planes. Interaction equations are well suited for structural analysis of
homogeneous metallic materials. It would be interesting to investigate their suitability for
predicting failures in the brazed joints. Preliminary results indicate that interaction
equations can be used for a conservative, lower bound estimate of the failure conditions
in several base metal / filler metal combinations (Flom, 2011; Flom et al, 2011).
2.2.4 Coulomb-Mohr Failure Criterion
This criterion states that fracture takes place in a given plane when a critical
combination of normal and shear stresses has occurred (Dowling, 1993). This is a very

11
interesting criterion and definitely worth considering when discussing the brazed joints
that fail within the braze plane. Coulomb-Mohr criterion has a very simple form that
assumes a linear relationship between normal and shear stresses:
In this expression, µ and c are material-specific parameters. Later in this chapter we will
spend more time discussing this criterion. A modified form of the Coulomb-Mohr
criterion, proposed by Christensen (2004), shows better correlation with experimental
results for homogeneous materials. It offers a more general form of failure condition and
considers a combined effect of hydrostatic (dilatation) and distortion (von Mises)
components of stress. However, its practical use in analysis of the brazed joints is
rather limited, since it requires a detailed FEA analysis of the brazed joints which, in
turn, relies on the knowledge of mechanical properties of the braze layer.
2.2.5 Fitness-For-Service (FFS) Approach
This approach was first introduced in welding industry and now is widely accepted in
analysis of the critical welded structures containing discontinuities (Dowling et al, 1975;
Webster et al, 2000; Gordon, 1993; API, 2007). The brand new or existing welded
structure is evaluated on the basis whether it can safely operate under given loading
and environmental conditions. Using a certain amount of mechanical testing and
analytical techniques, a safe-to-operate zone is established for a particular weldment
containing flaws. Failure Assessment Diagrams (FAD) are constructed to define such
safe zones. In order to construct FADs, welding industry has adopted a specific failure
criterion based on static strength and fracture mechanics characteristics of the weld
[2.9]
12
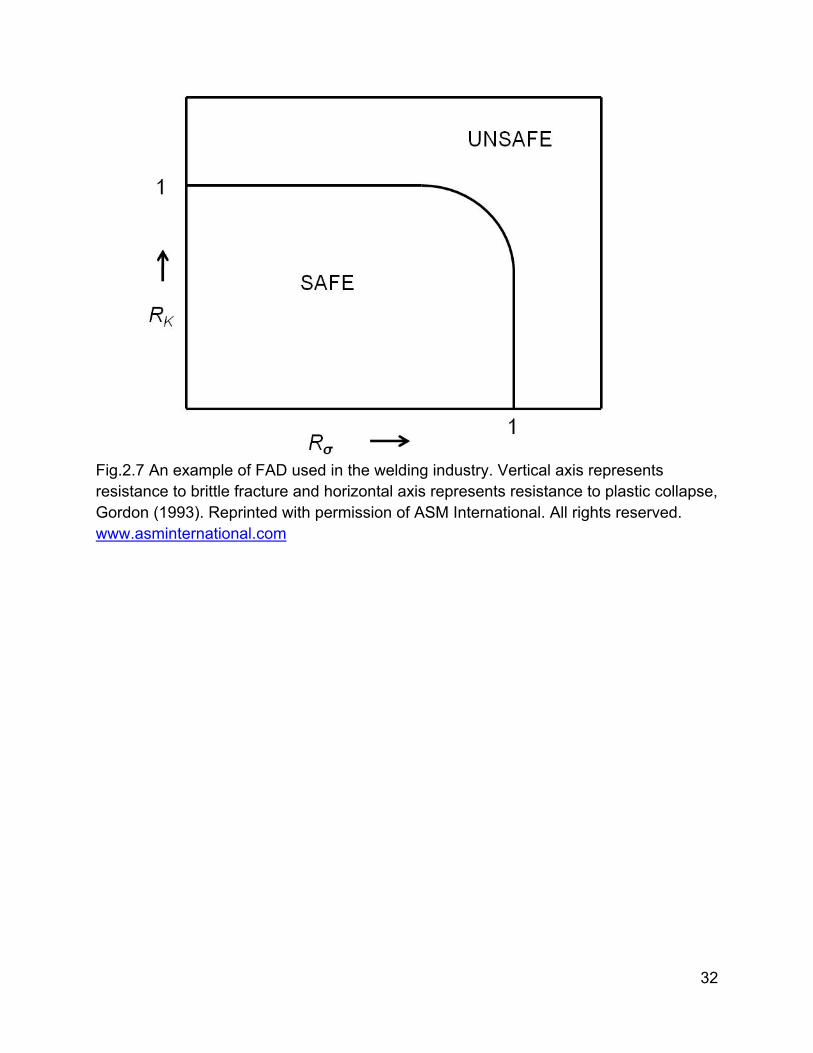
joint containing flaws. An example of such FAD with respect to the weld joint is shown in
Fig.2.7.
FADs are plotted in terms of the fracture toughness and plastic collapse stress ratios
(Gordon, 1993). The vertical axis represents ratios of RK = K1/Kmat and horizontal axis
represents ratios of Rσ = σ/σpc, where K1 is the stress intensity at existing flaw due to
applied load, Kmat is a fracture toughness of the material, σ is applied stress and σpc is
a plastic collapse stress for a given welded component. An attempt to apply this fracture
toughness and plastic collapse - based FAD to the brazed joints is described by
Leinenbach et al (2007).
There are several problems of using fracture toughness - and plastic collapse stress –
based criterion for predicting failures in the brazed joints. First, a concept of brazed joint
fracture toughness is not well defined. It is not clear what fracture toughness of the
material means in case of the brazed joint consisting of the two adjoining base metals
(similar or dissimilar) and a thin layer of the filler metal, metallurgically different from the
base metals. Consider the following argument. Recall, that for a crack to grow, energy
available for crack extension should exceed the crack resistance which is the energy
requires to create new crack surfaces. Each material has its own surface energy – it is a
physical property. If crack is propagated through the filler metal, the energy to create
new crack surfaces is different, than the energy required for creation of new crack
surfaces in the base metal. If a crack chooses to propagate through the base metal/filler
metal interface, the surface energy again will be different. And, finally if the crack
meanders through the base, filler and interface regions of the brazed joint, than the
13
energy of newly created surfaces will be even harder to define. If the fracture toughness
of the brazed joint does not have a well established definition, measurements of the
brazed joint fracture toughness is even less clear, particular when it comes to a
discussion of validity of the of the fracture toughness testing. Similar problems arise
when attempting to define and/or measure plastic collapse stress of the brazed joints.
One can see now how problematic, particular from the practical sense, it would be to try
to incorporate fracture toughness and plastic collapse stress into failure criteria of the
brazed joints.
2.3 Alternative Approach for Developing Brazed Joints FADs
Let’s consider Coulomb-Mohr criterion and see if it can be used to predict failures in the
brazed joints while satisfying as many conditions listed in the introduction as possible.
To begin, we are going to treat the brazed joint as a system, rather than trying to study
separate regions of the joint which are influenced by complex metallurgical reactions of
the brazing process and, as a consequence, having significantly different materials
properties. The latter had been more of a traditional approach taken by many
investigators attempting to study mechanical properties of the brazed joints [Flom et al,
2004; Rosen et al, 1980; Tolle et al, 1995; Wen-Chun Jiang et al, 2008). As it was
briefly mentioned earlier in this chapter, mechanical properties of the braze layer are not
readily available or can be determined through conventional methods. An evaluation of
mechanical properties of brazes is a rather challenging endeavor. A very thin cast layer
of filler metal consists most often of multiple phases and is affected by the braze gap
size, dilution from the base metal as well as by possible formation of intermetallic
compounds located at the filler metal / base metal interfaces. Even the properties of a
14
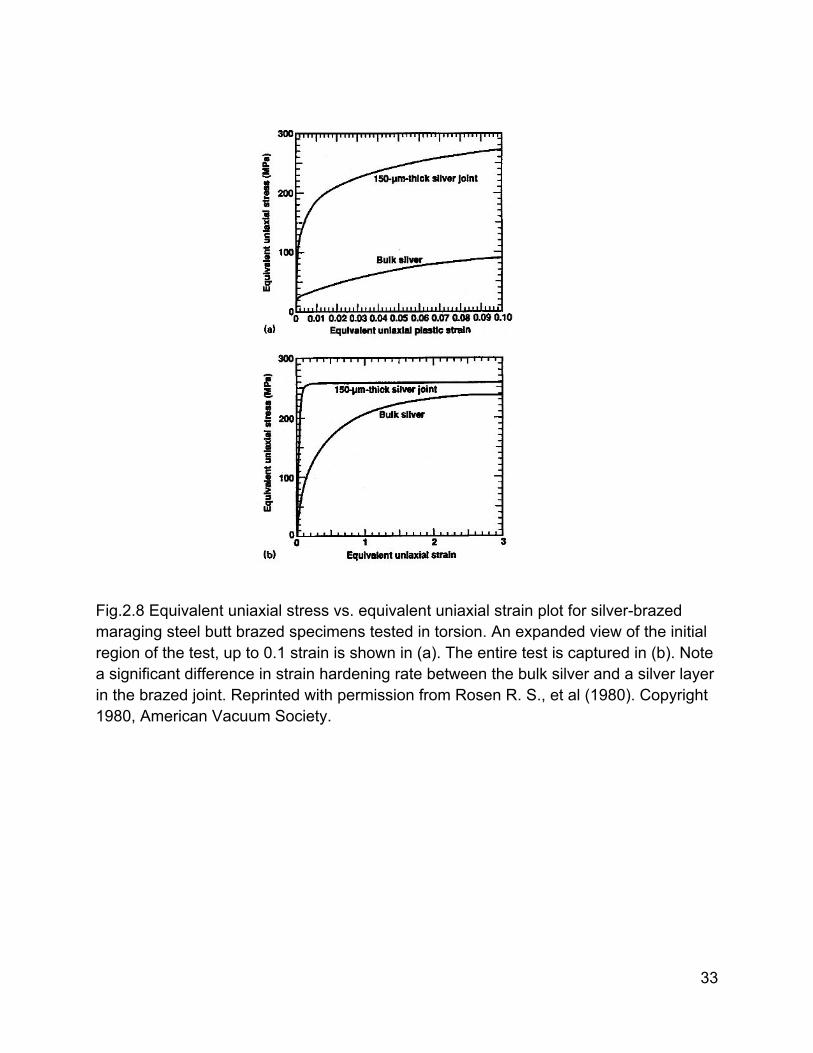
braze layer consisting of a single phase pure metal may be significantly different from
mechanical properties of identical wrought pure metal tested in the bulk form (Rosen,
1980), as shown, for example, in Figure 2.8. A presence of additional phases and
eutectics makes the situation even worse. For example, it is a well know fact that joints
brazed with Ni-based filler metals, such as AWS BNi2, could develop a variety of
microstructures and properties depending on joint geometry and the brazing cycle
(Brazing Handbook, 2005; Lugscheider et al, 1983). Consequently, trying to predict
mechanical properties of the braze layer either by testing some bulk form of the filler
metal or using some software specialized in calculating of the material properties of a
given alloy (Wen-Chun Jiang et al, 2008), may produce unreliable results. Other
attempts to measure properties of the braze layer were based on testing miniature test
specimens containing braze (Leinenbach et al, 2007). This approach may also present
some problems since the aspect ratios of such brazed joints are significantly higher than
the typical structural joints. Typical ratios of the brazed gaps to the joint size (diameter
or width) are less than 0.005. Thus, the level of constrain within the braze layer and
triaxiality of the stress state is very different from the actual brazed joints, which, in turn
may result in unrealistic ductility and stress-strain response of such miniature
specimens.
Consequently, rather than trying to predict the material properties of the braze layer, we
will focus on the properties of the brazed joint as a whole, or a system. Also, this will be
more in line with the FFS approach.
Now, as we ready to apply Coulomb-Mohr criterion to the brazed joints, we can think of
the constants µ and c , see Eq.[2.9], as representing the properties of the system, not

15
the material properties of the braze layer. Since our goal is to develop braze joint failure
criterion applicable to any brazed joint geometries, it is constructive to start with the two
most fundamental ones: a lap and a butt-brazed joints.
When the brazed joint is subjected to a pure shear loading conditions, normal stress
acting on the braze plane is zero. The lap shear brazed joints tested under uniaxial load
do not meet, strictly speaking, the conditions of pure shear. Consequently, the results
are reported in terms of an average shear stress. In this case, a non-uniform distribution
of shear stresses within the lap and the peel effects at the joint ends are ignored (AWS
C3.2, 2008). Therefore, from a practical sense, the presence of normal stresses in
standard lap shear test specimen is also ignored. If we let σ = 0, the Coulomb-Mohr
expression for the lap joint can be written as:
Now constant c can be interpreted as simply average shear strength of the lap joint, as
written below:
where o is the shear strength or allowable of the lap shear brazed joint. It is interesting
to note, that for the lap shear brazed joints which represent the most ductile geometric
configuration, eq. [2.11], takes a form of the Tresca criterion discussed in section 2.2.2
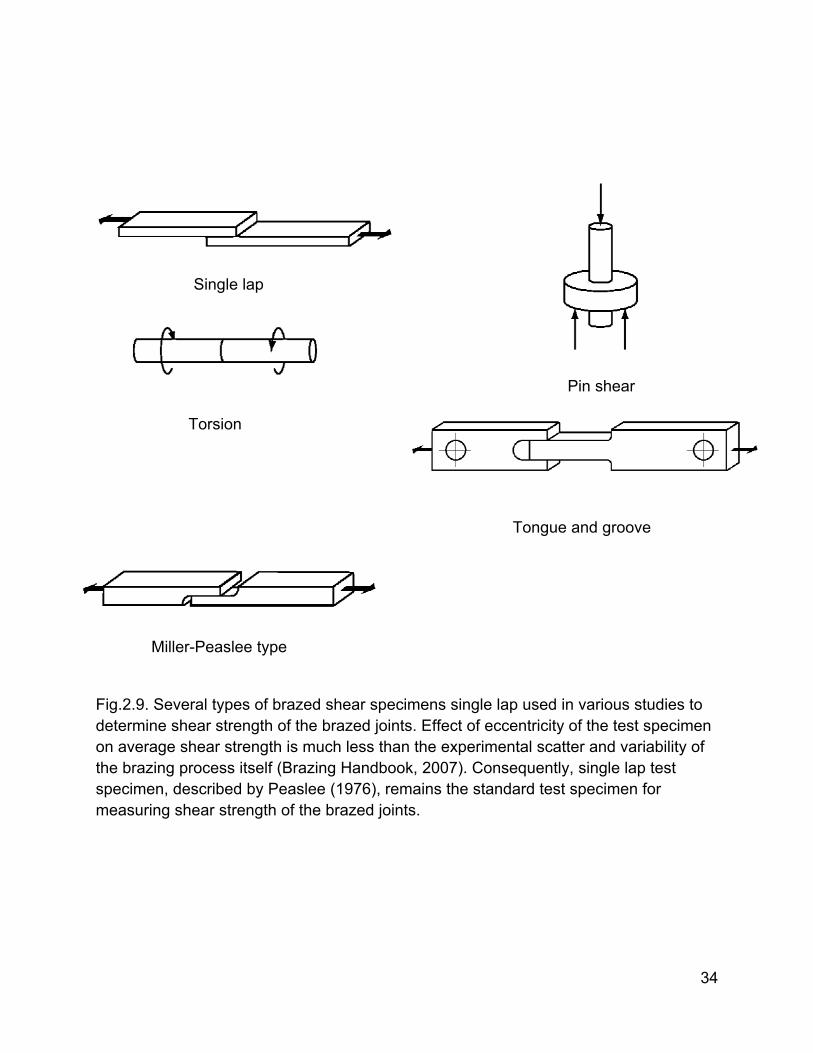
of this chapter. There are various types of lap shear brazed joint used in the brazing
industry to test specimens. Several of them are shown in Fig. 2.9. Some of these joints
may be a little closer to pure shear then the others and the question is which lap shear
[2.10]
[2.11]
16
type is more suitable for measuring shear allowable. A detailed discussion on this
subject is provided by Peaslee, (1976). It turns out that a single leap shear specimen is
quite adequate for measuring average shear strength of the brazed joints and any
attempts to develop braze specimen or test fixtures to eliminate or minimize the peel
effects as well as the bending of the specimen during testing are of little or no
consequence. Apparently, the behavior of the lap shear – type joints is predominantly
controlled by shear which causes extensive plastic deformation and the influence of
normal components of stresses is typically obscured by the experimental scatter when
testing any type of the brazed specimens.
On the other hand, when butt-brazed joint is tested in tension under uniaxial loading
condition, the shear stress within the brazed plane is essentially zero and can be
ignored in the practical sense. Therefore, assuming = 0 and substituting c = o ,
Coulomb-Mohr criterion for the butt-brazed joint can be written as:
μ
When testing standard butt-brazed test specimens to failure, we obtain their ultimate
tensile strength (AWS, 2008) or tensile allowable σo . It is important to keep in mind that
the value of σo is constant for a specific base metal/filler metal combination as long as it
is determined from testing the standard butt-brazed test specimens. This is no different
from testing material properties of any metallic materials. Consequently, butt-brazed or
any other brazed joint in which the braze plane is subjected to predominantly normal
stresses, is going to fail when the maximum normal stress σ = σo . For such condition,
equation (12), can be expressed as:
[2.12]
17
μ
Now we can define constant µ as a ratio of the brazed joint shear and tensile
allowables. It is important to remember that o and σo are not the properties of a specific
material, but the properties of a collection of materials, forming the brazed joints or
systems subjected to their two most extreme conditions: 1) butt-brazed joint under
uniaxial load which results in the highest degree of constraint and 2) the lap-shear joint
also subjected to uniaxial load, which, in turn, results in the most ductile behavior.
Substituting µ and c in equation [2.13] and dividing by o, Coulomb-Mohr criterion for
the brazed joints can be written as:
1
As one can see, for the brazed joints dominated by shear stresses, i.e. σ = 0, equation
[2.14] transforms simply into failure criterion of lap shear joint, such as = o; Likewise,
for the brazed joints dominated by normal stresses ( = 0) , such as, for example, butt-
brazed joints, eq. [2.14] becomes simply the failure criterion of the butt-brazed joint
subjected to uniaxial tensile load: σ = σo.
The same equation, using relationships [2.9], can be written in terms of stress ratios
and :
1
As one can see, eq. [2.15] is identical to interaction equation [2.8] when exponents m
and n equal to 1. Another words, equation [2.15] represents perhaps one of the most
[2.13]
[2.14]
[2.15]
18
conservative forms of interaction equations. Graphically, this expression can be plotted
as a straight line shown in Fig. 2.6.
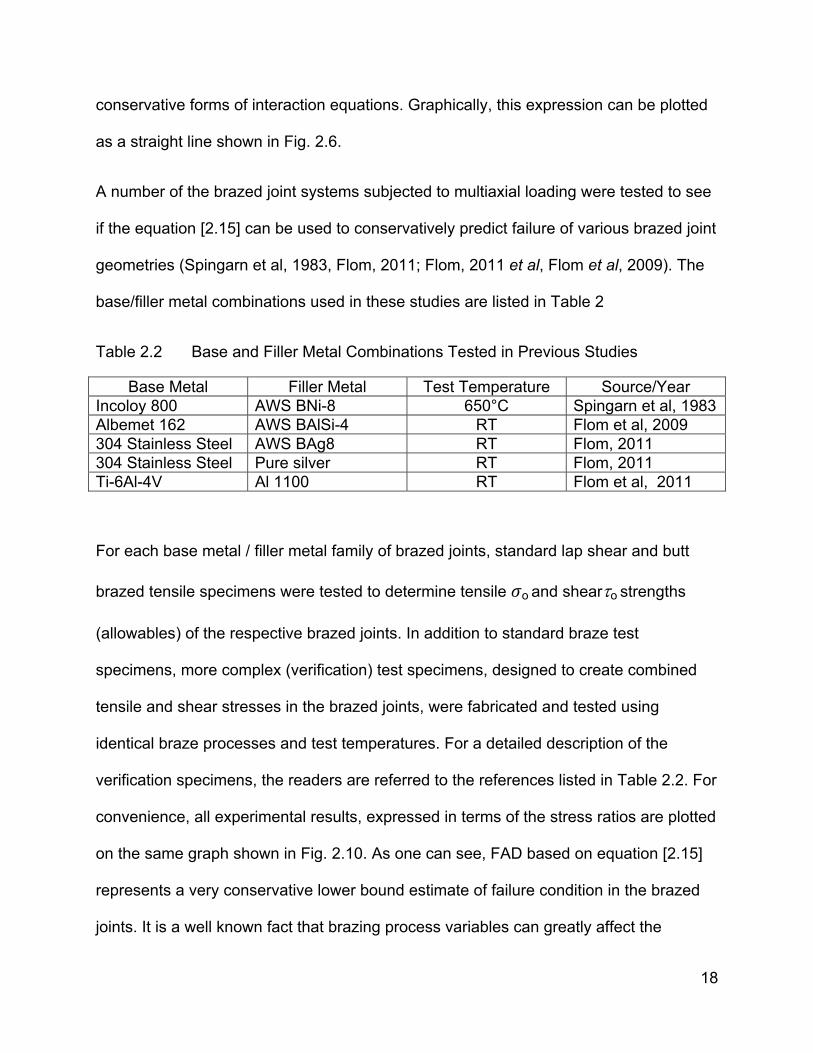
A number of the brazed joint systems subjected to multiaxial loading were tested to see
if the equation [2.15] can be used to conservatively predict failure of various brazed joint
geometries (Spingarn et al, 1983, Flom, 2011; Flom, 2011 et al, Flom et al, 2009). The
base/filler metal combinations used in these studies are listed in Table 2
Table 2.2 Base and Filler Metal Combinations Tested in Previous Studies
Base Metal Filler Metal Test Temperature Source/Year Incoloy 800 AWS BNi-8 650°C Spingarn et al, 1983 Albemet 162 AWS BAlSi-4 RT Flom et al, 2009 304 Stainless Steel AWS BAg8 RT Flom, 2011 304 Stainless Steel Pure silver RT Flom, 2011 Ti-6Al-4V Al 1100 RT Flom et al, 2011
For each base metal / filler metal family of brazed joints, standard lap shear and butt
brazed tensile specimens were tested to determine tensile o and shearo strengths
(allowables) of the respective brazed joints. In addition to standard braze test
specimens, more complex (verification) test specimens, designed to create combined
tensile and shear stresses in the brazed joints, were fabricated and tested using
identical braze processes and test temperatures. For a detailed description of the
verification specimens, the readers are referred to the references listed in Table 2.2. For
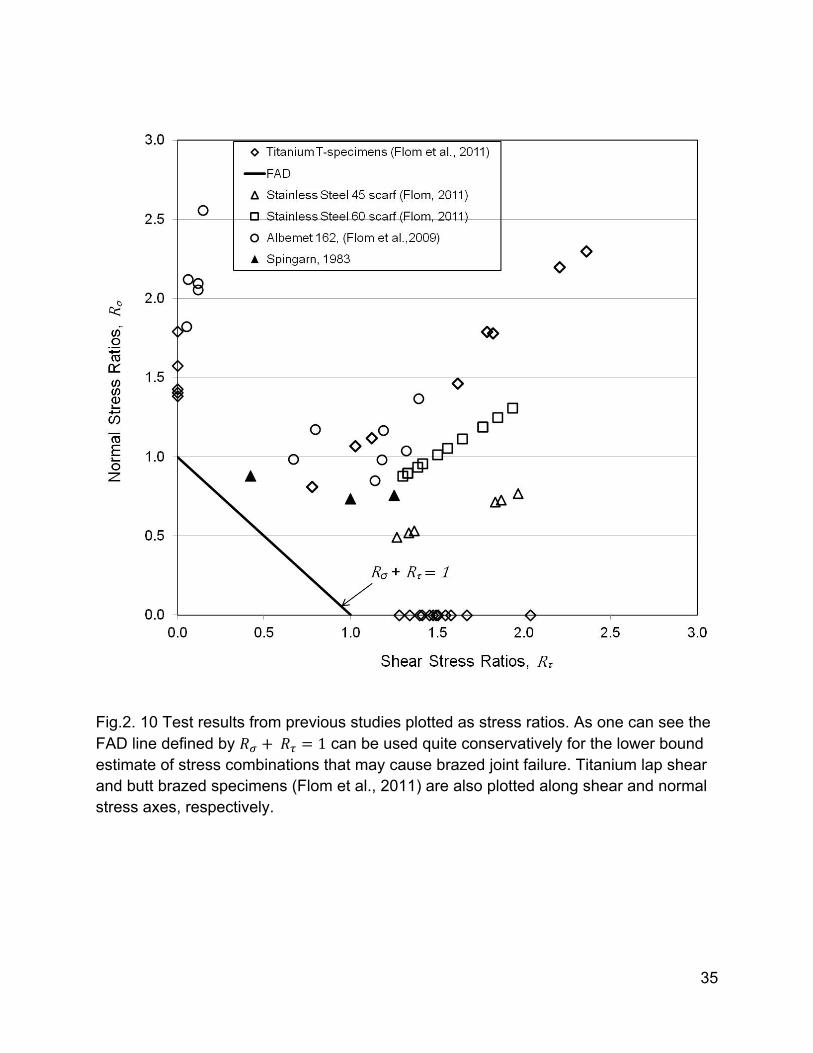
convenience, all experimental results, expressed in terms of the stress ratios are plotted
on the same graph shown in Fig. 2.10. As one can see, FAD based on equation [2.15]
represents a very conservative lower bound estimate of failure condition in the brazed
joints. It is a well known fact that brazing process variables can greatly affect the
19
strength of the brazed joints (Brazing Handbook, 2007). Our ability to account for all
process variables and their influence on properties of the brazed joints is rather limited
and accompanied with considerable uncertainty. Therefore, in an attempt to address
such uncertainties and increase the level of conservatism, the following procedure was
used for data analysis and graphing the plots shown in Fig.2.10:
First, using global model FEA of the brazed specimens, maximum normal and
maximum shear stresses were calculated in the finite elements located in the
brazed plane of the brazed joints. Maximum normal and maximum shear
stresses were all acted on the braze plane.
Second, it was assumed that maximum normal and maximum shear stresses
were located in the same finite element within the braze plane even though their
actual locations could be different.
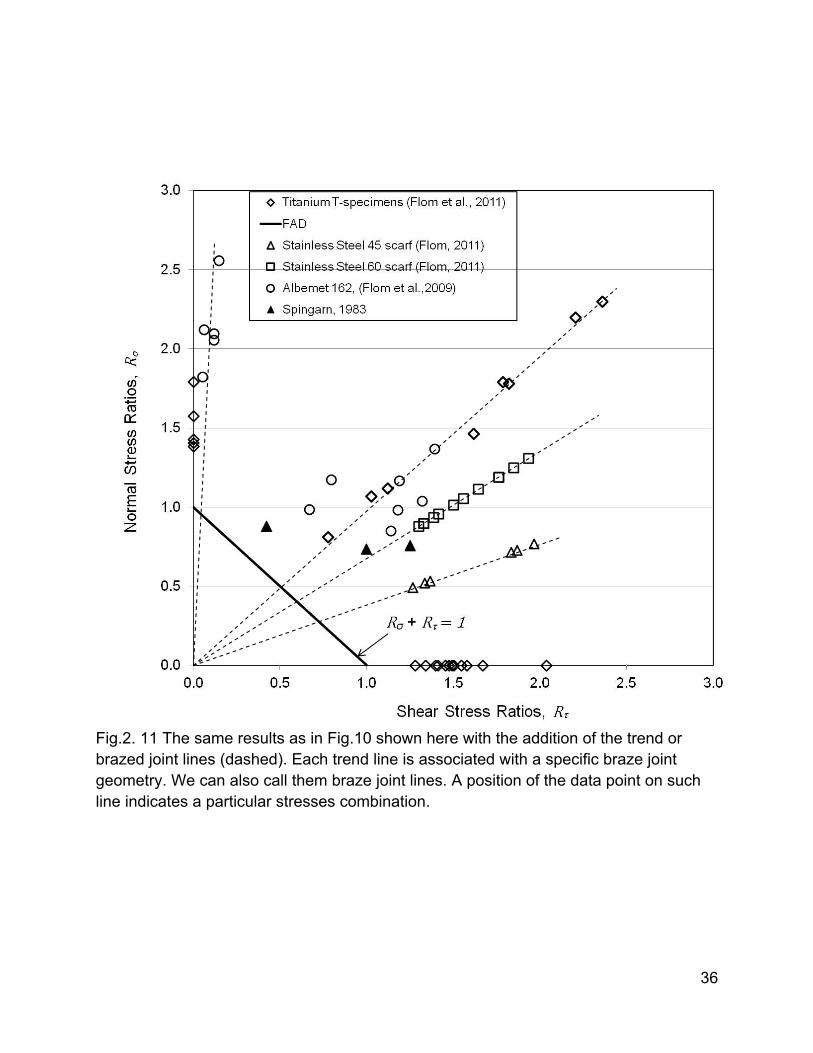
Two interesting observations can be made when examining experimental results plotted
in Fig. 2.10. One is that all data points representing specific joint geometries are aligned
along the same trend lines, as emphasized in Fig. 2.11. The second observation is that
the stress ratios representing failure of the brazed joints fall on the same trend lines
regardless of what combination of base and/or filler metal are used to fabricate brazed
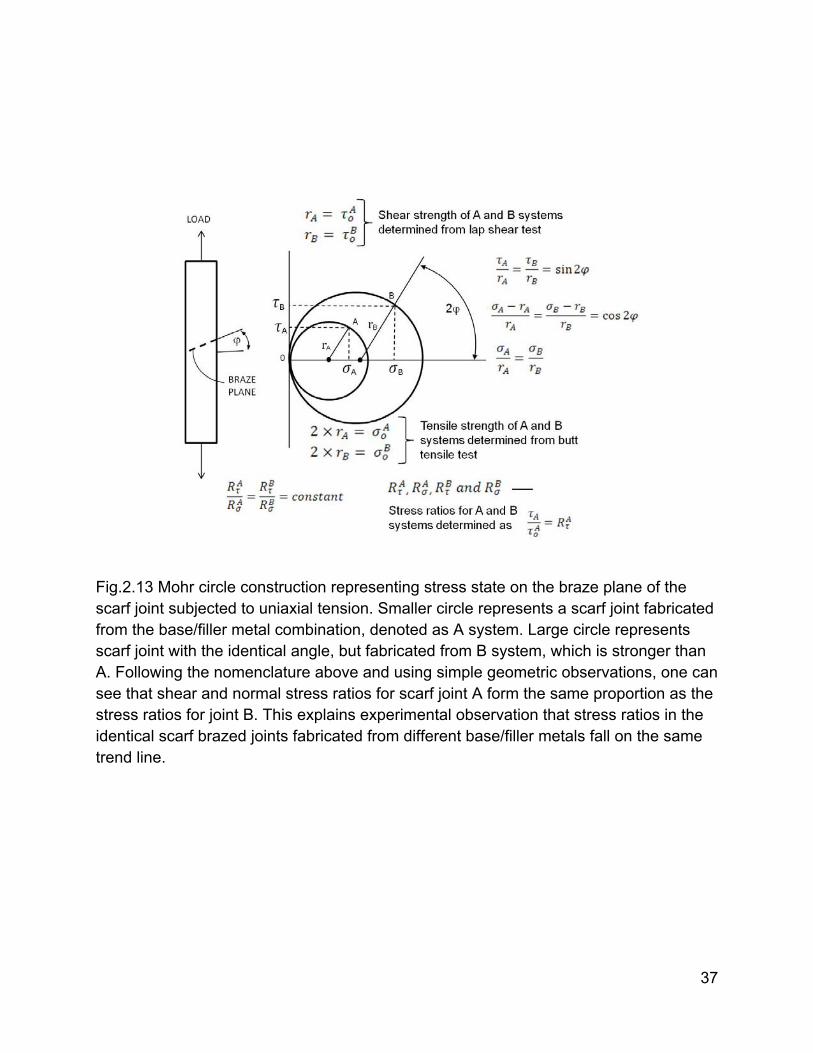
joints, or even their test temperature. These observations can be explained with the
help of the Mohr circles construction using scarf joints, as an example, as shown in Fig.
2.12. However, this explanation is not sufficient to rationalize behavior of the T-type
titanium specimens also showing similar trend, see Figs.2.10 and 2.11. As of the time of
this writing, no rigorous explanation of the observed trend line for T-specimens have
been developed. A well-pronounced data dispersion or scatter observed on the graphs,
20
is, most likely, related to the inherent scatter in test results associated with testing of the
brazed specimens, even the standard ones (AWS, 1963). For example, the results for
lap shear and butt-brazed specimens, presented in Fig. 2.10 as the data points located
along each axis, also show considerable scatter. The scatter is most likely a result of
the variability in internal quality of the brazed joints. Consequently, due to propagation
of scatter or error, it is quite reasonable to expect even larger scatter in testing more
complicated brazed specimens. The observed trend lines could provide an important
tool useful during preliminary design of the brazed structures. It can help in estimating
brazed joints margins of safety and predicting their failures. An example of using such
tool will be given later in this chapter.
These findings lead to the following simple engineering methodology of developing and
using Coulomb-Mohr – based FADs:
1. determine tensile and shear allowables by testing standard brazed test
specimens (AWS, 2008) and construct FAD line;
2. using FEA determine maximum normal and max shear stresses acting on the
braze plane in the actual structural brazed joint subjected to a small arbitrary
load. This load should act on the joint in the same manner as the design load.
These stresses will define the coordinates of the point needed to construct
the trend line.
3. connect the origin with the point determined in 2) and construct a trend or as
we call it braze joint line (see Fig.2.13);
4. an intercept of FAD line and the braze joint line corresponds to a zero safety
margin condition or a very conservative, lower bound failure condition.
21
5. fabricate a small number (two or three) of identical or “realistic” specimens
representing actual brazed joint geometry and test them to failure under
identical loading conditions. This step will help to determine the actual values
of maximum normal and maximum shear stresses causing failure.
Combination of these failure stresses will define the failure point that can be
plotted to validate the brazed joint line. If the actual level of stresses causing
failure is of no consequence, this step can be omitted
Now we can demonstrate how beneficial the brazed joint lines can be in designing
brazed assembly. Suppose such structure is to be fabricated from an expensive and
difficult to work with material, such as beryllium, for example. Unless one can find a
reliable source for tensile and shear allowables that have already been established, it
would be necessary to test certain number of standard lap shear and butt brazed
specimens. Depending how rigorous and conservative the requirements are, it would be
up to the program to determine the quantity of test specimens so for instance either A-
basis or B-basis (MMPDS-05, 2010) allowables could be established. The more critical
the requirements are, the smaller the zone representing safe combinations of stresses
(safe zone) is, as shown in Fig. 2.14. It is very important to mention that the standard
brazed test specimens should be manufactured using the same brazing procedure and
by the same vendor selected for brazing of the actual brazed structure. When step 1 of
the procedure outlined above is completed and FAD line is constructed, the designer
needs to define the brazed joint line or trend line specific to the joint geometry
considered for the brazed structure. In order to do define the trend line, all one needs to
22
do is to perform simplified FEA analysis of the imaginary brazed joint fabricated from
any well characterized, more conventional base metal/filler metal combination. For
example titanium base metal brazed with 1100 Al alloy filler metal. Assuming that our
observations of the brazed joints trend lines (see Figs. 2.10 and 2.11) hold true and are
validated in future studies, a ratio of maximum normal and maximum shear stresses
should define the point to construct the brazed joint line, as described in Steps 2 and 3.
After that, margins of safety (MS) can be estimated as (see Fig. 2.14):
(OB/OA) – 1
This geometric procedure, when expressed mathematically, takes form of:
Equation [2.17] is identical to some of the equations listed in the last column in Table
2.1. By changing the brazed joint geometry and/or design (for example changing the
angle in the scarf joint), one can actually see how such change affects MS of the brazed
joint. Then, the brazed joint design can be modified to achieve the desired MS.
Obviously, more base metal/filler metal combinations need to be tested before this
simple engineering procedure can be accepted in the brazing industry. It is our opinion,
however, that the preliminary results described in this chapter are very encouraging and
may generate enough interest in the industry to warrant additional studies of other
brazed joint systems.
A word of caution when developing brazed joint shear strength allowables. It is a well
established fact that average shear strength of the brazed lap joints drops as the
overlap length increases (Brazing Handbook, 2007; AWS, 2008). Thus, when testing lap
[2.16]
[2.17]
23
shear specimens having short overlap lengths (less than 2T, where T is the thickness of
the base metal), one may get a rather high values of shear strength. This is a typical
behavior of joints brazed with ductile filler metals. In practice, however, when the lap
shear joint geometry – based structures are fabricated, the practical overlap lengths are
kept at 4T or even higher in order to achieve a full load carrying capability of the brazed
joints. Full load carrying capability or full strength of the brazed joint is considered to be
achieved when the joint strength becomes equal to the strength of the base metal. Such
condition is observed in lap shear joints when their overlap lengths are 4T or greater
(Brazing Handbook, 2005). Therefore, testing specimens with short overlap lengths may
lead to artificially high values of shear strength allowables. Consequently, a series of lap
shear specimens covering a range of overlap lengths, typically between 1T and 5T
should be tested in order to establish the lowest, and not the highest average shear
strength or allowable, as described in AWS C3.2 (2008).
2.4 Conclusions
Construction of FADs based on Coulomb-Mohr failure criterion provides simple
engineering tool for conservative estimate of margins of safety in braze joints;
More work is required to further validate and better understand the trend line
behavior of the brazed joints.

24
The author would like to acknowledge the help of his co-workers at NASA Goddard
Space Center, which are too many to name, in preparation of this manuscript.
References
ASTM (2009) E8/E8M-09, Standard Test methods for Tension Testing of Metallic Materials
Astronautic Structures Manual (1975), NASA TM X-73305, MSFC Vol. 1, pt. 1 AWS (1963), C3.1-63, Establishment of a Standard Test for Brazed Joints, A
Committee Report, American Welding Society (AWS) AWS (2008), C3.2M/C3.2:2008, Standard Method for Evaluating the Strength of
Brazed Joints, American Welding Society (AWS). Blodgett, O. W. (1963), Design of Weldments, The James F. Lincoln Arc Welding
Foundation, Cleveland, Ohio. Brazing Handbook (2007), 5th Ed., American Welding Society Bruhn, E.F(1973), Analysis and Design of Flight Vehicle Structures, Jacobs
Publishing Christensen, R.M (2004), A Two-property Yield, Failure (fracture) Criterion for
Homogeneous, Isotropic Materials, J. Eng. Materials and Technology, Vol.126: 45-52
Dieter, G.E.(1976), Mechanical Metallurgy, 2nd ed., McGraw-Hill Dowling, A.R. and Townley, C.H.(1975), The Effect of Defects on Structural
Failure: A Two-criteria Approach, Int. J. Pres. Ves. & Piping (3), 1975, Applied Science Publishers Ltd, England
Dowling, N.E. (1993), Mechanical Behavior of Materials, Engineering Methods for Deformation, Fracture, and Fatigue, Prentice Hall
Engineering Stress Memo Manual (2008), Lockheed Martin Co. Fitness-for-service Engineering Assessment Procedure (2007), American
Petroleum Institute, API 579-1/ASME FFS-1 Flom, Y., Wang, L. (2004), Flaw Tolerance in Lap Shear Brazed Joints – Part1,
Welding Journal, 83(1), 32-s to 38-s Flom, Y., Wang, L, Powell, M.M., Soffa, M.A. and Rommel, M.L. (2009),
Evaluating Margins of Safety in Brazed Joints, Welding Journal,88 (10),31-37 Flom, Y.(2011), Failure Assessment Diagram for Brazed 304 Stainless Steel
Joints, NASA/TM-2011-215876 Flom, Y, Jones, J.S., Powell, M.M., Puckett, D. F.(2011), Failure Assessment
Diagrams for Titanium Brazed Joints, NASA/TM-2011-215882 Gordon, J.R.(1993), Fitness-for-Service Assessment of Welded Structures, ASM
Handbook, Vol. 6, 10th Ed., pp.1108-1116 Hart-Smith, L.J.(1973), Adhesive-Bonded Double-Lap Joints, NASA CR-112235 Leinenbach, C., Lehmann, H., Schindler, H.J., Dűbendorf, Sshweiz(2007),
Mechanisches Verhalten und Fehlerempfindlichkeit von Hartlötverbindungen, Carl Hanser Verlag, Műnchen, MP Materials Testing, 49

25
Lugscheider, E.F. and Partz, K.D. (1983), High Temperature Brazing of Stainless Steel with Nickel-based Filler Metals, BNi-2, BNi-5 and BNi-7, Welding Journal 62 (6): 160-s to 164-s,
MMPDS-05 (2010), Metallic Materials Properties Development and Standardization (MMPDS), prepared by Battelle Memorial Institute under contract with Federal Aviation Administration
Peaslee, R.L. (1976), The Brazing Test Specimen – Which One?, Welding Journal,55 (10), 850-858
Peery, D.J. and Azar J.J., (1982), Aircraft Structures, 2nd Ed., McGraw-Hill Rosen, R.S., Kassner, M.E., (1993), Mechanical Properties of Soft-Interlayer
Solid State Welds, ASM Handbook, 10th Ed, Vol. 6, pp.165-172 Rosen, R.S., Kassner, M.E., (1990), Diffusion Welding of Silver Interlayers
Coated onto Base Metals by Planar-magnetron Sputtering, J. Vac. Sci. Technol. A 8(1)
Sarafin, T.P.,(1998) Spacecraft Structures and Mechanisms, From Concept to Launch, Kluwer Academic Publishers.
Shanley, F.R. and Ryder, E.I.,(1937), Stress Ratios, Aviat. Mag., June, 1937 Spingarn, J.R., Kawahara, W.A., and Napolitano, L.M. Jr.,(1983), Shear Strength
of a Nickel-Based Brazement at 923 K, Sandia Report SAND82-8037 Tolle, M.C., Kassner, M.E., Cerri, E, Rosen, R.S.,(1995), Mechanical Behavior
and Microstructure of Au-Ni Brazes, Metallurgical and Materials Transactions A, Vol.26A, 941-948
Tong, L., Steven, G.P. (1999), Analysis and Design of Structural Bonded Joints, Kluwer Academic Publishers
Webster, S., Bannister, A., (2000), Structural Integrity Assessment Procedure for Europe-of the SINTAP Programme Overview, Engineering Fracture Mechanics 67, 481-514, Elsevier Science Ltd.
Wen-Chun Jiang, Jian-Ming Gong, Hu Chen, S.T. Tu,(2008), Finite Element Analysis of the Effect of Brazed Residual Stress on Creep for Stainless Steel Plate-Fin Structure, ASME, Journal of Pressure Vessel Technology, Vol.130.
26
(a) - base metal blanks; (b) – butt joints;(c) – V60; (d) – D60 and (e) –45˚(e)
Fig.2.1 Various types of silver-brazed 304SS joints and their behavior vs. base metal during tensile test. Note that strain hardening rates are very similar to the base metal. Reprinted from Flom (2011).
27
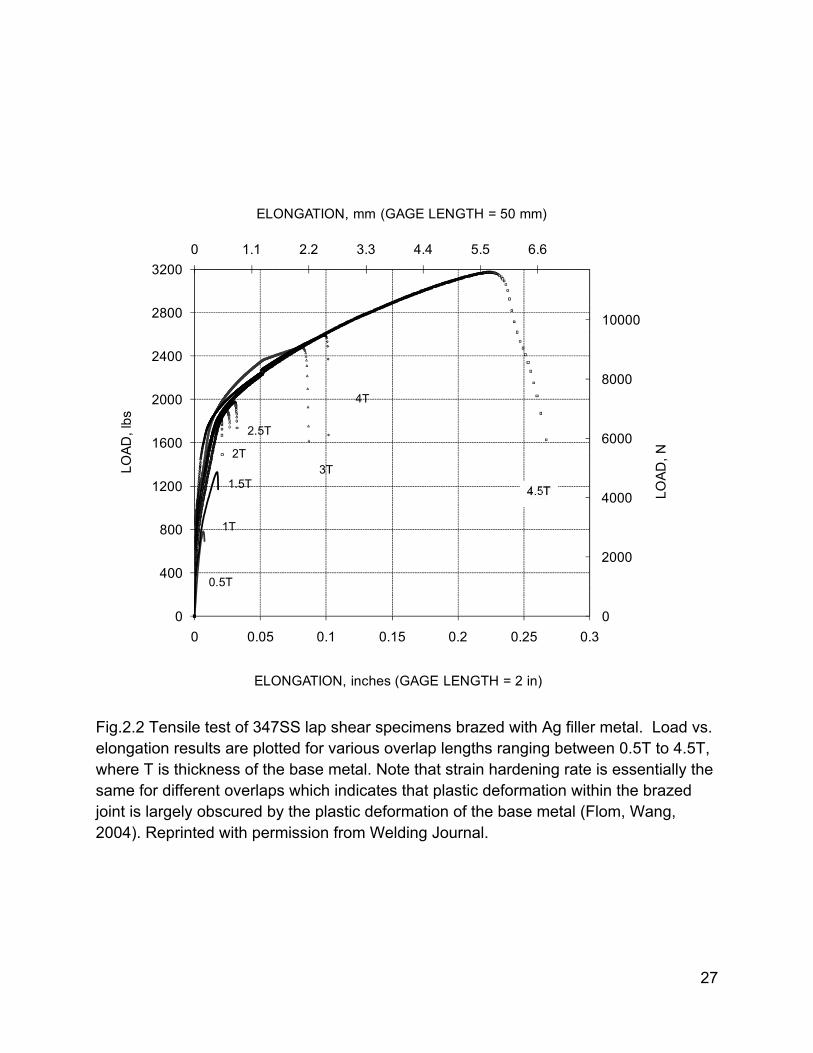
Fig.2.2 Tensile test of 347SS lap shear specimens brazed with Ag filler metal. Load vs. elongation results are plotted for various overlap lengths ranging between 0.5T to 4.5T, where T is thickness of the base metal. Note that strain hardening rate is essentially the same for different overlaps which indicates that plastic deformation within the brazed joint is largely obscured by the plastic deformation of the base metal (Flom, Wang, 2004). Reprinted with permission from Welding Journal.
0
2000
4000
6000
8000
10000
0 1.1 2.2 3.3 4.4 5.5 6.6
0
400
800
1200
1600
2000
2400
2800
3200
0 0.05 0.1 0.15 0.2 0.25 0.3
LO
AD
, N
ELONGATION, mm (GAGE LENGTH = 50 mm)
LO
AD
, lb
s
ELONGATION, inches (GAGE LENGTH = 2 in)
2.5T
3T
4T
1T
1.5T
2T
0.5T
28
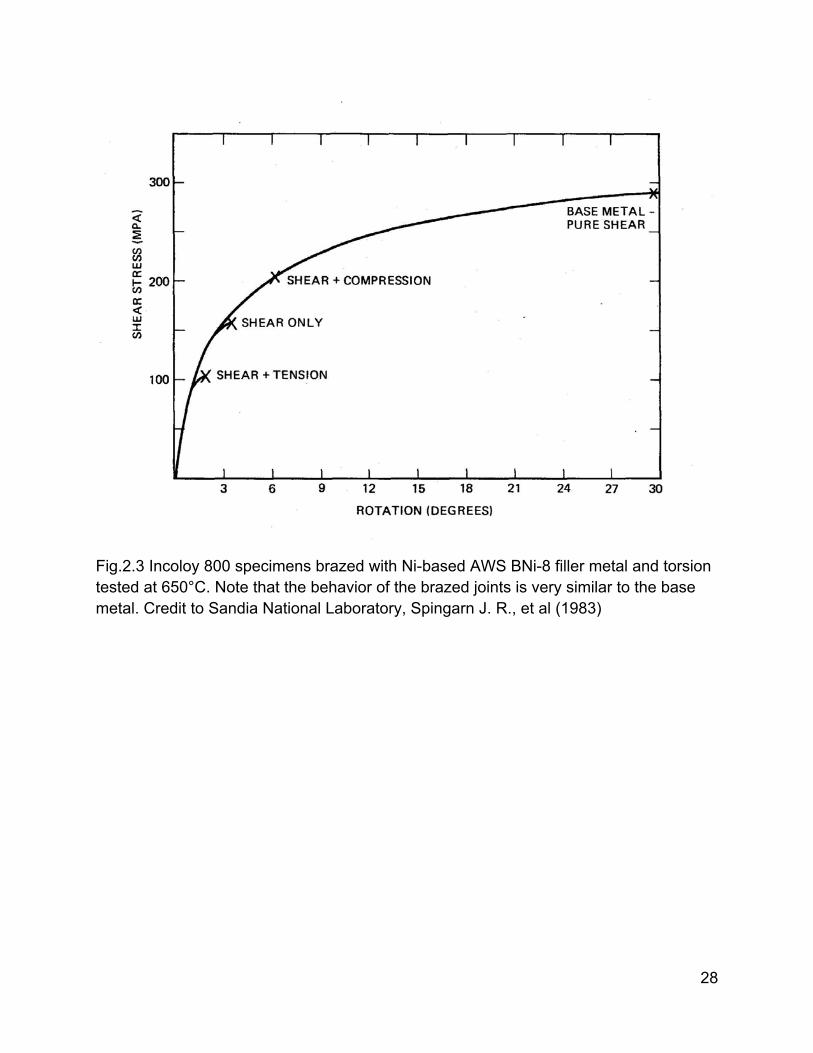
Fig.2.3 Incoloy 800 specimens brazed with Ni-based AWS BNi-8 filler metal and torsion tested at 650°C. Note that the behavior of the brazed joints is very similar to the base metal. Credit to Sandia National Laboratory, Spingarn J. R., et al (1983)
29
Fig.2.4 Distribution of von Mises (effective) stress within the 347SS/Ag lap shear brazed joints tested to failure. The stress is plotted as a function of the distance from the joint edge for specimens having overlap lengths ranging from 0.5T to 5T, where T is the thickness of the base metal. Note that stresses in many locations, particular near the joint edge exceed, by far, the ultimate strength of the bulk silver, which is about 35 ksi (250 MPa), Flom, Wang (2004). Reprinted with permission from Welding Journal.
0
100
200
300
400
500
600
700
800
0
20
40
60
80
100
120
0 0.2 0.4 0.6 0.8 1
VM
Str
ess,
Mp
a
VM
Str
ess,
Ksi
Normalized Distance (distance from edge / overlap length)
0.5T 1T
2T 3T
4T 5T
30
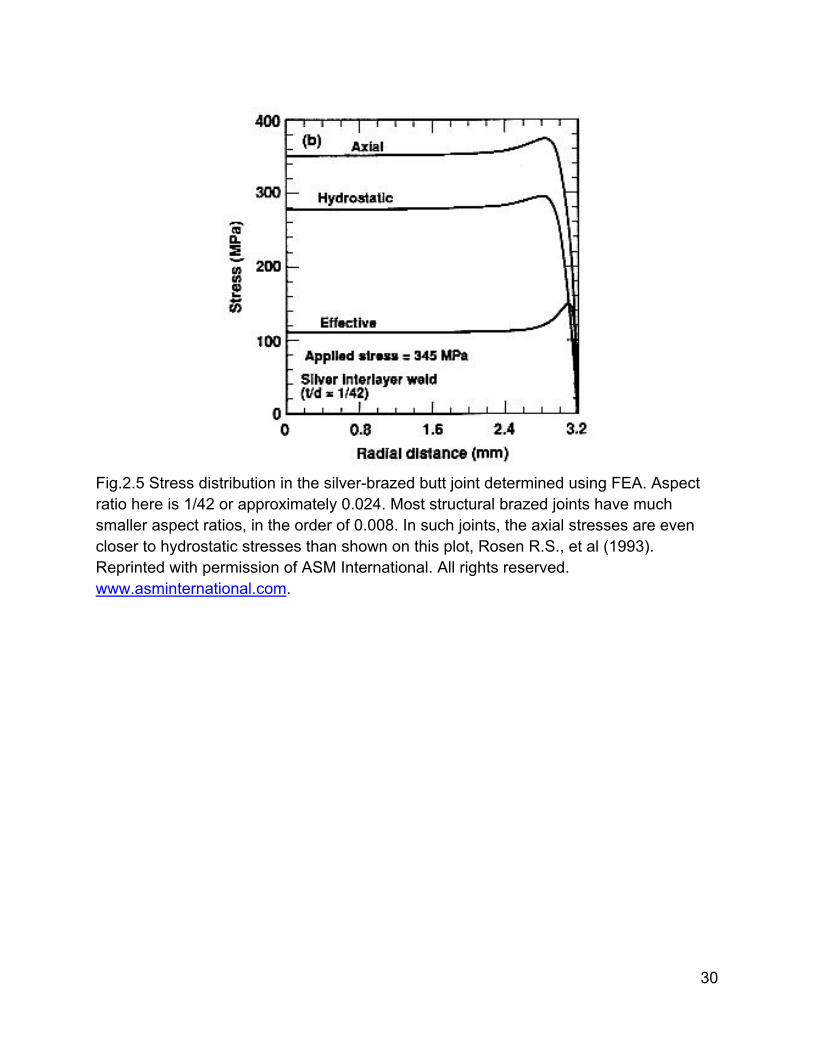
Fig.2.5 Stress distribution in the silver-brazed butt joint determined using FEA. Aspect ratio here is 1/42 or approximately 0.024. Most structural brazed joints have much smaller aspect ratios, in the order of 0.008. In such joints, the axial stresses are even closer to hydrostatic stresses than shown on this plot, Rosen R.S., et al (1993). Reprinted with permission of ASM International. All rights reserved. www.asminternational.com.
31
Fig. 2.6 Plots of several interaction equations. Note that straight line represents the most conservative case.
32
Fig.2.7 An example of FAD used in the welding industry. Vertical axis represents resistance to brittle fracture and horizontal axis represents resistance to plastic collapse, Gordon (1993). Reprinted with permission of ASM International. All rights reserved. www.asminternational.com
33
Fig.2.8 Equivalent uniaxial stress vs. equivalent uniaxial strain plot for silver-brazed maraging steel butt brazed specimens tested in torsion. An expanded view of the initial region of the test, up to 0.1 strain is shown in (a). The entire test is captured in (b). Note a significant difference in strain hardening rate between the bulk silver and a silver layer in the brazed joint. Reprinted with permission from Rosen R. S., et al (1980). Copyright 1980, American Vacuum Society.
34
Fig.2.9. Several types of brazed shear specimens single lap used in various studies to determine shear strength of the brazed joints. Effect of eccentricity of the test specimen on average shear strength is much less than the experimental scatter and variability of the brazing process itself (Brazing Handbook, 2007). Consequently, single lap test specimen, described by Peaslee (1976), remains the standard test specimen for measuring shear strength of the brazed joints.
Single lap
Pin shear
Miller-Peaslee type
Torsion
Tongue and groove
35
Fig.2. 10 Test results from previous studies plotted as stress ratios. As one can see the FAD line defined by 1 can be used quite conservatively for the lower bound estimate of stress combinations that may cause brazed joint failure. Titanium lap shear and butt brazed specimens (Flom et al., 2011) are also plotted along shear and normal stress axes, respectively.
36
Fig.2. 11 The same results as in Fig.10 shown here with the addition of the trend or brazed joint lines (dashed). Each trend line is associated with a specific braze joint geometry. We can also call them braze joint lines. A position of the data point on such line indicates a particular stresses combination.
37
Fig.2.13 Mohr circle construction representing stress state on the braze plane of the scarf joint subjected to uniaxial tension. Smaller circle represents a scarf joint fabricated from the base/filler metal combination, denoted as A system. Large circle represents scarf joint with the identical angle, but fabricated from B system, which is stronger than A. Following the nomenclature above and using simple geometric observations, one can see that shear and normal stress ratios for scarf joint A form the same proportion as the stress ratios for joint B. This explains experimental observation that stress ratios in the identical scarf brazed joints fabricated from different base/filler metals fall on the same trend line.

38
Fig.2. 13 This graph illustrates the process of constructing the braze joint line and determining margins of safety of the brazed joint. Safe zone represents safe combinations of stresses.

39
Fig. 2.14 Tensile and shear allowables can be determined using various levels of statistical requirements, as illustrated on this graph. More conservative or stringent allowables result in the smaller safe zone. The above graph is showing relative position of FAD depending on the relative value of the allowables. For example, if the test average values of and are twice as high as their “B” basis counterparts, it is easy to see that the line R R =1, representing test averages changes to R R =0.5, representing “B” – basis results.