Embed Size (px)
Citation preview
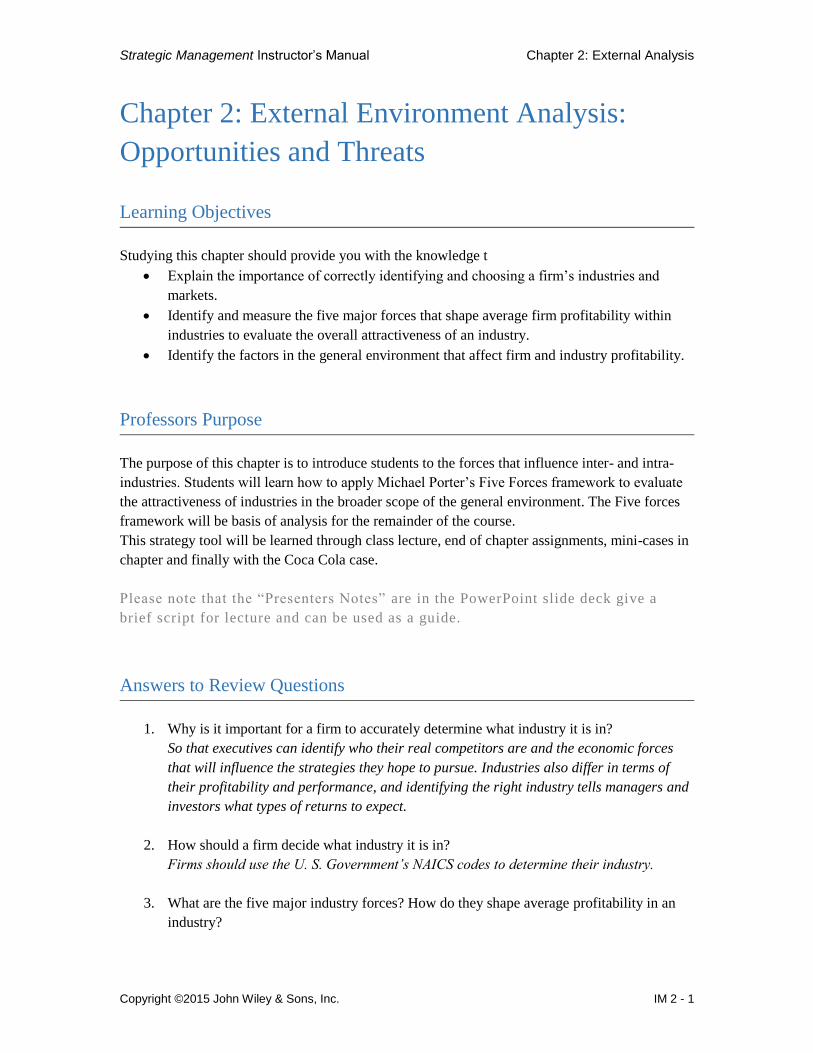
Strategic Management Instructor’s Manual Chapter 2: External Analysis
Copyright ©2015 John Wiley & Sons, Inc. IM 2 - 1
Chapter 2: External Environment Analysis:
Opportunities and Threats
Learning Objectives
Studying this chapter should provide you with the knowledge t
Explain the importance of correctly identifying and choosing a firm’s industries and
markets.
Identify and measure the five major forces that shape average firm profitability within
industries to evaluate the overall attractiveness of an industry.
Identify the factors in the general environment that affect firm and industry profitability.
Professors Purpose
The purpose of this chapter is to introduce students to the forces that influence inter- and intra-
industries. Students will learn how to apply Michael Porter’s Five Forces framework to evaluate
the attractiveness of industries in the broader scope of the general environment. The Five forces
framework will be basis of analysis for the remainder of the course.
This strategy tool will be learned through class lecture, end of chapter assignments, mini-cases in
chapter and finally with the Coca Cola case.
Please note that the “Presenters Notes” are in the PowerPoint slide deck give a
brief script for lecture and can be used as a guide.
Answers to Review Questions
1. Why is it important for a firm to accurately determine what industry it is in?
So that executives can identify who their real competitors are and the economic forces
that will influence the strategies they hope to pursue. Industries also differ in terms of
their profitability and performance, and identifying the right industry tells managers and
investors what types of returns to expect.
2. How should a firm decide what industry it is in?
Firms should use the U. S. Government’s NAICS codes to determine their industry.
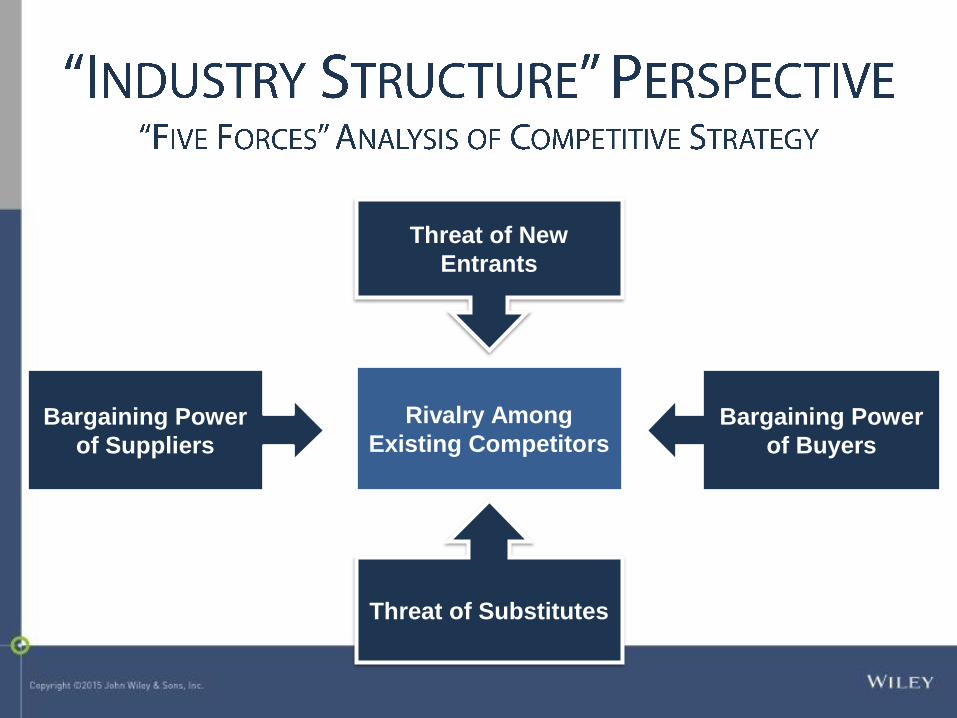
3. What are the five major industry forces? How do they shape average profitability in an
industry?
Strategic Management Instructor’s Manual Chapter 2: External Analysis
Copyright ©2015 John Wiley & Sons, Inc. IM 2 - 2
The five forces are: Barriers to (or threat of) Entry, Supplier Power, Buyer Power,
Presence of Substitutes, and Competitive Rivalry. The impacts on average profitability
are
Threat of Entry—the lower the threat the higher the average profitability
Supplier Power—the lower supplier power, the higher the average profitability
Buyer Power—the lower buyer power, the higher the average profitability
Substitution—the lower the threat of substitution, the higher the average profitability
Rivalry—the lower the degree of rivalry, the higher the average profitability.
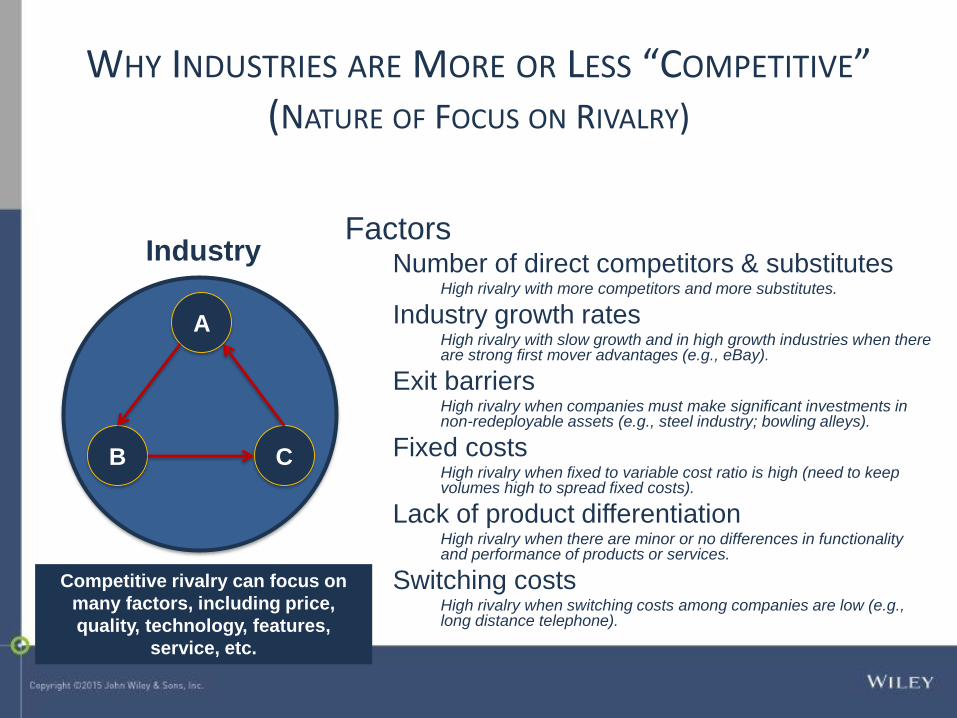
4. What factors determine the intensity of rivalry?
(1) the number and size of competitors; (2) standardization and perishability of products;
(3) costs to buyers of switching to another product; (4) growth in demand for products;
(5) levels of unused production capacity or fixed costs; and (6) the difficulty for firms of
leaving the industry.
5. Explain why increased buyer concentration would increase buyer power.
Increased buyer concentration (fewer buyers relative to the number of sellers) gives
buyers increased pricing leverage over the firm. This is because firms have to compete to
sell to fewer buyers, and orders tend to be larger.
6. Explain what it means for suppliers to have a credible threat of forward integration.
This happens when a supplier can easily compete with the firm. It may have the same
technology, or it may already have access to the same distribution system. With very little
expenditure, the supplier could produce and sell the same product as the firm.
7. What factors determine the intensity of the threat of new entrants?
The presence of economies of scale, experience, or learning; other cost advantages;
Capital requirements to enter the industry; network effects, government policies and
regulations.
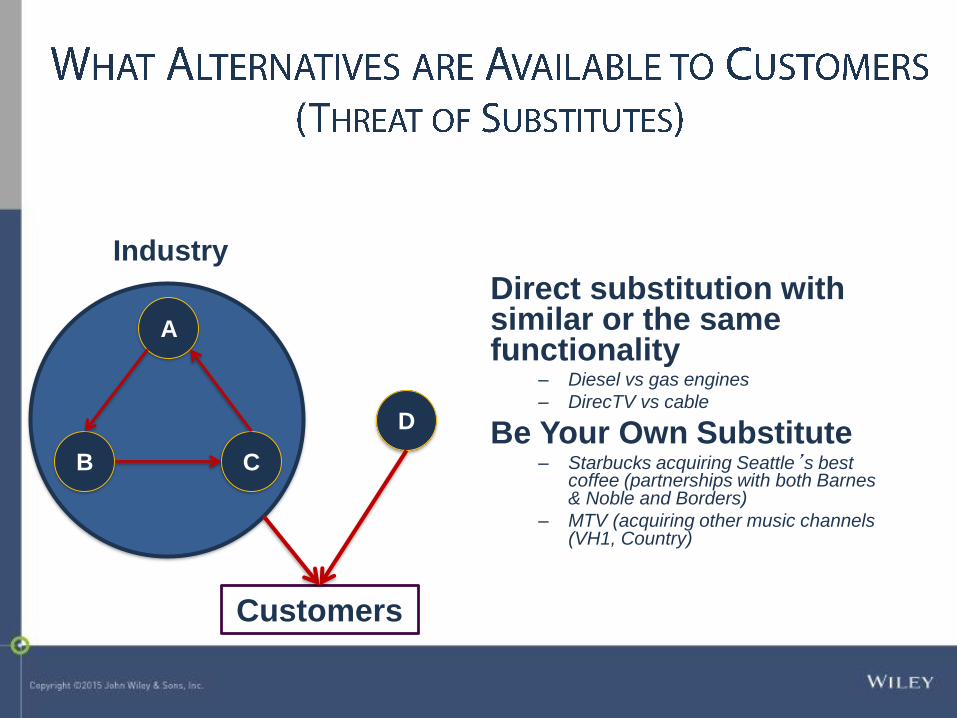
8. What are substitutes?
A product that is fundamentally different yet serves the same basic function or purpose as
another product
9. What are the seven general environmental factors that affect industry profitability?
Complementary products or services
Technological change
General economic conditions
Population demographics
Global competitive forces
Political, legal, and regulatory forces,
Social/Cultural forces
Ecological/Natural Environment
Strategic Management Instructor’s Manual Chapter 2: External Analysis
Copyright ©2015 John Wiley & Sons, Inc. IM 2 - 3
10. How does each of the eight general environmental factors influence industry
profitability?
Complementary products or services—raise the attractiveness of the industry’s products,
and hence its price
Technological change—technology can either enhance profitability (by creating new
complements) or it can destroy profitability by creating a new and better substitute
product.
General economic conditions—General economic conditions, such as interest rates,
affect the cost of capital as well as consumer’s overall willingness to spend.
Population demographics—affect the composition, and number, of customers. An aging
population is bad for toys and games, but good for vacations and retirement living.
Global competitive forces—Global competitive forces can drive down profitability by
removing trade barriers and inviting global competitors to enter the market. However,
globalization also helps profitability by giving firms access to new, and sometimes very
large, markets.
Political, legal, and regulatory forces—Regulations can increase the costs of doing
business, or make some products and services less attractive to buyers. Conversely,
government regulations can also raise barriers to entry and increase industry
profitability.
Social/Cultural forces—this force influences consumer tastes and preferences. Changes
in tastes can reduce profitability (think of the fast food industry), or it can raise
profitability (think of all the accessories that make your smartphone more attractive and
easier to use).
Ecological/Natural Environment—emerging concerns about the natural environment
may open new and profitable industries, such as renewable energy. Threats of ecological
damage can invite government regulations or activist concerns. These would drive down
profitability.
11. How do the eight general environmental factors affect the five industry forces?
The general environmental forces work primarily to make the five forces dynamic. Often
it is changes in the larger environment that causes a significant shift in each of the 5
forces.
12. What are the elements of a complete external analysis?
Managers should begin by defining the industry. They should then analyze and evaluate
the 5 forces, and then they should examine the current—and future—impacts of the eight
general environmental forces on the industry. It is important to understand how the
industry has evolved over time, and so a complete analysis will consider how each force
or element has changed over time, and what future changes might be reasonable.
Strategic Management Case Notes Case 2: Coca-Cola and Pepsi
Copyright ©2015 John Wiley & Sons, Inc. Case 2 - 1
Teaching Note
Coca-Cola, Pepsi, and the Shifting Landscape of theCarbonated Soft Drink Industry
Teaching Objectives
This case provides an understanding of the underlying economics of an industry and itsrelationship to average industry profits. The concentrate industry is, on average, moreattractive than bottling. It also provides students with an opportunity to create an entrystrategy for a new player in the concentrate industry.
After completing this case, students should have a much clearer understanding of the fiveforces that influence an industry’s attractiveness. They also should have an increasedability to analyze each of those five forces to assess and measure the overallattractiveness of a given industry. The case provides all of the needed information forstudents to use the supplier power and rivalry five forces tools from chapter 2.
Study Questions
1. Analyze the structure (Porter’s 5 Forces) of the soft drink industry. Why are Cokeand Pepsi so profitable? What prevent other firms from entering this industry andaccessing some of those high profits?
2. Compare the economics (costs and profits) of soft drinks (concentrate) versusbottlers. Why is the concentrate business more profitable than the bottlingbusiness? Why do you think Coke & Pepsi are in the bottling business?
3. Team Assignment: Create a 5 year proforma in Excel which projects therevenues, costs, and profits (both earnings before interest, taxes, and amortization(EBITDA) and earnings before taxes (EBT) for a company who enters the U.S.carbonated soft drink industry and who attempts to build a 10% market shareposition in the U.S. carbonated soft drink industry within a five year time period(please include fixed and variable costs in your analysis). To calculate interestexpense, assume that you will need to raise 50% of the capital you requirethrough bank financing at 10% interest. To calculate depreciation expense,assume that only a niche player (with less than 5% market share) can access thebottlers/distributors of Coke or Pepsi, which means you will need to build bottlingplants (which you can depreciate using straight line depreciation over a 30 year
Strategic Management Case Notes Case 2: Coca-Cola and Pepsi
Copyright ©2015 John Wiley & Sons, Inc. Case 2 - 2
life). Please provide your assumptions along with a one half page description ofyour market entry strategy.
Teaching Plan
I. Taste Test 15 minII. Board Exercise: Concentrate Environment 30 minIII. Board Exercise: Comparison to BottlingEnvironment
15 min
IV. Conclusion 10 min
I. Taste Test
While not required, this activity may help students understand more clearly that Coke &Pepsi are more differentiated by brand than they are by product.
In preparation for this activity, you will need a bottle of Coke, Pepsi, and generic cola. Itis best to put each brand in a pitcher or other type of generic container as the two literbottles are distinctive in appearance. Make sure you know which brand is in whichcontainer. This can be done with a number taped to the bottom of the container. Placeeach container on a table with a number in front of it. The students will use that numberto identify which brand they think they are tasting.
Ask if any students drink a lot of cola and have a preference for a particular brand. At theend of the exercise you will specifically ask those students if they correctly identifiedeach brand and if they chose the right one as their favorite.
Write Coke, Pepsi, and Generic on the board. Have either all or a subset of students tastea sample from each bottle and write down the number of the container beneath the brandthey believe they are tasting. While some professors like to use a subset of students tospeed up the exercise letting all students do the taste test really peaks their interest andengages them in the rest of the lesson. Also have the students select which cola they mostlike by placing an asterisk next to that selection on the board. After each student hascompleted the test taste, reveal to them which soda was which. Ask those who drink a lotof cola and were sure they could tell the difference if they got it right. While some maycorrectly identify all three, most of the students will likely not. It may also be interestingto note that some students that have a favorite cola (Pepsi or Coke) will mistakenlychoose another cola as their favorite (e.g. Pepsi drinkers may mistakenly identify Coke orthe generic brand as Pepsi). While with some classes the majority identify each cola
Strategic Management Case Notes Case 2: Coca-Cola and Pepsi
Copyright ©2015 John Wiley & Sons, Inc. Case 2 - 3
correctly most of the time they do not and the generic cola is often chosen as the overallfavorite.
Question: What does it mean that you can’t tell the difference?
The purpose of the Concentrate & Bottling Environment sections is to help students moreconcretely identify the sources of Coke & Pepsi’s profitability. These sections also givestudents an opportunity to identify what they would do to operate profitably in theseenvironments (see Study Question #3).
II. Concentrate Environment
Question: Coke & Pepsi make roughly 80% margins on a product that, according to thetaste test, isn’t very differentiated at all. How can you explain how a company that sells anon-differentiated product makes higher margins than companies that make verydifferentiated products such as Intel or Apple?
As students answer, help them see that the profitability does not solely come from brandequity. For example, it may be useful to refer students back to the taste test and ask aquestion such as: If brand is the source of profitability, does that mean that Coke andPepsi have convinced us that their product is better than the generic brand even thoughyou can’t really taste a difference between them?
During this discussion, it is likely that students will mention Coke & Pepsi’s spending onmarketing and advertising ($234m & 136m respectively). As they do so, it may be usefulto ask the following:
At this point, students should be describing characteristics of the competitiveenvironment other than brand equity. A description of the concentrate industryenvironment is given below for reference.
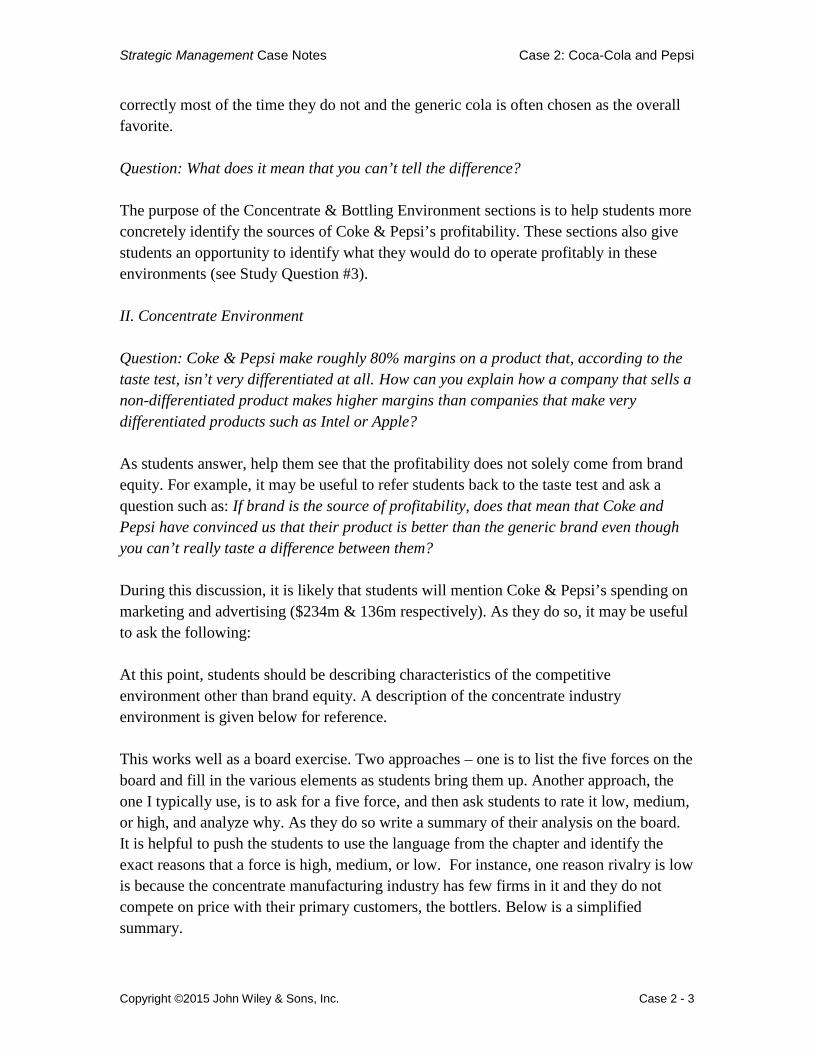
This works well as a board exercise. Two approaches – one is to list the five forces on theboard and fill in the various elements as students bring them up. Another approach, theone I typically use, is to ask for a five force, and then ask students to rate it low, medium,or high, and analyze why. As they do so write a summary of their analysis on the board.It is helpful to push the students to use the language from the chapter and identify theexact reasons that a force is high, medium, or low. For instance, one reason rivalry is lowis because the concentrate manufacturing industry has few firms in it and they do notcompete on price with their primary customers, the bottlers. Below is a simplifiedsummary.
Strategic Management Case Notes Case 2: Coca-Cola and Pepsi
Copyright ©2015 John Wiley & Sons, Inc. Case 2 - 4
If you had the students use the rivalry tool as an experiential exercise when coveringrivalry you may want to show the answers to five forces worksheet so students cancompare it with their answers and see how a thorough analysis can inform the moreinformal analysis they are doing in class.
*Besides limited shelf space, limited fountain space and costs of vending distribution alsocreate barriers to entry.
Question: Why can’t another company successfully enter the concentrate industry bysimply investing a large amount into marketing and advertising?
If you had the students do study question #3 this would be the time to show the excelspreadsheet showing the 5 year proforma, focusing on the costs of advertising, creating abottler network, and paying for shelf space.
Threat of New EntrantsLOW- due to barrierssuch as limited shelfspace* and the highbrand equities ofincumbentsCompetitive RivalryLOW - Coke & Pepsi havea large share of ashrinking market. Littleprice competition. Fewfirms in the industry.Threat of SubstitutesHIGH – multiplesubstitutes – any otherbeverage. Get studentsto see how Coke andPepsi have managed thisthreat by purchasingmajor substitute brands.
Buyer PowerLOW – The Bottlers arethe buyers. They arelocked into long termcontracts with no abilityto switch suppliers.
Supplier PowerLOW - All concentrateinputs are commodities.
Strategic Management Case Notes Case 2: Coca-Cola and Pepsi
Copyright ©2015 John Wiley & Sons, Inc. Case 2 - 5
III. Bottling Environment
Question: Compare the attractiveness of the concentrate industry with the bottlingindustry? Why is the concentrate industry more attractive than the bottling industry?
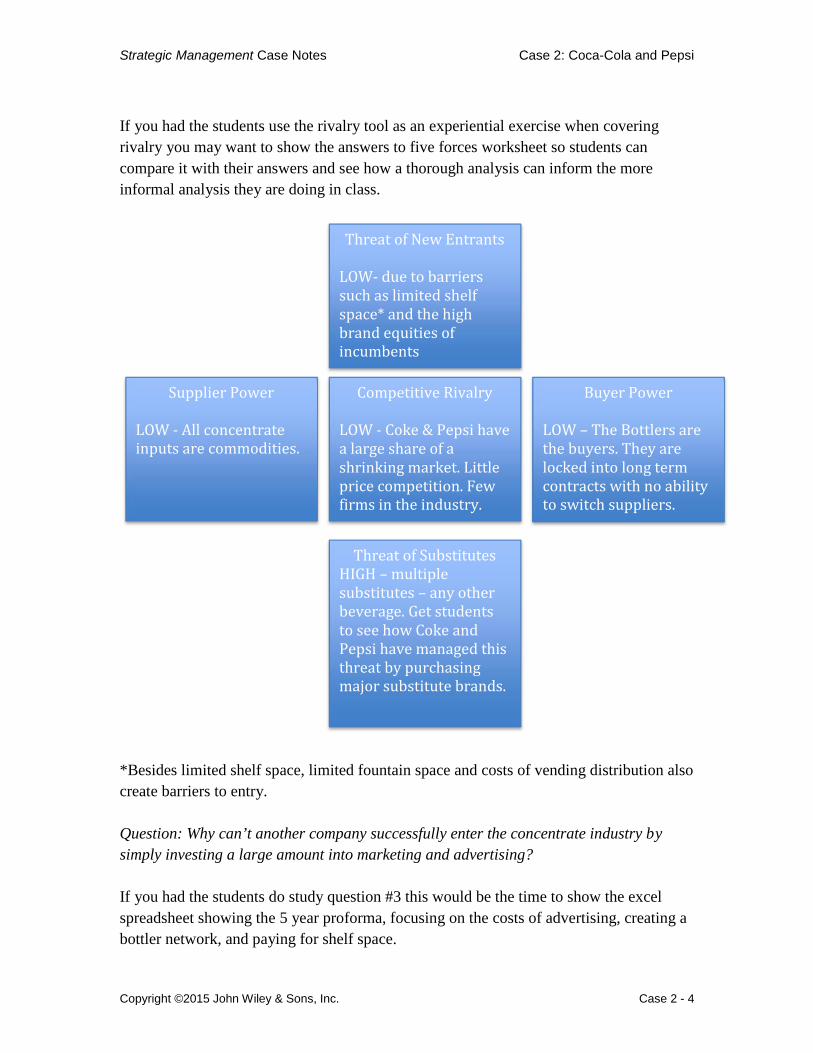
Push students to apply the 5 Forces model to compare the two industries. This workswell as a board exercise. As with the concentrate manufacturers ask students for a fiveforce, have them choose if the threat is low, medium, or high, and then analyze why.
If you had the students use the supplier power tool as an experiential exercise whencovering supplier power you may want to show the answers to five forces worksheet sostudents can compare it with their answers and see how a thorough analysis can informthe more informal analysis they are doing in class.
A comparison between the two industries can be very instructive. At this point ask thestudents if the industries are attractive. On the surface both look attractive. However,you can point out that the concentrate manufacturers enjoy high profit margins while thebottlers do not. Ask the students why. While the bottling industry looks very attractivethe lesson to be learned is that it can take only one of the five forces to be a major threatto industry profitability. In this case the extremely high supplier power that theconcentrate manufacturers enjoy allows them to siphon off any extra profits from thebottling industry.
Strategic Management Case Notes Case 2: Coca-Cola and Pepsi
Copyright ©2015 John Wiley & Sons, Inc. Case 2 - 6
Question: Why are Coke and Pepsi in the bottling business if it is so much less attractivethan concentrate?
Although the concentrate environment is attractive by itself, their presence in the bottlingbusiness is what protects the concentrate industry due to the increased barriers to entry.The purpose of this section is to help students understand why it would be difficult todirectly enter the concentrate market and why Coke & Pepsi are experiencing such greatprofits.
IV. Conclusion
This case provides an understanding of the underlying economics of an industry and itsrelationship to average industry profits. The concentrate industry is, on average, moreattractive than bottling.
Entry into the concentrate industry is limited by barriers to entry:Brand EquityBottling/Franchise SystemLimited Shelf Space
Threat of New EntrantsLOW- due to highcapital costs to enterand exclusive contractswith Coke and Pepsi.Competitive RivalryLOW – only two tothree bottlers in anygeographic area
Threat of SubstitutesLOW – Bottlers controlmost methods ofbottling including glassand aluminum.
Buyer PowerMED – overall buyersare fragmented but inany geographic areasupermarkets andwarehouse stores arelikely to represent alarge percentage ofsales.
Supplier PowerLOW for commodityinputs (such as glass)and Very HIGH for thesoda inputs (such asCoke)
Strategic Management Case Notes Case 2: Coca-Cola and Pepsi
Copyright ©2015 John Wiley & Sons, Inc. Case 2 - 7
Relative to bottling, concentrate has:
Greater bargaining power over suppliers and buyersA more attractive industry structure overall
Industry Analysis And Firm
Performance
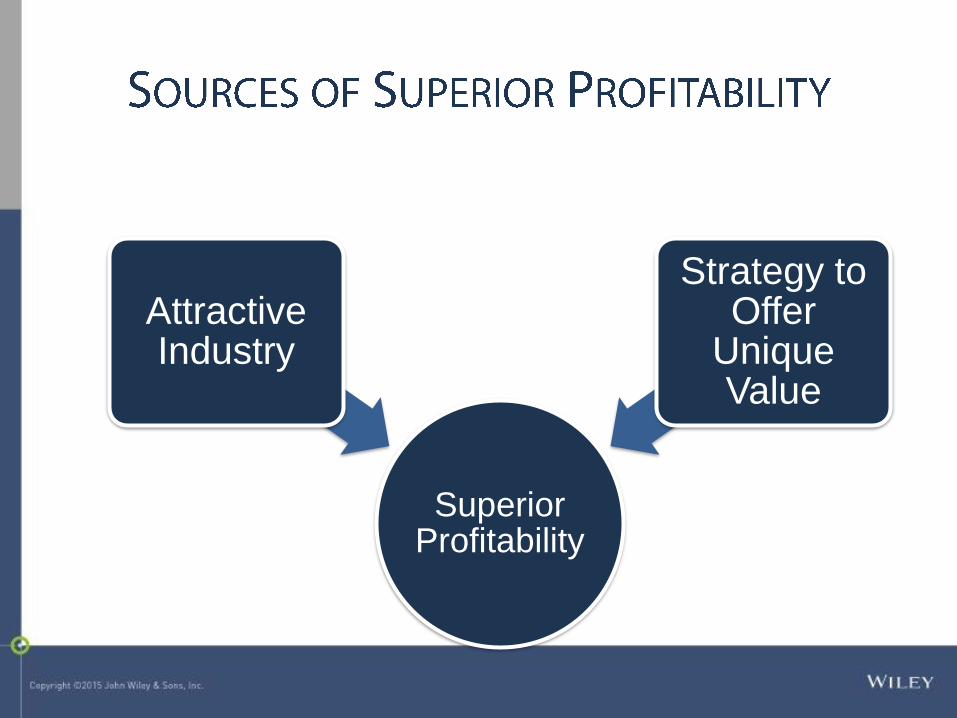
Superior Profitability
Attractive Industry
Strategy to Offer
Unique Value
-15%
-10%
-5%
0%
5%
10%
15%
Threat of New
Entrants
Threat of Substitutes
Rivalry Among
Existing CompetitorsBargaining Power
of Suppliers
Bargaining Power
of Buyers
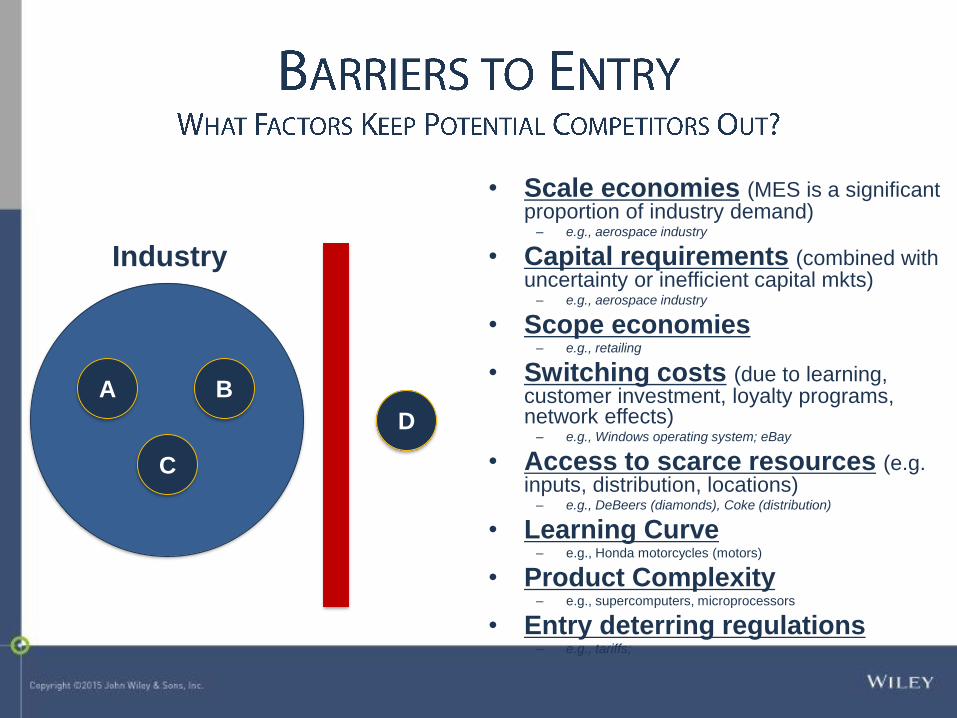
• Scale economies (MES is a significant proportion of industry demand)
– e.g., aerospace industry
• Capital requirements (combined with uncertainty or inefficient capital mkts)
– e.g., aerospace industry
• Scope economies– e.g., retailing
• Switching costs (due to learning, customer investment, loyalty programs, network effects)
– e.g., Windows operating system; eBay
• Access to scarce resources (e.g. inputs, distribution, locations)
– e.g., DeBeers (diamonds), Coke (distribution)
• Learning Curve– e.g., Honda motorcycles (motors)
• Product Complexity– e.g., supercomputers, microprocessors
• Entry deterring regulations– e.g., tariffs;
A B
C
D
Industry
A
B C
D
Industry
Direct substitution with similar or the same functionality
– Diesel vs gas engines
– DirecTV vs cable
Be Your Own Substitute– Starbucks acquiring Seattle’s best
coffee (partnerships with both Barnes & Noble and Borders)
– MTV (acquiring other music channels (VH1, Country)
Customers
A
B C
IndustryFactors
Number of direct competitors & substitutesHigh rivalry with more competitors and more substitutes.
Industry growth ratesHigh rivalry with slow growth and in high growth industries when there are strong first mover advantages (e.g., eBay).
Exit barriers High rivalry when companies must make significant investments in non-redeployable assets (e.g., steel industry; bowling alleys).
Fixed costsHigh rivalry when fixed to variable cost ratio is high (need to keep volumes high to spread fixed costs).
Lack of product differentiationHigh rivalry when there are minor or no differences in functionality and performance of products or services.
Switching costsHigh rivalry when switching costs among companies are low (e.g., long distance telephone).
Competitive rivalry can focus on
many factors, including price,
quality, technology, features,
service, etc.
WHY INDUSTRIES ARE MORE OR LESS “COMPETITIVE”(NATURE OF FOCUS ON RIVALRY)
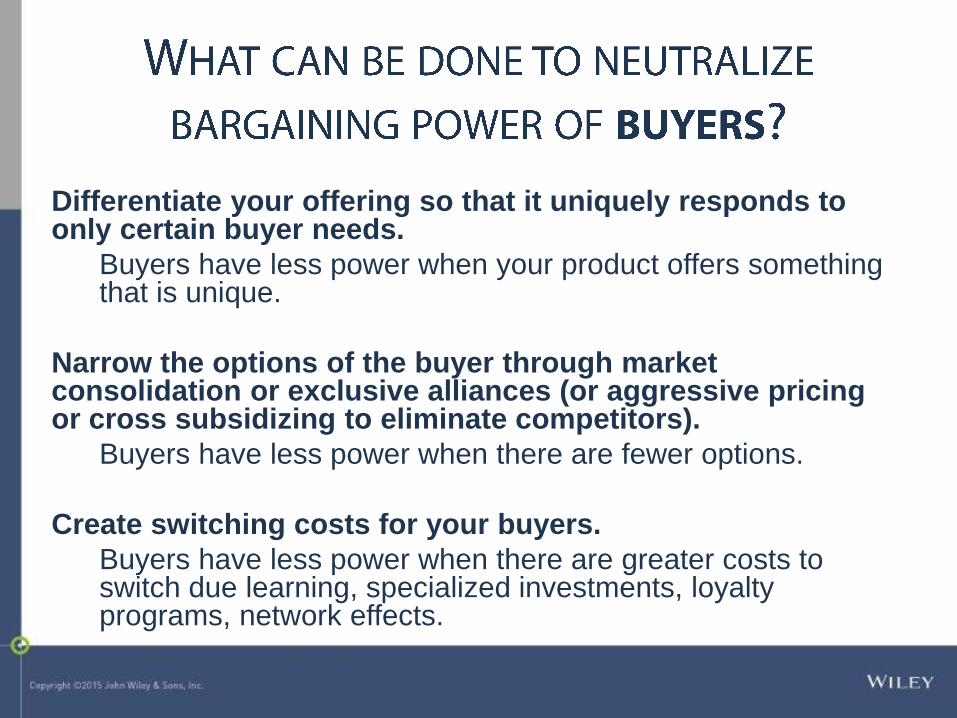
Differentiate your offering so that it uniquely responds to only certain buyer needs.
Buyers have less power when your product offers something that is unique.
Narrow the options of the buyer through market consolidation or exclusive alliances (or aggressive pricing or cross subsidizing to eliminate competitors).
Buyers have less power when there are fewer options.
Create switching costs for your buyers.
Buyers have less power when there are greater costs to switch due learning, specialized investments, loyalty programs, network effects.
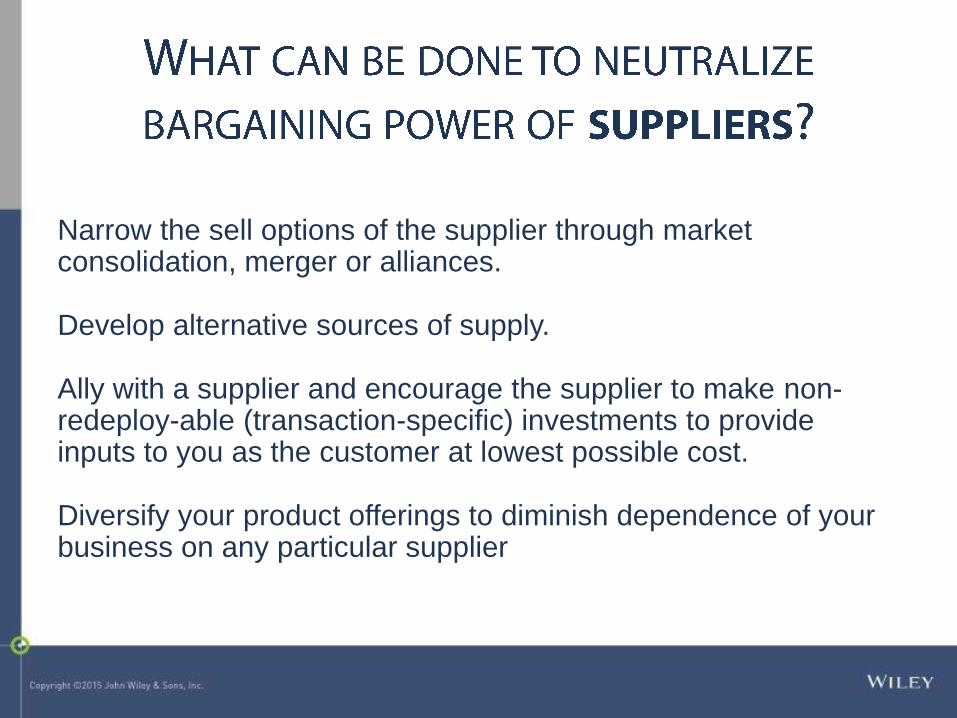
Narrow the sell options of the supplier through market consolidation, merger or alliances.
Develop alternative sources of supply.
Ally with a supplier and encourage the supplier to make non-redeploy-able (transaction-specific) investments to provide inputs to you as the customer at lowest possible cost.
Diversify your product offerings to diminish dependence of your business on any particular supplier
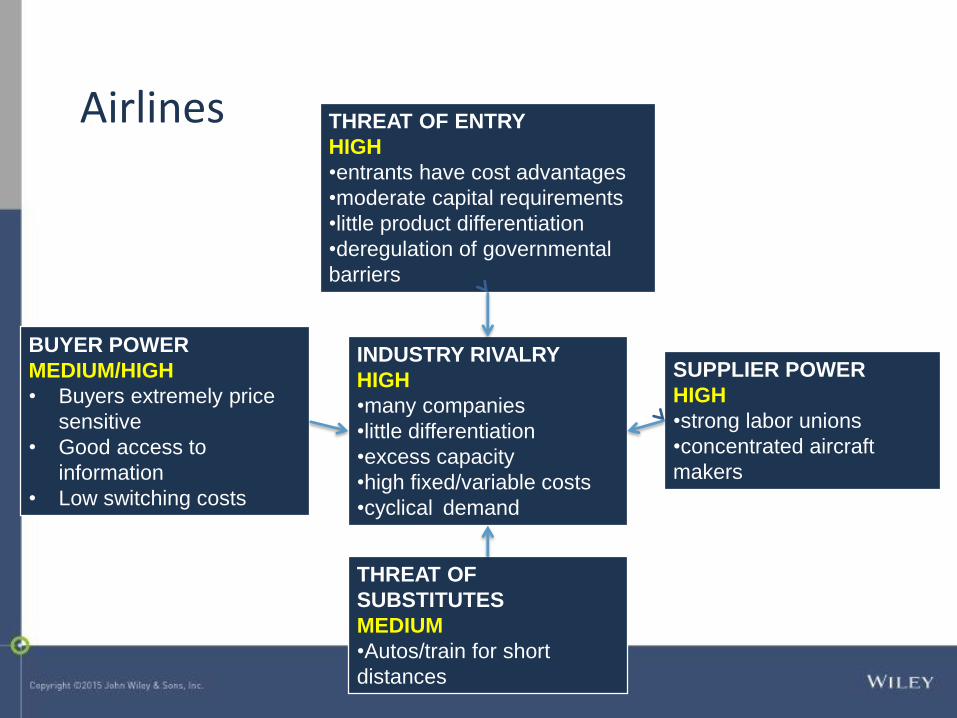
SUPPLIER POWER
HIGH
•strong labor unions
•concentrated aircraft
makers
THREAT OF ENTRY
HIGH
•entrants have cost advantages
•moderate capital requirements
•little product differentiation
•deregulation of governmental
barriers
INDUSTRY RIVALRY
HIGH
•many companies
•little differentiation
•excess capacity
•high fixed/variable costs
•cyclical demand
THREAT OF
SUBSTITUTES
MEDIUM
•Autos/train for short
distances
BUYER POWER
MEDIUM/HIGH
• Buyers extremely price
sensitive
• Good access to
information
• Low switching costs
Airlines
SUPPLIER
POWER
LOWSuppliers provide
mostly commodity
inputs
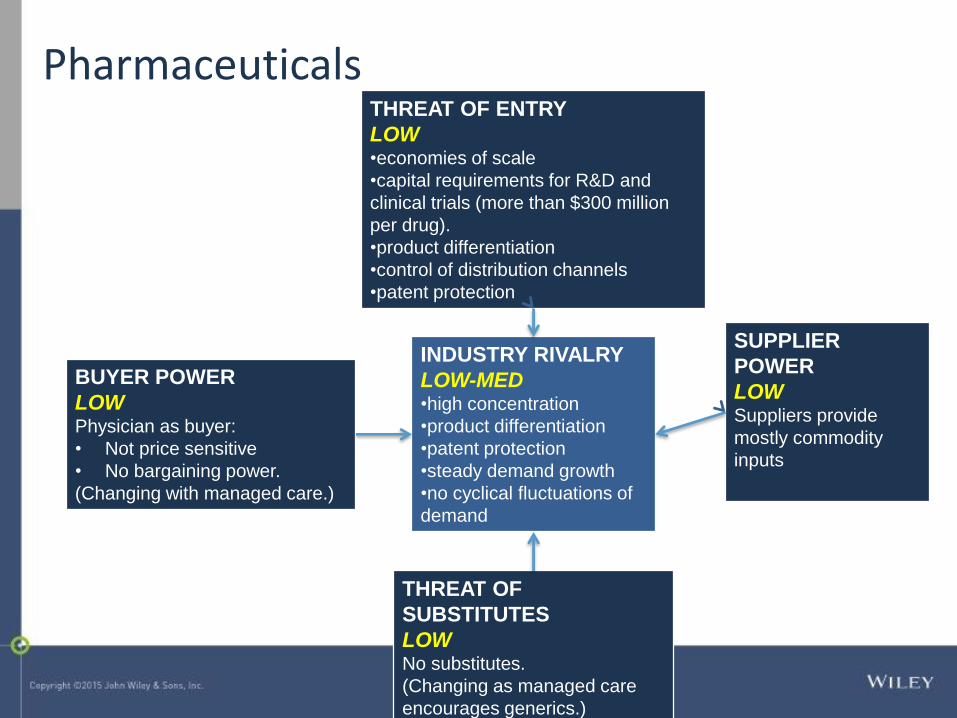
THREAT OF ENTRY
LOW•economies of scale
•capital requirements for R&D and
clinical trials (more than $300 million
per drug).
•product differentiation
•control of distribution channels
•patent protection
INDUSTRY RIVALRY
LOW-MED•high concentration
•product differentiation
•patent protection
•steady demand growth
•no cyclical fluctuations of
demand
THREAT OF
SUBSTITUTES
LOWNo substitutes.
(Changing as managed care
encourages generics.)
BUYER POWER
LOWPhysician as buyer:
• Not price sensitive
• No bargaining power.
(Changing with managed care.)
Pharmaceuticals
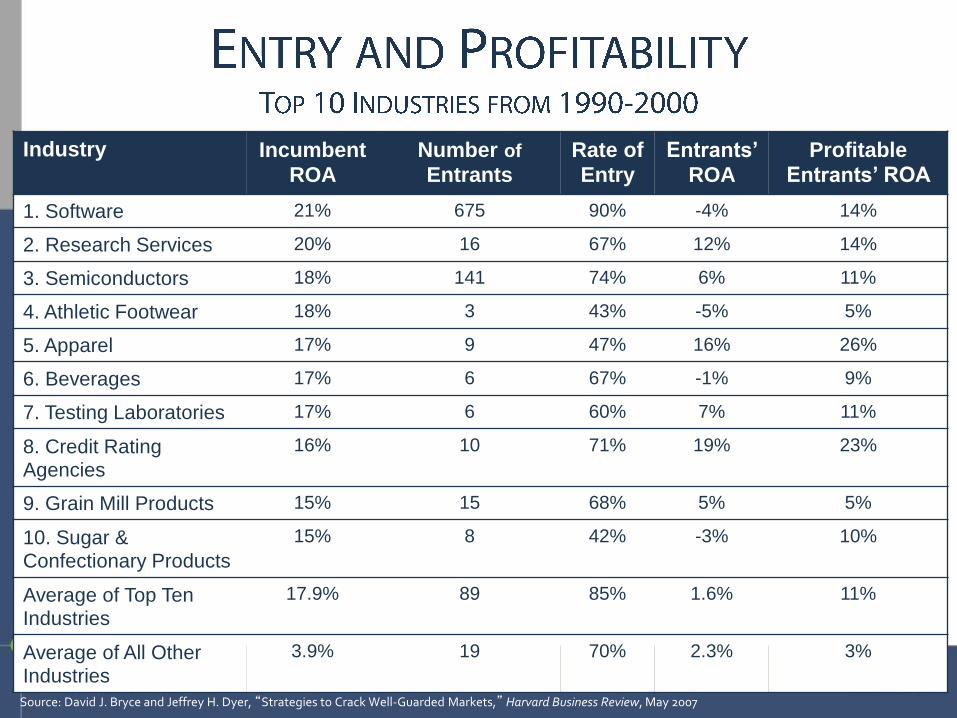
Industry Incumbent
ROANumber of
EntrantsRate of
EntryEntrants’
ROAProfitable
Entrants’ ROA
1. Software 21% 675 90% -4% 14%
2. Research Services 20% 16 67% 12% 14%
3. Semiconductors 18% 141 74% 6% 11%
4. Athletic Footwear 18% 3 43% -5% 5%
5. Apparel 17% 9 47% 16% 26%
6. Beverages 17% 6 67% -1% 9%
7. Testing Laboratories 17% 6 60% 7% 11%
8. Credit Rating Agencies
16% 10 71% 19% 23%
9. Grain Mill Products 15% 15 68% 5% 5%
10. Sugar & Confectionary Products
15% 8 42% -3% 10%
Average of Top Ten Industries
17.9% 89 85% 1.6% 11%
Average of All Other Industries
3.9% 19 70% 2.3% 3%
Source: David J. Bryce and Jeffrey H. Dyer, “Strategies to Crack Well-Guarded Markets,” Harvard Business Review, May 2007
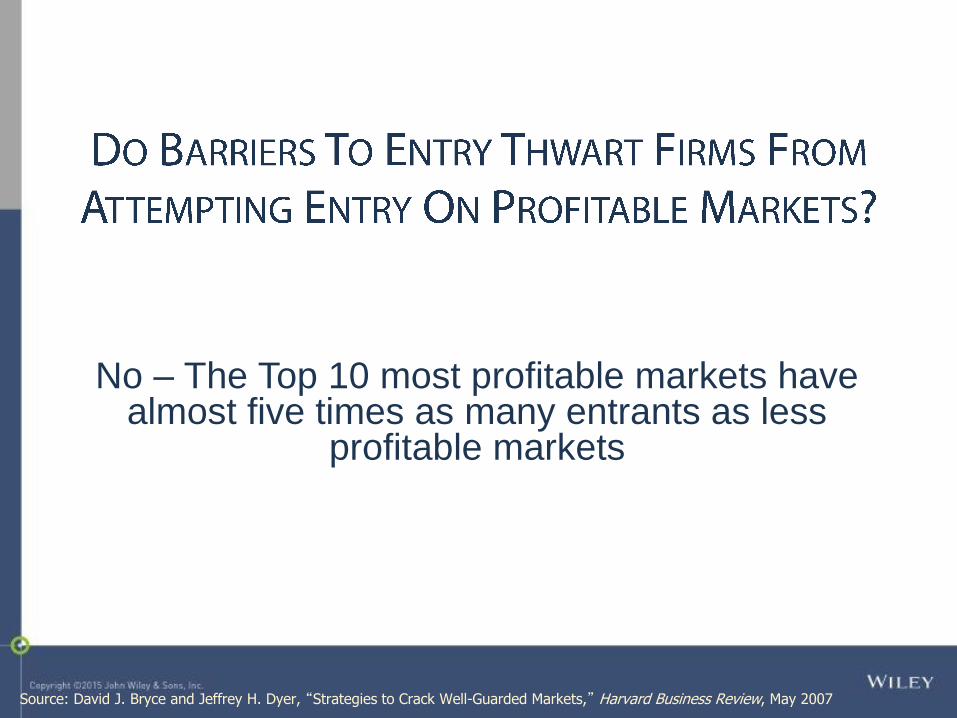
No – The Top 10 most profitable markets have almost five times as many entrants as less
profitable markets
Source: David J. Bryce and Jeffrey H. Dyer, “Strategies to Crack Well-Guarded Markets,” Harvard Business Review, May 2007
Source: David J. Bryce and Jeffrey H. Dyer, “Strategies to Crack Well-Guarded Markets,”Harvard Business Review, May 2007
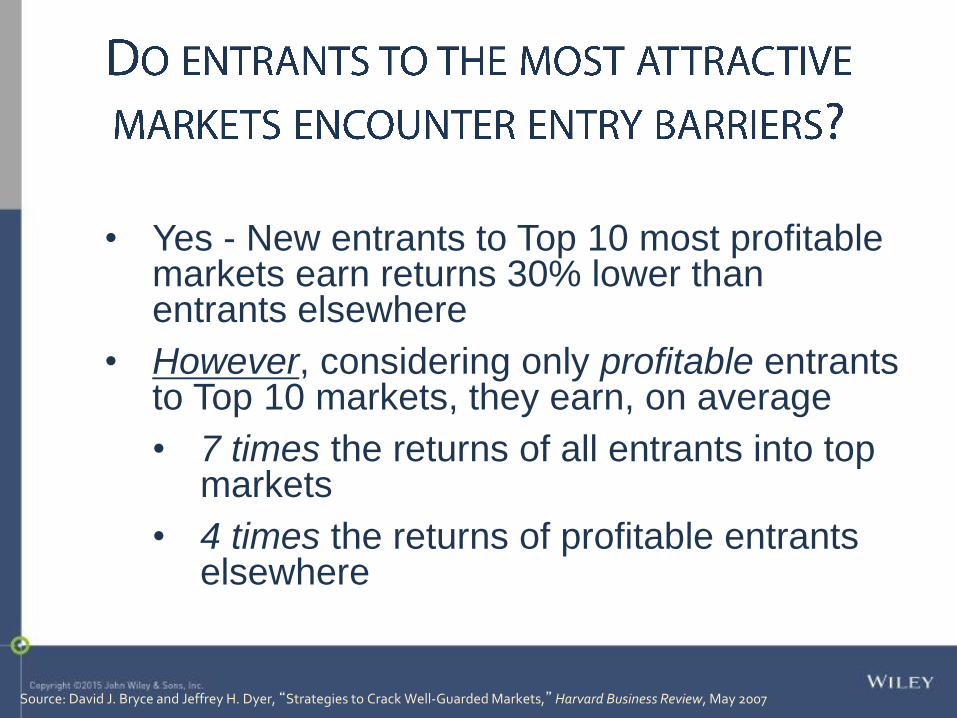
• Yes - New entrants to Top 10 most profitable markets earn returns 30% lower than entrants elsewhere
• However, considering only profitable entrants to Top 10 markets, they earn, on average
• 7 times the returns of all entrants into top markets
• 4 times the returns of profitable entrants elsewhere
Source: David J. Bryce and Jeffrey H. Dyer, “Strategies to Crack Well-Guarded Markets,”Harvard Business Review, May 2007
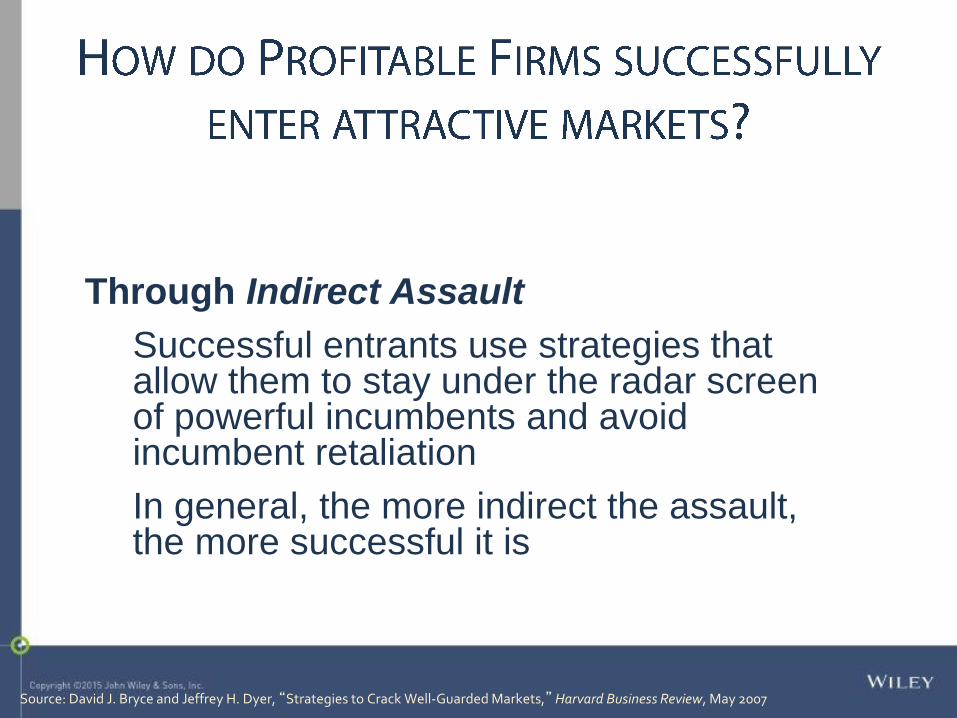
Through Indirect Assault
Successful entrants use strategies that allow them to stay under the radar screen of powerful incumbents and avoid incumbent retaliation
In general, the more indirect the assault, the more successful it is
Source: David J. Bryce and Jeffrey H. Dyer, “Strategies to Crack Well-Guarded Markets,”Harvard Business Review, May 2007
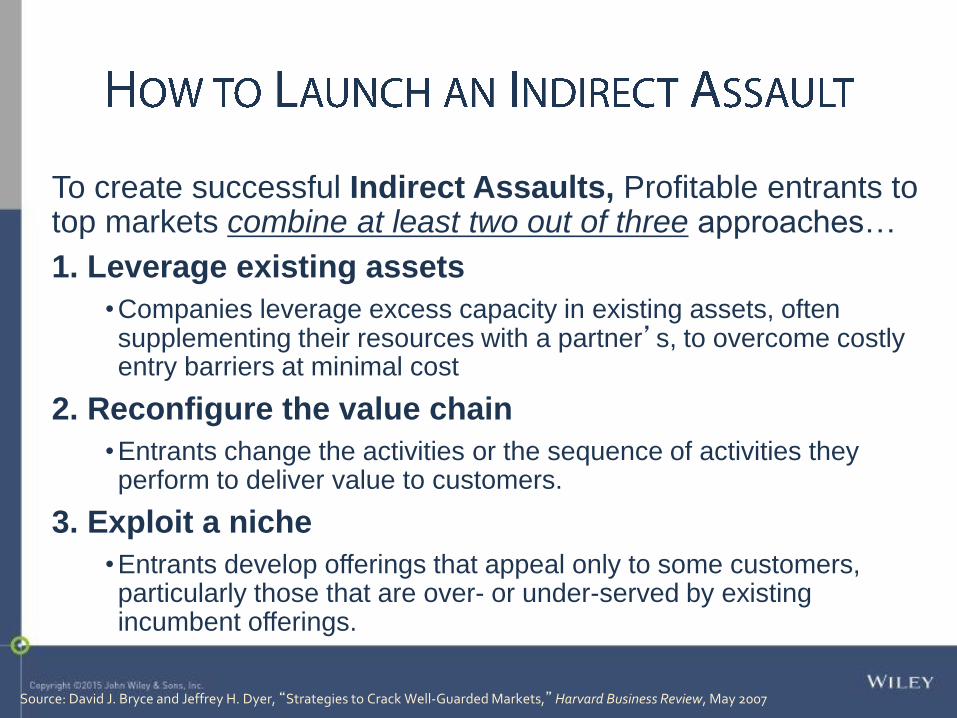
To create successful Indirect Assaults, Profitable entrants to top markets combine at least two out of three approaches…
1. Leverage existing assets
•Companies leverage excess capacity in existing assets, often supplementing their resources with a partner’s, to overcome costly entry barriers at minimal cost
2. Reconfigure the value chain
•Entrants change the activities or the sequence of activities they perform to deliver value to customers.
3. Exploit a niche
•Entrants develop offerings that appeal only to some customers, particularly those that are over- or under-served by existing incumbent offerings.
Source: David J. Bryce and Jeffrey H. Dyer, “Strategies to Crack Well-Guarded Markets,”Harvard Business Review, May 2007
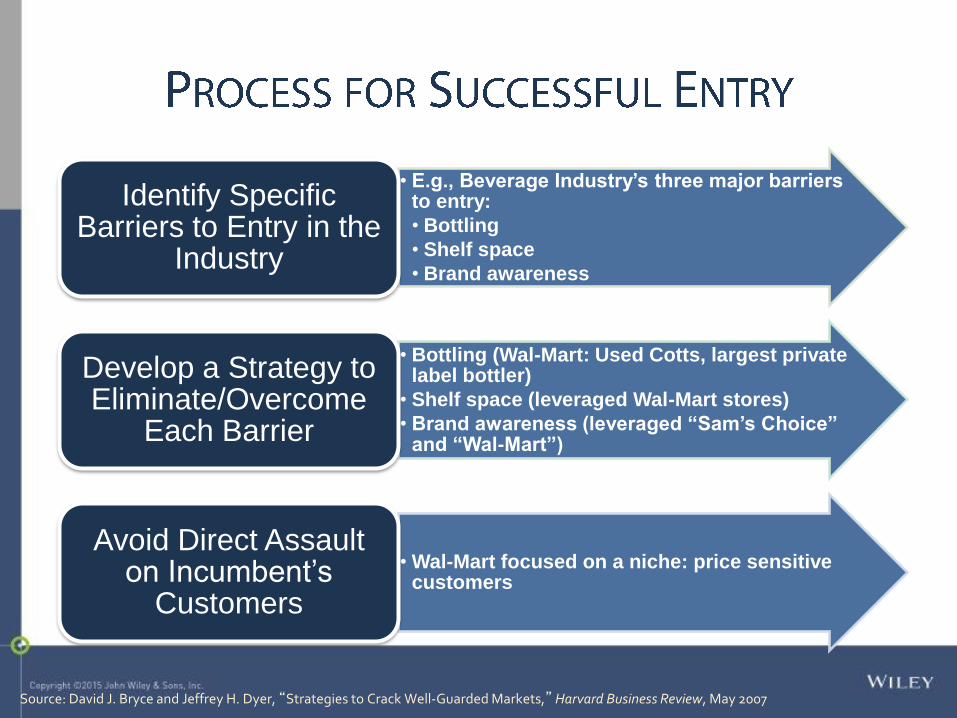
• E.g., Beverage Industry’s three major barriers to entry:
• Bottling
• Shelf space
• Brand awareness
Identify Specific Barriers to Entry in the
Industry
• Bottling (Wal-Mart: Used Cotts, largest private label bottler)
• Shelf space (leveraged Wal-Mart stores)
• Brand awareness (leveraged “Sam’s Choice” and “Wal-Mart”)
Develop a Strategy to Eliminate/Overcome
Each Barrier
• Wal-Mart focused on a niche: price sensitive customers
Avoid Direct Assault on Incumbent’s
Customers
Source: David J. Bryce and Jeffrey H. Dyer, “Strategies to Crack Well-Guarded Markets,”Harvard Business Review, May 2007
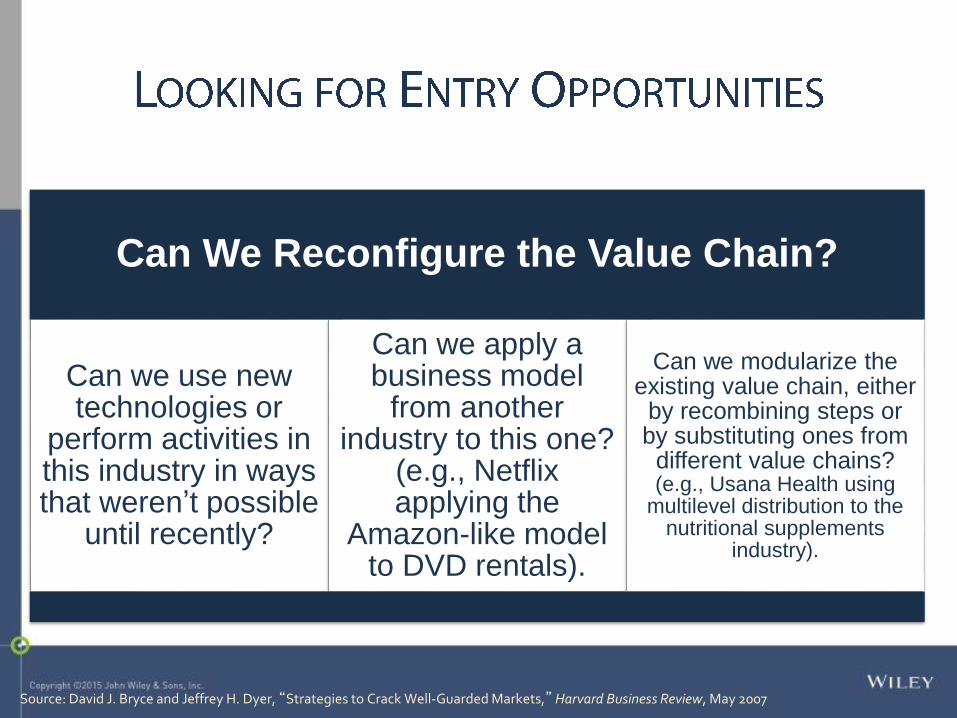
Can We Reconfigure the Value Chain?
Can we use new technologies or
perform activities in this industry in ways that weren’t possible
until recently?
Can we apply a business model
from another industry to this one?
(e.g., Netflix applying the
Amazon-like model to DVD rentals).
Can we modularize the existing value chain, either
by recombining steps or by substituting ones from
different value chains? (e.g., Usana Health using
multilevel distribution to the nutritional supplements
industry).
Source: David J. Bryce and Jeffrey H. Dyer, “Strategies to Crack Well-Guarded Markets,”Harvard Business Review, May 2007
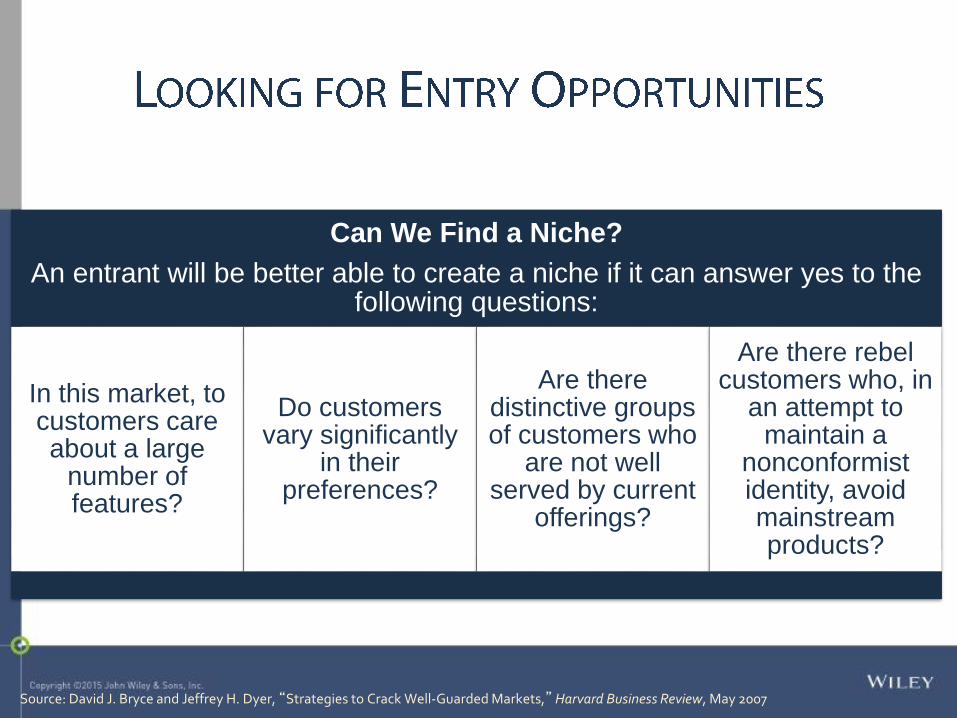
Can We Find a Niche?
An entrant will be better able to create a niche if it can answer yes to the following questions:
In this market, to customers care about a large
number of features?
Do customers vary significantly
in their preferences?
Are there distinctive groups of customers who
are not well served by current
offerings?
Are there rebel customers who, in
an attempt to maintain a
nonconformist identity, avoid mainstream products?
Source: David J. Bryce and Jeffrey H. Dyer, “Strategies to Crack Well-Guarded Markets,” Harvard Business Review, May 2007
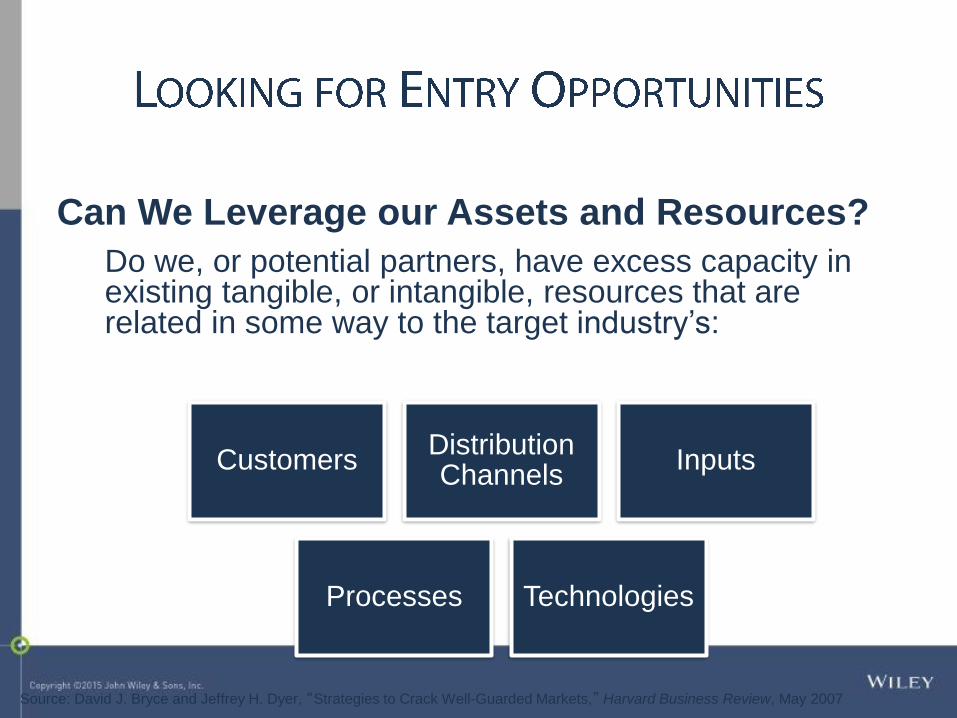
Can We Leverage our Assets and Resources?
Do we, or potential partners, have excess capacity in existing tangible, or intangible, resources that are related in some way to the target industry’s:
CustomersDistribution Channels
Inputs
Processes Technologies
Source: David J. Bryce and Jeffrey H. Dyer, “Strategies to Crack Well-Guarded Markets,” Harvard Business Review, May 2007
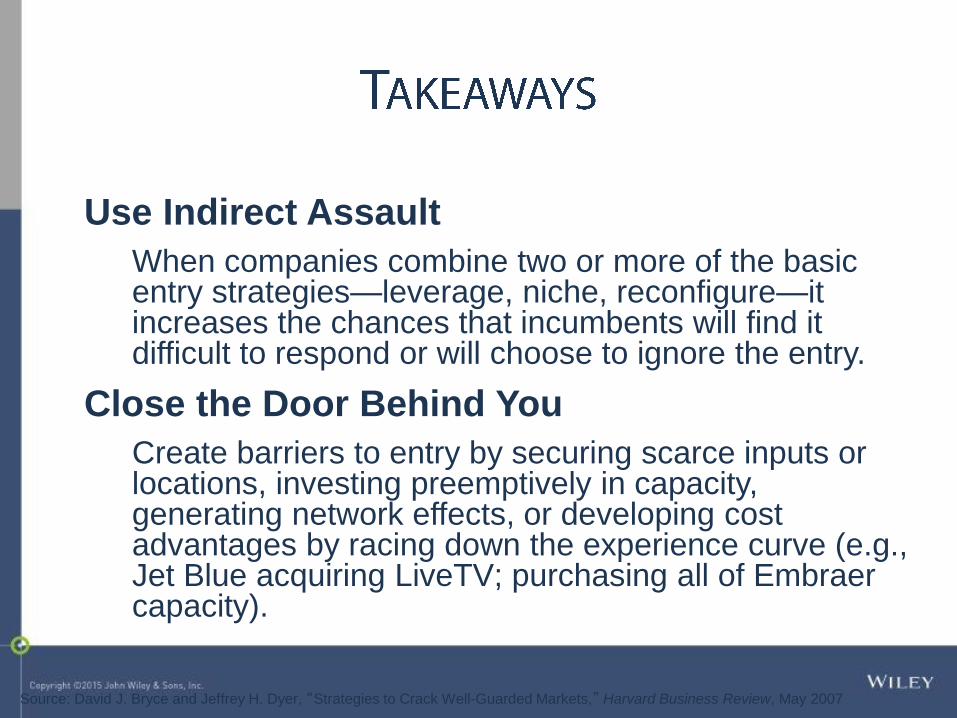
Use Indirect Assault
When companies combine two or more of the basic entry strategies—leverage, niche, reconfigure—it increases the chances that incumbents will find it difficult to respond or will choose to ignore the entry.
Close the Door Behind You
Create barriers to entry by securing scarce inputs or locations, investing preemptively in capacity, generating network effects, or developing cost advantages by racing down the experience curve (e.g., Jet Blue acquiring LiveTV; purchasing all of Embraer capacity).