Embed Size (px)
Citation preview

CHAPTER 2: AGRICULTURE AND NATURAL RESOURCE MANAGEMENT
2.1 Agriculture has been the backbone of the economy of the NWFP — in 2002/03 it contributed about 20 percent of the provincial GDP and provided employment for an estimated 44 percent of the labor force — and will continue to be crucial in the medium-term.11 However, as part of the strategy to accelerate growth in the province, the relative size and composition of the sector will have to undergo changes. Land is the binding constraint on the NWFP's agriculture. Only 30 percent of the land in the province is cultivable, and additions to the cultivable area through irrigation or to the cropped area12 through increases in cropping intensity have not kept pace with the growth of the population. If agriculture is to make its due contribution to the growth of the province's economy, the structure of the sector will have to change.
2.2 While agricultural output has expanded over the years, yields in the NWFP remain low relative to other agricultural producers (see Table 2.1).
Table 2.1: Yields of Key Agricultural Products, 2002 (Tonnes per Hectare)
Crop NWFP Pakistani Punjab Indian Punjab Egypt
Wheat 4.5 6.2 Irrigated 1.8 2.6 Un-irrigated 0.6 0.8
Rice-fine (paddy) 1.8 2.5 - - Rice-coarse (paddy) 2.6 3.3 5.3 9.4 Cotton (phutti) 1.3 1.8 1.3 2.8 Sugarcane 46.8 45.7 65.2 90.9 Maize 1.7 2.0 2.7 7.7 Gram 0.2 0.5 0.9 1.9 Rape & mustard 0.5 1.0 1.2 Tomato 10.3 13.7 - 35.1 Potato 12.8 17.0 20.0 23.8 Apple 12.3 9.0 - - Source: Government of Pakistan, Crops Area Production (2004), Punjab Agricultural Report (2004). Note: Data for NWFP is annual average over 2000/01 - 2002/03. The NWFP cotton yield reported at 5.92 bales/ ha.
A. RECENT AGRICULTURAL PERFORMANCE 2.3 Overall growth rates in agriculture have been low, and occasionally negative, reflecting the dependence on rains (and the drought of the late 1990s). The composition of growth within the agricultural sector slowly changed over the last two decades. The contribution of crops to GDP has decreased, particularly for major crops (i.e. cereals), while that of livestock has increased. See Table 2.2.
11 Agricultural statistics are available, but their reliability must always be assessed. Official estimates of provincial GDP are not available. The data quoted here and used throughout the report is derived from a GDP estimation exercise involving officials and Bank staff. Crop production and yield statistics, taken from provincial and national sources are also subject to discrepancies, and the data should be treated as suggestive. 12 The cultivable area times the cropping intensity.
15
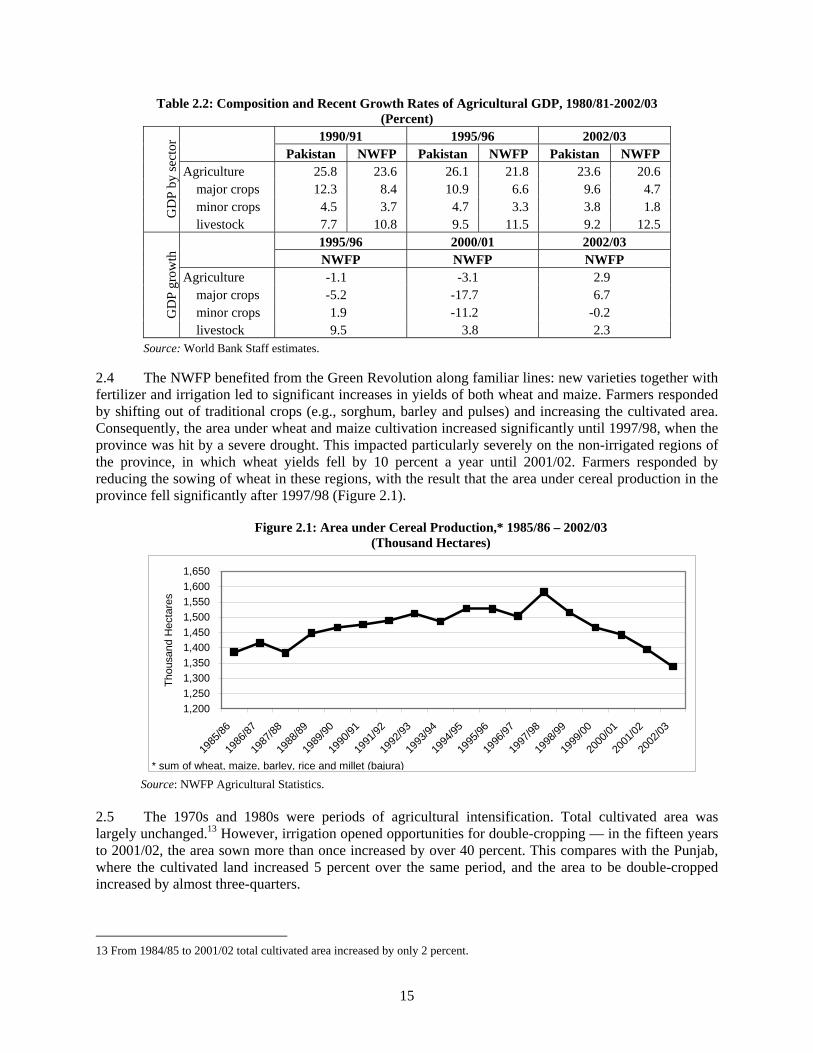
Table 2.2: Composition and Recent Growth Rates of Agricultural GDP, 1980/81-2002/03 (Percent)
1990/91 1995/96 2002/03 Pakistan NWFP Pakistan NWFP Pakistan NWFP
Agriculture 25.8 23.6 26.1 21.8 23.6 20.6 major crops 12.3 8.4 10.9 6.6 9.6 4.7 minor crops 4.5 3.7 4.7 3.3 3.8 1.8 G
DP
by se
ctor
livestock 7.7 10.8 9.5 11.5 9.2 12.5 1995/96 2000/01 2002/03
NWFP NWFP NWFP Agriculture -1.1 -3.1 2.9 major crops -5.2 -17.7 6.7 minor crops 1.9 -11.2 -0.2 G
DP
grow
th
livestock 9.5 3.8 2.3 Source: World Bank Staff estimates.
2.4 The NWFP benefited from the Green Revolution along familiar lines: new varieties together with fertilizer and irrigation led to significant increases in yields of both wheat and maize. Farmers responded by shifting out of traditional crops (e.g., sorghum, barley and pulses) and increasing the cultivated area. Consequently, the area under wheat and maize cultivation increased significantly until 1997/98, when the province was hit by a severe drought. This impacted particularly severely on the non-irrigated regions of the province, in which wheat yields fell by 10 percent a year until 2001/02. Farmers responded by reducing the sowing of wheat in these regions, with the result that the area under cereal production in the province fell significantly after 1997/98 (Figure 2.1).
Figure 2.1: Area under Cereal Production,* 1985/86 – 2002/03 (Thousand Hectares)
1,2001,2501,3001,3501,4001,4501,5001,5501,6001,650
1985
/86
1986
/87
1987
/88
1988
/89
1989
/90
1990
/91
1991
/92
1992
/93
1993
/94
1994
/95
1995
/96
1996
/97
1997
/98
1998
/99
1999
/00
2000
/01
2001
/02
2002
/03
Thou
sand
Hec
tare
s
* sum of wheat, maize, barley, rice and millet (bajura) Source: NWFP Agricultural Statistics. 2.5 The 1970s and 1980s were periods of agricultural intensification. Total cultivated area was largely unchanged.13 However, irrigation opened opportunities for double-cropping — in the fifteen years to 2001/02, the area sown more than once increased by over 40 percent. This compares with the Punjab, where the cultivated land increased 5 percent over the same period, and the area to be double-cropped increased by almost three-quarters.
13 From 1984/85 to 2001/02 total cultivated area increased by only 2 percent.

16
Box 2.1: The ‘Ladder’ of Diversification
There is a systematic progression within horticulture with farmers initially diversifying into apples, with more sophisticated fruit growing following thereafter as more experience is gained. Discussions with growers suggested that farmers who moved first into apple orchards are the first movers into peaches, suggesting a particularly strong opportunity not only for these farmers but for others to replace them in a ‘ladder of diversification’.
Figure 2.2: Fruit Production in the NWFP, 1985/86 – 2002/03 (Thousand Tonnes)
0
20
40
60
80
100
120
140
1985
/86
1986
/87
1987
/88
1988
/89
1989
/90
1990
/91
1991
/92
1992
/93
1993
/94
1994
/95
1995
/96
1996
/97
1997
/98
1998
/99
1999
/00
2000
/01
2001
/02
2002
/03
1,00
0 to
nnes
pear plum peach apple apricot
2.6 Irrigation was key to farmers’ ability to utilize advances in technology and to maintain production and hence incomes in periods of drought. Yet the extent of irrigation varies significantly across the NWFP, worsening the already severe regional differentials in agricultural livelihoods. In half of the districts more than 50 percent of their agricultural land remains unirrigated.
2.7 Across the province, fruit production has increased significantly up to 2002/03, largely due to support in research, extension and marketing provided by the Swiss-funded Project for Horticultural Promotion (PHP)14. Apple production was already significant in the NWFP, but increased further during the decade to 2002/03 at an annual rate of over 4 percent of which yield growth and acreage contributed about equal shares. Peach production has grown by an average of over 14 percent p.a. over the period, with spectacular increases in recent years (Figure 2.2).15 There is a clear sequence to diversification (Box 1).
Source: NWFP Agricultural Statistics.
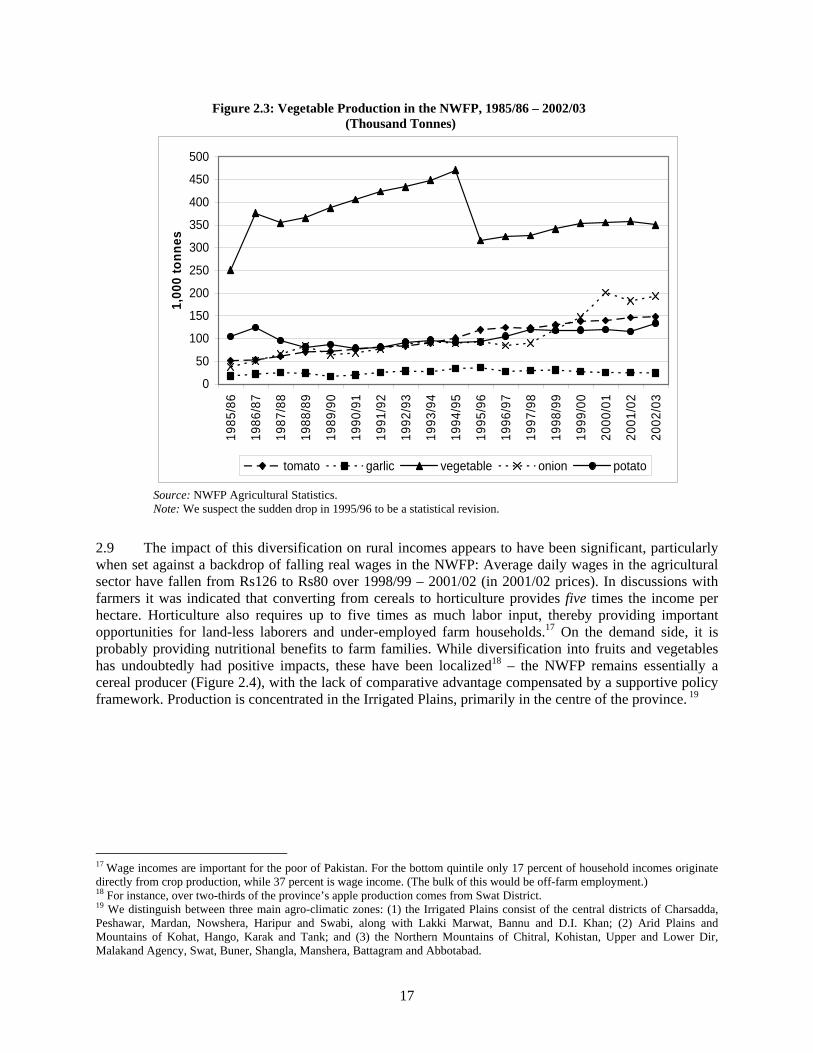
2.8 Farmers in the NWFP have also diversified into vegetable production. As shown in Figure 2.3, production of vegetables increased consistently over the decade after 1985/86.16 Again, the increase in production is driven largely by an increase in area sown, rather than yield growth. The exception is onions, where acreage grew by 6 percent a year while production increased by 11 percent per annum.
14 The Project for Horticultural Promotion (PHP) was a Swiss-funded agricultural diversification project that worked primarily in the Swat Valley. Most stakeholders attributed the growth of horticulture in the region to project interventions. 15 Of the remaining fruit products, apricot production has grown ay 2.48 percent p.a., pear at 0.05 percent p.a., and plum by 1.05 percent. 16 We suspect the fall in 1995 to be a statistical revision. These data need to be treated with some caution.
17
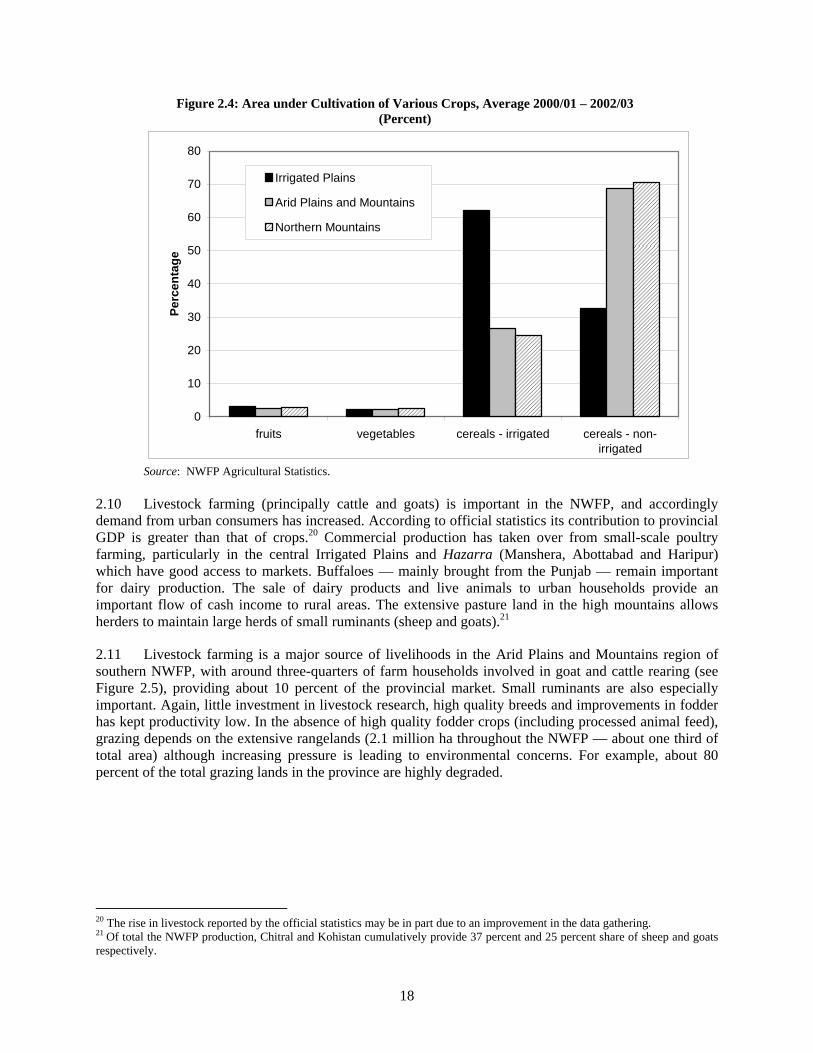
2.9 The impact of this diversification on rural incomes appears to have been significant, particularly when set against a backdrop of falling real wages in the NWFP: Average daily wages in the agricultural sector have fallen from Rs126 to Rs80 over 1998/99 – 2001/02 (in 2001/02 prices). In discussions with farmers it was indicated that converting from cereals to horticulture provides five times the income per hectare. Horticulture also requires up to five times as much labor input, thereby providing important opportunities for land-less laborers and under-employed farm households.17 On the demand side, it is probably providing nutritional benefits to farm families. While diversification into fruits and vegetables has undoubtedly had positive impacts, these have been localized18 – the NWFP remains essentially a cereal producer (Figure 2.4), with the lack of comparative advantage compensated by a supportive policy framework. Production is concentrated in the Irrigated Plains, primarily in the centre of the province. 19
17 Wage incomes are important for the poor of Pakistan. For the bottom quintile only 17 percent of household incomes originate directly from crop production, while 37 percent is wage income. (The bulk of this would be off-farm employment.)
18 For instance, over two-thirds of the province’s apple production comes from Swat District. 19 We distinguish between three main agro-climatic zones: (1) the Irrigated Plains consist of the central districts of Charsadda, Peshawar, Mardan, Nowshera, Haripur and Swabi, along with Lakki Marwat, Bannu and D.I. Khan; (2) Arid Plains and Mountains of Kohat, Hango, Karak and Tank; and (3) the Northern Mountains of Chitral, Kohistan, Upper and Lower Dir, Malakand Agency, Swat, Buner, Shangla, Manshera, Battagram and Abbotabad.
Figure 2.3: Vegetable Production in the NWFP, 1985/86 – 2002/03 (Thousand Tonnes)
0
50
100
150
200
250
300
350
400
450
500
1985
/86
1986
/87
1987
/88
1988
/89
1989
/90
1990
/91
1991
/92
1992
/93
1993
/94
1994
/95
1995
/96
1996
/97
1997
/98
1998
/99
1999
/00
2000
/01
2001
/02
2002
/03
1,00
0 to
nnes
tomato garlic vegetable onion potato
Source: NWFP Agricultural Statistics. Note: We suspect the sudden drop in 1995/96 to be a statistical revision.
18
Figure 2.4: Area under Cultivation of Various Crops, Average 2000/01 – 2002/03 (Percent)
0
10
20
30
40
50
60
70
80
fruits vegetables cereals - irrigated cereals - non-irrigated
Perc
enta
geIrrigated Plains
Arid Plains and Mountains
Northern Mountains
Source: NWFP Agricultural Statistics.
2.10 Livestock farming (principally cattle and goats) is important in the NWFP, and accordingly demand from urban consumers has increased. According to official statistics its contribution to provincial GDP is greater than that of crops.20 Commercial production has taken over from small-scale poultry farming, particularly in the central Irrigated Plains and Hazarra (Manshera, Abottabad and Haripur) which have good access to markets. Buffaloes — mainly brought from the Punjab — remain important for dairy production. The sale of dairy products and live animals to urban households provide an important flow of cash income to rural areas. The extensive pasture land in the high mountains allows herders to maintain large herds of small ruminants (sheep and goats).21
2.11 Livestock farming is a major source of livelihoods in the Arid Plains and Mountains region of southern NWFP, with around three-quarters of farm households involved in goat and cattle rearing (see Figure 2.5), providing about 10 percent of the provincial market. Small ruminants are also especially important. Again, little investment in livestock research, high quality breeds and improvements in fodder has kept productivity low. In the absence of high quality fodder crops (including processed animal feed), grazing depends on the extensive rangelands (2.1 million ha throughout the NWFP — about one third of total area) although increasing pressure is leading to environmental concerns. For example, about 80 percent of the total grazing lands in the province are highly degraded.
20 The rise in livestock reported by the official statistics may be in part due to an improvement in the data gathering. 21 Of total the NWFP production, Chitral and Kohistan cumulatively provide 37 percent and 25 percent share of sheep and goats respectively.

19
2.12 An increasing number of farmers are also engaging in agro-forestry. Tree nurseries are being encouraged through reforestation efforts, and a number of private nurseries have been established to meet the demand for saplings. Similarly, the high demand for timber, particularly from match producers, is encouraging farm forestry. In Mardan and Swat, for instance, farm forestry involving the planting of poplars on the edges of fields and along water courses is providing as much as 20 - 40 percent of total farm income.
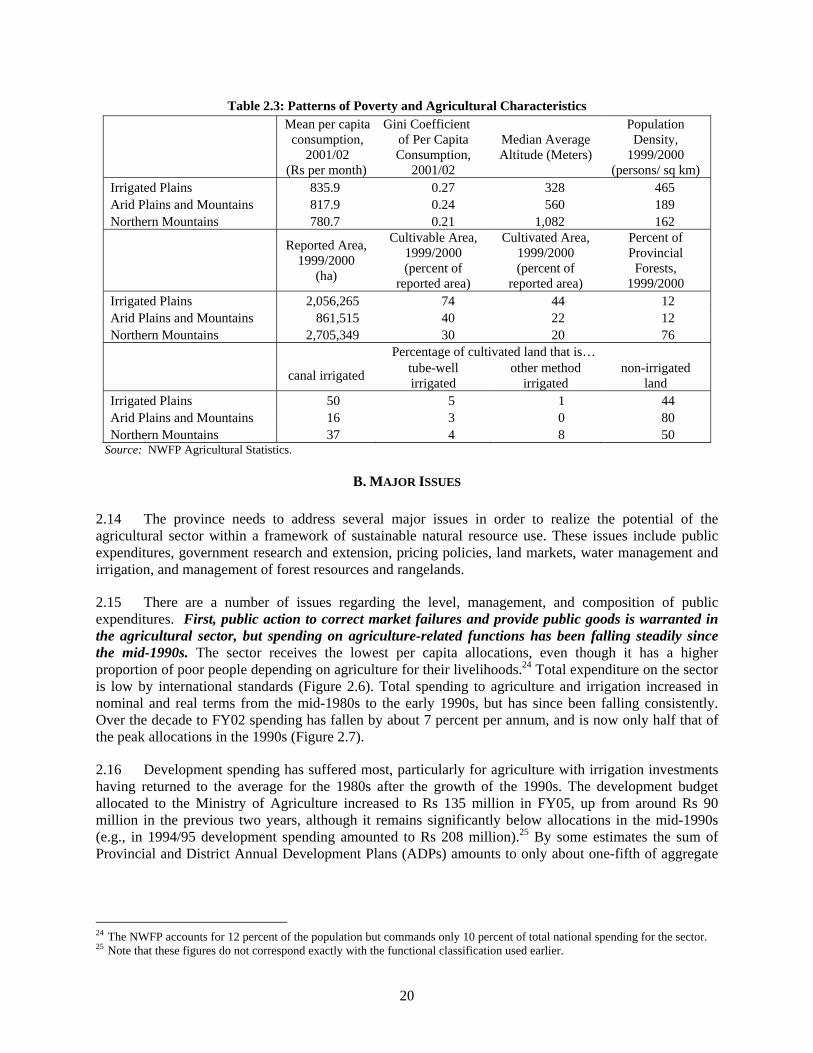
2.13 Agricultural growth is probably the most effective mechanism for poverty reduction, and increasing yields is likely to be a major driver in the NWFP as elsewhere in the region.22 Yield differences between the regions are stark: yields of the Arid Plains and Mountains are only half that of the Irrigated Plains in wheat, and two-thirds for maize. Available data suggests a correlation between poverty levels across the three agro-climatic regions and agricultural characteristics (Table 2.3).23
22 Across South Asia as a whole the elasticity of poverty reduction to changes in yield is estimated to be 0.48 (Thirtle et al, 2002). 23 These figures should be considered as indicative only.
Figure 2.5: Farm Households Engaged in Livestock Production, 2000 (Percent of Farm Households)
0
10
20
30
40
50
60
70
80
90
sheep goats cattle buffalo
Perc
enta
ge
Irrigated Plains Northern Mountains Arid Plains and Mountains
Source: Agricultural Census 2000.
20
Table 2.3: Patterns of Poverty and Agricultural Characteristics
Mean per capita consumption,
2001/02 (Rs per month)
Gini Coefficient of Per Capita Consumption,
2001/02
Median Average Altitude (Meters)
Population Density,
1999/2000 (persons/ sq km)
Irrigated Plains 835.9 0.27 328 465 Arid Plains and Mountains 817.9 0.24 560 189 Northern Mountains 780.7 0.21 1,082 162
Reported Area,
1999/2000 (ha)
Cultivable Area, 1999/2000 (percent of
reported area)
Cultivated Area, 1999/2000 (percent of
reported area)
Percent of Provincial Forests,
1999/2000 Irrigated Plains 2,056,265 74 44 12 Arid Plains and Mountains 861,515 40 22 12 Northern Mountains 2,705,349 30 20 76
Percentage of cultivated land that is…
canal irrigated tube-well irrigated
other method irrigated
non-irrigated land
Irrigated Plains 50 5 1 44 Arid Plains and Mountains 16 3 0 80 Northern Mountains 37 4 8 50
Source: NWFP Agricultural Statistics.
B. MAJOR ISSUES 2.14 The province needs to address several major issues in order to realize the potential of the agricultural sector within a framework of sustainable natural resource use. These issues include public expenditures, government research and extension, pricing policies, land markets, water management and irrigation, and management of forest resources and rangelands.
2.15 There are a number of issues regarding the level, management, and composition of public expenditures. First, public action to correct market failures and provide public goods is warranted in the agricultural sector, but spending on agriculture-related functions has been falling steadily since the mid-1990s. The sector receives the lowest per capita allocations, even though it has a higher proportion of poor people depending on agriculture for their livelihoods.24 Total expenditure on the sector is low by international standards (Figure 2.6). Total spending to agriculture and irrigation increased in nominal and real terms from the mid-1980s to the early 1990s, but has since been falling consistently. Over the decade to FY02 spending has fallen by about 7 percent per annum, and is now only half that of the peak allocations in the 1990s (Figure 2.7).
2.16 Development spending has suffered most, particularly for agriculture with irrigation investments having returned to the average for the 1980s after the growth of the 1990s. The development budget allocated to the Ministry of Agriculture increased to Rs 135 million in FY05, up from around Rs 90 million in the previous two years, although it remains significantly below allocations in the mid-1990s (e.g., in 1994/95 development spending amounted to Rs 208 million).25 By some estimates the sum of Provincial and District Annual Development Plans (ADPs) amounts to only about one-fifth of aggregate
24 The NWFP accounts for 12 percent of the population but commands only 10 percent of total national spending for the sector. 25 Note that these figures do not correspond exactly with the functional classification used earlier.

21
spending.26 Agriculture appears to have a low priority particularly at the District level, receiving at most token allocations.27
Figure 2.6: Public Expenditures in Agriculture (Percent of Agricultural GDP)
0
2
4
6
8
10
12
14
NWFPNepalAll PakistanBangladeshIndiaThailand
Source: Fan and Rao (2003) and World Bank Staff estimates. Expenditures include irrigation.
Figure 2.7: Trends in Agriculture Sector Spending (Constant 1981 Prices and Percent)
050
100150200250300350400450500
1984
/85
1985
/86
1986
/87
1987
/88
1988
/89
1989
/90
1990
/91
1991
/92
1992
/93
1993
/94
1994
/95
1995
/96
1996
/97
1997
/98
1998
/99
1999
/00
2000
/01
2001
/02
1981
Rs
Milli
on
0
0
0
0
0
0
0
0
0
Total Agriculture Spending (1981 Rs million) Left-hand scaleTotal Agriculture Spending (% of Public Expenditure) Right-hand scale
Source: World Bank Staff estimates. Data excludes irrigation.
26 Sectoral breakdowns of individual district ADPs are not published. The analysis was derived from a sub-sample of three districts for which such data were provided to the Mission. 27 There was virtual unanimity of view among District-based officials consulted by the Mission.
22
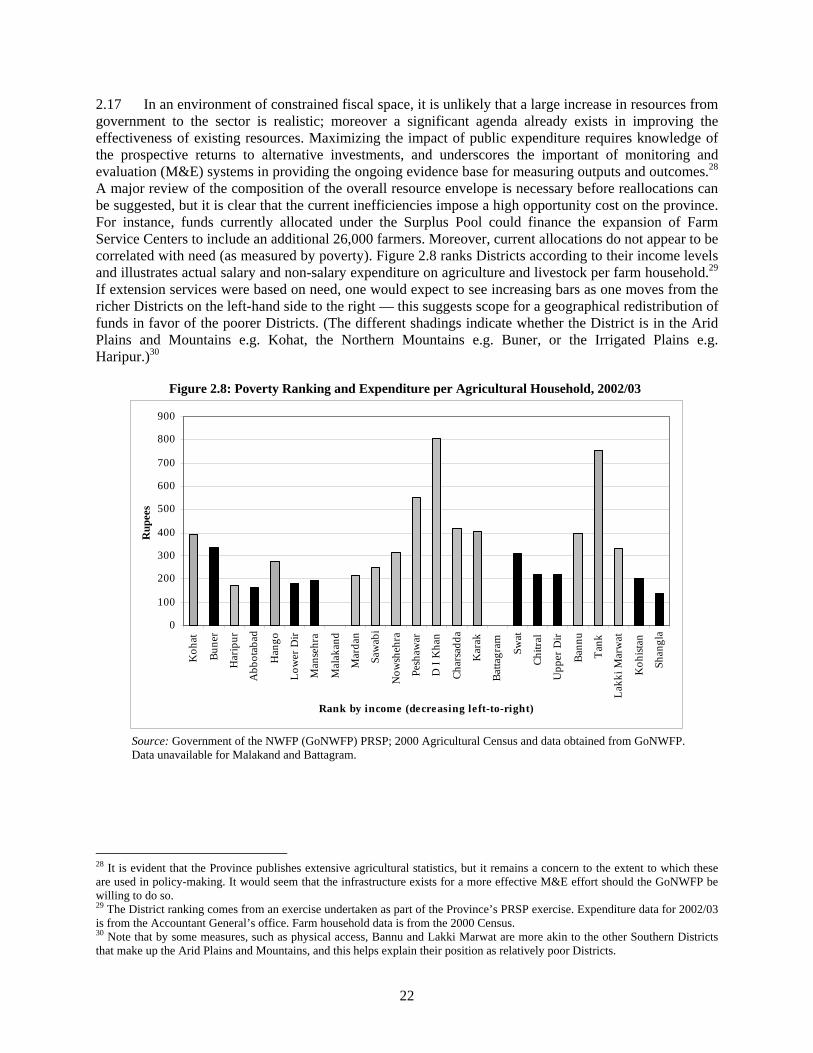
2.17 In an environment of constrained fiscal space, it is unlikely that a large increase in resources from government to the sector is realistic; moreover a significant agenda already exists in improving the effectiveness of existing resources. Maximizing the impact of public expenditure requires knowledge of the prospective returns to alternative investments, and underscores the important of monitoring and evaluation (M&E) systems in providing the ongoing evidence base for measuring outputs and outcomes.28 A major review of the composition of the overall resource envelope is necessary before reallocations can be suggested, but it is clear that the current inefficiencies impose a high opportunity cost on the province. For instance, funds currently allocated under the Surplus Pool could finance the expansion of Farm Service Centers to include an additional 26,000 farmers. Moreover, current allocations do not appear to be correlated with need (as measured by poverty). Figure 2.8 ranks Districts according to their income levels and illustrates actual salary and non-salary expenditure on agriculture and livestock per farm household.29 If extension services were based on need, one would expect to see increasing bars as one moves from the richer Districts on the left-hand side to the right — this suggests scope for a geographical redistribution of funds in favor of the poorer Districts. (The different shadings indicate whether the District is in the Arid Plains and Mountains e.g. Kohat, the Northern Mountains e.g. Buner, or the Irrigated Plains e.g. Haripur.)30
Figure 2.8: Poverty Ranking and Expenditure per Agricultural Household, 2002/03
0
100
200
300
400
500
600
700
800
900
Koh
at
Bune
r
Har
ipur
Abb
otab
ad
Han
go
Low
er D
ir
Man
sehr
a
Mal
akan
d
Mar
dan
Saw
abi
Now
sheh
ra
Pesh
awar
D I
Kha
n
Char
sadd
a
Kar
ak
Batta
gram Sw
at
Chitr
al
Upp
er D
ir
Bann
u
Tank
Lakk
i Mar
wat
Koh
istan
Shan
gla
Rank by income (decreasing left-to-right)
Rup
ees
Source: Government of the NWFP (GoNWFP) PRSP; 2000 Agricultural Census and data obtained from GoNWFP. Data unavailable for Malakand and Battagram.
28 It is evident that the Province publishes extensive agricultural statistics, but it remains a concern to the extent to which these are used in policy-making. It would seem that the infrastructure exists for a more effective M&E effort should the GoNWFP be willing to do so. 29 The District ranking comes from an exercise undertaken as part of the Province’s PRSP exercise. Expenditure data for 2002/03 is from the Accountant General’s office. Farm household data is from the 2000 Census. 30 Note that by some measures, such as physical access, Bannu and Lakki Marwat are more akin to the other Southern Districts that make up the Arid Plains and Mountains, and this helps explain their position as relatively poor Districts.

23
2.18 Second, the budgetary and expenditure control systems suffer from weaknesses. These deficiencies are common to many countries and not unique to the agricultural sector (see Chapter 5). The GoNWFP has started to address these through a reform program that will help introduce technical improvements to the public financial management regime. However, a number of inefficiencies are behavioral, rather than technical (e.g. robust budget ceilings), and it is essential to provide strong political commitment to expenditure control and efficient allocation.
2.19 Faced with political pressure to ‘do more’ budgets are often over-ambitious. This leads to mid-term corrections, creating inefficiencies with redundant staff lacking resources to undertake activities (e.g. salaries cannot be cut and thus the burden often falls on operations and maintenance (O&M) expenditures).31 Cash management can slow expenditure releases, delaying activities. The Mission learned of instances where the allocations for agricultural extension demonstration plots were so delayed that they missed the planting season, thus rendering this intervention useless. Often lessons are not learnt, and subsequent years’ allocations remain unrealistic while revised budget figures continue to fall short of allocations.32 The volatility in actual releases creates uncertainty and limits both strategic and operational planning.
2.20 Third, expenditures remain highly centralized, and salaries take up a large proportion of expenditures. Under the 2001 the NWFP Local Government Ordinance (LGO), responsibility for agriculture, amongst other sectors, was devolved to the province’s 24 districts. Yet the provincial government retains control of a large share of expenditure; for example, the share of provincial-level expenditure was 57 percent and 41 percent in the Agriculture and Livestock departments respectively. Further analysis suggests that these figures exaggerate the extent of managerial devolution to the district. First, resources barely cover establishment costs. Staff implements activities for which complementary O&M resources are available, but these tend to be centrally managed. Subtracting the transfers to the Agricultural University, salaries and allowances account for 44 percent of the total Regular budget of the Agriculture Department, and 64 percent of the Livestock Department. Second, a major source of establishment costs is the Provincial ADP. As such, the ADP allocations overstate the extent of investment spending in the sector.
2.21 Moreover, the data for three districts provided to the Mission suggest that salaries take up a large proportion of expenditures and that very little remains for O&M (in the case of the Regular budget) or for investment (in the case of ADPs). While international benchmarks suggest a ratio of salary to operational expenditure of 60:40 (i.e. 1.5:1), data from the Accountant General on actual expenditures by district for FY03 shows ratios for salary to non-salary costs of at least 3:1 and up to 32:1 for the Agriculture and Livestock departments.33
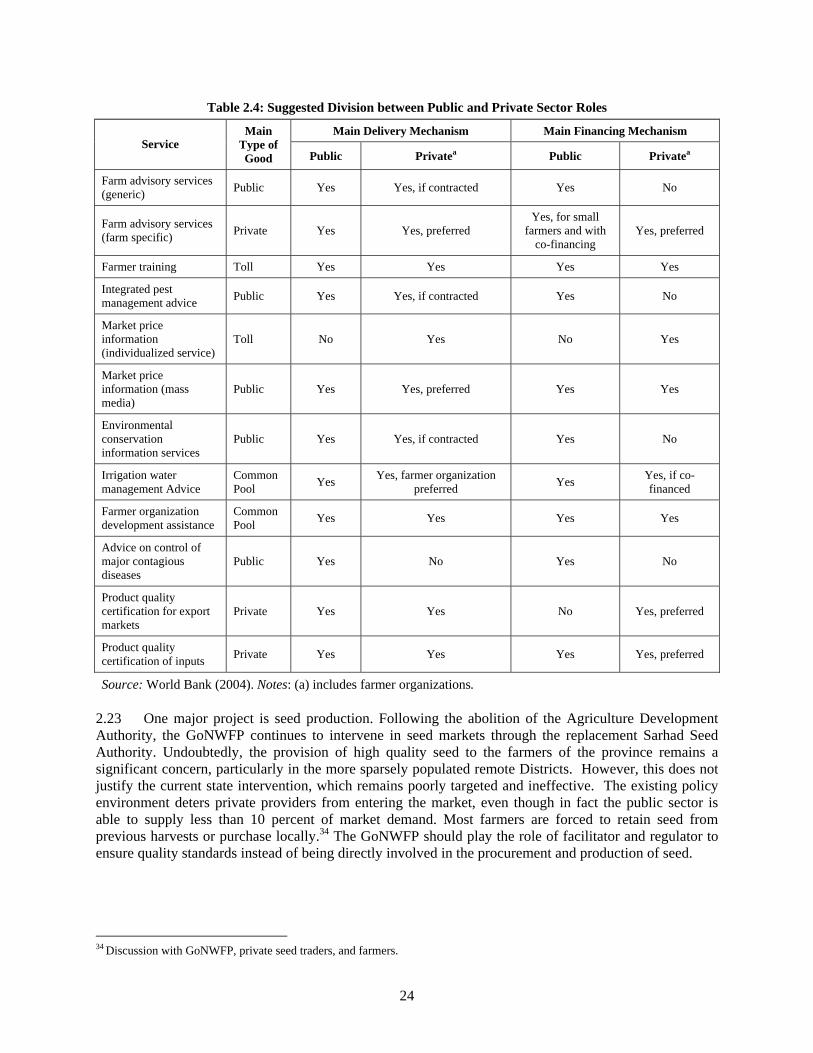
2.22 In view of the province’s limited resources, the mix between public and private roles needs to be reexamined and redefined. With limited fiscal space, and salaries and allowances taking such a high proportion of Regular Budget, it is particularly important to allocate public funding toward services justified on genuine public good grounds, with remaining functions left to the private or NGO sector. Table 2.4 provides a guide as to those activities warranting public intervention (funding and/or implementation) and others for which the government should play a facilitating role.
31 For example, during FY03/04 District allocations in the Department of Forestry to some districts were cut by 86 percent, while other districts had their allocations increased by more than half. 32 For example: the Revolving Fund to Animal Husbandry was allocated Rs 5 million in FY2003/04 yet received nothing. Again, in FY 2004/05 its allocation reverted to Rs 5 million. A similar outturn is expected. 33 Technically this is different to the benchmark ratio, since non-salary costs provided by the Accountant General include capital goods. In which case the ratios are even further from the international standards!
24
Table 2.4: Suggested Division between Public and Private Sector Roles
Main Delivery Mechanism Main Financing Mechanism Service
Main Type of Good Public Privatea Public Privatea
Farm advisory services (generic) Public Yes Yes, if contracted Yes No
Farm advisory services (farm specific) Private Yes Yes, preferred
Yes, for small farmers and with
co-financing Yes, preferred
Farmer training Toll Yes Yes Yes Yes
Integrated pest management advice Public Yes Yes, if contracted Yes No
Market price information (individualized service)
Toll No Yes No Yes
Market price information (mass media)
Public Yes Yes, preferred Yes Yes
Environmental conservation information services
Public Yes Yes, if contracted Yes No
Irrigation water management Advice
Common Pool Yes Yes, farmer organization
preferred Yes Yes, if co-financed
Farmer organization development assistance
Common Pool Yes Yes Yes Yes
Advice on control of major contagious diseases
Public Yes No Yes No
Product quality certification for export markets
Private Yes Yes No Yes, preferred
Product quality certification of inputs Private Yes Yes Yes Yes, preferred
Source: World Bank (2004). Notes: (a) includes farmer organizations. 2.23 One major project is seed production. Following the abolition of the Agriculture Development Authority, the GoNWFP continues to intervene in seed markets through the replacement Sarhad Seed Authority. Undoubtedly, the provision of high quality seed to the farmers of the province remains a significant concern, particularly in the more sparsely populated remote Districts. However, this does not justify the current state intervention, which remains poorly targeted and ineffective. The existing policy environment deters private providers from entering the market, even though in fact the public sector is able to supply less than 10 percent of market demand. Most farmers are forced to retain seed from previous harvests or purchase locally.34 The GoNWFP should play the role of facilitator and regulator to ensure quality standards instead of being directly involved in the procurement and production of seed.
34 Discussion with GoNWFP, private seed traders, and farmers.

25
2.24 More generally, the emphasis on the provision of seed is a symptom of a wider preoccupation within Government on the supply of agricultural inputs. Commodity provision by the public sector is a major drain on Government finances. This accounts for about one-fifth of the regular expenditures in agriculture and in livestock. It also occupies staff resources which could be better utilized elsewhere. This is detrimental to agricultural growth because a clear statement of intent by Government of public intervention deters private sector involvement. Fiscal constraints subsequently prevent these intentions being met, resulting in supply shortfalls with farmers facing no alternative sources for these inputs. This hinders both crop and livestock sectors.35
2.25 Research and extension services have generally failed to live up to expectations. A large hierarchical set-up of agricultural extension exists in the province under the Department of Agriculture. The approach of agricultural extension has remained top-down, focusing on crop-oriented high-yielding production technologies, mainly for traditional food crops such as wheat and maize. These production technologies have rarely benefited the predominantly resource-poor small farmers, particularly in the rain-fed districts. Even in the irrigated districts in the Northern Mountains and Irrigated Plains, farmers have diversified into high value horticulture and the focus on traditional crops is no longer relevant.
2.26 The current agricultural and livestock research system fails to deliver a relevant, science based knowledge outcomes for the sector. The existing institutional arrangements result in ambiguity in terms of overall responsibility for research, and frustration on the part of scientists, whose promotion is limited by the availability of suitable posts, and who are often at lower level than university professors of equivalent experience and qualifications. And even in the university system, promotion is based on seniority rather than performance, shortages of operating funds and appointment of research leaders based on seniority is stifling the creativity of the system. Although all stakeholders agree that the existing situation is untenable, returning agricultural research to the Department of Agriculture is not an option.
2.27 Such a solution should promote external contact with the global scientific community. Use of the internet and access to scientific literature is extremely limited, particularly at the field research stations and results in use of obsolescent science and technology in an age where access to modern technology is the basis for agricultural competitiveness. For example, tissue culture is now widely used in research and production of many fruits and vegetables, and molecular markers and molecular characterization are used in breeding research. Only tissue culture is used in the NWFP and only for potatoes. The existing stocks of plant genomes held by the research institutes are severely depleted and out of date.
2.28 It must also forge greater linkages between knowledge generation and knowledge dissemination, and between dissemination mechanisms and farmers. International best practice in agricultural extension (including livestock) emphasizes knowledge management and the importance of different and innovative mechanisms for knowledge transfer (including mass media and the internet). Yet with half the agricultural extension budget going on commodities and the other half on salaries, there is little left to fund such activities. International best practice also illustrates the importance of extension being responsive to farmers needs, yet there is evidence that public officials remain out of touch with the real constraints faced by farmers.36
35 The Government’s veterinary service meets only 10 percent of demand for key vaccines, including the four main bacterial diseases and one viral disease of economic significance. The shortfall at Provincial level noted in the previous paragraph is replicated at District level. For instance, in Karak District, the Government farm produced only 0.6 tonnes of wheat providing less than 1 percent of District demand. 36 This evidence comes from the reports of a stakeholder workshop funded by the EU’s Strengthening of Livestock Services project held in 2004. Five groups of stakeholders – farmers, field vets, research scientists, project development representatives and senior officers of the L&DD – were asked to identify constraints. There is a remarkable lack of consistency on the issues raised by each group. The one area of agreement was in the poor interaction between farmers and the Department. In general,

26
Box 2.2: Perceived Constraints to Cost Recovery Discussions with stakeholders suggested the possible reasons why private sector involvement was not more prevalent: • A strong perception amongst farmers that the state has a
responsibility to undertake specific functions (in part borne of a deep mistrust of the private sector) often matched with a sense of entitlement to such services;
• The relevant public institutions lack the capacity to provide the services, even on a cost-recovery basis, and even potentially viable enterprises require significant start-up investments;
• A concern that the governance environment is not sufficiently robust to encourage devolved responsibility for fiscal management.
2.29 Remedial action requires continued funding to update and maintain stocks of plant genomes to maintain the scientific asset base. In efforts to maximize the efficiency of research efforts, some counties have established competitive research grants overseen by a (semi-) autonomous institution. Successful approaches ensure that the needs of farmers are effectively represented in these evaluations to ensure that the research effort is relevant. And links are forged between the research community and extension service to provide for an integrated ‘knowledge management’ approach to research and extension.
2.30 The absence of (even partial) cost recovery denies opportunities for departmental revenue generation that would contribute to financial sustainability. Public delivery of some extension services may be justified with a degree of cost-sharing. Cost recovery has the benefit of: (i) avoiding over-consumption typically associated with free goods; and (ii) strengthening the financial foundations of service provision, while at the same time freeing up resources for use elsewhere in the sector. There are a number of reasons why cost recovery is currently viewed with some skepticism in the NWFP (Box 2.2).
2.31 Departmental revenue generation is deterred by existing financial regulations which require that all revenues generated by government activities be surrendered to the Ministry of Finance. Were departments permitted to retain at least a portion of revenues, this would create an internal incentive to increase revenue effort. This might apply at the sector level (for instance, the existing Forest Development Fund established under the new provincial forest policy) or at the level of each service unit (e.g. commercially-oriented artificial insemination centers that are run on similar lines to the already established autonomous hospitals under the Ministry of Health).
2.32 With appropriate incentives, cost recovery could lead to significant revenues. At present, receipts of the Animal Health Services in 2002/03 amounted to 17 percent of this year’s budget of the Livestock and Dairy Development Department.37 The Animal Husbandry in-service training generates revenues equivalent to 8 percent of its budget from training and other husbandry services.38 Cost sharing for services — as well as commodities — would help increase coverage as well as be a source of revenue for the Government.39
2.33 The institutional framework is insufficiently robust to support effective government intervention and support in the agricultural sector. The Ministry of Agriculture, Livestock and Cooperation is responsible for agricultural policy and public interventions in the sector. Effective public support to the agricultural sector requires a robust institutional framework. In particular, there needs to be an efficient civil service with appropriate incentives for staff, including merit-based appointment and promotion systems, and the right balance between managerial, technical and administrative staff.
public officials maintained a top-down and patronizing perspective, while farmers expressed frustration with the absence of a few non-market inputs including technical information upon which to base decisions. 37 The total recurrent budget of L&DD Department, excluding the grant to the University and veterinary research and disease investigation, amounts to Rs 35 million. Revenues amounted to Rs 6 million. 38 In FY03/04 revenues of Rs 0.24 million were obtained against a budget allocation of Rs 3.48 million. 39 Artificial insemination extension services only reach 10 percent of the current head of cattle.
27
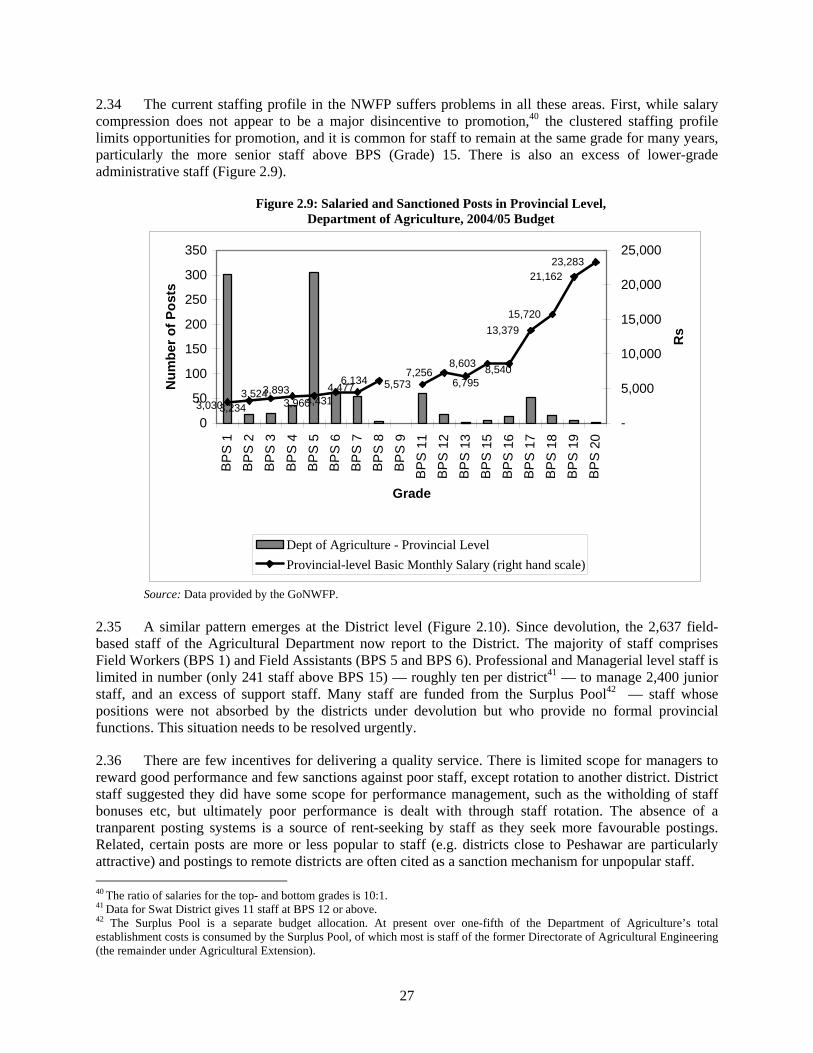
2.34 The current staffing profile in the NWFP suffers problems in all these areas. First, while salary compression does not appear to be a major disincentive to promotion,40 the clustered staffing profile limits opportunities for promotion, and it is common for staff to remain at the same grade for many years, particularly the more senior staff above BPS (Grade) 15. There is also an excess of lower-grade administrative staff (Figure 2.9).
Figure 2.9: Salaried and Sanctioned Posts in Provincial Level, Department of Agriculture, 2004/05 Budget
6,134 5,573
8,603
13,379
21,16223,283
6,7958,540
3,0303,2343,524
4,4314,477
3,9603,893
15,720
7,256
0
50
100
150
200
250
300
350
BPS
1BP
S 2
BPS
3BP
S 4
BPS
5BP
S 6
BPS
7BP
S 8
BPS
9BP
S 11
BPS
12BP
S 13
BPS
15BP
S 16
BPS
17BP
S 18
BPS
19BP
S 20
Grade
Num
ber o
f Pos
ts
-
5,000
10,000
15,000
20,000
25,000
Rs
Dept of Agriculture - Provincial LevelProvincial-level Basic Monthly Salary (right hand scale)
Source: Data provided by the GoNWFP.
2.35 A similar pattern emerges at the District level (Figure 2.10). Since devolution, the 2,637 field-based staff of the Agricultural Department now report to the District. The majority of staff comprises Field Workers (BPS 1) and Field Assistants (BPS 5 and BPS 6). Professional and Managerial level staff is limited in number (only 241 staff above BPS 15) — roughly ten per district41 — to manage 2,400 junior staff, and an excess of support staff. Many staff are funded from the Surplus Pool42 — staff whose positions were not absorbed by the districts under devolution but who provide no formal provincial functions. This situation needs to be resolved urgently.
2.36 There are few incentives for delivering a quality service. There is limited scope for managers to reward good performance and few sanctions against poor staff, except rotation to another district. District staff suggested they did have some scope for performance management, such as the witholding of staff bonuses etc, but ultimately poor performance is dealt with through staff rotation. The absence of a tranparent posting systems is a source of rent-seeking by staff as they seek more favourable postings. Related, certain posts are more or less popular to staff (e.g. districts close to Peshawar are particularly attractive) and postings to remote districts are often cited as a sanction mechanism for unpopular staff. 40 The ratio of salaries for the top- and bottom grades is 10:1. 41 Data for Swat District gives 11 staff at BPS 12 or above. 42 The Surplus Pool is a separate budget allocation. At present over one-fifth of the Department of Agriculture’s total establishment costs is consumed by the Surplus Pool, of which most is staff of the former Directorate of Agricultural Engineering (the remainder under Agricultural Extension).

28
Figure 2.10: Staffing Profile at District Level
Number of Staff at District Level of Agricultural Extension Department, 2004/05
-
200
400
600
800
1,000
1,200
BP
S 1
BP
S 2
BP
S 3
BP
S 4
BP
S 5
BP
S 6
BP
S 7
BP
S 8
BP
S 9
BP
S 1
1
BP
S 1
2
BP
S 1
3
BP
S 1
5
BP
S 1
6
BP
S 1
7
BP
S 1
8
BP
S 1
9
BP
S 2
0
Num
ber
of P
osts
Source: Data provided by the GoNWFP. Pricing Policies 2.37 A small number of existing price support policies have important effects on the agricultural sector in the NWFP and need to be remedied.
2.38 Wheat Policy and the NWFP: Wheat policy is the responsibility of the Federal government, with both Federal and Provincial procurement to maintain minimum prices. This price support sustains extensive wheat production in the province, and compensates for a lack of comparative advantage caused in part by small land holdings and relatively costly irrigation compared to other provinces. Even so, the NWFP produces only half of its wheat requirements (and this is declining as farmers diversify into horticulture). The remainder is imported from other provinces or from abroad. Imports from other provinces (in practice, mainly Punjab) provide a significant fiscal transfer from other provinces to the NWFP. The NWFP depends on the free movement of wheat into the province. However, this movement was disrupted in 2004, when the Punjab unilaterally imposed a ban on shipment of wheat out of the Punjab in efforts to meet its procurement target, despite the fact that wheat policy is a federal subject. This ban had serious consequences for the NWFP. The GoNWFP should seek concrete guarantees, agreed by all provinces, on the free movement of wheat across Provincial boundaries.
2.39 Sugarcane Pricing: The price of sugarcane and sugar beet is set by the GoNWFP through annual negotiations with the sugar mills and the growers. This price becomes a contract price for delivery to the mills. Since the price is set in terms of total sugarcane weight without regard to sugar content, it provides incentives for farmers to maximize total biomass through practices such as late application of nitrogen fertilizer, and reduces sugar yields to 8–9 percent of total cane biomass, well below world averages of about 11–12 percent. Although the technology exists to assess sugar content at delivery and is widely used in other developing countries, it has not been adopted in the NWFP (or elsewhere in Pakistan) despite years of discussion. This results in considerable inefficiency and waste in the sugar industry. The GoNWFP should urgently resolve the long standing discussion on pricing of sugarcane on the basis of sugar content, and require the testing of sugarcane quality at the mills.

29
2.40 Agricultural prices remain politically charged and negative price movements - high prices for consumers, low prices for producers - lead to loud protestations and demands for public action. Continued public intervention in even a small number of markets lends legitimacy to claims for intervention elsewhere, and the GoNWFP needs to establish a credible commitment to minimizing direct market interventions. For instance, wheat procurement should be constrained to the need to replenish strategic reserves. International experience shows that legitimate welfare objectives can be better achieved through alternative mechanisms (such as social safety-net programs to maintain nutritional consumption). Moreover, price controls are incompatible with other policy objectives. It is claimed that new market opportunities in neighboring countries are pushing up prices within the province, often on a very localized basis.43 These effects are best managed through efforts to improve the functioning of markets, assisting the price transmission mechanism and reducing transport and marketing costs. Other weaknesses in the market structure exist and will be remedied by recommendations made elsewhere in this report pertaining to increasing scope for value adding in the sector through private sector investment. For instance, the small number of sugarcane millers (only five in the NWFP) and tobacco processors (less than twenty, with two companies accounting for 96 percent of the market) reinforces the perception that markets are manipulated to the disadvantage of farmers.44 The increasing use of contract farming arrangements is evidence of a new, more equitable and mutually beneficial arrangement between many small-scale producers and commercial processors, and their applicability in the NWFP warrants greater attention.
Land Markets, Water Management and Irrigation 2.41 Constraints in land markets and in the availability of irrigation result in small holdings, poor access to credit and farmers remaining vulnerable to the vagaries of the weather. According to World Bank staff estimates, 57 percent of the population is close to the poverty line,45 indicating severe vulnerability of the non-poor falling into poverty and precarious position who do manage to make it above the poverty line. Coping with risk — especially weather-induced risk — is therefore a major preoccupation of the NWFP’s rural population. Although statistics vary significantly across Districts, in general the availability of irrigation is low. Although public irrigation schemes charge a user fee (abiana) which is high by regional standards, revenues are decreasing46 and many schemes continue to fall into disrepair through insufficient maintenance. Recent expenditure on irrigation has put too much emphasis on new schemes with insufficient attention to the recurrent financing of O&M. (Of particular concern is the O&M of the lift irrigation system, which is exceptionally high and requires a far greater subsidy than the other systems.) As the irrigation systems get older the demand for O&M will increase further, limiting resources for an expansion of the system to the 4.33 million acres that remain rain-fed – extension that is essential to increase productivity of cereals and permit diversification into higher value products.
2.42 The efficiency of water management is low. In areas irrigated by government and civil canals, close to 60 percent of the water available at the canal heads is lost to evaporation, theft or seepage before it reaches the crops in the farmers’ fields. Although fresh ground water seepages could in principle be recovered through tube-well irrigation, in practice this could be difficult because (i) of contamination with saline water and (ii) it may be uneconomic to pump, as ground water is being depleted due to the unregulated use of tube wells. Areas that use flow irrigation seem to have more than adequate water and there is no effort to limit irrigation methods and practices that are wasteful. Practices such as flood irrigation are contributing to serious drainage problems and water logging. Modern technologies that are used to conserve water are rarely applied, nor are practices that improve distribution efficiency and 43 For example, it is estimated that up to 1 million tons of flour already flow to Afghanistan. 44 For example, since processing of sugar must occur a short time after harvesting, it is believed that sugar millers delay the start of processing to ensure farmers are desperate to sell there harvest at low prices. 45 Defined as within 75 percent and 125 percent of the Basic Needs poverty line. 46 The ratio of abiana collections to assessed rates fell from 75 percent in 1999/00 to 50 percent in 2002/03, although this has recovered marginally since.

30
conserve water. Although the National Drainage Program (NDP) is closed, the direction of reform initiated by this program needs to be maintained. Both Punjab and Sindh are doing so by moving forward on institutional reforms to Area Water Boards (AWBs) and to their provincial irrigation departments, and GoNWFP should consider following suit. In addition, farmer organizations should take increasing responsibility for irrigation through Drainage Management Transfer Agreements. This function could be incorporated into the revised remit of Farmer Service Centers. The Water Sector Task Force to be established later this year will be important to set out the medium-term direction of change.
2.43 Land holdings are in general small (79 percent of farms are of less than 5 acres), and an inefficient land market prevents expansion and consolidation of these holdings into larger units.47 The land administration system lacks transparency, resulting in greater bureaucratic intervention and legal impediments to the sale and purchase of land. Officials responsible for land records (known as patwaris) maintain control over information through the use of peculiar numbering, signs, and symbols system they employ which make it difficult for outsiders to read land documents. Ineffective monitoring and control of the land registration and administration system encourages manipulation of the records, particularly, at the patwar circle level. And the increasing workload resulting from increasing subdivision of holdings and population growth has made revenue records unmanageable. GoNWFP is improving land titling and these efforts need to continue.
2.44 Lack of tenure security constrains not only the land markets but also the use of land as collateral to access credit. Existing land records do not provide conclusive proof of ownership. Illegal annotations are possible, making room for exploitation and bribery. Nor are records unambiguously correlated with spatial data to perfectly identify the plot. The existing legal framework governing land transactions restricts speedy resolution of disputes.
2.45 Social conventions such as inheritance practices and the social status provided by being a landowner encourage land fragmentation. The social value of landholding exceeds the economic value, resulting in inefficiencies. As in many low-income countries, previous efforts at land consolidation in the past have failed. The lack of efficient land markets restricts land consolidation through land purchases, particularly if this is to be funded by borrowing. Recent data suggests that a degree of land consolidation has occurred since 1998/99 and 2000/01, although there is evidence that this was motivated by distress sales due to drought.48 This shift in land holdings has been associated with rising poverty, further emphasizing that the nexus of land holding, agricultural efficiency and poverty is a complex one.
2.46 The province lacks a coherent policy for managing its forest resources and rangelands. The NWFP contains 40 percent of Pakistan’s forests (of which three-quarters are in the Northern Mountains) and about 2.1 million hectares of rangelands. However, the policy framework for the conservation and sustainable exploitation of these resources lacks coherence. Monopoly control by government over protected areas, poor land use rights and insufficient institutional arrangements and capacities are the main constraints to natural resource conservation in mountain areas.
2.47 The national-level forest policy environment lacks clarity regarding functions and responsibilities of national, provincial, local governments and particularly communities in planning, implementing and enforcing laws on natural resource utilization and conservation. Forest policies and laws introduced in the nineteenth century are still in place today. These policies focus on centralized management operations, emphasizing natural forests for timber harvesting and advocating government control over local needs. While several revisions were made after the first forest policy in 1955, these revisions still focused on 47 However, recent data suggests some land agglomeration. 48 For example, the 58 percent of the population of the NWFP with no land accounted for 70 percent of the population in the bottom quintile of income. The proportion of the population with holdings of less than 1 ha fell, while those with no land, and holdings above 1 ha, both rose.
31
technical forest protection and productivity, with little regard for the rights and participation of local people).
2.48 The National Conservation Strategy (NCS) has helped put in place a more suitable institutional framework and created awareness on natural resource conservation. The NCS has also helped in initiating consultative processes for achieving its goal of sustainable natural resource management at various levels, including the development of a provincial conservation strategy for the NWFP. However, the NCS has not been very effective in reaching the grass roots level in order to implement sustainable development and participatory management of natural resources.
2.49 Rangelands have been neglected in government policy. Responsibility for rangelands currently falls to the forestry department. The few public interventions that have occurred have failed to fully integrate the competing demands of conservation on the one hand, with the need to develop an economic asset to promote sustainable livestock grazing on the other. The result is that the sustainable management of range lands receives low priority; what is required is an effective policy process in which trade-offs can be made between these competing demands.
C. BROAD STRATEGY AND KEY RECOMMENDATIONS 2.50 The NWFP needs to move away from an emphasis on food self-sufficiency towards one that ensures consistent and secure access to food for its population. In view of the recent history of interruption of wheat movements from other provinces, the NWFP must seek iron-clad guarantees from the Federal government that such actions will not recur. This does not imply that the NWFP needs to meet all domestic cereal needs. Rather, that the most effective strategy for the province would be to concentrate on using its most scarce resource, namely land (particularly irrigated land), in activities that provide the highest returns and use the funds generated thereby to import cereals and other commodities in which the NWFP has no obvious comparative advantage.
2.51 This does not mean that the province should or will stop depending on cereals as a major crop over the medium term – cereals account for around three-quarters of agricultural activity (measured by land usage). But given the limited fiscal space, and the existing evidence of potentially high returns from diversification, it is clear that the best strategy for the use of constrained public investments in support of the agricultural sector is to encourage the movement towards high value products.
2.52 The climate and geographical position of the NWFP provide it with excellent prospects to expand the production of horticulture and other high-value products for the domestic market as well as for exports. Within Pakistan the demand for fruits and vegetables is growing, while the value of traditional agricultural exports is declining. Global export markets are growing at 7 percent a year in value terms. Capturing the potential of these markets will require lengthening the marketing season, diversifying export markets beyond the Gulf States, exploring markets for new products, and increasing the processing of fresh products.
2.53 The NWFP has considerable growth potential in many other high value and specialty products, such as seeds and seedlings (e.g., onions, fruit seedlings), floriculture, agro-forestry, non-timber forest products (such as mushrooms), medicinal products, milk, sheep and goat meat, Kashmiri wool, honey, and others. The production of these items should be encouraged, particularly as several of these have potential in the more marginal areas of the province.
32
Under this strategic priority, the following major objectives can be identified: i. Improving the overall business environment in order to promote value-added processing in
the NWFP. Agriculture (including livestock) is the private sector of the province. Consequently, the most significant contribution the GoNWFP can make to promote agriculture is to improve the environment for business, including household businesses. This issue is dealt with in more detail in the next chapter (on private sector development), as the generic recommendations for PSD would affect agro-processing as well. Improving transport infrastructure is particularly important for the economically viable shipment of agricultural products, which typically have low value-to-weight ratios. While this is necessary for the long-term more immediate interventions that will directly benefit the private sector include support for small-scale agro-processing industries (e.g., fruit drying, the production of jams and fruit juices) by farm households and small businesses through technology transfer and assistance with start-up costs.
ii. Maintaining the momentum from recent successes in stimulating new sources of growth in high-value products by building on and scaling up the successes. To do so will require the government to: (a) internalize and sustain the impact of donor-funded projects (particularly the PHP) with these have a track record of success; (b) replicate this approach, where appropriate throughout the remainder of the province; (c) create a research system that undertakes best-practice scientific research of relevance to all farmers in the province; (d) strengthen the linkages between agricultural research, extension and the farmers to ensure that research and extension priorities correspond with farmers' needs and market trends; (e) introduce new varieties of sheep for high-quality wool production, particularly in the high mountain areas, and improved breeds of goats suitable for rearing in the southern districts; (f) develop further varieties of high-value horticulture of particular interest to the southern districts (e.g. olives, berries, dates); promote private milk processing plants, particularly in the central plains; (g) construct a policy environment that supports active forest management for sustainable harvesting of timber, and the development of associated processing industries, such as furniture and sports goods.
iii. Broadening and deepening input and output markets by improving market efficiency and
promoting new export opportunities. The NWFP can increase its market share in domestic consumption of high-value horticultural products, and develop new opportunities for exports beyond the Gulf States. This will require the government to: (a) work in partnership with farmers and the private sector to improve input and output market information through the use of media and extension services; (b) reduce the transaction costs in the marketing of outputs, particularly for small farmers; (c) withdraw from direct intervention in input markets and act as facilitator and regulator for ensuring quality standards and efficient and timely distribution of key inputs;49 (d) establish key public infrastructure, such as transport links and cold storage facilities, to reduce post-harvest losses of high-value products; and (e) diversify export markets beyond the present narrow range of products and small number of destinations, by providing the private sector with market intelligence and information on new varieties/standards that meet consumer preferences.
iv. Building the capacity of small farmers through the development of farmer organizations. With over one million farms in the NWFP solving the coordination problem associated with small farm size requires an institutional foundation of farmer organizations. This is essential to capture scale economies of input and output markets and to ensure the provision of services with common property or public good characteristics (e.g., irrigation; market intelligence for sub-groups of producers). Moreover, farmer organizations can provide the interface between extension service providers and farmers, by articulating farm-specific needs, mobilizing effective demand for services, and organizing their delivery. They are the linchpin of an effective dialogue between farmers and the public research and extension 49 For example, the Seed Certification Scheme established by the Federal Seed Certification and Registration Department (in Islamabad) and the Provincial authorities presents a promising example for the future.

33
system. Revising the remit and expanding the coverage of Farmer’s Service Centers could be an effective intervention in this regard.50
v. Raising incomes of subsistence farmers. For the majority of agricultural households in the
NWFP, particularly the poorest, land and labor will continue to be employed in traditional agricultural products, such as wheat, maize, and pulses. Grains, pulses, and livestock are especially important for small farmers in more marginal areas, and the Government will have to pay continued attention to these crops in order to reduce income inequalities that may be generated through an exclusive focus on high-value products. The long-term objective is for farmers in the southern districts to take advantage of the market opportunities in cereals created by the diversification of better-off farms into horticulture. However, in the short- to medium-term, government interventions will be necessary to sustain the nutritional intake of subsistence farm households. To achieve this, the government needs to share the benefits of agricultural growth across the NWFP so as to maximize the poverty-reducing impact of growth and reduce risk and vulnerability. This is especially critical from an equity perspective and to maintain viable populations in the more remote regions of the province. Such an agenda would include: (a) continued development of new varieties of plants and animals by the local research and extension systems to reflect prevailing agro-climatic conditions in the marginal lands; (b) expansion of irrigation systems, particularly through water harvesting techniques in the southern districts; (c) improved rangeland management practices through better alternatives to grazing (i.e., improved fodder crops) and the reintroduction of traditional management systems in communal lands. In the longer run, the province should plan to move towards instituting a system of crop insurance.
vi. Creating the right institutional framework. Achieving the objectives set out above will
require an appropriate legislative and institutional framework, as well as political commitment at the highest level. This requires: (a) GoNWFP deploying available financial and human resources in a manner that is consistent with established policy priorities; (b) a review of existing organizational structures with the objective of making the public institutions fit for purpose; (c) improved human resource management in order to create a revised incentive framework for a professional cadre of staff; and (d) a more open and accountable Government which gives stakeholders a greater voice in decision-making. Critical areas for immediate attention include the following: On irrigation, the GoNWFP needs to continue to transfer responsibility for irrigation to farmer organizations through Irrigation and Drainage Management Transfer Agreements. In addition, the NWFP should continue reforms initiated under the National Drainage Program to Area Water Boards and Provincial irrigation department, following experience in Sindh and Punjab. In agricultural and livestock, the pilot project to introduce performance based budgeting provides an important entry point to public expenditure reforms. Similarly, major efforts are required to address the institutional weaknesses in research and extension services, and a critical first step is a more thorough diagnosis of existing institutional arrangements and a process established for implementing subsequent recommendations.
vii. Conserving natural resources. The growth strategy adopted by the province must give due
regard to environmental sustainability, recognizing the intrinsic as well as commercial value of the province’s unique natural resource base. The authorities must recognize the competing demands on environmental resources and provide a mechanism whereby these conflicts can be resolved in a way that balances these competing demands. Local communities — the primary stakeholders of natural resources — must be at the center of this process. This will require the government to: (a) clarify incentives for communities for sustainable management of their natural resources by establishing ownership and/or user rights that encourage joint management approaches and use traditional structures that are likely to be community-specific; (b) strengthen institutional capacities for rangeland management, particularly in the 50 The GoNWFP has also recently established District Agriculture Coordination Forums to support, inter alia, district-level planning in the sector.

34
southern rangeland upon which the poorest depend for resources for grazing, fuel, and fodder; (c) support provincial research in natural resources management in general and forest conservation and range management in particular, through provincial efforts and the federally-administered Pakistan Forest Institute; and (d) promote eco-tourism by providing direct socio-economic benefits to local communities so as to provide them the incentive for nature conservation in their area.
D. POSTSCRIPT: RECENT AGRICULTURAL POLICY CHANGES 2.54 Recognizing the issues and challenges highlighted above and its unique climate and geographic position, the GoNWFP has recently issued a policy document - Agricultural Policy 2005 (AP05). This policy document was written and finalized around the same time as this economic report. The policy document identifies the major constraints to rapid growth in agriculture, sets a vision for the future of the sector and formulates both short-and medium-term policies and strategies for key sub-sectors. The AP05 is focused on those sub-sectors that are likely to have much more immediate impact on growth and poverty reduction and for laying the foundation for a robust agricultural growth. The government vision for the agriculture and irrigation sector in this policy document is to develop a modern, competitive, sustainable and productive agricultural system that is aimed at improving incomes of the farming population in a relatively short time.
2.55 Given the nature of challenges and issues facing the sector, the successes achieved so far and the existing evidence of potentially high returns from diversification, the strategy is to encourage the movement towards high value products for both domestic and international markets.
2.56 The GoNWFP strategy is focused on fully exploiting the considerable growth potential NWFP has in many high value and specialty products, such as seeds and seedlings (e.g., onions, fruit seedlings), floriculture, agro-forestry, non-timber forest products (such as mushrooms), medicinal products, milk, sheep and goat meat, Kashmiri wool, honey, and others. The GoNWFP therefore intends to encourage production of these commodities, as several of them have potential also in the more marginal areas of the province. Under this strategic priority, the government will carry out policy and institutional reforms, as well as investment programs in several areas including, (i) improving the overall business environment for private sector participation, particularly, on interventions that will directly benefit the private sector and support small-scale agro-processing industries through technology transfer and assistance with start-up costs; (ii) maintaining the momentum from recent successes in stimulating new sources of growth in high-value products by building on, and scaling up, the activities of successful interventions; (iii) broadening and deepening input and output markets by improving market efficiency and promoting new export opportunities; (iv) forming farmer organizations/associations to capture scale economies of input and output markets and to ensure the provision of services with common property or public good characteristics (e.g. irrigation; market intelligence for sub-groups of producers); and also to provide the interface between extension service providers and farmers, by articulating farm-specific needs, mobilizing effective demand for services, and organizing their delivery; (v) creating supporting institutional framework by reviewing existing organizational structures and the legal framework; (vi) removing barriers in the market chain and reinforcing production-market linkages including investment in physical infrastructure such as roads, rural electrification and communications systems; supporting effective sub-contracting systems, quality inspection; strengthening the information and communication technology to enable real-time access to information on agricultural market prices and, (vii) giving due regard to environmental sustainability recognizing the intrinsic as well as commercial value of the Province’s unique natural resource base, as well as the competing demands on environmental resources.
2.57 Many of the specific policies recommended in this policy document are in line with the broad strategy and key recommendations highlighted in the drafts of the agricultural chapter shared with the government during the preparation of this report.