Embed Size (px)
Citation preview

1818Water Resources
Draft EIS: 29/06/2017
Page i
DRAFT
Chapter 18 - Table of Contents
VERSION CONTROL: 29/06/2017
18 Water Resources 18-1
18.1 Introduction 18-1
18.2 Legislation 18-1
18.3 Groundwater Resources 18-1
18.4 Climate 18-2
18.5 Existing Site Assumptions 18-2
18.6 Proposed Demands 18-4 18.6.1 Equivalent Population 18-4 18.6.2 Occupancy 18-6 18.6.3 Water Demands 18-6 18.6.4 Proposed Water Conservation Measures 18-8
18.7 Proposed Dam Diversion 18-9
18.8 GoldSim Model Setup 18-13
18.9 GoldSim Results 18-15
18.10 Impact of Climate Change 18-17
18.11 Sewage Treatment Plant Flows 18-18
18.12 Potential Impacts and Mitigation Measures 18-19
18.13 Summary 18-20
List of Figures Figure 18-1. Average Monthly Rainfall. ..................................................................................................... 18-2 Figure 18-2. Proposed Dam Diversion Engineering Details (overview). ................................................. 18-11 Figure 18-3. Proposed Dam Diversion Engineering Details (enlarged). ................................................. 18-11 Figure 18-4. GoldSim Model Setup. ........................................................................................................ 18-13 Figure 18-5. GoldSim Flow Interactions. ................................................................................................. 18-14 Figure 18-6. GoldSim Model Player. ....................................................................................................... 18-15 Figure 18-7. Lake History Plot. ................................................................................................................ 18-17
Draft EIS: 29/06/2017
Page ii
DRAFT
List of Tables Table 18-1. Existing Dam Stage Storage Relationship. ........................................................................... 18-2 Table 18-2. Water Supply Equivalent Populations. .................................................................................. 18-4 Table 18-3. Water Demands Summary. .................................................................................................. 18-8 Table 18-4. Revised Dam Stage Storage Relationship. ........................................................................ 18-12 Table 18-5. Average Monthly Water Sources. ....................................................................................... 18-16 Table 18-6. Risk assessment matrix – water resources. ....................................................................... 18-19
List of Maps Map 18-1. Proposed Dam Diversion. ........................................................................................................ 18-10
1 Introduction
2 Project Proponent
3 Site Description
4 Project Description
Draft EIS: 29/06/2017
Page 18-1
DRAFT
18 Water Resources
18.1 Introduction
The resort’s current and proposed water supply source is Gap Creek Dam located to the north of the existing
resort development. Recycled water produced at the new wastewater treatment plant is proposed to be used
for a range of non-potable uses within the development, including toilet flushing, washdown and irrigation of
the island’s golf course and landscaped areas. Separated reticulation networks consisting of pipelines, pump
stations and storage tanks will be constructed to deliver potable and recycled water to the required areas within
the resort. A water balance model was set up in GoldSim to determine the water demand for the site and likely
reliability of supply, noting that in accordance with the Geotechnical Assessment (refer to Appendix F -
Geotechnical Assessment), it is unlikely there are substantial groundwater resources and as such no
extraction or use of this resource is proposed. The GoldSim model was set up based on 50 years of climate
data from 1950 to 1999 for Lindeman Island, sourced from Queensland Government Department of Science,
Information Technology and Innovation (DSITI) SILO program. The GoldSim model was able to model the
complex interactions between different water demands and flows. It was also able to model the potential
impact that reduced rainfall could have on the reliability of supply.
This section provides a summary of the technical assessment provided in Appendix P - Stormwater
Management Plan and Water Balance Modelling.
Addendum: This EIS was initially prepared assuming that the safe harbour was to be part of the Lindeman
Great Barrier Reef Resort Project. With the commencement of the Great Barrier Reef Marine Park Authority’s
(GBRMPA) Dredging Coral Reef Habitat Policy (2016), further impacts on Great Barrier Reef coral reef habitats
from yet more bleaching, and the recent impacts from Tropical Cyclone Debbie, the proponent no longer seeks
assessment and approval to construct a safe harbour at Lindeman Island. Instead the proponent seeks
assessment and approval for upgrades to the existing jetty and additional moorings in sheltered locations
around the island to enable the resort’s marine craft to obtain safe shelter under a range of wind and wave
conditions. Accordingly, remaining references to, and images of, a safe harbour on various figures and maps
in the EIS are no longer current.
18.2 Legislation
The Water Act 2000 was introduced to establish a system for the planning, allocation and use of water. Rights
over water in Gap Creek Dam is vested in the state of Queensland. An approval under the Water Act 2000
will be required for extraction of waters from Gap Creek Dam for use within the resort. It is noted that Gap
Creek Dam was established as a raw water supply to service the previous Lindeman Island resort and is an
existing element of the resort infrastructure. A permit will also be required for excavation of the dam as
proposed.
18.3 Groundwater Resources
The geotechnical assessment undertaken for the project found that the geology of the island is not one that is
conducive to the formation of aquifers and if groundwater does occur, it will be limited to areas of intense
Draft EIS: 29/06/2017
Page 18-2
DRAFT
fracturing of the rock (refer to Appendix F - Geotechnical Assessment). A review of historical data regarding
bore water extraction confirms this assessment and indicates that any groundwater resource is limited and
usually limited to short period of time following a rainfall event. Due to the unreliability and limited nature of
this resource, no extraction of groundwater resources is proposed.
18.4 Climate
The Bureau of Meteorology (BoM) had a rainfall station (033042) in operation at Lindeman Island from 1950
to 2011. From 1993 until 1995 the rainfall station was not in operation. For this period, SILO used surrounding
rainfall stations to estimate the likely rainfall patterns. The average annual rainfall from at Lindeman Island
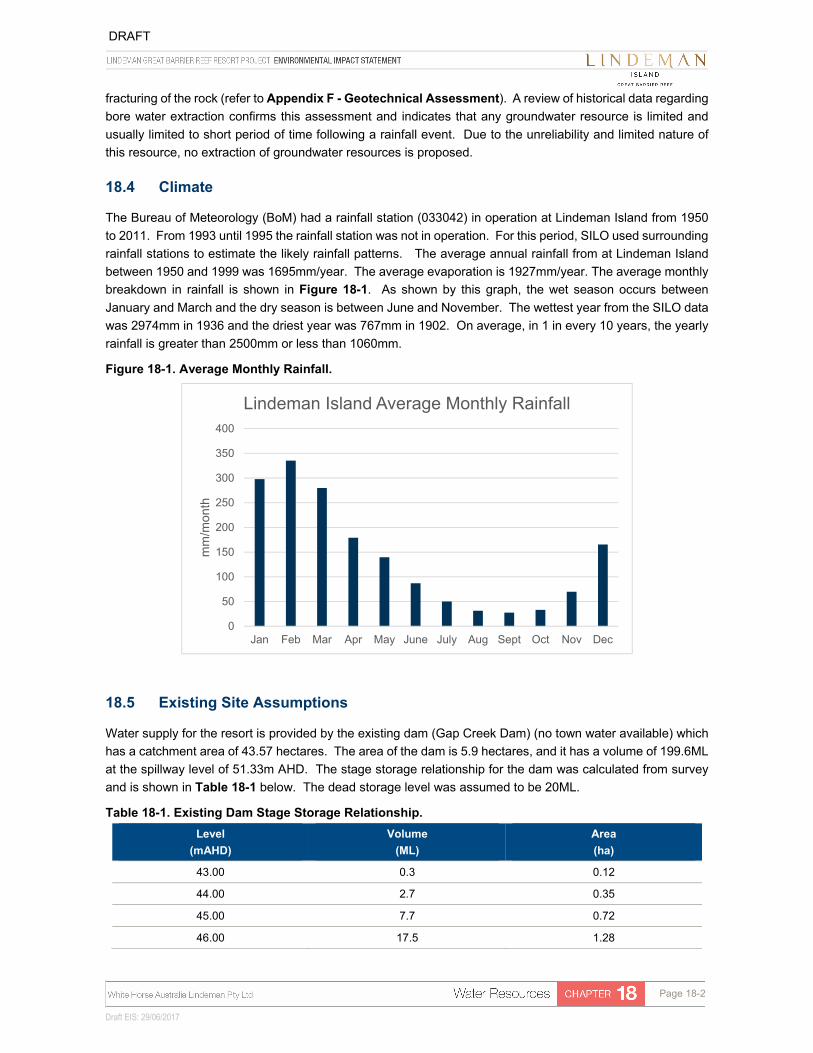
between 1950 and 1999 was 1695mm/year. The average evaporation is 1927mm/year. The average monthly
breakdown in rainfall is shown in Figure 18-1. As shown by this graph, the wet season occurs between
January and March and the dry season is between June and November. The wettest year from the SILO data
was 2974mm in 1936 and the driest year was 767mm in 1902. On average, in 1 in every 10 years, the yearly
rainfall is greater than 2500mm or less than 1060mm.
Figure 18-1. Average Monthly Rainfall.
18.5 Existing Site Assumptions
Water supply for the resort is provided by the existing dam (Gap Creek Dam) (no town water available) which
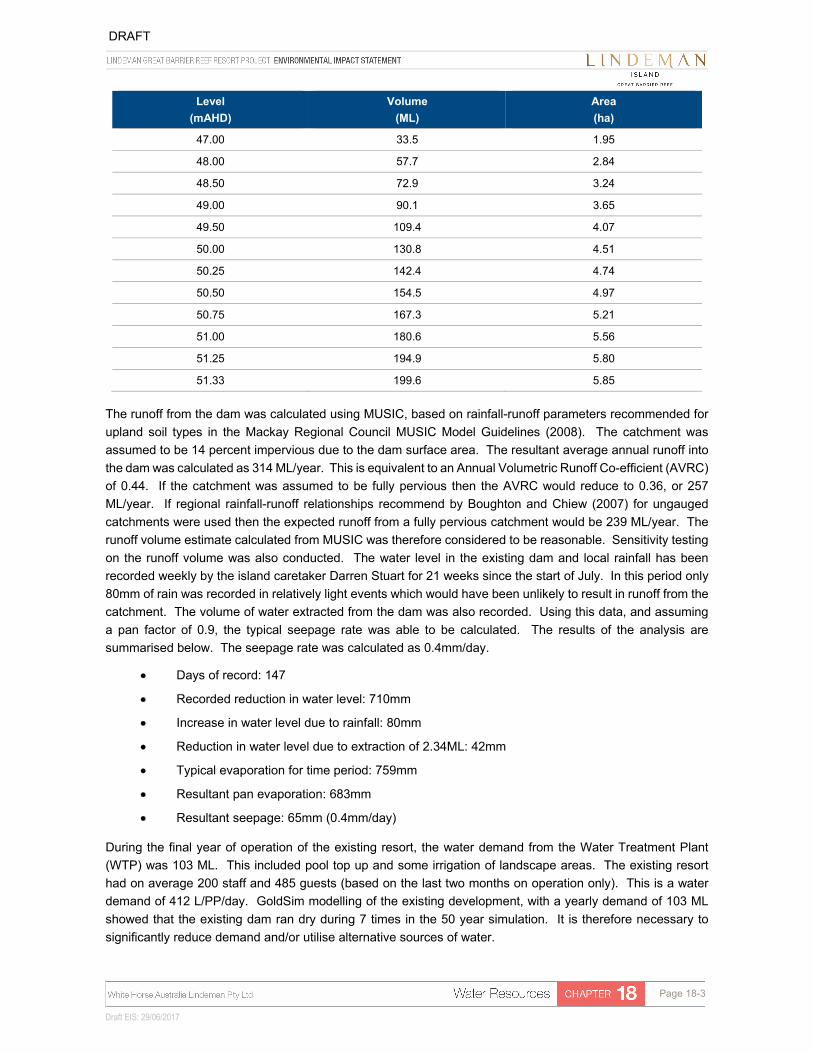
has a catchment area of 43.57 hectares. The area of the dam is 5.9 hectares, and it has a volume of 199.6ML
at the spillway level of 51.33m AHD. The stage storage relationship for the dam was calculated from survey
and is shown in Table 18-1 below. The dead storage level was assumed to be 20ML.
Table 18-1. Existing Dam Stage Storage Relationship.
Level
(mAHD)
Volume
(ML)
Area
(ha)
43.00 0.3 0.12
44.00 2.7 0.35
45.00 7.7 0.72
46.00 17.5 1.28
0
50
100
150
200
250
300
350
400
Jan Feb Mar Apr May June July Aug Sept Oct Nov Dec
mm
/mon
th
Lindeman Island Average Monthly Rainfall
Draft EIS: 29/06/2017
Page 18-3
DRAFT
Level
(mAHD)
Volume
(ML)
Area
(ha)
47.00 33.5 1.95
48.00 57.7 2.84
48.50 72.9 3.24
49.00 90.1 3.65
49.50 109.4 4.07
50.00 130.8 4.51
50.25 142.4 4.74
50.50 154.5 4.97
50.75 167.3 5.21
51.00 180.6 5.56
51.25 194.9 5.80
51.33 199.6 5.85
The runoff from the dam was calculated using MUSIC, based on rainfall-runoff parameters recommended for
upland soil types in the Mackay Regional Council MUSIC Model Guidelines (2008). The catchment was
assumed to be 14 percent impervious due to the dam surface area. The resultant average annual runoff into
the dam was calculated as 314 ML/year. This is equivalent to an Annual Volumetric Runoff Co-efficient (AVRC)
of 0.44. If the catchment was assumed to be fully pervious then the AVRC would reduce to 0.36, or 257
ML/year. If regional rainfall-runoff relationships recommend by Boughton and Chiew (2007) for ungauged
catchments were used then the expected runoff from a fully pervious catchment would be 239 ML/year. The
runoff volume estimate calculated from MUSIC was therefore considered to be reasonable. Sensitivity testing
on the runoff volume was also conducted. The water level in the existing dam and local rainfall has been
recorded weekly by the island caretaker Darren Stuart for 21 weeks since the start of July. In this period only
80mm of rain was recorded in relatively light events which would have been unlikely to result in runoff from the
catchment. The volume of water extracted from the dam was also recorded. Using this data, and assuming
a pan factor of 0.9, the typical seepage rate was able to be calculated. The results of the analysis are
summarised below. The seepage rate was calculated as 0.4mm/day.
Days of record: 147
Recorded reduction in water level: 710mm
Increase in water level due to rainfall: 80mm
Reduction in water level due to extraction of 2.34ML: 42mm
Typical evaporation for time period: 759mm
Resultant pan evaporation: 683mm
Resultant seepage: 65mm (0.4mm/day)
During the final year of operation of the existing resort, the water demand from the Water Treatment Plant
(WTP) was 103 ML. This included pool top up and some irrigation of landscape areas. The existing resort
had on average 200 staff and 485 guests (based on the last two months on operation only). This is a water
demand of 412 L/PP/day. GoldSim modelling of the existing development, with a yearly demand of 103 ML
showed that the existing dam ran dry during 7 times in the 50 year simulation. It is therefore necessary to
significantly reduce demand and/or utilise alternative sources of water.
Draft EIS: 29/06/2017
Page 18-4
DRAFT
18.6 Proposed Demands
18.6.1 Equivalent Population
Equivalent populations are required to be estimated for the development to inform the design of water and
sewerage infrastructure. Equivalent populations were calculated based on the development types and areas
as detailed in the Lindeman Island Redevelopment Development Area Schedule Issue K 16/02/16 and the
Water Services Association of Australia Sewerage Code WSA 02-2014. The Code provides estimates of
contributions to equivalent populations from residential and commercial development based on a unit rate such
as gross hectare or occupant.
The calculation of equivalent populations are conservative as they relate to fully occupied typical urban
development, as opposed to partially occupied island resorts with a contained population. The equivalent
population (EP) for the proposed development with full occupancy was revised down from the originally
proposed 1604 to 1493, which includes staff, guests and day visitors. This was broken down into:
320 staff;
617 villa guests; and
556 hotel and day guests.
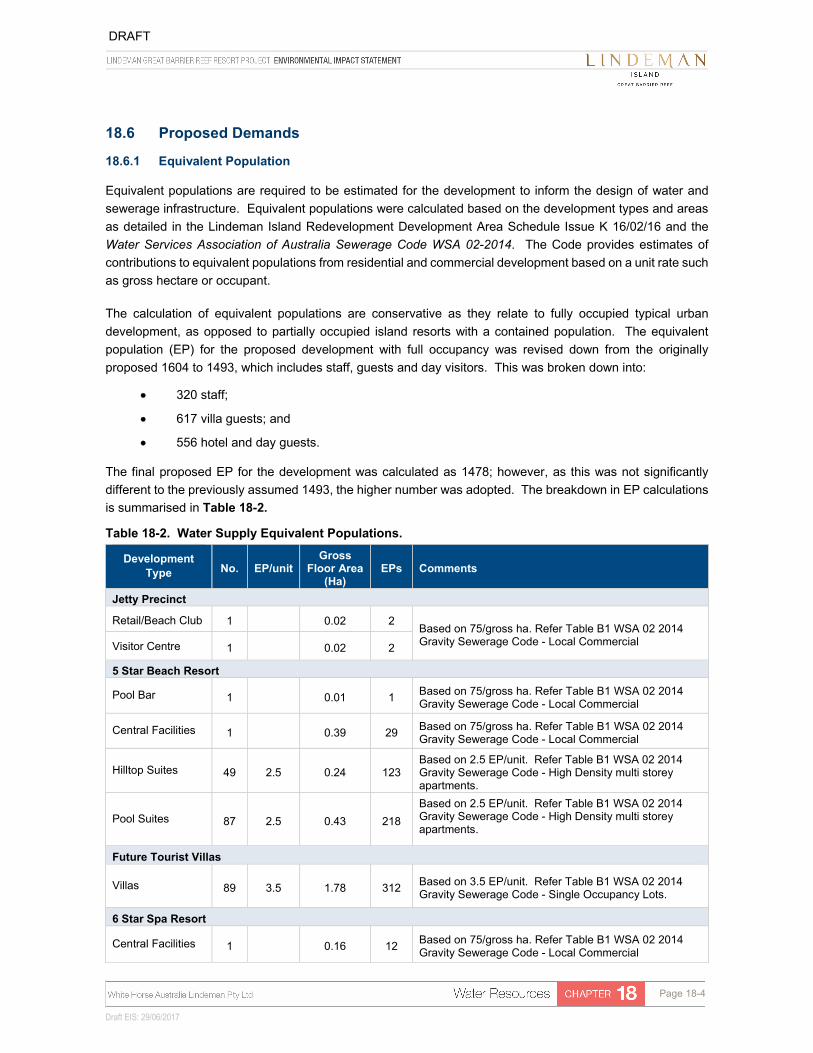
The final proposed EP for the development was calculated as 1478; however, as this was not significantly
different to the previously assumed 1493, the higher number was adopted. The breakdown in EP calculations
is summarised in Table 18-2.
Table 18-2. Water Supply Equivalent Populations.
Development Type No. EP/unit
Gross Floor Area
(Ha) EPs Comments
Jetty Precinct
Retail/Beach Club 1 0.02 2 Based on 75/gross ha. Refer Table B1 WSA 02 2014 Gravity Sewerage Code - Local Commercial Visitor Centre 1 0.02 2
5 Star Beach Resort
Pool Bar 1 0.01 1 Based on 75/gross ha. Refer Table B1 WSA 02 2014 Gravity Sewerage Code - Local Commercial
Central Facilities 1 0.39 29 Based on 75/gross ha. Refer Table B1 WSA 02 2014 Gravity Sewerage Code - Local Commercial
Hilltop Suites 49 2.5 0.24 123 Based on 2.5 EP/unit. Refer Table B1 WSA 02 2014 Gravity Sewerage Code - High Density multi storey apartments.
Pool Suites 87 2.5 0.43 218
Based on 2.5 EP/unit. Refer Table B1 WSA 02 2014 Gravity Sewerage Code - High Density multi storey apartments.
Future Tourist Villas
Villas 89 3.5 1.78 312 Based on 3.5 EP/unit. Refer Table B1 WSA 02 2014 Gravity Sewerage Code - Single Occupancy Lots.
6 Star Spa Resort
Central Facilities 1 0.16 12 Based on 75/gross ha. Refer Table B1 WSA 02 2014 Gravity Sewerage Code - Local Commercial
Draft EIS: 29/06/2017
Page 18-5
DRAFT
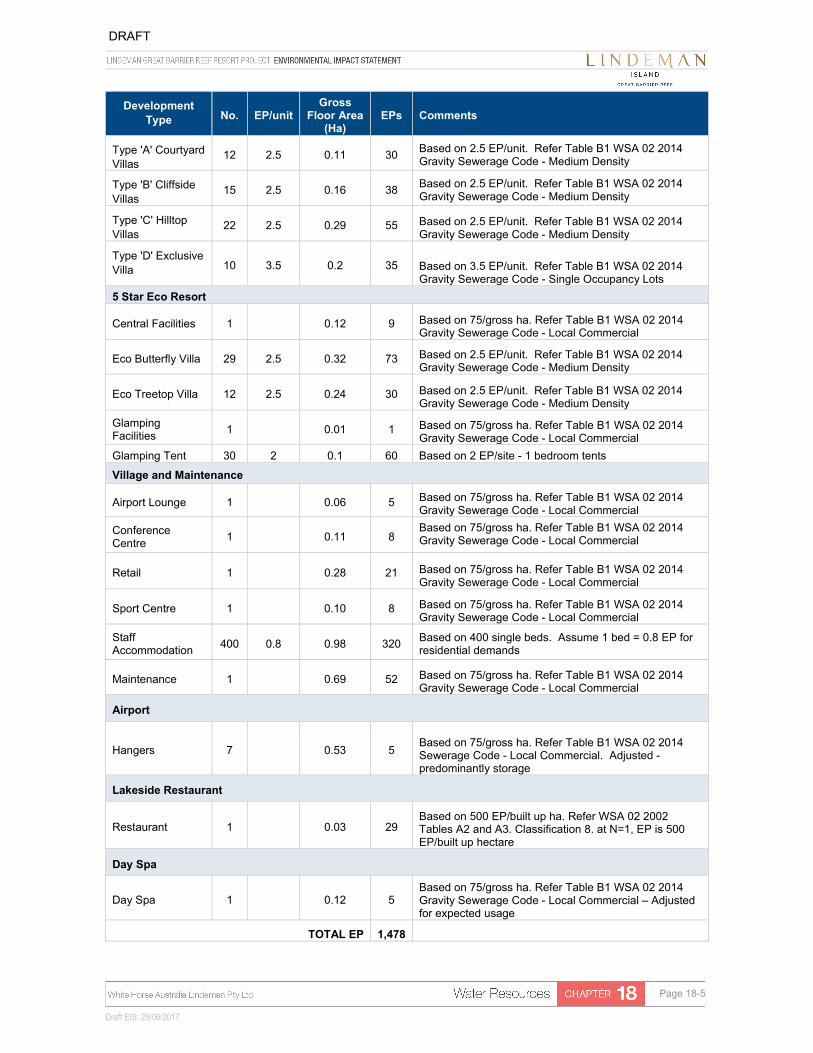
Development Type No. EP/unit
Gross Floor Area
(Ha) EPs Comments
Type 'A' Courtyard Villas
12 2.5 0.11 30 Based on 2.5 EP/unit. Refer Table B1 WSA 02 2014 Gravity Sewerage Code - Medium Density
Type 'B' Cliffside Villas
15 2.5 0.16 38 Based on 2.5 EP/unit. Refer Table B1 WSA 02 2014 Gravity Sewerage Code - Medium Density
Type 'C' Hilltop Villas
22 2.5 0.29 55 Based on 2.5 EP/unit. Refer Table B1 WSA 02 2014 Gravity Sewerage Code - Medium Density
Type 'D' Exclusive Villa 10 3.5 0.2 35 Based on 3.5 EP/unit. Refer Table B1 WSA 02 2014
Gravity Sewerage Code - Single Occupancy Lots
5 Star Eco Resort
Central Facilities 1 0.12 9 Based on 75/gross ha. Refer Table B1 WSA 02 2014 Gravity Sewerage Code - Local Commercial
Eco Butterfly Villa 29 2.5 0.32 73 Based on 2.5 EP/unit. Refer Table B1 WSA 02 2014 Gravity Sewerage Code - Medium Density
Eco Treetop Villa 12 2.5 0.24 30 Based on 2.5 EP/unit. Refer Table B1 WSA 02 2014 Gravity Sewerage Code - Medium Density
Glamping Facilities
1 0.01 1 Based on 75/gross ha. Refer Table B1 WSA 02 2014 Gravity Sewerage Code - Local Commercial
Glamping Tent 30 2 0.1 60 Based on 2 EP/site - 1 bedroom tents
Village and Maintenance
Airport Lounge 1 0.06 5 Based on 75/gross ha. Refer Table B1 WSA 02 2014 Gravity Sewerage Code - Local Commercial
Conference Centre
1 0.11 8 Based on 75/gross ha. Refer Table B1 WSA 02 2014 Gravity Sewerage Code - Local Commercial
Retail 1 0.28 21 Based on 75/gross ha. Refer Table B1 WSA 02 2014 Gravity Sewerage Code - Local Commercial
Sport Centre 1 0.10 8 Based on 75/gross ha. Refer Table B1 WSA 02 2014 Gravity Sewerage Code - Local Commercial
Staff Accommodation
400 0.8 0.98 320 Based on 400 single beds. Assume 1 bed = 0.8 EP for residential demands
Maintenance 1 0.69 52 Based on 75/gross ha. Refer Table B1 WSA 02 2014 Gravity Sewerage Code - Local Commercial
Airport
Hangers 7 0.53 5 Based on 75/gross ha. Refer Table B1 WSA 02 2014 Sewerage Code - Local Commercial. Adjusted - predominantly storage
Lakeside Restaurant
Restaurant 1 0.03 29 Based on 500 EP/built up ha. Refer WSA 02 2002 Tables A2 and A3. Classification 8. at N=1, EP is 500 EP/built up hectare
Day Spa
Day Spa 1 0.12 5 Based on 75/gross ha. Refer Table B1 WSA 02 2014 Gravity Sewerage Code - Local Commercial – Adjusted for expected usage
TOTAL EP 1,478
Draft EIS: 29/06/2017
Page 18-6
DRAFT
18.6.2 Occupancy
To determine the likely fluctuation in occupancy over the year, typical occupancy rates were taken from the
Queensland Government Destination Q website
https://www.destq.com.au/squiznew/resources/research/statistics), which reports tourism statistics from the
Australian Bureau of Statistics. For the Whitsunday region, average occupancy for hotels and motels with
over 15 rooms from 2002 to 2012 was:
January to March: 52.3%
April to June: 49.2%
July to September: 61.6%
October to December: 62.3%
The peak period coincides with the driest period of the year. 100 percent occupancy was conservatively assumed for the peak period, with the occupancy scaled down in accordance with typical occupancy rates for the region. The EP over the year was therefore assumed to be:
January to March: 1253
April to June: 1179
July to September: 1470
October to December: 1493
The average EP is 1351.
18.6.3 Water Demands
The average water demand was assumed to be 285 L/EP/day based on required levels of service for Mackay
Regional Council. Applying this to 1351 EP, results in a total annual water demand of 140.5 ML. It was
originally estimated that 45.6 ML/year will be required for irrigation based on irrigating 11.4 hectares at 4
ML/ha/year. This will be supplied by recycled water. This reduces the remaining annual water demand to 94.9
ML. Applying this to 1351 EP, results in a daily demand of192.5 L/EP/day. The split in water demands
referenced the Healthy Waterways MUSIC Modelling Guidelines (2010). For hotels and resorts with full water
saving devices they recommend:
Laundry - 5 L/EP/day
Toilet – 25 L/EP/day
Kitchen – 13 L/EP/day
Bathroom – 94 L/EP/day
TOTAL – 137 L/EP/day
The remaining demand (56 L/EP/day) was assumed to be for the communal areas of the resort. This was
assumed to be split 60:40 for potable and non-potable uses. The water demands listed above do not include
the demand for pools. There will be 189 pools for villas throughout the development (assumed to be 25m2
each) and communal resort pools with a total area of around 3000m2. The pools will be initially filled up during
the wet season during the main rainfall event and will be topped up via rainwater tanks. They will also be
provided with backwash recycling tanks to reduce top-up demand. During periods of prolonged dry weather,
the pools will be topped up with potable water when the resort is at low occupation. Each of the 189 villas will
have a 10kL rainwater tank that will drain at least 100m2 of roof area. The rainwater tank will be used for pool
top up and toilet flushing. The rainwater tanks will provide approximately 74.3 percent of the water demand.
Draft EIS: 29/06/2017
Page 18-7
DRAFT
If larger pools than specified are adopted, then the roof area and/or tank size should be increased. Preliminary
analysis found that a pool area of 40m2 would require a tank size of 20kL or a roof area of at least 180m2 in
order to provide the same water yields for the villas. It was assumed that a minimum of 3500m2 of roof area
would be directed to a 500kL rainwater tank for resort pool top up. This would provide 49.4 percent of the
resort pool water. The rainwater tanks and roof area would be distributed proportionally for the numerous
communal pool areas. Additional top up for villa and resort tanks would be supplied by the WTP.
Recycled water will be used to irrigate golf courses and landscape areas. A total of 11.4 hectares was
assumed to be available for irrigation at a rate of 4ML/ha/year. Recent MEDLI modelling (refer to Appendix
O - Water Infrastructure Assessment)has indicated that higher irrigation rates and more irrigation area is
available. The irrigation was scaled based on potential evapotranspiration. No irrigation was applied if there
had been more than 6mm of rainfall in the last 3 days. The majority of laundry uses will be conducted at
communal facilities where recycled water will be able to be used. It was therefore assumed that the incidental
laundry demands of each villa would be supplied by potable water. An additional 350kL rainwater tank will be
provided for roof area (from surrounding hangars and buildings) near the WTP. This will direct roofwater as a
first preference source to the WTP for treatment. It was assumed that at least 6300m2 of roof area was
available. The hotel, staff accommodation and communal facilities will have non-potable water demands (i.e.
laundry, toilet flushing and washdown) supplied by recycled water. The total recycled water demand (excluding
irrigation) was calculated at 18.3 ML/year. The recycled water network was not extended to all villas throughout
the site as the potential non-potable uses in these areas were not significant enough to justify the expense.
All potable water demand for the site will be supplied by the WTP. Additional losses were allowed for in the
water balance. These included:
10 kL/day for reservoir and distribution losses;
Splash and evaporation losses from pools. As each pool will be provided with backwash recycling tanks, minimal backwash loss was assumed; and
Usage losses of 10 percent (i.e. internal water demand lost from system).
The resultant total water demand for the site was 160.1 ML/year including irrigation and pool top up. This is
equivalent to a total water demand (including pool top up) of 325 L/EP/day. Excluding irrigation (45.6 ML/year)
this is equivalent to an average water demand of 232 L/EP/day.
Allowing 56 L/EP/day for communal areas of the resort, the average water demand is 176 L/EP/day. The split
in water demands is as follows:
Laundry - 5 L/EP/day
Toilet – 25 L/EP/day
Kitchen – 13 L/EP/day
Bathroom – 94 L/EP/day
Pool top-up – 39 L/EP/day
TOTAL – 176 L/EP/day
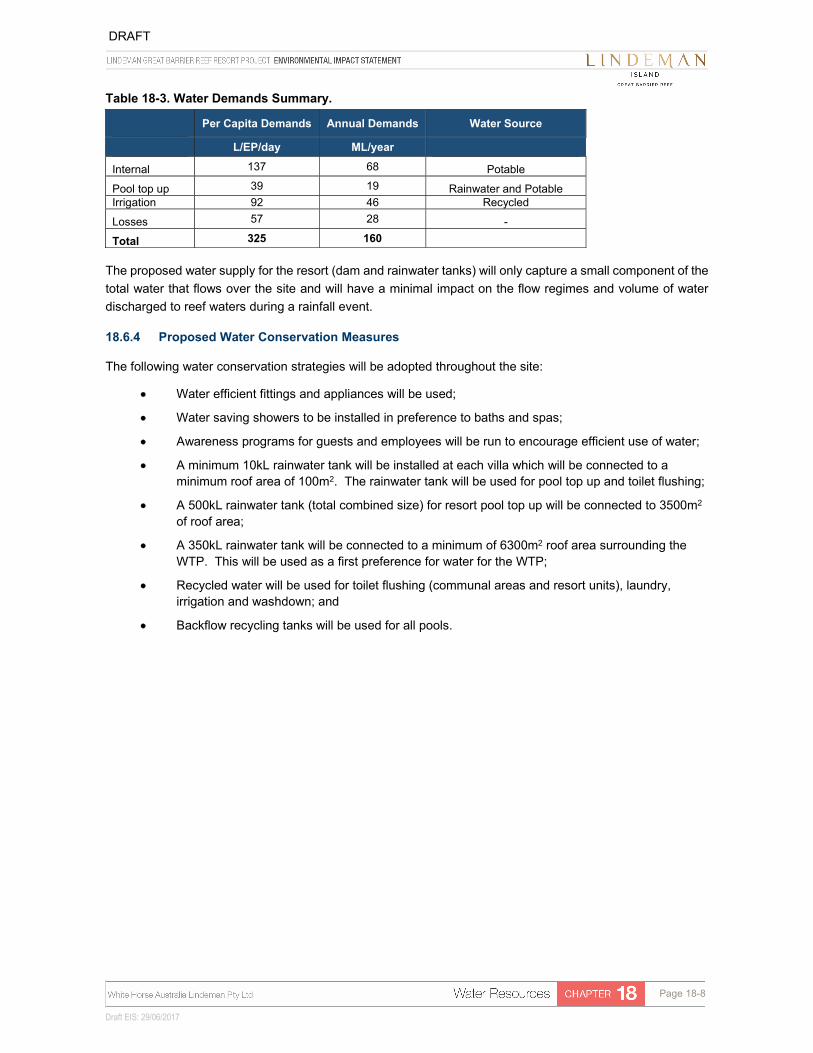
Water demands and the source of water meeting those demands are summarised in Table 18-3.
Draft EIS: 29/06/2017
Page 18-8
DRAFT
Table 18-3. Water Demands Summary.
Per Capita Demands Annual Demands Water Source
L/EP/day ML/year
Internal 137 68 Potable
Pool top up 39 19 Rainwater and Potable Irrigation 92 46 Recycled
Losses 57 28 -
Total 325 160
The proposed water supply for the resort (dam and rainwater tanks) will only capture a small component of the
total water that flows over the site and will have a minimal impact on the flow regimes and volume of water
discharged to reef waters during a rainfall event.
18.6.4 Proposed Water Conservation Measures
The following water conservation strategies will be adopted throughout the site:
Water efficient fittings and appliances will be used;
Water saving showers to be installed in preference to baths and spas;
Awareness programs for guests and employees will be run to encourage efficient use of water;
A minimum 10kL rainwater tank will be installed at each villa which will be connected to a minimum roof area of 100m2. The rainwater tank will be used for pool top up and toilet flushing;
A 500kL rainwater tank (total combined size) for resort pool top up will be connected to 3500m2
of roof area;
A 350kL rainwater tank will be connected to a minimum of 6300m2 roof area surrounding the WTP. This will be used as a first preference for water for the WTP;
Recycled water will be used for toilet flushing (communal areas and resort units), laundry, irrigation and washdown; and
Backflow recycling tanks will be used for all pools.
Draft EIS: 29/06/2017
Page 18-9
DRAFT
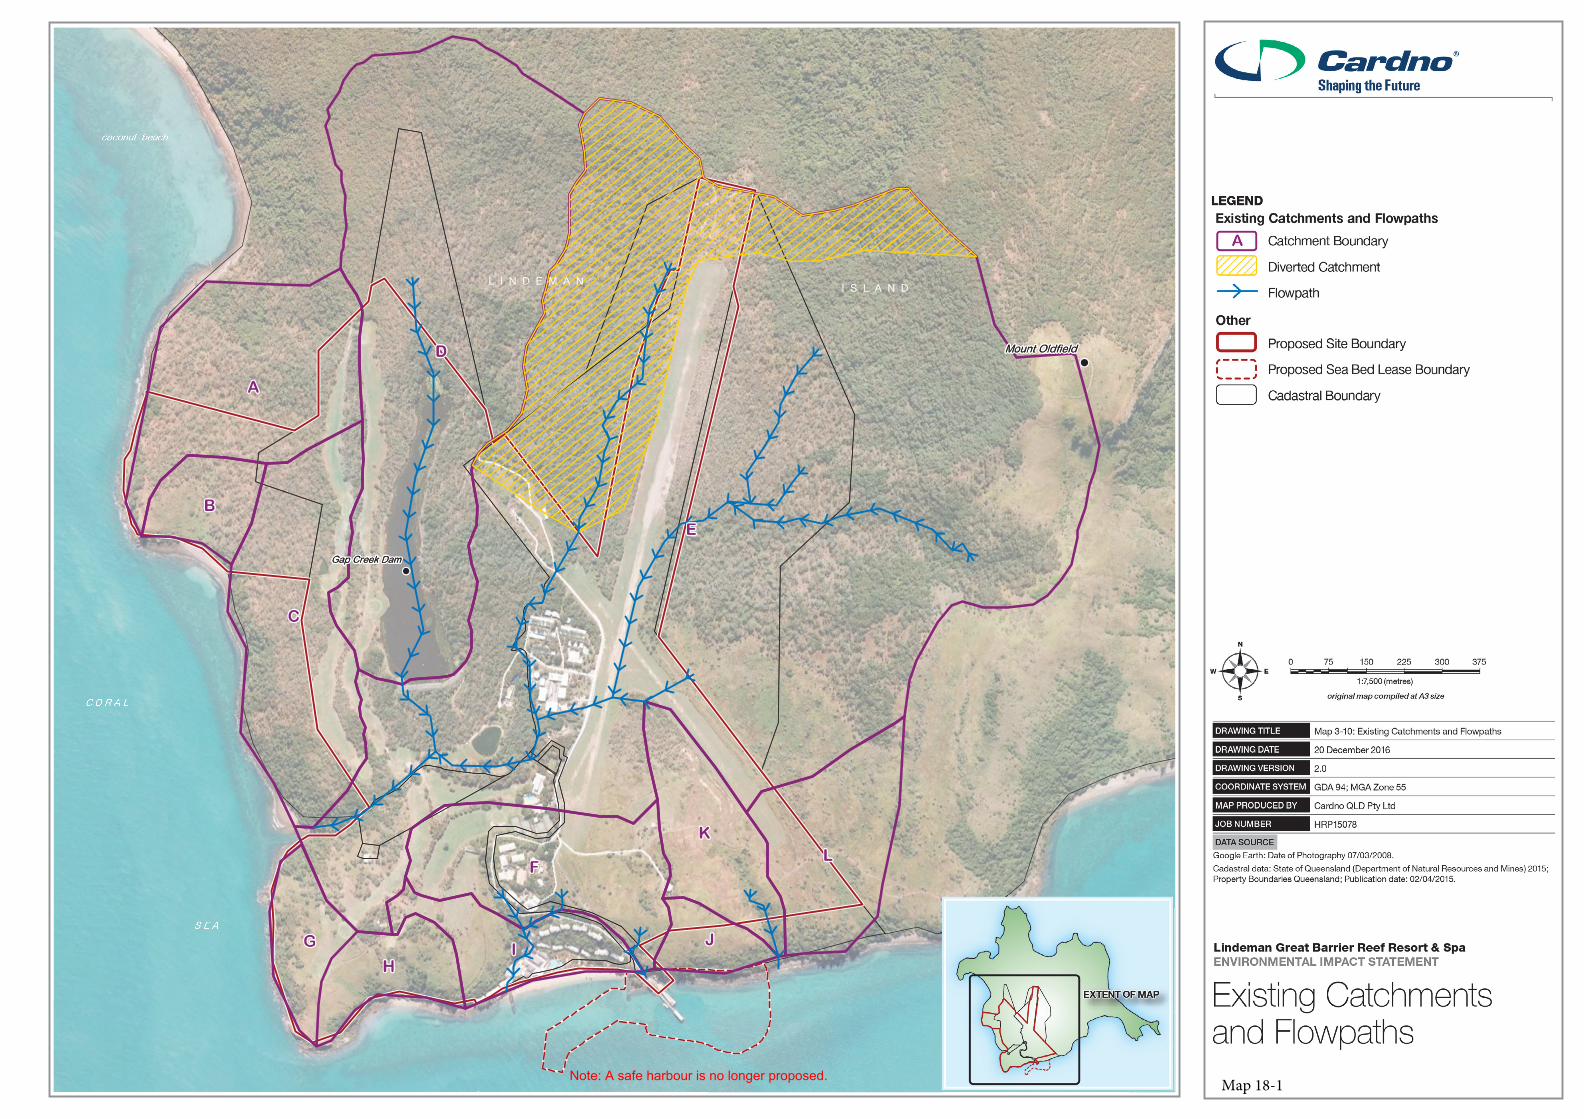
18.7 Proposed Dam Diversion
Preliminary analysis in GoldSim found that with the originally proposed EP of 1604 and the existing catchment
area draining towards the dam that the dam would be empty for 4 to 5 dry seasons of the 50 year simulation.
The months when this is likely to occur are September to January. A reduction in EP and an increase in
catchment area was therefore proposed in order to increase the reliability of supply. An additional 27 hectares
will be diverted towards the dam (refer to Map 18-1). This catchment area was added to the MUSIC model as
a fully pervious additional catchment. It was assumed that only low flows, less than 6ML/day, would be diverted
to the dam, with larger flows being directed down the existing drainage path. The total dam diversion was 71.6
ML/year. The total flow from this catchment area was 163.1 ML/year. The dam diversion channel will also
change the stage-storage relationship, increasing the volume of the dam from 199.6 to 207.3 ML, as shown in
Table 18-4.
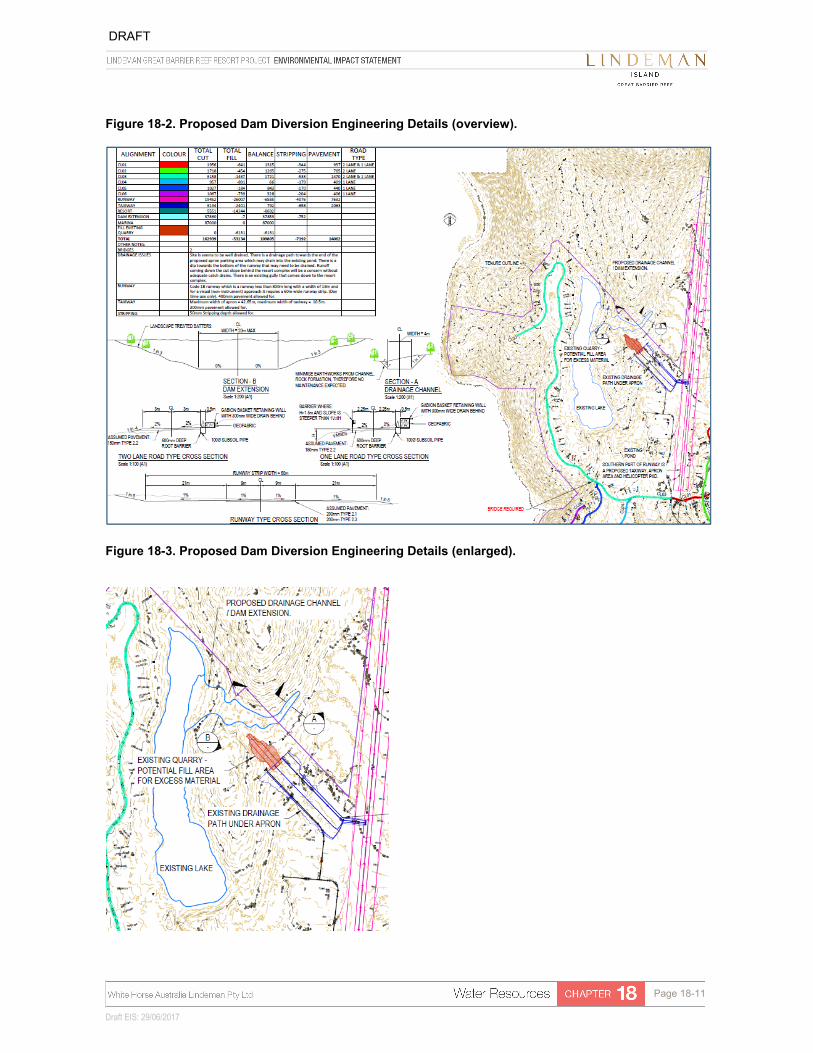
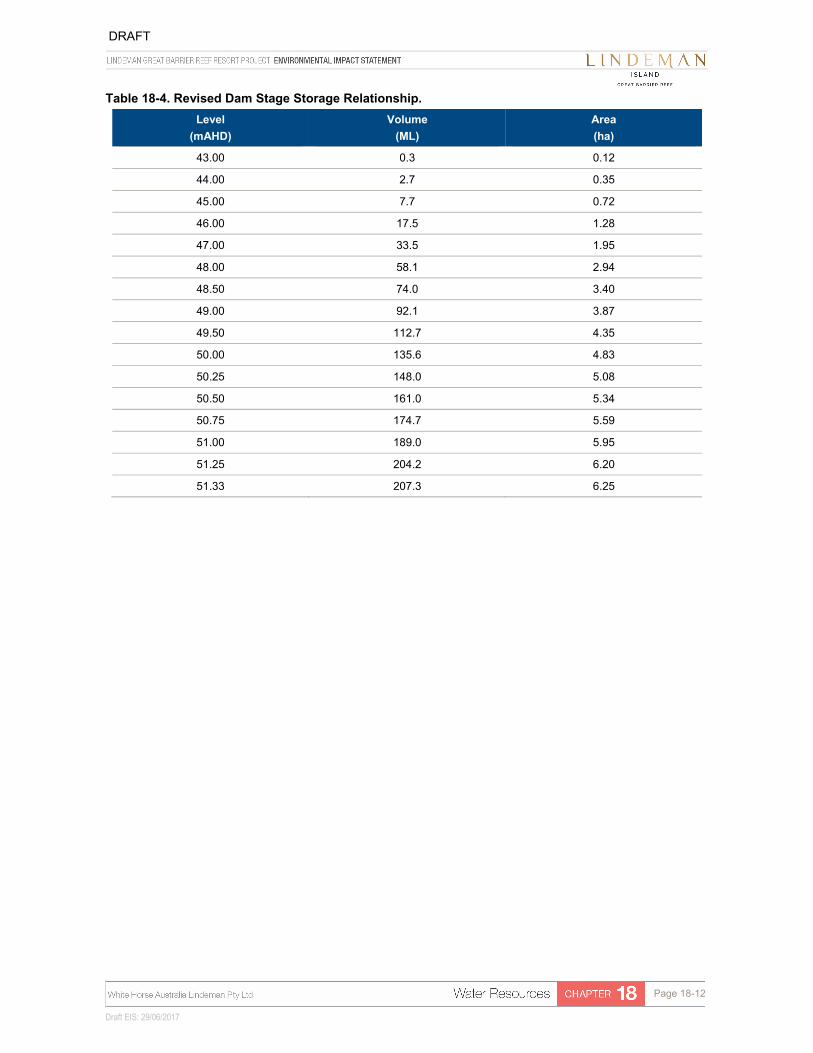
The proposed dam diversion will involve a cut of 37,860m2 and disturbance to additional areas required for the
proposed channel diversion earthworks (refer to Map 18-1 and Figure 18-2/Figure 18-3). The runoff from the
runway will need to be ensure it does not drain to the lake but is diverted to downstream stormwater treatment.
The natural and cultural values of this proposed diversion are assessed in Chapter 6 – Tenure.
L I N D E M A NI S L A N D
Note: A safe harbour is no longer proposed. Map 18-1
Draft EIS: 29/06/2017
Page 18-11
DRAFT
Figure 18-2. Proposed Dam Diversion Engineering Details (overview).
Figure 18-3. Proposed Dam Diversion Engineering Details (enlarged).
Draft EIS: 29/06/2017
Page 18-12
DRAFT
Table 18-4. Revised Dam Stage Storage Relationship.
Level
(mAHD)
Volume
(ML)
Area
(ha)
43.00 0.3 0.12
44.00 2.7 0.35
45.00 7.7 0.72
46.00 17.5 1.28
47.00 33.5 1.95
48.00 58.1 2.94
48.50 74.0 3.40
49.00 92.1 3.87
49.50 112.7 4.35
50.00 135.6 4.83
50.25 148.0 5.08
50.50 161.0 5.34
50.75 174.7 5.59
51.00 189.0 5.95
51.25 204.2 6.20
51.33 207.3 6.25
Draft EIS: 29/06/2017
Page 18-13
DRAFT
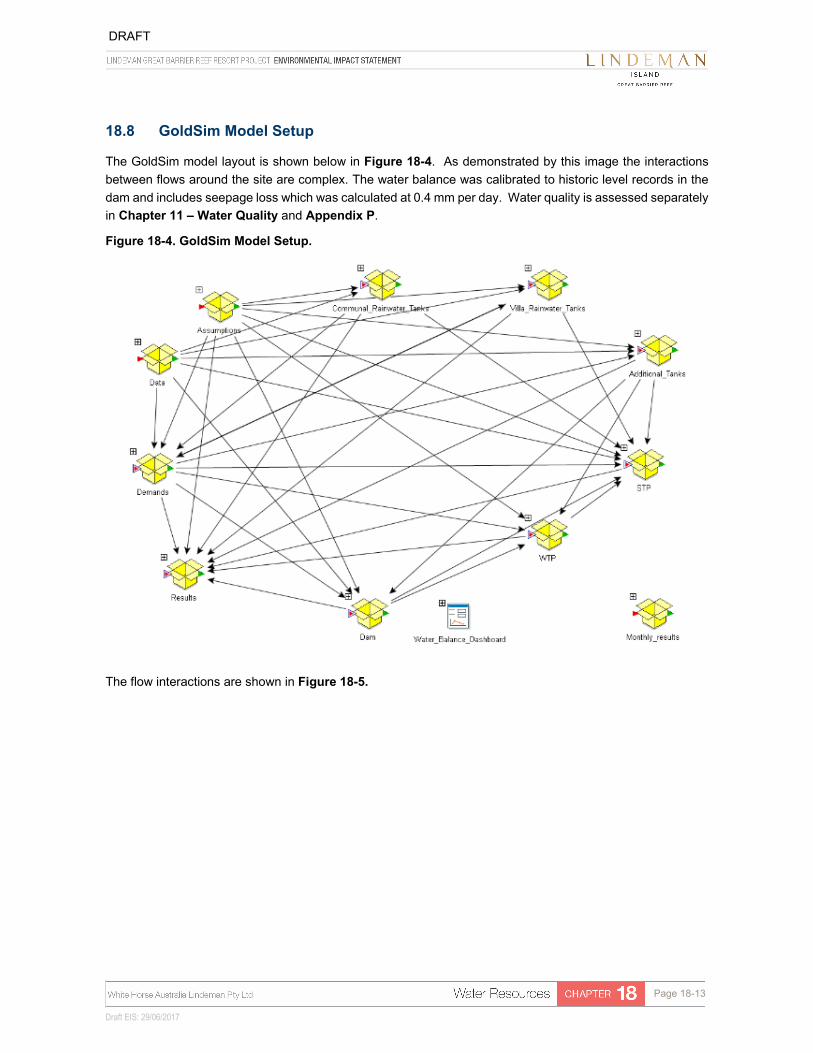
18.8 GoldSim Model Setup
The GoldSim model layout is shown below in Figure 18-4. As demonstrated by this image the interactions
between flows around the site are complex. The water balance was calibrated to historic level records in the
dam and includes seepage loss which was calculated at 0.4 mm per day. Water quality is assessed separately
in Chapter 11 – Water Quality and Appendix P.
Figure 18-4. GoldSim Model Setup.
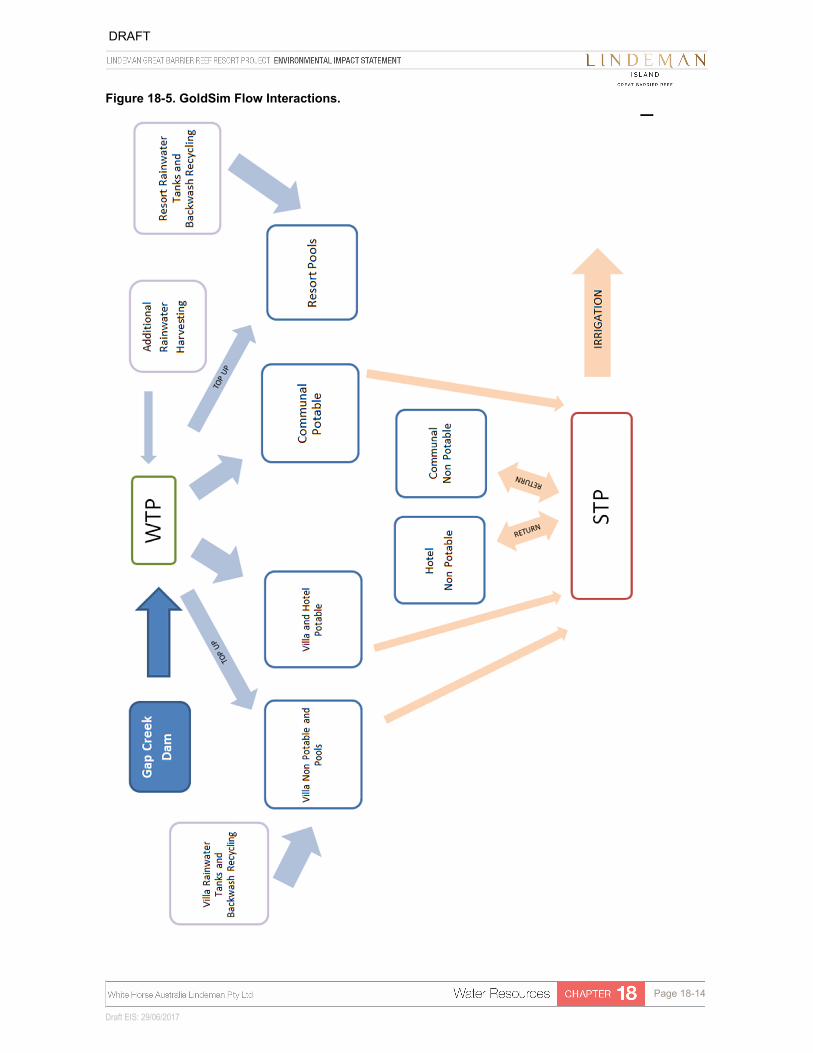
The flow interactions are shown in Figure 18-5.
Draft EIS: 29/06/2017
Page 18-14
DRAFT
Figure 18-5. GoldSim Flow Interactions.
Draft EIS: 29/06/2017
Page 18-15
DRAFT
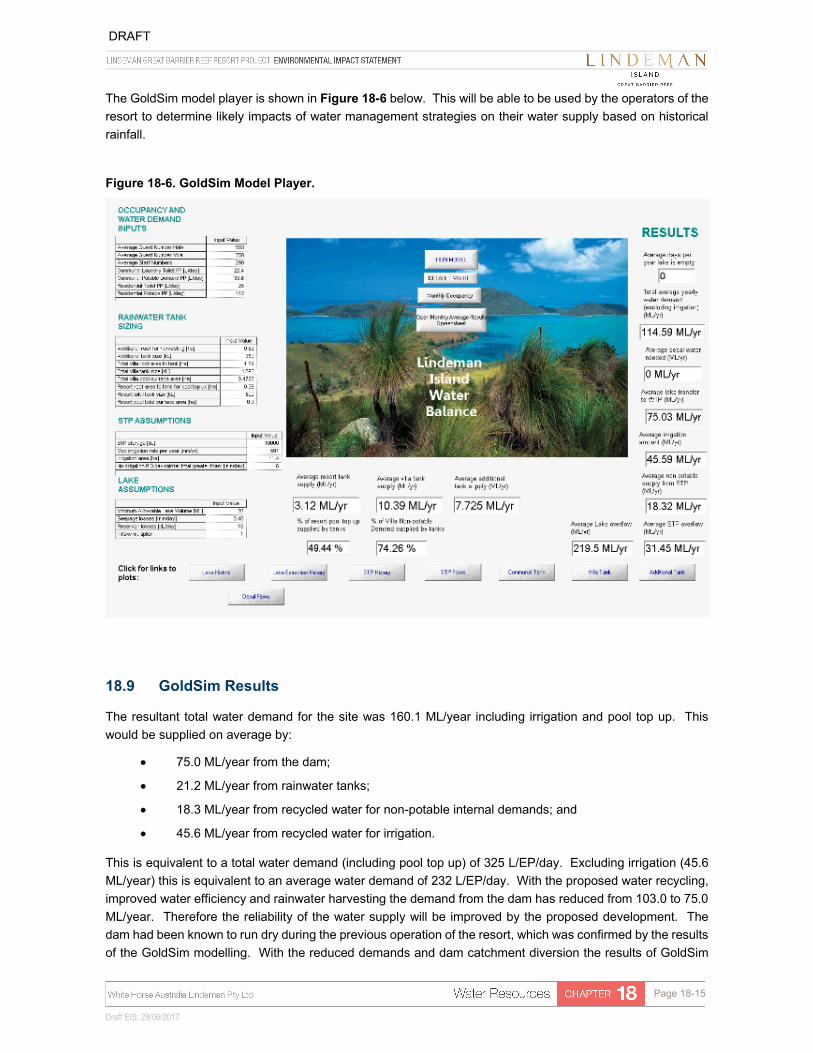
The GoldSim model player is shown in Figure 18-6 below. This will be able to be used by the operators of the
resort to determine likely impacts of water management strategies on their water supply based on historical
rainfall.
Figure 18-6. GoldSim Model Player.
18.9 GoldSim Results
The resultant total water demand for the site was 160.1 ML/year including irrigation and pool top up. This
would be supplied on average by:
75.0 ML/year from the dam;
21.2 ML/year from rainwater tanks;
18.3 ML/year from recycled water for non-potable internal demands; and
45.6 ML/year from recycled water for irrigation.
This is equivalent to a total water demand (including pool top up) of 325 L/EP/day. Excluding irrigation (45.6
ML/year) this is equivalent to an average water demand of 232 L/EP/day. With the proposed water recycling,
improved water efficiency and rainwater harvesting the demand from the dam has reduced from 103.0 to 75.0
ML/year. Therefore the reliability of the water supply will be improved by the proposed development. The
dam had been known to run dry during the previous operation of the resort, which was confirmed by the results
of the GoldSim modelling. With the reduced demands and dam catchment diversion the results of GoldSim
Draft EIS: 29/06/2017
Page 18-16
DRAFT
modelling showed that the dam was unlikely to go empty during the 50 years of simulation. If no additional
tank is provided near the WTP, then the dam would go empty in 1 dry season in 50 years, with the average
amount of water being extracted from the dam rising from 75.0 to 82.7 ML/year and as such no desalination
plant is proposed to provide potable water. A small desalination plant is proposed to treat water to be
discharged from the lagoon as part of the cleaning and maintenance process to remove the salt concentration
of the water prior to treatment of the water in the waste water plant (refer to section 4.4.12 for further
information). It should be noted that the assumed water demands for the GoldSim analysis are conservative
and full occupancy has been assumed during the peak periods.
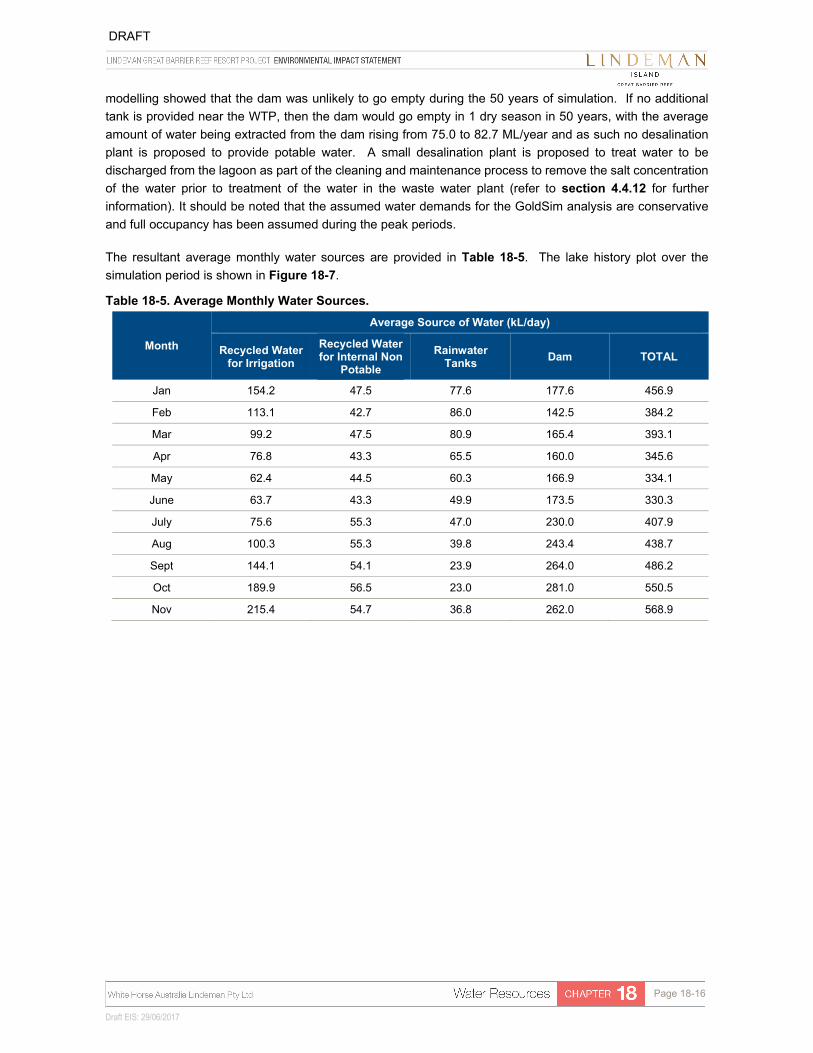
The resultant average monthly water sources are provided in Table 18-5. The lake history plot over the
simulation period is shown in Figure 18-7.
Table 18-5. Average Monthly Water Sources.
Month
Average Source of Water (kL/day)
Recycled Water for Irrigation
Recycled Water for Internal Non
Potable
Rainwater Tanks
Dam TOTAL
Jan 154.2 47.5 77.6 177.6 456.9
Feb 113.1 42.7 86.0 142.5 384.2
Mar 99.2 47.5 80.9 165.4 393.1
Apr 76.8 43.3 65.5 160.0 345.6
May 62.4 44.5 60.3 166.9 334.1
June 63.7 43.3 49.9 173.5 330.3
July 75.6 55.3 47.0 230.0 407.9
Aug 100.3 55.3 39.8 243.4 438.7
Sept 144.1 54.1 23.9 264.0 486.2
Oct 189.9 56.5 23.0 281.0 550.5
Nov 215.4 54.7 36.8 262.0 568.9

Draft EIS: 29/06/2017
Page 18-17
DRAFT
Figure 18-7. Lake History Plot.
18.10 Impact of Climate Change
The potential impacts of climate change in the Mackay Whitsunday region are summarised in the 2014-2021
WQIP. The climate change trends for the Mackay Whitsunday region include:
Increased atmospheric CO2;
Increases in average air temperatures, more hot days and fewer cold days. On a national basis, Australia’s climate has warmed by 0.9ºC, with more extreme heat and fewer cool extremes (Bureau of Meteorology and CSIRO 2014). Projections for the Mackay Whitsunday region show that average maximum temperatures may increase by 1ºC by 2030 and 2ºC by 2070 (RPS 2014);
Annual rainfall is not expected to change, however the intensity of extreme events is expected to increase (Hilbert et al. 2014). Projections for the Mackay Whitsunday region indicate baseline (1995) 1 in 100 year rainfall events may occur every 70 years by 2030 and every 60 years by 2050 (RPS 2014);
The intensity (not frequency) of tropical cyclones is expected to increase (Hilbert et al. 2014);
Evapotranspiration is expected to increase in all seasons (Hilbert et al. 2014);
Wind speeds are expected to increase across eastern Australia (Hilbert et al. 2014); and
Sea levels will continue to rise, and the frequency and height of storm surges are expected to increase (Hilbert et al. 2014).
Draft EIS: 29/06/2017
Page 18-18
DRAFT
Although the average annual rainfall is not expected to change, the increases in rainfall intensity during the
wet season, likely reductions in rainfall intensity in dry seasons and increases in evapotranspiration indicate
that an overall reduction in runoff is likely, and the reliability of the water supply will be decreased. Increased
evapotranspiration will also increase water demands. Due to the difficulties predicting the impact of climate
change on rainfall and runoff patterns the sensitivity analysis assumed that rainfall (for rainwater tanks) and
runoff was reduced by a global 20 percent. The water demands were not changed. The results of the GoldSim
analysis showed that if a reduction in rainfall and runoff of 20 percent was to occur then the dam would likely
go empty 5 times during the 50 year simulation. While this not a desirable outcome, the following measures
could be adopted in the event that these changes to rainfall patterns eventuate:
Temporary reduction in occupancy rates during prolonged dry periods;
Staff and visitor awareness programs to encourage reductions in water use; and
Install pool covers to reduce evaporation losses.
It should be noted that the GoldSim modelling has assumed full occupancy during peak periods and it is likely
that more roof area than assumed in the modelling will be able to be diverted to rainwater tanks. Therefore
the results of the analysis are conservative. The proposed development is well placed to handle the potential
impacts of climate change due to the following reasons:
The use of recycled water provides an alternative source of supply that is not reliant on rainfall. It is proposed to use recycled water for the majority of non-potable uses on site;
The proposed water demand from Gap Creek Dam is significantly less than the existing resort; and
The population at the resort is not permanent, and can be controlled if necessary during prolonged dry periods.
18.11 Sewage Treatment Plant Flows
The Sewage Treatment Plant (STP) storage was assumed to be 10ML, and no evaporation losses were
allowed for as it will be a closed storage. Based on an irrigation rate of 4ML/ha and irrigation area of 11.4
hectares the STP will overflow every wet season. This is due to inflows being significantly greater than the
recycled water and irrigation demands assumed in the GoldSim modelling. The non-potable water demand
provided by recycled water was assumed to be 63.9 ML/year (18.3 ML/year for non-potable internal demands
and 45.6 ML/year for irrigation). The results of the GoldSim modelling showed that the average irrigation rate
would need to be increased to 77 ML/year for there only to be overflow from the STP approximately once in
every ten years. The detailed MEDLI modelling conducted for the site calculated that an irrigation rate of 67
ML/year would be possible and that this would result in no overflows from the STP. The flows for this modelling
were based on expected average occupancy rates, i.e. a maximum EP of 921. As highlighted the predicted
STP discharges compared to the existing case are significantly reduced.
Draft EIS: 29/06/2017
Page 18-19
DRAFT
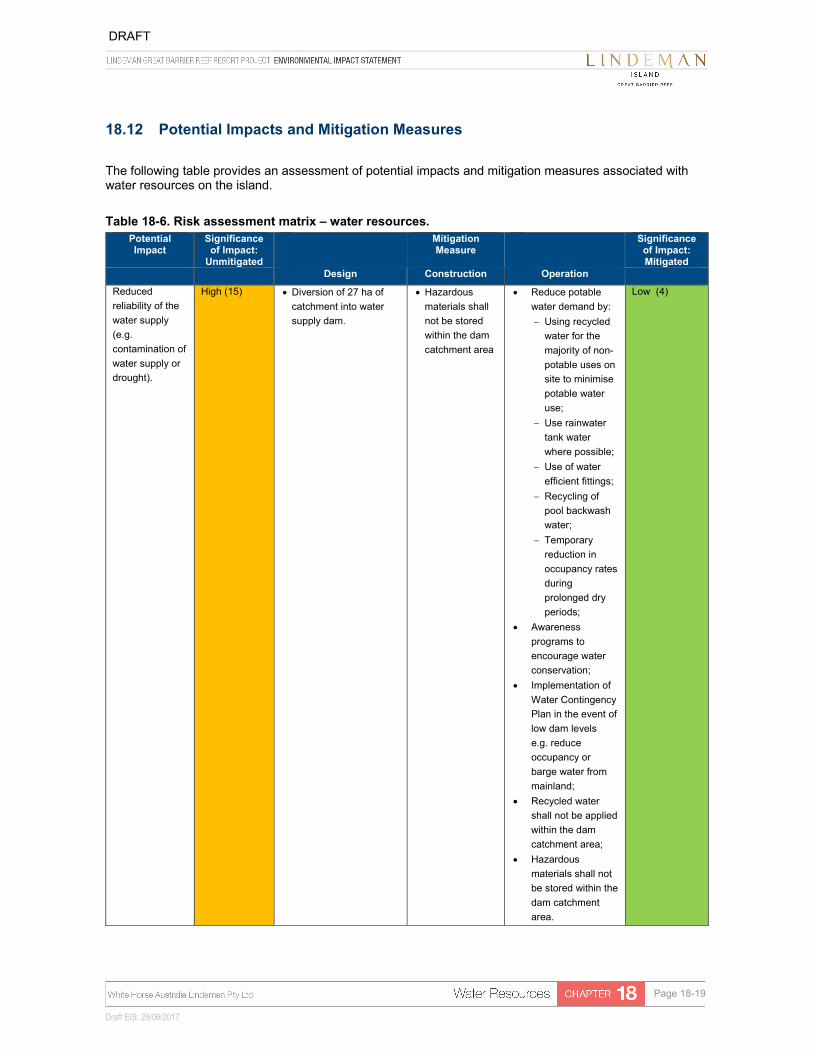
18.12 Potential Impacts and Mitigation Measures
The following table provides an assessment of potential impacts and mitigation measures associated with water resources on the island.
Table 18-6. Risk assessment matrix – water resources. Potential Impact
Significance of Impact:
Unmitigated
Mitigation Measure
Significance of Impact: Mitigated
Design Construction Operation
Reduced
reliability of the
water supply
(e.g.
contamination of
water supply or
drought).
High (15) Diversion of 27 ha of
catchment into water
supply dam.
Hazardous
materials shall
not be stored
within the dam
catchment area
Reduce potable
water demand by:
Using recycled
water for the
majority of non-
potable uses on
site to minimise
potable water
use;
Use rainwater
tank water
where possible;
Use of water
efficient fittings;
Recycling of
pool backwash
water;
Temporary
reduction in
occupancy rates
during
prolonged dry
periods;
Awareness
programs to
encourage water
conservation;
Implementation of
Water Contingency
Plan in the event of
low dam levels
e.g. reduce
occupancy or
barge water from
mainland;
Recycled water
shall not be applied
within the dam
catchment area;
Hazardous
materials shall not
be stored within the
dam catchment
area.
Low (4)

Draft EIS: 29/06/2017
Page 18-20
DRAFT
18.13 Summary
The water balance modelling in GoldSim for the proposed development identified that additional sources of
water were required for a reliable source of water. The proposed water strategy for the site includes:
Diversion of an additional 27 hectares towards the dam;
Water efficient fittings and appliances will be used;
Water saving showers to be installed in preference to baths and spas;
Awareness programs for guests and employees will be run to encourage efficient use of water;
A minimum 10kL rainwater tank will be installed at each villa which will be connected to a minimum roof area of 100m2. The rainwater tank will be used for pool top up and toilet flushing;
A 500kL rainwater tank (total combined size) for resort pool top up will be connected to 3500m2 of roof area;
A 350kL rainwater tank will be connected to a minimum of 6300m2 roof area surrounding the WTP. This will be used as a first preference for water for the WTP;
Recycled water will be used for toilet flushing (communal areas and resort units), laundry, irrigation and washdown; and
Backflow recycling tanks will be used for all pools.
The resultant total water demand for the site was 160.1 ML/year including irrigation and pool top up. This would
be supplied on average by:
75.0 ML/year from the dam;
21.2 ML/year from rainwater tanks;
18.3 ML/year from recycled water for non-potable internal demands; and
45.6 ML/year from recycled water for irrigation.
This is equivalent to a total water demand (including pool top up) of 325 L/EP/day. With the proposed water
recycling, improved water efficiency and rainwater harvesting the demand from the dam compared to the
existing resort development has reduced from 103.0 to 75.0 ML/year. Due to the proposed recycling of water
the STP flows compared to the existing resort have also been significantly reduced. MEDLI modelling showed
that if average occupancy rates are assumed then discharges to the ocean are unlikely.
Climate change may reduce the reliability of the water supply in the future. However, the proposed
development is well placed to handle the potential impacts of climate change due to the following reasons:
The use of recycled water provides an alternative source of supply that is not reliant on rainfall. It is proposed to use recycled water for the majority of non-potable uses on site;
The proposed water demand from Gap Creek Dam is significantly less than the existing resort; and
The population at the resort is not permanent, and can be controlled if necessary during prolonged dry periods.
The proposed water supply for the resort (dam and rainwater tanks) will only capture a small component of the
total water that flows over the site and will have a minimal impact on the flow regimes and volume of water
discharged to reef waters during a rainfall event.


![Henry Lindeman - Method for Saxophone[1]](https://img.pdfslide.us/doc/110x75/5571f32149795947648d8c23/henry-lindeman-method-for-saxophone1.jpg)