Embed Size (px)
Citation preview
Chapter 18
Effects of Stress and Defence Allocation
on Tree Growth: Simulation Results
at the Individual and Stand Level
T. R€otzer, T. Seifert, S. Gayler, E. Priesack, and H. Pretzsch
18.1 Introduction
The long life span of trees implies that they are more or less frequently confronted
with different biotic and abiotic stress situations during their lives. However, biotic
stress such as attacks by herbivores or pathogens and abiotic stress such as frost or
drought could strongly vary in frequency, intensity, duration, time of occurrence
as well as in the involved tissues. This urged trees to develop flexible defence
mechanisms during their evolution ensuring a high probability of survival to
regenerate successfully. Based on an analysis of existing literature on plant
response to herbivory, McNaughton (1983) concludes that “. . .the yield of the
tissue affected and other tissues is not affected in proportion to the amount of
tissues damaged by the herbivore”, referring also to Lee and Bazzaz (1980) and
Neilsen (1981). McNaughton presents a set of alternative patterns about the effect
T. R€otzer (*) • H. Pretzsch
Chair for Forest Growth and Yield Science, Technische Universit€at M€unchen, Hans-Carl-von-Carlowitz-Platz 2, 85354 Freising, Germany
e-mail: [email protected]
T. Seifert
Department of Forest and Wood Science, Stellenbosch University, Private Bag X1, 7602
Matieland, South Africa
S. Gayler
Water & Earth System Science Competence Cluster, University of T€ubingen, Keplerstr. 17,72074 T€ubingen, Germany
E. Priesack
Institute of Soil Ecology, Helmholtz Zentrum M€unchen, Ingolst€adter Landstr. 1, 85764Neuherberg, Germany
R. Matyssek et al. (eds.), Growth and Defence in Plants, Ecological Studies 220,DOI 10.1007/978-3-642-30645-7_18, # Springer-Verlag Berlin Heidelberg 2012
401

of herbivory; at low herbivory levels growth reactions of individual plants range
from immediate decline to a certain compensation. At moderate herbivory even a
positive effect and overcompensation can be the result. These described patterns are
in line with the phases of stress response defined by Larcher (2003).
Under the conditions of limited resources, a tree has the “choice” either to invest
in growth to stay competitive against its neighbours, or to adapt to biotic and abiotic
stress to keep the gained resources (see Chap. 1). Koricheva (2002) classified the
costs involved in the context of herbivory in three major groups, which are also
applicable to other pathogens and stress situations: allocation costs, ecological costs
and opportunity costs. Allocation costs define the internal trade-offs between
growth, defence and reproduction within the individual plant (Chew and Rodman
1979; Rhoades 1979; Bazzaz et al. 1987; Simms 1992; Seifert and M€uller-Starck2009), while ecological costs are external trade-offs caused by defence investments
in other than defence or growth-related properties, such as increased susceptibility
against other pathogens or abiotic stress. Other ecological costs are negative effects
of the induced defence on pollinators, predators and parasitoids (Simms 1992;
Rausher 1996). Opportunity costs are costs incurred through an investment in
defence instead of investing in growth. In this sense these are costs of resources
to defend against herbivores and pathogens, based on what could have been earned
if the resources had been used for growth. Based on published results of Coley et al.
(1985), Gulmon and Mooney (1986), and Koricheva (2002) and first simulation
studies of Seifert (2007) with an empirical growth model, it could be assumed that
opportunity costs have a substantial influence on the consequences of an allocation
strategy of a tree and may be even more important than the actual diversion of
resources. Opportunity costs involve similarly tree and stand level, and imply a
decline of competitiveness of the subject tree compared to neighbouring trees. This
effect is caused by the fact that the subject tree cannot use the invested products of
the assimilation for growth since they were allocated to defence. This can lead to a
feedback cycle that consistently increases the loss of competitiveness over time
(Fig. 18.1).
It is obvious that an adapted defence strategy is only one determinant of the
allocation strategy that ensures a tree’s long-term survival. Growth and space
occupation strongly determine the access to above- and below-ground resources,
and thus define the absolute amount of resources that can be acquired (e.g. Grams
et al 2002; Gayler et al. 2006; R€otzer et al. 2009). The consequence is that social
position and tree size in relation to the competing trees are highly correlated with
tree growth (e.g. Seifert 2007; Seifert and M€uller-Starck 2009). As a result a tree
has to adjust its allocation in a way that it allows sufficient defence without losing
competitiveness regarding space occupation and resource acquisition. “Allocation”
can be defined as biomass partitioning, in the sense of translation of resources to
structural components of a plant (e.g. Niklas and Enquist 2002). Defence-related
allocations are only partly structural; they involve chemical compounds in a non-
structural sense.
402 T. R€otzer et al.

During the past years allocation patterns of trees have gained increasing scien-
tific attention. Particularly the trade-off questions of growth and defence, subject to
the resource availability of the tree, have been analysed (e.g. H€aberle et al. 2009;
Chap. 1). Several competing hypotheses have been presented and were highly
discussed (Hamilton et al. 2001; Stamp 2003). Most of the empirical and theoretical
work is focussed on the allocation pattern within the individual plant. With regards
to forest trees, it seems especially rewarding to extend the focus in order to have a
closer look at the effects of stress-induced allocation patterns in a competitive
environment. This opens up a way to evaluate the long-term success of certain
allocation strategies. This approach includes the examination of the effects at the
tree and at the stand level alike, to take into consideration that forests are highly
complex spatially and temporally determined systems.
There is strong evidence for a feedback of the resource availability on the
allocation pattern in defence- or growth-related metabolism (Coley et al. 1985;
Herms and Mattson 1992; see also Chap. 17). This interdependence of defence- and
growth-related allocation can lead to trade-off situations where the tree grows less
in favour of strengthening its defence. The correlation between environmental
stimuli and internal allocation processes are still not understood well enough.
Further lack of knowledge becomes evident if the focus of interest is moved
from the individual tree to the stand level. Due to the intense interaction of
the individuals, the stand cannot be explained from reaction of solitary trees. For
example if a certain proportion of trees in a stand has decreased growth in
stand level tree level
allocation in defence
defensive situation
enhanced
decreased growth
competitors grow more
less resources for growth
feedback
Fig. 18.1 Concept of opportunity costs of a tree as a consequence of defence allocation
18 Effects of Stress and Defence Allocation on Tree Growth: Simulation. . . 403

consequence of herbivore attack, or an allocation shift from growth to defence
metabolism, one could assume that other trees, which are not affected, will take the
opportunity and try to occupy the space. These compensation effects are dependent
on the spatial pattern of trees and are especially regarded to be attenuated in mixed
species stands, which contribute to their resilience and economic feasibility
(e.g. Knoke and Seifert 2008).
From the above stated it can be concluded that stressor–plant interactions are
inevitably linked with plant–plant interaction patterns. A rigorous examination of
those dependencies is necessary to understand trade-off reactions of the individual.
As a result of an extensive meta-analysis on costs of plants confronted with stress
as, e.g. herbivores, Koricheva (2002) pointed out that most of the compiled studies
were aimed at the internal trade-offs of the individual plant and excluded the
interaction with the biotic environment.
To overcome the problems described above an alternative way was followed to
evaluate the effects of biotic and abiotic stress on the growth, defence and alloca-
tion patterns by resorting to a growth model-based approach. Provided the tree–tree
interaction and the resource competition are reproduced plausibly in the model,
scenario analysis can give most desired stress scenarios for various types of tree
stands with defined spatial stand structures.
In the following a simulation study is presented to analyse the effects of biotic
and abiotic stress on growth, allocation and defence at tree and stand level. The
scenario simulations were based on the eco-physiological individual-tree growth
model BALANCE and include three scenarios with pure and mixed stands. The
objectives were to investigate
1. The magnitude of opportunity costs
2. The effects of different intensities and frequencies of defoliation stress and
3. The effects of drought stress.
18.2 The Eco-Physiological Growth Model BALANCE
Growth models–particularly eco-physiological growth models–have been proven
suitable tools for analysing the effects of environmental changes on the growth of
entire forest stands, individual trees or even specific tree compartments such as
roots or stems, as they integrate a wide range of system knowledge (Pretzsch et al.
2008; Fontes et al. 2010). They simulate forest growth on the basis of generally
accepted eco-physiological principles (see Chap. 15). Well-known physiological
models were developed by Running and Coughlan (1988), Kellom€aki et al. (1993),Mohren and van de Veen (1995), Landsberg andWaring (1997), Bossel (1996), and
Bartelink (2000).
Apart from the evaluation and understanding of a tree’s internal resource
allocation and related “decisions” on regulation, these kinds of models can also
404 T. R€otzer et al.
be used as versatile tools for revealing the effects of defence allocation on the long-
term growth and competitive success of trees.
Dedicated spatial and eco-physiologically based tree-growth models, such as the
newly developed model BALANCE (Grote and Pretzsch 2002; R€otzer et al. 2005,2010), allow for scenarios confronting different forest stands with biotic and
abiotic stress. The competitive capacity of a tree can be quantified, i.e. the
amount of resources which has to be allocated to defence instead of to growth.
Eco-physiologically based models give answers about the consequences and
implications of these trade-offs. BALANCE is a functional–structural model,
which accounts for the influence of competition, stand structure, species mixture,
and management impacts on individual tree growth. Tree development is calculated
depending on the explicitly spatial environmental conditions of each tree. In turn,
each tree is influencing its microenvironment in terms of, e.g. shading or water
consumption.
The three-dimensional development of the individual trees in a forest stand is
estimated based on the annual increase of biomass. The simulation of the carbon,
water and nutrient balances of the individual trees form the core processes of
the model. Each tree of a forest stand is divided into crown and root layers,
which are in turn subdivided into eight crown- and eight root sectors. For each
layer or each sector respectively, the micro-climatic conditions and the water
balance are computed daily. Assimilation, respiration, nutrient uptake, growth,
senescence and allocation are calculated in 10-day periods from the aggregated
weather and water balance variables. This way, the approach takes into account the
physiological responses to weather conditions, CO2 concentration, water and nitro-
gen availability, as well as biotic and abiotic stress. The seasonal development of
foliage is explicitly modelled to include light availability and radiation absorption
changes depending on leaf biomass (see also Chap. 8). The beginning of bud
burst is predicted based on temperature sums (R€otzer et al. 2004), while foliage
senescence is estimated depending on the respiration sum (R€otzer et al. 2010). Theindividual tree approach of BALANCE facilitates the simulation of pure and mixed
stands of various age structures and patterns of species mixtures.
For the initialisation of BALANCE, tree position, stem diameter, crown dimen-
sions and stem height for every tree are required as well as a basic description of the
soil (field capacity, wilting point, nutrient status, rooting depth). Daily meteorologi-
cal values of temperature, radiation, wind speed, humidity and precipitation are used
as driving forces of the simulations. Additionally, CO2 concentration of the air and
N-deposition data can be considered. Output is obtained from daily up to annual
values in a spatial resolution of individual tree compartments and can be aggregated
to tree and stand values. Apart from growth data such as diameter, height or carbon
content, data describing standmicro-climate and water balance can also be obtained.
Growth model evaluation was an integral part of the development of BALANCE.
The basic processes, i.e. micro-climate within the stand, water balance, photosyn-
thesis and phenology, have been evaluated for the site “Kranzberger Forst” (R€otzeret al. 2010). Further on, numerous validation studies for different sites in Central
Europe, for different tree species and different climate regimes have proven that
18 Effects of Stress and Defence Allocation on Tree Growth: Simulation. . . 405

BALANCE is suitable for growth simulations and analyses after adapting the model
to the site (Grote 2002; Grote and Pretzsch 2002; R€otzer et al. 2004, 2005, 2010).
18.3 Scenario Definition
To elucidate the reactions and feedback reactions of growth, defence and competi-
tion different scenarios simulating biotic stress are presented: Defined investment
proportions for the defence against a pathogen, specific loss of biomass to
herbivores, and abiotic drought stress. Both biotic and abiotic stresses were varied
with respect to intensity, duration, frequency and time of occurrence. Within the
simulations not only individual trees, but also entire stands, different stand
structures, i.e. species mixtures and their spatial formations were considered.
Each scenario required defining an initial stand with a certain structure. These
stands were then confronted with defined biotic and abiotic stress scenarios over the
simulation period of 14 years.
18.3.1 Initial Stand Structure
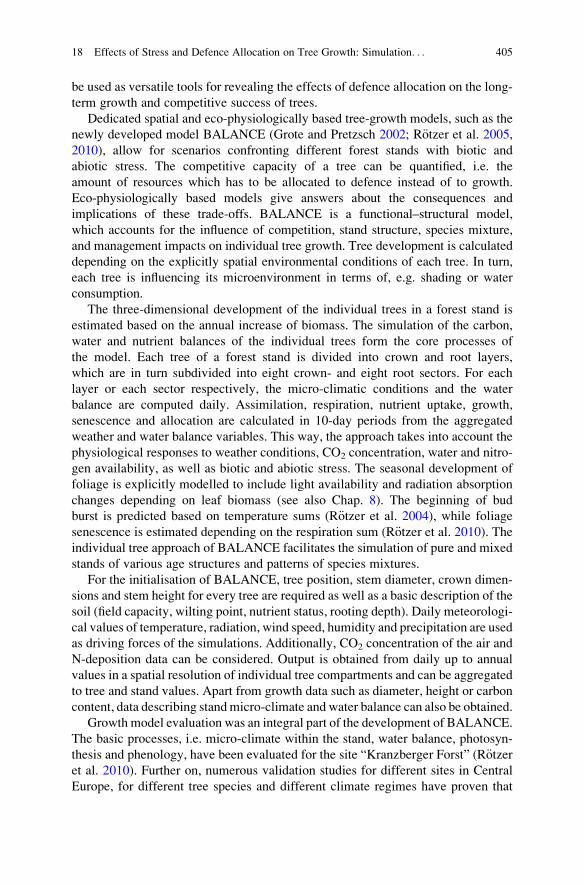
Virtual tree stands (30 m � 30 m) of different mixing ratios and spatial structures
of adult Norway spruce (Picea abies (L.) Karst.) and European beech (Fagussylvatica L.) were created based on the structure generator “STRUGEN” (Pretzsch
1997). The mixing structure varied to represent mixture in groups and clusters of
beech and a random individual tree mixture (Fig. 18.2).
18.3.2 General Site Conditions
The site conditions used for the scenario simulations were based on data of the SFB
607 site “Kranzberger Forst”, located in Southern Germany (48.420�N, 11.662�E,elevation 490 m a.s.l.). For the simulation period of 1994–2007 the mean annual air
temperature was 8.1�C, the mean annual radiation 1,096 J/cm and the mean annual
precipitation sum 842 mm. Thus, temperature as well as precipitation were at the
upper limit of the long-term regional averages (BayFORKLIM 1996), which ranged
between 7 and 8�C (period 1951–1980) resp. between 750 and 850 mm (period
1961–1990). Radiation, on the other hand, was somewhat higher than the long-term
mean with 1,015 J/cm for the period 1976–1989 (BayFORKLIM 1996). The growing
season extended from mid April through the end of October. The soil of the study
site—a Luvisol—is described in more detail in Chap. 9. For the calculation of the
water balance, we distinguish four soil layers with a maximum rooting depth of
1.2 m.
406 T. R€otzer et al.
18.3.3 Stress Scenarios
Regardless whether biotic or abiotic, stressors can occur and lead to disturbances
in the growth of individual trees and forest stands. Growth rates may change
competition of trees or allocation patterns to a great extent according to the stress
intensity, the duration of the stress (short, long or even continuous) the stress
frequency (received as a single or repeated pulse), and the phase of stress occur-
rence (early or late within the growing period) (Fig. 18.3).
For the simulation studies three stress scenarios were defined that varied
according to the intensity, duration and frequency of the stress (Table 18.1):
Scenario I (opportunity costs) was set up to investigate opportunity costs of
beech in a mixed stand. A constant defence investment rate was deducted from the
available net resources for all beech trees while spruce trees were not subjected to
defence investments.
In Scenario II (consequences of defoliation), different rates of defoliation were
simulated for a pure beech stand. Defoliation was simulated by a proportional
removal of leaf biomass equally over all crown parts. A partial replacement of
leaves by proleptic sprouting as found in beech was not simulated. Four levels of
defoliation intensity were compared with the control. These were combined with
three different frequencies of the years of leaf loss in a 10-year period. In the last 5
years no defoliations were simulated.
spruce : beech
big groups
70 : 30
50 : 50
30 : 70
random clustered
pure stands
Fig. 18.2 Initial stands for the scenario simulation. The stands differ in the proportion of spruce
and beech in the crown projection and the degree of clustering of the tree species (green circlesrepresent beech, red circles spruce trees)
18 Effects of Stress and Defence Allocation on Tree Growth: Simulation. . . 407

In Scenario III (effects of drought stress) years with different intensities of
drought periods as well as years with optimal growth conditions were chosen to
analyse the effects of water deficit on the growth of individual trees and entire pure
and mixed stands. The influence of drought stress on allocation patterns was
studied.
18.4 Analysis Methods
The response variables to characterise stress effects were production rates of leaf
biomass, fine root biomass, free C-pool (reserve), total structural biomass (above-
and below-ground), tree diameter and net primary production. Additionally, allo-
metric relationships were calculated to look for changes in the partitioning.
Pretzsch (2009) proposed a set of different ways for empirical diagnosis of growth
disturbances of forest trees. Two main methods were applied to analyse the
simulation results: a pairwise comparison of affected and unaffected trees and a
comparison of the average response with variation on the plot with a control plot.
The first method is the method of choice if the initial stand is homogenous.
Compared to empirical studies, the advantage of simulation studies is that the
determination of equal pairs of trees is simple since initially identical trees can be
simulated ceteris paribus with different treatments (Seifert 2007; Pretzsch 2009).
In the case that stand structure is used as an independent variable, the initial
stand structure is different. That favours the second method with the average and
variance of trees affected and unaffected by stress of a plot to be contrasted with the
values of the control plot.
In most cases relative changes of the stress scenarios to the control were chosen
to analyse the patterns because the main focus of the simulation study was to reveal
the reaction rather than providing absolute magnitudes. The main response
variables were the allocation patterns of the trees, and tree growth, both analysed
on the individual tree and stand level.
time
inte
nsity
intensity duration frequency time of occurrence
time
inte
nsity
time
inte
nsity
time
inte
nsity
inte
nsity
inte
nsity
inte
nsity
inte
nsity
high continuous single early
low short repeated late
Fig. 18.3 Contrasting levels of stress patterns (intensity, duration, frequency and time of
occurrence)
408 T. R€otzer et al.

Table
18.1
Stressscenariosthat
varyin
intensity,frequency,durationandtimeofoccurrence
ofthestress
Scenario
Initialstands
Intensity
Frequency
Duration
Tim
eof
occurrence
(month)
Number
of
simulationruns
ScenarioI
“Opportunitycosts”
Pure
beech
0,10,20,30,40,50%
for
defence
investm
ent
Single
Continuous
–6
All(only
beech
was
stressed)
0,10,20,30,40,50%
for
defence
investm
ent
Single
Continuous
–60
ScenarioII
“Consequencesof
defoliationattree
level”
Pure
beech
%Defoliation
Repetition
Year
00�
––
–1
25,50,75,99
1�
1Pulse
54
25,50,75,99
3�
1,6,11
Pulse
54
25,50,75,99
4�
1,4,7,10
Pulse
54
ScenarioIII
“Droughtstress
and
standstructure”
All
Nodroughtandselected
“drought”
years
––
––
11
18 Effects of Stress and Defence Allocation on Tree Growth: Simulation. . . 409

18.5 Effects of Stress on Growth and Allocation Pattern
18.5.1 Scenario I: Biotic Stress on Stand Level
In the first scenario, a response to a species-specific pathogen was simulated for a
mixed stand. The beech trees in the stand were subjected to a constant defence
investment while the competing spruce trees were not. For each beech tree the
available free carbon pool was reduced by 10–50% to simulate different defence
rates. The objectives of the scenario simulation were the quantification of opportu-
nity costs and the investigation of the structural stand variables that influence the
opportunity costs. Additionally, a closer look was taken at adaptive changes of
structural allometric relationships as a consequence of defence allocations.
In Scenario I, it was assumed that a tree incurred opportunity costs if the
predicted growth losses were higher than indicated by the specified defence invest-
ment. For example in case of incurred opportunity costs a tree with a defence
investment of 30% of the available net resources should lose more than 30% of its
growth, compared to the control tree, which was not subjected to that investment.
Over time compound interest effects have to be considered.
18.5.1.1 Quantification of Opportunity Costs
Economic theory can be employed to analyse investment patterns in plants (Bloom
et al. 1985). An adequate response variable to assess possible opportunity costs is
the total biomass of the tree and its changes because it is unaffected by shifts in
the partitioning between the tree compartments. A cross-sectional analysis of all
Scenario I simulations revealed a significant drop in biomass production after
14 years of simulation (Fig. 18.4). The results indicate an effect beyond the relative
reduction of net resources. At 10% defence rate beech trees showed a decrease in
total biomass of 16.1% on average compared to the control. At 50% defence rate,
67.4% of the biomass was lost. These results strongly suggest the presence of
compound interest effects caused by losses of competitiveness in space occupation
and resource acquisition of trees investing in defence instead of growth, which
leads to opportunity costs.
The spruce trees profit from the decreased growth of the beech trees, but from a
beech defence investment rate of 30% upwards, spruce trees were not able to
compensate for the decreased growth of beech trees any more. However, we have
to take into account the “compound interest effect”. A quantification of the annual
costs instead of the accumulated costs over the 14 years is therefore necessary to
investigate the presence of opportunity costs. In the simulated early growth phase
trees grow with nearly constant increment rates. Thus in approximation the well-
known concept of the compound interest rate can be adapted from economics
(Eq. 18.1)
410 T. R€otzer et al.

i ¼ FV=PVð Þ1=n � 1; (18.1)
where i is the compound interest rate, PV is the present value, FV the future value,
and n the time in years.
Translated to biological terms PV is the tree biomass at the beginning and FV the
biomass at the end of the simulation period which will be denoted by x and y resp.further on. The compound interest rate i represents the annual biomass increment.
In our case two effects influence biomass increment: the given defence investment
d, and c, the true opportunity costs that are incurred by the loss in competition. It is
important to note that the opportunity costs c are incurred additionally to the
defence investment d. In order to obtain c Eq. 18.1 has to be extended (Eq. 18.2)
yd ¼ x � ð1þ i � ð1� dÞ � ð1� cÞÞn; (18.2)
where yd is the final biomass with defence investments considered according to the
simulation; x is the initial biomass, i can be obtained from the control simulation
without defence investment (Eq. 18.3) and d is the given defence investment
percentage divided by 100; n represents the simulation period (14 years)
yc ¼ x � ð1þ iÞn; (18.3)
where yc is the final biomass of the control simulation, without defence investment.
Defence allocation of beech in proportion to net resources
Tot
al s
truc
tura
l bio
mas
s in
rel
atio
n to
con
trol
(1.
0)
beech
spruce
Fig. 18.4 Predicted deviation of total structural biomass of beech and spruce in a simulated mixed
stand in relation to the control (1.0 line): Beech trees are subjected to different defence investment
proportions (lower line with circles). They are compared to the reaction of the non-investing
spruce trees in the same stand (upper line with diamonds)
18 Effects of Stress and Defence Allocation on Tree Growth: Simulation. . . 411

By obtaining i from Eq. 18.3 and inserting it in Eq. 18.2, Eq. 18.2 can be solved
for c (Eq. 18.4)
c ¼ 1�
ffiffiffiffiffiffiffiffiffiffiffiffiffi
ydx� 1
n
r
i � 1� c: (18.4)
The results are presented in Table 18.2, where the opportunity costs (competition
effects c) are calculated in proportion to the defence investments d.The scenario results suggest that the relative importance of opportunity costs
compared to allocation costs increase in a nonlinear fashion with increasing
defence rates, ranging from 1.5 at 10% defence investment to more than 3.0 at
50% defence investment. This means that opportunity costs caused by competition
effects were always higher than the direct defence investments.
18.5.1.2 Influence of Stand Structure on the Opportunity Costs
A particularly relevant question in mixed stands is how stand structure and inter-
specific competition influence the opportunity costs, because this determines the
long-term competitiveness of a tree species. It also gives an indication for practical
forestry on how stand composition impacts growth, in situations where one species
is stressed in a mixed stand. An analysis of the simulation results of Scenario I was
carried out based on multiple linear regression. The objective was to determine the
influence of the beech proportion and the spatial distribution of beech (mixing
pattern) within the stand on biomass growth. As a response variable, the biomass at
the end of the simulation period in relation to the control was selected (Eq. 18.5)
Biomassproportion ¼ aþ b � defenceproportion þ c � beechproportion þ d �mixing pattern,
(18.5)
where a, b, c and d are fitted regression parameters.
Again beech was the tree species subjected to different degrees of defence
allocation.
The results in Table 18.3 indicate for beech that the deviation of biomass from
the control is significantly influenced by the proportion of beech in the stand.
Table 18.2 Opportunity costs expressed as competition-based growth reductions c in relation to
direct defence investments d (given in the first column)
Defence investment % 10 20 30 40 50
Opportunity costs Mean 1.40 1.35 1.87 2.63 3.08
95% Confidence interval Lower 1.25 1.23 1.79 2.39 2.98
Upper 1.57 1.51 1.97 3.03 3.18
412 T. R€otzer et al.

The spatial distribution of the mixture (random, cluster, group) is only significant at
the 0.1 level. An increased beech proportion leads to less severe growth reductions,
because the interactions with spruce trees were decreased. For spruce, which was
not subjected to defence investments, the beech proportion in the mixture was non-
significant while the distribution of species had a highly significant influence.
Spruce trees seem to profit from a random individual tree mixture much more
and are able to gain competitiveness over the beech in our scenario. The bigger the
beech groups, the less attenuated the advantage of spruce.
18.5.1.3 Changed Allometric Relations as a Result of Defence and Different
Stand Structures
It is important to consider the cause of the changes at the individual tree level.
Changes in structural partitioning become obvious if the allometric relationships of
the trees are changed. Based on the results of Scenario I, allometric functions were
calculated that relate the diameter at breast height (dbh) to the total tree biomass.
Based on a double logarithmic function: lnðbiomassÞ ¼ aþ b � lnðdbhÞ the influ-
ence of the beech proportion and the way the trees are mixed spatially (mixing
pattern) on the allometric slope parameter b were assessed for each of the stands
in Scenario I. The database for the analysis was again the situation at the end of the
14 years simulation period.
The regression fits of the simulation results with a second-degree polynomial
suggest that beech trees subjected to defence allocation react to increasing inter-
specific competition with a changed allometry. The slope parameter showed a
correlation to the beech proportion (Fig. 18.5, left). In the stand with the 70:30
spruce/beech proportion, the allometric relation had the lowest slope parameters
indicating the lowest biomass per dbh. The biomass per stem diameter in beech is
reduced with increasing amount of spruce in the stand. Interestingly, the allometric
Table 18.3 Multiple linear regression analysis of simulation results in Scenario I: Influence of
proportionally invested resources in defence (Defence proportion), beech proportion in the stand
and spatial species distribution (Cluster) on the total biomass in relation to the control
Species Model parameter
Unstandardised
coefficients
Standardised
coefficients
t Sig.B Std. error Beta
Spruce a (Constant) 1.276 0.037 34.787 0.000
b Defence
proportion
0.007 0.001 0.280 11.623 0.000
c Beech proportion 0.000 0.001 0.017 0.716 0.474
d Cluster �0.099 0.010 �0.236 �9.786 0.000
Beech a (Constant) 0.826 0.019 42.427 0.000
b Defence
proportion
�0.014 0.000 �0.733 �46.953 0.000
c Beech proportion 0.002 0.000 0.213 10.916 0.000
d Cluster 0.008 0.004 0.037 1.891 0.059
18 Effects of Stress and Defence Allocation on Tree Growth: Simulation. . . 413

slope values peek according to the proportion of net resources that are allocated to
defence. At 70:30 spruce/beech proportion the peek is around 15% defence propor-
tion, 50:50 proportion led to a peak at around 20% and with 30:70 spruce/beech
proportion in the stand the peek was around 25%. The influence of the interspecific
mixture of the two species is similar (Fig. 18.5, right). The more intensively the
individual trees of the two species intermingle spatially, the more the allometry is
changed and the biomass per dbh of beech is reduced. The statements made on the
nonlinearity of the correlation and the maximum of the slope parameter at the
examination of the beech proportion are equally valid for the clustering structure as
for the independent variable.
18.5.1.4 Scenario I: Discussion
Our results suggest that opportunity costs in their compound interest effect are a
relevant factor for trees, confirming results obtained by Koricheva (2002) and
Seifert (2007). The observed pattern suggests that competition-related opportunity
costs have a bigger effect on annual biomass increment than the defence
investments themselves. Moreover, opportunity costs increased over-proportionally
with increasing defence investments. In the mixed scenario decreased increments of
the defence investing beech trees were compensated for by the non-investing spruce
trees, if defence investments of beech did not exceed 20–30%. The proportion and
type of mixture of affected trees in a stand influenced growth losses and compensa-
tion, and were reflected in changed allometric relationships between stem diameter
at breast height and biomass of the affected species. The allometric changes
indicate an adaptation of the allometric pattern of beech according to defence
investment and the amount of beech in the stand with an interaction between both
variables. Spruce trees were strong competitors for resources because they were not
subjected to a defence allocation in this scenario. With an increasing proportion of
spruce trees in the stand, the maximum biomass per diameter of beech trees is
0.0
0.5
1.0
1.5
2.0
2.5
3.0
3.5
4.0
0
defence proportion
slop
e pa
ram
eter
7030
5050
3070
10 20 30 40 50 600.0
0.5
1.0
1.5
2.0
2.5
3.0
3.5
4.0
0
defence proportion
10 20 30 40 50 60
slop
e pa
ram
eter
random mixture
clustered mixture
grouped mixture
Fig. 18.5 Influence of species’ mixing ratios (left) and spatial mixing structure (right) on the
allometric relationship of beech between dbh and total biomass (the first two digits in the species
code indicate the proportion of spruce, the second two the proportion of beech; e.g. 7030 codes for
70 % spruce and 30 % beech)
414 T. R€otzer et al.

reached at increasingly smaller defence rates. This reaction pattern shown in the
simulations is supported by the fact that intensive intermingling of the species
resulted in decreased biomass per dbh of the beech trees.
18.5.2 Scenario II: Biotic Stress on Tree Level
18.5.2.1 Influence of Defoliation Patterns
The second scenario aims at investigating the influence of different defoliation
patterns on tree growth and partitioning at the individual tree level. Using the total
biomass in relation to the control as a response variable, the simulation results show
that low intensities of defoliation like 25 and 50% at low frequencies (only once in
the simulation period) led to a recovery but no overcompensation of biomass
(Fig. 18.6). Also three consecutive defoliations with 25% leaf loss were followed
by a near complete recovery. Higher defoliation rates, especially in combination
with higher frequencies, resulted in a decline in total biomass compared to the
control which only recovered gradually after defoliation was stopped, or otherwise
lead to a permanent decline (Fig. 18.6.).
tota
l bio
mas
s in
rel
atio
n to
con
trol
(1.
0)
1.0
0.8
0.6
0.4
0.2
0.0
defoliation proportion99755025
1.0
0.8
0.6
0.4
0.2
0.01.0
0.8
0.6
0.4
0.2
0.0
stre
ss fr
eque
ncy
13
4
year14121086420 14121086420 14121086420 14121086420
Fig. 18.6 Effects of proportion of defoliated leaves and the frequency of the defoliation on the
total biomass in relation to the control
18 Effects of Stress and Defence Allocation on Tree Growth: Simulation. . . 415

A closer look at the pattern of above-ground, below-ground, and reserve alloca-
tion reveals that the simulation results propose a more complex reaction (Fig. 18.7).
While defoliation at any intensity and frequency was detrimental to the predicted
relative above-ground biomass, below-ground biomass and free C-pool showed a
distinctive overcompensation (values greater 1.0) at certain combinations of defo-
liation intensities and frequencies, as a result of internal interactions of the model.
18.5.2.2 Scenario II: Discussion
The results obtained in Scenario II would favour McNaughton’s second hypothesis
(McNaughton 1983) that suggests compensation to a certain extent, but not over-
compensation at low levels of herbivory. Decreases in diameter and volume
increments were often described as proportional to the needle losses in conifers
(Craighead 1940; Bruce 1956; Chalupa 1965) while other authors negate
proportionality in a strict sense (Fournier et al. 2010). Brubaker (1978) stated that
no significant decrease in ring width occurred if more than 50% of needles were
biom
ass
in r
elat
ion
to c
ontr
ol (
1.0 )
1.21.00.80.60.40.20.0
defoliation proportion
99755025
1.21.00.80.60.40.20.0
year
14121086420
1.21.00.80.60.40.20.0
14121086420 14121086420 14121086420
stre
ss fr
eque
ncy
31
4
nonstructural reservesbelow ground structuralabove ground structural
Fig. 18.7 Effects of proportion of defoliated leaves and the frequency of the defoliation on the
above-ground biomass (bold line), below-ground biomass (thin line) and reserves (dotted line) inrelation to the control
416 T. R€otzer et al.
remaining, which can be seen as an argument for a nonlinear relationship, where
small needle losses do not lead to proportional diameter growth losses and with
increasing defoliation the growth losses increase progressively. A similar reaction
pattern was apparent in our simulation results for beech. Our findings confirm the
empirical results of Krause and Raffa (1996), who compared the growth and
recovery rates of 10-year-old deciduous and evergreen conifers after defoliation.
They found a quick recovery for deciduous Larix decidua in contrast to evergreen
Pinus resinosa trees. Pines with 66% defoliation rates never recovered with regards
to above-ground biomass. They attributed the differences partially to the plastic
architectural response of Larix but also to the differences of nutrient and carbon
distribution in evergreen and deciduous conifers. Beech may be more comparable
with Larix as it is also a deciduous tree. There is ample evidence from defoliation
studies that leaf and needle losses are nonlinearly related to diameter growth and
above-ground biomass (Kulman 1971).
The overcompensation of below-ground biomass, predicted by BALANCE,
requires some interpretation. BALANCE does not allow for efficiency changes in
the chemical pathways of photosynthesis itself, but is sensitive to changed leaf
areas, modified root–shoot ratios and higher light and water availability. However,
the observed effects suggest a complex interaction on the eco-physiological levels
covered by the model, which includes extrinsic and also intrinsic mechanisms to a
certain extent as discussed by McNaughton (1983).
18.5.3 Scenario III: Abiotic Stress (Drought)
In the Scenario III simulations, the influence of abiotic stress on growth and
competition of individual trees and entire forest stands was analysed. Abiotic stress
that changes tree and stand growth includes, for example, storms, drought or heat. In
this study, we concentrate on the influence of drought. The analysis provides answers
to the questions: (1) What is the influence of drought stress on biomass growth?
(2) Does drought stress change the allocation patterns of trees (free C-pool, above
and below-ground biomass)? and (3) Do stand structure and interspecific competi-
tion influence the growth of individual trees resp. entire stands in drought periods?
18.5.3.1 Quantification of Drought Stress
To assess drought quantitatively and qualitatively for the single years of the period
from 1999 to 2007, several drought indicators were analysed. As a first indicator a
meteorologically based index, i.e. the number of days with precipitation sums lower
than 0.1 mm within the summer months June to August (nNIE0), was used. In
Fig. 18.8a, the annual deviations of nNIE0 from the mean of the years 1999–2007
are given. The year with the highest positive deviation, i.e. the year with the most
days without precipitation, was 2003. Other dry years were 2002 and 2006, while
18 Effects of Stress and Defence Allocation on Tree Growth: Simulation. . . 417

2001 was the year with the lowest number of nNIE0. If, however, other climate
parameters that influence the water balance of a site are additionally taken into
account, the ranking of years with drought is changing. The drought indices of
Bruschek or De Martonne consider temperature as well as precipitation. While the
Bruschek index is based on the annual precipitation sum and the number of summer
days, i.e. the number of days with temperatures above 25�C (Bruscheck 1994), the
De Martonne index is calculated from the precipitation sum and the temperature of
the summer months June, July and August (De Martonne 1926). Both indicators
show the highest drought stress in 2003 and a lighter drought stress in 2006,
followed by the years 2004 (Bruschek) and 1999 (De Martonne) (Fig. 18.8b, c).
A more sophisticated index is the climatological water balance cwb, calculated
from the difference between precipitation sum and potential evapotranspiration.
Based on the values for the summer months, the order of the drought stress intensity
is again 2003 followed by 2006 and 1999 (Fig. 18.8d).
-25.0
-20.0
-15.0
-10.0
-5.0
0.0
5.0
10.0
15.0
20.0
1999 2000 2001 2002 2003 2004 2005 2006 2007
-20.0
-15.0
-10.0
-5.0
0.0
5.0
10.0
15.0
1999 2000 2001 2002 2003 2004 2005 2006 2007
-6.0
-4.0
-2.0
0.0
2.0
4.0
6.0
1999 2000 2001 2002 2003 2004 2005 2006 2007
-80.0
-60.0
-40.0
-20.0
0.0
20.0
40.0
60.0
1999 2000 2001 2002 2003 2004 2005 2006 2007
-250.0
-200.0
-150.0
-100.0
-50.0
0.0
50.0
100.0
150.0
1999 2000 2001 2002 2003 2004 2005 2006 2007
-0,15
-0,10
-0,05
0,00
0,05
0,10
1999 2000 2001 2002 2003 2004 2005 2006 2007
nNIE0 Bruschek
Martonne cwb
eta/etpswp
b
c d
e f
a
Fig. 18.8 Anomalies of different drought indices (a ¼ nNIE0, b ¼ Bruschek, c ¼ Martonne,
d ¼ cwb, e ¼ swp, f ¼ eta/etp) for the years 1999–2007 from the average of 1999–2007 for the
site Kranzberger Forst
418 T. R€otzer et al.

By using the plant available soil water swp as an indicator for drought, site
conditions other than the meteorological conditions are also considered
(Fig. 18.8e). The annual anomalies of the summer month June to August against
the average were highest for the year 2003 and 2006. If the ratio of actual to
potential evapotranspiration eta/etp is used 2003 indicated the strongest drought
(Fig. 18.8f). Hereby the water balance parameters swp,, eta and etp were simulated
with BALANCE for the beech stand using the above-mentioned site and weather
conditions. In contrast to the above drought indices, positive anomalies based on
swp and the eta/etp ratio were also found for the years 2001 and 2007. This is
because the favourable growth conditions in these 2 years increased growth and in
consequence also actual transpiration, which lowered eta/etp ratios and swp values.
Based on these results the year 2001 was selected as a year with sufficient water
availability, the year 2006 as a year with a moderate drought and the year 2003 with
a severe drought in order to analyse the influence of drought on tree growth and
competition.
18.5.3.2 Influence on Individual Tree and Stand Level
To compare total biomass development of single years, simulated total biomasses
of 10-day periods were related to the initial biomass of each year. Figure 18.9
presents the results for the pure beech stand.
Starting in May biomass development of the year 2001 increased stronger than
the mean values of the period 1999–2007. Already in the spring months growth
rates were smaller compared to the average for the moderate dry year 2006. In the
severe dry year 2003 beech tree growth in spring was somewhat higher than on
average. However, in the mid of June growth rates dropped severely. At the end of
the dry years 2006 and 2003, there was no detectable increase in the stand biomass
compared to the initial biomass.
Compared to the average biomass increment (1999–2007) the biomass incre-
ment of the beech stand was increased by 1.8% in the year 2001 while it was clearly
lower in the drought years with 4.5% (2006) respectively 4.9% (2003). Spruce, on
the other hand, was more affected by the year 2003 with a decrease of 7.1%
compared to the mean growth rate. In 2006, biomass growth was lowered by
1.5%. In 2001, a year with good growing conditions, the growth rates of spruce
were 4.1% higher compared to the average.
An essential factor of the production of forest stands is the condition of each tree,
i.e. its individual light regime, nutrient status and water supply. Figure 18.10
illustrates that at the individual tree level the influence of droughts on the growth
rates of trees varied strongly. In dependence on the tree size, denoted as dbh, net
primary productivity (npp) increased clearly with tree size.
As can be seen from Fig. 18.10, particularly in the year 2001 with good growth
conditions individual trees developed huge differences in npp. Small-sized trees
18 Effects of Stress and Defence Allocation on Tree Growth: Simulation. . . 419

had npp values smaller than 5 kg, big-sized trees, on the other hand, had rates above
15 kg. In years with drought, the slope of the regression line clearly dropped. While
small trees still grew with the same increment rates as calculated for 2001, big trees
reduced their growth rates severely (Fig. 18.10).
0.90
0.95
1.00
1.05
1.10
1.15
Jan Feb Mar Apr May Jun Jul Aug Sep Oct Nov Dec
mean 1999-2007
2001
2003
2006
Fig. 18.9 Relative total biomass development of a pure beech stand at the site Kranzberger Forst
for single years and on average
2006y = 1.065x -11.10
r2 = 0.43
2001y = 2.468x -21.89
r2 = 0.77
2003y = 0.801x -7.612
r2 = 0.43
-5
0
5
10
15
20
25
30
35
40
0 5 10 15 20 25
npp
[kg
]
dbh [cm]
2006
2001
2003
Fig. 18.10 Net primary productivity of individual beech trees at the site Kranzberger Forst for the
years 2001, 2003 and 2006 in dependence on their sizes (dbh); lines denote the linear regressionsof the 3 years
420 T. R€otzer et al.

To elucidate the loss of npp based on tree size in a drought year compared to a
year with favourable growing conditions, the differences of the linear regression
lines of the years 2001 and 2003 were calculated (Fig. 18.11). While the spruce
trees of the Kranzberger Forst lost approximately 12 kg per tree in all size classes,
small-sized beech trees of about 10 cm in dbh decreased npp in 2003 by 2.5 kg per
tree compared to 2001. The npp of big beech trees with a dbh of 20 cm, on the other
hand, decreased by 19 kg per tree.
18.5.3.3 Influence on Individual Tree and Stand Level: Discussion
Higher growth rates of spruce compared to beech in years with suitable growing
conditions are well known (e.g. Pretzsch 2009). This is reflected in our simulation
results since the growth of spruce is reduced more than the growth of beech in
intensive drought years. These findings confirm the results reported by
Beierkuhnlein and Foken (2008). Additionally, Pichler and Oberhuber (2007)
found for the year 2003 a 30% reduction of the radial tree growth for spruce
compared to the reference period (1998–2002). The annual energy flux
measurements of Gr€unwald and Bernhofer (2007) for the spruce forest Tharandt
show a distinctive lower net ecosystem productivity of 395 g C/m in 2003 com-
pared to 2001 with 559 g C/m. Based on the long-term mean for the years
0
5
10
15
20
25
10 15 20
npp
[kg
]
dbh [cm]
beech
spruce
Fig. 18.11 Regression line of the npp differences between the year with favourable growing
conditions (2001) and the drought year 2003 for beech and spruce trees at the site Kranzberger
Forst depending on tree size (dbh)
18 Effects of Stress and Defence Allocation on Tree Growth: Simulation. . . 421
1996–2005 this is a 30% reduction in 2003, but no reduction in 2001. An increase of
the above-ground biomass with tree size is also reported by Ogaya and Penuelas
(2007) for a holm oak forest using initial above-ground biomass as a representative
for tree size.
The growth patterns for different sized trees under stress and no stress conditions
can also be seen in the studies shown in Chap.14, where size–growth relationships
in forest stands are analysed, amongst others under drought events. Pichler and
Oberhuber (2007) found at a dry mesic site for dominant spruces the strongest
growth reductions in the year 2003 compared to the 1998–2002 period. The results
of Ogaya and Penuelas (2007) were similar to our results: The above-ground
biomass increment was clearly lower under drought conditions averaged over all
species; the slope of the regression line for the above-ground biomass increment
based on tree size was higher for non-drought conditions compared to the drought
conditions averaged over the species. The response of the single tree species,
however, was quite different (high for Arbutus unedo and Quercus ilex, low for
Phillyrea latifolia).The simulation results for npp based on tree size in drought years (Fig. 18.11)
were in accordance with findings of Peterken and Mountford (1996) that 30-year-
old beeches (small trees) were largely unaffected by droughts, while the growth of
75- to 105-year-old beeches (big trees) declined or ceased. Further on, Dohrenbusch
et al. (2002) reported that spruces of the dominant social classes reacted more on
low water supply than suppressed trees.
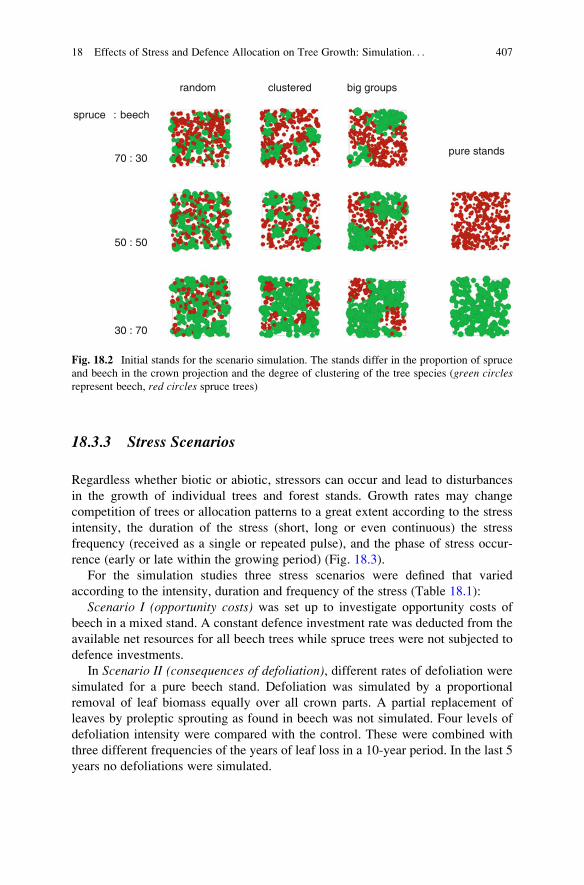
A reason for the different growth patterns of beech and spruce depending on tree
size is related to their water supply. The eta/etp ratio can serve as an indicator for the
water supply of a tree (Fig. 18.12). For beech trees a clear decrease of the eta/etpratio with increasing tree size (dbh) for the year 2003 and 2001 is evident, which
means that big trees have higher water deficits.
Spruce trees, however, showed no correlation of the drought index to tree size.
For the year 2001 the ratio oscillated around a value of 0.75, which denotes good
2001y = -0.014x + 0.875
r2 = 0.375
2003y = -0.027x + 1.025
r2 = 0.580
0.2
0.3
0.4
0.5
0.6
0.7
0.8
0.9
1
5 10 15 20 25
drou
ght i
ndex
dbh [cm]
2001
2003
2001y = 0.000x + 0.736
r2 = 0.014
2003y = 0.002x + 0.395
r2 = 0.071
0.2
0.3
0.4
0.5
0.6
0.7
0.8
0.9
1
5 10 15 20 25
drou
ght i
ndex
dbh [cm]
2001
2003
Fig. 18.12 Drought index eta/etp of beech (left) and spruce (right) at the site Kranzberger Forst for2001 and 2003; lines denote the linear regressions for the single years
422 T. R€otzer et al.

water supply for all size classes. In 2003 the eta/etp ratios ranged between 0.36 and
0.44, which indicates severe drought stress for all size classes. For beech trees such
low ratios were only found for big trees in the year 2003. The 2003 drought stress
for all tree sizes of spruce caused low npp values in 2003, while in 2001 the high
eta/etp ratios for all tree sizes (indicating no water stress) caused equally high npp
values. This implies that drought stress changed growth rates of the individual trees,
of the entire stands, but also of the tree species to a different extent. Longer stress
periods can therefore change stand structure and stand growth (e.g. Peterken and
Mountford 1996; Dohrenbusch et al. 2002; Ogaya and Penuelas 2007). The
assumption of Dohrenbusch et al. (2002) that a worsening of the environmental
conditions, for example drought, mainly affects the dominant trees of a stand
compared to the dominated was confirmed for beech, but not for spruce. It seems
that the 2003 drought intensity was so strong that all tree sizes of the spruces were
similarly influenced.
18.5.3.4 Effects on Allocation Patterns
Up to now, the influence of abiotic stress is shown on individual tree and on stand
level. But there is also evidence (e.g. Polomski and Kuhn 1998; Frank 2007; Pichler
and Oberhuber 2007; R€otzer et al. 2009) that stress such as droughts change the
allocation pattern of plants. In two examples, BALANCE simulations demonstrate
allocation changes of a beech stand.
Figure 18.13 presents the relative annual development of the free C-pool aver-
aged over the years 1999–2007 as well as for the single years 2001, 2003 and 2006.
In 2001, a year with good growing conditions, from mid May onwards the free
C-pool increased more than the long-term mean. In the moderately dry year 2006
with the beginning of May, the free C-pool increased slower than on average.
In the dry year 2003, the development of the free C-pool nearly matched the
average values in the first months. Since the beginning of July, however, the free
C-pool had clearly dropped. At the end of the year 2003, the C-pool was 19% lower
than at the end of the year 2001.
Fine root biomass was also clearly influenced by drought stress. Figure 18.14
depicts the development of the fine root growth again for the long-term mean and
the three chosen years. Higher growth rates for the fine roots than on average can be
found in all years. In the course and at the end of the year, the highest amount of fine
root biomass was available in the severe dry year of 2003. However, there was only
a small difference in the fine root growth rate at the end of the year 2003 compared
to 2001, a year with favourable growing conditions.
If the fine root to leaf biomass ratio of the beech trees of the single years were
combined with a drought stress indicator like the eta/etp ratio, a close relationship
(r2 ¼ 0.59) is obvious (Fig.18.15). Increasing drought stress, i.e. decreasing eta/etpvalues, stimulated fine root to leaf biomass ratio positively.
18 Effects of Stress and Defence Allocation on Tree Growth: Simulation. . . 423

18.5.3.5 Effects on Allocation Patterns: Discussion
Nikolova et al. (2009) found for the mixed beech/spruce stand in the Kranzberger
Forst similar levels of fine root production and fine root recovery for beech in the
year 2003 compared to 2002. For spruce, on the other hand, these values were
0.80
0.85
0.90
0.95
1.00
1.05
1.10
1.15
1.20
1.25
Jan Feb Mar Apr May Jun Jul Aug Sep Oct Nov Dec
mean 1999-2007
2001
2003
2006
Fig. 18.13 Relative course of the free C-pool of beech at the site Kranzberger Forst
0.80
0.90
1.00
1.10
1.20
1.30
1.40
Jan Feb Mar Apr May Jun Jul Aug Sep Oct Nov Dec
mean 1999-2007
2001
2003
2006
Fig. 18.14 Relative course of the fine root growth of beech at the site Kranzberger Forst
424 T. R€otzer et al.

significantly lower in 2003. Regarding that both years 2001 and 2002 show quite
low drought indices (Fig. 18.8b–f), the results for beech of Nikolova et al. (2009)
are consistent with the simulation results. Konopka et al. (2007) found that fine root
biomass of Japanese cedar decreased by drought treatment. They refer to Eissenstat
(1997), who stated that “plant root responses to drought are diverse, ranging from
shedding of roots to the stimulation of root production”. Konopka et al. (2007)
further argued that these strategies are modified by the intensity and duration of a
drought. This is in accordance with our results (Fig. 18.14), and with the conclusion
of Mainiero and Kazda (2006) who found no evidence that fine root formation of
beech counter-balances short-term soil water shortages.
Leuschner et al. (2001) stated that fine root growth is more vulnerable to
soil water shortage than leaf expansion and photosynthesis, causing (inter-annual)
shifts in the carbon allocation patterns of trees. This suggestion is confirmed by the
simulation results as shown in the Figs. 18.13 and 18.14 for the free C-pool and the
fine root biomass. Despite the fact that fine root biomass greatly varies among
tree species, forest type and climate (e.g. Vogt et al. 1996; Noguchi et al. 2007),
there are also significant year to year changes. Our results (Figs. 18.9, 18.13 and
18.14) support these findings.
Increased root growth as observed in the simulations in response to drought
(Fig. 18.15) was reported by several authors (e.g., Cienciala et al. 1994; Leuschner
et al. 2001; Frank 2007). This is in conformity with the plant allocation theory. This
theory states that above- and below-ground biomass is allocated in order to
y = -6.241x + 5.898r2 = 0.59
0.0
0.5
1.0
1.5
2.0
2.5
0.62 0.64 0.66 0.68 0.70 0.72 0.74 0.76 0.78
fine
root
/ le
af b
iom
ass
ratio
drought index
Fig. 18.15 Simulated fine root/foliage ratio and drought index eta/etp of the vegetation period for
beech
18 Effects of Stress and Defence Allocation on Tree Growth: Simulation. . . 425

minimise resource limitation resp. to maximise resource capture (e.g. Chapin
1980). Vivin and Guehl (1997), however, report that the root to shoot biomass
ratio of Quercus robur seedlings decreased by drought, which contradicts the
theory that under limiting water supply increased root growth would be advanta-
geous for the acquisition of water (Tyree and Alexander 1993).
In dry periods more carbon was invested in root growth of beeches compared to
leaf growth (Fig. 18.15) indicating that more fine root biomass is formed in the
trees’ search for resources (water). These changes in the carbon allocation from
above- to below-ground guarantee the water supply during drought (Cermak et al.
1993; Leuschner et al. 2001). Noguchi et al. (2007) found that the ratio of fine root
biomass to total biomass of different tree species clearly increased in drought
periods pointing out a biomass allocation to the fine roots.
18.5.3.6 Influence of Stand Structure
Other factors that influence growth of forest stands in drought periods are stand
structure and interspecific competition. Based on three different mixing ratios
(spruce to beech 30:70, 50:50 and 30:70) and three different mixing structures
(random, clustered, grouped), the growth of mixed stands was simulated.
Figure 18.16 shows the net primary production of the mixed stands for the three
mixing proportions averaged over the mixing ratios for the year 2001 and 2003.
Again, distinctively smaller net primary production values in the drought year
2003 compared to the 2001 values were evident. In 2003 only about 14% of the npp
of 2001 was gained by the different forest stands. When the effects of the different
mixing structures on npp were compared, decreasing values were obvious in 2001,
starting with a grouped mixing structure over a clustered structure to randomly
distributed beeches and spruces. The low npp of the randomly structured stand was
due to the low npp of spruce that cannot be compensated by the higher npp values of
beech in the randomly structured stand. In 2003, all three mixing structures
produced nearly the same (250–270 g/m). Hereby, the spruces had the highest
1700
1800
1900
2000
2100
grouped cluster random
g / m² g / m²
0
100
200
300
400
grouped cluster random
2001 2003
Fig. 18.16 Net primary production of the entire stand for different mixing structures (average of
mixing ratios) in the year 2001 with good growing conditions (left) and in the dry year 2003 (right)at the site Kranzberger Forst
426 T. R€otzer et al.
npp reductions (in relation to the 2001 values), particularly the grouped mixing
structure. Because there was also a clear drop in the npp of the beech trees in all
mixing structures, npp of the year 2003 fell to a low level showing no differences
between the mixing structures.
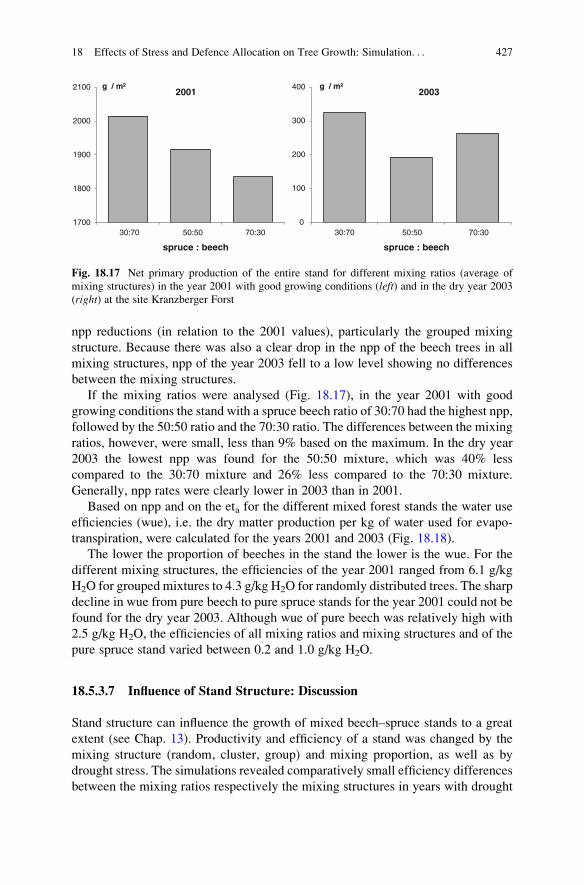
If the mixing ratios were analysed (Fig. 18.17), in the year 2001 with good
growing conditions the stand with a spruce beech ratio of 30:70 had the highest npp,
followed by the 50:50 ratio and the 70:30 ratio. The differences between the mixing
ratios, however, were small, less than 9% based on the maximum. In the dry year
2003 the lowest npp was found for the 50:50 mixture, which was 40% less
compared to the 30:70 mixture and 26% less compared to the 70:30 mixture.
Generally, npp rates were clearly lower in 2003 than in 2001.
Based on npp and on the eta for the different mixed forest stands the water use
efficiencies (wue), i.e. the dry matter production per kg of water used for evapo-
transpiration, were calculated for the years 2001 and 2003 (Fig. 18.18).
The lower the proportion of beeches in the stand the lower is the wue. For the
different mixing structures, the efficiencies of the year 2001 ranged from 6.1 g/kg
H2O for grouped mixtures to 4.3 g/kg H2O for randomly distributed trees. The sharp
decline in wue from pure beech to pure spruce stands for the year 2001 could not be
found for the dry year 2003. Although wue of pure beech was relatively high with
2.5 g/kg H2O, the efficiencies of all mixing ratios and mixing structures and of the
pure spruce stand varied between 0.2 and 1.0 g/kg H2O.
18.5.3.7 Influence of Stand Structure: Discussion
Stand structure can influence the growth of mixed beech–spruce stands to a great
extent (see Chap. 13). Productivity and efficiency of a stand was changed by the
mixing structure (random, cluster, group) and mixing proportion, as well as by
drought stress. The simulations revealed comparatively small efficiency differences
between the mixing ratios respectively the mixing structures in years with drought
2001 2003
1700
1800
1900
2000
2100
30:70 50:50 70:30
g / m²
spruce : beech
0
100
200
300
400
30:70 50:50 70:30
g / m²
spruce : beech
Fig. 18.17 Net primary production of the entire stand for different mixing ratios (average of
mixing structures) in the year 2001 with good growing conditions (left) and in the dry year 2003
(right) at the site Kranzberger Forst
18 Effects of Stress and Defence Allocation on Tree Growth: Simulation. . . 427

stress but distinct differences in years with good water supply. This result was
consistent for pure stands as well as for stands with different mixing structures of
beech and spruce. It can be deduced that the wue of a tree species is reduced under
drought stress. The mixing structure of a forest stand altered the water use effi-
ciency. The efficiency differences are more pronounced under favourable growing
conditions than under drought influence. The findings of Guehl et al. (1995), Barr
et al. (2007) and Menon et al. (2007) underline this assumption of lower water use
efficiencies under stress.
18.6 Conclusions
The scenario simulations with the eco-physiologically based, individual tree growth
model BALANCE proved feasible for analysing the influence of environmental
changes on growth, productivity and efficiency of forest stands. The simulation
results were plausible and in accordance with empirical studies. From the
simulations, the following conclusions can be drawn:
Defoliation of beech led to a decline of total biomass growth as expected. The
intensity and the frequency of the defoliation stress determined whether trees
recovered fully, partially to a lower biomass level, or died.
Even without changing physiological parameters like photosynthetic efficiency
explicitly in BALANCE, intrinsic changes of allocation patterns led to an over-
compensation of the growth of certain tree compartments under low defoliation
rates. The recovery time between the defoliation events was more important than
the number of defoliations.
Opportunity costs were incurred by beech trees in mixed stands that invested in
defence of a species-specific pathogen, which did not attack their interspecific
competitors. Competition effects between investing and non-investing trees caused
0.0
1.0
2.0
3.0
4.0
5.0
6.0
7.0
8.0
9.0
pure beech grouped cluster random pure spruce
g /
kg H
2O
mixing structure
2001
2003
0.0
1.0
2.0
3.0
4.0
5.0
6.0
7.0
8.0
9.0
100:0 30:70 50:50 70:30 0:100
g /
kg H
2O
spruce : beech
2001
2003
Fig. 18.18 Water use efficiency of mixed beech–spruce stands for different mixing ratios (left,averaged over all mixing structures) and different mixing structures (right, averaged over all
mixing ratios) for the years 2001 and 2003 at the site Kranzberger Forst
428 T. R€otzer et al.

losses that ranged from 1.5 to 3.1 of the direct defence investments. The competing
non-affected spruce trees were able to increase their total biomass at the cost of the
beech trees, to 140% when compared to the control, but were only able to compen-
sate for the losses of beech if the defence investments of beech did not exceed
20–30%. This showed the limits of the buffering capacity in mixed stands.
Additionally to the defence rate of beech, stand structure influenced the growth
of beech and spruce significantly. The simulation results revealed a differential
pattern considering the two species. Spruce significantly profited from an individual
tree mixture but could not compensate for the growth of beech in clustered and
grouped situations. In contrast, beech reacted more to the absolute proportion of
spruce in the stand than to the distribution of the spruce trees.
The simulation results suggest that the allometry between dbh and above-ground
biomass was changed nonlinearly. The factors influencing allometry were the
proportion of net resources invested in defence, the proportion of a tree species at
the total crown area of a stand, and the degree of clustering of the tree species. The
findings suggest a higher biomass to dbh ratio for beech at higher proportions of
beech in the stand. The more beech was spatially intermingled with spruce the
lower the biomass to dbh ratio of beech trees.
Compared to dominated, small trees, productivity of dominant big trees was
influenced more by decreasing resource availability (e.g. water). Under severe
drought stress as for example for the year 2003, however, for spruce a nearly
constant loss of productivity for all size classes was obvious.
Drought stress clearly changed the allocation patterns of trees. Total biomass
growth was decreased particularly for spruce under intensified drought. While in
years with favourable growing conditions, the free C-pool of the trees increased,
more severe drought caused increasing losses of the free C-pool. Fine root biomass
of beech, on the other hand, increased with increasing drought. This is in confor-
mity with the plant allocation theory, that above and below-ground allocation is
adjusted to minimise resource constraints resp. maximise resource acquisition.
Stand structure characterised by the kind of mixing and/or tree species composi-
tion was shown to change productivity and efficiency of a forest stand.
Overall, climate sensitive, physiologically based growth models like BALANCE
are useful tools for analysing influences of environmental changes on productivity
and efficiency. They can help to map out adaption strategies to avoid negative
consequences of environmental changes. Furthermore, such models can provide
interesting hypotheses for subsequent empirical or experimental testing and can
thus support theory building.
References
Barr AG, Black TA, Hogg EM, Griffis TJ, Morgenstern K, Kljun N, Theede A, Nesic Z (2007)
Climatic controls on the carbon and water balances of a boreal aspen forest, 1994-2003. Glob
Change Biol 13:561–576
Bartelink HH (2000) A growth model for mixed forest stands. Forest Ecol Manage 134:29–43
BayFORKLIM (1996) Klimaatlas Bayern. Fachbuchhandlung Kanzler, M€unchen
18 Effects of Stress and Defence Allocation on Tree Growth: Simulation. . . 429

Bazzaz FA, Chiariello NR, Coley PD, Pitelka LF (1987) Allocating resources to reproduction and
defense. Bioscience 37:58–67
Beierkuhnlein C, Foken T (2008) Klimawandel in Bayern: Auswirkungen und Anpassung-
sm€oglichkeiten. Bayreuther Forum Okologie, vol 113, University Bayreuth, 501 p
Bloom AJ, Chapin FS III, Mooney HA (1985) Resource limitation in plants – an economic
analogy. Ann Rev Ecol Syst 16:363–392
Bossel H (1996) TREEDYN3 forest simulation model. Ecol Model 90:187–227
Brubaker LB (1978) Effects of defoliation by Douglas-fir tussock moth on ring sequences of
Douglas-fir and Grand fir. Tree Ring Bull 38:49–60
Bruce D (1956) Effect of defoliation on growth of longleaf pine seedlings. Forest Sci 2:31–35
Bruscheck GJ (1994) Waldgebiete und Waldbrandgeschehen in Brandenburg im Trockensommer
1992. PIK Rep 2:245–264
Cermak J, Matyssek R, Kucera J (1993) Rapid response of large, drought-stressed beech trees to
irrigation. Tree Physiol 12:281–290
Chalupa V (1965) Influence of the reduction of leaves on the beginning and course of radial
growth. Commun Inst Forest Czech 4:61–73, Forest Abstr 27 no. 4580
Chapin FS III (1980) The mineral nutrition of wild plants. Annu Rev Ecol Syst 11:233–260
Chew FS, Rodman JE (1979) Plant resources for chemical defense. In: Rosenthal GA, Janzen DH
(eds) Herbivores: their interaction with secondary plant metabolites. Academic, New York,
pp 271–307
Cienciala E, Lindorth A, Cermak J, H€allgren JE, Kucera J (1994) The effects of water availabilityon transpiration, water potential and growth of Picea abies during a growing season. J Hydrol
155:57–71
Coley PD, Bryant JP, Chapin FS III (1985) Resource availability and plant herbivore defense.
Science 230:895–899
Craighead FC (1940) Some effects of artificial defoliation on pine and larch. J Forest 38:885–888
De Martonne E (1926) Une nouvelle fonction climatologique: L’indice d’aridite. La Meteorologie
2:449–458
Dohrenbusch A, Jaehne S, Bredemeier M, Lamersdorf N (2002) Growth and fructification of a
Norway spruce (Picea abies L. Karst) forest ecosystem under changed nutrient and water input.
Ann Forest Sci 59:359–368
Eissenstat DM (1997) Trade-offs in root form and functioning. In: Jackson LE (ed) Ecology in
agriculture. Academic, San Diego, CA, pp 173–179
Fontes L, Bontemps JD, Bugmann H, van Oijen M, Gracia C, Kramer K, Lindner M, R€otzer T,Skovsgaard JP (2010) Models for supporting forest management in a changing environment.
Forest Syst 19:8–29
Fournier C, Bauce E, Dupont A (2010) Wood losses and economical threshold of Btk aerial spray
operation against spruce budworm. Pest Manag Sci 66:319–324
Frank DA (2007) Drought effects on above- and belowground production of a grazed temperate
grassland ecosystem. Oecologia 152:131–139
Gayler S, Grams TEE, Kosivits AR, Winkler JB, Luedemann G, Priesack E (2006) Analysis of
competition effects in mono- and mixed cultures of juvenile beech and spruce by means of the
plant growth simulation model PLATHO. Plant Biol 8:503–514
Grams TEE, Kozovits AR, Reiter IM, Winkler JB, Sommerkorn M, Blaschke H, H€aberle K-H,
Matyssek R (2002) Quantifying competitiveness in woody plants. Plant Biol 4:153–158
Grote R (2002) Estimation of crown radii and crown projection area from stem size and tree
position. Ann Forest Sci 60:393–402
Grote R, Pretzsch H (2002) A model for individual tree development based on physiological
processes. Plant Biol 4(2):167–180
Gr€unwald T, Bernhofer C (2007) A decade of carbon, water and energy flux measurements of an
old spruce forest at the Anchor Station Tharandt. Tellus 59B(3):387–396
Guehl JM, Fort C, Ferhi A (1995) Differential response of leaf conductance, carbon isotope
discrimination and water use efficiency to nitrogen deficiency in maritime pine and peduncu-
late oak plants. New Phytol 131:149–157
430 T. R€otzer et al.
Gulmon SL, Mooney HA (1986) Costs of defense and their effects on plant productivity. In:
Givnish TJ (ed) On the economy of plant form and function. Cambridge University Press,
Cambridge, pp 681–698
H€aberle K-H, Nunn AJ, Reiter IM,Werner H, Heller W, Bahnweg G, Gayler S, L€utz C, Matyssek R
(2009) Variation of defence-related metabolites in the foliage of adult beech and spruce:
a conceptual approach to approximating trade-off carbon. Eur J Forest Res 128:99–108
Hamilton JG, Zangerl AR, DeLucia EH, Berenbaum MR (2001) The carbon-nutrient balance
hypothesis: its rise and fall. Ecol Lett 4:86–95
Herms DA, Mattson WJ (1992) The dilemma of plants: to grow or to defend. Q Rev Biol
67:283–335
Kellom€aki S, V€aisinen H, Strandman H (1993) FINNFOR: a model for calculating the response of
boreal forest ecosystems to climate change. Research notes, no. 6. University of Joensuu,
Joensuu, Finnland, 120 p
Knoke T, Seifert T (2008) Integrating selected ecological effects of mixed European beech –
Norway spruce stands in bioeconomic modelling. Ecol Model 210:487–498
Konopka B, Noguchi K, Sakata T, Takahashi M, Konopkova Z (2007) Effects of simulated
drought stress on the fine roots of Japanese cedar (Cryptomeria japonica) in a plantation forest
on the Kanto Plain, eastern Japan. J Forest Res 12:143–151
Koricheva J (2002) Meta-analysis of sources of variation in fitness costs of plant antiherbivore
defenses. Ecology 83(1):176–190
Krause SC, Raffa KF (1996) Differential growth and recovery rates following defoliation in
related deciduous and evergreen trees. Trees 10:308–316
Kulman HM (1971) Effects of insect defoliation on growth and mortality of trees. Annu Rev
Entomol 16:289–324
Landsberg JJ, Waring RH (1997) A generalised model of forest productivity using simplified
concepts of radiation-use efficiency, carbon balance and partitioning. Forest Ecol Manage
95:209–228
Larcher W (2003) Physiological plant ecology. Springer, Berlin, 513 p
Lee TD, Bazzaz FA (1980) Effects of defoliation and competition on growth and reproduction in
the annual plant Abutilon theophrasti. J Ecol 68:813–821
Leuschner Ch, Backes K, Hertel D, Schipka F, Schmitt U, Terborg O, Runge M (2001) Drought
responses at leaf, stem and fine root levels of competitive Fagus sylvatica L. and Quercuspetraea (Matt.) Liebl. trees in dry and wet years. Forest Ecol Manage 149:33–46
Mainiero R, Kazda M (2006) Depth-related fine root dynamics of Fagus sylvatica during excep-
tional drought. Forest Ecol Manage 237:135–142
McNaughton SJ (1983) Compensatory plant growth as a response to herbivory. Oikos 40:329–336
Menon M, Hermle S, G€unthardt-Goerg MS, Schulin R (2007) Effects of heavy metal soil pollution
and acid rain on growth and water use efficiency of a young model forest ecosystem. Plant Soil
297:171–183
Mohren GMJ, van de Veen JR (1995) Forest growth in relation to site conditions. Application of
the model FORGRO to the Solling spruce site. Ecol Model 83:73–183
Neilsen WA (1981) Effect of simulated browsing on survival and growth of Pinus radiata (D. Don)
seedlings. Aust Forest Res 11:47–53
Niklas KJ, Enquist BJ (2002) Canonical rules for plant biomass partitioning and annual allocation.
Am J Bot 89:812–819
Nikolova P, St R, Andersen C, Mainiero R, Blaschke H, Matyssek R, H€aberle K-H (2009) Effects
of extreme drought in 2003 on soil respiration in a mixed forest. Eur J Forest Res 128:87–98
Noguchi K, Konopka B, Satomura T, Kaneko S, Takahashi M (2007) Biomass and production of
fine roots in Japanese forests. J Forest Res 12:83–95
Ogaya R, Penuelas J (2007) Tree growth, mortality, and above-ground biomass accumulation in a
holm oak forest under a five-year experimental field drought. Plant Ecol 189:291–299
Peterken CF, Mountford EP (1996) Effects of drought on beech in Lady Park Wood, an unman-
aged mixed deciduous woodland. Forestry 69:125–136
18 Effects of Stress and Defence Allocation on Tree Growth: Simulation. . . 431
Pichler P, Oberhuber W (2007) Radial growth response of coniferous forest trees in an inner
Alpine environment to heat-wave in 2003. Forest Ecol Manage 242:688–699
Polomski J, Kuhn N (1998) Wurzelsysteme. Birmensdorf, Eidgen€ossische Forschungsanstalt f€urWald, Schnee und Landschaft. Paul Haupt, Bern, 290 p
Pretzsch H (1997) Analysis an modeling of spatial stand structure. Methodological considerations
based on mixed beech-larch stands in Lower Saxony. Forest Ecol Manage 95:237–253
Pretzsch H (2009) Forest dynamics, growth and yield. Springer, Berlin, 664 p
Pretzsch H, Grote R, Reineking B, R€otzer T, Seifert S (2008) Models for forest ecosystem
management: a European perspective. Ann Bot 101:1065–1087
Rausher MD (1996) Genetic analysis of coevolution between plants and their natural enemies.
Trends Genet 12:212–217
Rhoades DF (1979) Evolution of plant chemical defense against herbivores. In: Rosenthal GA,
Janzen DH (eds) Herbivores: their interaction with secondary plant metabolites. Academic,
Orlando, FL, pp 3–54
R€otzer T, Grote R, Pretzsch H (2004) The timing of bud burst and its effects on tree growth. Int J
Biometeorol 48:109–118
R€otzer T, Grote R, Pretzsch H (2005) Effects of environmental changes on the vitality of forest
stands. Eur J Forest Res 124:349–362
R€otzer T, Seifert T, Pretzsch H (2009) Modelling above and below ground carbon dynamics in a
mixed beech and spruce stand influenced by climate. Eur J Forest Res 128:171–182
R€otzer T, Leuchner M, Nunn AJ (2010) Simulating stand climate, phenology, and photosynthesis
of a forest stand with a process based growth model. Int J Biometeorol 54(4):449–464
Running SW, Coughlan JC (1988) A general model of forest ecosystem processes for regional
applications 1. Hydrological balance, canopy gas exchange, and primary production processes.
Ecol Model 42:125–154
Seifert T (2007) A simulation model to determine the extent of decay in stems of Norway spruce
caused by annosum root rot. Forest Ecol Manage 248:95–106
Seifert T, M€uller-Starck G (2009) Impacts of fructification on biomass production and correlated
genetic effects in Norway spruce (Picea abies L. [Karst.]). Eur J Forest Res 128(2):155–169Simms EL (1992) Costs of plant resistance to herbivory. In: Fritz RS, Simms EL (eds) Plant
resistance to herbivores and pathogens: ecology, evolution and genetics. University of Chicago
Press, Chicago, IL, pp 392–425
Stamp N (2003) Out of the quagmire of plant defense hypotheses. Q Rev Biol 78(1):23–55
Tyree MT, Alexander JD (1993) Plant water relations and the effects of elevated CO2: a review
and suggestions for future research. Vegetatio 104(105):47–62
Vivin P, Guehl JM (1997) Changes in carbon uptake and allocation patterns in Quercus robur
seedlings in response to elevated CO2 and water stress: an evaluation with 13C labelling.
Ann Forest Sci 54:597–610
Vogt KA, Vogt DJ, Palmitto PA, Boon P, O’Hara J, Asbjornsen H (1996) Review of root dynamics
in forest ecosystems grouped by climate, climatic forest type and species. Plant Soil
187:159–219
432 T. R€otzer et al.