Embed Size (px)
Citation preview

Bodie−Kane−Marcus: Investments, Fifth Edition
V. Security Analysis 17. Macroeconomics and Industry Analysis
537© The McGraw−Hill Companies, 2001
C H A P T E R S E V E N T E E N
MACROECONOMIC ANDINDUSTRY ANALYSIS
To determine a proper price for a firm’s stock, the security analyst must forecast the
dividend and earnings that can be expected from the firm. This is the heart of fun-
damental analysis—that is, the analysis of the determinants of value such as earn-
ings prospects. Ultimately, the business success of the firm determines the dividends
it can pay to shareholders and the price it will command in the stock market. Be-
cause the prospects of the firm are tied to those of the broader economy, however,
fundamental analysis must consider the
business environment in which the firm
operates. For some firms, macroeco-
nomic and industry circumstances
might have a greater influence on prof-
its than the firm’s relative performance
within its industry. It often makes sense
to do a “top-down” analysis of a firm’s
prospects. One starts with the broad
economic environment, examining the
state of the aggregate economy and
even the international economy. From
there, one considers the implications of
the outside environment on the industry
in which the firm operates. Finally, the
firm’s position within the industry is
examined.
This chapter treats the broad-based aspects of fundamental analysis—
macroeconomic and industry analysis. The two chapters following cover firm-spe-
cific analysis. We begin with a discussion of international factors relevant to firm
performance, and move on to an overview of the significance of the key variables
usually used to summarize the state of the macroeconomy. We then discuss
532
Bodie−Kane−Marcus: Investments, Fifth Edition
V. Security Analysis 17. Macroeconomics and Industry Analysis
538 © The McGraw−Hill Companies, 2001
CHAPTER 17 Macroeconomic and Industry Analysis 533
government macroeconomic policy. We conclude the analysis of the macroenviron-
ment with a discussion of business cycles. Finally, we move to industry analysis,
treating issues concerning the sensitivity of the firm to the business cycle, the typical
life cycle of an industry, and strategic issues that affect industry performance.
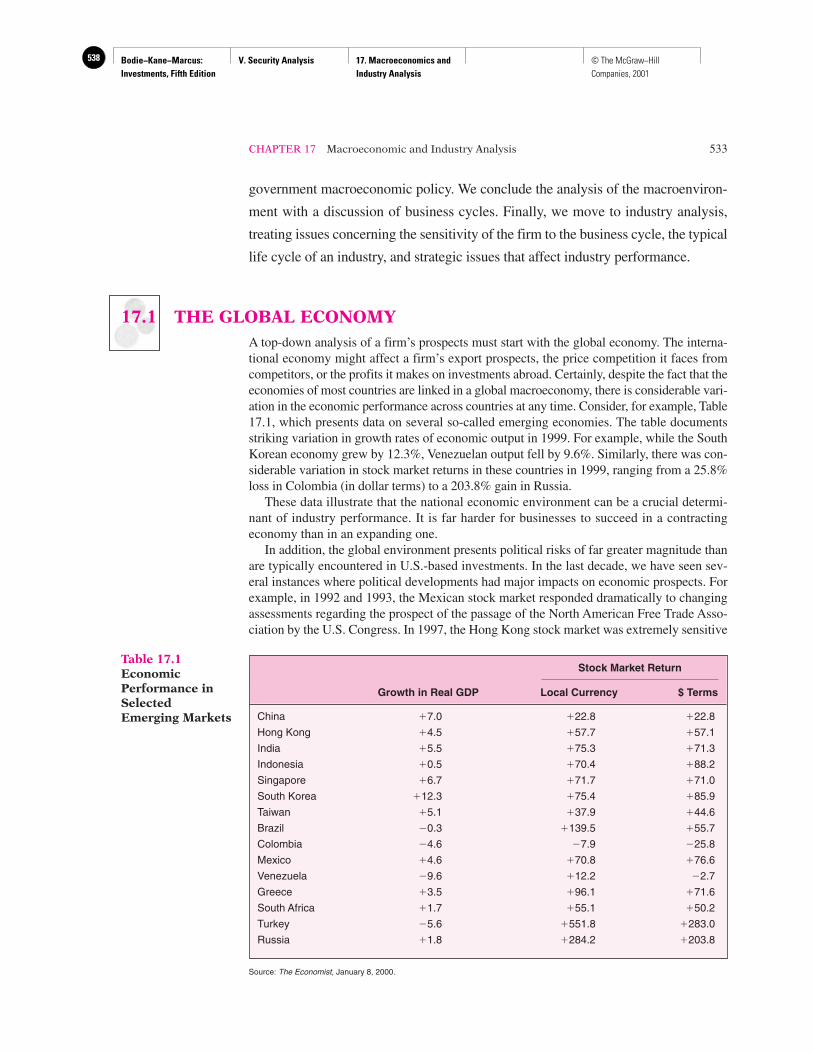
17.1 THE GLOBAL ECONOMYA top-down analysis of a firm’s prospects must start with the global economy. The interna-tional economy might affect a firm’s export prospects, the price competition it faces fromcompetitors, or the profits it makes on investments abroad. Certainly, despite the fact that theeconomies of most countries are linked in a global macroeconomy, there is considerable vari-ation in the economic performance across countries at any time. Consider, for example, Table17.1, which presents data on several so-called emerging economies. The table documentsstriking variation in growth rates of economic output in 1999. For example, while the SouthKorean economy grew by 12.3%, Venezuelan output fell by 9.6%. Similarly, there was con-siderable variation in stock market returns in these countries in 1999, ranging from a 25.8%loss in Colombia (in dollar terms) to a 203.8% gain in Russia.
These data illustrate that the national economic environment can be a crucial determi-nant of industry performance. It is far harder for businesses to succeed in a contractingeconomy than in an expanding one.
In addition, the global environment presents political risks of far greater magnitude thanare typically encountered in U.S.-based investments. In the last decade, we have seen sev-eral instances where political developments had major impacts on economic prospects. Forexample, in 1992 and 1993, the Mexican stock market responded dramatically to changingassessments regarding the prospect of the passage of the North American Free Trade Asso-ciation by the U.S. Congress. In 1997, the Hong Kong stock market was extremely sensitive
Stock Market Return
Growth in Real GDP Local Currency $ Terms
China �7.0 �22.8 �22.8
Hong Kong �4.5 �57.7 �57.1
India �5.5 �75.3 �71.3
Indonesia �0.5 �70.4 �88.2
Singapore �6.7 �71.7 �71.0
South Korea �12.3 �75.4 �85.9
Taiwan �5.1 �37.9 �44.6
Brazil �0.3 �139.5 �55.7
Colombia �4.6 �7.9 �25.8
Mexico �4.6 �70.8 �76.6
Venezuela �9.6 �12.2 �2.7
Greece �3.5 �96.1 �71.6
South Africa �1.7 �55.1 �50.2
Turkey �5.6 �551.8 �283.0
Russia �1.8 �284.2 �203.8
Table 17.1EconomicPerformance inSelectedEmerging Markets
Source: The Economist, January 8, 2000.
Bodie−Kane−Marcus: Investments, Fifth Edition
V. Security Analysis 17. Macroeconomics and Industry Analysis
539© The McGraw−Hill Companies, 2001
to political developments leading up to the transfer of governance to China. The biggest in-ternational economic story in late 1997 and 1998 was the turmoil in several Asianeconomies, notably Thailand, Indonesia, and South Korea. The close interplay between pol-itics and economics was also highlighted by these episodes, as both currency and stock val-ues swung with enormous volatility in response to developments concerning the prospectsfor aid from the International Monetary Fund. In August 1998, the shockwaves followingRussia’s devaluation of the ruble and its default on some of its debt created havoc in worldsecurity markets, ultimately requiring a rescue of the giant hedge fund Long Term CapitalManagement to avoid further major disruptions. In the immediate future, the degree towhich the European Monetary Union is successful will again illustrate the important inter-action between the political and economic arenas.
Other political issues that are less sensational but still extremely important to economicgrowth and investment returns include issues of protectionism and trade policy, the freeflow of capital, and the status of a nation’s work force.
One obvious factor that affects the international competitiveness of a country’s indus-tries is the exchange rate between that country’s currency and other currencies. The ex-change rate is the rate at which domestic currency can be converted into foreign currency.For example, in late 2000, it took about 106 Japanese yen to purchase one U.S. dollar. Wewould say that the exchange rate is ¥106 per dollar or, equivalently, $.0094 per yen.
As exchange rates fluctuate, the dollar value of goods priced in foreign currency similarlyfluctuates. For example, in 1980, the dollar–yen exchange rate was about $.0045 per yen. Be-cause the exchange rate today is $.0094 per yen, a U.S. citizen would need more than twiceas many dollars in 2000 to buy a product selling for ¥10,000 than would have been requiredin 1980. If the Japanese producer were to maintain a fixed yen price for its product, the priceexpressed in U.S. dollars would have to double. This would make Japanese products more ex-pensive to U.S. consumers, however, and result in lost sales. Obviously, appreciation of theyen creates a problem for Japanese producers that must compete with U.S. producers.
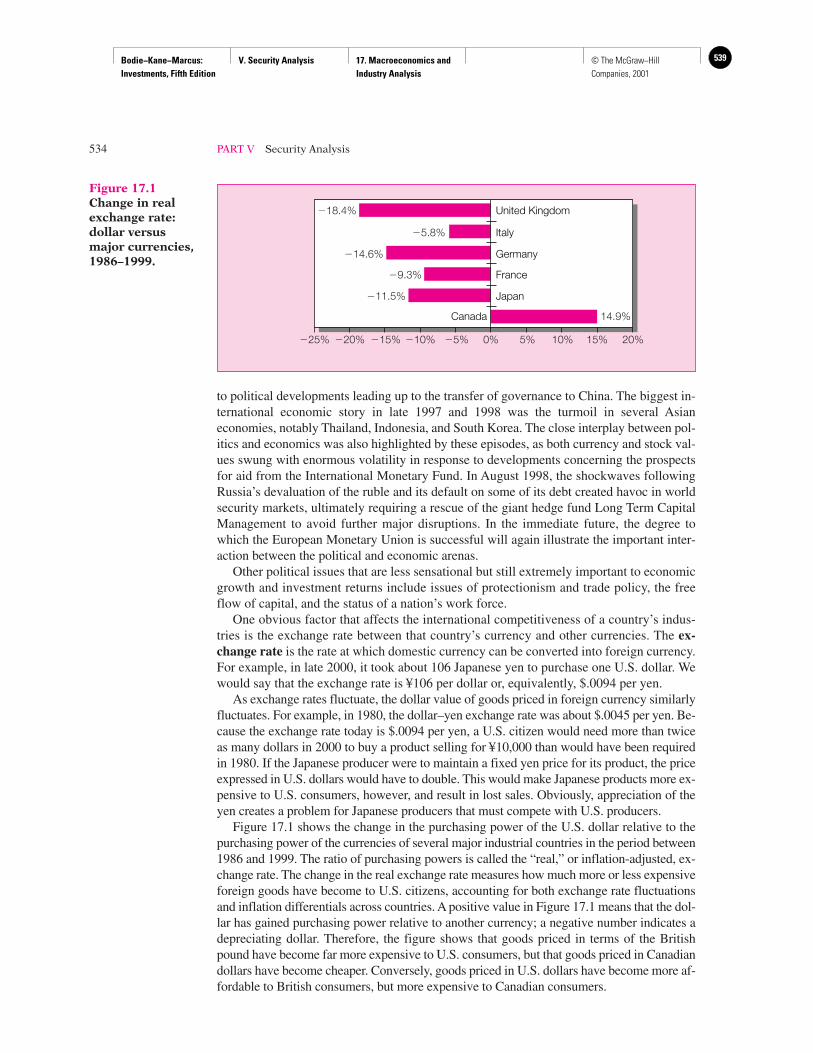
Figure 17.1 shows the change in the purchasing power of the U.S. dollar relative to thepurchasing power of the currencies of several major industrial countries in the period between1986 and 1999. The ratio of purchasing powers is called the “real,” or inflation-adjusted, ex-change rate. The change in the real exchange rate measures how much more or less expensiveforeign goods have become to U.S. citizens, accounting for both exchange rate fluctuationsand inflation differentials across countries. A positive value in Figure 17.1 means that the dol-lar has gained purchasing power relative to another currency; a negative number indicates adepreciating dollar. Therefore, the figure shows that goods priced in terms of the Britishpound have become far more expensive to U.S. consumers, but that goods priced in Canadiandollars have become cheaper. Conversely, goods priced in U.S. dollars have become more af-fordable to British consumers, but more expensive to Canadian consumers.
534 PART V Security Analysis
�20% �15% �10% �5% 0% 15%10%5% 20%�25%
�18.4% United Kingdom
�14.6% Germany
�9.3% France
�11.5% Japan
�5.8% Italy
14.9%Canada
Figure 17.1Change in realexchange rate:dollar versusmajor currencies,1986–1999.
Bodie−Kane−Marcus: Investments, Fifth Edition
V. Security Analysis 17. Macroeconomics and Industry Analysis
540 © The McGraw−Hill Companies, 2001
CHAPTER 17 Macroeconomic and Industry Analysis 535
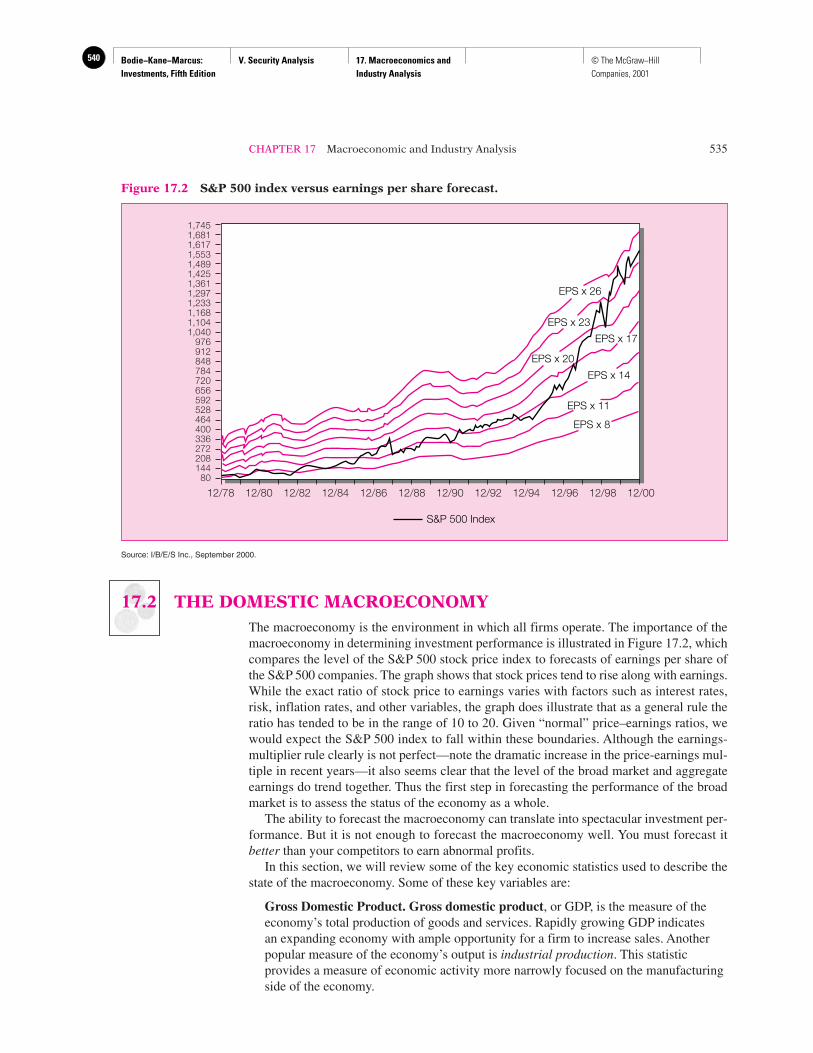
17.2 THE DOMESTIC MACROECONOMYThe macroeconomy is the environment in which all firms operate. The importance of themacroeconomy in determining investment performance is illustrated in Figure 17.2, whichcompares the level of the S&P 500 stock price index to forecasts of earnings per share ofthe S&P 500 companies. The graph shows that stock prices tend to rise along with earnings.While the exact ratio of stock price to earnings varies with factors such as interest rates,risk, inflation rates, and other variables, the graph does illustrate that as a general rule theratio has tended to be in the range of 10 to 20. Given “normal” price–earnings ratios, wewould expect the S&P 500 index to fall within these boundaries. Although the earnings-multiplier rule clearly is not perfect—note the dramatic increase in the price-earnings mul-tiple in recent years—it also seems clear that the level of the broad market and aggregateearnings do trend together. Thus the first step in forecasting the performance of the broadmarket is to assess the status of the economy as a whole.
The ability to forecast the macroeconomy can translate into spectacular investment per-formance. But it is not enough to forecast the macroeconomy well. You must forecast itbetter than your competitors to earn abnormal profits.
In this section, we will review some of the key economic statistics used to describe thestate of the macroeconomy. Some of these key variables are:
Gross Domestic Product. Gross domestic product, or GDP, is the measure of theeconomy’s total production of goods and services. Rapidly growing GDP indicatesan expanding economy with ample opportunity for a firm to increase sales. Anotherpopular measure of the economy’s output is industrial production. This statisticprovides a measure of economic activity more narrowly focused on the manufacturingside of the economy.
S&P 500 Index
EPS x 20
EPS x 17
EPS x 23
EPS x 26
EPS x 14
EPS x 11
EPS x 8
1,7451,6811,6171,5531,4891,4251,3611,2971,2331,1681,1041,040
97691284878472065659252846440033627220814480
12/8012/78 12/82 12/84 12/86 12/88 12/90 12/92 12/94 12/96 12/98 12/00
Figure 17.2 S&P 500 index versus earnings per share forecast.
Source: I/B/E/S Inc., September 2000.
Bodie−Kane−Marcus: Investments, Fifth Edition
V. Security Analysis 17. Macroeconomics and Industry Analysis
541© The McGraw−Hill Companies, 2001
Employment. The unemployment rate is the percentage of the total labor force (i.e.,those who are either working or actively seeking employment) yet to find work. Theunemployment rate measures the extent to which the economy is operating at fullcapacity. The unemployment rate is a factor related to workers only, but further insightinto the strength of the economy can be gleaned from the unemployment rate for otherfactors of production. Analysts also look at the factory capacity utilization rate, whichis the ratio of actual output from factories to potential output.
Inflation. Inflation is the rate at which the general level of prices is rising. High rates ofinflation often are associated with “overheated” economies, that is, economies where thedemand for goods and services is outstripping productive capacity, which leads to upwardpressure on prices. Most governments walk a fine line in their economic policies. Theyhope to stimulate their economies enough to maintain nearly full employment, but notso much as to bring on inflationary pressures. The perceived trade-off between inflationand unemployment is at the heart of many macroeconomic policy disputes. There isconsiderable room for disagreement as to the relative costs of these policies as well asthe economy’s relative vulnerability to these pressures at any particular time.
Interest Rates. High interest rates reduce the present value of future cash flows,thereby reducing the attractiveness of investment opportunities. For this reason, realinterest rates are key determinants of business investment expenditures. Demand forhousing and high-priced consumer durables such as automobiles, which are commonlyfinanced, also is highly sensitive to interest rates because interest rates affect interestpayments. (In Chapter 5, Section 5.1, we examined the determinants of interest rates.)
Budget Deficit. The budget deficit of the federal government is the differencebetween government spending and revenues. Any budgetary shortfall must be offsetby government borrowing. Large amounts of government borrowing can force upinterest rates by increasing the total demand for credit in the economy. Economistsgenerally believe excessive government borrowing will “crowd out” private borrowingand investing by forcing up interest rates and choking off business investment.
Sentiment. Consumers’ and producers’ optimism or pessimism concerning theeconomy is an important determinant of economic performance. If consumers haveconfidence in their future income levels, for example, they will be more willing tospend on big-ticket items. Similarly, businesses will increase production and inventorylevels if they anticipate higher demand for their products. In this way, beliefs influencehow much consumption and investment will be pursued and affect the aggregatedemand for goods and services.
17.3 DEMAND AND SUPPLY SHOCKSA useful way to organize your analysis of the factors that might influence the macroecon-omy is to classify any impact as a supply or demand shock. A demand shock is an event thataffects the demand for goods and services in the economy. Examples of positive demandshocks are reductions in tax rates, increases in the money supply, increases in governmentspending, or increases in foreign export demand. A supply shock is an event that influences
536 PART V Security Analysis
CONCEPTC H E C K �QUESTION 1
Consider an economy where the dominant industry is automobile production for domestic con-sumption as well as export. Now suppose the auto market is hurt by an increase in the length oftime people use their cars before replacing them. Describe the probable effects of this change on(a) GDP, (b) unemployment, (c) the government budget deficit, and (d ) interest rates.
Bodie−Kane−Marcus: Investments, Fifth Edition
V. Security Analysis 17. Macroeconomics and Industry Analysis
542 © The McGraw−Hill Companies, 2001
production capacity and costs. Examples of supply shocks are changes in the price of im-ported oil; freezes, floods, or droughts that might destroy large quantities of agriculturalcrops; changes in the educational level of an economy’s work force; or changes in the wagerates at which the labor force is willing to work.
Demand shocks are usually characterized by aggregate output moving in the same di-rection as interest rates and inflation. For example, a big increase in government spendingwill tend to stimulate the economy and increase GDP. It also might increase interest ratesby increasing the demand for borrowed funds by the government as well as by businessesthat might desire to borrow to finance new ventures. Finally, it could increase the inflationrate if the demand for goods and services is raised to a level at or beyond the total produc-tive capacity of the economy.
Supply shocks are usually characterized by aggregate output moving in the opposite di-rection of inflation and interest rates. For example, a big increase in the price of imported oilwill be inflationary because costs of production will rise, which eventually will lead to in-creases in prices of finished goods. The increase in inflation rates over the near term can leadto higher nominal interest rates. Against this background, aggregate output will be falling.With raw materials more expensive, the productive capacity of the economy is reduced, as isthe ability of individuals to purchase goods at now-higher prices. GDP, therefore, tends to fall.
How can we relate this framework to investment analysis? You want to identify the in-dustries that will be most helped or hurt in any macroeconomic scenario you envision. Forexample, if you forecast a tightening of the money supply, you might want to avoid indus-tries such as automobile producers that might be hurt by the likely increase in interest rates.We caution you again that these forecasts are no easy task. Macroeconomic predictions arenotoriously unreliable. And again, you must be aware that in all likelihood your forecastwill be made using only publicly available information. Any investment advantage youhave will be a result only of better analysis—not better information.
CONFLICTING ECONOMIC SIGNALS
Despite last week’s return to optimism in the stock mar-ket, nagging recession concerns continue to confoundWall Street.
With conflicting economic signals, investors findthemselves in a quandary. Is the economy rapidly drop-ping into recession, or close to one? Or is it simply takinga modest breath before strengthening later this year?
The recession quandary has split Wall Street strate-gists. One camp, which includes Charles Clough, chiefstrategist at Merrill Lynch & Co., argues that the econ-omy is slowing much faster than realized. He says risingcorporate inventories and a spent consumer are con-tributing to a steepening slowdown. Moreover, the Fed-eral Reserve is moving too slowly to stave off a period ofextended sluggishness, and earnings will probably suffermore than anticipated this year.
The other camp, which includes Abby J. Cohen, mar-ket strategist at Goldman, Sachs & Co., believes that theeconomy will rebound later this year.
Emphasizing Financial StocksThe divergent views play a crucial role in near-term in-vesting decisions. Mr. Clough has trimmed his exposureto the stock market in favor of bonds and emphasizes fi-nancial stocks, which would benefit in a low-rate envi-ronment.
Ms. Cohen, conversely, maintains a healthy exposureto the stock market and emphasizes not just financials,but also economically sensitive stocks such as autos andhousing-related stocks. She further expects to emphasizelater-cyclical commodity stocks as the year unfolds andthe economic pace quickens.
James Weiss, deputy chief investment officer forgrowth equities at State Street in Boston, and DavidShulman, chief strategist at Salomon Brothers, concurwith much of Mr. Clough’s analysis of the economy. Mr.Weiss says the recent uptick in cyclical stocks should bemostly ignored, and he favors steadier growth in defen-sive sectors like health care and beverages.
Source: Dave Kansas, “Conflicting Economic Signals Are Dividing Strategists,” The Wall Street Journal, February 26, 1996. Excerpted bypermission of The Wall Street Journal, © 1996 Dow Jones & Company, Inc. All Rights Reserved Worldwide.
Bodie−Kane−Marcus: Investments, Fifth Edition
V. Security Analysis 17. Macroeconomics and Industry Analysis
543© The McGraw−Hill Companies, 2001
An example of how investment advice is tied to macroeconomic forecasts is given in thenearby box. The article focuses on the different advice being given by two prominent ana-lysts with differing views of the economy. The relatively bearish strategists believe theeconomy is about to slow down. As a result, they recommend asset allocation toward thefixed-income market, which will benefit if interest rates fall in a recession. Within the stockmarket, they recommend industries with below-average sensitivity to macroeconomic con-ditions. Two recession-resistant, or “defensive,” investments specifically cited are bever-age and health care stocks, both of which are expected to outperform the rest of the marketas investors become aware of the slowdown in growth. Conversely, the optimistic analystsrecommend investments with greater sensitivity to the business cycle.
17.4 FEDERAL GOVERNMENT POLICYAs the previous section would suggest, the government has two broad classes of macro-economic tools—those that affect the demand for goods and services and those that affectthe supply. For much of postwar history, demand-side policy has been of primary interest.The focus has been on government spending, tax levels, and monetary policy. Since the1980s, however, increasing attention has been focused on supply-side economics. Broadlyinterpreted, supply-side concerns have to do with enhancing the productive capacity of theeconomy, rather than increasing the demand for the goods and services the economy canproduce. In practice, supply-side economists have focused on the appropriateness of the in-centives to work, innovate, and take risks that result from our system of taxation. However,issues such as national policies on education, infrastructure (such as communication andtransportation systems), and research and development also are properly regarded as partof supply-side macroeconomic policy.
Fiscal Policy
Fiscal policy refers to the government’s spending and tax actions and is part of “demand-side management.” Fiscal policy is probably the most direct way either to stimulate or toslow the economy. Decreases in government spending directly deflate the demand forgoods and services. Similarly, increases in tax rates immediately siphon income from con-sumers and result in fairly rapid decreases in consumption.
Ironically, although fiscal policy has the most immediate impact on the economy, theformulation and implementation of such policy is usually painfully slow and involved. Thisis because fiscal policy requires enormous amounts of compromise between the executiveand legislative branches. Tax and spending policy must be initiated and voted on by Con-gress, which requires considerable political negotiations, and any legislation passed mustbe signed by the president, requiring more negotiation. Thus, although the impact of fiscalpolicy is relatively immediate, its formulation is so cumbersome that fiscal policy cannotin practice be used to fine-tune the economy.
Moreover, much of government spending, such as that for Medicare or social security,is nondiscretionary, meaning that it is determined by formula rather than policy and cannotbe changed in response to economic conditions. This places even more rigidity into the for-mulation of fiscal policy.
A common way to summarize the net impact of government fiscal policy is to look at thegovernment’s budget deficit or surplus, which is simply the difference between revenues andexpenditures. A large deficit means the government is spending considerably more than it istaking in by way of taxes. The net effect is to increase the demand for goods (via spending)by more than it reduces the demand for goods (via taxes), thereby stimulating the economy.
538 PART V Security Analysis
Bodie−Kane−Marcus: Investments, Fifth Edition
V. Security Analysis 17. Macroeconomics and Industry Analysis
544 © The McGraw−Hill Companies, 2001
CHAPTER 17 Macroeconomic and Industry Analysis 539
Monetary Policy
Monetary policy refers to the manipulation of the money supply to affect the macroecon-omy and is the other main leg of demand-side policy. Monetary policy works largelythrough its impact on interest rates. Increases in the money supply lower short-term inter-est rates, ultimately encouraging investment and consumption demand. Over longer peri-ods, however, most economists believe a higher money supply leads only to a higherprice level and does not have a permanent effect on economic activity. Thus the monetaryauthorities face a difficult balancing act. Expansionary monetary policy probably willlower interest rates and thereby stimulate investment and some consumption demandin the short run, but these circumstances ultimately will lead only to higher prices. Thestimulation/inflation trade-off is implicit in all debate over proper monetary policy.
Fiscal policy is cumbersome to implement but has a fairly direct impact on the economy,whereas monetary policy is easily formulated and implemented but has a less direct impact.Monetary policy is determined by the Board of Governors of the Federal Reserve System.Board members are appointed by the president for 14-year terms and are reasonably insu-lated from political pressure. The board is small enough, and often sufficiently dominatedby its chairperson, that policy can be formulated and modulated relatively easily.
Implementation of monetary policy also is quite direct. The most widely used tool is theopen market operation, in which the Fed buys or sells bonds for its own account. When theFed buys securities, it simply “writes a check,” thereby increasing the money supply. (Un-like us, the Fed can pay for the securities without drawing down funds at a bank account.)Conversely, when the Fed sells a security, the money paid for it leaves the money supply.Open market operations occur daily, allowing the Fed to fine-tune its monetary policy.
Other tools at the Fed’s disposal are the discount rate, which is the interest rate it chargesbanks on short-term loans, and the reserve requirement, which is the fraction of depositsthat banks must hold as cash on hand or as deposits with the Fed. Reductions in the dis-count rate signal a more expansionary monetary policy. Lowering reserve requirementsallows banks to make more loans with each dollar of deposits and stimulates the economyby increasing the effective money supply.
Monetary policy affects the economy in a more roundabout way than fiscal policy.Whereas fiscal policy directly stimulates or dampens the economy, monetary policy workslargely through its impact on interest rates. Increases in the money supply lower interestrates, which stimulates investment demand. As the quantity of money in the economy in-creases, investors will find that their portfolios of assets include too much money. They willrebalance their portfolios by buying securities such as bonds, forcing bond prices up andinterest rates down. In the longer run, individuals may increase their holdings of stocks aswell and ultimately buy real assets, which stimulates consumption demand directly. Theultimate effect of monetary policy on investment and consumption demand, however, isless immediate than that of fiscal policy.
Supply-Side Policies
Fiscal and monetary policy are demand-oriented tools that affect the economy by stimulat-ing the total demand for goods and services. The implicit belief is that the economy will notby itself arrive at a full employment equilibrium, and that macroeconomic policy can push
CONCEPTC H E C K �QUESTION 2
Suppose the government wants to stimulate the economy without increasing interest rates. Whatcombination of fiscal and monetary policy might accomplish this goal?
Bodie−Kane−Marcus: Investments, Fifth Edition
V. Security Analysis 17. Macroeconomics and Industry Analysis
545© The McGraw−Hill Companies, 2001
the economy toward this goal. In contrast, supply-side policies treat the issue of the produc-tive capacity of the economy. The goal is to create an environment in which workers andowners of capital have the maximum incentive and ability to produce and develop goods.
Supply-side economists also pay considerable attention to tax policy. Whereas demandsiders look at the effect of taxes on consumption demand, supply siders focus on incentivesand marginal tax rates. They argue that lowering tax rates will elicit more investment and im-prove incentives to work, thereby enhancing economic growth. Some go so far as to claimthat reductions in tax rates can lead to increases in tax revenues because the lower tax rateswill cause the economy and the revenue tax base to grow by more than the tax rate is reduced.
17.5 BUSINESS CYCLESWe’ve looked at the tools the government uses to fine-tune the economy, attempting tomaintain low unemployment and low inflation. Despite these efforts, economies repeatedlyseem to pass through good and bad times. One determinant of the broad asset allocation de-cision of many analysts is a forecast of whether the macroeconomy is improving or deteri-orating. A forecast that differs from the market consensus can have a major impact oninvestment strategy.
The Business Cycle
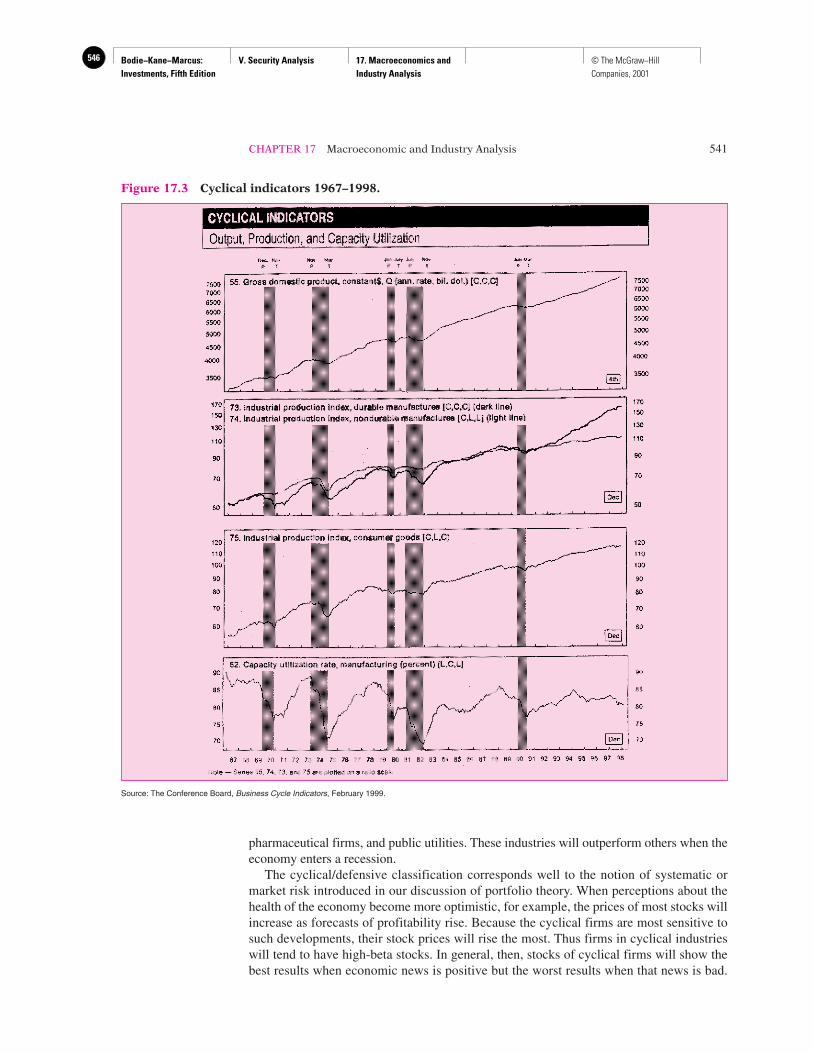
The economy recurrently experiences periods of expansion and contraction, although thelength and depth of those cycles can be irregular. This recurring pattern of recession and re-covery is called the business cycle. Figure 17.3 presents graphs of several measures of pro-duction and output for the years 1967–1998. The production series all show clear variationaround a generally rising trend. The bottom graph of capacity utilization also evidences aclear cyclical (although irregular) pattern.
The transition points across cycles are called peaks and troughs, labeled P and T at thetop of the graph. A peak is the transition from the end of an expansion to the start of a con-traction. A trough occurs at the bottom of a recession just as the economy enters a recov-ery. The shaded areas in Figure 17.3 all represent periods of recession.
As the economy passes through different stages of the business cycle, the relative per-formance of different industry groups might be expected to vary. For example, at a trough,just before the economy begins to recover from a recession, one would expect that cyclicalindustries, those with above-average sensitivity to the state of the economy, would tend tooutperform other industries. Examples of cyclical industries are producers of durable goodssuch as automobiles or washing machines. Because purchases of these goods can be de-ferred during a recession, sales are particularly sensitive to macroeconomic conditions.Other cyclical industries are producers of capital goods, that is, goods used by other firmsto produce their own products. When demand is slack, few companies will be expandingand purchasing capital goods. Therefore, the capital goods industry bears the brunt of aslowdown but does well in an expansion.
In contrast to cyclical firms, defensive industries have little sensitivity to the businesscycle. These are industries that produce goods for which sales and profits are least sensitiveto the state of the economy. Defensive industries include food producers and processors,
540 PART V Security Analysis
CONCEPTC H E C K �QUESTION 3
Large tax cuts in the 1980s were followed by rapid growth in GDP. How would demand-side andsupply-side economists differ in their interpretations of this phenomenon?
Bodie−Kane−Marcus: Investments, Fifth Edition
V. Security Analysis 17. Macroeconomics and Industry Analysis
546 © The McGraw−Hill Companies, 2001
CHAPTER 17 Macroeconomic and Industry Analysis 541
pharmaceutical firms, and public utilities. These industries will outperform others when theeconomy enters a recession.
The cyclical/defensive classification corresponds well to the notion of systematic ormarket risk introduced in our discussion of portfolio theory. When perceptions about thehealth of the economy become more optimistic, for example, the prices of most stocks willincrease as forecasts of profitability rise. Because the cyclical firms are most sensitive tosuch developments, their stock prices will rise the most. Thus firms in cyclical industrieswill tend to have high-beta stocks. In general, then, stocks of cyclical firms will show thebest results when economic news is positive but the worst results when that news is bad.
Figure 17.3 Cyclical indicators 1967–1998.
Source: The Conference Board, Business Cycle Indicators, February 1999.

Bodie−Kane−Marcus: Investments, Fifth Edition
V. Security Analysis 17. Macroeconomics and Industry Analysis
547© The McGraw−Hill Companies, 2001
Conversely, defensive firms will have low betas and performance that is relatively unaf-fected by overall market conditions.
If your assessments of the state of the business cycle were reliably more accurate thanthose of other investors, you would simply choose cyclical industries when you are rela-tively more optimistic about the economy and defensive firms when you are relativelymore pessimistic. Unfortunately, it is not so easy to determine when the economy is pass-ing through a peak or a trough. It if were, choosing between cyclical and defensive indus-tries would be easy. As we know from our discussion of efficient markets, however,attractive investment choices will rarely be obvious. It usually is not apparent that a reces-sion or expansion has started or ended until several months after the fact. With hindsight,the transitions from expansion to recession and back might be apparent, but it is often quitedifficult to say whether the economy is heating up or slowing down at any moment.
Economic Indicators
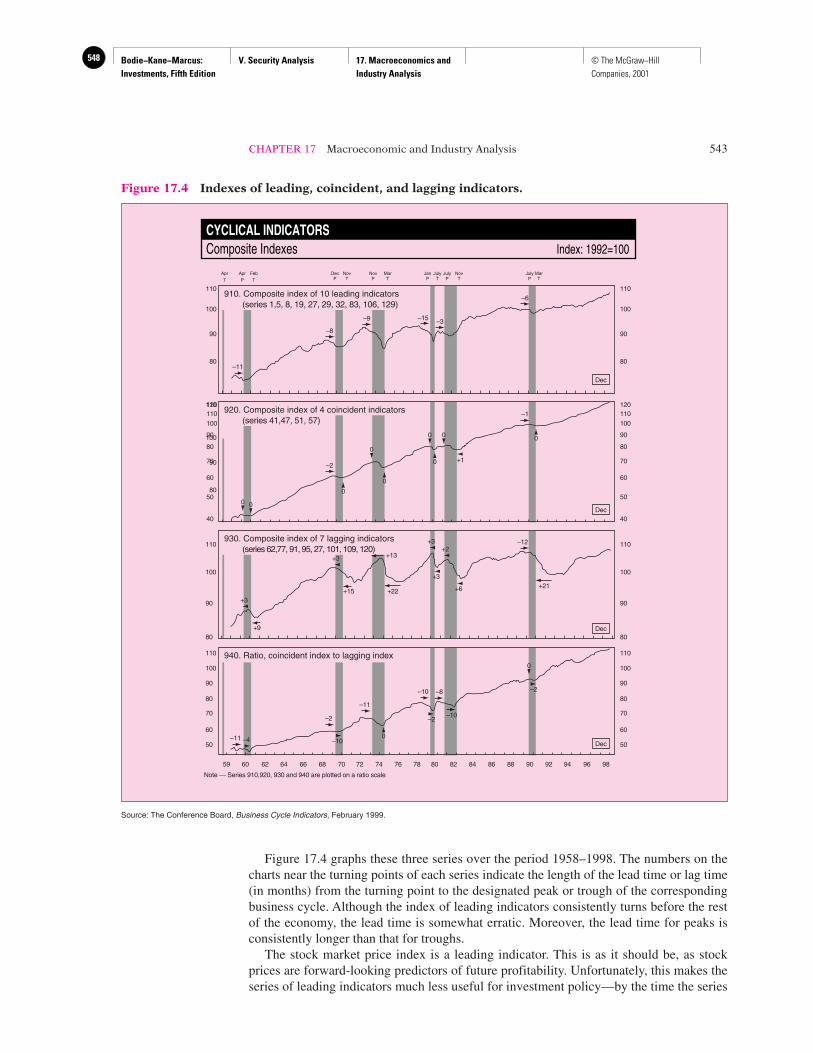
Given the cyclical nature of the business cycle, it is not surprising that to some extent thecycle can be predicted. A set of cyclical indicators computed by the Conference Boardhelps forecast, measure, and interpret short-term fluctuations in economic activity. Lead-ing economic indicators are those economic series that tend to rise or fall in advance ofthe rest of the economy. Coincident and lagging indicators, as their names suggest, movein tandem with or somewhat after the broad economy.
Ten series are grouped into a widely followed composite index of leading economic in-dicators. Similarly, four coincident and seven lagging indicators form separate indexes. Thecomposition of these indexes appears in Table 17.2.
542 PART V Security Analysis
A. Leading indicators1. Average weekly hours of production workers (manufacturing)2. Initial claims for unemployment insurance3. Manufacturers’ new orders (consumer goods and materials industries)4. Vendor performance—slower deliveries diffusion index5. New orders for nondefense capital goods6. New private housing units authorized by local building permits7. Yield curve slope: 10-year Treasury minus federal funds rate8. Stock prices, 500 common stocks9. Money supply (M2)
10. Index of consumer expectations
B. Coincident indicators1. Employees on nonagricultural payrolls2. Personal income less transfer payments3. Industrial production4. Manufacturing and trade sales
C. Lagging indicators1. Average duration of unemployment2. Ratio of trade inventories to sales3. Change in index of labor cost per unit of output4. Average prime rate charged by banks5. Commercial and industrial loans outstanding6. Ratio of consumer installment credit outstanding to personal income7. Change in consumer price index for services
Table 17.2Indexes ofEconomicIndicators
Source: The Conference Board, Business Cycle Indicators, February 2000.
Bodie−Kane−Marcus: Investments, Fifth Edition
V. Security Analysis 17. Macroeconomics and Industry Analysis
548 © The McGraw−Hill Companies, 2001
CHAPTER 17 Macroeconomic and Industry Analysis 543
Figure 17.4 graphs these three series over the period 1958–1998. The numbers on thecharts near the turning points of each series indicate the length of the lead time or lag time(in months) from the turning point to the designated peak or trough of the correspondingbusiness cycle. Although the index of leading indicators consistently turns before the restof the economy, the lead time is somewhat erratic. Moreover, the lead time for peaks isconsistently longer than that for troughs.
The stock market price index is a leading indicator. This is as it should be, as stockprices are forward-looking predictors of future profitability. Unfortunately, this makes theseries of leading indicators much less useful for investment policy—by the time the series
CYCLICAL INDICATORSComposite Indexes Index: 1992=100
910. Composite index of 10 leading indicators(series 1,5, 8, 19, 27, 29, 32, 83, 106, 129)
110
100
90
80
110
100
90
80
Dec
–6
–3–15–9
–8
–11
JulyP
MarT
DecP
AprT
AprP
FebT
NovT
NovP
MarT
JulyP
JulyT
JanP
NovT
930. Composite index of 7 lagging indicators(series 62,77, 91, 95, 27, 101, 109, 120)
110
100
90
80
110
100
90
80Dec
–12
+9
+15 +22+21
+13
+3
+3
+3+2
+3
+6
920. Composite index of 4 coincident indicators(series 41,47, 51, 57)
110
100
90
80
120
100
110
90
80
70
60
50
40
120
100
110
90
80
70
60
50
40Dec
–1
–2+1
0 0
0
0 0
0
0
0
0
0
940. Ratio, coincident index to lagging index 110
100
90
80
70
60
50
110
100
90
80
70
60
50 Dec–11
59 60 62 64 66 68 70 72 74 76 78 80 82 84 86 88 90 92 94 96 98
Note — Series 910,920, 930 and 940 are plotted on a ratio scale
–11
–10 –8
–2
–4 –10
–10–2
–2
0
Figure 17.4 Indexes of leading, coincident, and lagging indicators.
Source: The Conference Board, Business Cycle Indicators, February 1999.

Bodie−Kane−Marcus: Investments, Fifth Edition
V. Security Analysis 17. Macroeconomics and Industry Analysis
549© The McGraw−Hill Companies, 2001
predicts an upturn, the market his already made its move. Although the business cycle maybe somewhat predictable, the stock market may not be. This is just one more manifestationof the efficient markets hypothesis.
The money supply is another indicator. This makes sense in light of our earlier discus-sion concerning the lags surrounding the effects of monetary policy on the economy. Anexpansionary monetary policy can be observed fairly quickly, but it might not affect theeconomy for several months. Therefore, today’s monetary policy might well predict futureeconomic activity.
Other leading indicators focus directly on decisions made today that will affect productionin the near future. For example, manufacturers’ new orders for goods, contracts and orders forplant and equipment, and housing starts all signal a coming expansion in the economy.
A wide range of economic indicators are released to the public on a regular “economiccalendar.” Table 17.3 is an “economic calendar,” listing the public announcement dates andsources for about 20 statistics of interest. These announcements are reported in the financial
544 PART V Security Analysis
Statistic Release Date* Source
Auto and truck sales 2nd of month Commerce Department
Business inventories 15th of month Commerce Department
Construction spending 1st business day of month Commerce Department
Consumer confidence Last Tuesday of month Conference Board
Consumer credit 5th business day of month Federal Reserve Board
Consumer price index (CPI) 13th of month Bureau of Labor Statistics
Durable goods orders 26th of month Commerce Department
Employment cost index End of first month of quarter Bureau of Labor Statistics
Employment record 1st Friday of month Bureau of Labor Statistics(unemployment, averageworkweek, nonfarmpayrolls)
Existing home sales 25th of month National Association ofRealtors
Factory orders 1st business day of month Commerce Department
Gross domestic product 3rd–4th week of month Commerce Department
Housing starts 16th of month Commerce Department
Industrial production 15th of month Federal Reserve Board
Initial claims for jobless Thursdays Department of Laborbenefits
International trade balance 20th of month Commerce Department
Index of leading economic Beginning of month Conference Boardindicators
Money supply Thursdays Federal Reserve Board
New home sales Last business day of month Commerce Department
Producer price index 11th of month Bureau of Labor Statistics
Productivity and costs 2nd month in quarter Bureau of Labor Statistics(approx. 7th day of month)
Retail sales 13th of month Commerce Department
Survey of purchasing 1st business day of month National Association ofmanagers Purchasing Managers
Table 17.3EconomicCalendar
*Many of these release dates are approximate.Source: Charter Media, Inc., http://biz.yahoo.com/c/terms/terms.html.
Bodie−Kane−Marcus: Investments, Fifth Edition
V. Security Analysis 17. Macroeconomics and Industry Analysis
550 © The McGraw−Hill Companies, 2001
CHAPTER 17 Macroeconomic and Industry Analysis 545
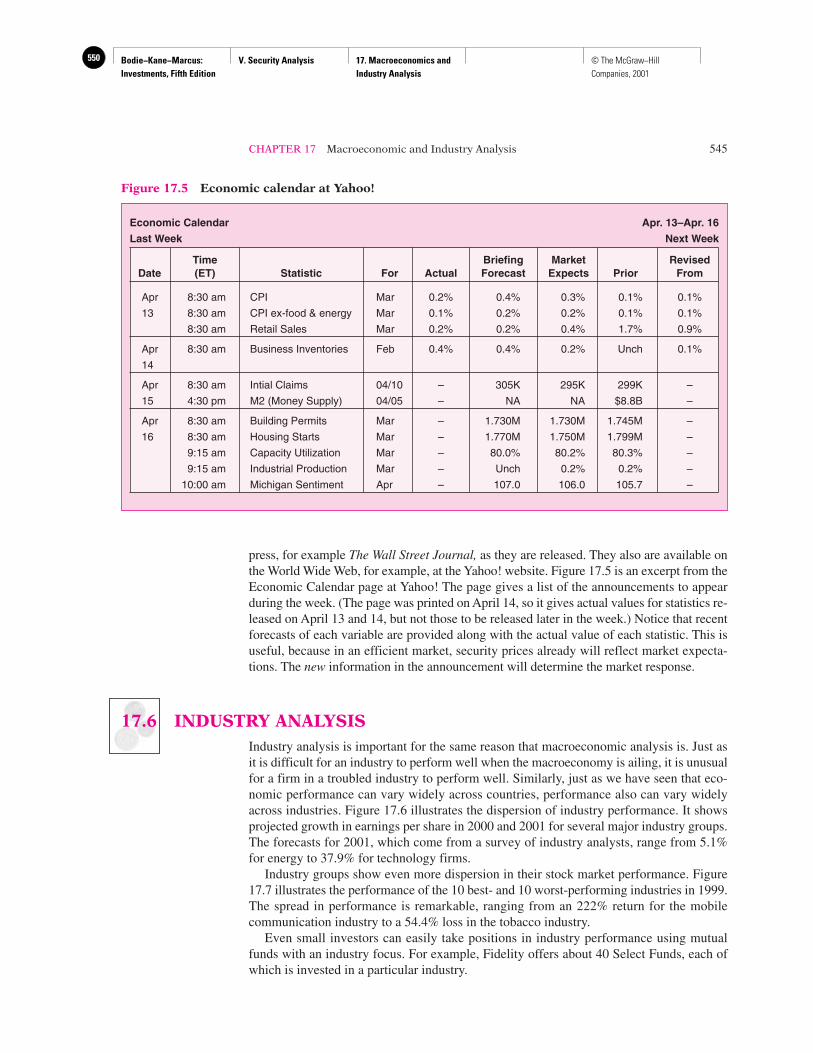
press, for example The Wall Street Journal, as they are released. They also are available onthe World Wide Web, for example, at the Yahoo! website. Figure 17.5 is an excerpt from theEconomic Calendar page at Yahoo! The page gives a list of the announcements to appearduring the week. (The page was printed on April 14, so it gives actual values for statistics re-leased on April 13 and 14, but not those to be released later in the week.) Notice that recentforecasts of each variable are provided along with the actual value of each statistic. This isuseful, because in an efficient market, security prices already will reflect market expecta-tions. The new information in the announcement will determine the market response.
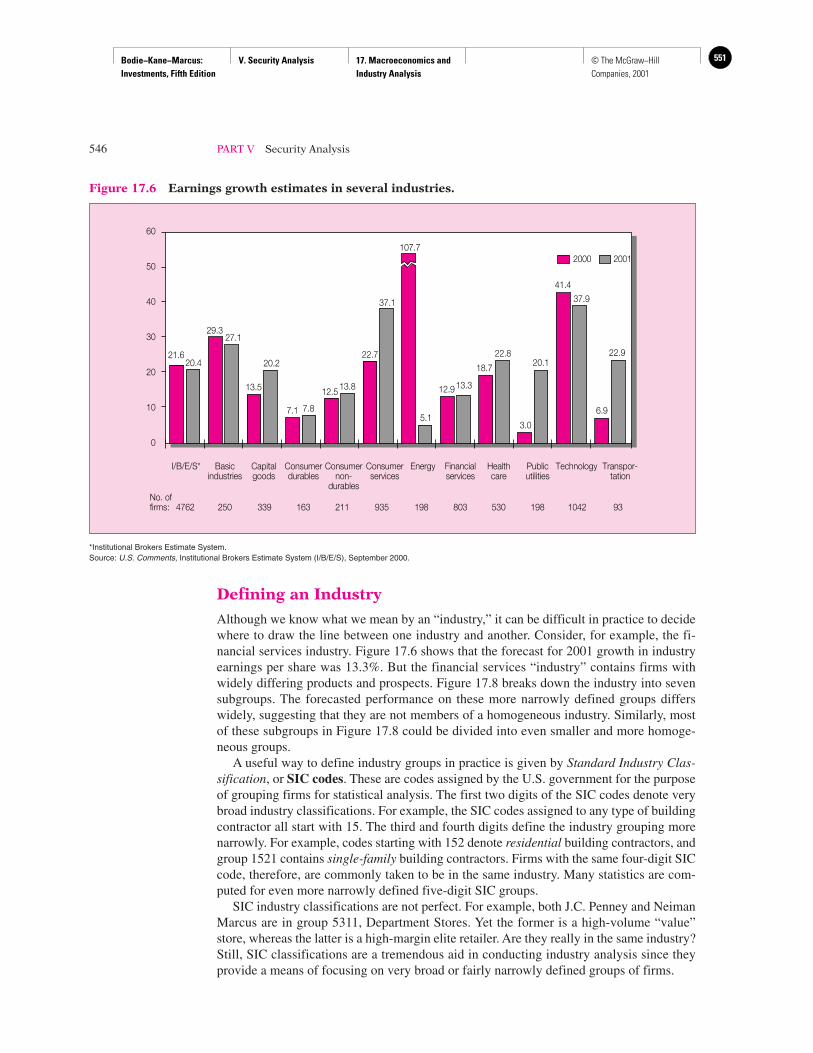
17.6 INDUSTRY ANALYSISIndustry analysis is important for the same reason that macroeconomic analysis is. Just asit is difficult for an industry to perform well when the macroeconomy is ailing, it is unusualfor a firm in a troubled industry to perform well. Similarly, just as we have seen that eco-nomic performance can vary widely across countries, performance also can vary widelyacross industries. Figure 17.6 illustrates the dispersion of industry performance. It showsprojected growth in earnings per share in 2000 and 2001 for several major industry groups.The forecasts for 2001, which come from a survey of industry analysts, range from 5.1%for energy to 37.9% for technology firms.
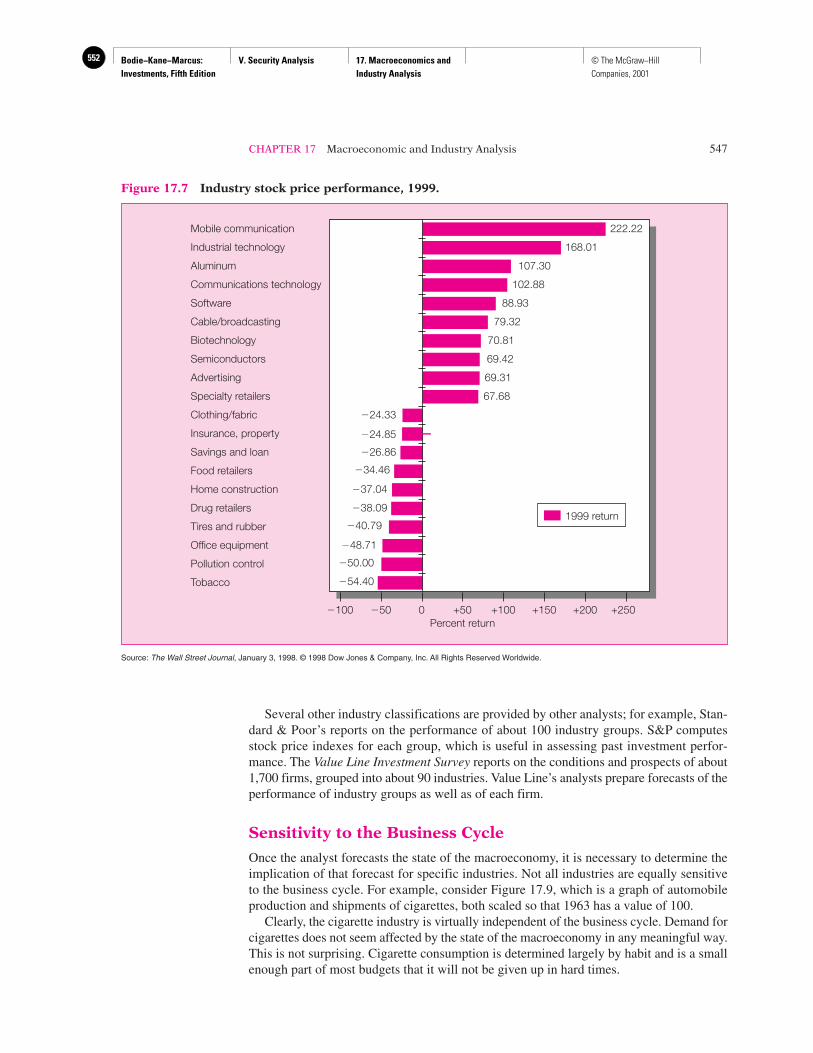
Industry groups show even more dispersion in their stock market performance. Figure17.7 illustrates the performance of the 10 best- and 10 worst-performing industries in 1999.The spread in performance is remarkable, ranging from an 222% return for the mobilecommunication industry to a 54.4% loss in the tobacco industry.
Even small investors can easily take positions in industry performance using mutualfunds with an industry focus. For example, Fidelity offers about 40 Select Funds, each ofwhich is invested in a particular industry.
Economic Calendar Apr. 13–Apr. 16
Last Week Next Week
Time Briefing Market RevisedDate (ET) Statistic For Actual Forecast Expects Prior From
Apr 8:30 am CPI Mar 0.2% 0.4% 0.3% 0.1% 0.1%
13 8:30 am CPI ex-food & energy Mar 0.1% 0.2% 0.2% 0.1% 0.1%
8:30 am Retail Sales Mar 0.2% 0.2% 0.4% 1.7% 0.9%
Apr 8:30 am Business Inventories Feb 0.4% 0.4% 0.2% Unch 0.1%
14
Apr 8:30 am Intial Claims 04/10 – 305K 295K 299K –
15 4:30 pm M2 (Money Supply) 04/05 – NA NA $8.8B –
Apr 8:30 am Building Permits Mar – 1.730M 1.730M 1.745M –
16 8:30 am Housing Starts Mar – 1.770M 1.750M 1.799M –
9:15 am Capacity Utilization Mar – 80.0% 80.2% 80.3% –
9:15 am Industrial Production Mar – Unch 0.2% 0.2% –
10:00 am Michigan Sentiment Apr – 107.0 106.0 105.7 –
Figure 17.5 Economic calendar at Yahoo!
Bodie−Kane−Marcus: Investments, Fifth Edition
V. Security Analysis 17. Macroeconomics and Industry Analysis
551© The McGraw−Hill Companies, 2001
Defining an Industry
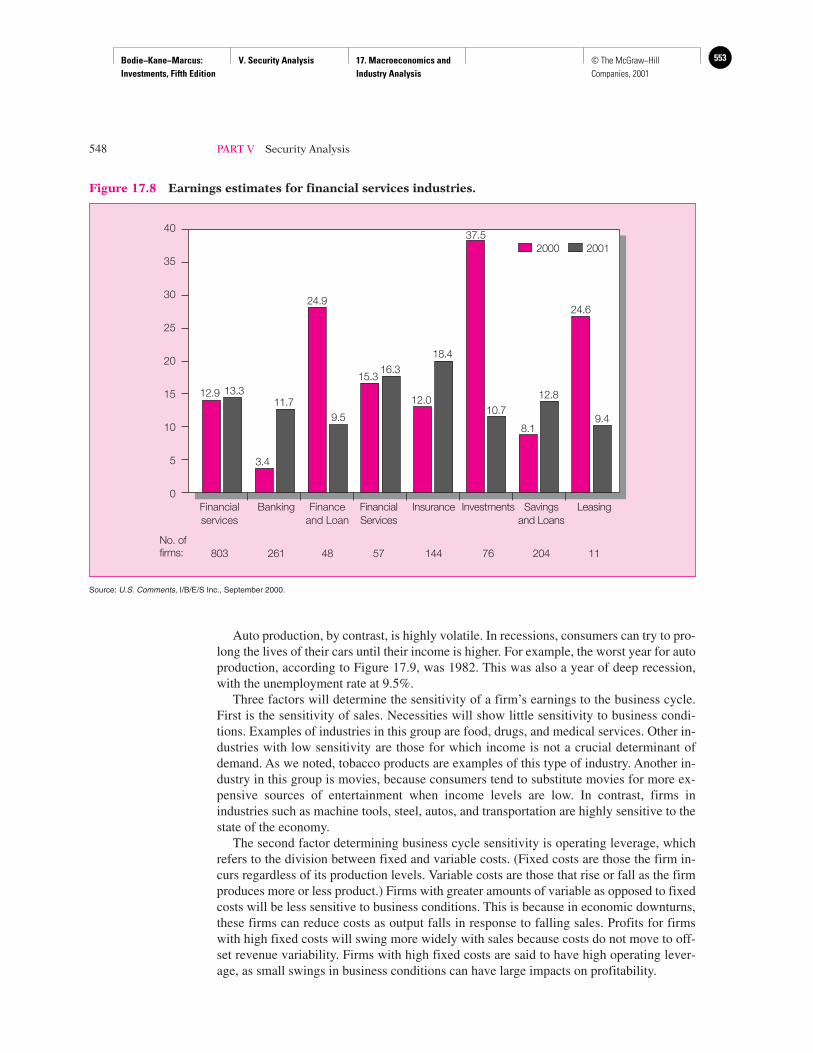
Although we know what we mean by an “industry,” it can be difficult in practice to decidewhere to draw the line between one industry and another. Consider, for example, the fi-nancial services industry. Figure 17.6 shows that the forecast for 2001 growth in industryearnings per share was 13.3%. But the financial services “industry” contains firms withwidely differing products and prospects. Figure 17.8 breaks down the industry into sevensubgroups. The forecasted performance on these more narrowly defined groups differswidely, suggesting that they are not members of a homogeneous industry. Similarly, mostof these subgroups in Figure 17.8 could be divided into even smaller and more homoge-neous groups.
A useful way to define industry groups in practice is given by Standard Industry Clas-sification, or SIC codes. These are codes assigned by the U.S. government for the purposeof grouping firms for statistical analysis. The first two digits of the SIC codes denote verybroad industry classifications. For example, the SIC codes assigned to any type of buildingcontractor all start with 15. The third and fourth digits define the industry grouping morenarrowly. For example, codes starting with 152 denote residential building contractors, andgroup 1521 contains single-family building contractors. Firms with the same four-digit SICcode, therefore, are commonly taken to be in the same industry. Many statistics are com-puted for even more narrowly defined five-digit SIC groups.
SIC industry classifications are not perfect. For example, both J.C. Penney and NeimanMarcus are in group 5311, Department Stores. Yet the former is a high-volume “value”store, whereas the latter is a high-margin elite retailer. Are they really in the same industry?Still, SIC classifications are a tremendous aid in conducting industry analysis since theyprovide a means of focusing on very broad or fairly narrowly defined groups of firms.
546 PART V Security Analysis
60
50
40
30
20
10
0
No. offirms:
I/B/E/S* Basicindustries
Capitalgoods
Consumerdurables
Consumernon-
durables
Consumerservices
Energy Financialservices
Healthcare
Publicutilities
Technology Transpor-tation
2504762 339 163 211 935 198 803
21.620.4
29.327.1
13.5
20.2
7.1 7.8
12.5 13.8
22.7
37.1
107.7
5.1
12.913.3
18.7
22.8
3.0
20.1
41.4
37.9
6.9
22.9
530 198 1042 93
2000 2001
Figure 17.6 Earnings growth estimates in several industries.
*Institutional Brokers Estimate System.Source: U.S. Comments, Institutional Brokers Estimate System (I/B/E/S), September 2000.
Bodie−Kane−Marcus: Investments, Fifth Edition
V. Security Analysis 17. Macroeconomics and Industry Analysis
552 © The McGraw−Hill Companies, 2001
CHAPTER 17 Macroeconomic and Industry Analysis 547
Several other industry classifications are provided by other analysts; for example, Stan-dard & Poor’s reports on the performance of about 100 industry groups. S&P computesstock price indexes for each group, which is useful in assessing past investment perfor-mance. The Value Line Investment Survey reports on the conditions and prospects of about1,700 firms, grouped into about 90 industries. Value Line’s analysts prepare forecasts of theperformance of industry groups as well as of each firm.
Sensitivity to the Business Cycle
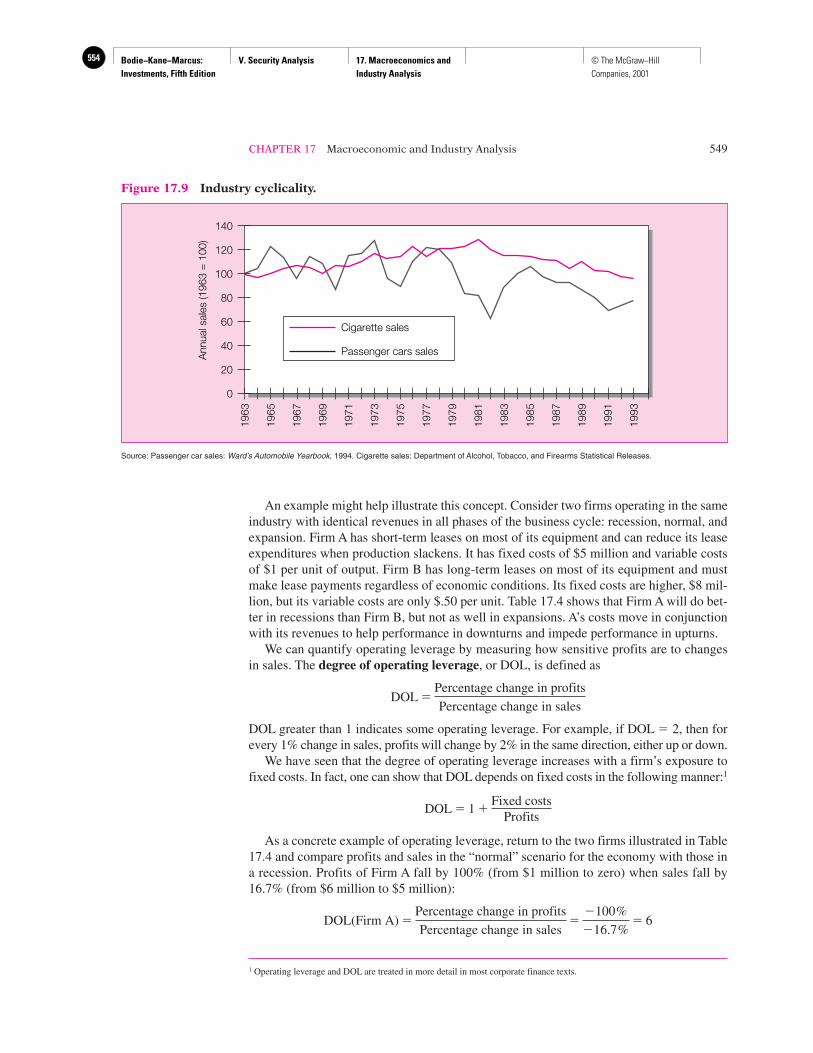
Once the analyst forecasts the state of the macroeconomy, it is necessary to determine theimplication of that forecast for specific industries. Not all industries are equally sensitiveto the business cycle. For example, consider Figure 17.9, which is a graph of automobileproduction and shipments of cigarettes, both scaled so that 1963 has a value of 100.
Clearly, the cigarette industry is virtually independent of the business cycle. Demand forcigarettes does not seem affected by the state of the macroeconomy in any meaningful way.This is not surprising. Cigarette consumption is determined largely by habit and is a smallenough part of most budgets that it will not be given up in hard times.
�100 �50 0 +50Percent return
+100 +150
222.22
+200 +250
Mobile communication
Industrial technology
Aluminum
Communications technology
Software
Cable/broadcasting
Biotechnology
Semiconductors
Advertising
Specialty retailers
Clothing/fabric
Insurance, property
Savings and loan
Food retailers
Home construction
Drug retailers
Tires and rubber
Office equipment
Pollution control
Tobacco
168.01
107.30
102.88
88.93
79.32
69.42
69.31
67.68
�24.33
�24.85
�26.86
�34.46
�37.04
�38.09
�40.79
�48.71
�50.00
�54.40
70.81
1999 return
Figure 17.7 Industry stock price performance, 1999.
Source: The Wall Street Journal, January 3, 1998. © 1998 Dow Jones & Company, Inc. All Rights Reserved Worldwide.
Bodie−Kane−Marcus: Investments, Fifth Edition
V. Security Analysis 17. Macroeconomics and Industry Analysis
553© The McGraw−Hill Companies, 2001
Auto production, by contrast, is highly volatile. In recessions, consumers can try to pro-long the lives of their cars until their income is higher. For example, the worst year for autoproduction, according to Figure 17.9, was 1982. This was also a year of deep recession,with the unemployment rate at 9.5%.
Three factors will determine the sensitivity of a firm’s earnings to the business cycle.First is the sensitivity of sales. Necessities will show little sensitivity to business condi-tions. Examples of industries in this group are food, drugs, and medical services. Other in-dustries with low sensitivity are those for which income is not a crucial determinant ofdemand. As we noted, tobacco products are examples of this type of industry. Another in-dustry in this group is movies, because consumers tend to substitute movies for more ex-pensive sources of entertainment when income levels are low. In contrast, firms inindustries such as machine tools, steel, autos, and transportation are highly sensitive to thestate of the economy.
The second factor determining business cycle sensitivity is operating leverage, whichrefers to the division between fixed and variable costs. (Fixed costs are those the firm in-curs regardless of its production levels. Variable costs are those that rise or fall as the firmproduces more or less product.) Firms with greater amounts of variable as opposed to fixedcosts will be less sensitive to business conditions. This is because in economic downturns,these firms can reduce costs as output falls in response to falling sales. Profits for firmswith high fixed costs will swing more widely with sales because costs do not move to off-set revenue variability. Firms with high fixed costs are said to have high operating lever-age, as small swings in business conditions can have large impacts on profitability.
548 PART V Security Analysis
Financialservices
Banking Financeand Loan
InsuranceFinancialServices
Investments Savingsand Loans
Leasing
No. of firms: 261803
12.9 13.3
3.4
11.7
24.9
9.5
15.316.3
12.0
18.4
37.5
10.7
8.1
12.8
24.6
9.4
48 57 144 76 204 11
2000 2001
0
5
10
15
20
25
30
35
40
Figure 17.8 Earnings estimates for financial services industries.
Source: U.S. Comments, I/B/E/S Inc., September 2000.
Bodie−Kane−Marcus: Investments, Fifth Edition
V. Security Analysis 17. Macroeconomics and Industry Analysis
554 © The McGraw−Hill Companies, 2001
CHAPTER 17 Macroeconomic and Industry Analysis 549
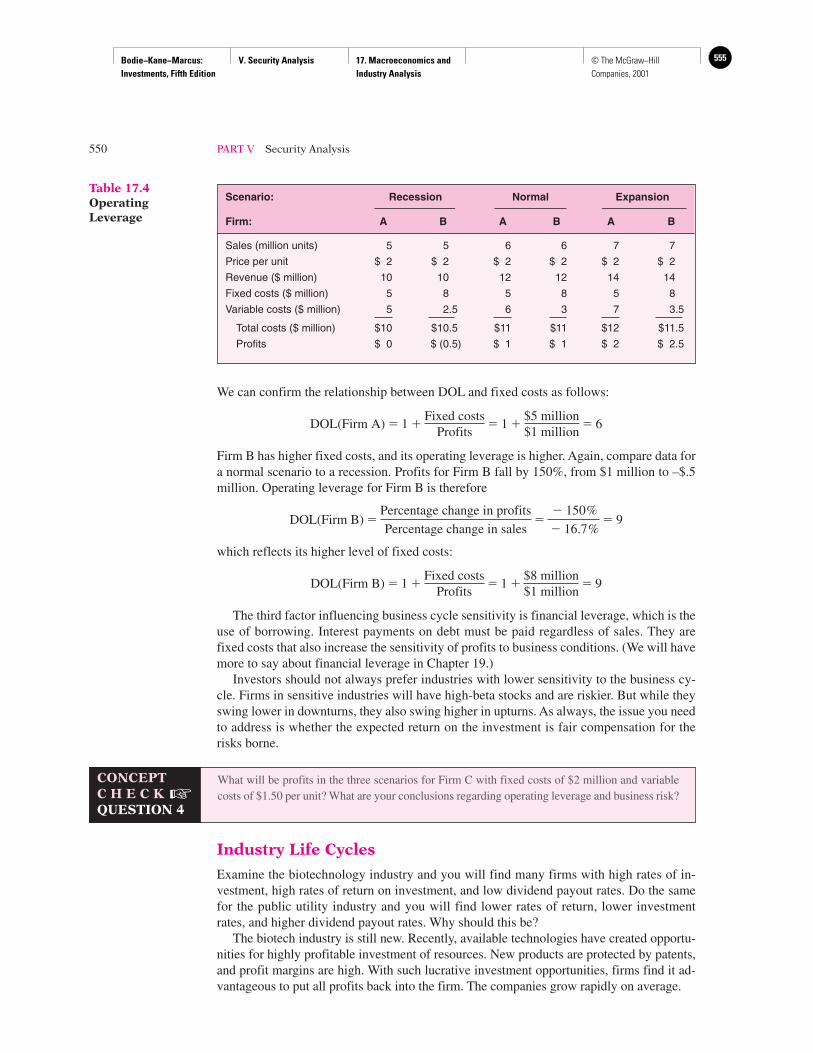
An example might help illustrate this concept. Consider two firms operating in the sameindustry with identical revenues in all phases of the business cycle: recession, normal, andexpansion. Firm A has short-term leases on most of its equipment and can reduce its leaseexpenditures when production slackens. It has fixed costs of $5 million and variable costsof $1 per unit of output. Firm B has long-term leases on most of its equipment and mustmake lease payments regardless of economic conditions. Its fixed costs are higher, $8 mil-lion, but its variable costs are only $.50 per unit. Table 17.4 shows that Firm A will do bet-ter in recessions than Firm B, but not as well in expansions. A’s costs move in conjunctionwith its revenues to help performance in downturns and impede performance in upturns.
We can quantify operating leverage by measuring how sensitive profits are to changesin sales. The degree of operating leverage, or DOL, is defined as
DOL greater than 1 indicates some operating leverage. For example, if DOL � 2, then forevery 1% change in sales, profits will change by 2% in the same direction, either up or down.
We have seen that the degree of operating leverage increases with a firm’s exposure tofixed costs. In fact, one can show that DOL depends on fixed costs in the following manner:1
As a concrete example of operating leverage, return to the two firms illustrated in Table17.4 and compare profits and sales in the “normal” scenario for the economy with those ina recession. Profits of Firm A fall by 100% (from $1 million to zero) when sales fall by16.7% (from $6 million to $5 million):
DOL(Firm A) �Percentage change in profits
Percentage change in sales�
�100%
�16.7%� 6
DOL � 1 �Fixed costs
Profits
DOL �Percentage change in profits
Percentage change in sales
1963
1965
1967
1969
1971
1973
1975
1977
1979
1981
1983
1985
1987
1989
1991
1993
140
120
100
80
60
40
20
0
Ann
ual s
ales
(196
3 =
100
)
Cigarette sales
Passenger cars sales
Figure 17.9 Industry cyclicality.
Source: Passenger car sales: Ward’s Automobile Yearbook, 1994. Cigarette sales: Department of Alcohol, Tobacco, and Firearms Statistical Releases.
1 Operating leverage and DOL are treated in more detail in most corporate finance texts.
Bodie−Kane−Marcus: Investments, Fifth Edition
V. Security Analysis 17. Macroeconomics and Industry Analysis
555© The McGraw−Hill Companies, 2001
We can confirm the relationship between DOL and fixed costs as follows:
Firm B has higher fixed costs, and its operating leverage is higher. Again, compare data fora normal scenario to a recession. Profits for Firm B fall by 150%, from $1 million to –$.5million. Operating leverage for Firm B is therefore
which reflects its higher level of fixed costs:
The third factor influencing business cycle sensitivity is financial leverage, which is theuse of borrowing. Interest payments on debt must be paid regardless of sales. They arefixed costs that also increase the sensitivity of profits to business conditions. (We will havemore to say about financial leverage in Chapter 19.)
Investors should not always prefer industries with lower sensitivity to the business cy-cle. Firms in sensitive industries will have high-beta stocks and are riskier. But while theyswing lower in downturns, they also swing higher in upturns. As always, the issue you needto address is whether the expected return on the investment is fair compensation for therisks borne.
Industry Life Cycles
Examine the biotechnology industry and you will find many firms with high rates of in-vestment, high rates of return on investment, and low dividend payout rates. Do the samefor the public utility industry and you will find lower rates of return, lower investmentrates, and higher dividend payout rates. Why should this be?
The biotech industry is still new. Recently, available technologies have created opportu-nities for highly profitable investment of resources. New products are protected by patents,and profit margins are high. With such lucrative investment opportunities, firms find it ad-vantageous to put all profits back into the firm. The companies grow rapidly on average.
DOL(Firm B) � 1 �Fixed costs
Profits� 1 �
$8 million$1 million
� 9
DOL(Firm B) �Percentage change in profits
Percentage change in sales�
� 150%
� 16.7%� 9
DOL(Firm A) � 1 �Fixed costs
Profits� 1 �
$5 million$1 million
� 6
550 PART V Security Analysis
Scenario: Recession Normal Expansion
Firm: A B A B A B
Sales (million units) 5 5 6 6 7 7
Price per unit $ 2 $ 2 $ 2 $ 2 $ 2 $ 2
Revenue ($ million) 10 10 12 12 14 14
Fixed costs ($ million) 5 8 5 8 5 8
Variable costs ($ million) 5 2.5 6 3 7 3.5
Total costs ($ million) $10 $10.5 $11 $11 $12 $11.5
Profits $ 0 $ (0.5) $ 1 $ 1 $ 2 $ 2.5
Table 17.4OperatingLeverage
CONCEPTC H E C K �QUESTION 4
What will be profits in the three scenarios for Firm C with fixed costs of $2 million and variablecosts of $1.50 per unit? What are your conclusions regarding operating leverage and business risk?
Bodie−Kane−Marcus: Investments, Fifth Edition
V. Security Analysis 17. Macroeconomics and Industry Analysis
556 © The McGraw−Hill Companies, 2001
CHAPTER 17 Macroeconomic and Industry Analysis 551
Eventually, however, growth must slow. The high profit rates will induce new firms toenter the industry. Increasing competition will hold down prices and profit margins. Newtechnologies become proven and more predictable, risk levels fall, and entry becomes eveneasier. As internal investment opportunities become less attractive, a lower fraction of prof-its are reinvested in the firm. Cash dividends increase.
Ultimately, in a mature industry, we observe “cash cows,” firms with stable dividendsand cash flows and little risk. Growth rates might be similar to that of the overall economy.Industries in early states of their life cycles offer high-risk/high-potential-return invest-ments. Mature industries offer lower-risk, lower-return combinations.
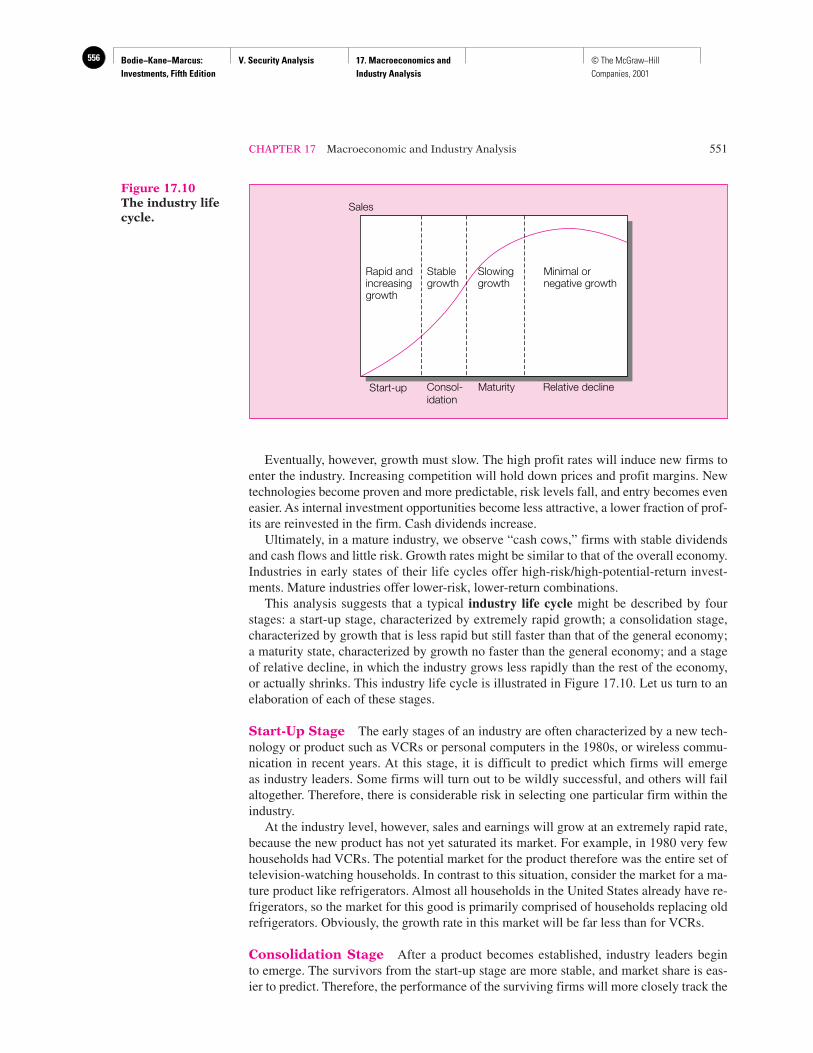
This analysis suggests that a typical industry life cycle might be described by fourstages: a start-up stage, characterized by extremely rapid growth; a consolidation stage,characterized by growth that is less rapid but still faster than that of the general economy;a maturity state, characterized by growth no faster than the general economy; and a stageof relative decline, in which the industry grows less rapidly than the rest of the economy,or actually shrinks. This industry life cycle is illustrated in Figure 17.10. Let us turn to anelaboration of each of these stages.
Start-Up Stage The early stages of an industry are often characterized by a new tech-nology or product such as VCRs or personal computers in the 1980s, or wireless commu-nication in recent years. At this stage, it is difficult to predict which firms will emergeas industry leaders. Some firms will turn out to be wildly successful, and others will failaltogether. Therefore, there is considerable risk in selecting one particular firm within theindustry.
At the industry level, however, sales and earnings will grow at an extremely rapid rate,because the new product has not yet saturated its market. For example, in 1980 very fewhouseholds had VCRs. The potential market for the product therefore was the entire set oftelevision-watching households. In contrast to this situation, consider the market for a ma-ture product like refrigerators. Almost all households in the United States already have re-frigerators, so the market for this good is primarily comprised of households replacing oldrefrigerators. Obviously, the growth rate in this market will be far less than for VCRs.
Consolidation Stage After a product becomes established, industry leaders beginto emerge. The survivors from the start-up stage are more stable, and market share is eas-ier to predict. Therefore, the performance of the surviving firms will more closely track the
Sales
Start-up Consol-idation
Maturity Relative decline
Rapid andincreasinggrowth
Stablegrowth
Slowinggrowth
Minimal ornegative growth
Figure 17.10The industry lifecycle.
Bodie−Kane−Marcus: Investments, Fifth Edition
V. Security Analysis 17. Macroeconomics and Industry Analysis
557© The McGraw−Hill Companies, 2001
performance of the overall industry. The industry still grows faster than the rest of theeconomy as the product penetrates the marketplace and becomes more commonly used.
Maturity Stage At this point, the product has reached its full potential for use by con-sumers. Further growth might merely track growth in the general economy. The producthas become far more standardized, and producers are forced to compete to a greater extenton the basis of price. This leads to narrower profit margins and further pressure on profits.Firms at this stage sometimes are characterized as cash cows, having reasonably stable cashflow but offering little opportunity for profitable expansion. The cash flow is best “milkedfrom” rather than reinvested in the company.
Relative Decline In this stage, the industry might grow at less than the rate of theoverall economy, or it might even shrink. This could be due to obsolescence of the product,competition from new products, or competition from new low-cost suppliers.
At which stage in the life cycle are investments in an industry most attractive? Conven-tional wisdom is that investors should seek firms in high-growth industries. This recipe forsuccess is simplistic, however. If the security prices already reflect the likelihood for highgrowth, then it is too late to make money from that knowledge. Moreover, high growth andfat profits encourage competition from other producers. The exploitation of profit opportu-nities brings about new sources of supply that eventually reduce prices, profits, investmentreturns, and finally growth. This is the dynamic behind the progression from one stage ofthe industry life cycle to another. The famous portfolio manager Peter Lynch makes thispoint in One Up on Wall Street:
Many people prefer to invest in a high-growth industry, where there’s a lot of sound and fury. Notme. I prefer to invest in a low-growth industry. . . . In a low-growth industry, especially one that’sboring and upsets people [such as funeral homes or the oil-drum retrieval business], there’s noproblem with competition. You don’t have to protect your flanks from potential rivals . . . and thisgives you the leeway to continue to grow. [p. 131]
In fact, Lynch uses an industry classification system in a very similar spirit to the life-cycle approach we have described. He places firms in the following six groups:
Slow Growers Large and aging companies that will grow only slightly faster than thebroad economy. These firms have matured from their earlier fast-growth phase. They usu-ally have steady cash flow and pay a generous dividend, indicating that the firm is gener-ating more cash than can be profitably reinvested in the firm.
Stalwarts Large, well-known firms like Coca-Cola, Hershey’s, or Colgate-Palmolive.They grow faster than the slow growers, but are not in the very rapid growth start-up stage.They also tend to be in noncyclical industries that are relatively unaffected by recessions.
Fast Growers Small and aggressive new firms with annual growth rates in the neigh-borhood of 20% to 25%. Company growth can be due to broad industry growth or to an in-crease in market share in a more mature industry.
Cyclicals These are firms with sales and profits that regularly expand and contract alongwith the business cycle. Examples are auto companies (see Figure 17.9 again), steel com-panies, or the construction industry.
Turnarounds These are firms that are in bankruptcy or soon might be. If they can re-cover from what might appear to be imminent disaster, they can offer tremendous investment
552 PART V Security Analysis
Bodie−Kane−Marcus: Investments, Fifth Edition
V. Security Analysis 17. Macroeconomics and Industry Analysis
558 © The McGraw−Hill Companies, 2001
CHAPTER 17 Macroeconomic and Industry Analysis 553
returns. A good example of this type of firm would be Chrysler in 1982, when it required agovernment guarantee on its debt to avoid bankruptcy. The stock price rose fifteenfold in thenext five years.
Asset Plays These are firms that have valuable assets not currently reflected in the stockprice. For example, a company may own or be located on valuable real estate that is worthas much or more than the company’s business enterprises. Sometimes the hidden asset canbe tax-loss carryforwards. Other times the assets may be intangible. For example, a cablecompany might have a valuable list of cable subscribers. These assets do not immediatelygenerate cash flow, and so may be more easily overlooked by other analysts attempting tovalue the firm.
Industry Structure and Performance
The maturation of an industry involves regular changes in the firm’s competitive environ-ment. As a final topic, we examine the relationship among industry structure, competitivestrategy, and profitability. Michael Porter2 has highlighted these five determinants of compe-tition: threat of entry from new competitors, rivalry between existing competitors, price pres-sure from substitute products, bargaining power of buyers, and bargaining power of suppliers.
Threat of Entry New entrants to an industry put pressure on price and profits. Even ifa firm has not yet entered an industry, the potential for it to do so places pressure on prices,because high prices and profit margins will encourage entry by new competitors. There-fore, barriers to entry can be a key determinant of industry profitability. Barriers can takemany forms. For example, existing firms may already have secure distribution channels fortheir products based on longstanding relationships with customers or suppliers that wouldbe costly for a new entrant to duplicate. Brand loyalty also makes it difficult for new en-trants to penetrate a market and gives firms more pricing discretion. Proprietary knowledgeor patent protection also may give firms advantages in serving a market. Finally, an exist-ing firm’s experience in a market may give it cost advantages due to the learning that takesplace over time.
Rivalry between Existing Competitors When there are several competitors in anindustry, there will generally be more price competition and lower profit margins as com-petitors seek to expand their share of the market. Slow industry growth contributes to thiscompetition, because expansion must come at the expense of a rival’s market share. Highfixed costs also create pressure to reduce prices, because fixed costs put greater pressure onfirms to operate near full capacity. Industries producing relatively homogeneous goods arealso subject to considerable price pressure, because firms cannot compete on the basis ofproduct differentiation.
Pressure from Substitute Products Substitute products means that the industryfaces competition from firms in related industries. For example, sugar producers competewith corn syrup producers. Wool producers compete with synthetic fiber producers. Theavailability of substitutes limits the prices that can be charged to customers.
Bargaining Power of Buyers If a buyer purchases a large fraction of an industry’soutput, it will have considerable bargaining power and can demand price concessions. For
2 Michael Porter, Competitive Advantage: Creating and Sustaining Superior Performance (New York: Free Press, 1985).

Bodie−Kane−Marcus: Investments, Fifth Edition
V. Security Analysis 17. Macroeconomics and Industry Analysis
559© The McGraw−Hill Companies, 2001
example, auto producers can put pressure on suppliers of auto parts. This reduces the prof-itability of the auto parts industry.
Bargaining Power of Suppliers If a supplier of a key input has monopolistic con-trol over the product, it can demand higher prices for the good and squeeze profits out ofthe industry. One special case of this issue pertains to organized labor as a supplier of a keyinput to the production process. Labor unions engage in collective bargaining to increasethe wages paid to workers. When the labor market is highly unionized, a significant shareof the potential profits in the industry can be captured by the work force.
The key factor determining the bargaining power of suppliers is the availability of sub-stitute products. If substitutes are available, the supplier has little clout and cannot extracthigher prices.
SUMMARY 1. Macroeconomic policy aims to maintain the economy near full employment without ag-gravating inflationary pressures. The proper trade-off between these two goals is asource of ongoing debate.
2. The traditional tools of macropolicy are government spending and tax collection, whichcomprise fiscal policy, and manipulation of the money supply via monetary policy. Ex-pansionary fiscal policy can stimulate the economy and increase GDP but tends to in-crease interest rates. Expansionary monetary policy works by lowering interest rates.
3. The business cycle is the economy’s recurring pattern of expansions and recessions.Leading economic indicators can be used to anticipate the evolution of the business cy-cle because their values tend to change before those of other key economic variables.
4. Industries differ in their sensitivity to the business cycle. More sensitive industries tendto be those producing high-priced durable goods for which the consumer has consider-able discretion as to the timing of purchase. Examples are automobiles or consumerdurables. Other sensitive industries are those that produce capital equipment for otherfirms. Operating leverage and financial leverage increase sensitivity to the businesscycle.
KEY TERMS fundamental analysis supply shock cyclical industriesexchange rate fiscal policy defensive industriesgross domestic product monetary policy leading economic indicatorsunemployment rate business cycle SIC codesinflation peak degree of operating leveragebudget deficit trough industry life cycledemand shock
554 PART V Security Analysis
Vis
it u
s at
ww
w.m
hh
e.co
m/b
km
WEBSITES The site listed below is a comprehensive site with complete analysis of economic indi-cators for the U.S. and global economy.
http://www.yardeni.com/sitemap.asp
The banks of the Federal Reserve System provide significant economic data for the do-mestic and international economy. Most of the individual banks also provide regional

Bodie−Kane−Marcus: Investments, Fifth Edition
V. Security Analysis 17. Macroeconomics and Industry Analysis
560 © The McGraw−Hill Companies, 2001
CHAPTER 17 Macroeconomic and Industry Analysis 555
PROBLEMS 1. What monetary and fiscal policies might be prescribed for an economy in a deeprecession?
2. Unlike other investors, you believe the Fed is going to loosen monetary policy. Whatwould be your recommendations about investments in the following industries?
a. Gold mining.b. Construction.
3. Briefly discuss what actions the U.S. Federal Reserve would likely take in pursuing anexpansionary monetary policy using each of the following three monetary tools:
a. Reserve requirements.b. Open market operations.c. Discount rate.
4. An unanticipated expansionary monetary policy has been implemented. Indicate theimpact of this policy on each of the following four variables:
a. Inflation rate.b. Real output and employment.c. Real interest rate.d. Nominal interest rate.
5. If you believe the U.S. dollar will depreciate more dramatically than do other investors,what will be your stance on investments in U.S. auto producers?
CFA©
CFA© V
isit
us
at w
ww
.mh
he.
com
/bkm
WEBSITES economic analysis. The site listed below gives you access to each of the regional banksby clicking on the map.
http://www.federalreserve.gov/otherfrb.htm
Current news and analysis on the economy, industries, and individual companies areavailable on an online subscription basis to The Wall Street Journal. Subscribers gainaccess to all of Barron’s and Smart Money as well. Limited information is freely avail-able at the sites listed below.
http://public.wsj.comhttp://smartmoney.comhttp://www.barrons.com
Information on the economy can also be found at the sites listed below.
http://economics.about.comhttp://investormap.com/data-econ.htmhttp://moneycentral.msn.com/investor/research/profile.asphttp://www.bloomberg.comhttp://www.hoovers.com

Bodie−Kane−Marcus: Investments, Fifth Edition
V. Security Analysis 17. Macroeconomics and Industry Analysis
561© The McGraw−Hill Companies, 2001
6. According to supply-side economists, what will be the long-run impact on prices of areduction in income tax rates?
7. Consider two firms producing videocassette recorders. One uses a highly automatedrobotics process, whereas the other uses workers on an assembly line and pays over-time when there is heavy production demand.
a. Which firm will have higher profits in a recession? In a boom?b. Which firm’s stock will have a higher beta?
8. Here are four industries and four forecasts for the macroeconomy. Match the industryto the scenario in which it is likely to be the best performer.
Industry Economic Forecast
556 PART V Security Analysis
Vis
it u
s at
ww
w.m
hh
e.co
m/b
km
a. Housing constructionb. Health carec. Gold miningd. Steel production
(i.) Deep recession: falling inflation, interestrates, and GDP
(ii.) Superheated economy: rapidly rising GDP,increasing inflation and interest rates
(iii.) Healthy expansion: rising GDP, mildinflation, low unemployment
(iv.) Stagflation: falling GDP, high inflation
9. In which stage of the industry life cycle would you place the following industries?(Note: There is often considerable room for disagreement concerning the “correct”answers to this question.)
a. Oil well equipment.b. Computer hardware.c. Computer software.d. Genetic engineering.e. Railroads.
10. For each pair of firms, choose the one that you think would be more sensitive to thebusiness cycle.
a. General Autos or General Pharmaceuticals.b. Friendly Airlines or Happy Cinemas.
11. Choose an industry and identify the factors that will determine its performance in thenext three years. What is your forecast for performance in that time period?
12. Why do you think the index of consumer expectations is a useful leading indicator ofthe macroeconomy? (See Table 17.2.)
13. Why do you think the change in the index of labor cost per unit of output is a usefullagging indicator of the macroeconomy? (See Table 17.2.)
14. Universal Auto is a large multinational corporation headquartered in the United States.For segment reporting purposes, the company is engaged in two businesses: productionof motor vehicles and information processing services.
The motor vehicle business is by far the larger of Universal’s two segments. It consistsmainly of domestic U.S. passenger car production, but it also includes small truck manu-facturing operations in the United States and passenger car production in other countries.This segment of Universal has had weak operating results for the past several years, in-cluding a large loss in 1996. Although the company does not reveal the operating resultsof its domestic passenger car segments, that part of Universal’s business is generally be-lieved to be primarily responsible for the weak performance of its motor vehicle segment.
Idata, the information processing services segment of Universal, was started by Uni-versal about 15 years ago. This business has shown strong, steady growth that has beenentirely internal; no acquisitions have been made.
CFA©
Bodie−Kane−Marcus: Investments, Fifth Edition
V. Security Analysis 17. Macroeconomics and Industry Analysis
562 © The McGraw−Hill Companies, 2001
CHAPTER 17 Macroeconomic and Industry Analysis 557
An excerpt from a research report on Universal prepared by Paul Adams, a CFAcandidate, states: “Based on our assumption that Universal will he able to increaseprices significantly on U.S. passenger cars in 1997, we project a multibillion dollarprofit improvement.”
a. Discuss the concept of an industrial life cycle by describing each of its four phases.b. Identify where each of Universal’s two primary businesses—passenger cars and in-
formation processing—is in such a cycle.c. Discuss how product pricing should differ between Universal’s two businesses,
based on the location of each in the industrial life cycle.
15. Adams’s research report (see the preceding problem) continued as follows: “With abusiness recovery already under way, the expected profit surge should lead to a muchhigher price for Universal Auto stock. We strongly recommend purchase.”
a. Discuss the business cycle approach to investment timing. (Your answer should de-scribe actions to be taken on both stocks and bonds at different points over a typicalbusiness cycle.)
b. Assuming Adams’s assertion is correct (that a business recovery is already underway), evaluate the timeliness of his recommendation to purchase Universal Auto, acyclical stock, based on the business cycle approach to investment timing.
16. General Weedkillers dominates the chemical weed control market with its patentedproduct Weed-ex. The patent is about to expire, however. What are your forecasts forchanges in the industry? Specifically, what will happen to industry prices, sales, theprofit prospects of General Weedkillers, and the profit prospects of its competitors?What stage of the industry life cycle do you think is relevant for the analysis of thismarket?
Problem 17 has two parts.
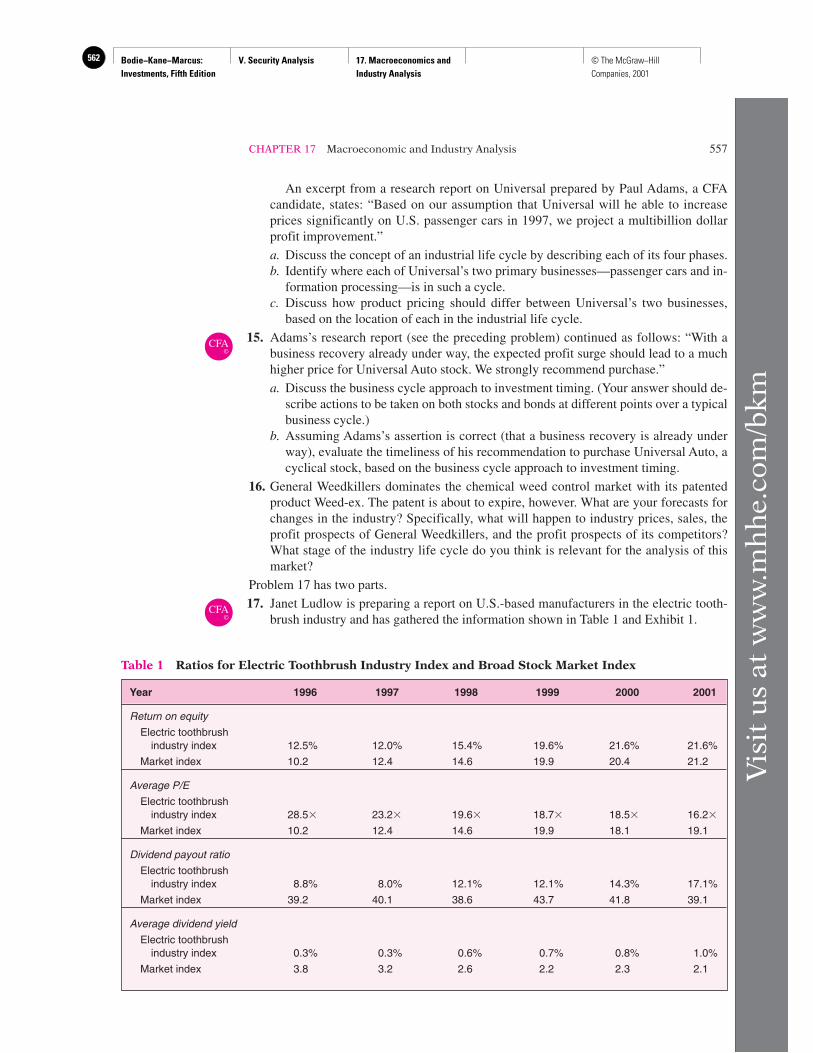
17. Janet Ludlow is preparing a report on U.S.-based manufacturers in the electric tooth-brush industry and has gathered the information shown in Table 1 and Exhibit 1.
CFA©
CFA©
Vis
it u
s at
ww
w.m
hh
e.co
m/b
km
Table 1 Ratios for Electric Toothbrush Industry Index and Broad Stock Market Index
Year 1996 1997 1998 1999 2000 2001
Return on equity
Electric toothbrushindustry index 12.5% 12.0% 15.4% 19.6% 21.6% 21.6%
Market index 10.2 12.4 14.6 19.9 20.4 21.2
Average P/E
Electric toothbrushindustry index 28.5� 23.2� 19.6� 18.7� 18.5� 16.2�
Market index 10.2 12.4 14.6 19.9 18.1 19.1
Dividend payout ratio
Electric toothbrushindustry index 8.8% 8.0% 12.1% 12.1% 14.3% 17.1%
Market index 39.2 40.1 38.6 43.7 41.8 39.1
Average dividend yield
Electric toothbrushindustry index 0.3% 0.3% 0.6% 0.7% 0.8% 1.0%
Market index 3.8 3.2 2.6 2.2 2.3 2.1
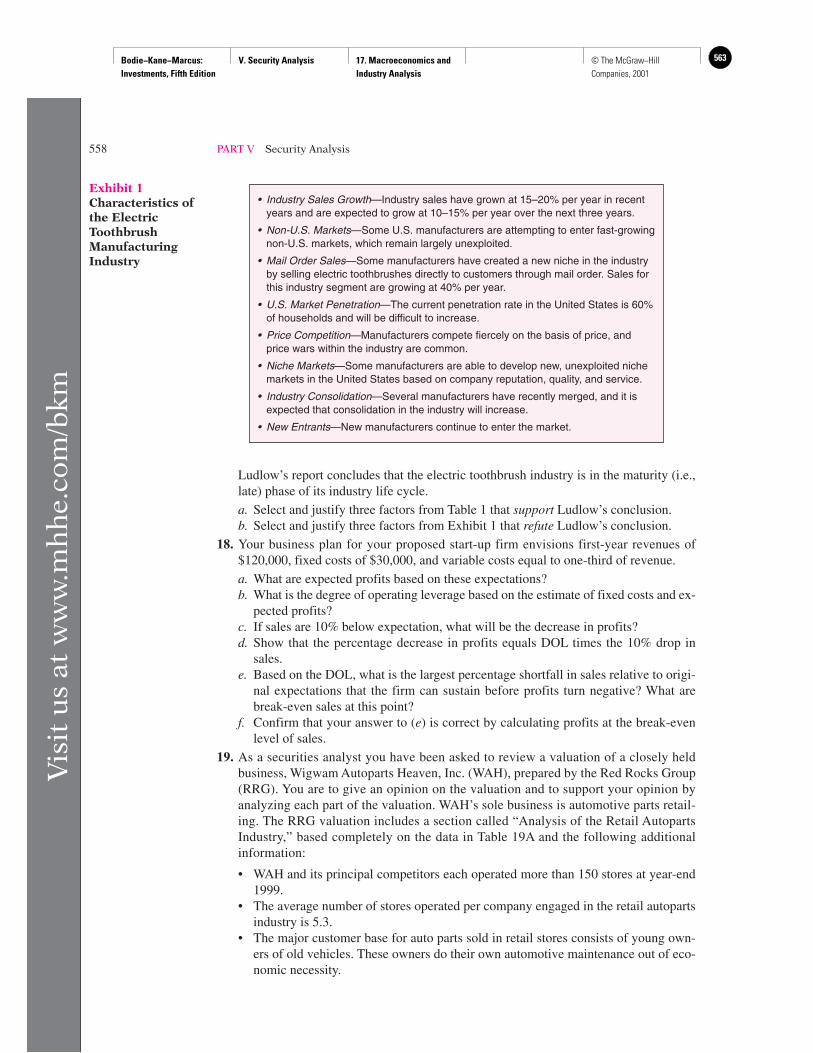
Bodie−Kane−Marcus: Investments, Fifth Edition
V. Security Analysis 17. Macroeconomics and Industry Analysis
563© The McGraw−Hill Companies, 2001
Ludlow’s report concludes that the electric toothbrush industry is in the maturity (i.e.,late) phase of its industry life cycle.
a. Select and justify three factors from Table 1 that support Ludlow’s conclusion.b. Select and justify three factors from Exhibit 1 that refute Ludlow’s conclusion.
18. Your business plan for your proposed start-up firm envisions first-year revenues of$120,000, fixed costs of $30,000, and variable costs equal to one-third of revenue.
a. What are expected profits based on these expectations?b. What is the degree of operating leverage based on the estimate of fixed costs and ex-
pected profits?c. If sales are 10% below expectation, what will be the decrease in profits?d. Show that the percentage decrease in profits equals DOL times the 10% drop in
sales.e. Based on the DOL, what is the largest percentage shortfall in sales relative to origi-
nal expectations that the firm can sustain before profits turn negative? What arebreak-even sales at this point?
f. Confirm that your answer to (e) is correct by calculating profits at the break-evenlevel of sales.
19. As a securities analyst you have been asked to review a valuation of a closely heldbusiness, Wigwam Autoparts Heaven, Inc. (WAH), prepared by the Red Rocks Group(RRG). You are to give an opinion on the valuation and to support your opinion byanalyzing each part of the valuation. WAH’s sole business is automotive parts retail-ing. The RRG valuation includes a section called “Analysis of the Retail AutopartsIndustry,” based completely on the data in Table 19A and the following additionalinformation:
• WAH and its principal competitors each operated more than 150 stores at year-end1999.
• The average number of stores operated per company engaged in the retail autopartsindustry is 5.3.
• The major customer base for auto parts sold in retail stores consists of young own-ers of old vehicles. These owners do their own automotive maintenance out of eco-nomic necessity.
558 PART V Security Analysis
Vis
it u
s at
ww
w.m
hh
e.co
m/b
km
• Industry Sales Growth—Industry sales have grown at 15–20% per year in recentyears and are expected to grow at 10–15% per year over the next three years.
• Non-U.S. Markets—Some U.S. manufacturers are attempting to enter fast-growingnon-U.S. markets, which remain largely unexploited.
• Mail Order Sales—Some manufacturers have created a new niche in the industryby selling electric toothbrushes directly to customers through mail order. Sales forthis industry segment are growing at 40% per year.
• U.S. Market Penetration—The current penetration rate in the United States is 60%of households and will be difficult to increase.
• Price Competition—Manufacturers compete fiercely on the basis of price, andprice wars within the industry are common.
• Niche Markets—Some manufacturers are able to develop new, unexploited nichemarkets in the United States based on company reputation, quality, and service.
• Industry Consolidation—Several manufacturers have recently merged, and it isexpected that consolidation in the industry will increase.
• New Entrants—New manufacturers continue to enter the market.
Exhibit 1Characteristics ofthe ElectricToothbrushManufacturingIndustry
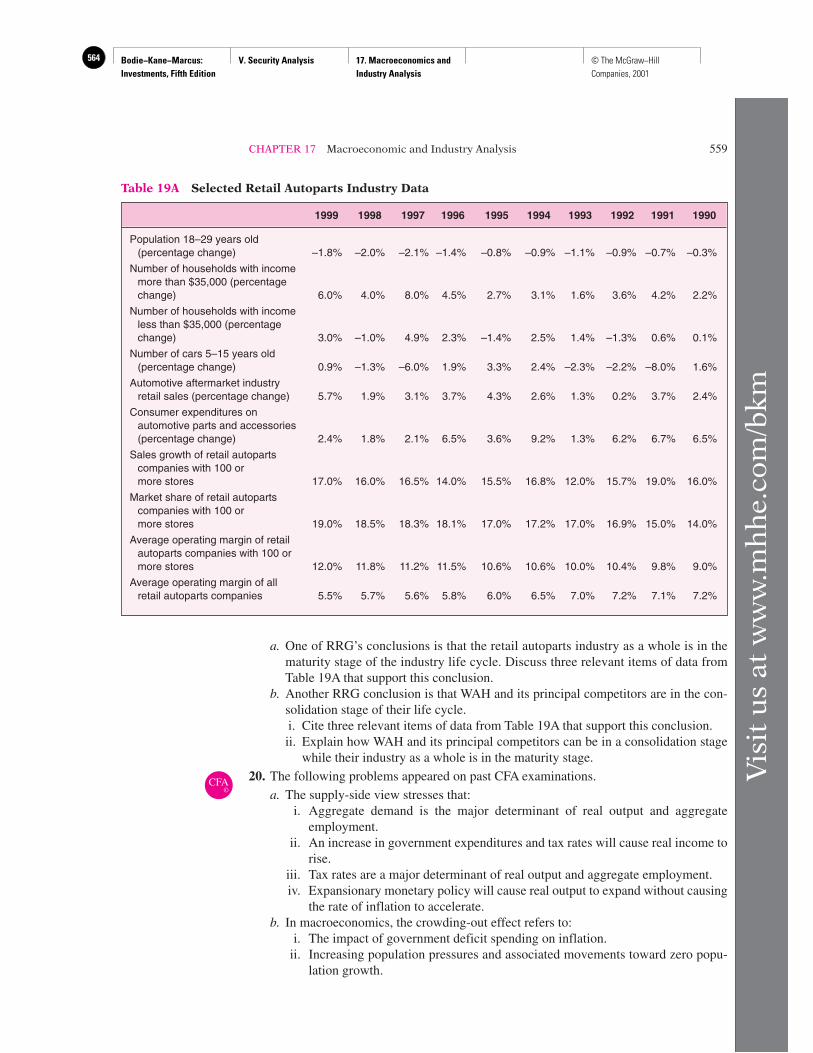
Bodie−Kane−Marcus: Investments, Fifth Edition
V. Security Analysis 17. Macroeconomics and Industry Analysis
564 © The McGraw−Hill Companies, 2001
CHAPTER 17 Macroeconomic and Industry Analysis 559
a. One of RRG’s conclusions is that the retail autoparts industry as a whole is in thematurity stage of the industry life cycle. Discuss three relevant items of data fromTable 19A that support this conclusion.
b. Another RRG conclusion is that WAH and its principal competitors are in the con-solidation stage of their life cycle.i. Cite three relevant items of data from Table 19A that support this conclusion.ii. Explain how WAH and its principal competitors can be in a consolidation stage
while their industry as a whole is in the maturity stage.
20. The following problems appeared on past CFA examinations.
a. The supply-side view stresses that:i. Aggregate demand is the major determinant of real output and aggregate
employment.ii. An increase in government expenditures and tax rates will cause real income to
rise.iii. Tax rates are a major determinant of real output and aggregate employment.iv. Expansionary monetary policy will cause real output to expand without causing
the rate of inflation to accelerate.b. In macroeconomics, the crowding-out effect refers to:
i. The impact of government deficit spending on inflation.ii. Increasing population pressures and associated movements toward zero popu-
lation growth.
CFA©
Vis
it u
s at
ww
w.m
hh
e.co
m/b
km
Table 19A Selected Retail Autoparts Industry Data
1999 1998 1997 1996 1995 1994 1993 1992 1991 1990
Population 18–29 years old (percentage change) –1.8% –2.0% –2.1% –1.4% –0.8% –0.9% –1.1% –0.9% –0.7% –0.3%
Number of households with income more than $35,000 (percentage change) 6.0% 4.0% 8.0% 4.5% 2.7% 3.1% 1.6% 3.6% 4.2% 2.2%
Number of households with income less than $35,000 (percentage change) 3.0% –1.0% 4.9% 2.3% –1.4% 2.5% 1.4% –1.3% 0.6% 0.1%
Number of cars 5–15 years old (percentage change) 0.9% –1.3% –6.0% 1.9% 3.3% 2.4% –2.3% –2.2% –8.0% 1.6%
Automotive aftermarket industry retail sales (percentage change) 5.7% 1.9% 3.1% 3.7% 4.3% 2.6% 1.3% 0.2% 3.7% 2.4%
Consumer expenditures on automotive parts and accessories (percentage change) 2.4% 1.8% 2.1% 6.5% 3.6% 9.2% 1.3% 6.2% 6.7% 6.5%
Sales growth of retail autoparts companies with 100 or more stores 17.0% 16.0% 16.5% 14.0% 15.5% 16.8% 12.0% 15.7% 19.0% 16.0%
Market share of retail autoparts companies with 100 or more stores 19.0% 18.5% 18.3% 18.1% 17.0% 17.2% 17.0% 16.9% 15.0% 14.0%
Average operating margin of retail autoparts companies with 100 or more stores 12.0% 11.8% 11.2% 11.5% 10.6% 10.6% 10.0% 10.4% 9.8% 9.0%
Average operating margin of all retail autoparts companies 5.5% 5.7% 5.6% 5.8% 6.0% 6.5% 7.0% 7.2% 7.1% 7.2%
Bodie−Kane−Marcus: Investments, Fifth Edition
V. Security Analysis 17. Macroeconomics and Industry Analysis
565© The McGraw−Hill Companies, 2001
iii. A situation where the unemployment rate is below its natural rate.iv. The impact of government borrowing on interest rates and private investment.
c. Based on historical data and assuming less-than-full employment, periods of sharp ac-celeration in the growth rate of the money supply tend to be associated initially with:
i. Periods of economic recession.ii. An increase in the velocity of money.
iii. A rapid growth of gross domestic product.iv. Reductions in real gross domestic product.
d. If the exchange rate value of the British pound goes from U.S.$1.80 to U.S.$1.60,then the pound has:
i. Appreciated and the British will find U.S. goods cheaper.ii. Appreciated and the British will find U.S. goods more expensive.
iii. Depreciated and the British will find U.S. goods more expensive.iv. Depreciated and the British will find U.S. goods cheaper.
e. The consumer price index is:i. A measure of the increase in the prices of the goods that are included in the cal-
culation of GDP.ii. The ratio of the average price of a typical market basket of goods compared to
the cost of producing those goods during the previous year.iii. A comparison of the cost of a typical bundle of goods during a given period
with the cost of the same bundle during a prior base period.iv. Computed in the same manner as the GDP deflator.
f. Changes in which of the following are likely to affect interest rates?I. Inflation expectations.
II. Size of the federal deficit.III. Money supply.
i. I and II only.ii. II and III only.
iii. I and III only.iv. I, II, and III.
g. According to the supply-side view of fiscal policy, if the impact of tax revenues isthe same, does it make any difference whether the government cuts taxes by eitherreducing marginal tax rates or increasing the personal exemption allowance?
i. No, both methods of cutting taxes will exert the same impact on aggregate supply.ii. No, people in both cases will increase their saving expecting higher future taxes
and thereby offset the stimulus effect of lower current taxes.iii. Yes, the lower marginal tax rates alone will increase the incentive to earn mar-
ginal income and thereby stimulate aggregate supply.iv. Yes, interest rates will increase if marginal tax rates are lowered, whereas they
will tend to decrease if the personal exemption allowance is raised.h. If the Federal Reserve wanted to reduce the supply of money as part of an anti-
inflation policy, it might:i. Increase the reserve requirements.
ii. Buy U.S. securities on the open market.iii. Lower the discount rate.iv. Buy U.S. securities directly from the Treasury.
CFA©
560 PART V Security Analysis
Vis
it u
s at
ww
w.m
hh
e.co
m/b
km
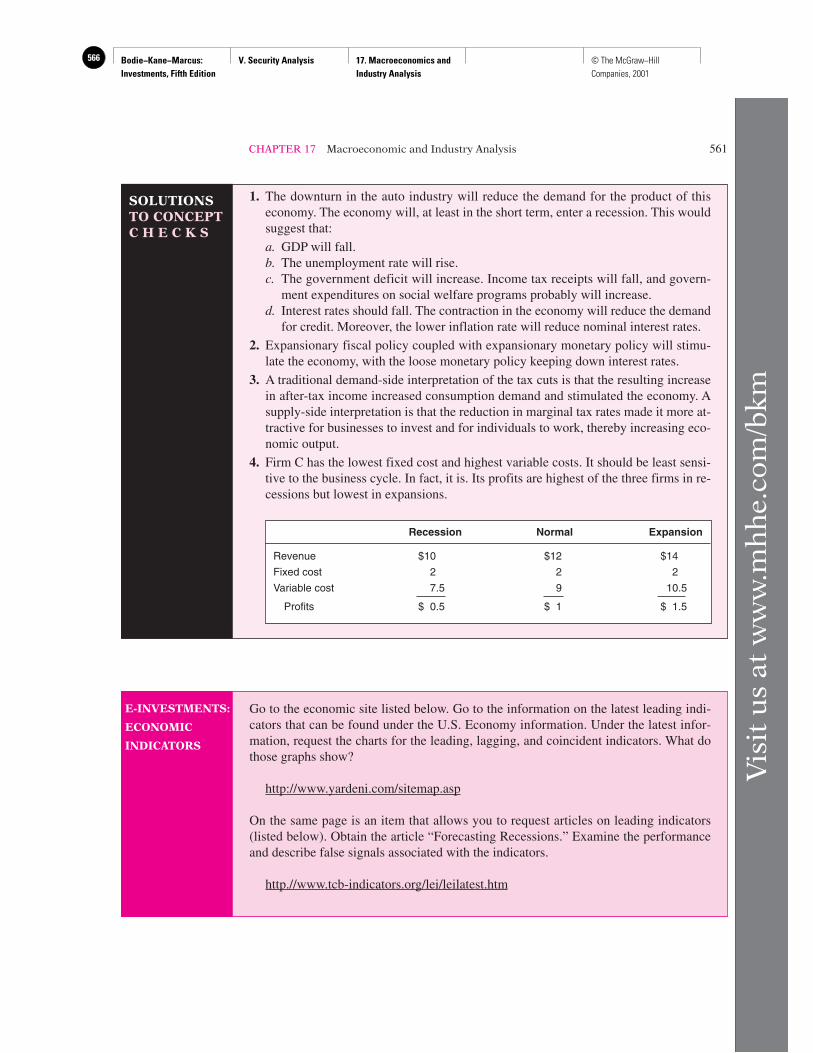
Bodie−Kane−Marcus: Investments, Fifth Edition
V. Security Analysis 17. Macroeconomics and Industry Analysis
566 © The McGraw−Hill Companies, 2001
CHAPTER 17 Macroeconomic and Industry Analysis 561
Vis
it u
s at
ww
w.m
hh
e.co
m/b
km
SOLUTIONSTO CONCEPTC H E C K S
E-INVESTMENTS:
ECONOMIC
INDICATORS
Go to the economic site listed below. Go to the information on the latest leading indi-cators that can be found under the U.S. Economy information. Under the latest infor-mation, request the charts for the leading, lagging, and coincident indicators. What dothose graphs show?
http://www.yardeni.com/sitemap.asp
On the same page is an item that allows you to request articles on leading indicators(listed below). Obtain the article “Forecasting Recessions.” Examine the performanceand describe false signals associated with the indicators.
http.//www.tcb-indicators.org/lei/leilatest.htm
1. The downturn in the auto industry will reduce the demand for the product of thiseconomy. The economy will, at least in the short term, enter a recession. This wouldsuggest that:
a. GDP will fall.b. The unemployment rate will rise.c. The government deficit will increase. Income tax receipts will fall, and govern-
ment expenditures on social welfare programs probably will increase.d. Interest rates should fall. The contraction in the economy will reduce the demand
for credit. Moreover, the lower inflation rate will reduce nominal interest rates.
2. Expansionary fiscal policy coupled with expansionary monetary policy will stimu-late the economy, with the loose monetary policy keeping down interest rates.
3. A traditional demand-side interpretation of the tax cuts is that the resulting increasein after-tax income increased consumption demand and stimulated the economy. Asupply-side interpretation is that the reduction in marginal tax rates made it more at-tractive for businesses to invest and for individuals to work, thereby increasing eco-nomic output.
4. Firm C has the lowest fixed cost and highest variable costs. It should be least sensi-tive to the business cycle. In fact, it is. Its profits are highest of the three firms in re-cessions but lowest in expansions.
Recession Normal Expansion
Revenue $10 $12 $14
Fixed cost 2 2 2
Variable cost 7.5 9 10.5
Profits $ 0.5 $ 1 $ 1.5