Embed Size (px)
Citation preview
Chapter 16Chapter 16
Liquids and SolidsLiquids and Solids
Chapter 16: Liquids and Solids
16.1 Intermolecular Forces16.2 The Liquid State16.3 An Introduction to Structures and Types of Solids16.4 Structure and Bonding in Metals16.5 Carbon and Silicon: Network Atomic Solids16.6 Molecular Solids16.7 Ionic Solids16.8 Structures of Actual Ionic Solids16.9 Lattice Defects16.10 Vapor Pressure and Changes of State16.11 Phase Diagrams
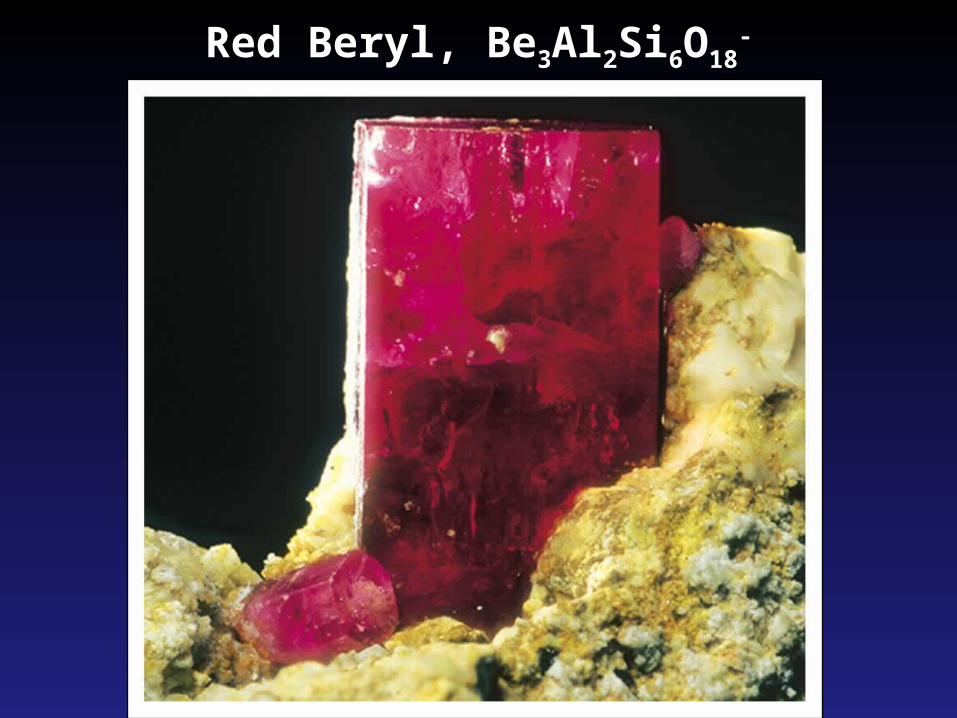
Red Beryl, Be3Al2Si6O18-
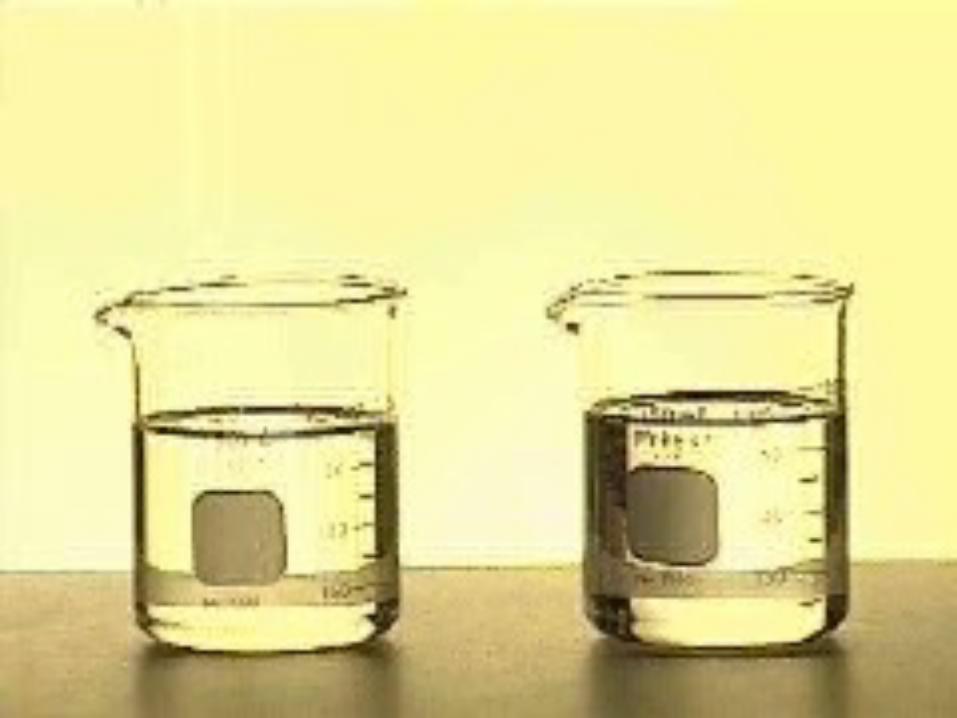
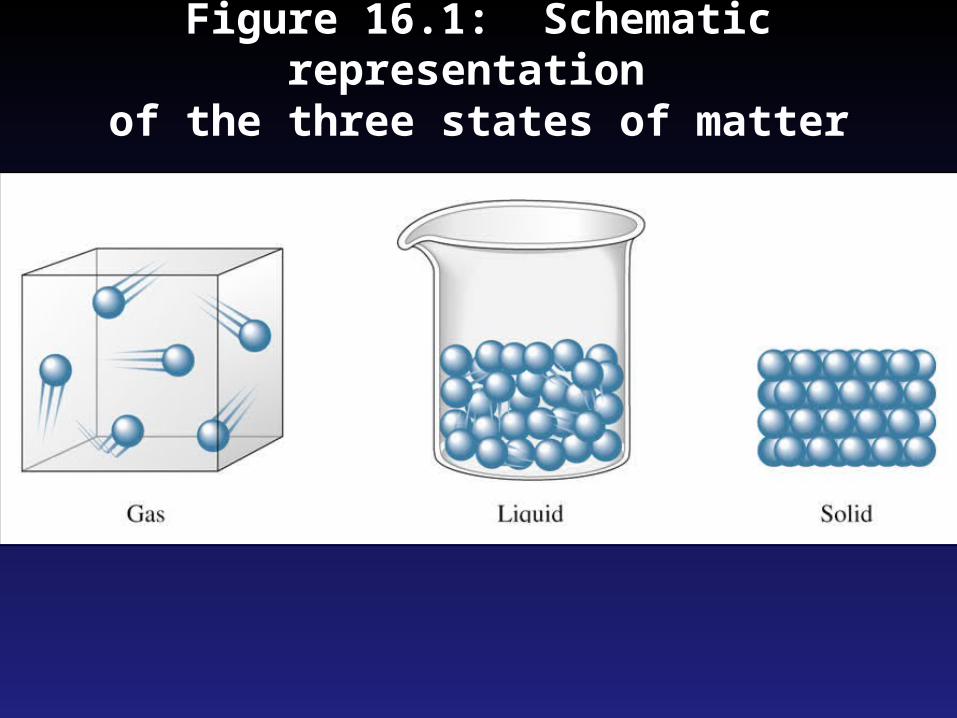
Figure 16.1: Schematic representation of the three states of matter
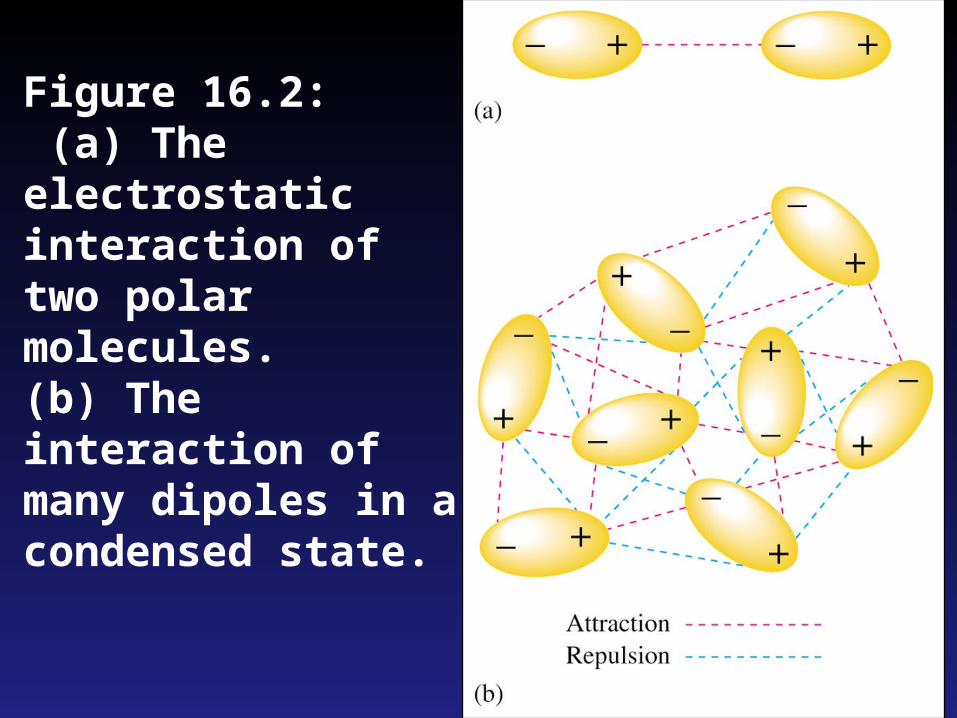
Figure 16.2: (a) The electrostatic interaction of two polar molecules. (b) The interaction of many dipoles in a condensed state.
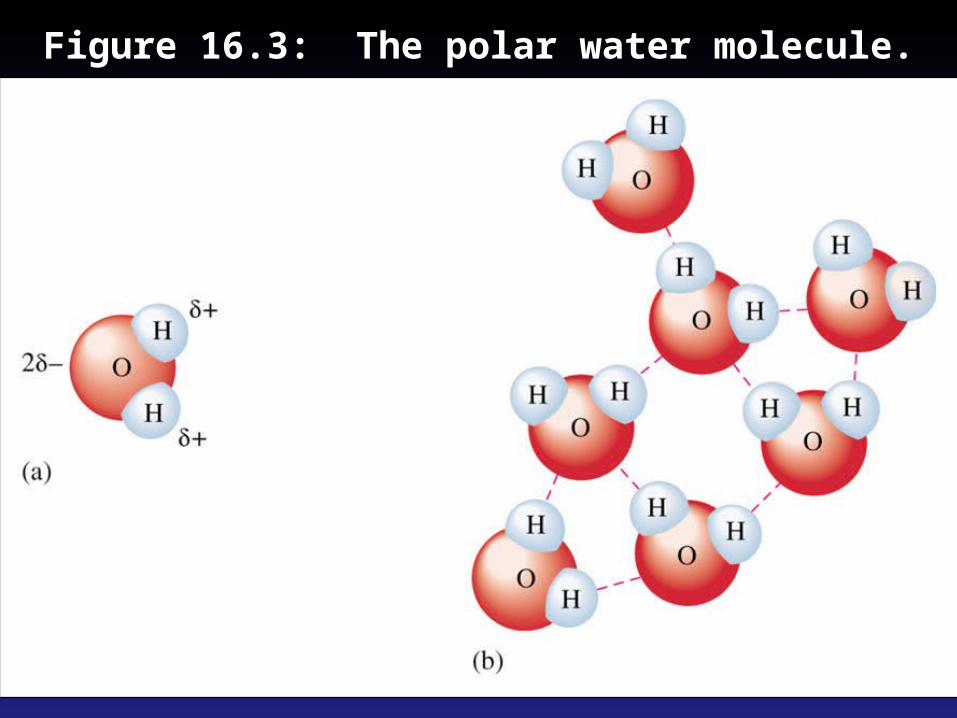
Figure 16.3: The polar water molecule.
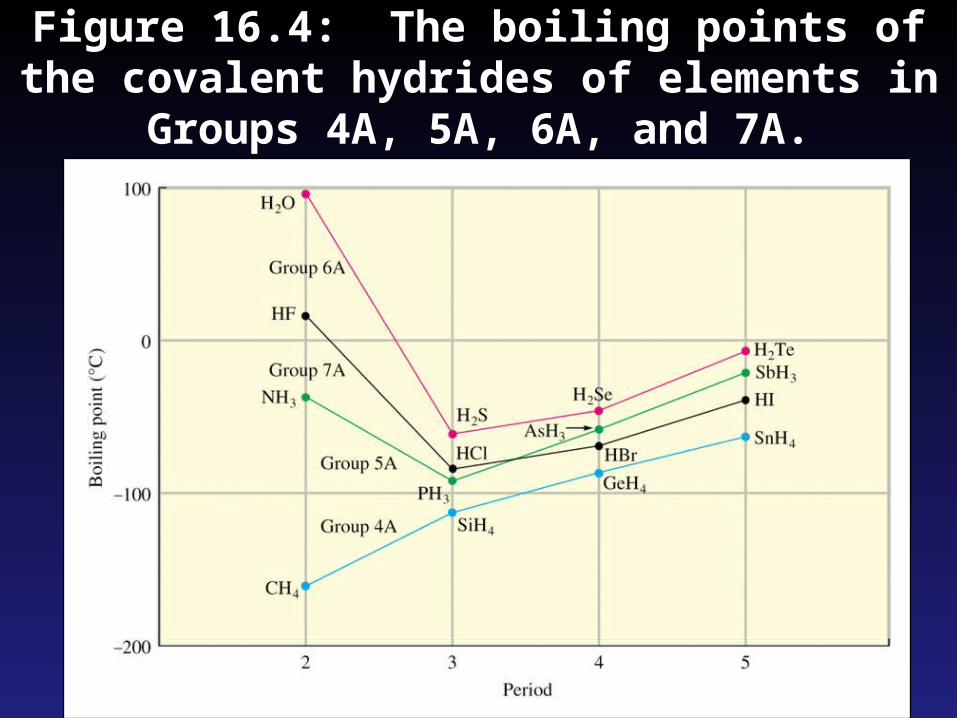
Figure 16.4: The boiling points of the covalent hydrides of elements in Groups 4A,
5A, 6A, and 7A.
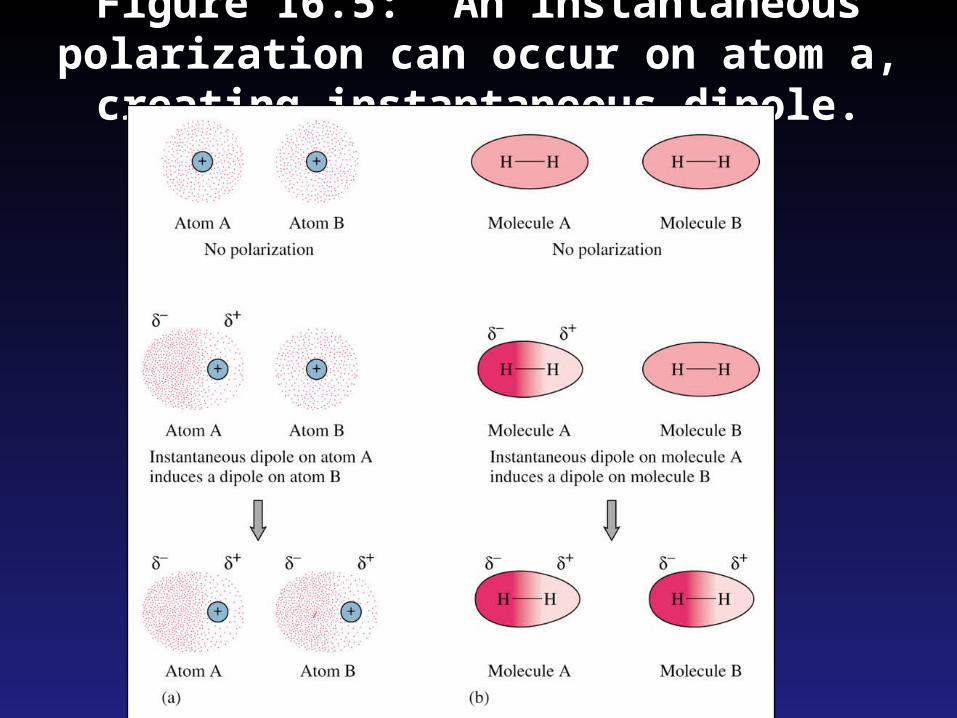
Figure 16.5: An instantaneous polarization can occur on atom a, creating instantaneous dipole.
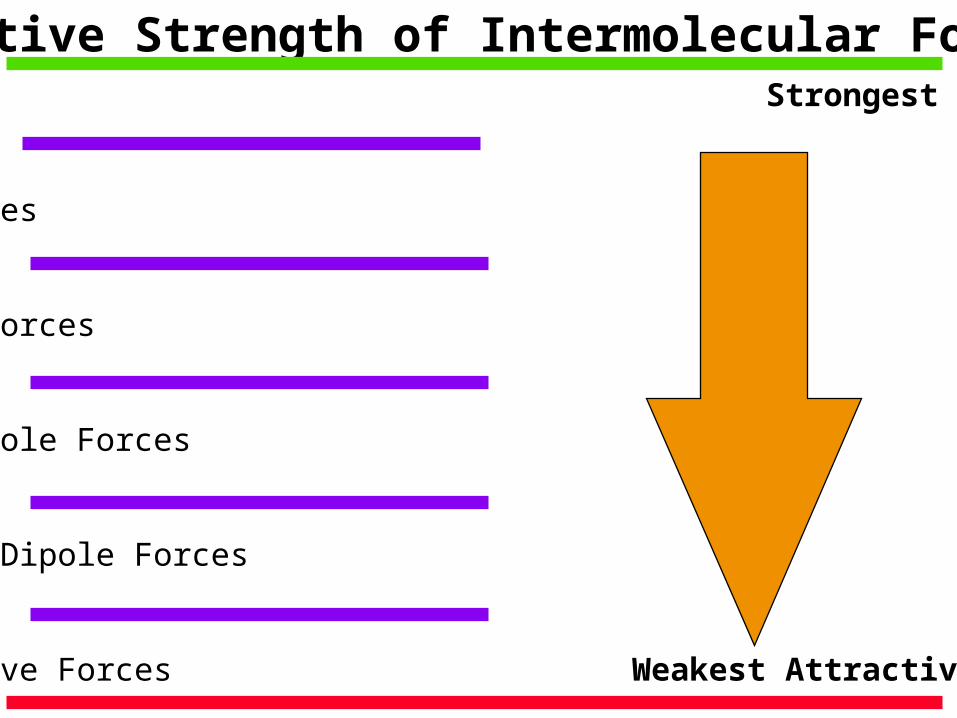
Relative Strength of Intermolecular ForcesIon - Ion Forces Strongest Attractive Forces
Ion - Dipole Forces
Dipole - Dipole Forces
Ion - Induced Dipole Forces
Dipole - Induced Dipole Forces
London - Dispersive Forces Weakest Attractive Forces
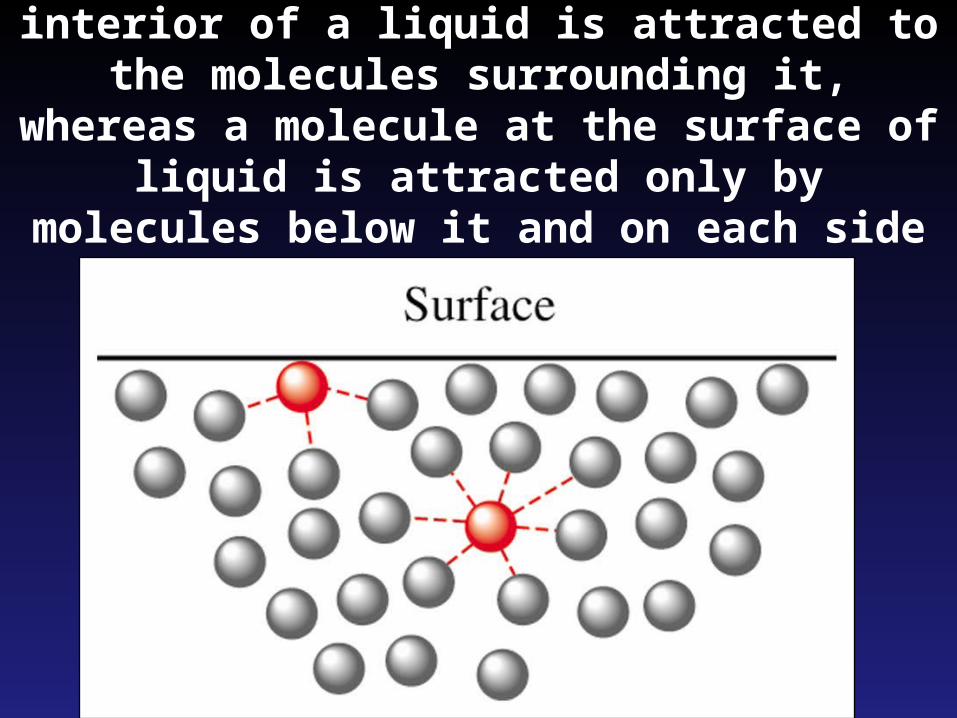
Figure 16.6: A molecule in the interior of a liquid is attracted to the molecules
surrounding it, whereas a molecule at the surface of liquid is attracted only by
molecules below it and on each side of it.

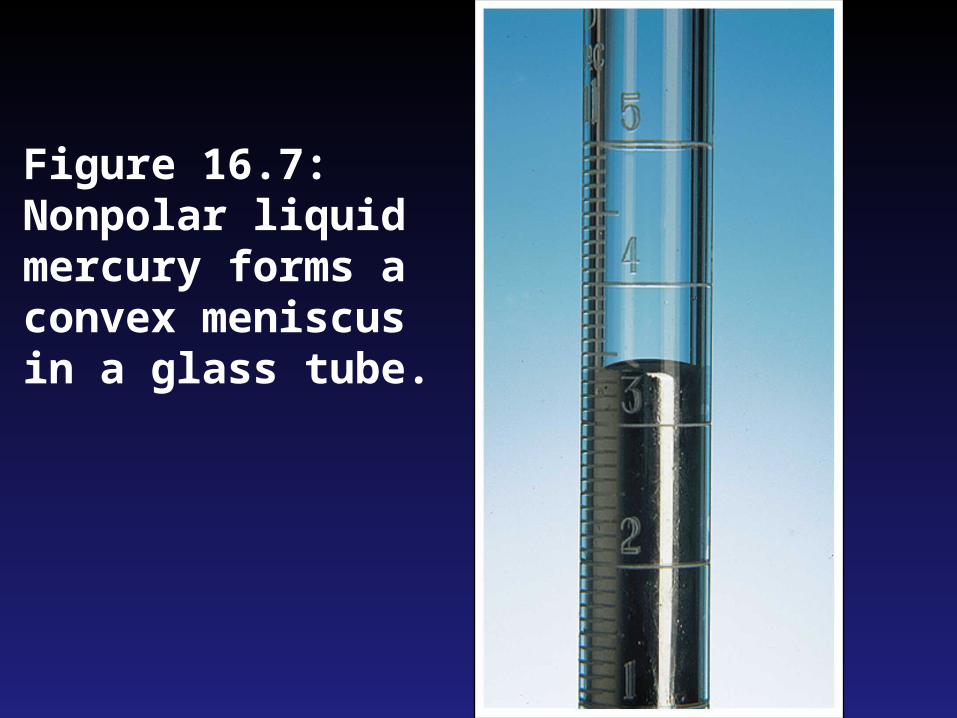
Figure 16.7: Nonpolar liquid mercury forms a convex meniscus in a glass tube.
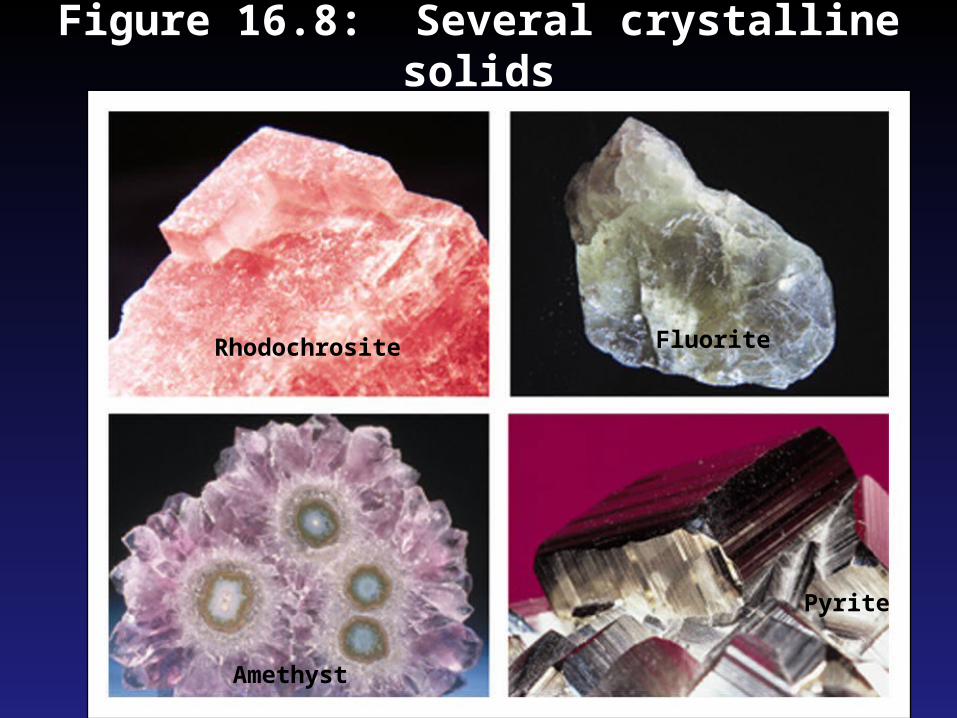
Figure 16.8: Several crystalline solids
Rhodochrosite Fluorite
Pyrite
Amethyst
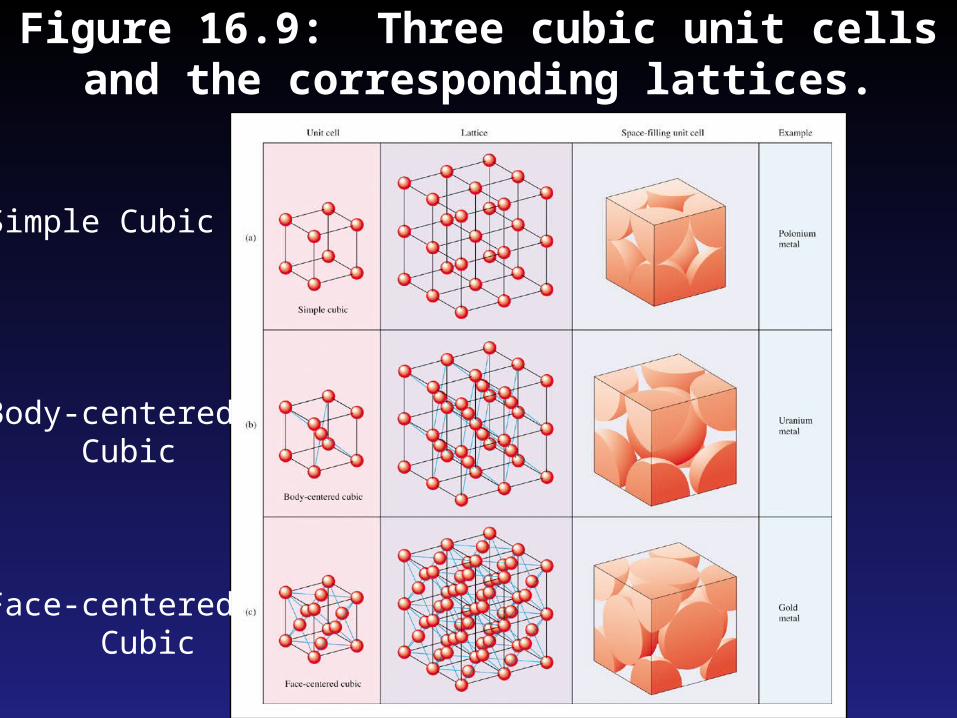
Figure 16.9: Three cubic unit cells and the corresponding lattices.
Simple Cubic
Body-centered Cubic
Face-centered Cubic
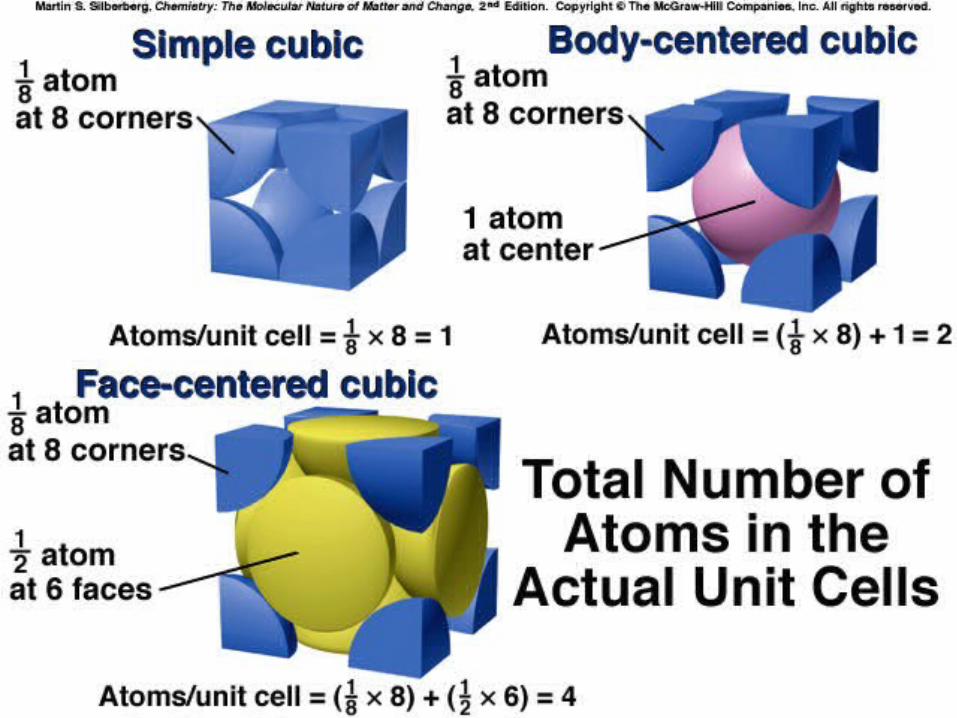
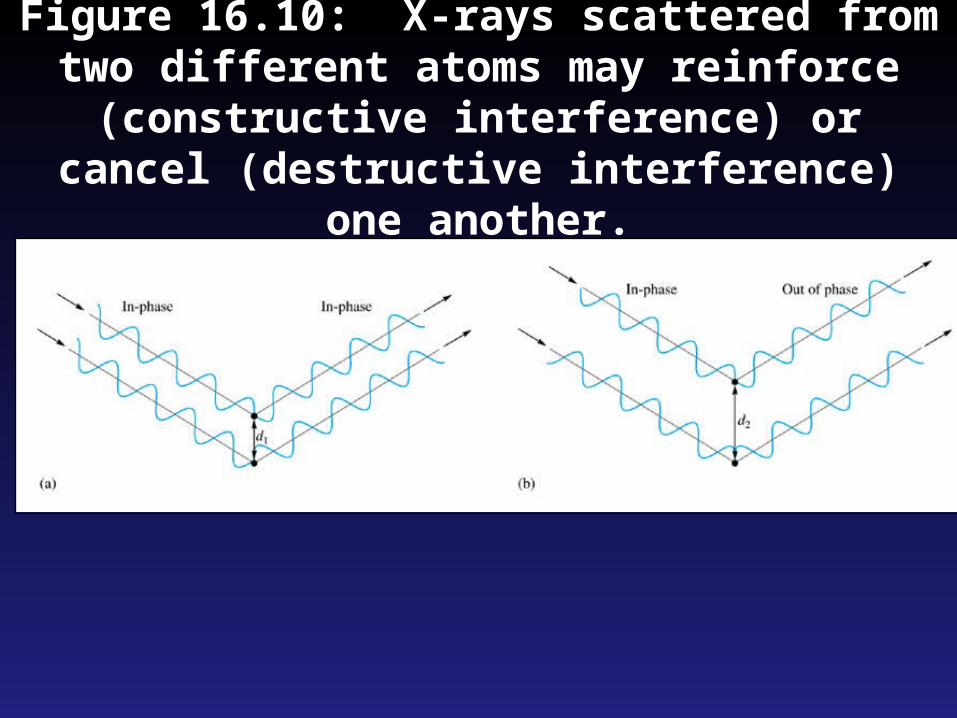
Figure 16.10: X-rays scattered from two different atoms may reinforce (constructive
interference) or cancel (destructive interference) one another.
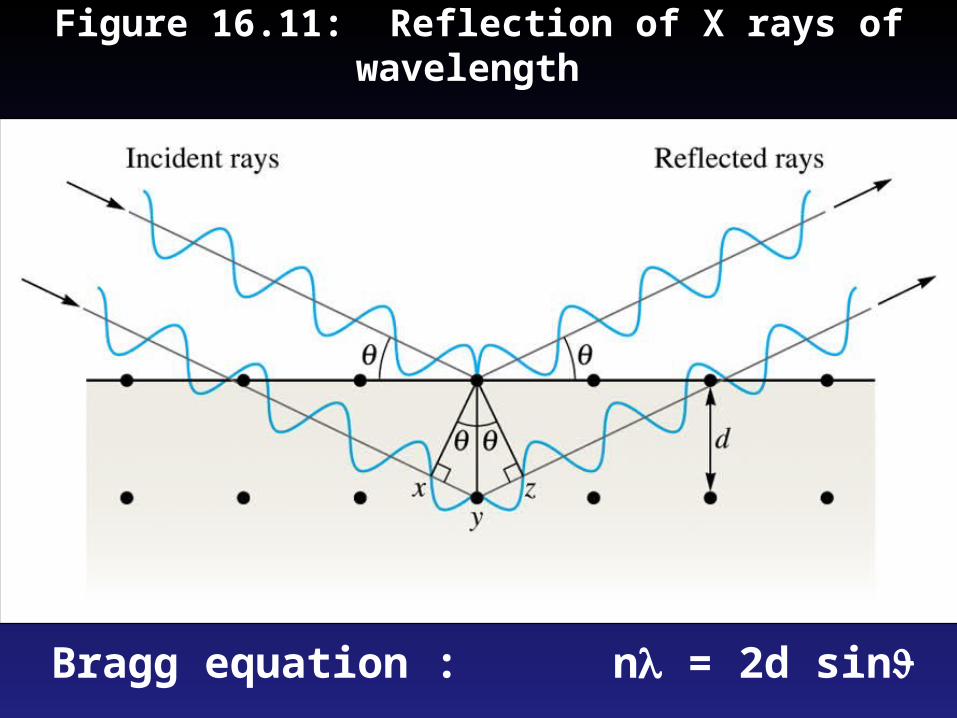
Figure 16.11: Reflection of X rays of wavelength
Bragg equation : n = 2d sin
A conch shell on a beach.
Source: Corbis
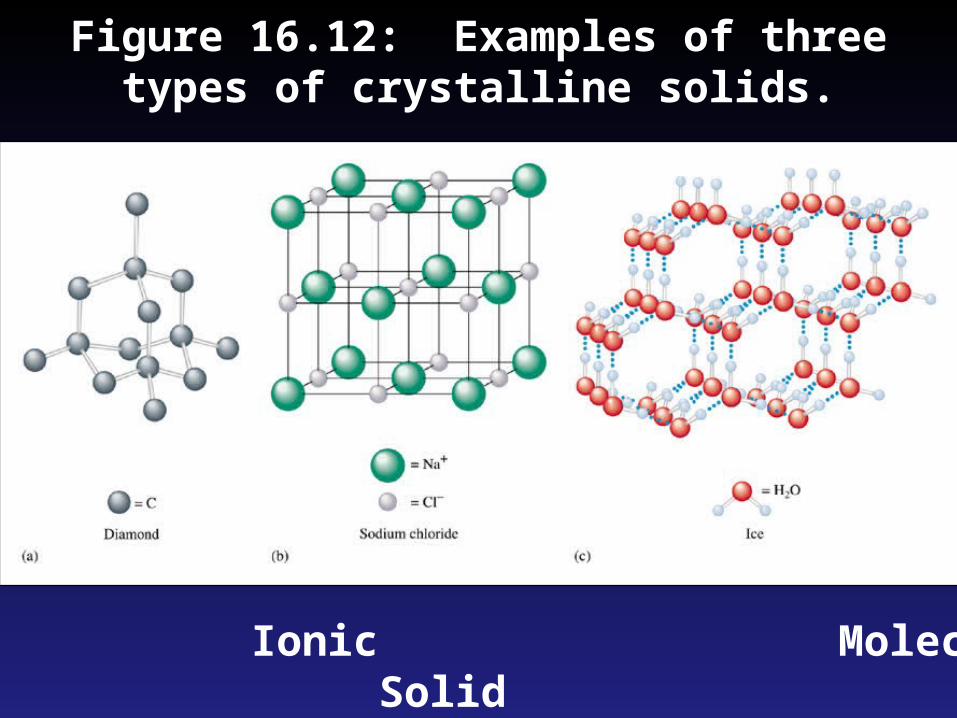
Figure 16.12: Examples of three types of crystalline solids.
Elemental Ionic Molecular Solid Solid Solid
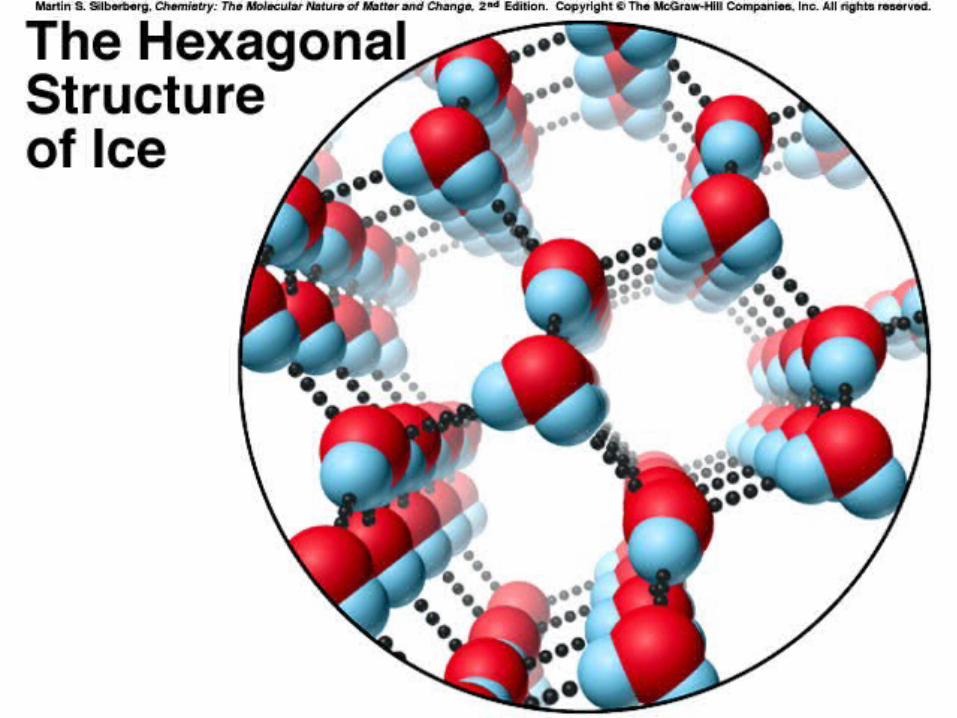
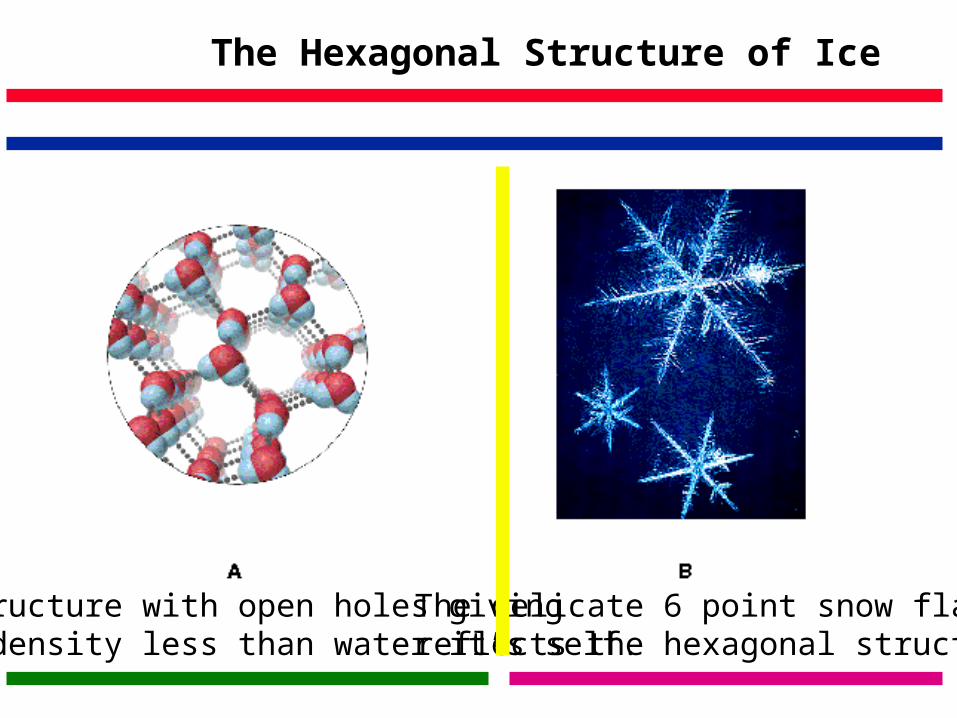
The Hexagonal Structure of Ice
Ice Structure with open holes givingIce a density less than water it’s self.
The delicate 6 point snow flakereflects the hexagonal structure.

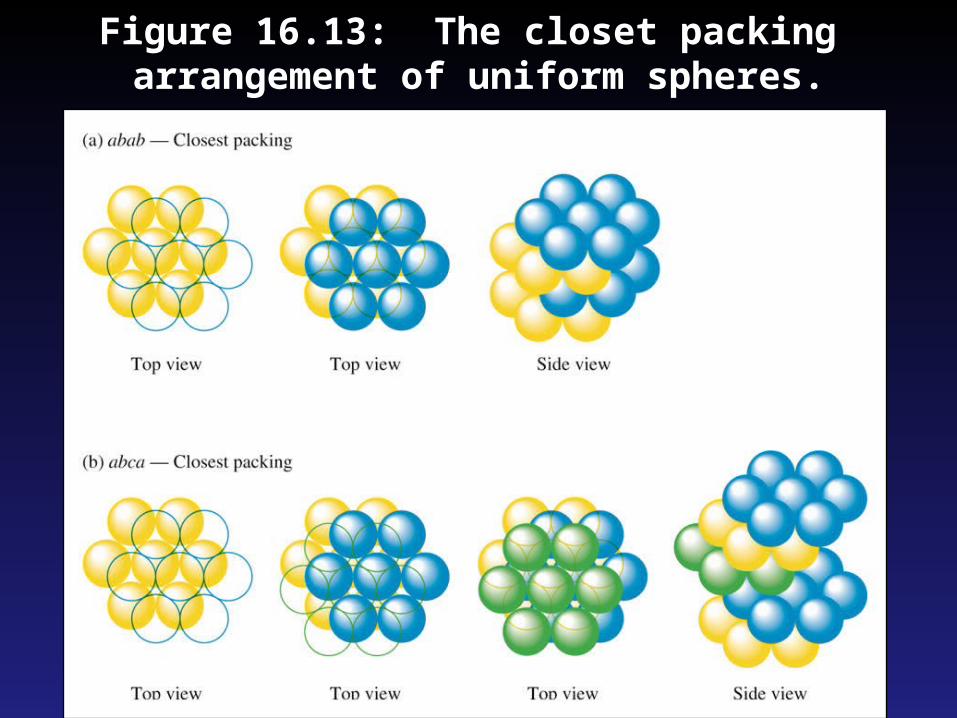
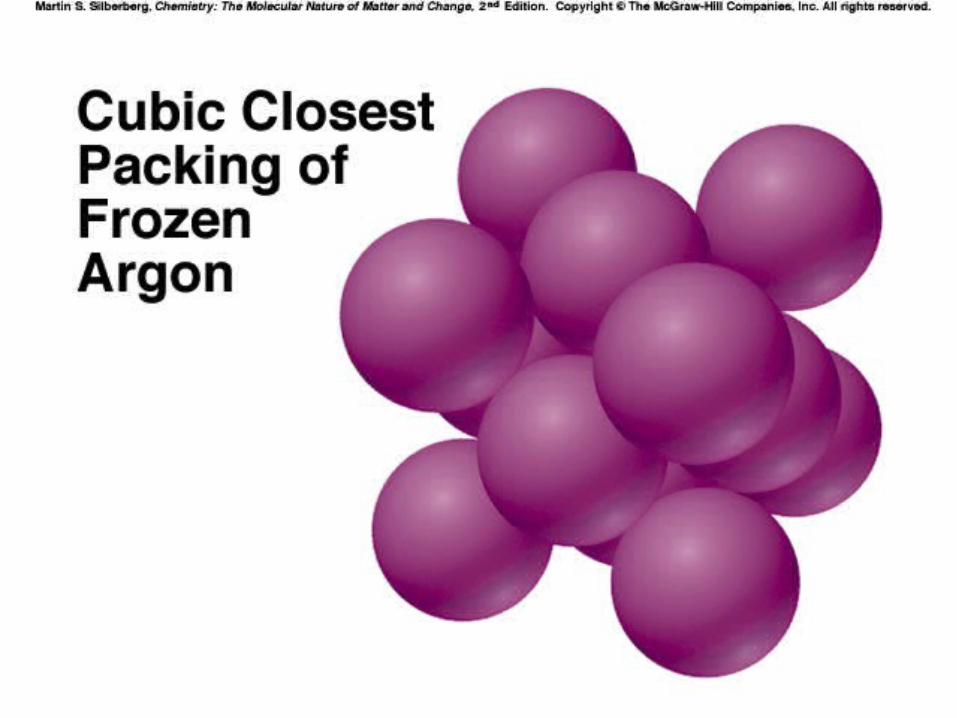
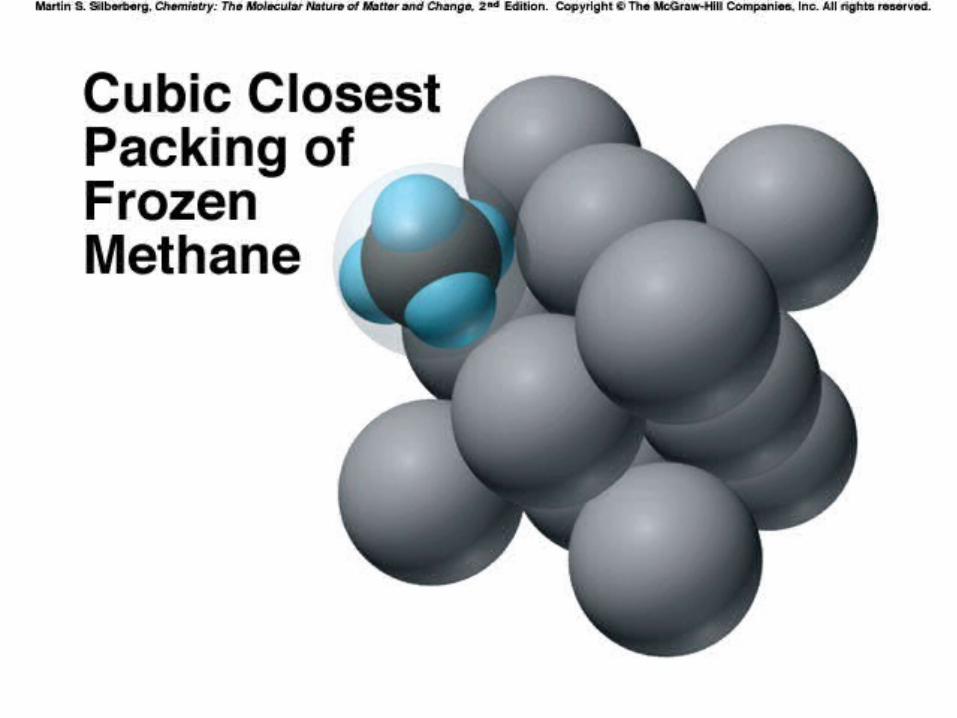
Figure 16.13: The closet packing arrangement of uniform spheres.
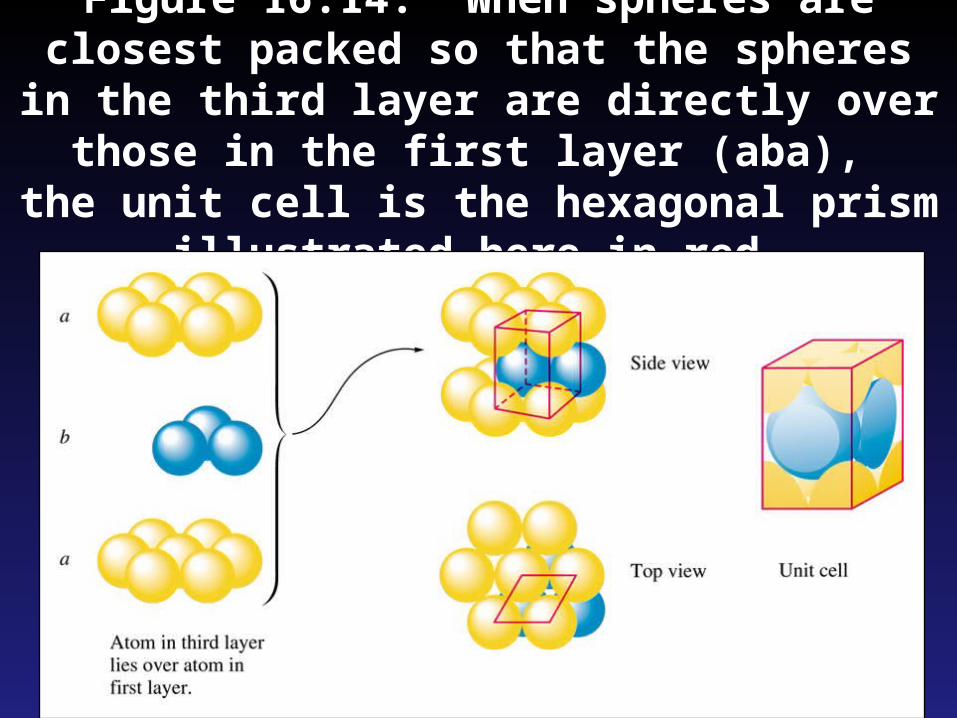
Figure 16.14: When spheres are closest packed so that the spheres in the third layer
are directly over those in the first layer (aba), the unit cell is the hexagonal prism illustrated
here in red.
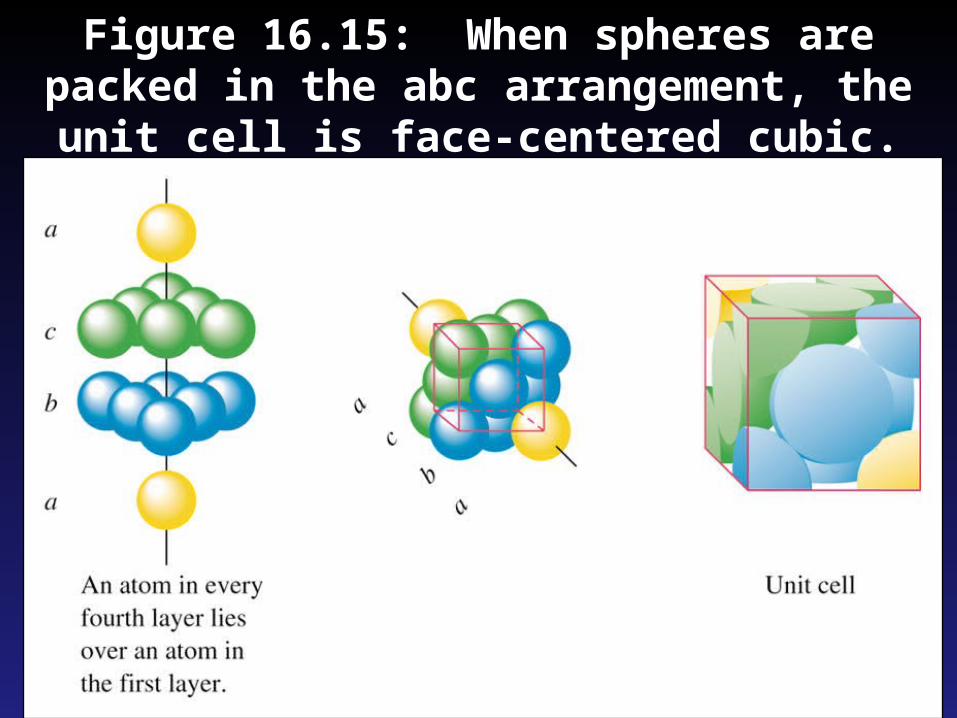
Figure 16.15: When spheres are packed in the abc arrangement, the unit cell is face-centered
cubic.
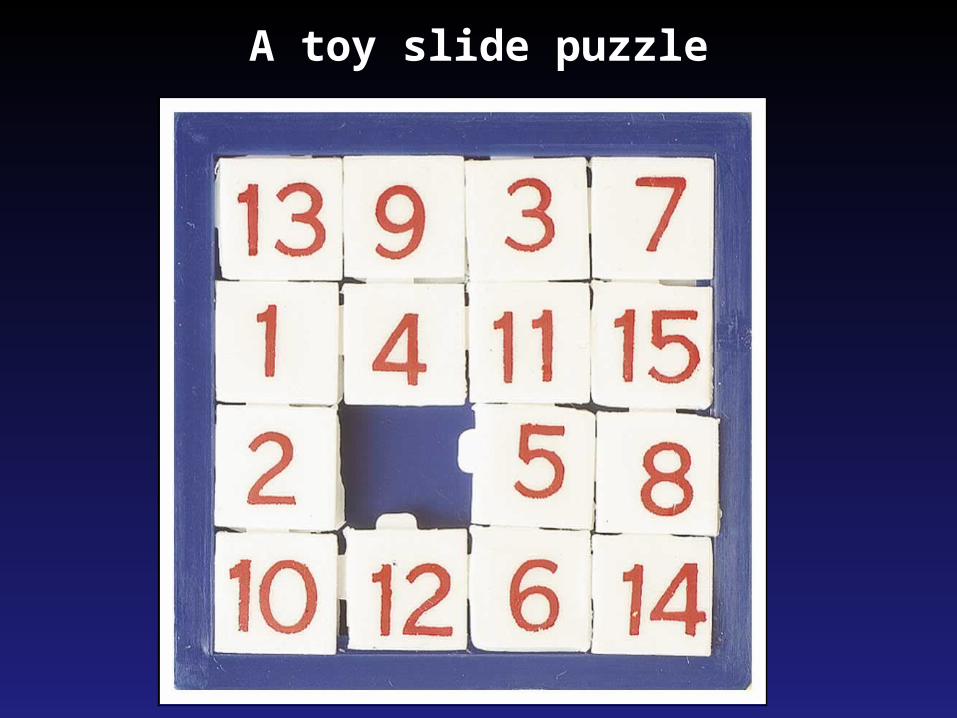
A toy slide puzzle
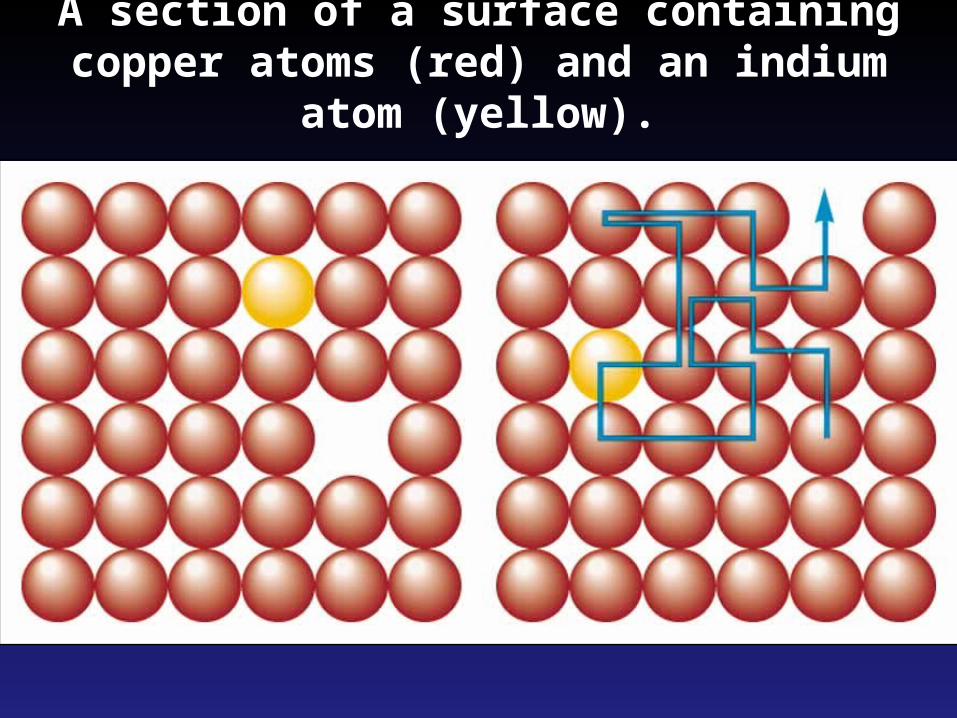
A section of a surface containing copper atoms (red) and an indium atom (yellow).
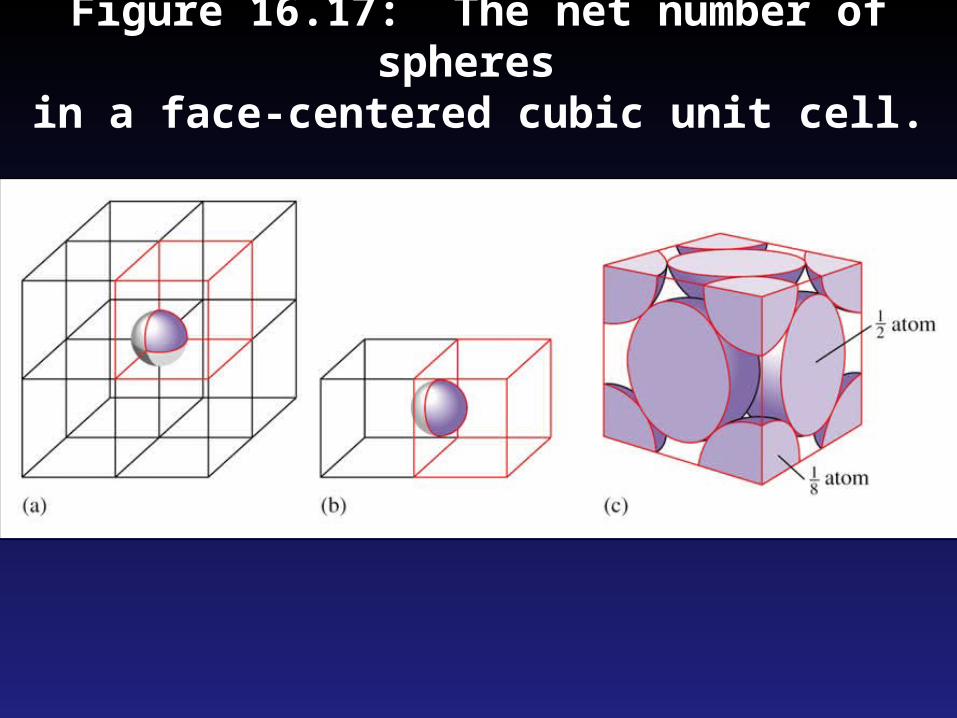
Figure 16.17: The net number of spheres in a face-centered cubic unit cell.
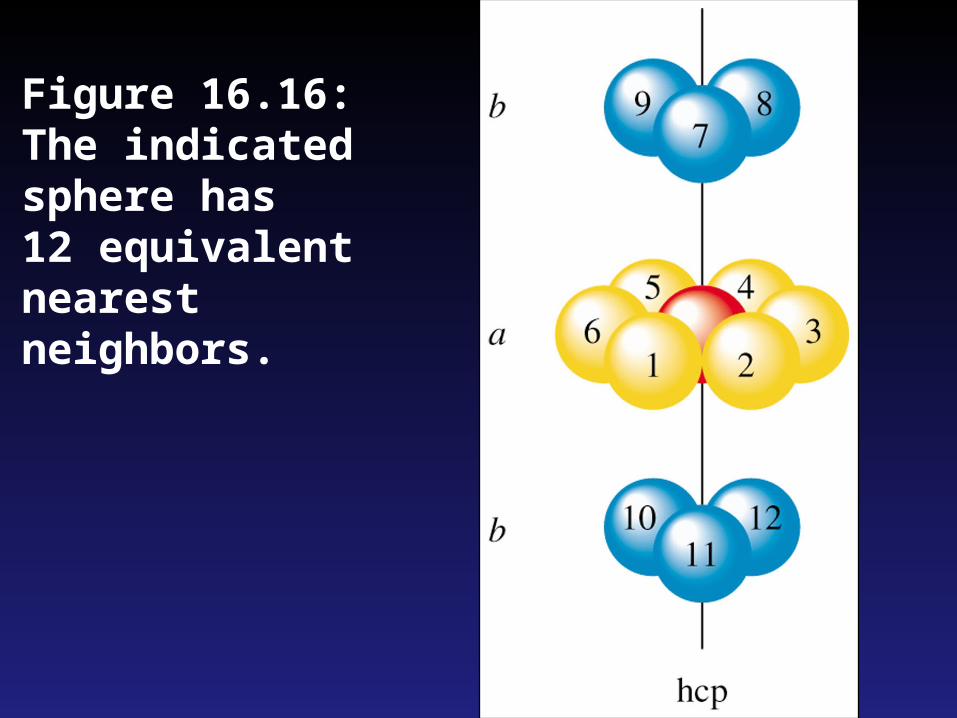
Figure 16.16: The indicated sphere has
12 equivalent nearest neighbors.
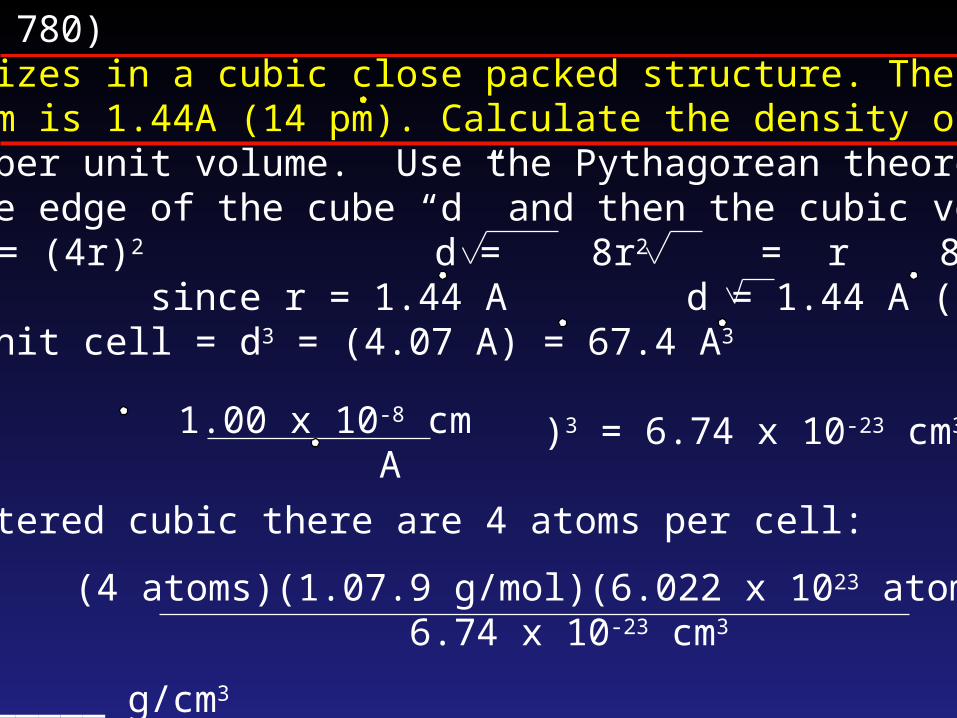
Example 16.1 (P 780)Silver crystallizes in a cubic close packed structure. The radius of a sliver atom is 1.44A (14 pm). Calculate the density of Ag.Density = mass per unit volume. Use the Pythagorean theoremto calculate the edge of the cube “d” and then the cubic volume. d2 + d2 = (4r)2 d = 8r2 = r 8 since r = 1.44 A d = 1.44 A ( 8 ) = 4.07 AVolume of the unit cell = d3 = (4.07 A) = 67.4 A3
67.4 A3 x ( )3 = 6.74 x 10⁻²³ cm3
In the face-centered cubic there are 4 atoms per cell:
Density =
Density = _________ g/cm3
1.00 x 10⁻⁸ cm A
(4 atoms)(1.07.9 g/mol)(6.022 x 1023 atoms/mol) 6.74 x 10⁻²³ cm3
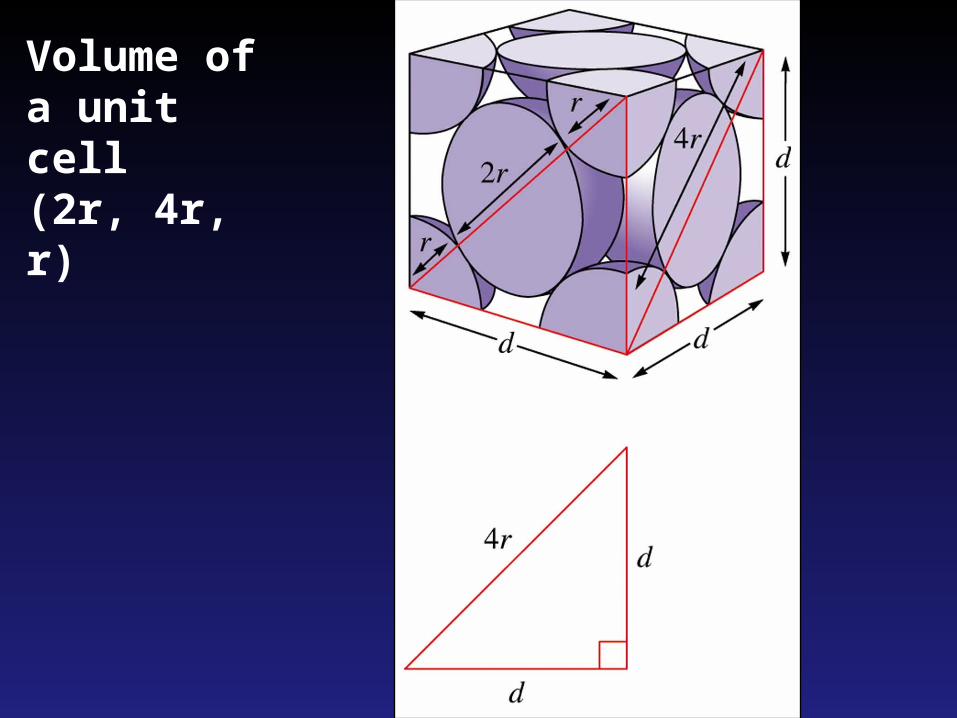
Volume of a unit cell (2r, 4r, r)
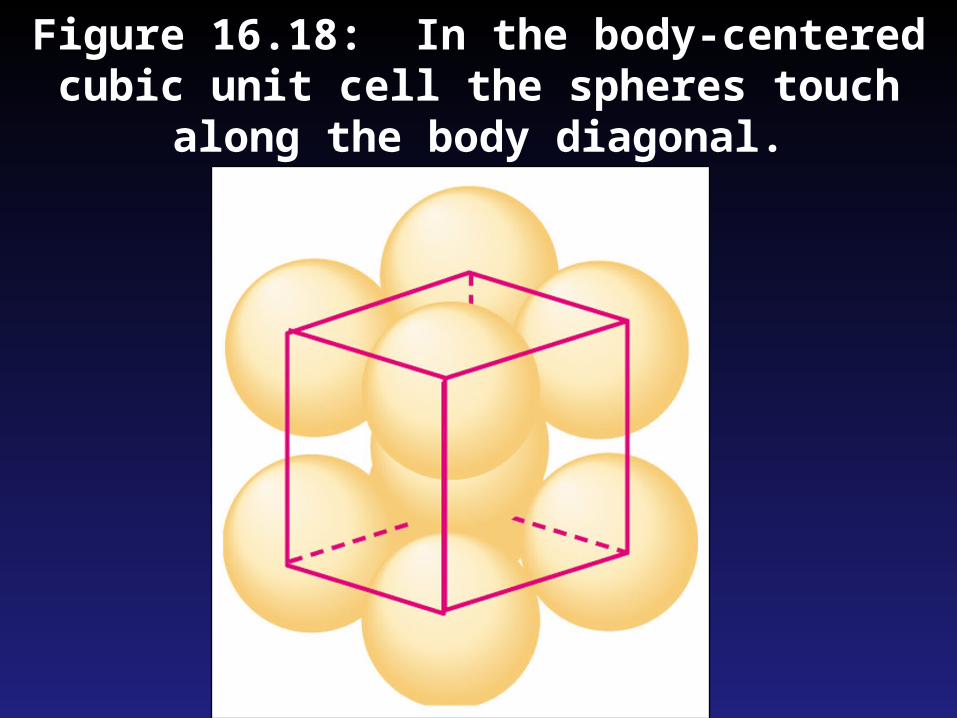
Figure 16.18: In the body-centered cubic unit cell the spheres touch along the body
diagonal.
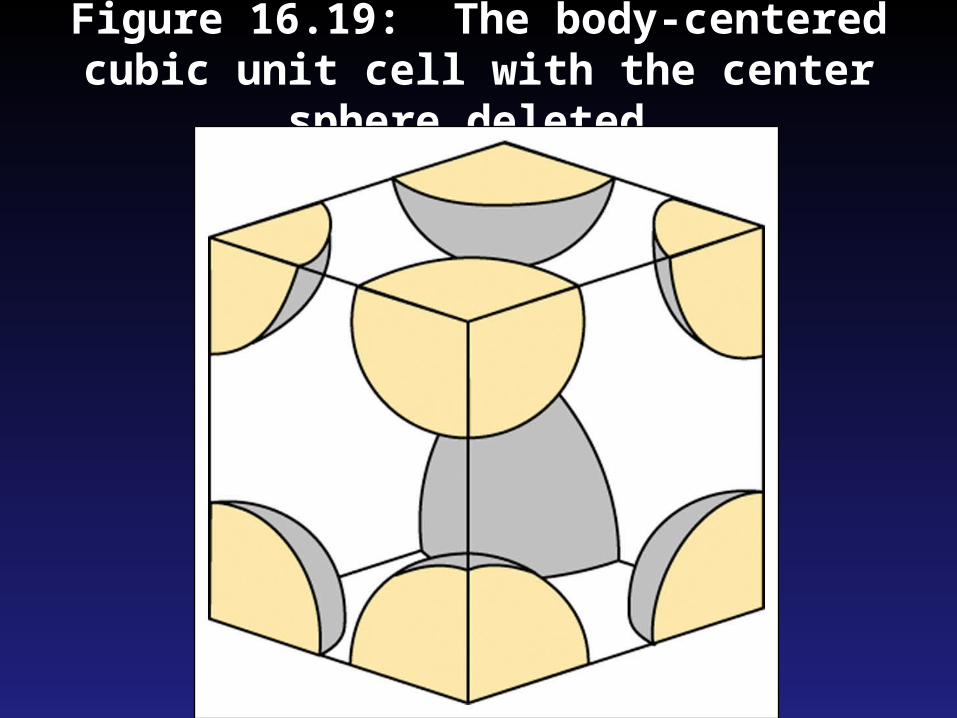
Figure 16.19: The body-centered cubic unit cell with the center sphere deleted.
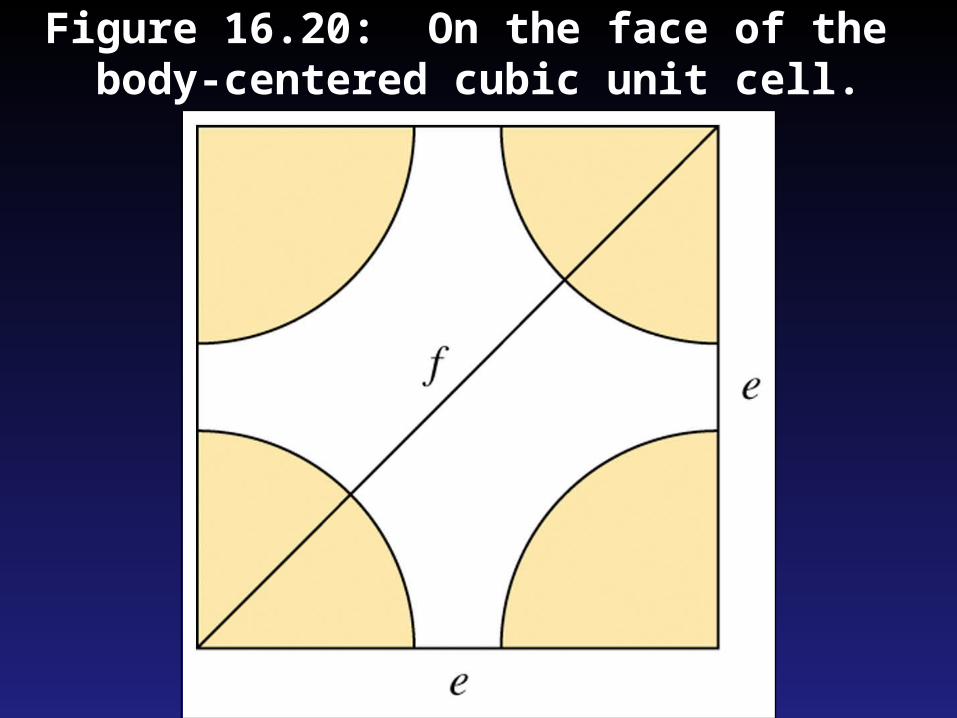
Figure 16.20: On the face of the body-centered cubic unit cell.
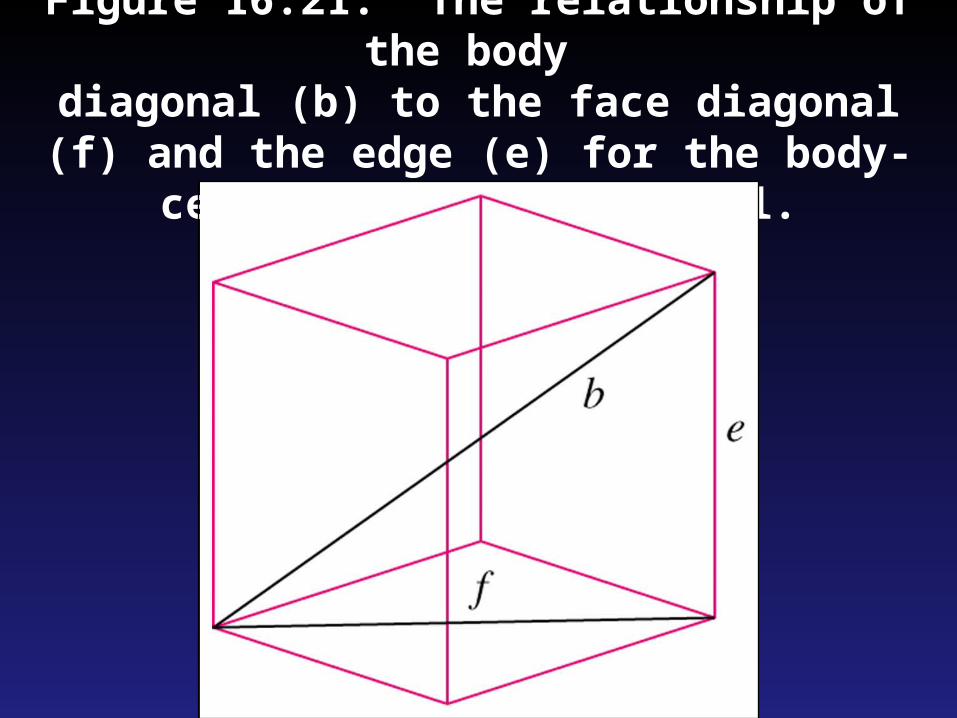
Figure 16.21: The relationship of the body diagonal (b) to the face diagonal (f) and the
edge (e) for the body-centered cubic unit cell.
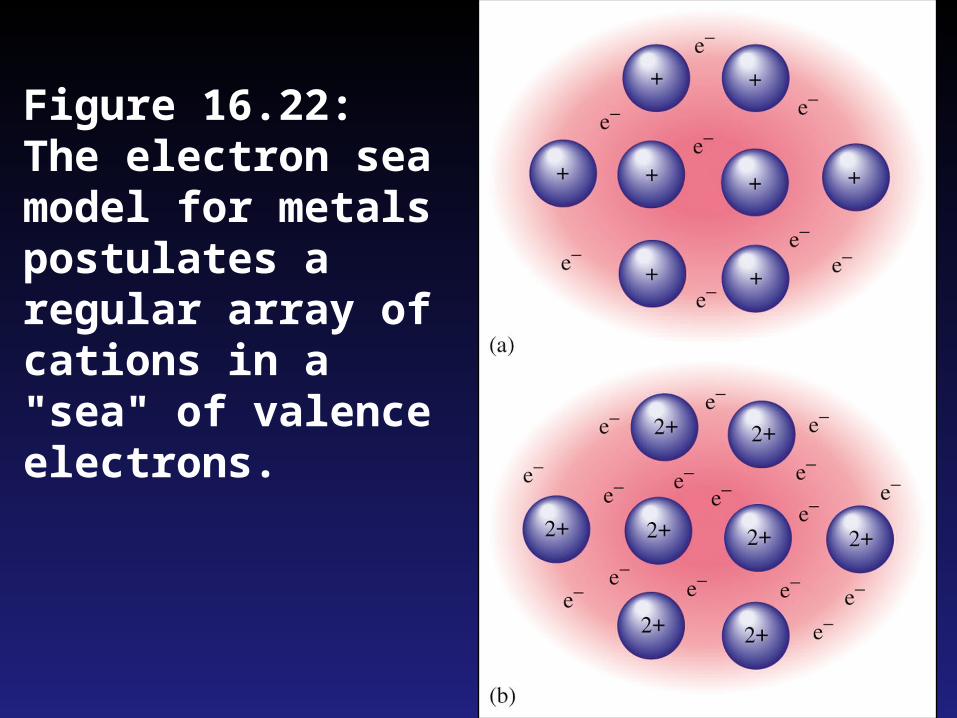
Figure 16.22: The electron sea model for metals postulates a regular array of cations in a "sea" of valence electrons.
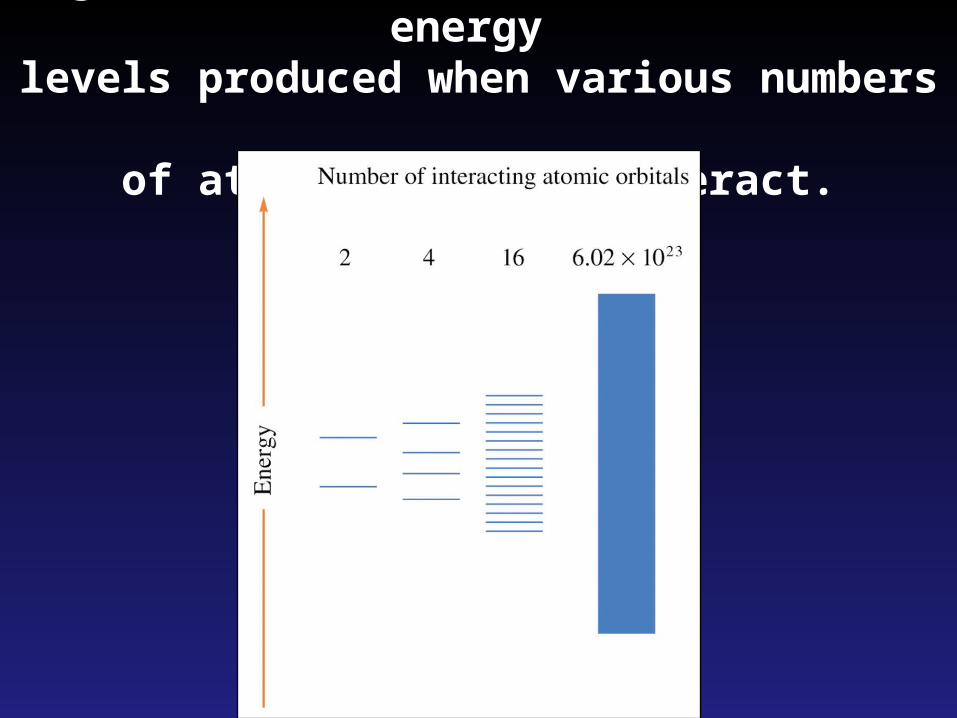
Figure 16.23: The molecular orbital energy levels produced when various numbers
of atomic orbitals interact.
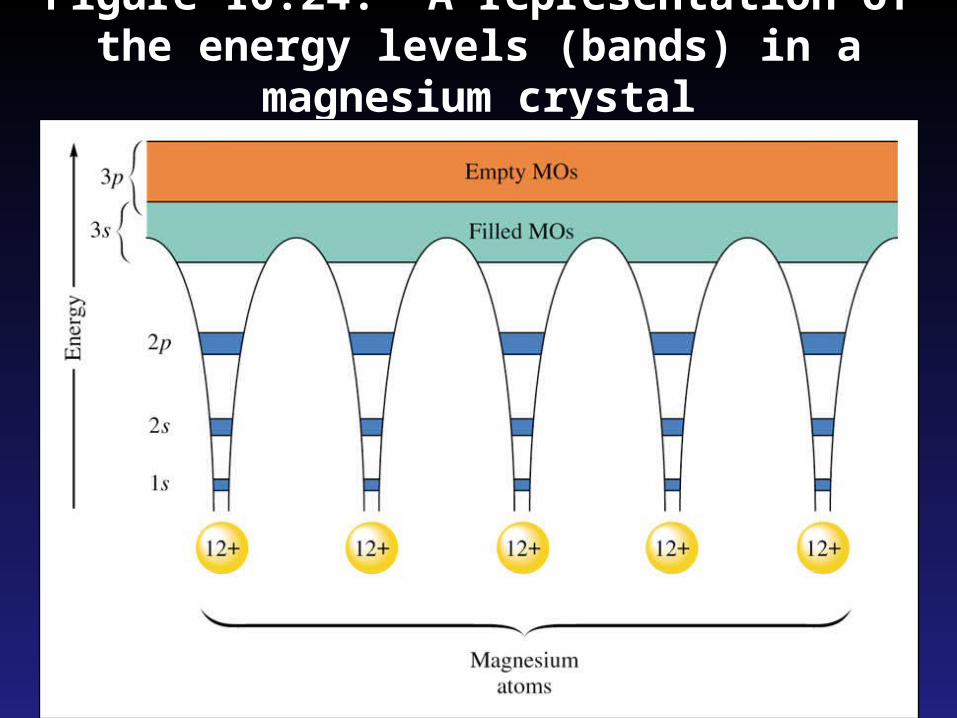
Figure 16.24: A representation of the energy levels (bands) in a magnesium crystal
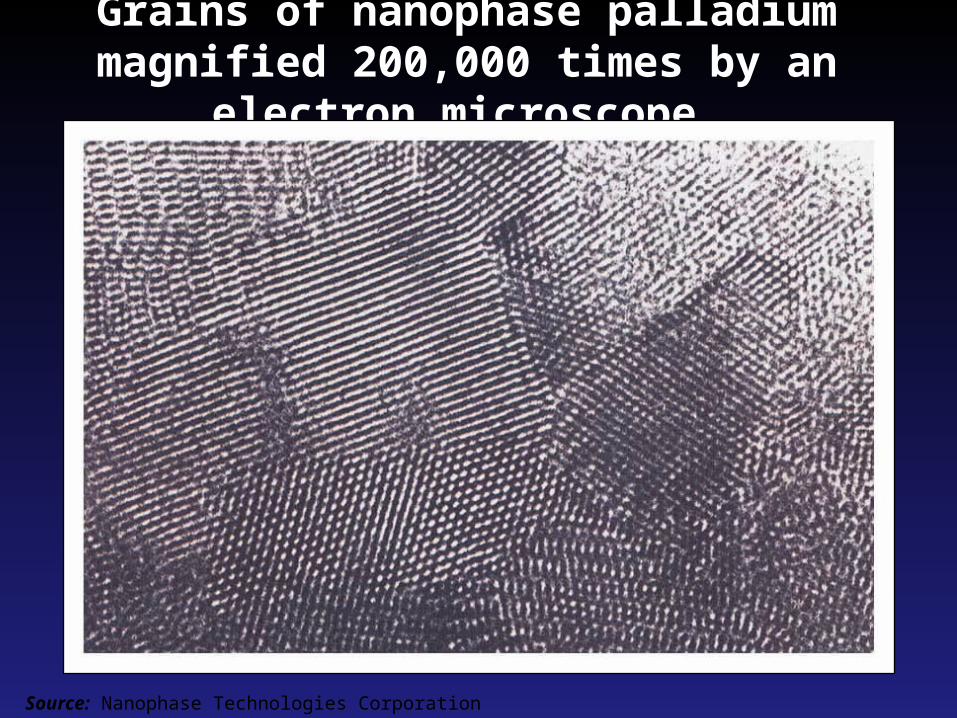
Grains of nanophase palladium magnified 200,000 times by an electron microscope.
Source: Nanophase Technologies Corporation
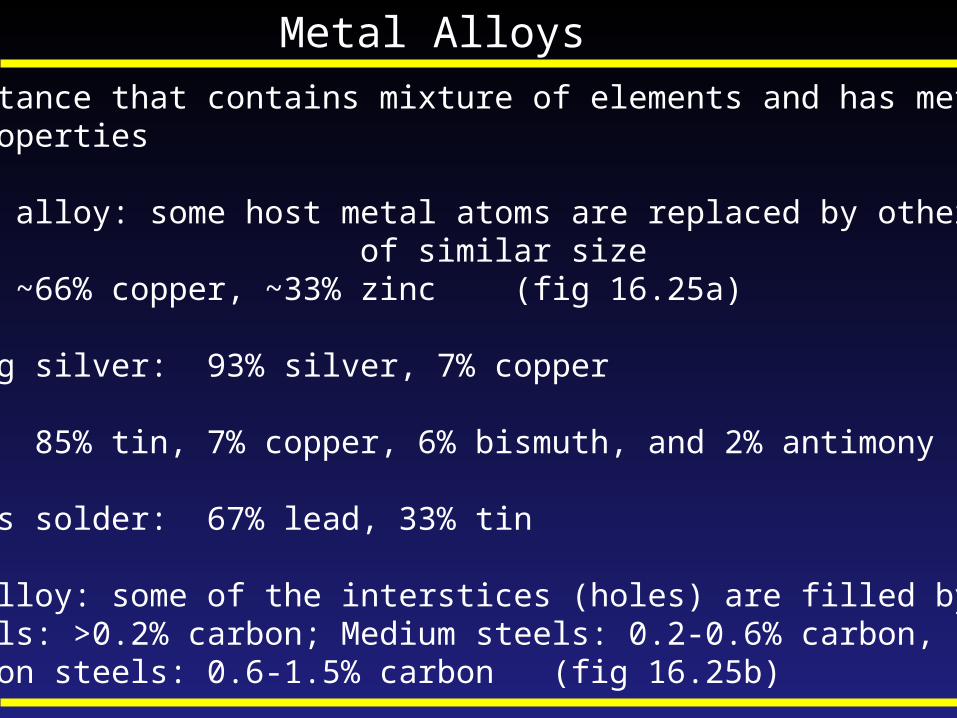
Metal Alloys
Alloy: a substance that contains mixture of elements and has metallic properties
Substitutional alloy: some host metal atoms are replaced by other atoms of similar size Brass: ~66% copper, ~33% zinc (fig 16.25a)
Sterling silver: 93% silver, 7% copper
Pewter: 85% tin, 7% copper, 6% bismuth, and 2% antimony
Plumbers solder: 67% lead, 33% tin
Interstitial alloy: some of the interstices (holes) are filled by smaller atoms Mild steels: >0.2% carbon; Medium steels: 0.2-0.6% carbon, High carbon steels: 0.6-1.5% carbon (fig 16.25b)
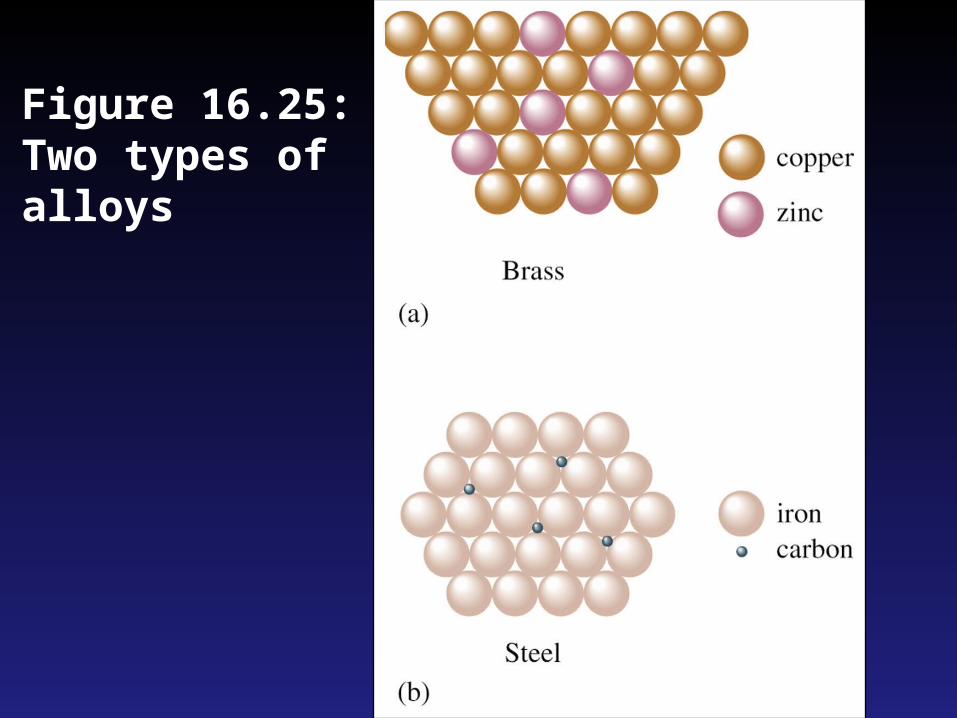
Figure 16.25: Two types of alloys
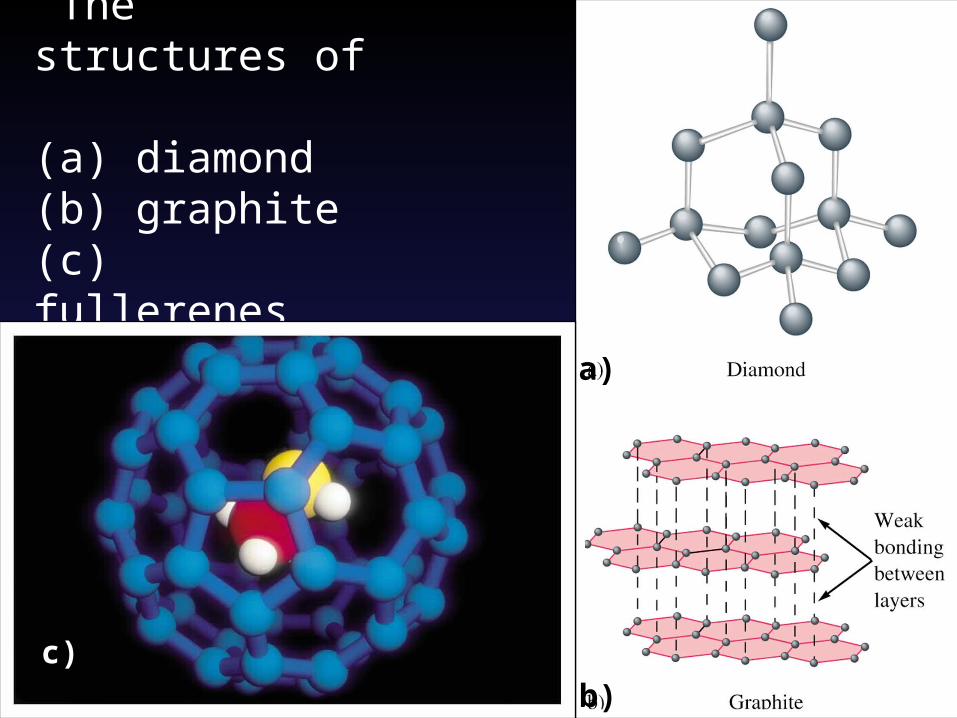
Figure 16.26: The structures of (a) diamond (b) graphite(c) fullerenes
c)
a)
b)
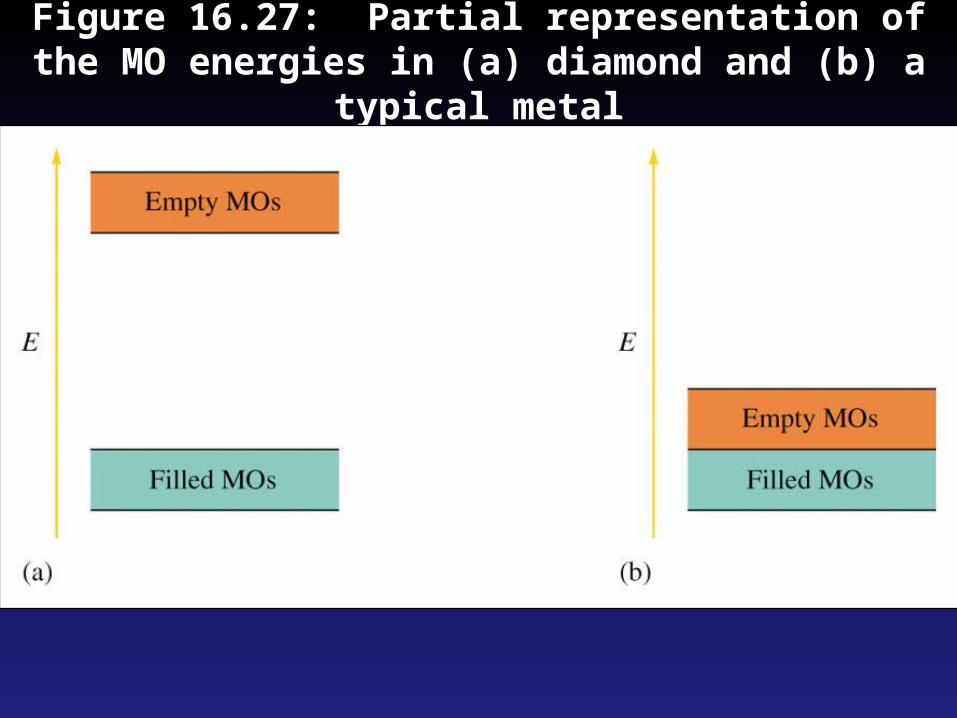
Figure 16.27: Partial representation of the MO energies in (a) diamond and (b) a typical metal
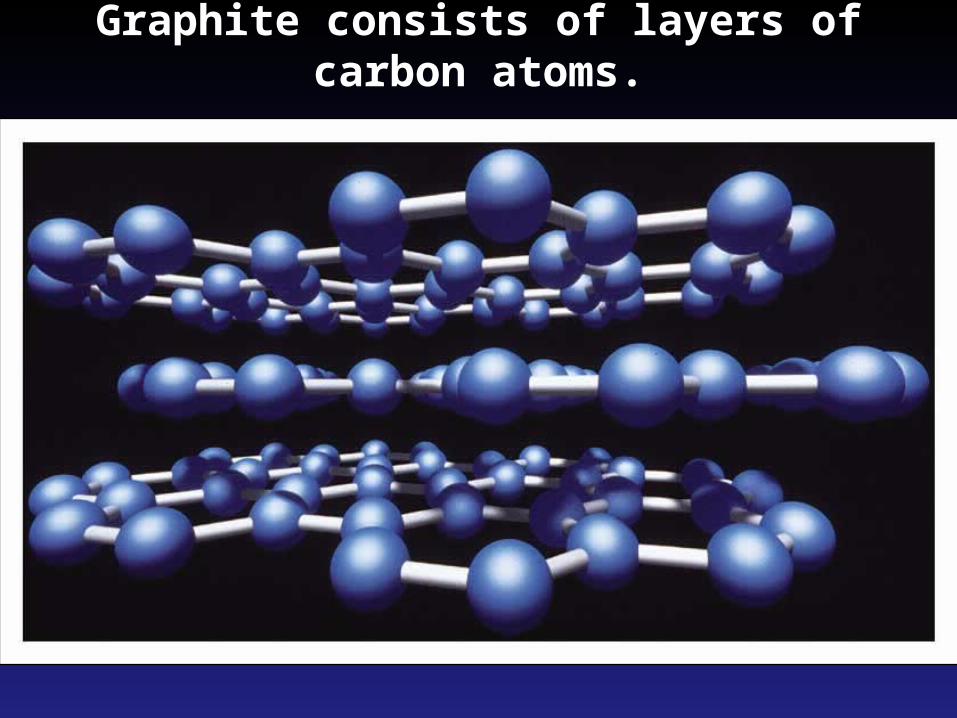
Graphite consists of layers of carbon atoms.
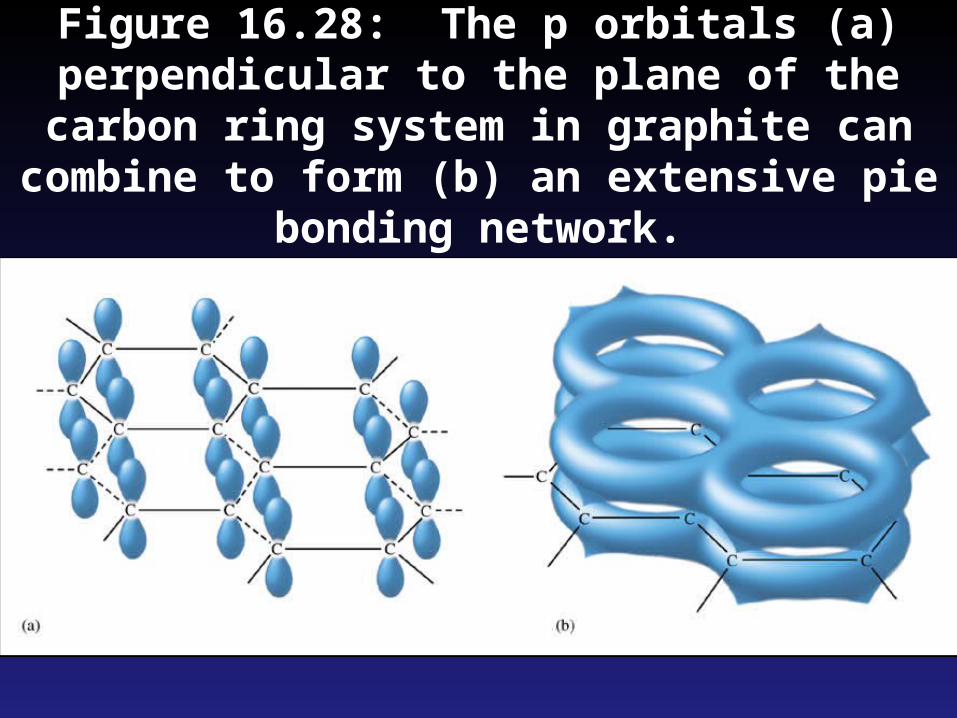
Figure 16.28: The p orbitals (a) perpendicular to the plane of the carbon ring system in
graphite can combine to form (b) an extensive pie bonding network.
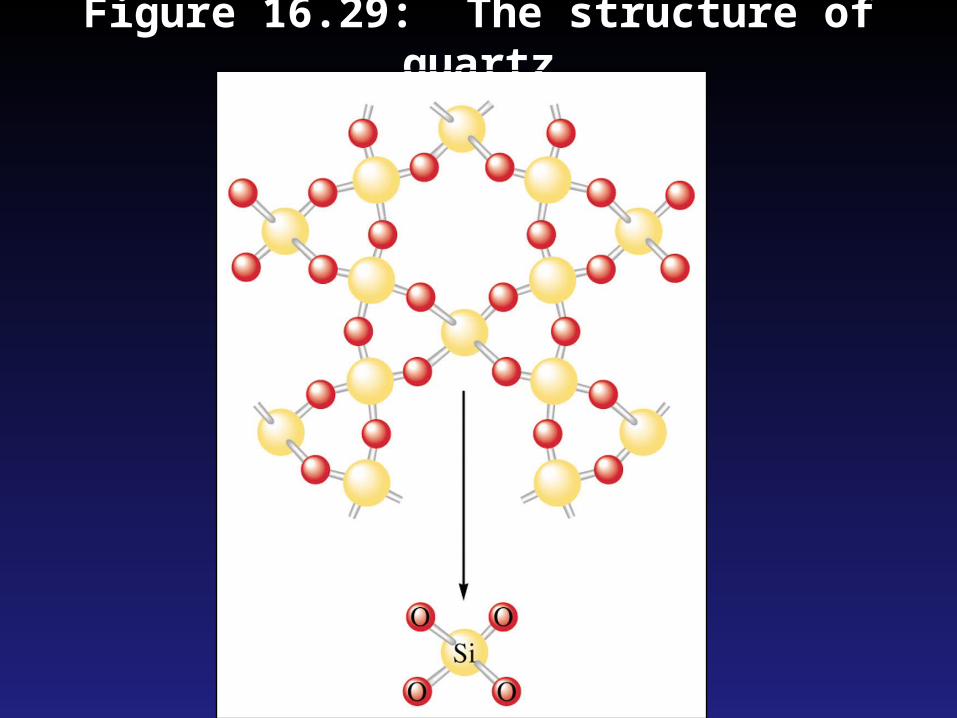
Figure 16.29: The structure of quartz
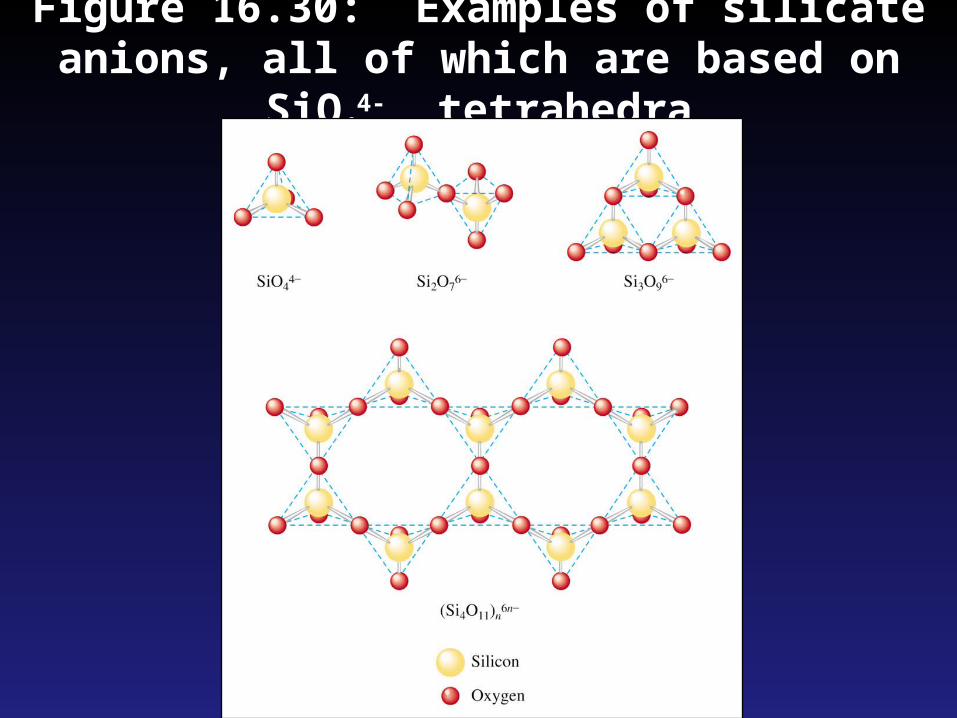
Figure 16.30: Examples of silicate anions, all of which are based on SiO4
4- tetrahedra
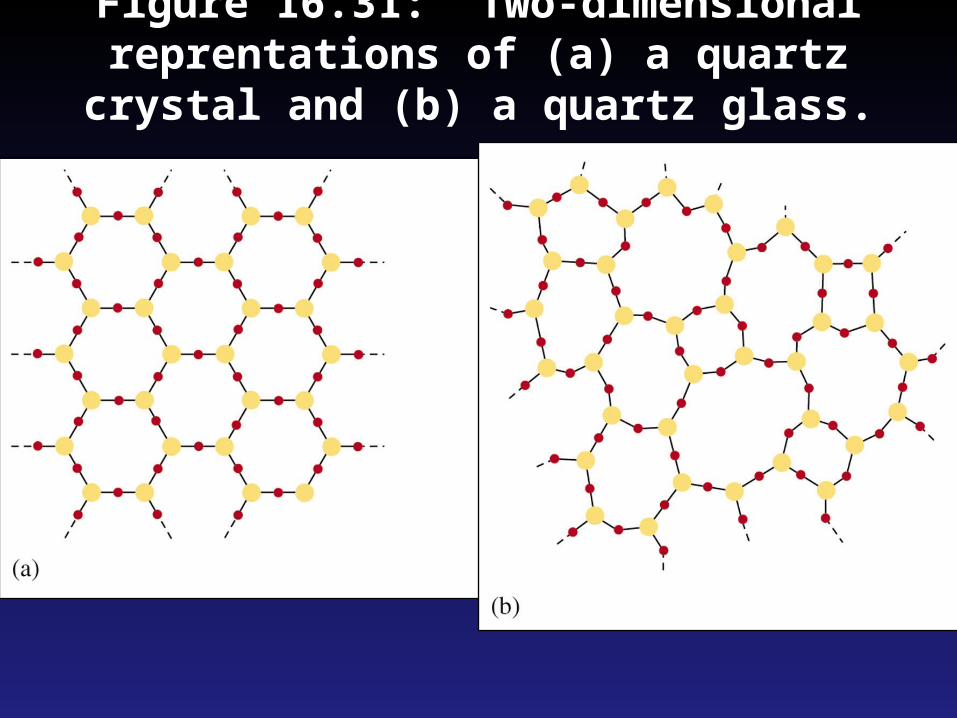
Figure 16.31: Two-dimensional reprentations of (a) a quartz crystal and (b) a quartz glass.
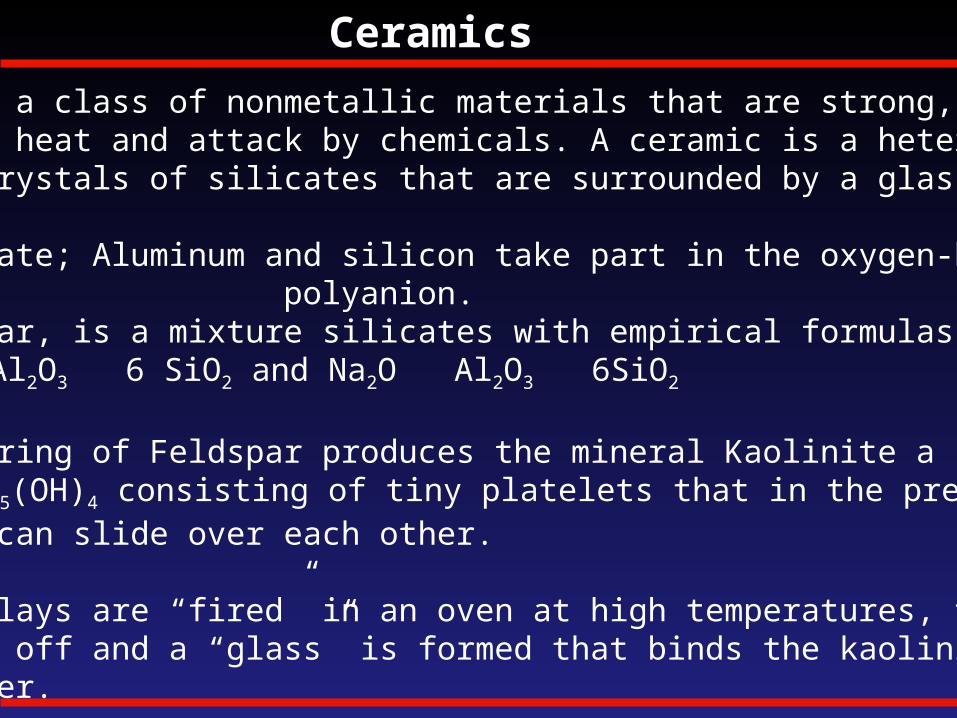
Ceramics
Ceramics are a class of nonmetallic materials that are strong, brittle, andresistant to heat and attack by chemicals. A ceramic is a heterogeneousmixture of crystals of silicates that are surrounded by a glassy cement.
Aluminosilicate; Aluminum and silicon take part in the oxygen-bridged polyanion. Feldspar, is a mixture silicates with empirical formulas such as: K2O Al2O3 6 SiO2 and Na2O Al2O3 6SiO2
Weathering of Feldspar produces the mineral Kaolinite a “clay” Al2Si2O5(OH)4 consisting of tiny platelets that in the presence of water can slide over each other.
When clays are “fired” in an oven at high temperatures, the water is driven off and a “glass” is formed that binds the kaolinite crystals together.
Semiconductors
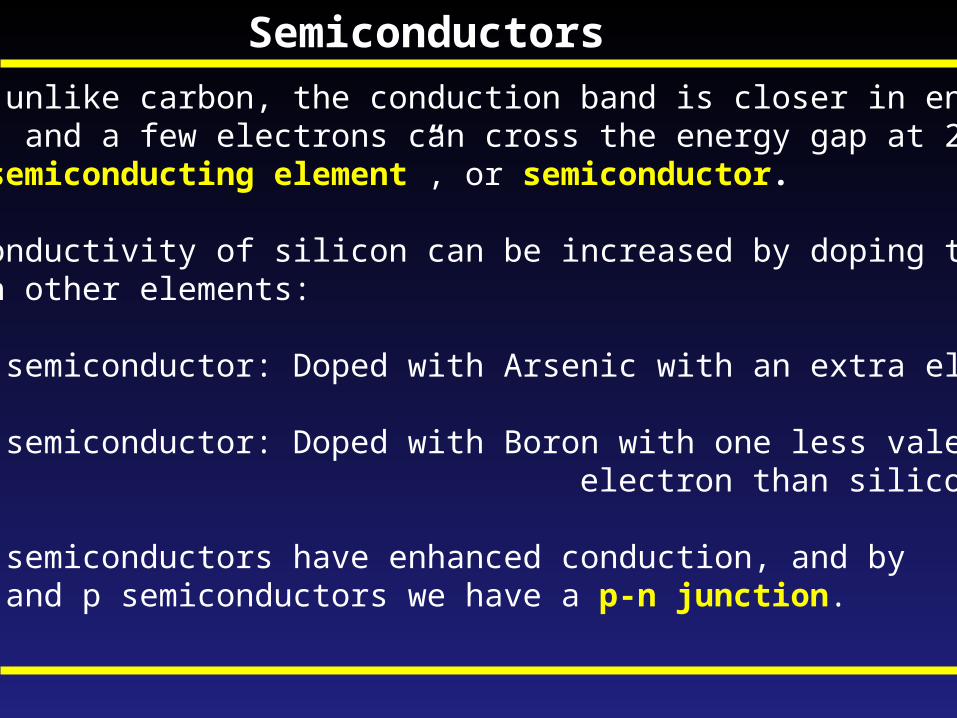
In silicon, unlike carbon, the conduction band is closer in energy to the filled MO’s, and a few electrons can cross the energy gap at 25oC, makingsilicon a “semiconducting element”, or semiconductor.
The small conductivity of silicon can be increased by doping the siliconcrystal with other elements:
n-type semiconductor: Doped with Arsenic with an extra electron.
p-type semiconductor: Doped with Boron with one less valence electron than silicon or “hole”.
These doped semiconductors have enhanced conduction, and by combining n and p semiconductors we have a p-n junction.
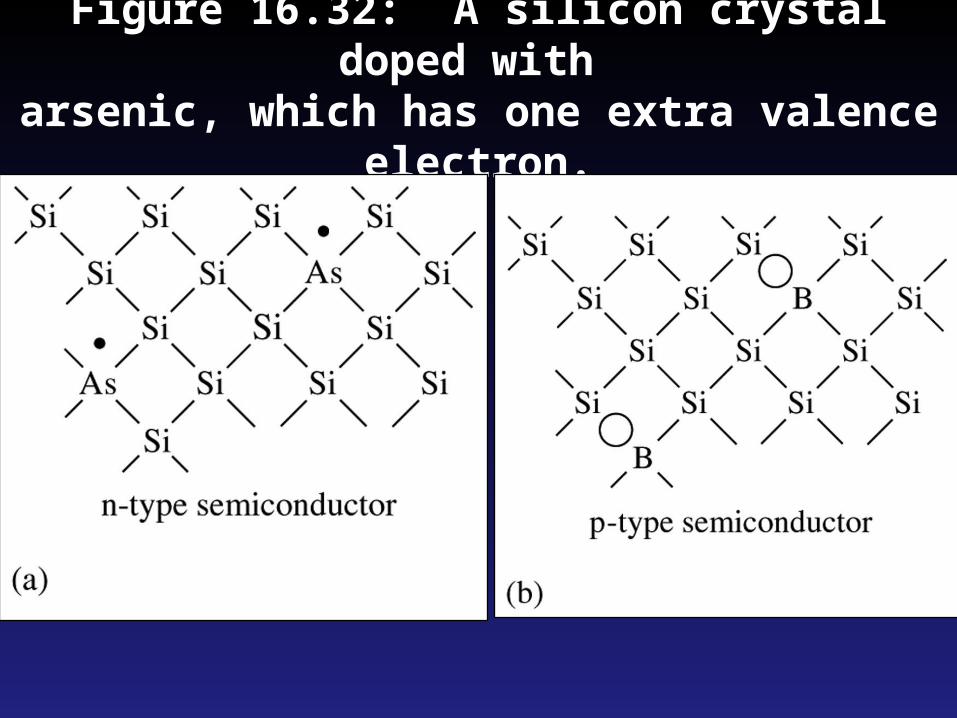
Figure 16.32: A silicon crystal doped with arsenic, which has one extra valence electron.
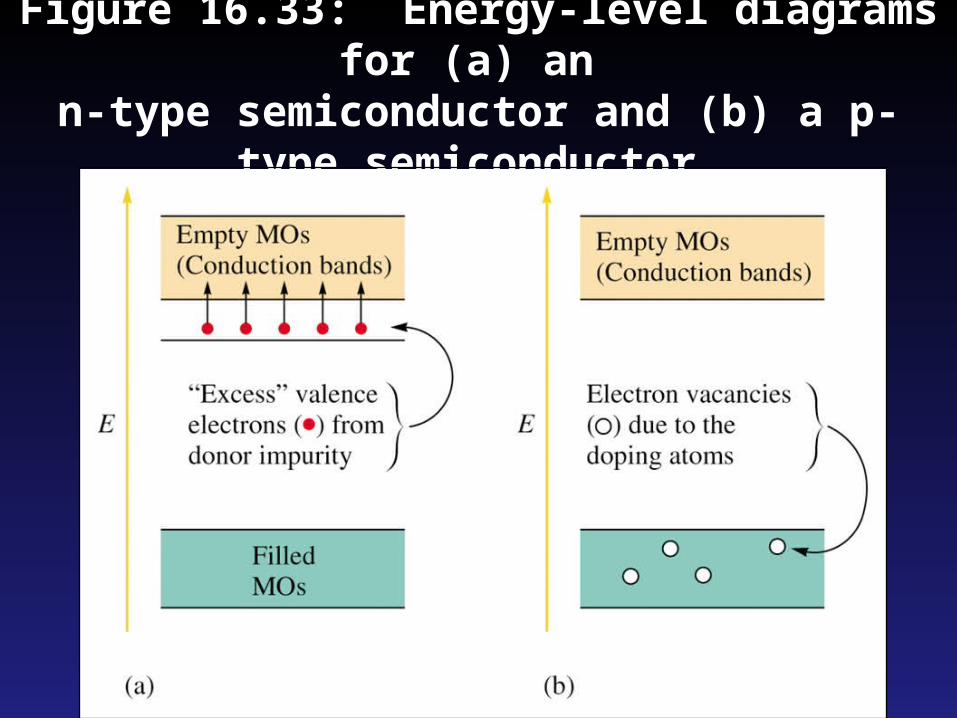
Figure 16.33: Energy-level diagrams for (a) an
n-type semiconductor and (b) a p-type semiconductor.
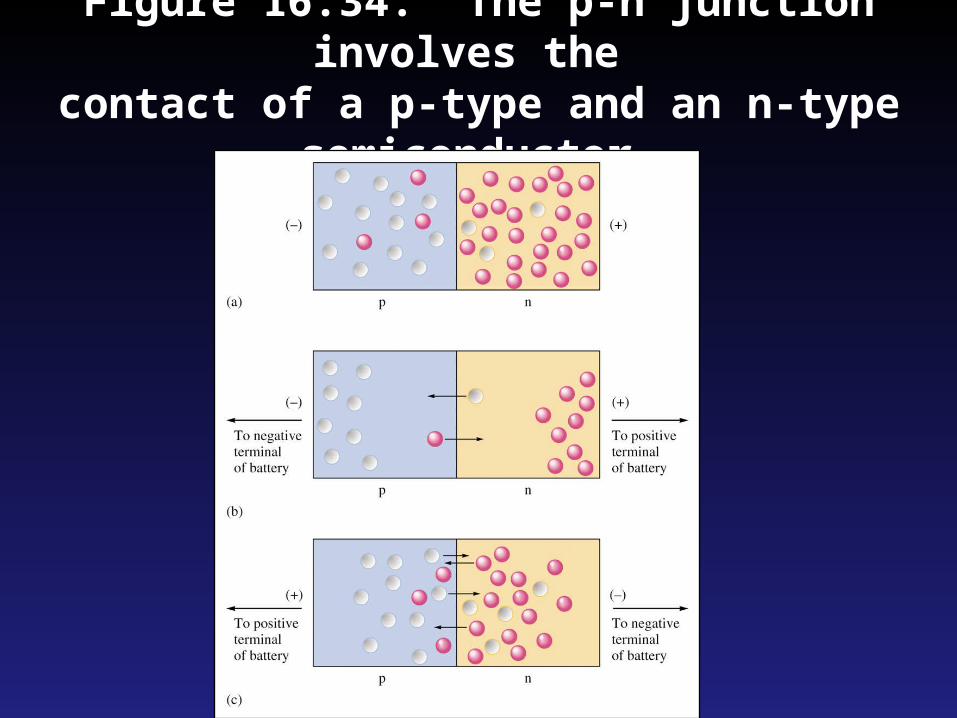
Figure 16.34: The p-n junction involves the contact of a p-type and an n-type
semiconductor.
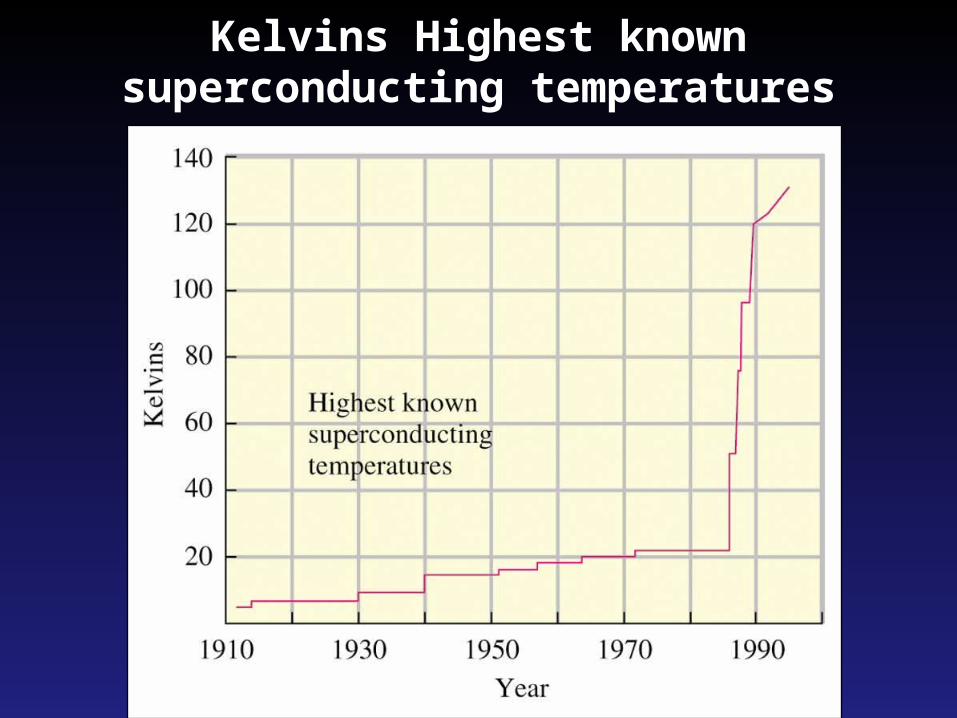
Kelvins Highest knownsuperconducting temperatures
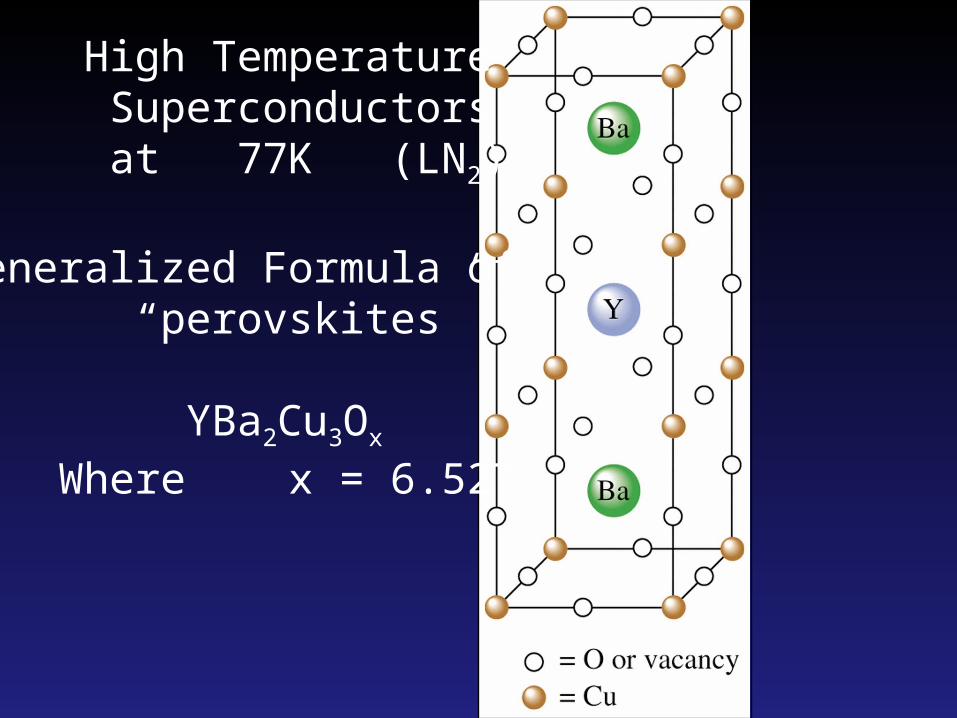
High Temperature Superconductors at 77K (LN2)
Generalized Formula of “perovskites”
YBa2Cu3Ox
Where x = 6.527
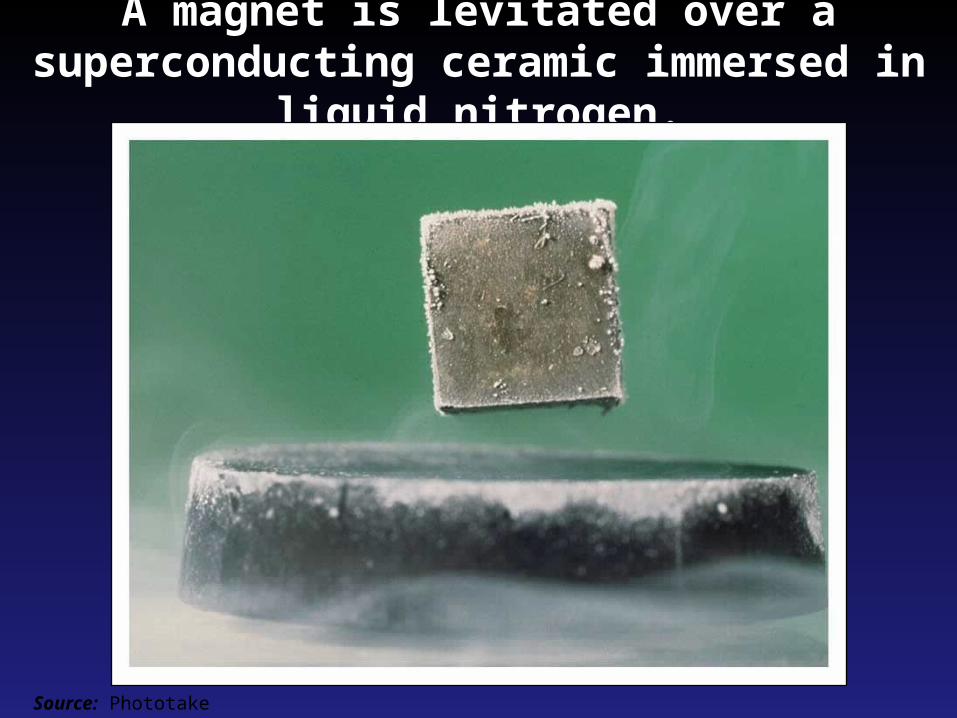
A magnet is levitated over a superconducting ceramic immersed in liquid nitrogen.
Source: Phototake
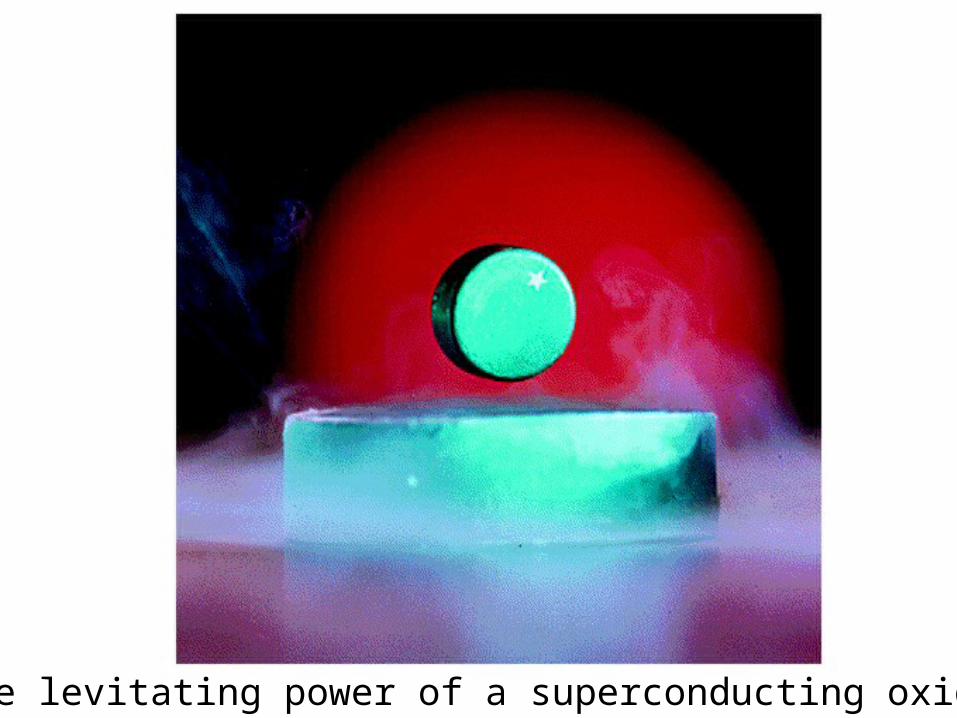
The levitating power of a superconducting oxide
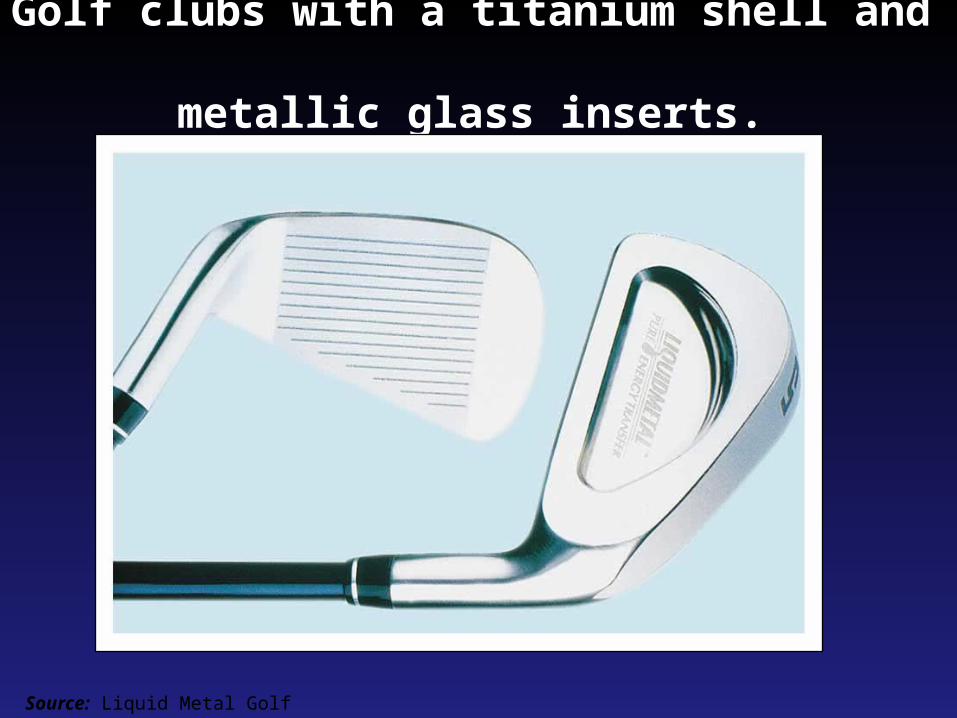
Golf clubs with a titanium shell and metallic glass inserts.
Source: Liquid Metal Golf
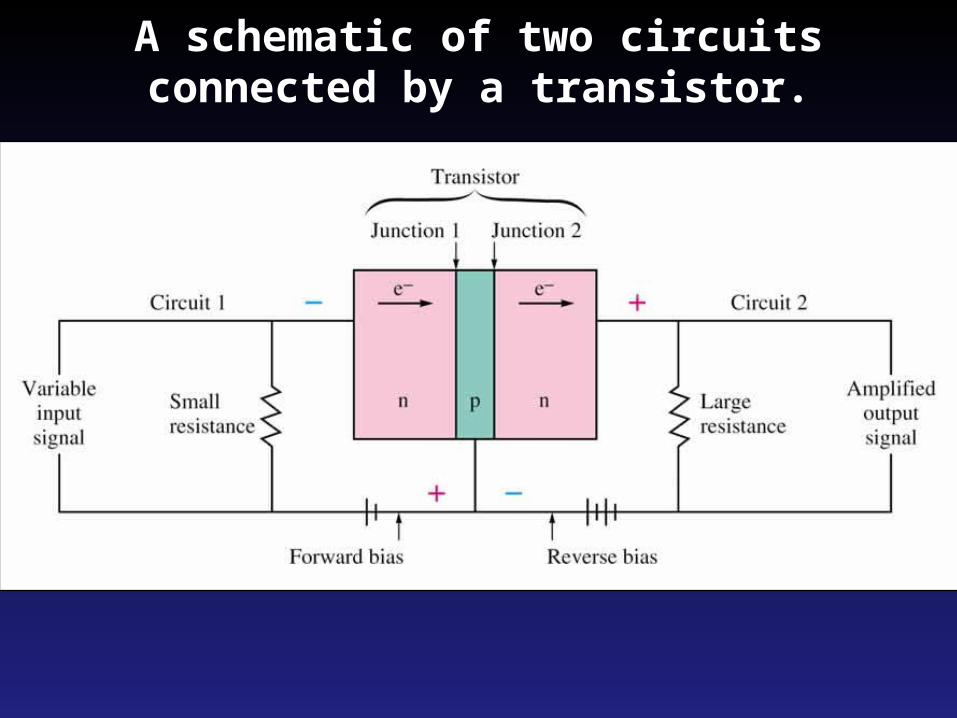
A schematic of two circuitsconnected by a transistor.
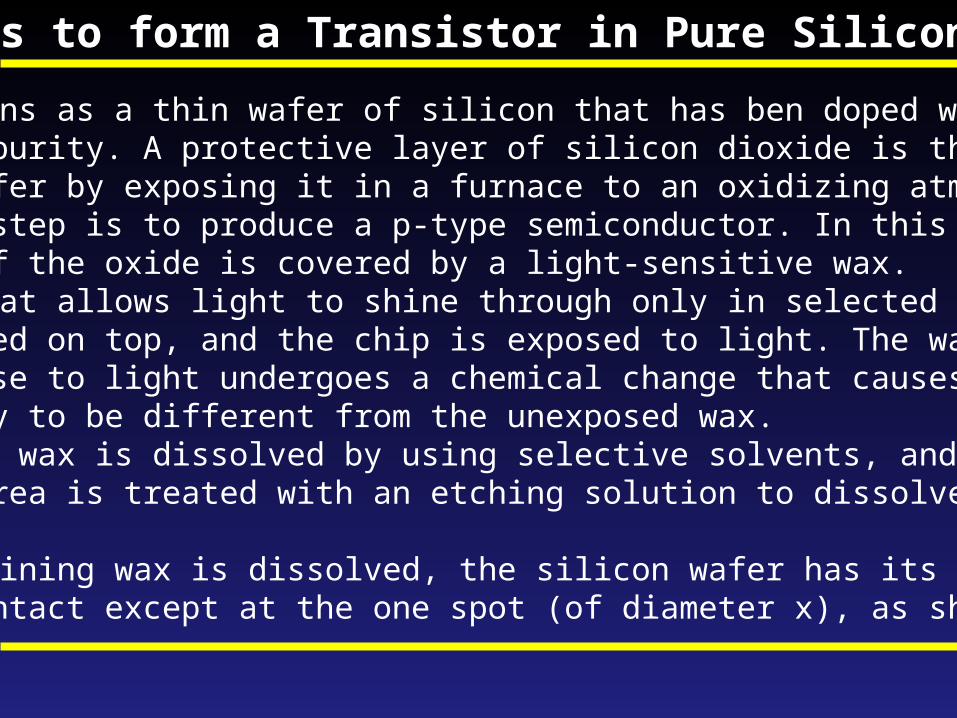
Steps to form a Transistor in Pure Silicon - I
a) The chip begins as a thin wafer of silicon that has ben doped with an n-type impurity. A protective layer of silicon dioxide is then produced on the wafer by exposing it in a furnace to an oxidizing atmosphere. The next step is to produce a p-type semiconductor. In this step the surface of the oxide is covered by a light-sensitive wax.b) A template that allows light to shine through only in selected areas is then placed on top, and the chip is exposed to light. The wax that has been expose to light undergoes a chemical change that causes its solubility to be different from the unexposed wax. c) The unexposed wax is dissolved by using selective solvents, and the exposed area is treated with an etching solution to dissolve the oxide coating.d) When the remaining wax is dissolved, the silicon wafer has its oxide coating intact except at the one spot (of diameter x), as shown.
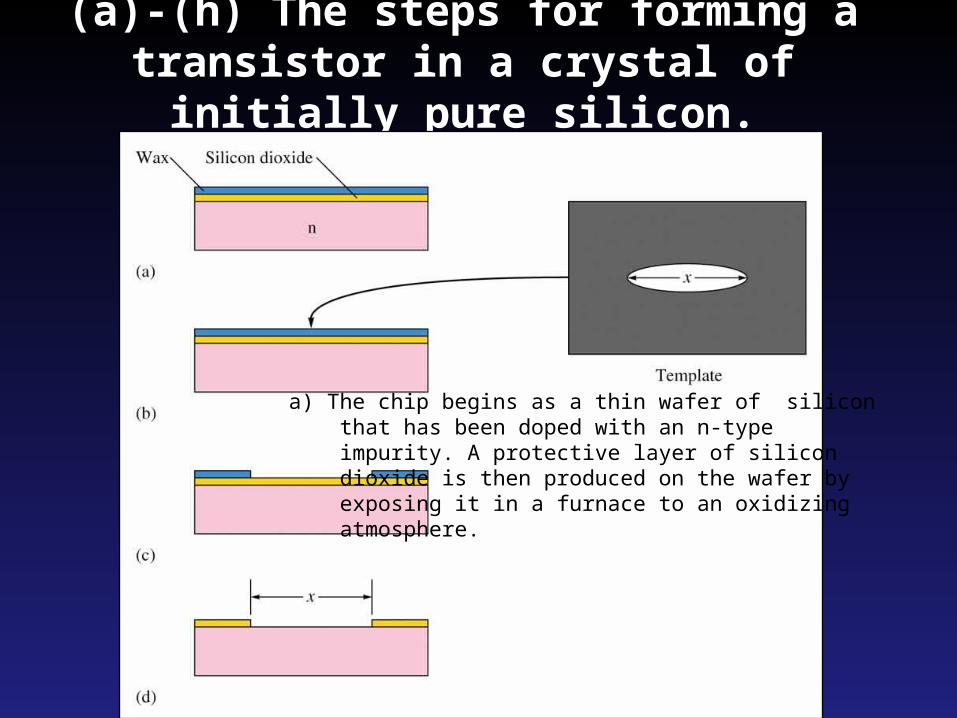
(a)-(h) The steps for forming a transistor in a crystal of initially pure silicon.
a) The chip begins as a thin wafer of silicon that has been doped with an n-type impurity. A protective layer of silicon dioxide is then produced on the wafer by exposing it in a furnace to an oxidizing atmosphere.
Steps to form a Transistor in Pure Silicon - II
e) Exposing the wafer to a p-type impurity such as boron at about 1000oC causes a p-type semiconductor area to be formed in the exposed spot as the boron atoms diffuse into the silicon crystal.f) For the formation of a small n-type area in the center of the p-type region, the wafer is again placed in the oxidizing furnace to be recoated over its entire surface with oxide. Then a new wax covering is applied, which is illuminated through a template with a transparent area indicated by part y in the template.g) The wax and oxide are then removed from the illuminated area, and the wafer is exposed to an n-type impurity to form a small n-type region, as shown. h) Finally conductors are layered onto the chip, giving the finished transistor, ehich has two circuits connected through an n-p-n junction. This transistor then becomes a part of a larger circuit layered onto the chip and interconnected by conductors.
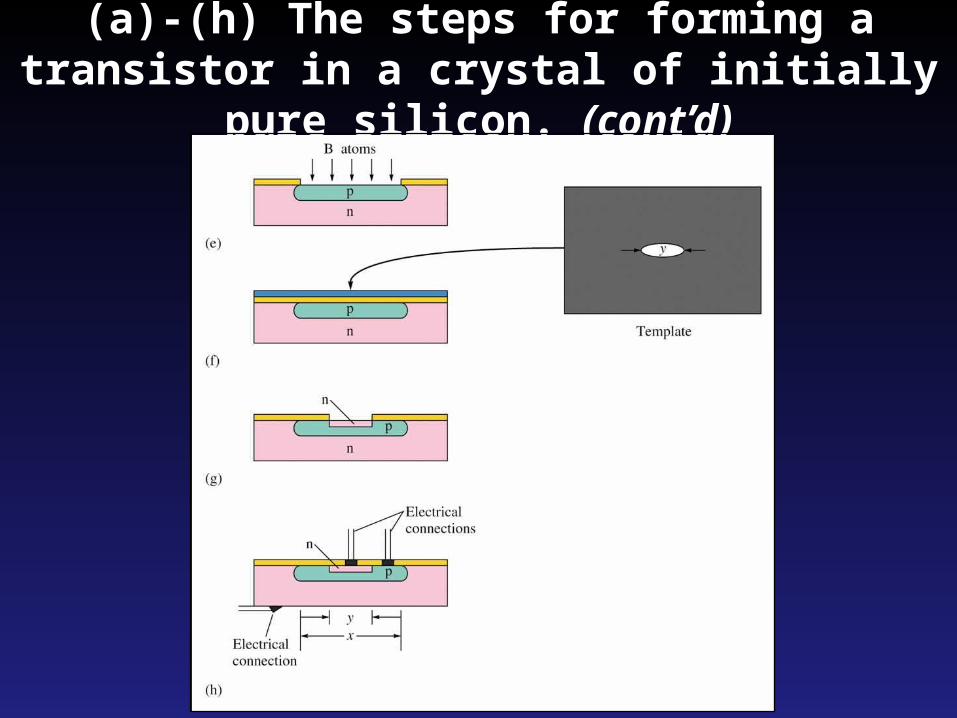
(a)-(h) The steps for forming a transistor in a crystal of initially pure silicon. (cont’d)
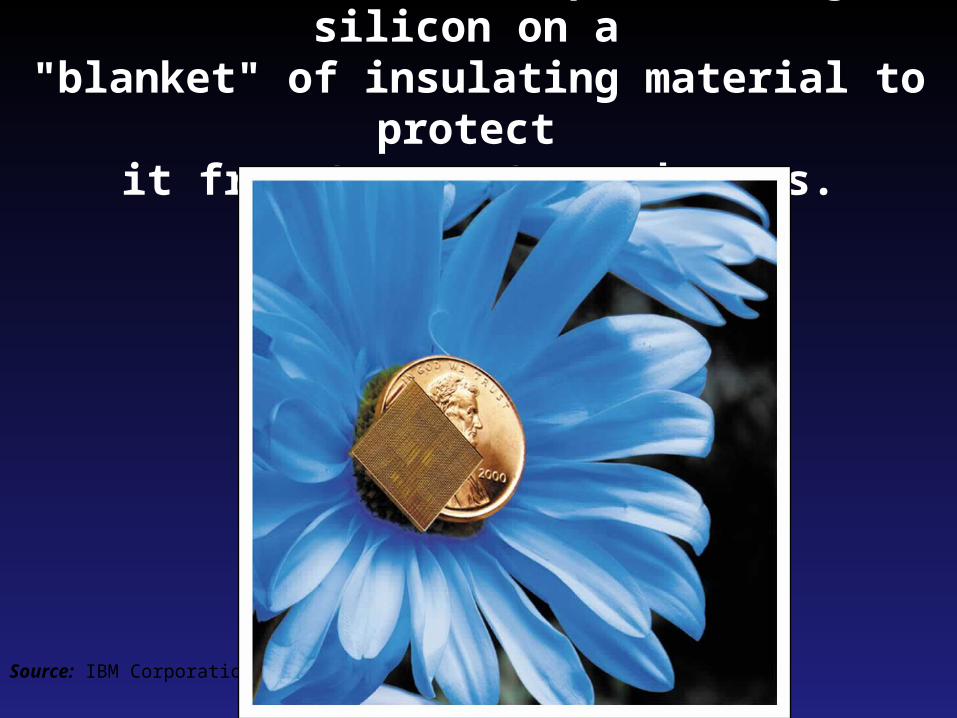
A new IBM microchip featuring silicon on a "blanket" of insulating material to protect
it from temperature changes.
Source: IBM Corporation
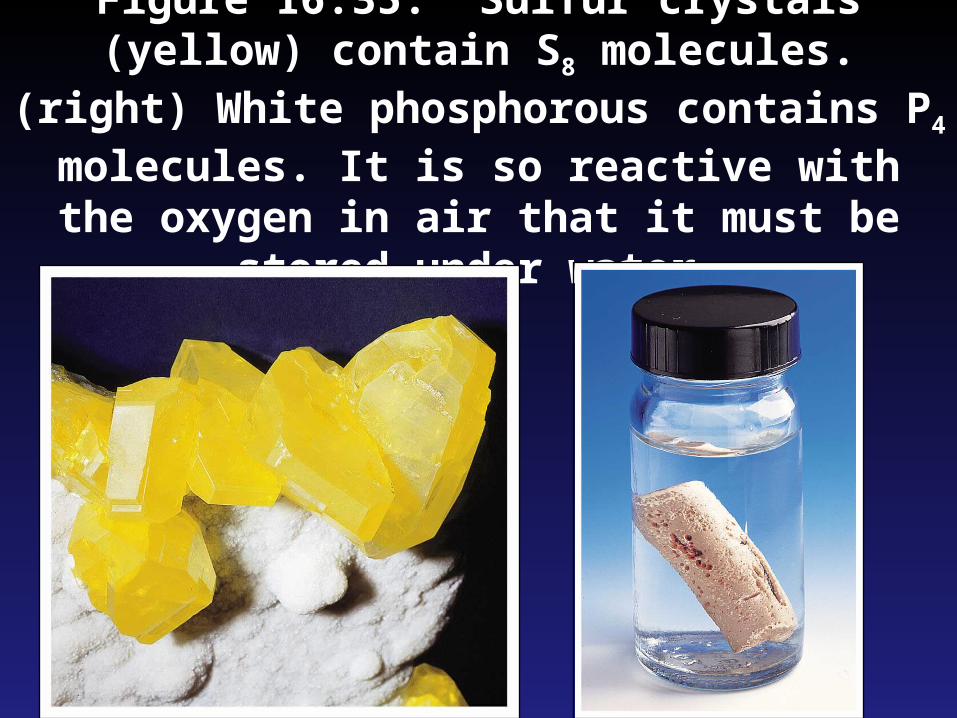
Figure 16.35: Sulfur crystals (yellow) contain S8 molecules. (right) White phosphorous
contains P4 molecules. It is so reactive with the oxygen in air that it must be stored under
water.
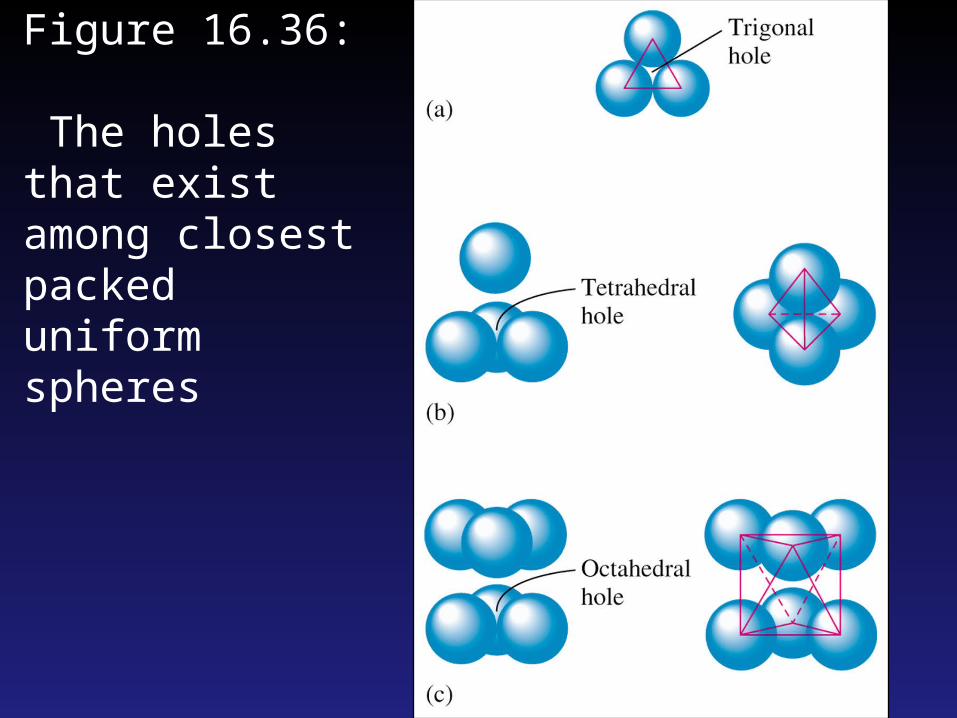
Figure 16.36: The holes that exist among closest packed uniform spheres
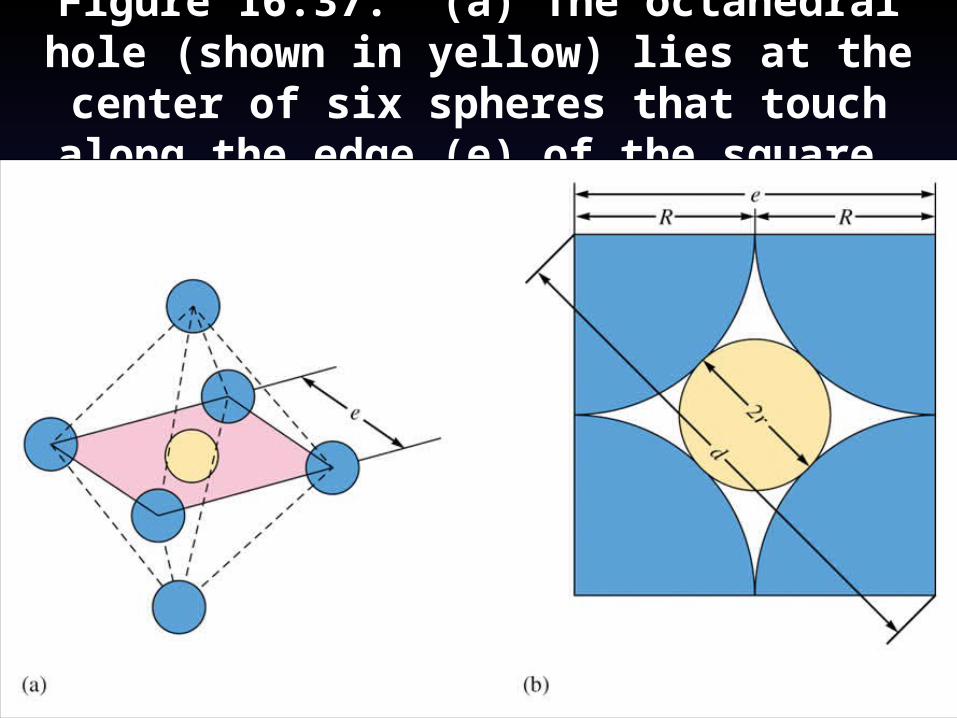
Figure 16.37: (a) The octahedral hole (shown in yellow) lies at the center of six spheres that
touch along the edge (e) of the square.
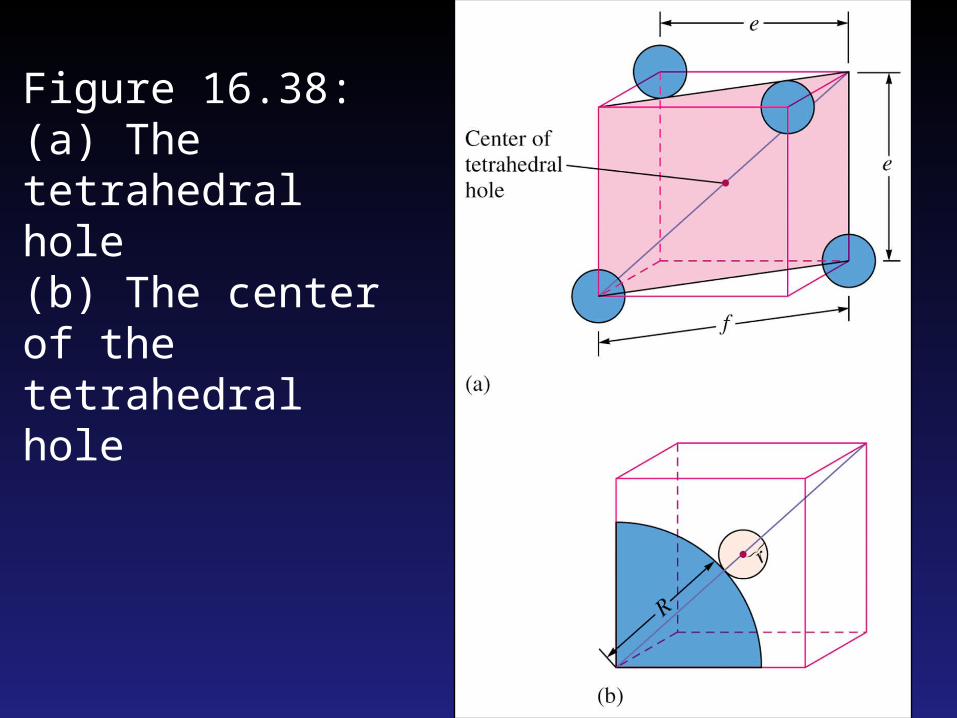
Figure 16.38: (a) The tetrahedral hole (b) The center of the tetrahedral hole
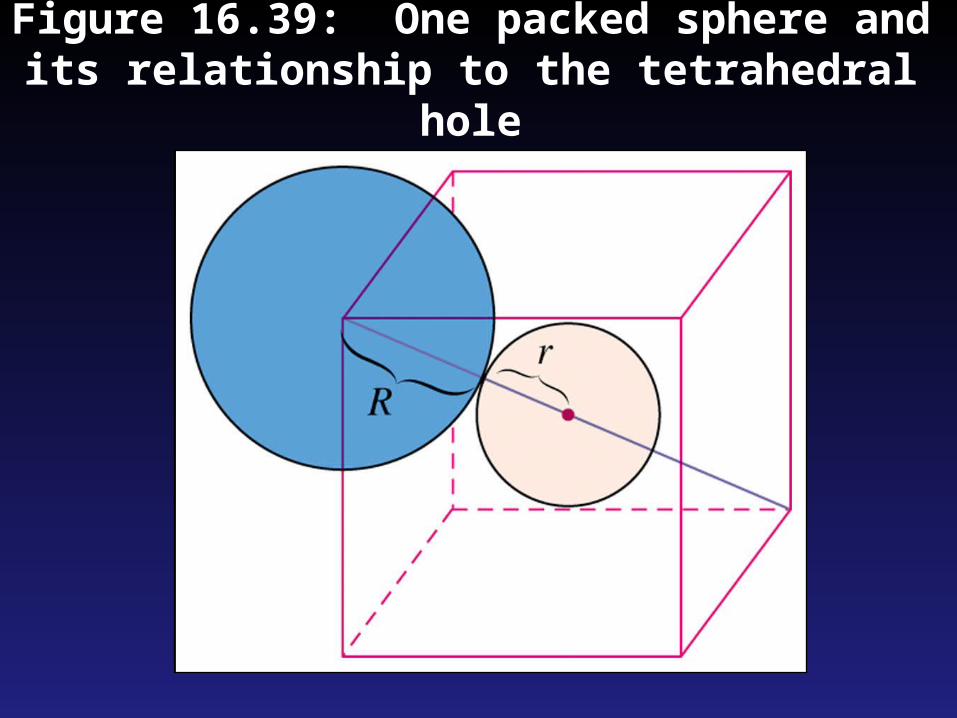
Figure 16.39: One packed sphere and its relationship to the tetrahedral hole
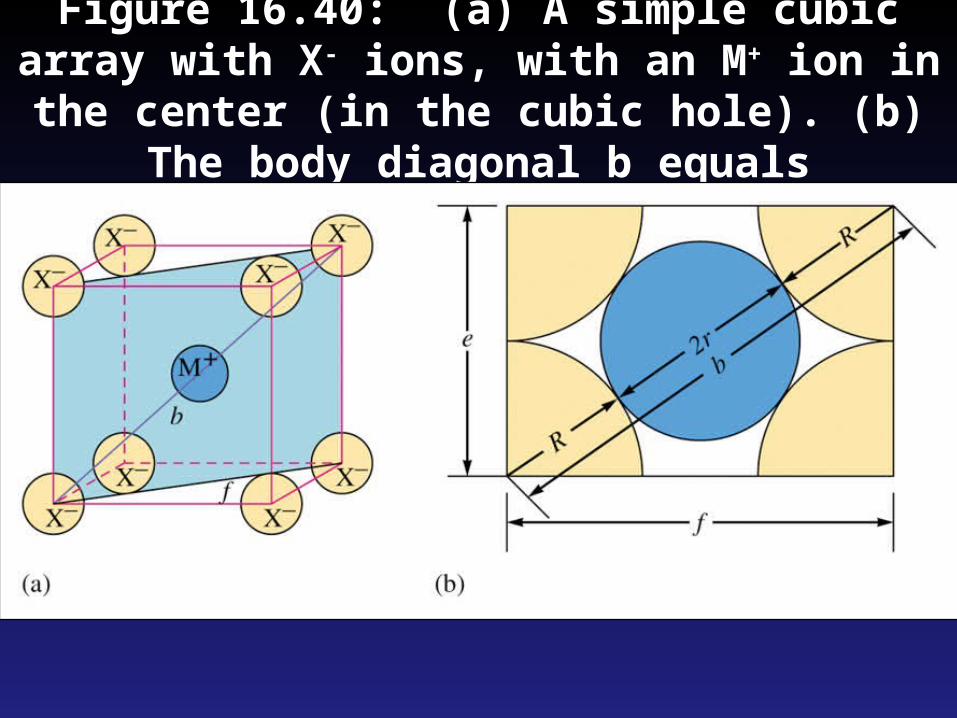
Figure 16.40: (a) A simple cubic array with X- ions, with an M+ ion in the center (in the cubic
hole). (b) The body diagonal b equals

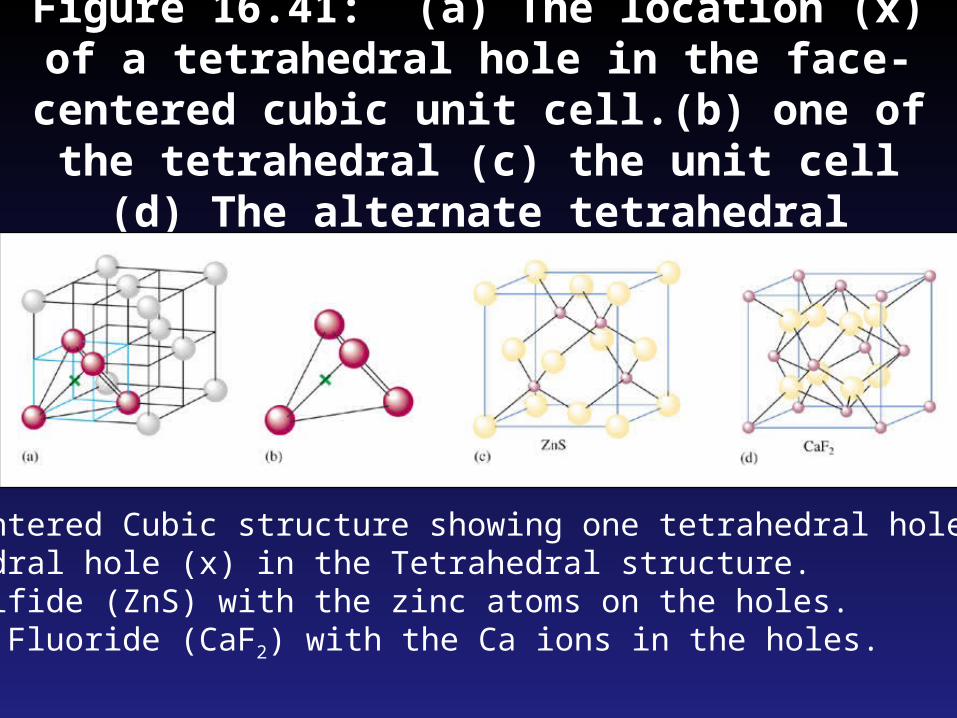
Figure 16.41: (a) The location (x) of a tetrahedral hole in the face-centered cubic
unit cell.(b) one of the tetrahedral (c) the unit cell (d) The alternate tetrahedral
a) Face Centered Cubic structure showing one tetrahedral hole location.b) Tetrahedral hole (x) in the Tetrahedral structure.c) Zinc Sulfide (ZnS) with the zinc atoms on the holes.d) Calcium Fluoride (CaF2) with the Ca ions in the holes.
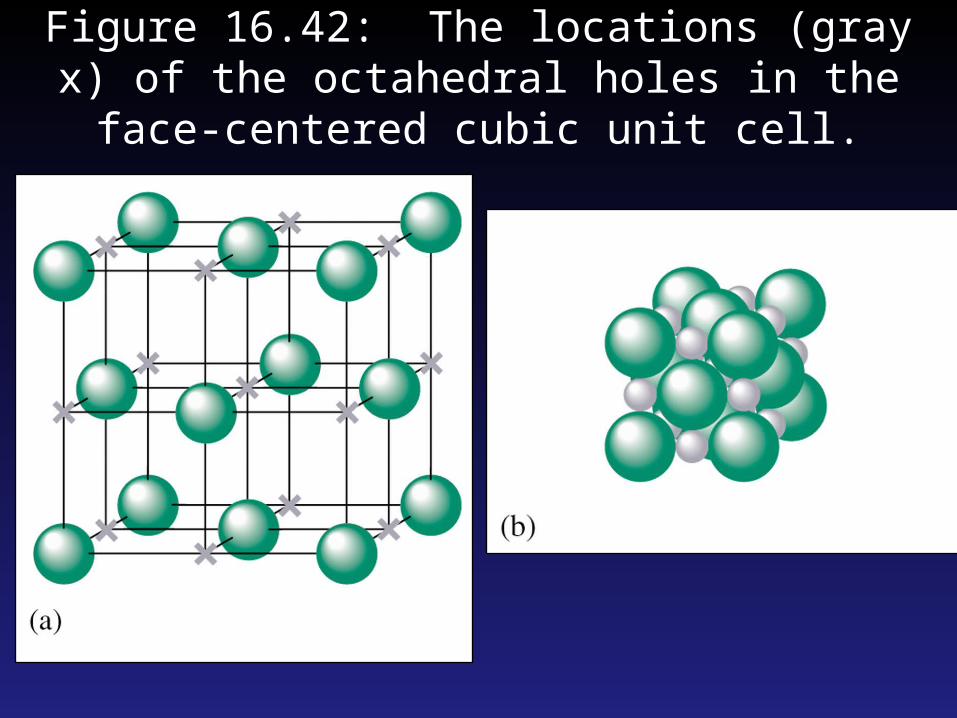
Figure 16.42: The locations (gray x) of the octahedral holes in the face-centered cubic unit
cell.
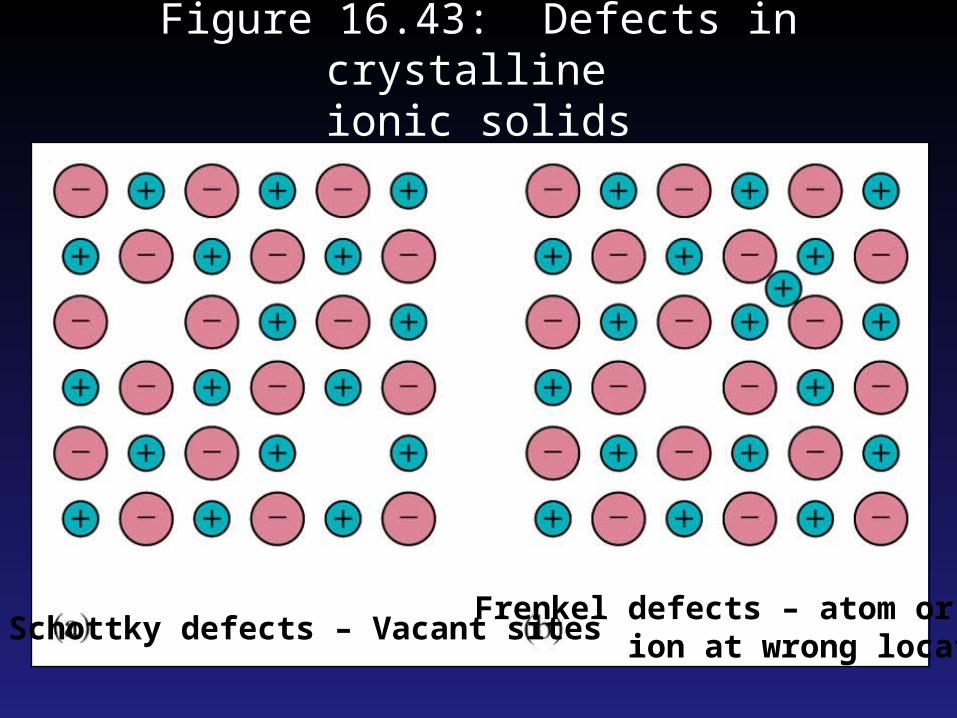
Figure 16.43: Defects in crystalline ionic solids
Schottky defects – Vacant sitesFrenkel defects – atom or ion at wrong location
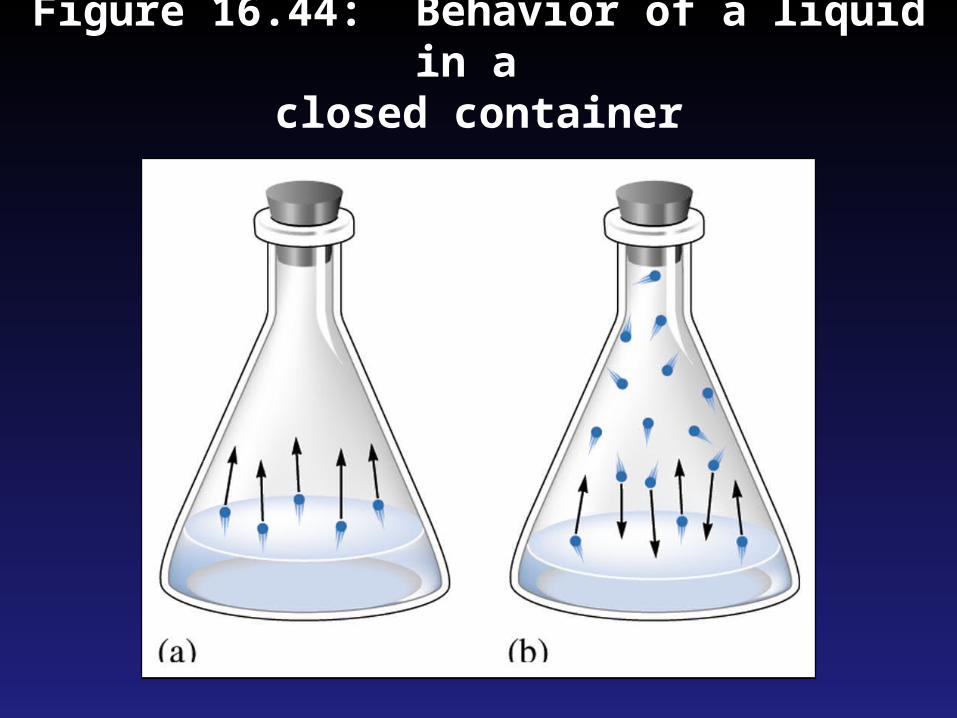
Figure 16.44: Behavior of a liquid in a closed container
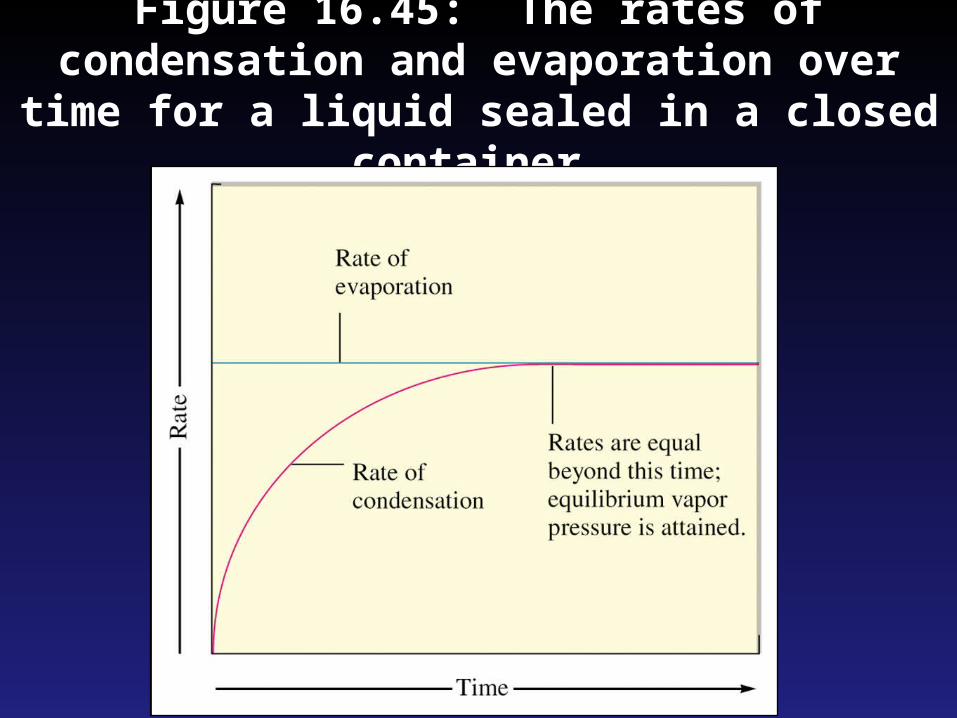
Figure 16.45: The rates of condensation and evaporation over time for a liquid sealed in a
closed container.
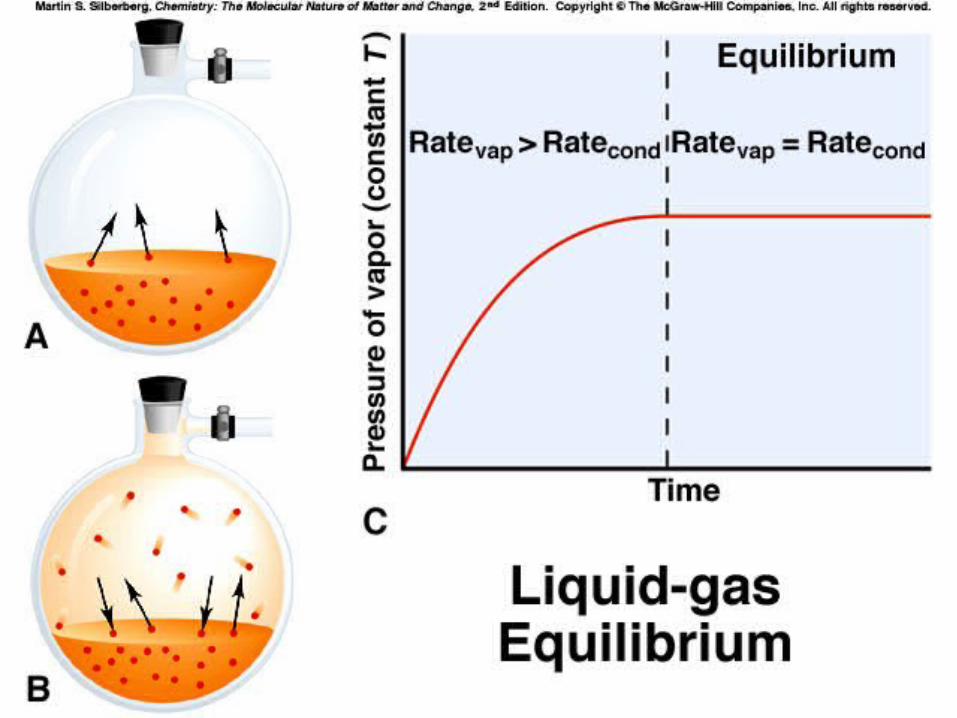
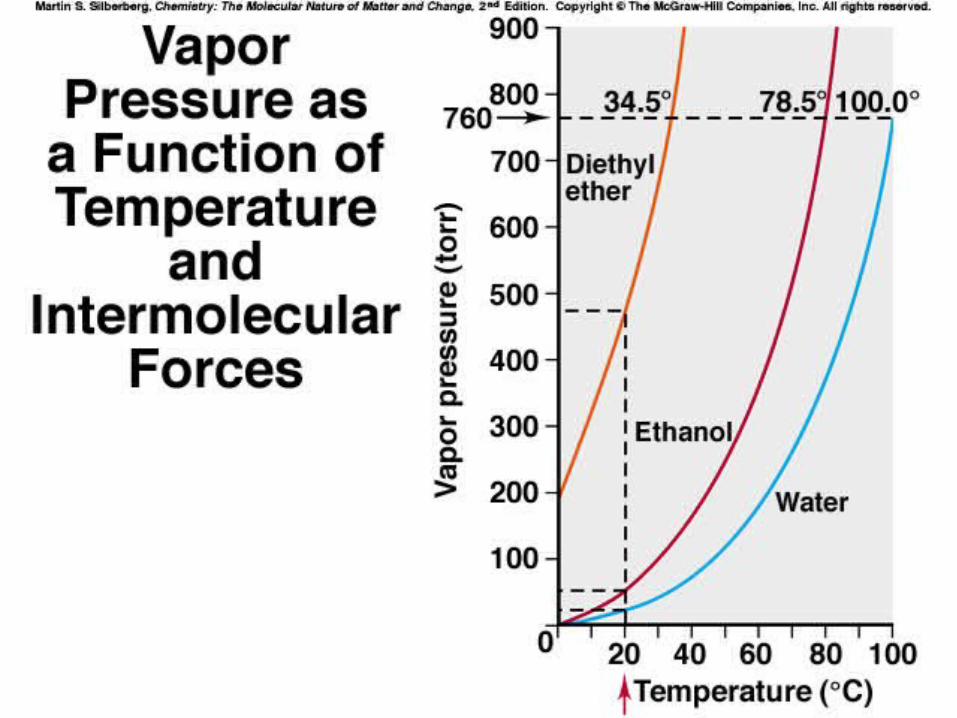
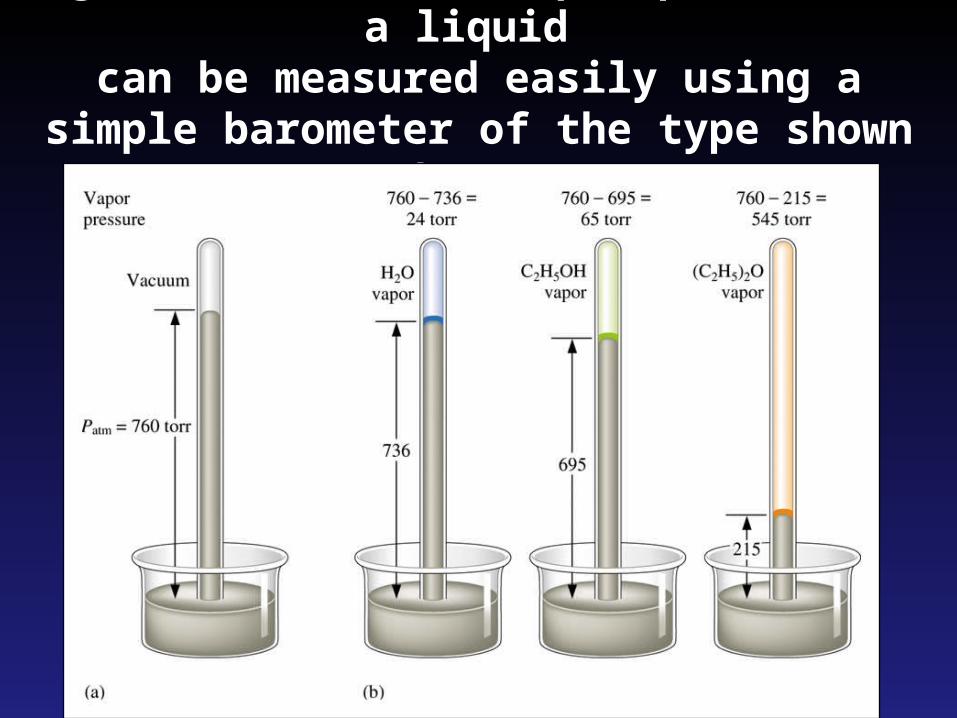
Figure 16.46: The vapor pressure of a liquid can be measured easily using a simple
barometer of the type shown here.
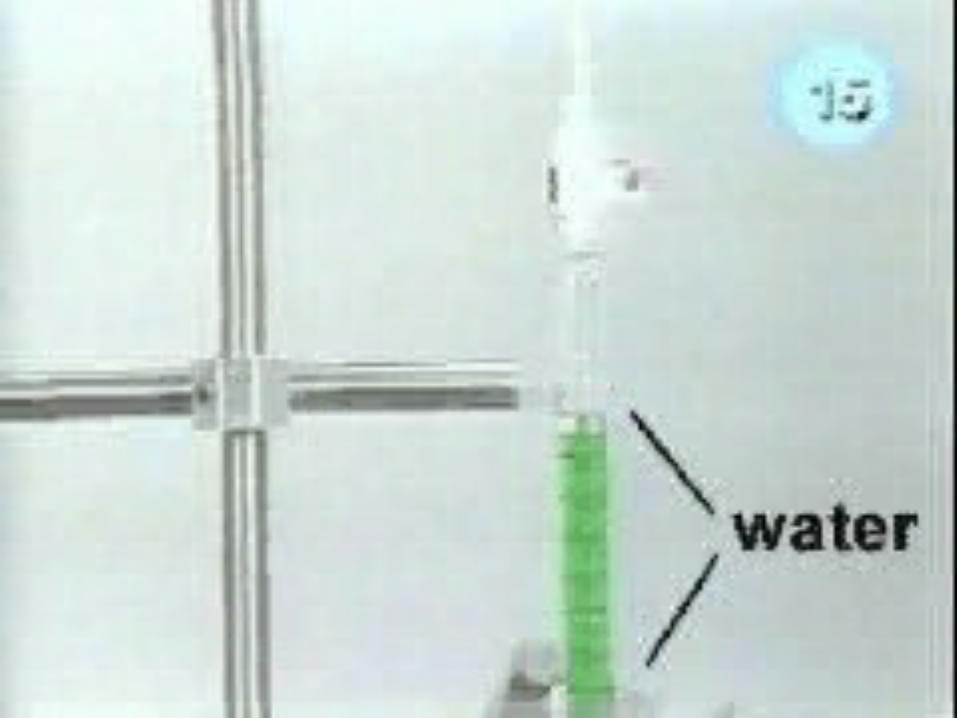
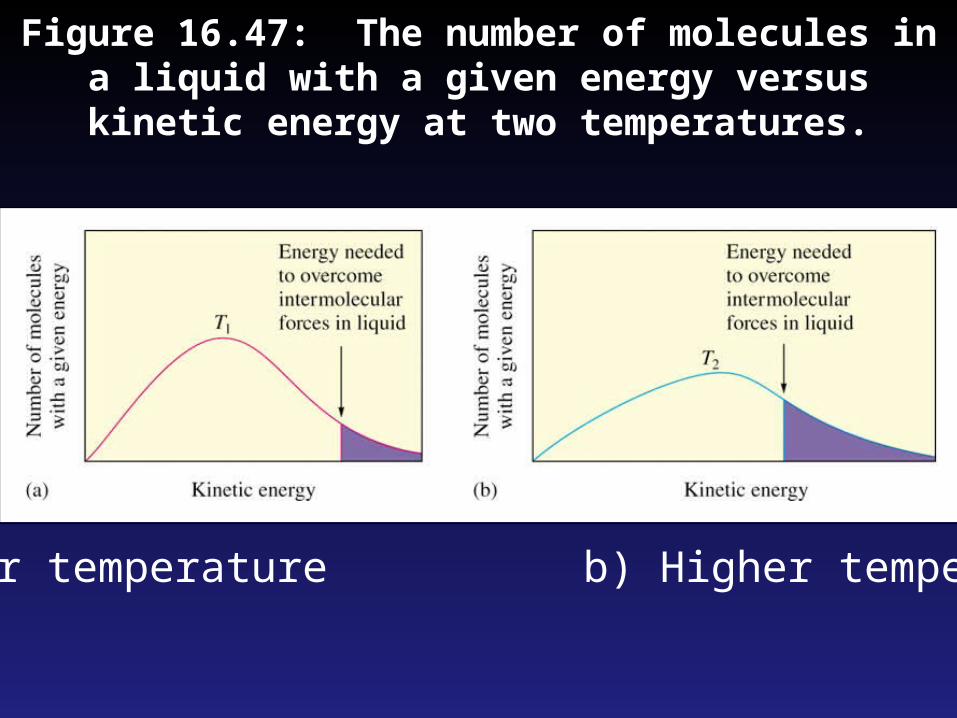
Figure 16.47: The number of molecules in a liquid with a given energy versus kinetic energy at two
temperatures.
a) Lower temperature b) Higher temperature
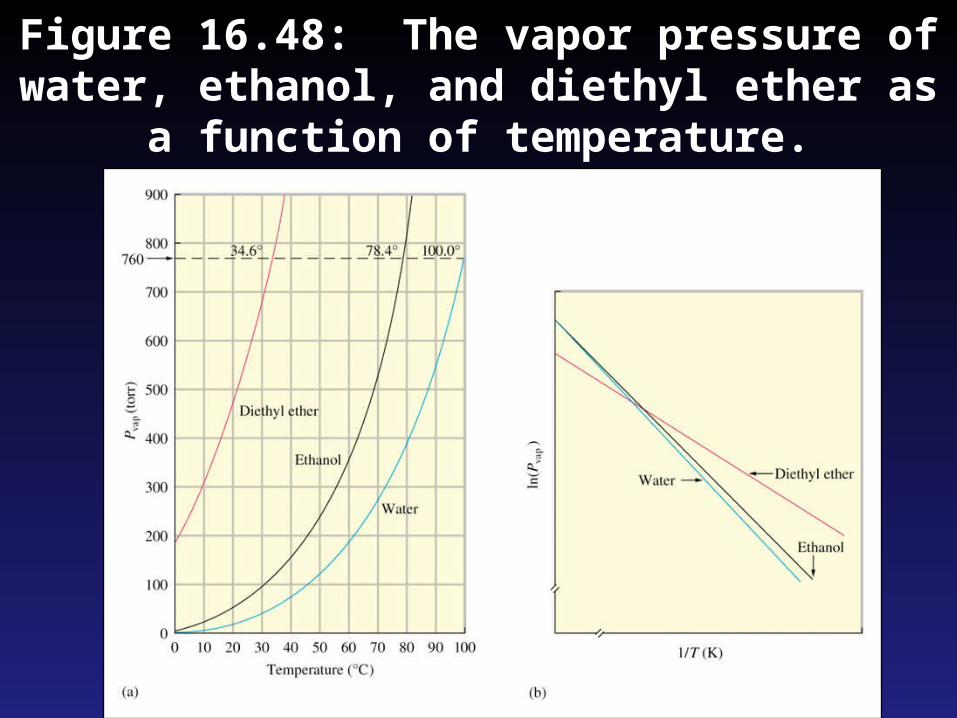
Figure 16.48: The vapor pressure of water, ethanol, and diethyl ether as a function of
temperature.
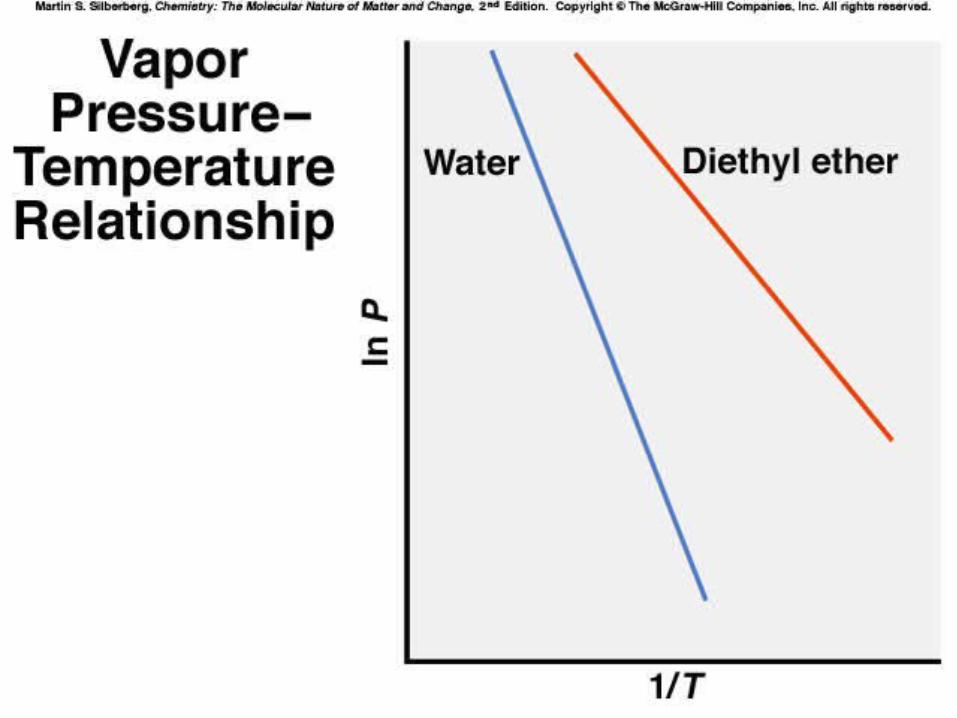
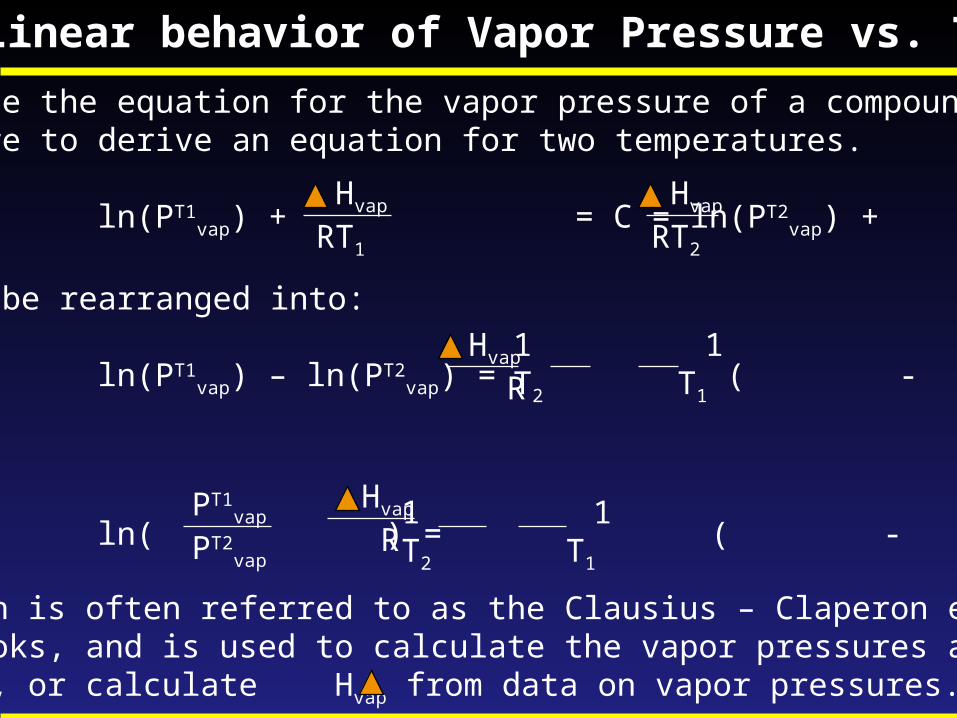
The Linear behavior of Vapor Pressure vs. Temp!
We will use the equation for the vapor pressure of a compound vs. temperature to derive an equation for two temperatures.
ln(PT1vap) + = C = ln(PT2
vap) +
Which can be rearranged into:
ln(PT1vap) – ln(PT2
vap) = ( - )
Or:
ln( ) = ( - )
Hvap
RT1
Hvap
RT2
Hvap
R1 1T2 T1
PT1vap
PT2vap
Hvap
R1 1T2 T1
This equation is often referred to as the Clausius – Claperon equation inmost text books, and is used to calculate the vapor pressures at differentTemperatures, or calculate Hvap from data on vapor pressures.
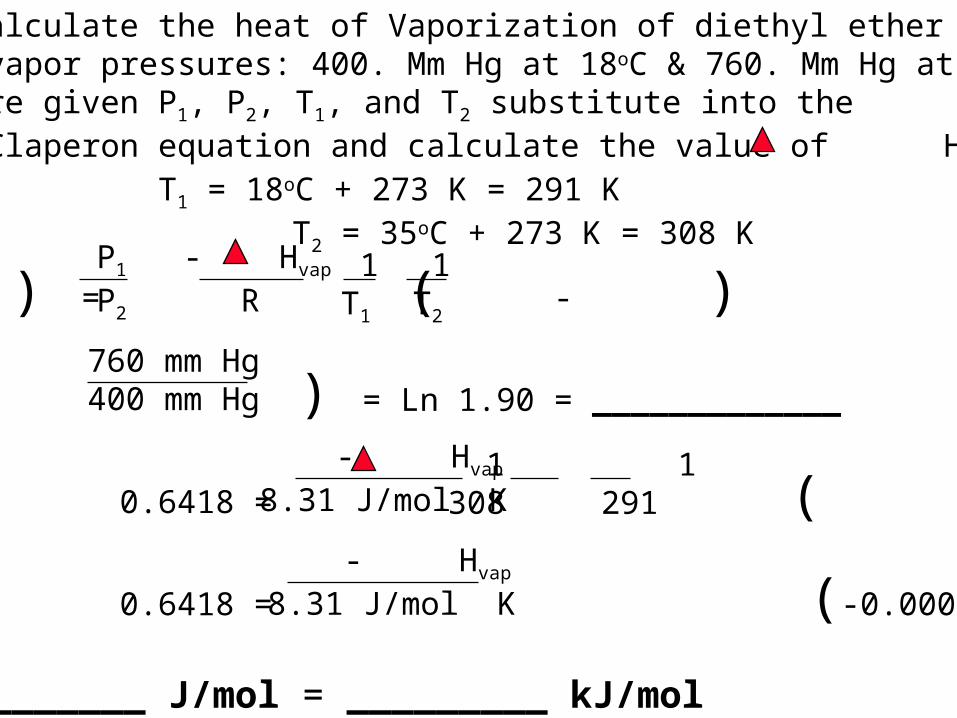
Problem: Calculate the heat of Vaporization of diethyl ether From the following vapor pressures: 400. Mm Hg at 18oC & 760. Mm Hg at 35oCPlan: We are given P1, P2, T1, and T2 substitute into the Clausious-Claperon equation and calculate the value of Hvap !Solution: T1 = 18oC + 273 K = 291 K T2 = 35oC + 273 K = 308 K
Ln ( ) = ( - )
Ln ( ) = Ln 1.90 = _____________
0.6418 = ( - )
0.6418 = (-0.00019 K) Hvap = __________ J/mol = _________ kJ/mol
P1
P2
- Hvap
R 1T1
1T2
760 mm Hg400 mm Hg
- Hvap
8.31 J/mol K 1 1308 291
- Hvap
8.31 J/mol K
100.0 760.0
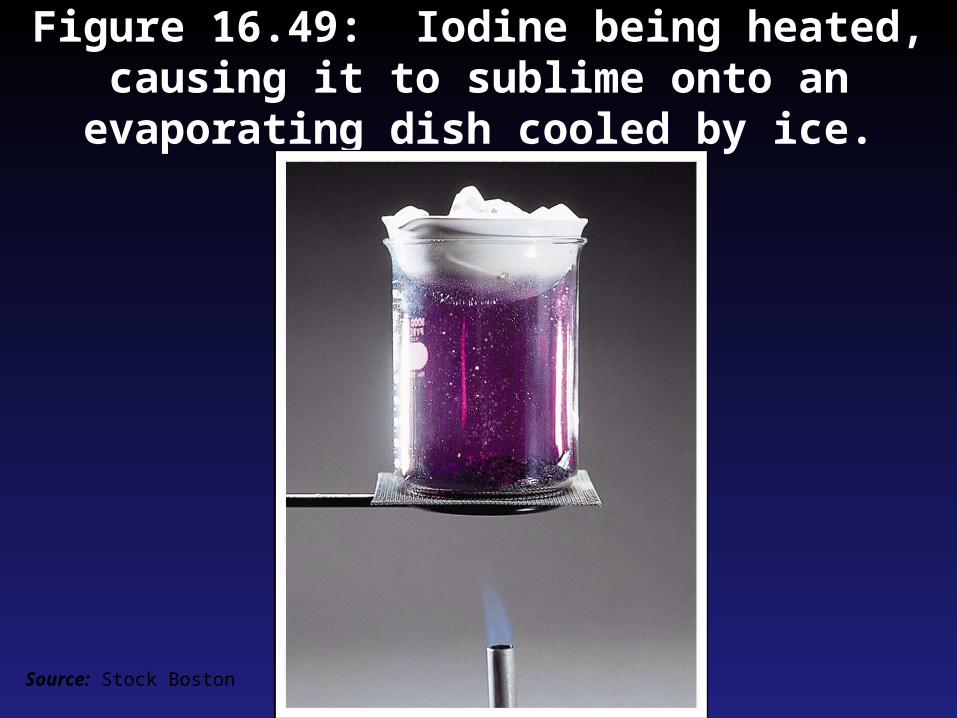
Figure 16.49: Iodine being heated, causing it to sublime onto an evaporating dish cooled
by ice.
Source: Stock Boston
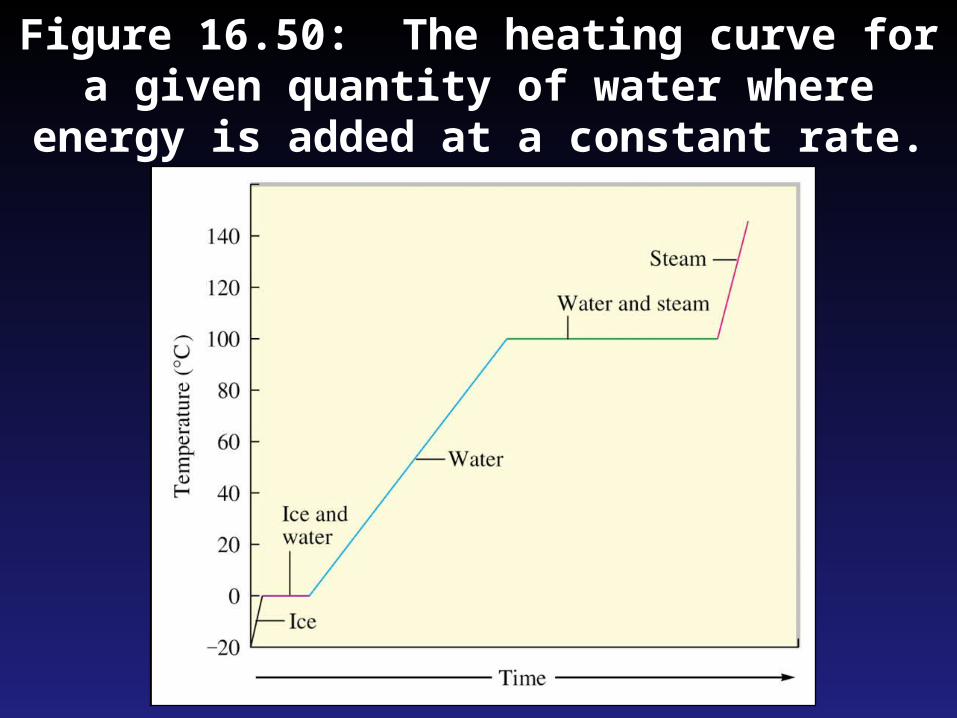
Figure 16.50: The heating curve for a given quantity of water where energy is added at a
constant rate.
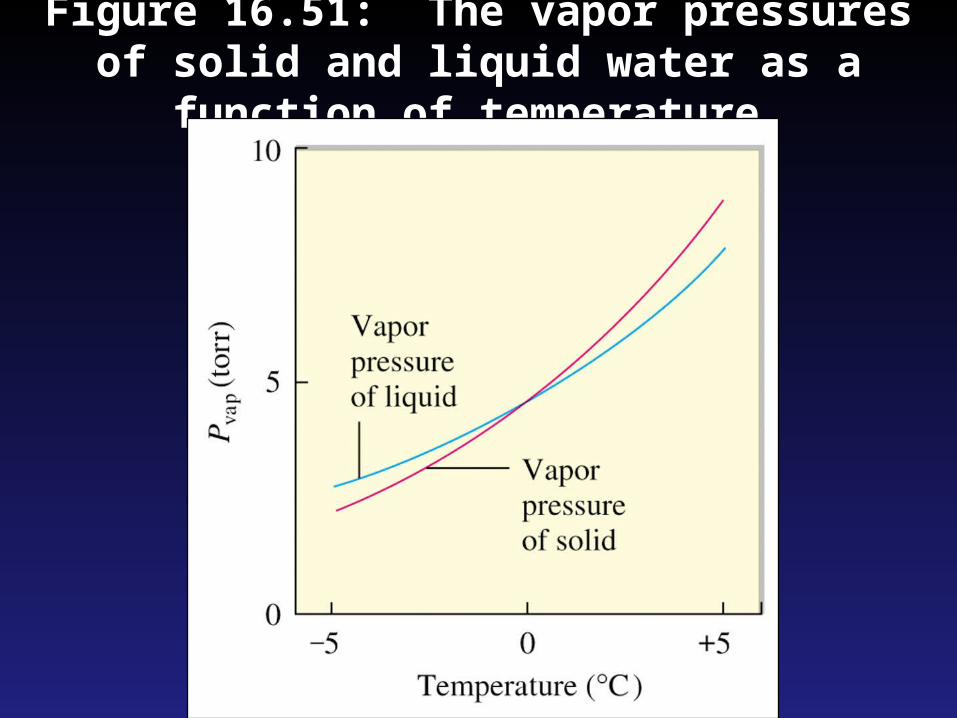
Figure 16.51: The vapor pressures of solid and liquid water as a function of temperature.
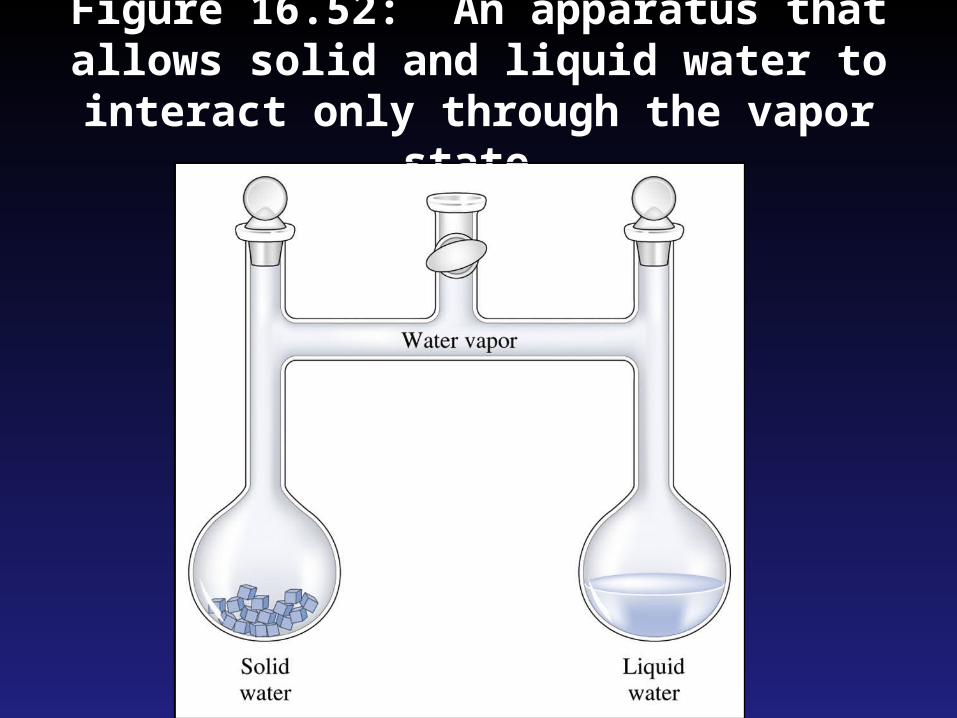
Figure 16.52: An apparatus that allows solid and liquid water to interact only through the
vapor state.

Figure 16.53: Water in a closed system with a pressure of 1 atm exerted on the piston.
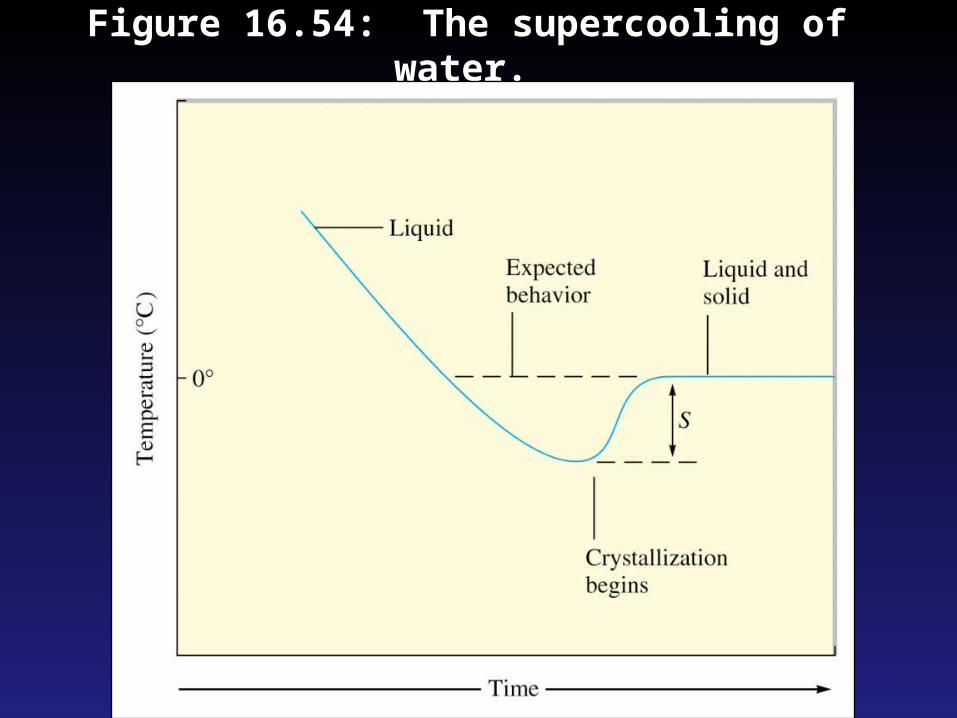
Figure 16.54: The supercooling of water.
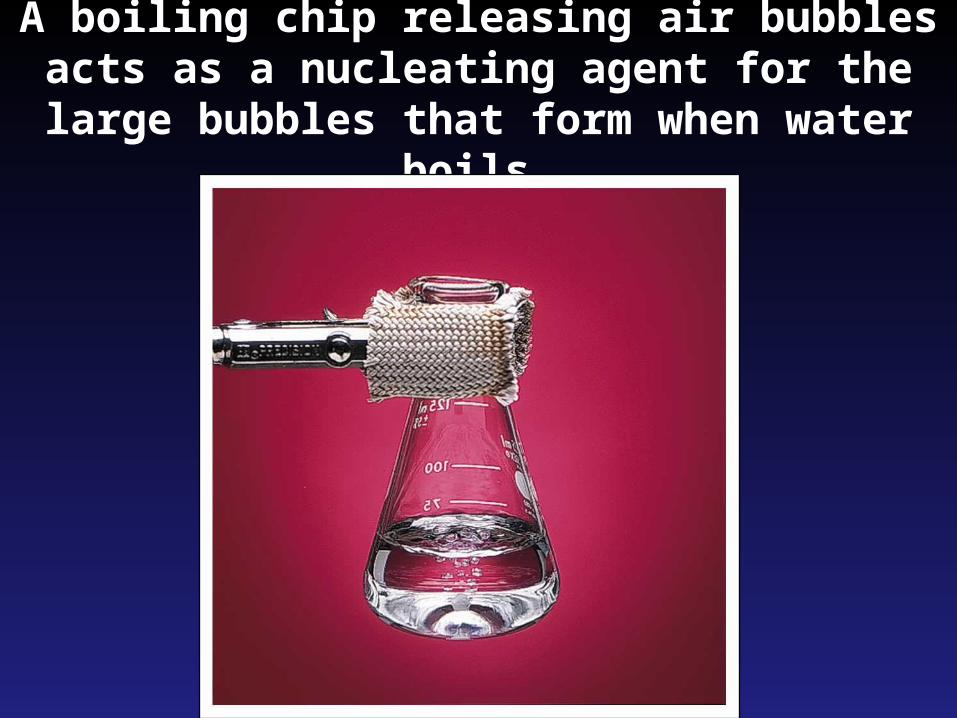
A boiling chip releasing air bubbles acts as a nucleating agent for the large bubbles that
form when water boils.
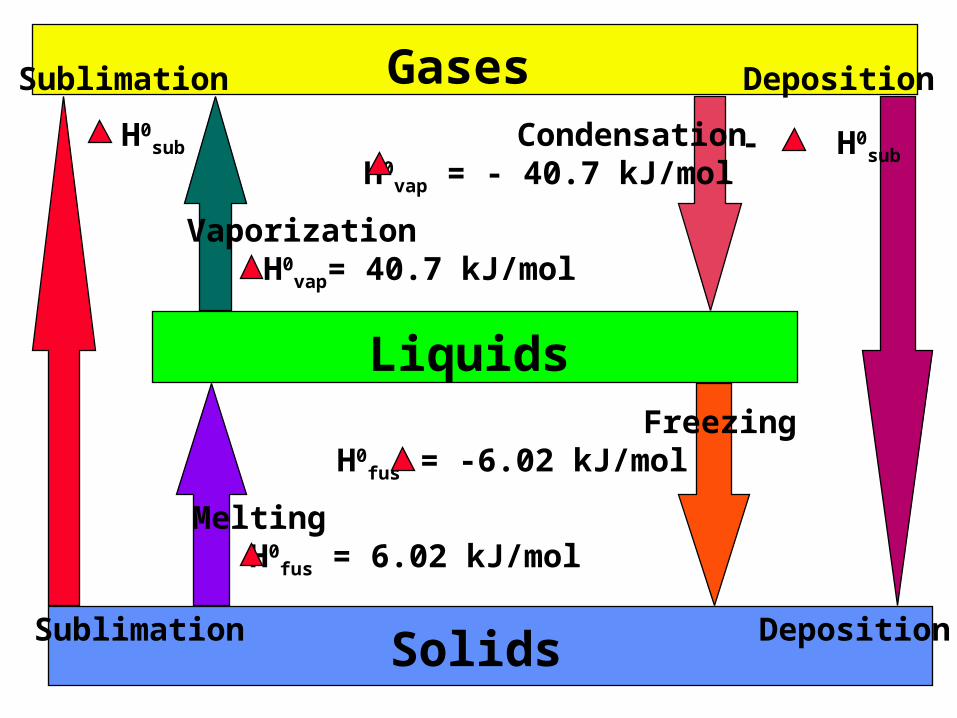
Gases
Liquids
Solids
Condensation H0
vap = - 40.7 kJ/mol
Vaporization H0
vap= 40.7 kJ/mol
Freezing H0
fus = -6.02 kJ/mol
Melting H0
fus = 6.02 kJ/mol
Sublimation Deposition
DepositionSublimation
- H0sub
H0sub
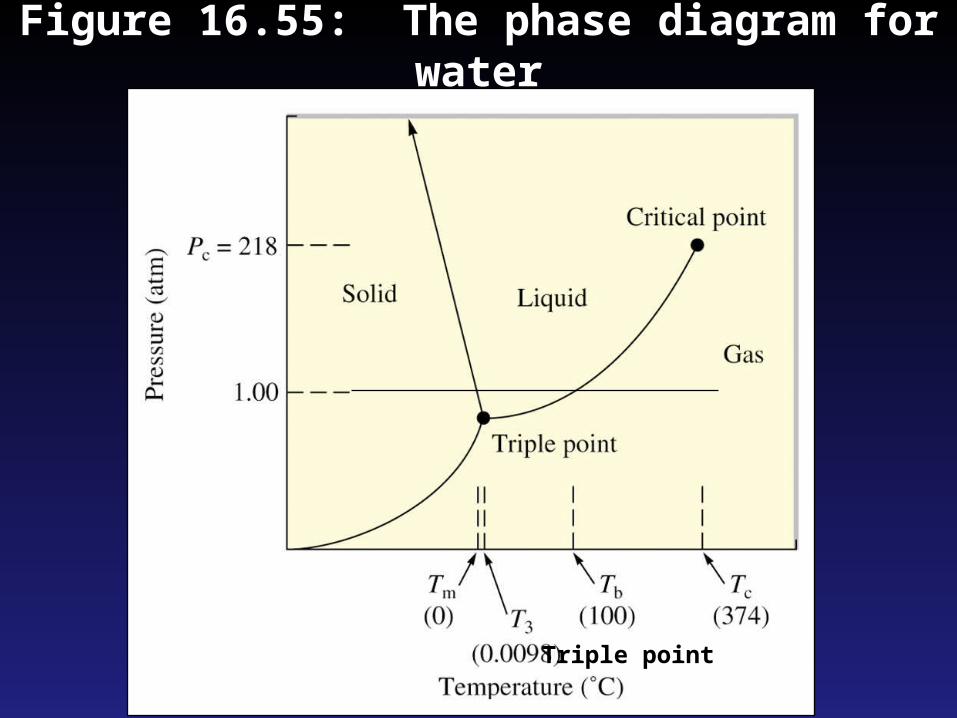
Figure 16.55: The phase diagram for water
Triple point
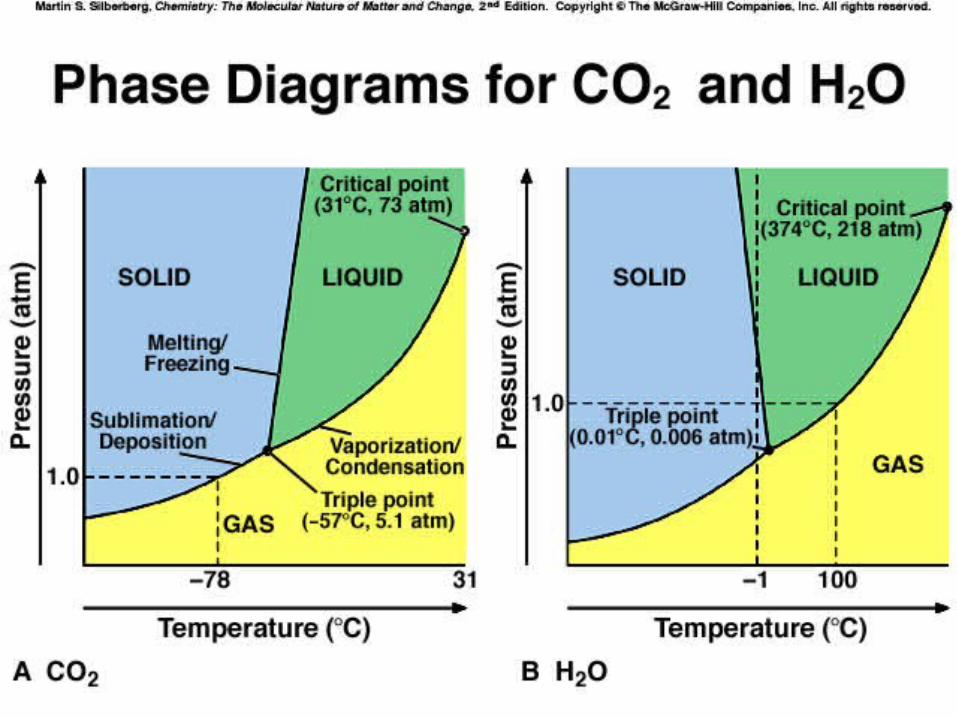
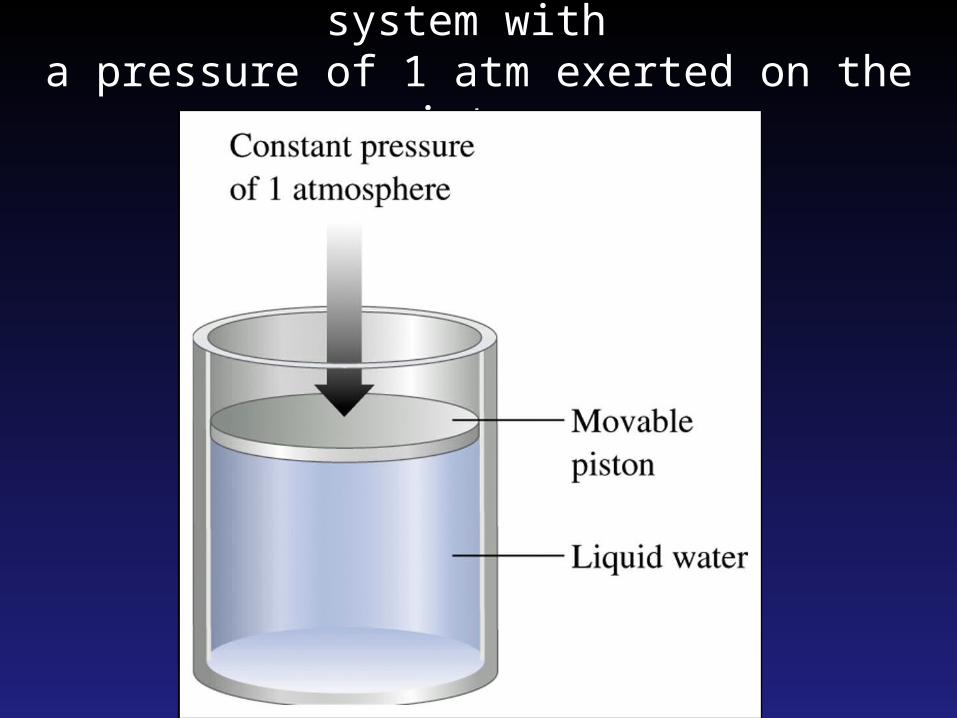
Figure 16.53: Water in a closed system with a pressure of 1 atm exerted on the piston.
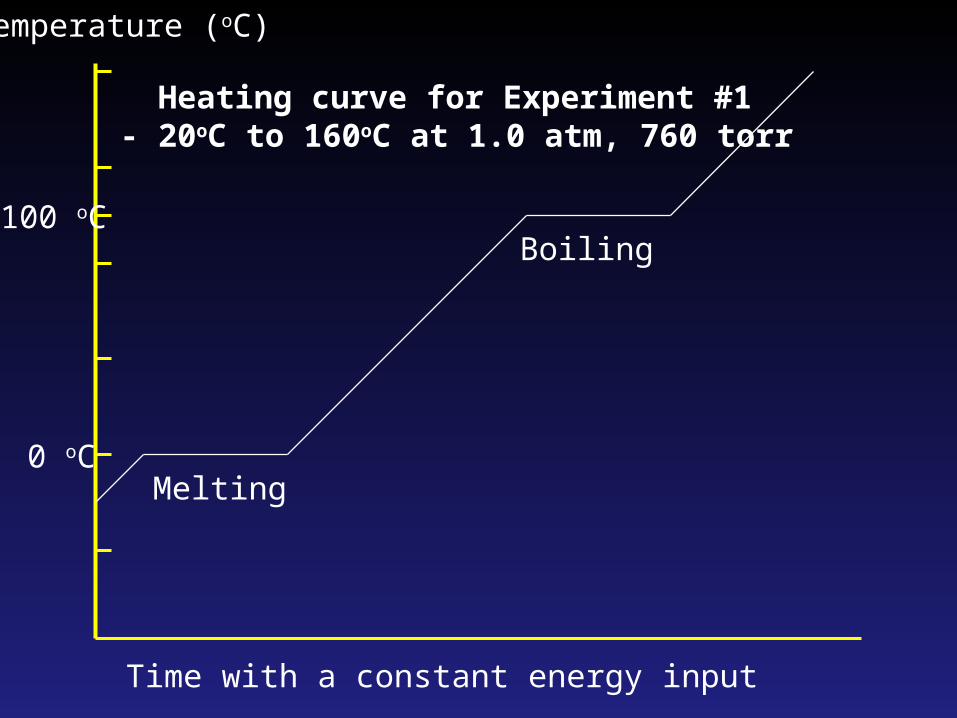
Time with a constant energy input
Temperature (oC)
0 oC
100 oC
Melting
Boiling
Heating curve for Experiment #1- 20oC to 160oC at 1.0 atm, 760 torr
Time with a constant energy input
Temperature (oC)
0 oC
100 oC
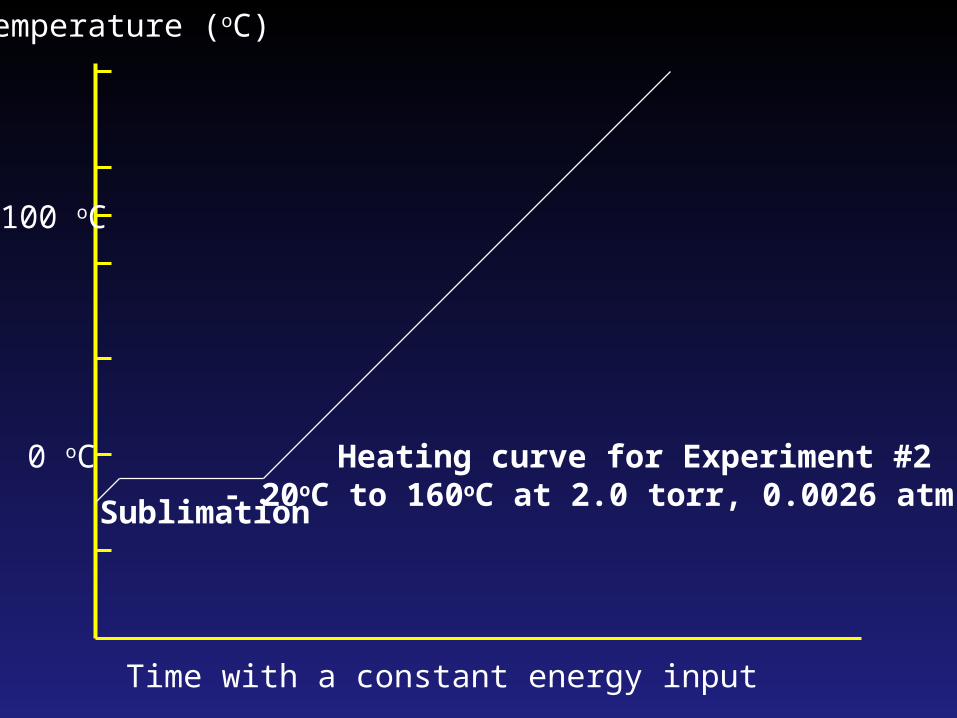
Heating curve for Experiment #2- 20oC to 160oC at 2.0 torr, 0.0026 atmSublimation
Time with a constant energy input
Temperature (oC)
0 oC
100 oC
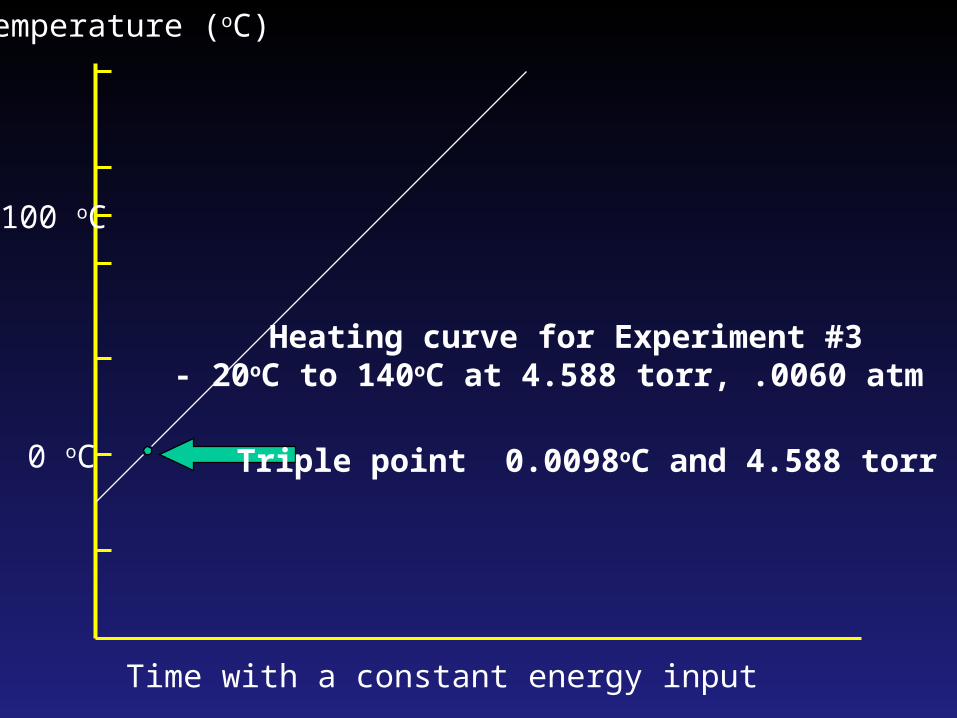
Heating curve for Experiment #3- 20oC to 140oC at 4.588 torr, .0060 atm
Triple point 0.0098oC and 4.588 torr
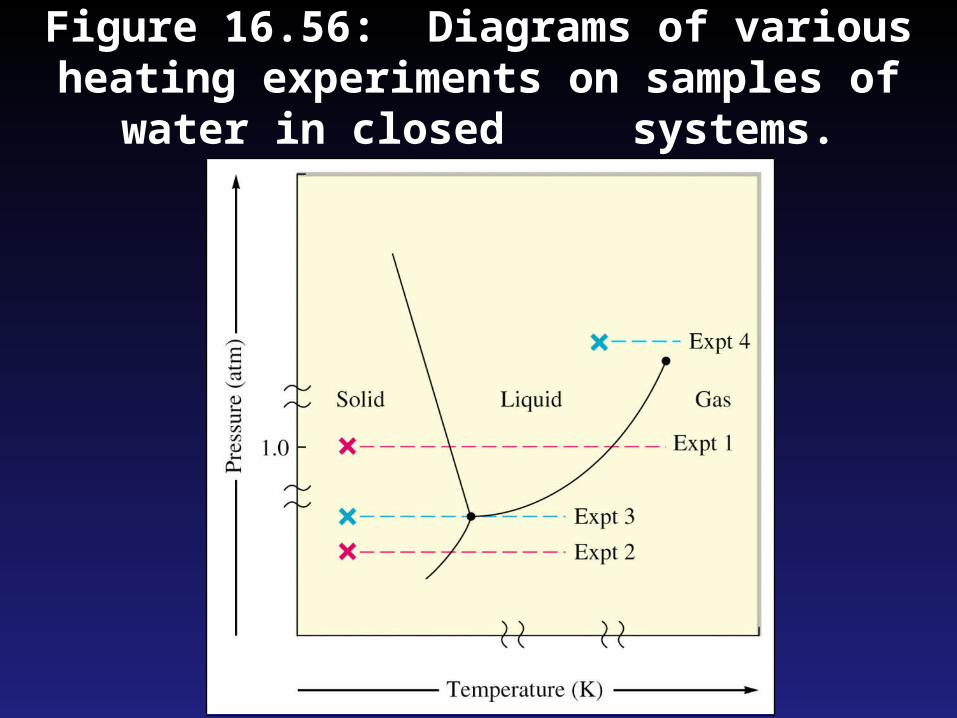
Figure 16.56: Diagrams of various heating experiments on samples of water in closed
systems.
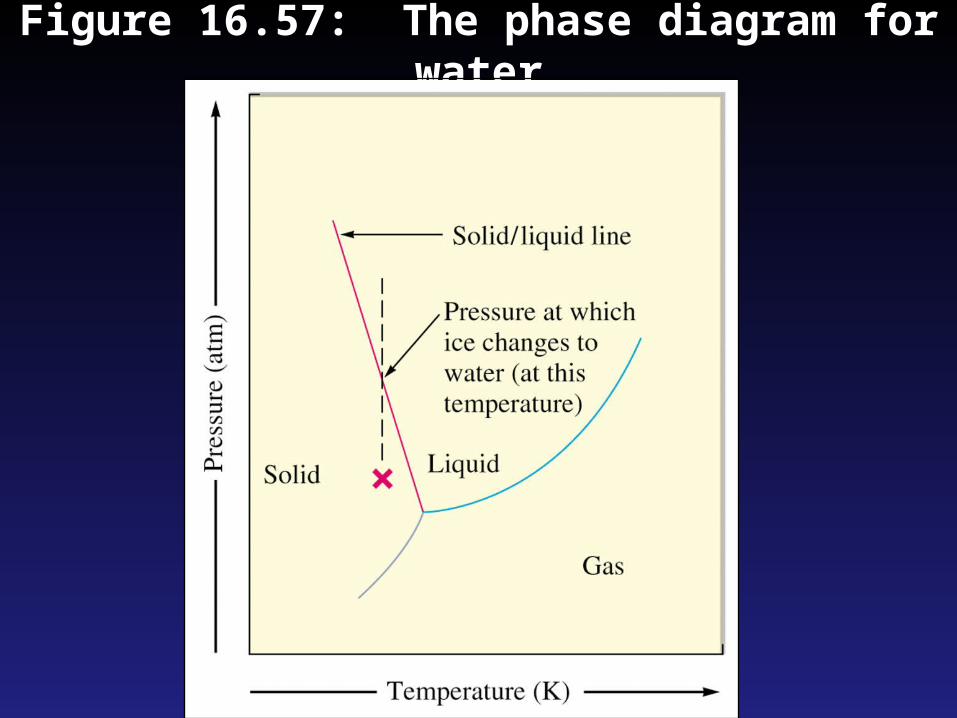
Figure 16.57: The phase diagram for water
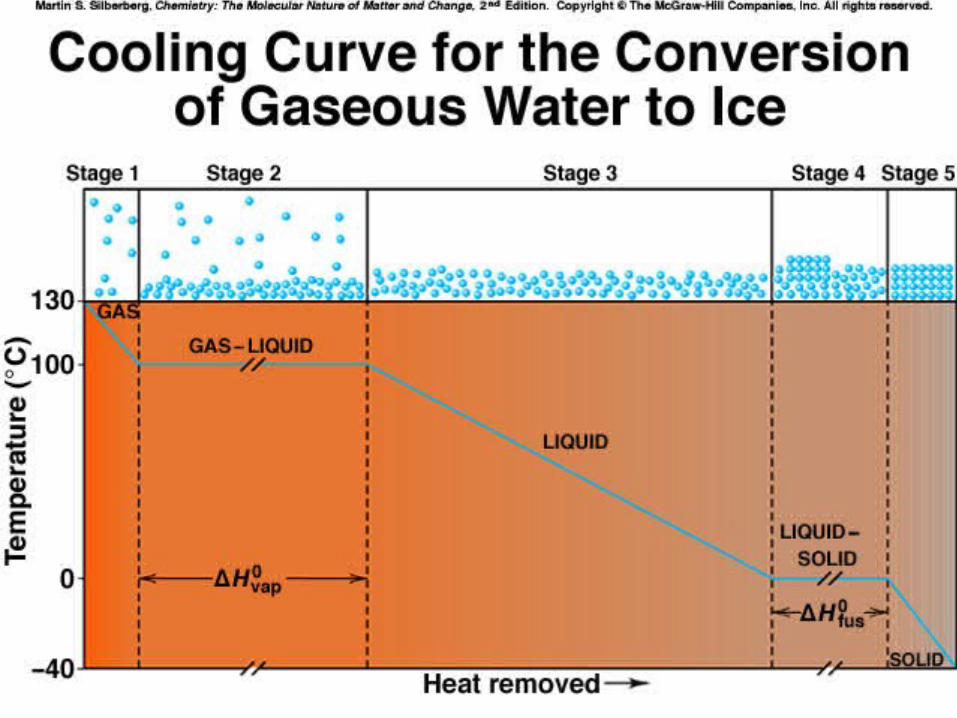
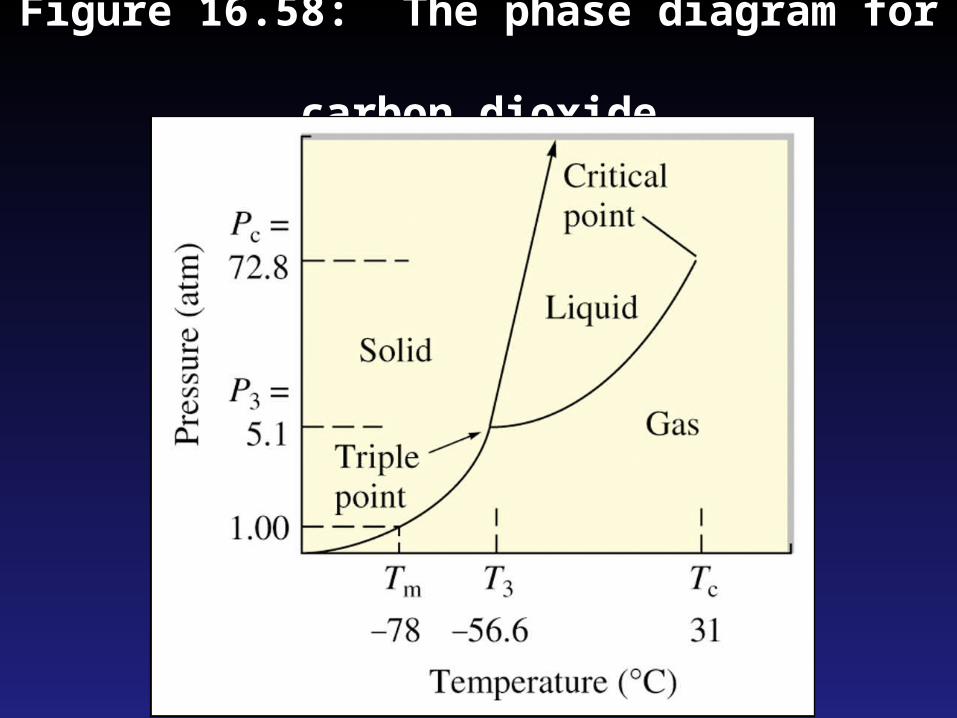
Figure 16.58: The phase diagram for carbon dioxide
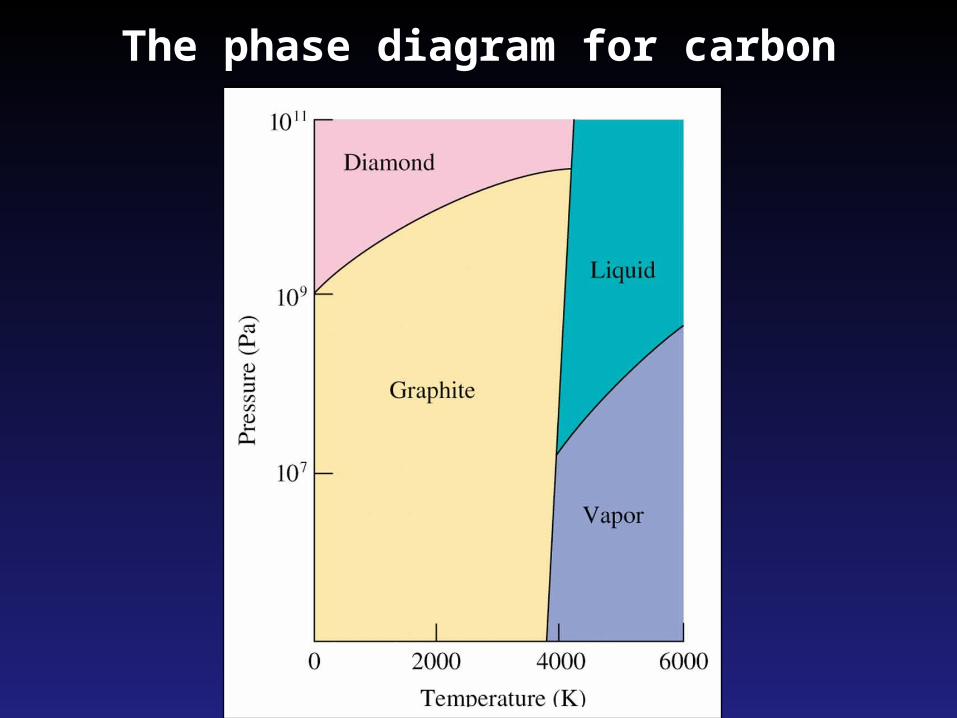
The phase diagram for carbon