Embed Size (px)
Citation preview

Chapter 16: Earth’s Climate System
Copyright © The McGraw-Hill Companies, Inc. Permission required for reproduction or display.
1. Want Ice with That?
2. Global Air Circulation
3. Global Climate Regions
5. Records of Climate Change
4. Extreme Climate Environments
6. Natural Causes of Climate Change

Learning Objectives• Students will explain concepts related to Earth’s climate systems.• Students will explain why areas with the same latitude have
different climates.• Students will summarize the features of the global climate regions.• Students will predict the climate for a location given rainfall and
temperature data.• Students will describe types of glaciers, glacial features, and
describe how glaciers are formed.• Students will analyze patterns in temperature and cloud cover,
precipitation, and air pressure and relate these patterns to Earth’s deserts.
• Students will identify the features of a desert.• Students will compare the action of glaciers with desert wind action.• Students will describe proxy indicators used to determine past
climates.• Students will explain natural causes of climate change.

Want Ice with That?
The Good Earth/Chapter 16: Earth’s Climate System
Each fall, polar bears migrate through Churchill, Manitoba on their way to Hudson Bay to wait for new sea ice to form so they can hunt seals.
17% reduction in Hudson Bay polar bears in past 30 years.
Rising temperatures in the Arctic cause sea ice to melt earlier in spring and form later in fall.
Bears hang around in Churchill longer waiting for the ice to form.
Who is in more danger, the tourist or the bear?
Want Ice with That?
The Good Earth/Chapter 16: Earth's Climate System
Polar Bear Jail, Churchill, Canada. Polar bears that wander into Churchill are captured by the trap and placed in "jail" until Hudson Bay freezes over.

Want Ice with That?
The Good Earth/Chapter 16: Earth's Climate System
Climate = A description of the weather conditions for a region averaged over several decades.
The climate of every region on Earth has changed often.
Shrinking glaciers are just one line of evidence of increasing global temperatures.
a. Riggs glacier, Glacier Bay National Park, Alaska in 1941.
b. Riggs glacier in 2004.

The Good Earth/Chapter 16: Earth's Climate System
Want Ice with That?The Arctic – A prime example of a region recording climate
change
Signs of change:
Decline in polar bear population
Rise in average temperatures by 2-3°C.
This temperature rise is more than double what is observed throughout the rest of the world.
Shrinking glaciers and other ice masses.
Rising sea level and increased coastal erosion.

Want Ice with That?
• Widespread and steady decline in Arctic sea ice over last few decades.
• Puts cold water into Arctic ocean – could disrupt the oceanic conveyor belt.
• Worst case scenario:
- Higher temps reduce annual volume of sea ice exposing more open water in Arctic ocean
- Water has lower albedo which absorbs more heat from sun
- Sea ice forms later in the fall and is thinner and not as widespread; melts earlier in spring The Good Earth/Chapter 16: Earth's Climate System

Want Ice with That?
The Good Earth/Chapter 16: Earth's Climate System
Process repeats – positive feedback loop
Each time the environment is modified it becomes less likely that the warming will reverse itself
Worst case scenario continued:
- Melting of ice changes density and salinity of Arctic ocean water- Freshwater input from Greenland further dilutes salt content- Reduction in sinking water at northern end of Gulf Stream can slow the conveyor belt- Temperatures in the North Atlantic can decrease with slowing of Gulf Stream

Want Ice with That?
The Good Earth/Chapter 16: Earth's Climate System
Best Case Scenario:
- Temperature increase is a short-term variation, and lower temperatures begin to prevail- Sea ice volume increases, increasing albedo and reducing absorption of heat- Sea ice forms earlier in fall and stays around longer into spring- Sea water salinity increases with increasing sea ice- Less melting of ice sheet on Greenland and elsewhere- Temperatures in North Atlantic gradually decrease and return to levels similar to those of the 1980's
This doesn't seem likely, as warming trend continues each year. Eight of the ten hottest years on record have occurred in
the last decade.

Want Ice with That?
The Good Earth/Chapter 16: Earth's Climate System
Why do we care?
The big question is –
ARE HUMANS AFFECTING CLIMATE CHANGES?

Earth's Climate System Self Reflection Survey
The Good Earth/Chapter 16: Earth's Climate System
Answer the following questions as a means of uncovering what you already know about Earth's climate system.
1. Imagine that you were blindfolded and air-dropped onto a continent somewhere on Earth. What features could you use to identify the climate of the region?

Earth's Climate System Self Reflection Survey
The Good Earth/Chapter 16: Earth's Climate System
Answer the following questions as a means of uncovering what you already know about Earth's climate system.
2. Any effective climate model must account for regional variations in climate at any moment in time as well as for variations in climate for any location over the course of a year. Make a list of what you know about annual variations in climate in the U.S. and around the globe.

Earth's Climate System Self Reflection Survey
The Good Earth/Chapter 16: Earth's Climate System
Answer the following questions as a means of uncovering what you already know about Earth's climate system.
3. What are some climate-related concepts featured in earlier chapters of this text?

Go back to the Table of Contents
Go to the next section: Global Air Circulation
The Good Earth/Chapter 16: Earth's Climate System

The Good Earth/Chapter 16: Earth's Climate System
Look at these four maps: What patterns do you see? Global Air Circulation

Several significant patterns should emerge:
The Good Earth/Chapter 16: Earth's Climate System
• Temperatures decrease with increasing latitude north and south from equator. Equator receives more solar energy.
• Temperature range is much greater for the continents than for the oceans. Water has a high heat capacity.
• Clouds are concentrated in irregular bands parallel to the equator and latitudes 60° N and S, and these latitudes also have high precipitation and low atmospheric pressure. Desert belts are located around 30°N and S latitude.
Global Air Circulation

Global Air Circulation
The Good Earth/Chapter 16: Earth's Climate System
Non-rotating Earth model – rising air at the equator and sinking air at the poles would form opposing limbs (loops) of a large-scale circulation pattern called a convection cell.
Q: Where is there low-pressure and where is there high-pressure?
A: Low-pressure where air rises (equator) and high pressure where air descends (poles).
A difference in solar radiation causes differential heating, which produces convection cells that drive air circulation.

Earth's Climate System Checkpoint 16.1
The following map shows the locations of four climate extremes. Match each extreme climate with its location (each is only used once).
The Good Earth/Chapter 16: Earth's Climate System
a. Highest temperature (136°F) is at location _____
b. Highest average annual precipitation (524 inches) is at location _______
c. Second lowest temperature (-90°F) is at location ______
d. Lowest annual precipitation (0.08 cm) is at location ______

Earth's Climate System Checkpoint 16.2
Florida lies at the same latitude as the Sahara Desert. Why do you think Florida is not a hot, dry desert?
The Good Earth/Chapter 16: Earth's Climate System
The Good Earth/Chapter 16: Earth's Climate System
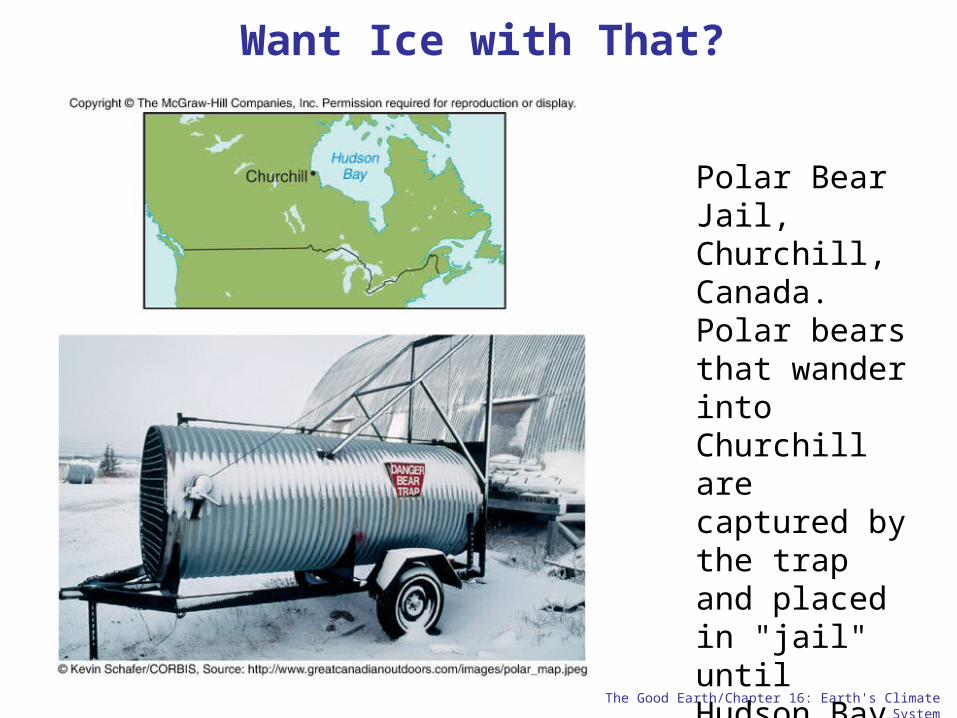
Global Air CirculationThe Earth rotates complicating the system.
Regardless of Earth's rotation, warm humid air expands and rises at the equator, forming a low-pressure system and nearly continuous band of clouds.
The Coriolis effect deflects winds to the right in the Northern Hemisphere and to the left in the Southern Hemisphere.
North moving air is continuously deflected east and is moving almost directly eastward by the time it reaches 30°N = Subtropical Jet Stream
Jet stream moves in upper troposphere at speeds approaching 61 mph.

Global Air Circulation
The Good Earth/Chapter 16: Earth's Climate System
Descending air warms adiabatically and its relative humidity decreases promoting desert formation.
Trade winds – prevailing surface winds deflected north and south at these areas of descending air.
Hadley Cell – continuous convection cell formed by columns of rising air and descending air connecter by north and south moving winds.
Polar Cell – anchored by a column of descending air in the polar regions.
Ferrel Cell – midlatitude convection system separating thermal circulation cells - not as well defined, as they are modified by midlatitude cyclone formation.

Global Air Circulation
The Good Earth/Chapter 16: Earth's Climate System
Atmospheric circulation can be divided into three convection cells in each hemisphere.
These bands of wind are often disrupted by variations in topography, especially in the Northern Hemisphere.
Jet streams are present near the top of the troposphere. Winds in the core of the jet streams can reach speeds of more than 195 mph!

Go back to the Table of Contents
Go to the next section: Global Climate Regions
The Good Earth/Chapter 16: Earth's Climate System

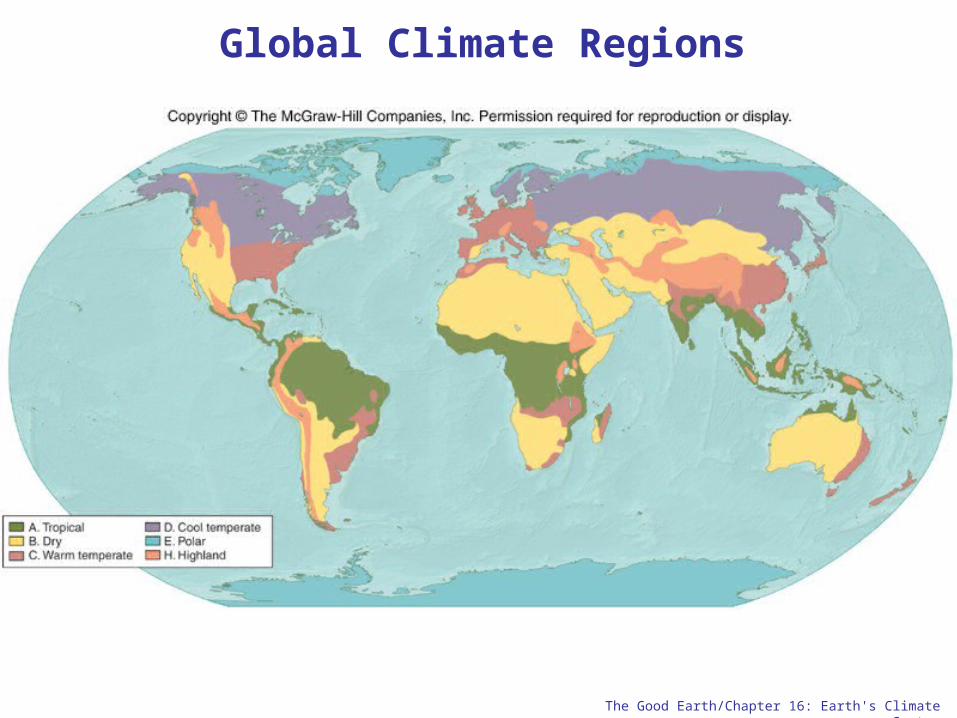
Global Climate Regions
The Good Earth/Chapter 16: Earth's Climate System
Climate regions are differentiated by their temperatures and precipitation and their resulting vegetation.
Koppen-Geiger classification system uses average monthly temperatures and precipitation, and total annual precipitation.
Averaging can cause microclimates to be missed.
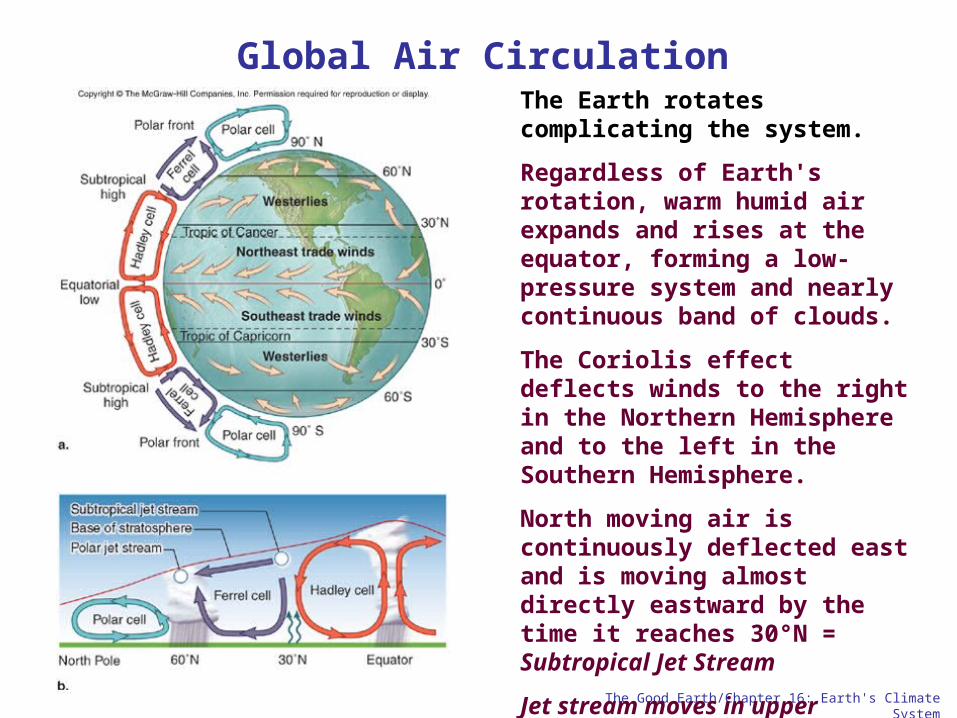
Earth's Climate System Conceptest
The Good Earth/Chapter 16: Earth's Climate System
The following graph illustrates mean monthly high and low temperatures and the average monthly rainfall for Sydney, Australia. Estimate the average monthly temperatures as halfway between the mean high and low temperatures. On the basis of these data, in what climate region does Sydney belong? Explain your reasoning.
a. Tropical
b. Dry
c. Warm temperate
d. Cool temperate
Global Climate Regions
The Good Earth/Chapter 16: Earth's Climate System

Global Climate Regions
The Good Earth/Chapter 16: Earth's Climate System
Ecosystems = communities of organisms that inhabit specific physical environments.
Biodiversity = the number of species in an ecosystem.
Biome = a regional community of plants and animals named after the dominant type of vegetation.
Humans, unlike other organisms, inhabit a wide range of biomes. Why?

Global Climate Regions
The Good Earth/Chapter 16: Earth's Climate System
Global population density. Darker colors signify regions with highest population density.
What can you say about the relationship between population density and climate regions?
In terms of altitude, most organisms live in a narrow vertical band of land and shallow sea where the climate is warm and moist.

Earth's Climate System Checkpoint 16.6
The Good Earth/Chapter 16: Earth's Climate System
How does the distribution of people on Earth compare to the distribution of climate zones and biomes?
hint: refer to figures 16.8, 16.9, and 16.11

Global Climate Regions
The Good Earth/Chapter 16: Earth's Climate System
Three major climate-related biome groups: grasslands, forests, and deserts.
Each of these can be divided into individual biomes.
Tropical rain forests are a critical biome – dominate the tropical climate region and are home to the most diverse ecosystems on the planet, containing 50,000 plant species!
Changes in biome character can tell us about climate change.
Environmental factors influencing the distribution of ecosystems. Why are most species found in the upper 200 meters of the ocean and below about 20,500 feet on land?

Global Climate Regions
The Good Earth/Chapter 16: Earth's Climate System
Biogeochemical CyclesPlants are producers
Animals are consumers
Food chain – transfers energy between organisms within an ecosystem
N, C, O, H, P, S make up 95% of the materials in plants and animals
Biomass = amount of organic material in an ecosystem. Plants account for 99% of all biomass on Earth.

Earth's Climate System Checkpoint 16.8
The Good Earth/Chapter 16: Earth's Climate System
With all the media reports about climate change, people in your community turn to you to help them figure out if it is
really happening. They ask you to generate a common sense index of climate change that could be used by long-time residents (longer than 20 years) of your community. The
index should not be too complicated, so you must identify just three things that an interested resident could observe, using
data from the evening news, the Internet, or a local newspaper. Finally, residents should not have to collect daily weather data, but they may be asked to compare daily data
with long-term averages. What three factors would you choose and how would residents use them to identify climate
change?

Go back to the Table of Contents
Go to the next section: Extreme Climate Environments
The Good Earth/Chapter 16: Earth's Climate System

Extreme Climate Environments
The Good Earth/Chapter 16: Earth's Climate System
What makes an environment extreme?
Exceptionally high or low temperatures and/or lack of precipitation
Where on this map might you find an extreme environment?

Extreme Climate Environments
The Good Earth/Chapter 16: Earth's Climate System
Extreme environments:
• Reduced biodiversity
• Low population densities
• Fall within the dry and polar climate regions
• Greenland and Antarctica represent the world's largest accumulations of ice and snow
• Glacier = A long-lived mass of slow moving snow and ice on land
Antarctic landscape. Climbers on their way to Mount Vinson, the highest peak on the continent.
Continental glaciers/ice sheets – form at polar latitudes. Alpine glaciers – found at high elevations in mountainous regions.

Extreme Climate Environments
The Good Earth/Chapter 16: Earth's Climate System
Glaciers move and can tell us something about climate change:
• Alpine glaciers are more susceptible to climate changes
• Individual alpine glaciers may last for decades or up to thousands of years

Extreme Climate Environments
The Good Earth/Chapter 16: Earth's Climate System
The weight of thick glacial ice causes it to move.
In general they move downslope.
Alpine glaciers move ~5-50 m/yr.
Ice sheets can move hundreds of meters per yr.
Crevasses = steep, narrow cracks in the surface ice form as the glacier changes shape.
As the ice moves it transports pieces of bedrock that fall off surrounding cliffs or are torn off by the glacier.
Snow falling on the glacier is compacted into ice crystals that contain trapped air bubbles.

Extreme Climate Environments
The Good Earth/Chapter 16: Earth's Climate System
Glaciers are composed of layers of ice
Snowflakes fall in accumulation zone and are compacted into ice crystals
Air bubbles are trapped as the ice crystals are buried lower in the glacier
The tiny air bubbles preserve a record atmospheric composition at the time of their
formation
The layers in a glacier represent annual accumulations of snow
Scientists can count the annual snow layers to get an estimate of the glacier's age
Can combine age information and atmospheric composition information from the air bubbles
and see a record of past climate

Extreme Climate Environments
The Good Earth/Chapter 16: Earth's Climate System
Zones of an alpine glacier
Zones are based on elevation
Accumulation zone – higher elevation, thickest part of the glacier, addition of
snow exceeds loss by melting
Ablation zone – lower, thinner zone where seasonal snow melts causing thaw
of underlying glacial ice
Snowline – boundary between accumulation and ablation zones
The mass balance of the glacier is the difference between how much ice and
snow accumulates vs. melts each year.
Earth's Climate System Checkpoint 16.9
The Good Earth/Chapter 16: Earth's Climate System
While hiking in the Sierra Nevada Mountains of California you come across a high valley filled with several meters of snow and ice. What would you look for to determine if it is just a big pile of snow and ice or a glacier?

Extreme Climate Environments
The Good Earth/Chapter 16: Earth's Climate System
If ablation exceeds accumulation, a glacier melts faster than new ice can be added and the front of the glacier retreats upslope.
• Scientists studying North Cascade glaciers have recorded a steady decline in volume over the last two decades.
• Glaciers are about 1/3 smaller today than they were in the mid-1980's.
• Glaciers undercut adjacent mountainsides and scrape underlying material causing erosion and mass wasting.
• Bits of rock frozen into base of glacier act like sand paper scouring the underlying landscape.
• At the terminus (end) of the glacier, unsorted debris from clay size to house size boulders collects. (Till = unsorted deposits)
• Ridges of till that surround the edge of the glacier = moraines
• Terminal moraine – marks farthest limit of the glacier
• Geologists can map rate of melting by looking at the location of the terminal moraine and the terminus of the glacier.

Extreme Climate Environments
The Good Earth/Chapter 16: Earth's Climate System
Till Tillite
Glacier terminus and moraine. The edge of the moraine represents deposits formed when the terminus of the glacier remained in one location.

Extreme Climate Environments
The Good Earth/Chapter 16: Earth's Climate System
The presence of moraines in regions without present-day glaciers is evidence for more extensive glaciers in the geologic past.
Moraines are seen in the Midwest and Great Plains states
Recession of the Gangotri glacier, India.
Icebergs breaking off a glacier in Greenland
Larsen Ice shelf, Antarctica – terminus floating in shallow water adjacent to a landmass

Earth's Climate System Checkpoint 16.10
The Good Earth/Chapter 16: Earth's Climate System
Examine the two pictures of the glaciers at left:
a. In the photos, identify as many features as you can.
b. In the photo on the right, what do you infer is the origin of the dark stripes?

Extreme Climate Environments
The Good Earth/Chapter 16: Earth's Climate System
Glaciers that reach the ocean may break off into icebergs or form an ice shelf.
Icebergs and ice shelves carry clay, sand, and boulders that were eroded by the glacier.
As the ice melts into the ocean, these materials are dropped and descend to the ocean floor forming a dropstone deposit.

Earth's Climate System Checkpoint 16.11
Draw a diagram that illustrates the fate of a snowflake that falls in the accumulation zone of a growing alpine glacier. Begin and end the path of the snowflake in the atmosphere.
The Good Earth/Chapter 16: Earth's Climate System

Extreme Climate Environments
The Good Earth/Chapter 16: Earth's Climate System
In most hot deserts, temperatures are high, annual rainfall is less than 10 inches, and evaporation exceeds
precipitation.
Desert surfaces are a combination of sand, desert pavement, and rock outcrops.

Extreme Climate Environments
The Good Earth/Chapter 16: Earth's Climate System
Many deserts are located around 30°N and S latitude – subtropical deserts
Some are located in continental interiors far from moisture sources – continental deserts
Some are located along a coast where cold ocean waters cool the air and it loses its moisture before reaching land – coastal deserts
Some are located in polar regions and are dry, with relatively little ice or snow – polar deserts
Some are found on the downwind side of a mountain range where the rainshadow effect has depleted air of its moisture before it descends down the landward side – rainshadow deserts
Deserts don't have to be hot, but always have less than 10 inches of annual precipitation. Deserts are always dry.

Earth's Climate System Checkpoint 16.13
The Good Earth/Chapter 16: Earth's Climate System
The area around the South Pole receives just a few centimeters of snowfall each year. Is the South Pole a desert? Give reasons to support your answer.
Extreme Climate Environments
The Good Earth/Chapter 16: Earth's Climate System
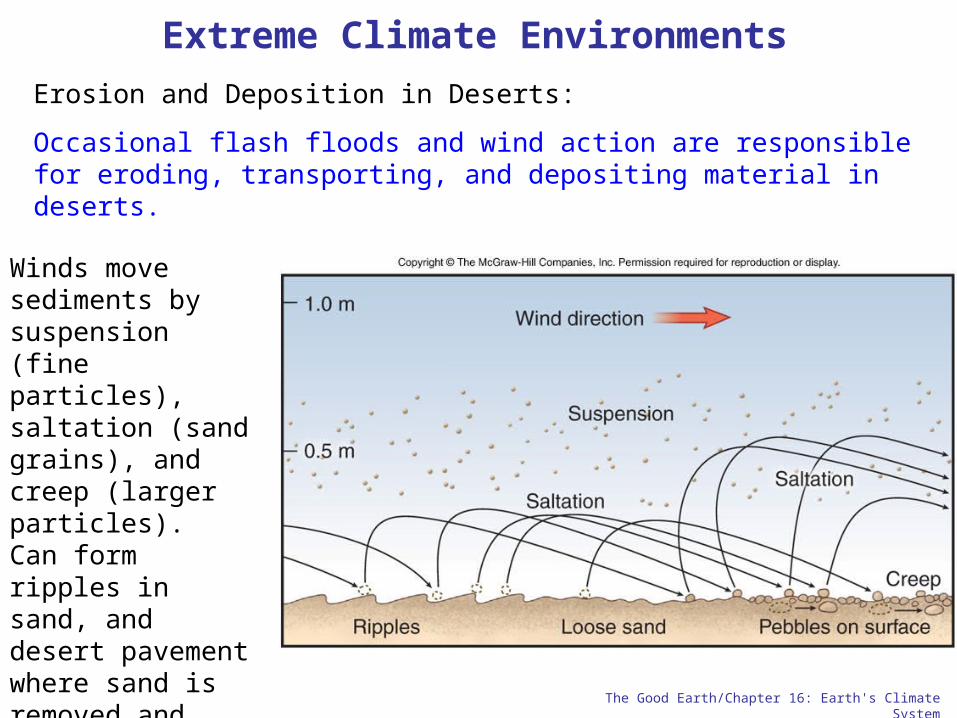
Erosion and Deposition in Deserts:
Occasional flash floods and wind action are responsible for eroding, transporting, and depositing material in deserts.
Winds move sediments by suspension (fine particles), saltation (sand grains), and creep (larger particles). Can form ripples in sand, and desert pavement where sand is removed and pebbles are left behind.

Extreme Climate Environments
The Good Earth/Chapter 16: Earth's Climate System
Sand grains may be deposited together to form sand dunes.
The most common sand dunes have a gentle windward face and a steep lee face. The dune migrates slowly with the wind as sand is moved from the gentle face to the steep face.

Extreme Climate Environments
The Good Earth/Chapter 16: Earth's Climate System
Cross beds = a pattern of sloping layers that slope in the same direction the wind blows.
Cross beds can tell us the direction of prevailing winds when the dunes were formed.

Earth's Climate System Checkpoint 16.15
The Good Earth/Chapter 16: Earth's Climate System
Complete the Venn diagram provided by placing the six listed descriptions in the appropriate locations on the diagram. Add at least an additional 4 characteristics.
Wind Action Glacial Processes
1. Transport sediment in direction of movement
2. Can transport large boulders
3. Form dunes
4. Occur most frequently at high latitudes
5. Few associated plants and animals
6. Occur on at least 5 continents
7.
8.
9.
10.

Go back to the Table of Contents
Go to the next section: Records of Climate Change
The Good Earth/Chapter 16: Earth's Climate System

Records of Climate Change
The Good Earth/Chapter 16: Earth's Climate System
Imagine you have boarded an airplane with no windows and have flown somewhere far away. The pilot does not
tell you where you have landed. What evidence would you use to determine the climate of the region?
Indicators of climate = proxies
Proxy = something that stands for something else
Example: the change in native woodlands in Missouri to grasslands in Kansas is a proxy for the westward decrease
in precipitation.
Proxies of climate fluctuations include tree rings, oxygen isotopes, and microfossils

Records of Climate Change
The Good Earth/Chapter 16: Earth's Climate System
Detailed, accurate data on temperature and precipitation have only been collected for about 150 years.
a) Average global temperatures taken from land and ship-based instruments since the late 1850's.
b) Average of temperatures from the troposphere taken by satellites since 1979. Two data interpretations – UAH (Univ of Alabama, Huntsville) and RSS (Remote Sensing Systems) using same data set.
What trend do you see on both graphs? Is it real?

Records of Climate Change
The Good Earth/Chapter 16: Earth's Climate System
Changes in climate patterns influenced where past civilizations were able to flourish
• Viking migration to Greenland during warmer temperatures – increased length of Greenland growing season
• When it cooled again Vikings agricultural base declined and environment became more hostile
Records of Climate Change
The Good Earth/Chapter 16: Earth's Climate System
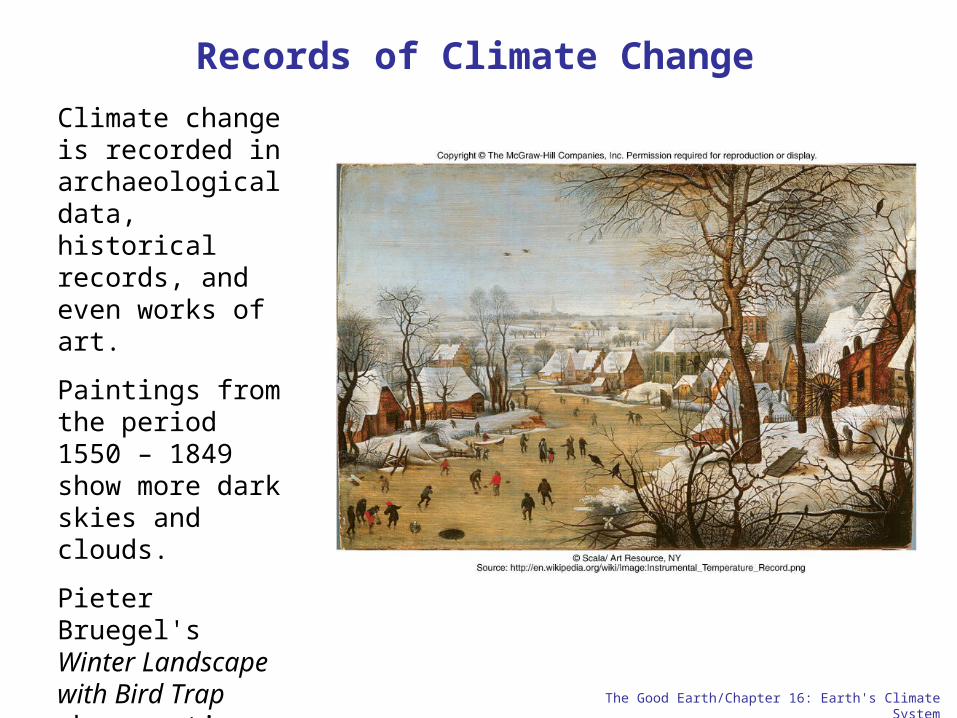
Climate change is recorded in archaeological data, historical records, and even works of art.
Paintings from the period 1550 – 1849 show more dark skies and clouds.
Pieter Bruegel's Winter Landscape with Bird Trap shows a time when European rivers were likely to freeze over, a rare event today.

Records of Climate Change
The Good Earth/Chapter 16: Earth's Climate System
Cultural records indicate three distinct climate periods for the Northern Hemisphere in the last 1,000 years or so:
1. Medieval warm period - Temperatures were relatively warm from 1000 – 1450 A.D.
2. The Little Ice Age – A time of very cold temperatures but not really an ice age. Occurred for about 400 years after the medieval warm period.
3. By the end of the 19th century climate moderated leading to our present relatively warm temperatures, which exceed any in the last 1,000 years.

Records of Climate Change
The Good Earth/Chapter 16: Earth's Climate System
Annual climate records can be found in tree rings, lake sediments, and ice layers.
Each year includes earlywood (light) and latewood (dark) growth.
Wide rings occur during wet, warm years and narrow rings during cold, dry years.
Usually it is necessary to match partial records from multiple trees to get a climate record.
Short-term climate change is recorded in tree rings (hundreds of years).

Records of Climate Change
The Good Earth/Chapter 16: Earth's Climate System
Northern Wyoming precipitation record from tree ring analysis. Precipitation records from 1895 onward were matched with tree ring
widths to estimate precipitation values for pre-1895 tree rings.

Records of Climate Change
The Good Earth/Chapter 16: Earth's Climate System
Lake sediments are often deposited in paired annual layers called varves.
Varves reflect seasonal changes in deposition in a lake.
Algae grows on surface from spring to late fall
Dies in fall and sinks to bottom making a dark layer of sediment
Sediment near lake margins comes from streams and is thicker during periods of higher precipitation
During colder parts of year much of central lake sediment is wind blown dust and clay, producing lighter sediment layer
Can cover longer periods of time that tree rings, and hold more proxy information such as pollen from land plants, sediment from nearby land sources, chemical changes due to weathering, organic remains, and ash layers that can be radiometrically dated.
Records of Climate Change
The Good Earth/Chapter 16: Earth's Climate System
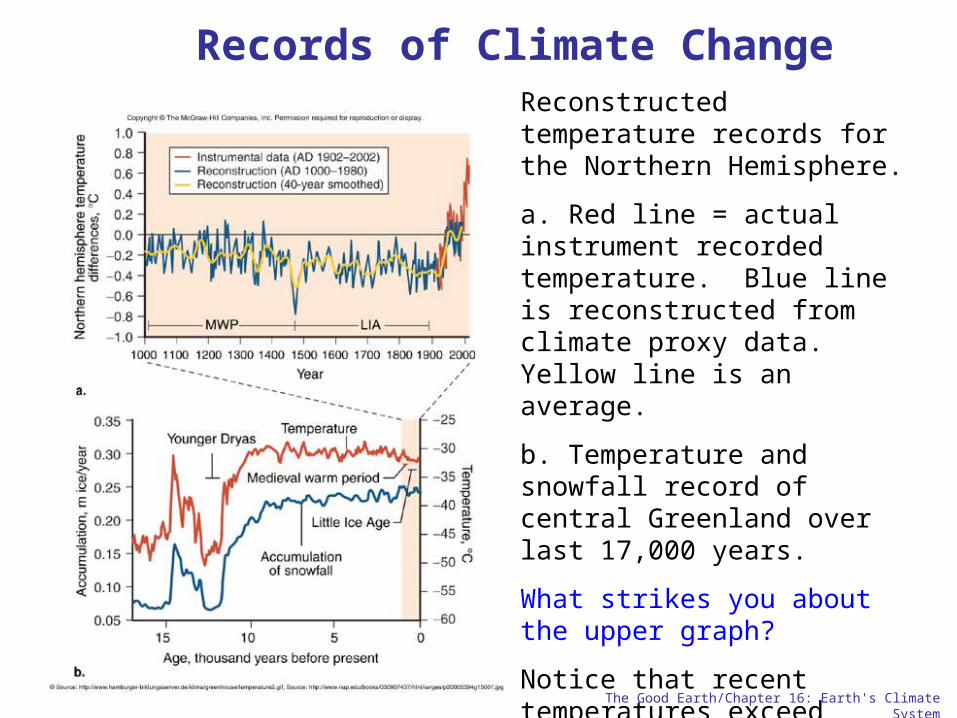
Reconstructed temperature records for the Northern Hemisphere.
a. Red line = actual instrument recorded temperature. Blue line is reconstructed from climate proxy data. Yellow line is an average.
b. Temperature and snowfall record of central Greenland over last 17,000 years.
What strikes you about the upper graph?
Notice that recent temperatures exceed anything from the last 1,000 years. Why?

Records of Climate Change
The Good Earth/Chapter 16: Earth's Climate System
The thickness of ice layers is related to temperature and directly tied to precipitation.
Yearly layers can be observed, counted, and studied for climate information.
Oxygen isotopes serve as a proxy for long-term climate change.
18O is heavier than 16O. 16O is much more abundant in the ocean than 18O. Changes in the ratio of these isotopes indicate changes in climate.

Records of Climate Change
The Good Earth/Chapter 16: Earth's Climate System
Lighter 16O isotopes evaporate with seawater and are returned to the ocean through precipitation and runoff. When it is colder 16O is incorporated into continental ice sheets which causes the oceans to become enriched with heavier 18O that has not evaporated and precipitated onto ice sheets.

Records of Changing Climate
The Good Earth/Chapter 16: Earth's Climate System
The oxygen isotope record acts as a paleothermometer for ancient climates.
Oxygen isotope ratios of ocean water are recorded in the calcium carbonate shells of microscopic foraminifera.
The ratios in the shells can tell us about temperature and ice volume in the oceans in the past.
Large drops in biodiversity usually correspond with sudden climate changes.

Records of Changing Climate
The Good Earth/Chapter 16: Earth’s Climate System
Climate records indicate that the Northern Hemisphere experienced glaciation (Ice Age) during the last 2 million years:
Lower sea level
Land bridge between Siberia and Alaska
More forests in North America
Western U.S. deserts were cooler
North America was dominated by a 3-kilometer thick (1.9 mile) continental glacier centered over Canada.

Records of Changing Climate
The Good Earth/Chapter 16: Earth’s Climate System
The last Ice Age is divided into cold glacial intervals and warmer interglacials. Temperatures during the glacials were at least 9-18°F colder
than today. Based on the length of interglacials, we are about 10,000 years away from entering another cold glacial interval. What trends do you
notice on the above graph?

Records of Changing Climate
The Good Earth/Chapter 16: Earth’s Climate System
Younger Dryas – short, cold interval marked by the appearance of pollen from polar wildflower Dryas octopetala.
At end of Younger Dryas, entered the Holocene, our current interglacial.
Climate can change very quickly as evidenced by the graph at left.
At end of Younger Dryas average annual temperature of much of Northern Hemisphere increased by 12°F in less than a decade!

Records of Climate Change
The Good Earth/Chapter 16: Earth’s Climate System
Hypothesis – rapid warming at the end of an especially cold interval cause catastrophic failure of Northern Hemisphere ice sheet, putting surges of icebergs into the Atlantic.
Addition of so much fresh water slowed thermohaline circulation (Gulf Stream), causing a plummet in temperatures in Europe, Asia, and Africa.
Longest ice core from Antarctica only records back less than one million years.
To model earlier climate we must look at fossil chemistry and sedimentary rock characteristics.
These proxies give us a record back to about 66 million years ago.

Records of Climate Change
The Good Earth/Chapter 16: Earth’s Climate System
Earth was 18-27°F warmer 52 million years ago – Hothouse Earth!
Temperature contrast between the equator and the poles was much less.
No polar ice caps.
Alligator-like reptiles on islands of northern Canada.
65 million years of climate change. Temperature is only correlated with earliest and latest portions of the curve. Temperatures were generally warmer than today until the major ice sheet of Antarctica formed ~34 Ma.
Records of Climate Change
The Good Earth/Chapter 16: Earth’s Climate System
Implications for our future:
Freshwater sources today are smaller continental glaciers such as Greenland.
At current melting rates this couldn’t produce enough freshwater to generate the dramatic alteration in salinity needed to significantly impact thermohaline circulation.
An abrupt catastrophic climate change is not likely to happen, but a constant refreshing of the North Atlantic by melting of
Greenland can slow down the ocean conveyor – still can have consequences!
Do humans indeed affect climate?

Go back to the Table of Contents
Go to the next section: Natural Causes of Climate Change
The Good Earth/Chapter 16: Earth’s Climate System

Natural Causes of Climate Change
The Good Earth/Chapter 16: Earth’s Climate System
Causes of long-term global climate change must operate on a global scale
over very long time intervals.
Most likely causes:
• Changing locations of continents and oceans due to plate tectonics
• Changes in the Earth’s orbit around the sun
• Variations in the composition of the atmosphere such as concentrations of greenhouse gases

Natural Causes of Climate Change
The Good Earth/Chapter 16: Earth’s Climate System
The last three major ice ages have occurred when large landmasses were located near one or both poles.
Must be land near poles to build up long-lived continental ice sheets.
Having landmasses near the poles isn’t enough by itself to create climate changes.
What else might be important?
Distribution of continents and oceans at the time of Pangaea.
Natural Causes of Climate Change
The Good Earth/Chapter 16: Earth’s Climate System
Recall that water carries a lot of heat around the globe. Ocean circulation patterns can impact climate!
Examples:
Closing of the connection between North and South America ~3 million years ago strengthened gulf stream, warmer water to North Atlantic region, greater evaporation and precipitation in the form of snow, greater albedo and less melting of northern glaciers leading to long term formation of ice caps.
Separation of South America and Australia from Antarctica ~34 million years ago triggered large-scale glaciation of Antarctica, opened up circulation patterns in Southern Ocean, isolated southern continent from moderating climate influences from lower latitudes.
Earth’s climate involves interaction between geosphere, hydrosphere, atmosphere, and biosphere.

Natural Causes of Climate Change
The Good Earth/Chapter 16: Earth’s Climate System
Which orbital path would cause the most extreme variations between summer and winter months?
Small changes in Earth’s orbit, on scales of tens of thousands of years, influence climate changes.
Milankovitch Cycles – caused by the interaction of Earth with the gravitational fields of other planets. There are three principal variations:
1. Eccentricity of Earth’s orbit = shape of Earth’s orbit around the sun varies from more circular to more elliptical. Changes occur on a 100,000 year cycle.
Natural Causes of Climate Change
The Good Earth/Chapter 16: Earth’s Climate System
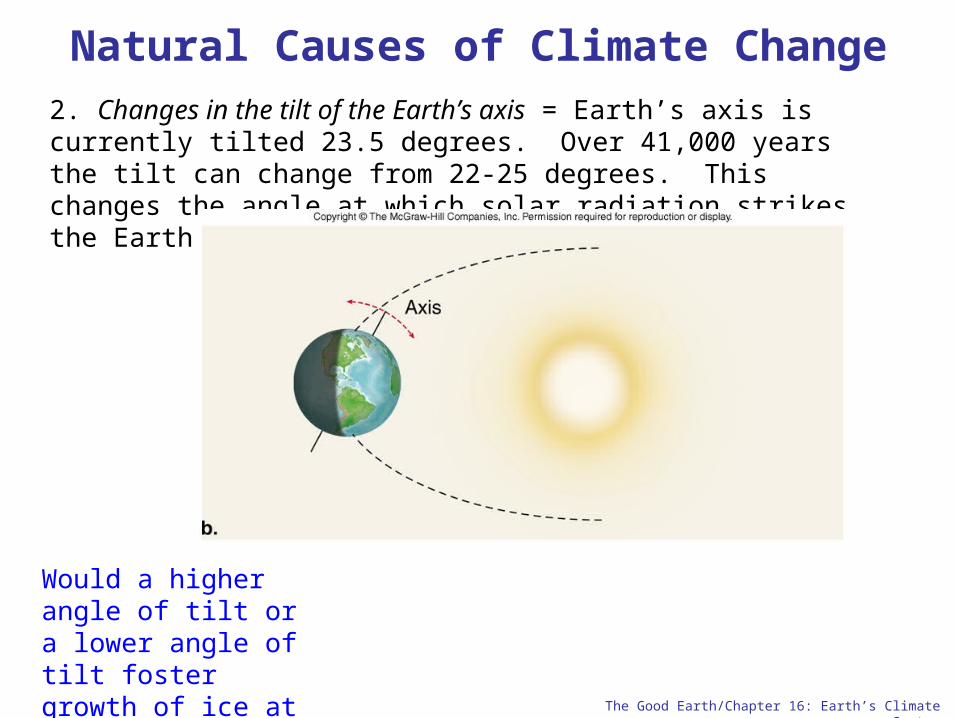
2. Changes in the tilt of the Earth’s axis = Earth’s axis is currently tilted 23.5 degrees. Over 41,000 years the tilt can change from 22-25 degrees. This changes the angle at which solar radiation strikes the Earth.
Would a higher angle of tilt or a lower angle of tilt foster growth of ice at the poles?

Natural Causes of Climate Change
The Good Earth/Chapter 16: Earth’s Climate System
3. Precession = The wobbling of the Earth on its spin axis (like a top). Changes the direction of the axial tilt. It takes 23,000 years for the axis to make a complete round trip back to where it started.
Today Earth’s axis is tilted toward the sun during summer months. In 11,500 years it will be the exact opposite. What will this mean for our seasons?

Earth’s Climate System Checkpoint 16.21
The Good Earth/Chapter 16: Earth’s Climate System
What combination of changes in the Milankovitch cycles would cause the highest and lowest summer temperatures in North America?

Earth’s Climate System Checkpoint 16.22
The Good Earth/Chapter 16: Earth’s Climate System
Would the amount of incoming solar radiation increase or decrease at the Arctic Circle during
July in the Northern Hemisphere if
1.Earth’s axis were vertical rather than tilted?
2.Earth’s orbit brought it closer to the sun?
3.The tilt of Earth’s axis were opposite to its present orientation? (away from the sun)

Earth’s Climate System Checkpoint 16.23
The Good Earth/Chapter 16: Earth’s Climate System
Concisely describe five features that could cause the temperature of a region of the Earth’s
surface to decrease.

Earth’s Climate System Checkpoint 16.23
The Good Earth/Chapter 16: Earth’s Climate System
From the information in this chapter, discuss what you think would be some potential climate
scenarios for North America over the next 1,000 years.

The End
Go back to the Table of Contents
The Good Earth/Chapter 16: Earth’s Climate System