Embed Size (px)
Citation preview
Chapter 16: Analysing
survey data
CONTENTS
• Survey data analysis and types of research• Spreadsheet analysis• Statistical Package for the Social Sciences (SPSS) • Preparation• SPSS procedures• The analysis process

Survey data analysis and types of research (Fig. 16.1)
Research type SPSS proceduresDescriptive Frequencies, Means
Explanatory Crosstabulation, Comparison of means, regression
Evaluative Frequencies – compared with targets or benchmarksCrosstabulations – comparing user/customer-groupsMeans – compared with some benchmark or target
A. J. Veal & S. Darcy (2014) Research Methods for Sport Studies and Sport Management: A practical guide. London: Routledge
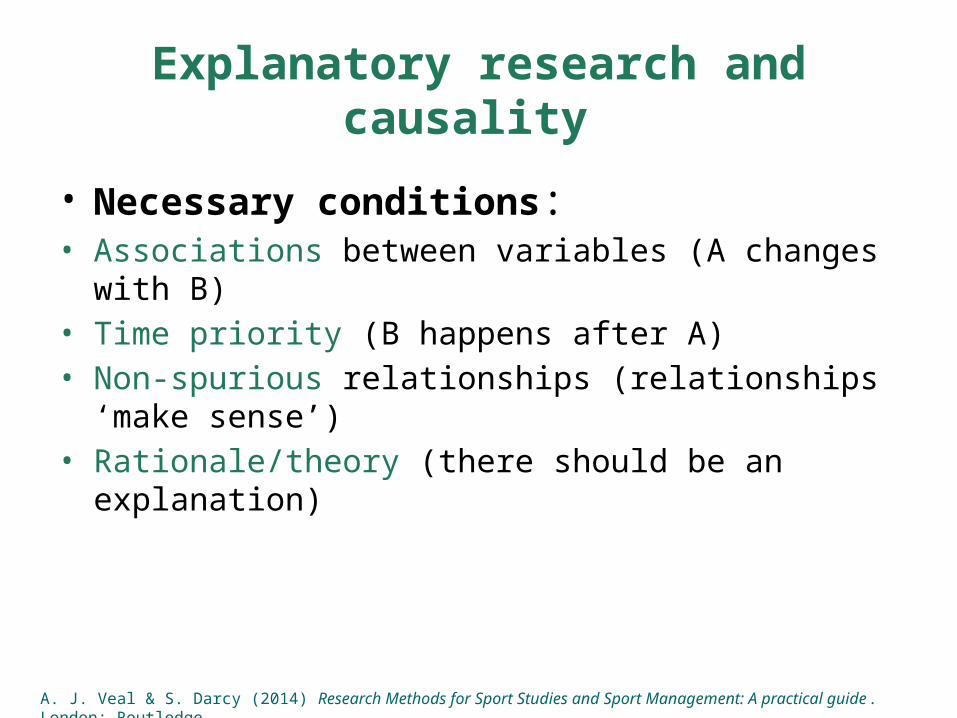
Explanatory research and causality
• Necessary conditions:• Associations between variables (A changes with B)• Time priority (B happens after A)• Non-spurious relationships (relationships ‘make sense’)• Rationale/theory (there should be an explanation)
A. J. Veal & S. Darcy (2014) Research Methods for Sport Studies and Sport Management: A practical guide. London: Routledge
Spreadsheet analysis (Fig. 16.1)
• Example using data from Campus Sporting Life questionnaire (Fig. 10.21)
• FREQUENCY procedure in Microsoft Excel used to produce:– frequency counts of coded variables– averages for numerical variables (age, spend)
A. J. Veal & S. Darcy (2014) Research Methods for Sport Studies and Sport Management: A practical guide. London: Routledge
Statistical Package for the Social Sciences (SPSS)
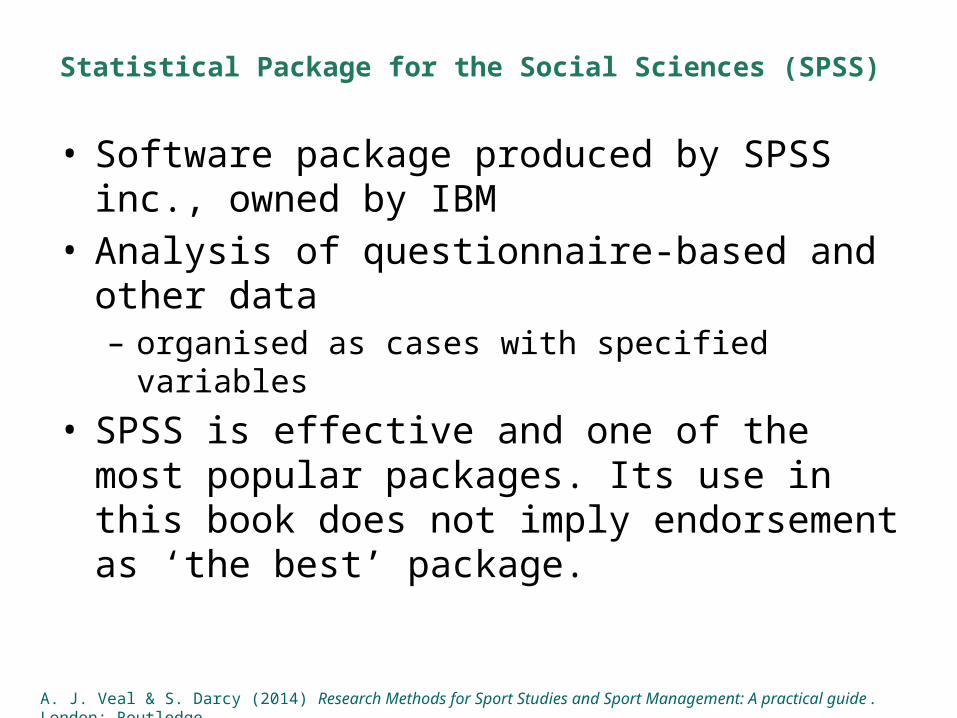
• Software package produced by SPSS inc., owned by IBM
• Analysis of questionnaire-based and other data– organised as cases with specified variables
• SPSS is effective and one of the most popular packages. Its use in this book does not imply endorsement as ‘the best’ package.
A. J. Veal & S. Darcy (2014) Research Methods for Sport Studies and Sport Management: A practical guide. London: Routledge
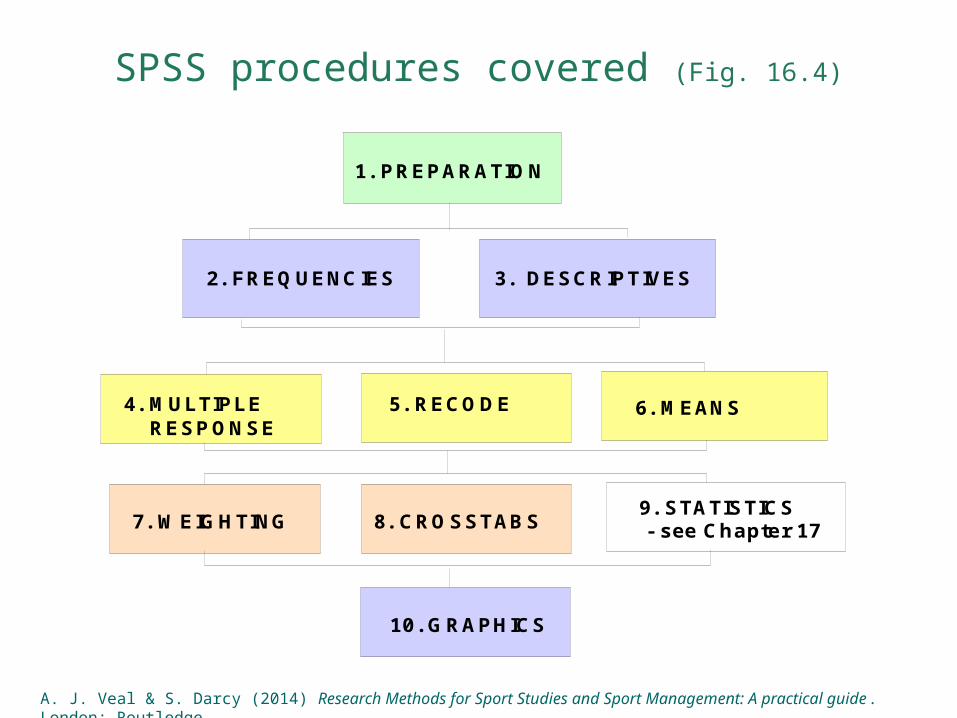
SPSS procedures covered (Fig. 16.4)
3. DESCRIPTIVES
4. MULTIPLE RESPONSE
5. RECODE
7. WEIGHTING
6. MEANS
8. CROSSTABS9. STATISTICS - see Chapter 17
10. GRAPHICS
1. PREPARATION
2. FREQUENCIES
A. J. Veal & S. Darcy (2014) Research Methods for Sport Studies and Sport Management: A practical guide. London: Routledge
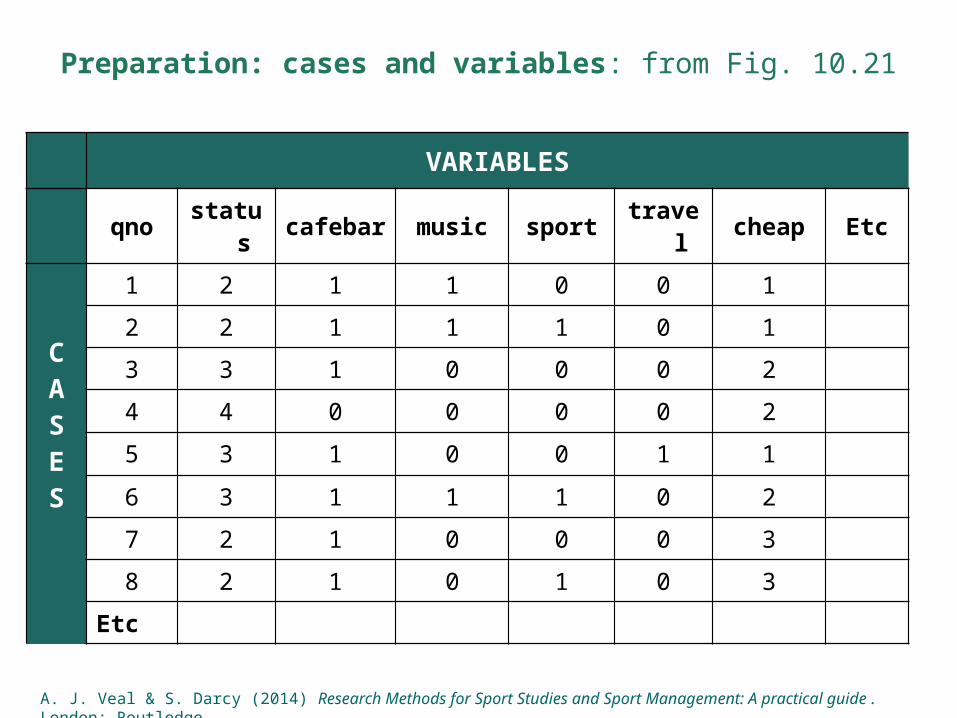
Preparation: cases and variables: from Fig. 10.21
VARIABLES
qno status cafebar music sport travel cheap Etc
CASES
1 2 1 1 0 0 1
2 2 1 1 1 0 1
3 3 1 0 0 0 2
4 4 0 0 0 0 2
5 3 1 0 0 1 1
6 3 1 1 1 0 2
7 2 1 0 0 0 3
8 2 1 0 1 0 3
Etc
A. J. Veal & S. Darcy (2014) Research Methods for Sport Studies and Sport Management: A practical guide. London: Routledge
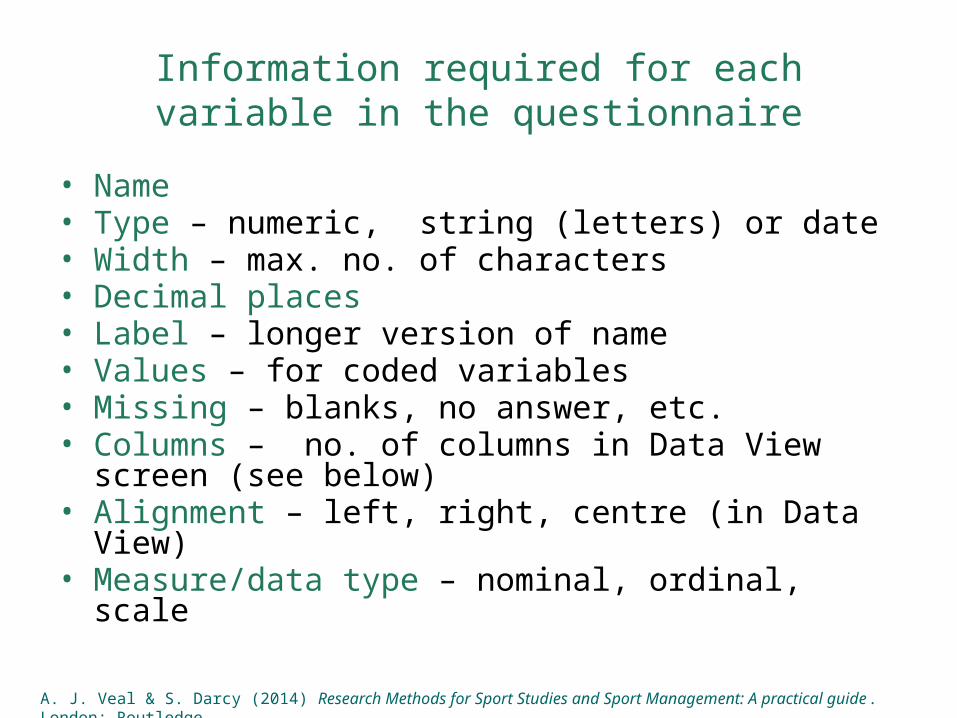
Information required for each variable in the questionnaire
• Name• Type – numeric, string (letters) or date• Width – max. no. of characters• Decimal places• Label – longer version of name• Values – for coded variables• Missing – blanks, no answer, etc. • Columns – no. of columns in Data View screen (see below)• Alignment – left, right, centre (in Data View)• Measure/data type – nominal, ordinal, scale
A. J. Veal & S. Darcy (2014) Research Methods for Sport Studies and Sport Management: A practical guide. London: Routledge
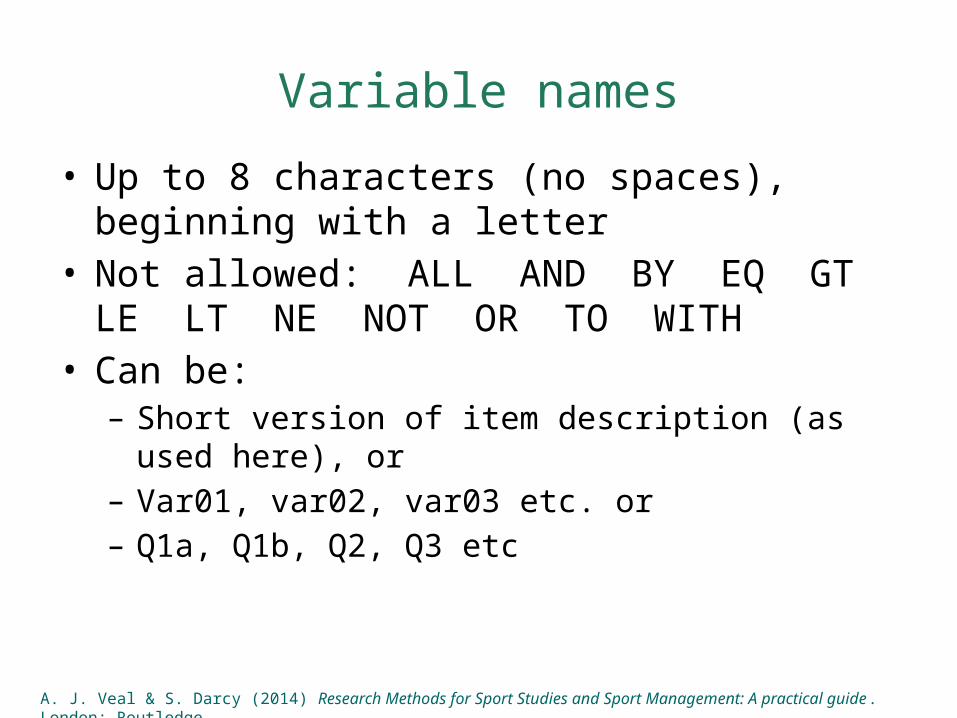
Variable names
• Up to 8 characters (no spaces), beginning with a letter
• Not allowed: ALL AND BY EQ GT LE LT NE NOT OR TO WITH
• Can be:– Short version of item description (as used here), or– Var01, var02, var03 etc. or– Q1a, Q1b, Q2, Q3 etc
A. J. Veal & S. Darcy (2014) Research Methods for Sport Studies and Sport Management: A practical guide. London: Routledge

Types of measure
• Nominal: described in words – eg. male/female• Ordinal: Ranked: 1, 2, 3 … means 1st, 2nd, 3rd ….• Scale: fully numeric
A. J. Veal & S. Darcy (2014) Research Methods for Sport Studies and Sport Management: A practical guide. London: Routledge

Variable View
• Information on variables is entered in the SPSS ‘Variable View’ screen
A. J. Veal & S. Darcy (2014) Research Methods for Sport Studies and Sport Management: A practical guide. London: Routledge

Variable view screen (Fig. 16.8)
Data View
• Data entered directly on the Data View screen, or
• Can be imported from a spreadsheet file
A. J. Veal & S. Darcy (2014) Research Methods for Sport Studies and Sport Management: A practical guide. London: Routledge
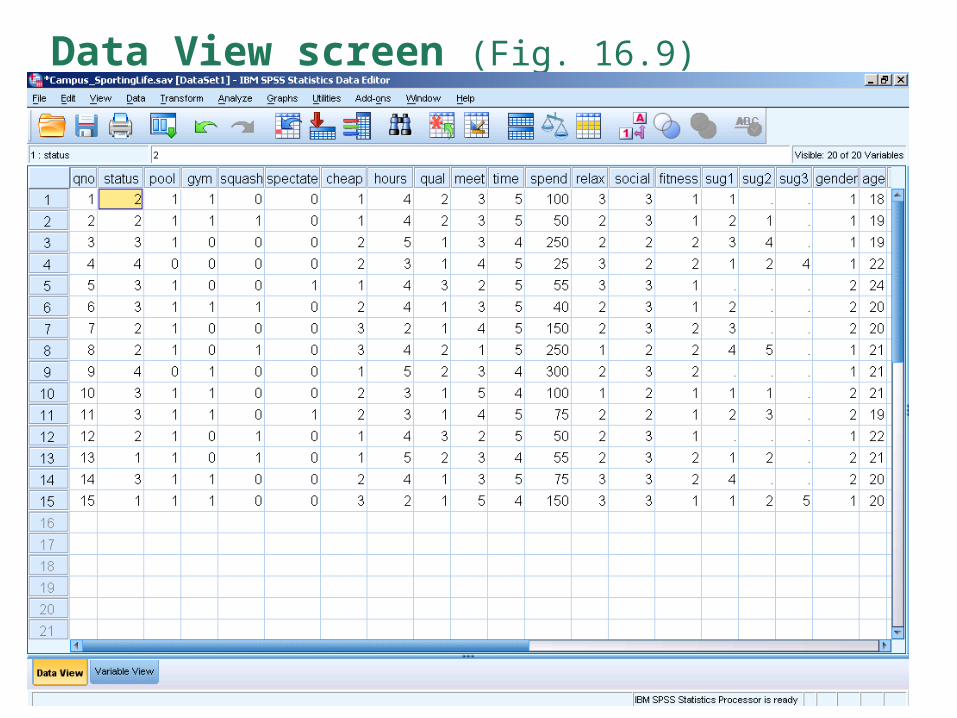
Data View screen (Fig. 16.9)
Note to teachers• It is not envisaged that SPSS detailed procedures
would be the subject of a PowerPoint presentation: students would benefit most from following the procedures in practical sessions
• A copy of the Campus Sporting Life data files is available on the book website
• However, teachers may wish to discuss the nature/ purpose of the various procedures.
• Slides are therefore included with the outputs from the procedures
A. J. Veal & S. Darcy (2014) Research Methods for Sport Studies and Sport Management: A practical guide. London: Routledge

Descriptives: N, Minimum, Maximum, Mean & Standard Deviation for each variable.
A. J. Veal & S. Darcy (2014) Research Methods for Sport Studies and Sport Management: A practical guide. London: Routledge
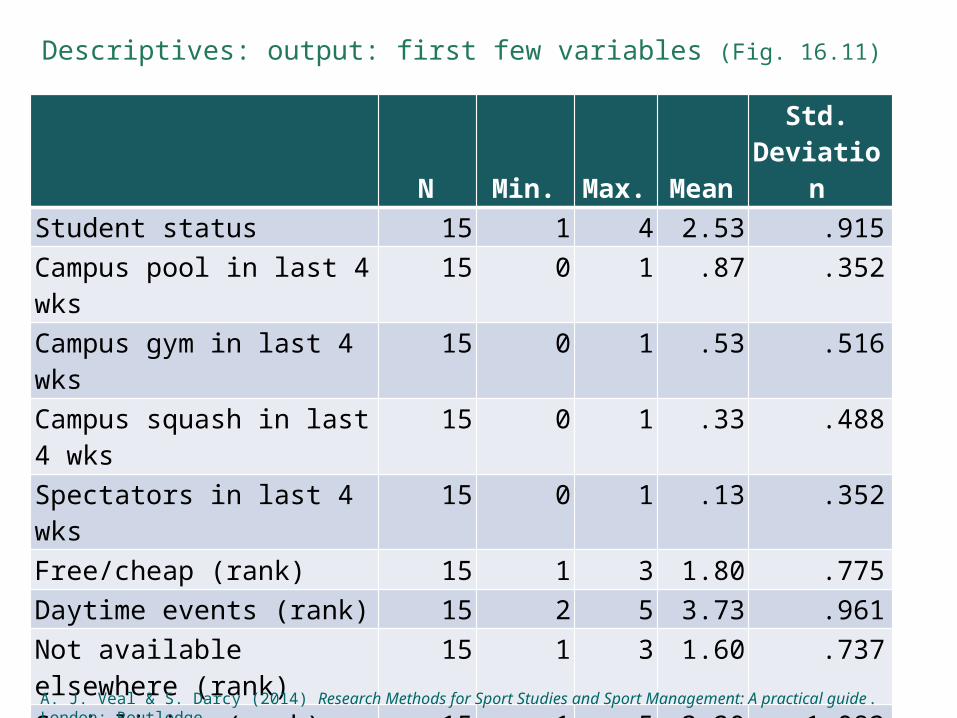
Descriptives: output: first few variables (Fig. 16.11)
N Min. Max. MeanStd.
DeviationStudent status 15 1 4 2.53 .915Campus pool in last 4 wks 15 0 1 .87 .352Campus gym in last 4 wks 15 0 1 .53 .516Campus squash in last 4 wks 15 0 1 .33 .488Spectators in last 4 wks 15 0 1 .13 .352Free/cheap (rank) 15 1 3 1.80 .775Daytime events (rank) 15 2 5 3.73 .961Not available elsewhere (rank) 15 1 3 1.60 .737Socialising (rank) 15 1 5 3.20 1.082Quality of presentation (rank) 15 4 5 4.67 .488Entertainment exp./month 15 25 300 115.00 87.076Relaxation opportunities – imp. 15 1 3 2.20 .676Etc.
A. J. Veal & S. Darcy (2014) Research Methods for Sport Studies and Sport Management: A practical guide. London: Routledge
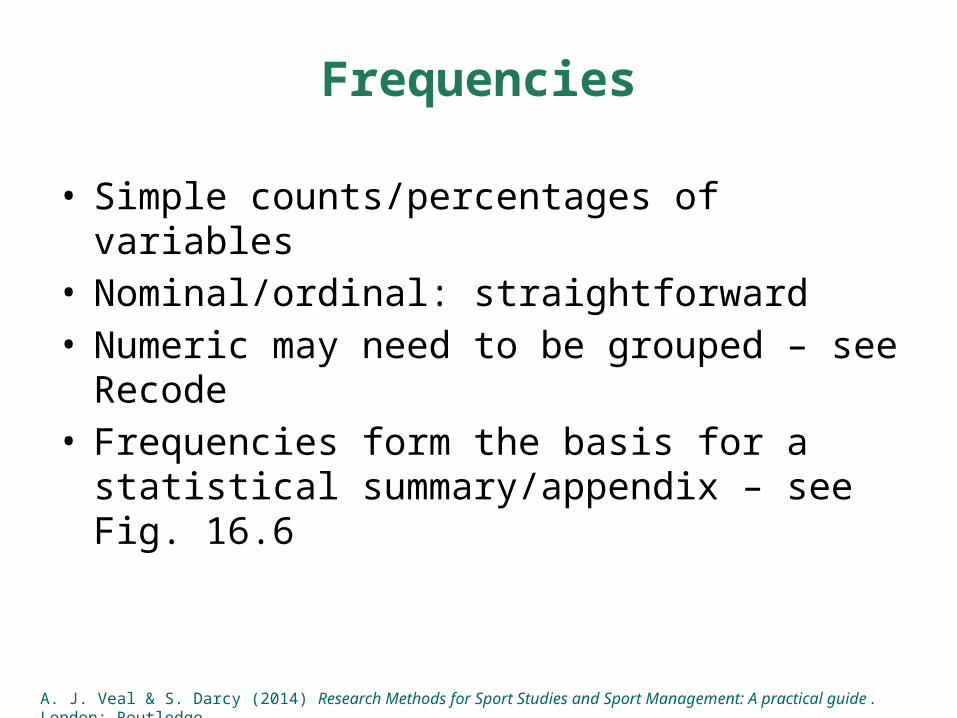
Frequencies
• Simple counts/percentages of variables• Nominal/ordinal: straightforward• Numeric may need to be grouped – see Recode• Frequencies form the basis for a statistical
summary/appendix – see Fig. 16.6
A. J. Veal & S. Darcy (2014) Research Methods for Sport Studies and Sport Management: A practical guide. London: Routledge

Frequencies: output (Fig. 16.12)
Student status Frequency PercentValid
PercentCumulative
PercentValid F/T student/no paid work 2 13.3 13.3 13.3
F/T student/paid work 5 33.3 33.3 46.7P/T student - F/T job 6 40.0 40.0 86.7P/T student/Other 2 13.3 13.3 100.0Total 15 100.0 100.0
Frequencies for all variables: see Appendix 16.1
A. J. Veal & S. Darcy (2014) Research Methods for Sport Studies and Sport Management: A practical guide. London: Routledge
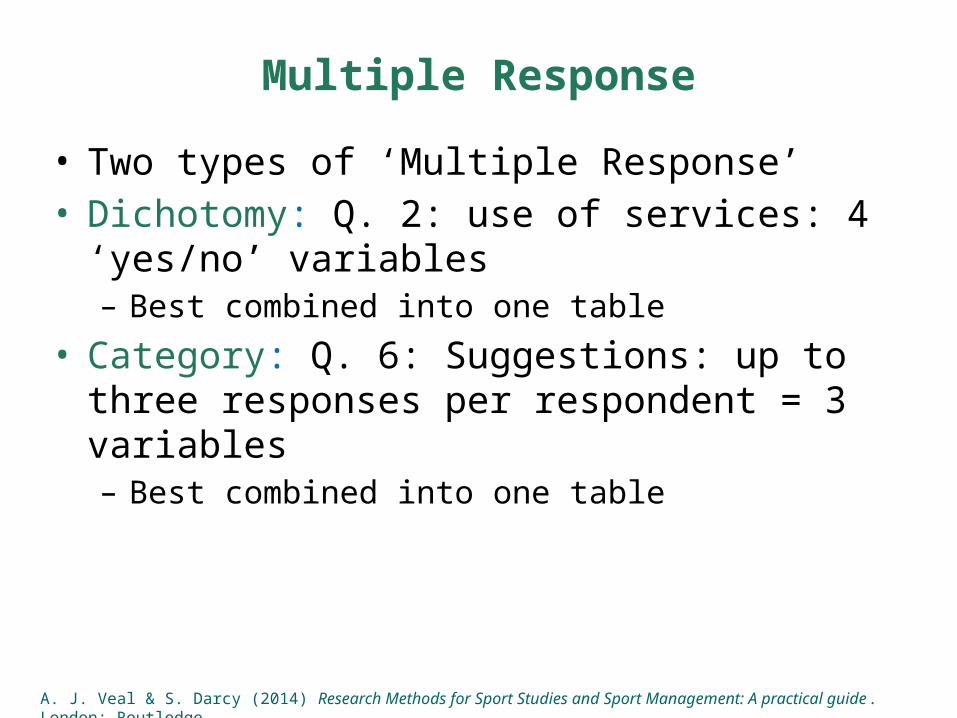
Multiple Response
• Two types of ‘Multiple Response’• Dichotomy: Q. 2: use of services: 4 ‘yes/no’ variables– Best combined into one table
• Category: Q. 6: Suggestions: up to three responses per respondent = 3 variables– Best combined into one table
A. J. Veal & S. Darcy (2014) Research Methods for Sport Studies and Sport Management: A practical guide. London: Routledge
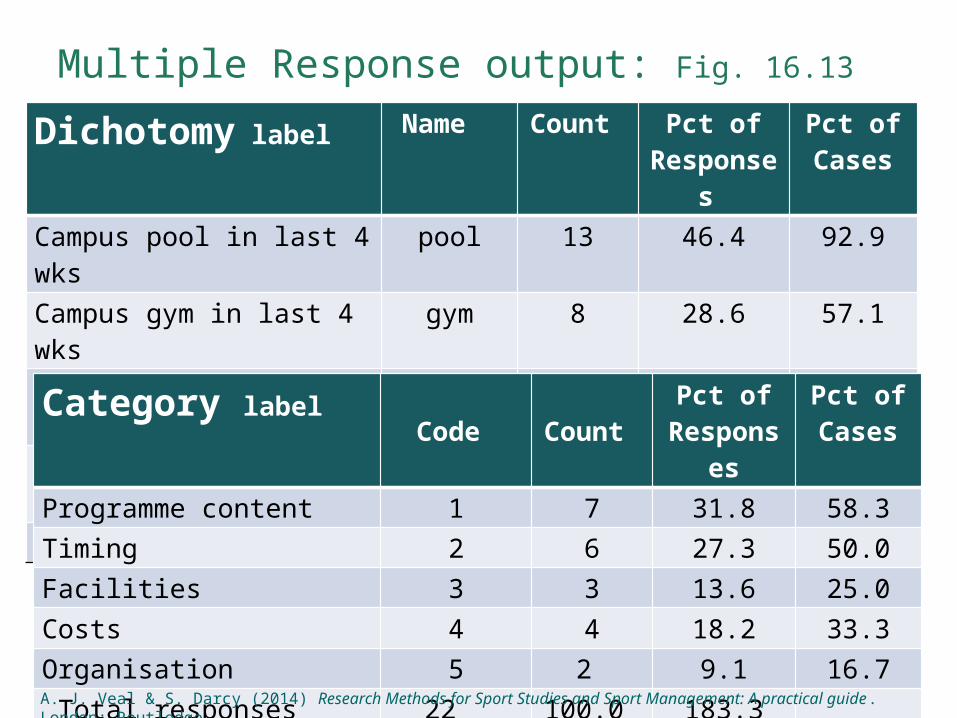
Multiple Response output: Fig. 16.13
Dichotomy label Name Count Pct of Responses
Pct ofCases
Campus pool in last 4 wks pool 13 46.4 92.9Campus gym in last 4 wks gym 8 28.6 57.1Campus squash in last 4 wks squash 5 17.9 35.7Spectate, campus in last 4 wks spectate 2 7.1 14.3Total responses 28 100.0 200.0
Category label Code Count
Pct of Responses
Pct of Cases
Programme content 1 7 31.8 58.3Timing 2 6 27.3 50.0Facilities 3 3 13.6 25.0Costs 4 4 18.2 33.3Organisation 5 2 9.1 16.7 Total responses 22 100.0 183.3
A. J. Veal & S. Darcy (2014) Research Methods for Sport Studies and Sport Management: A practical guide. London: Routledge
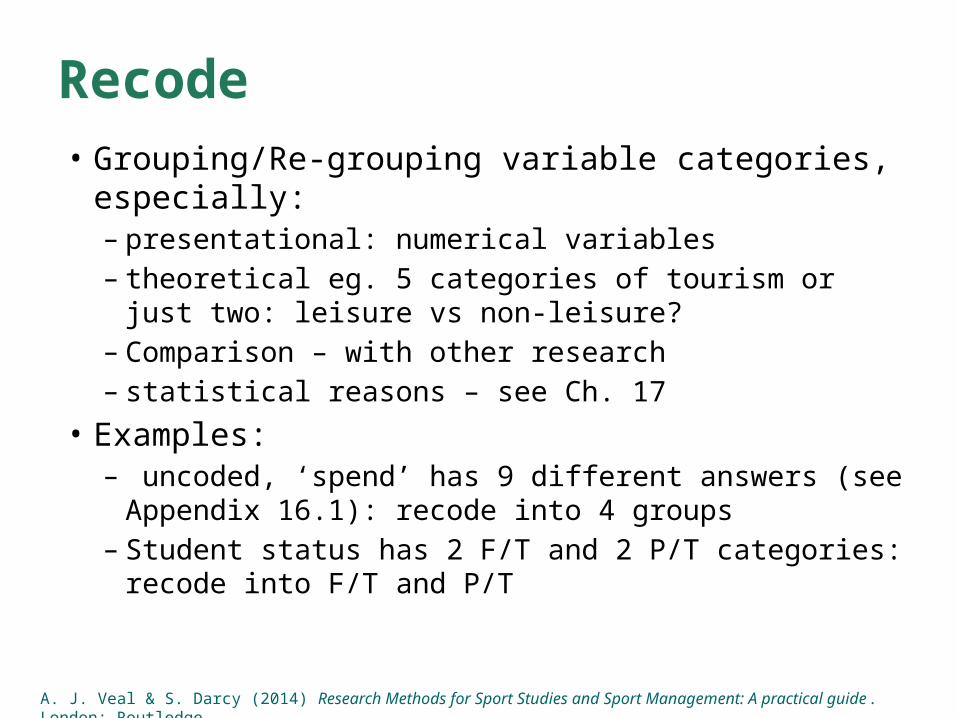
Recode• Grouping/Re-grouping variable categories, especially:
– presentational: numerical variables – theoretical eg. 5 categories of tourism or just two: leisure
vs non-leisure?– Comparison – with other research– statistical reasons – see Ch. 17
• Examples:– uncoded, ‘spend’ has 9 different answers (see Appendix
16.1): recode into 4 groups– Student status has 2 F/T and 2 P/T categories: recode into
F/T and P/T
A. J. Veal & S. Darcy (2014) Research Methods for Sport Studies and Sport Management: A practical guide. London: Routledge
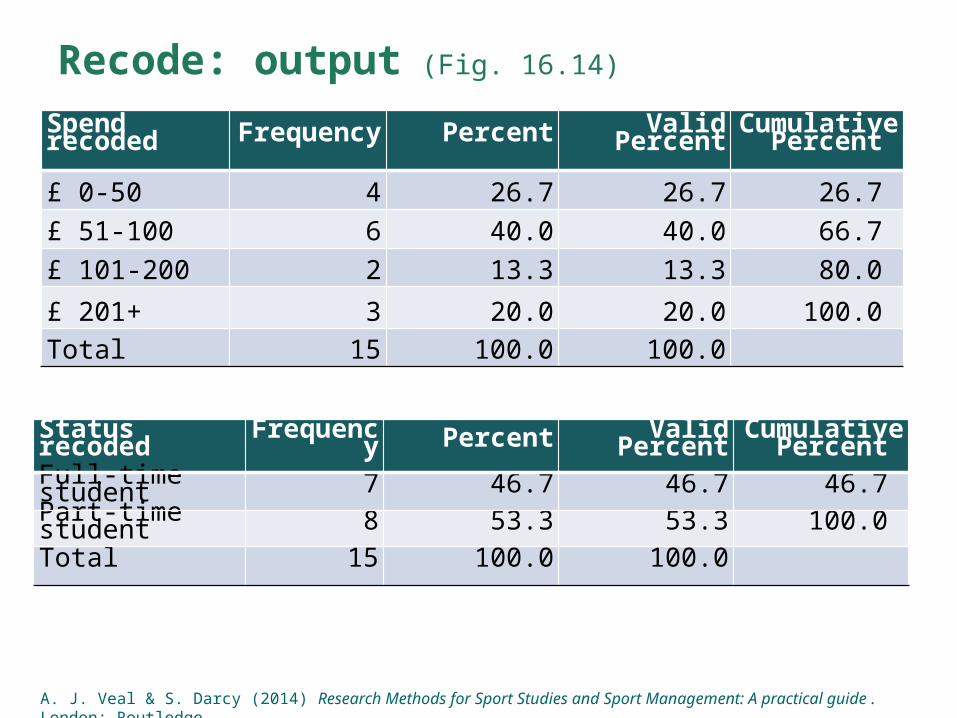
Recode: output (Fig. 16.14)
Spend recoded Frequency Percent Valid Percent Cumulative Percent
£ 0-50 4 26.7 26.7 26.7 £ 51-100 6 40.0 40.0 66.7 £ 101-200 2 13.3 13.3 80.0
£ 201+ 3 20.0 20.0 100.0 Total 15 100.0 100.0
Status recoded Frequency Percent Valid Percent Cumulative Percent
Full-time student 7 46.7 46.7 46.7 Part-time student 8 53.3 53.3 100.0 Total 15 100.0 100.0
A. J. Veal & S. Darcy (2014) Research Methods for Sport Studies and Sport Management: A practical guide. London: Routledge

Measures of central tendency: Mean, Median, Mode
• Mean = average • Median = middle value when all cases ranked in order• Mode = most popular value• Only valid with scale and ordinal variables• Options:– Add to ‘Frequencies’ procedure– Use ‘Means’
A. J. Veal & S. Darcy (2014) Research Methods for Sport Studies and Sport Management: A practical guide. London: Routledge
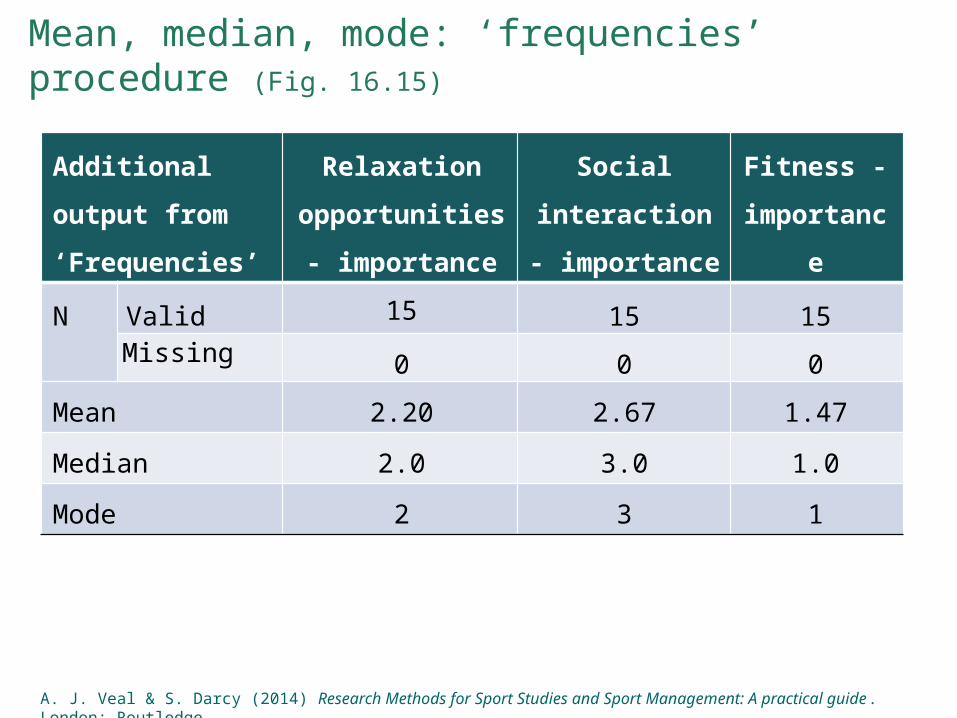
Mean, median, mode: ‘frequencies’ procedure (Fig. 16.15)
Additional output from ‘Frequencies’
Relaxation opportunities -
importance
Social interaction - importance
Fitness - importance
N Valid 15 15 15Missing 0 0 0
Mean 2.20 2.67 1.47Median 2.0 3.0 1.0Mode 2 3 1
A. J. Veal & S. Darcy (2014) Research Methods for Sport Studies and Sport Management: A practical guide. London: Routledge

Means procedure (Fig. 16.15)
Student status Mean N Std. Deviation*F/T student/no paid work 102.50 2 67.175F/T student/paid work 120.00 5 83.666P/T student - F/T job 99.17 6 76.643P/T student/Other 162.50 2 194.454Total 115.00 15 87.076
Mean expenditure by student status
A. J. Veal & S. Darcy (2014) Research Methods for Sport Studies and Sport Management: A practical guide. London: Routledge
Crosstabulation
• Table showing relationships between two or more variables
• Table can include one or more of the following:– counts– row %– column %– total % – statistical tests – see Ch. 17
• Procedure: ‘Crosstabs’
A. J. Veal & S. Darcy (2014) Research Methods for Sport Studies and Sport Management: A practical guide. London: Routledge
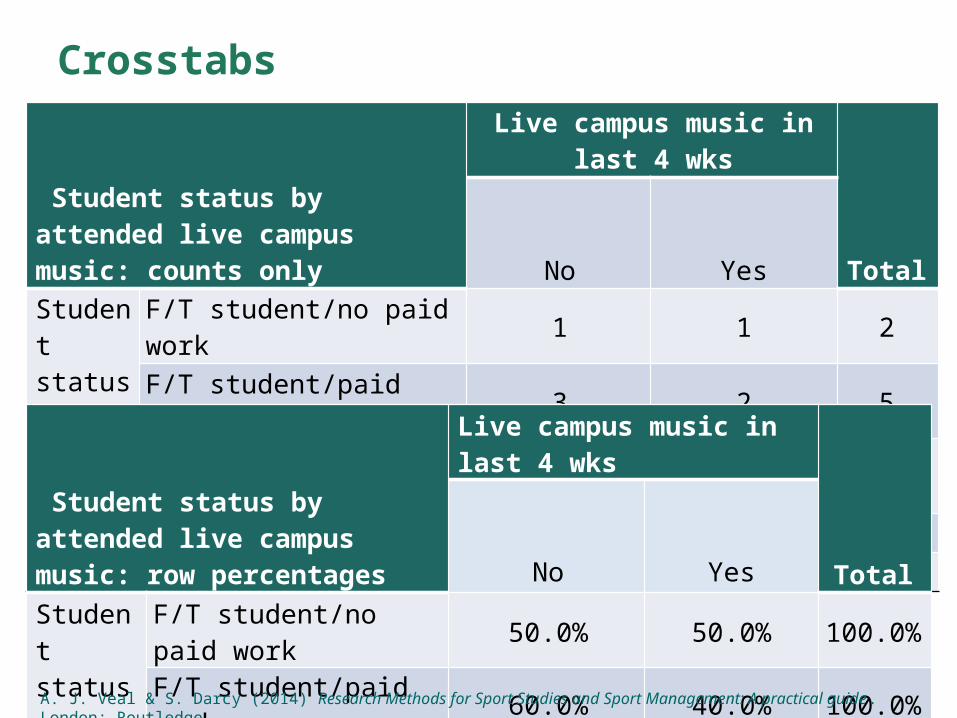
Crosstabs
Student status by attended live campus music: counts only
Live campus music in last 4 wks
TotalNo YesStudent status
F/T student/no paid work 1 1 2F/T student/paid work 3 2 5P/T student - F/T job 2 4 6P/T student/Other 1 1 2
Total 7 8 15
Student status by attended live campus music: row percentages
Live campus music in last 4 wks
TotalNo YesStudent status
F/T student/no paid work 50.0% 50.0% 100.0%F/T student/paid work 60.0% 40.0% 100.0%P/T student - F/T job 33.3% 66.7% 100.0%P/T student/Other 50.0% 50.0% 100.0%
Total 46.7% 53.3% 100.0%A. J. Veal & S. Darcy (2014) Research Methods for Sport Studies and Sport Management: A practical guide. London: Routledge
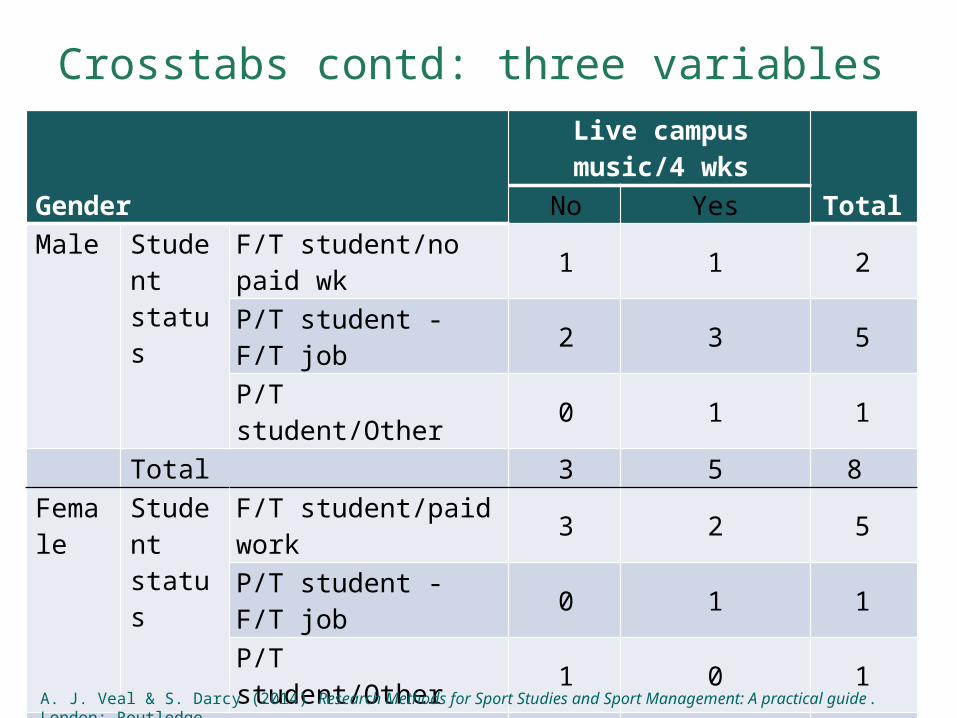
Crosstabs contd: three variables
Gender Live campus music/4 wks
TotalNo YesMale Student
statusF/T student/no paid wk 1 1 2P/T student - F/T job 2 3 5P/T student/Other 0 1 1
Total 3 5 8 Female Student
statusF/T student/paid work 3 2 5P/T student - F/T job 0 1 1P/T student/Other 1 0 1
Total 4 3 7
A. J. Veal & S. Darcy (2014) Research Methods for Sport Studies and Sport Management: A practical guide. London: Routledge

Weighting
• Weighting discussed in Ch. 13• ‘Weight cases’ procedure• eg. if Masters students under-sampled:– suppose masters students need to be given a
weight of 1.3– create new variable wt– for Masters students wt = 1.3; all others: wt = 1– In ‘Weight cases’: weight by wt
A. J. Veal & S. Darcy (2014) Research Methods for Sport Studies and Sport Management: A practical guide. London: Routledge
Graphics
• Types:– bar graph– stacked bar graph– pie chart– line graph– scatter plot
• Different graph types suited to different data types
A. J. Veal & S. Darcy (2014) Research Methods for Sport Studies and Sport Management: A practical guide. London: Routledge
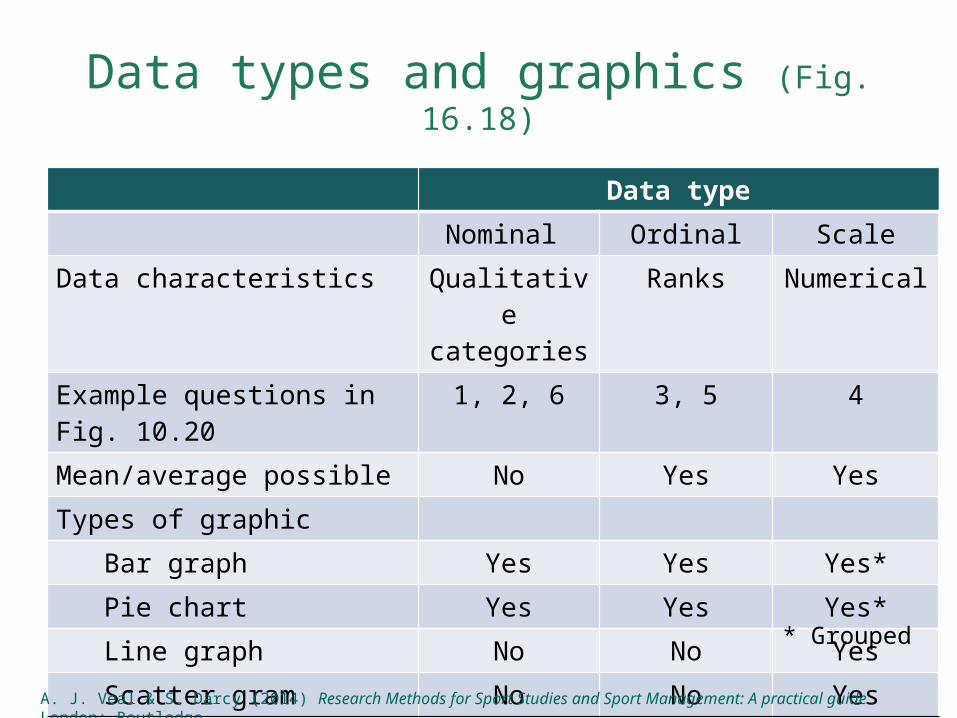
Data types and graphics (Fig. 16.18)
Data typeNominal Ordinal Scale
Data characteristics Qualitative categories
Ranks Numerical
Example questions in Fig. 10.20 1, 2, 6 3, 5 4Mean/average possible No Yes YesTypes of graphic Bar graph Yes Yes Yes* Pie chart Yes Yes Yes* Line graph No No Yes Scatter gram No No Yes
* Grouped
A. J. Veal & S. Darcy (2014) Research Methods for Sport Studies and Sport Management: A practical guide. London: Routledge

Bar chart
A. J. Veal & S. Darcy (2014) Research Methods for Sport Studies and Sport Management: A practical guide. London: Routledge

Stacked bar chart
A. J. Veal & S. Darcy (2014) Research Methods for Sport Studies and Sport Management: A practical guide. London: Routledge
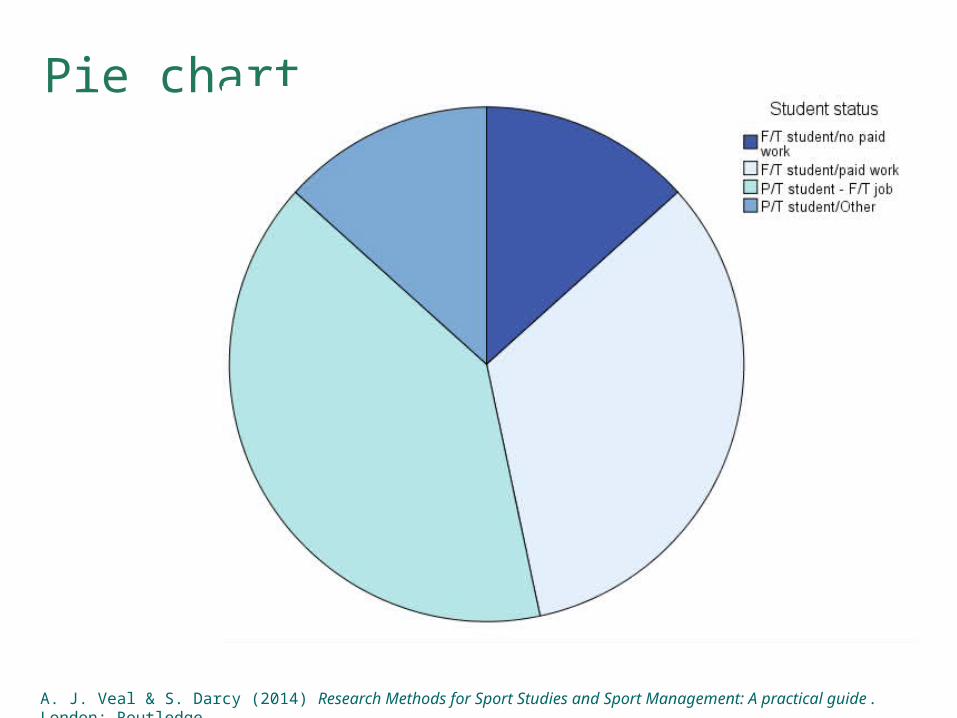
Pie chart
A. J. Veal & S. Darcy (2014) Research Methods for Sport Studies and Sport Management: A practical guide. London: Routledge
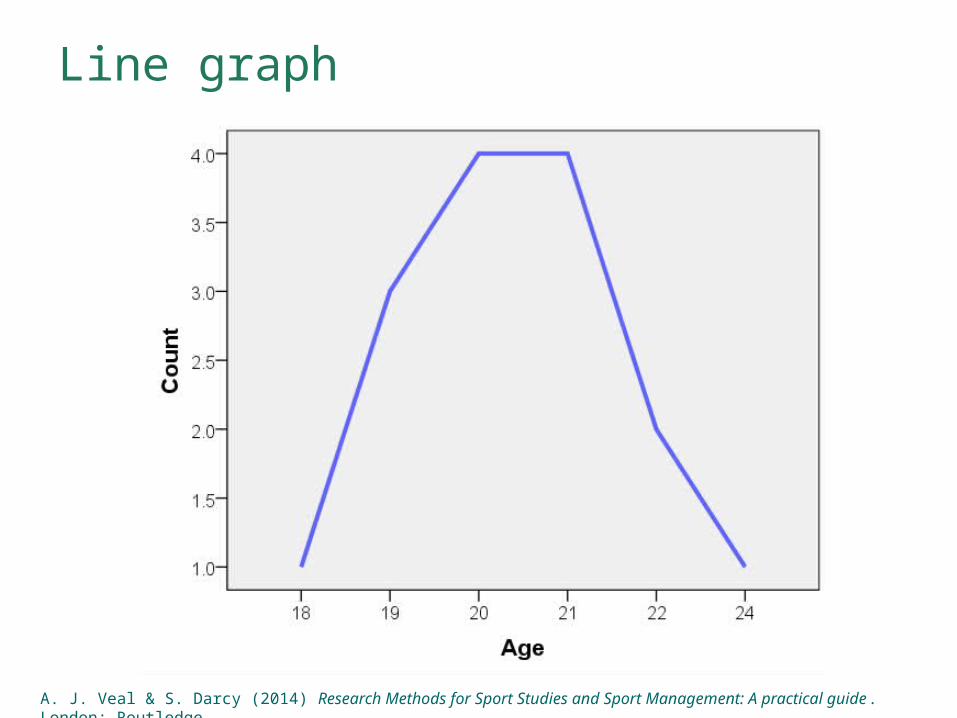
Line graph
A. J. Veal & S. Darcy (2014) Research Methods for Sport Studies and Sport Management: A practical guide. London: Routledge

Scatterplot
A. J. Veal & S. Darcy (2014) Research Methods for Sport Studies and Sport Management: A practical guide. London: Routledge


![[XLS]Value Analysis / Cost Justifcation Spreadsheet files/Automation_Justification.xls · Web viewYyUb15rA40OfsReezZBJfoS3m Module1 Financial Spreadsheet Investment Summary Savings](https://img.pdfslide.us/doc/110x75/5ab9b1857f8b9ad13d8e008e/xlsvalue-analysis-cost-justifcation-filesautomationjustificationxlsweb-viewyyub15ra40ofsreezzbjfos3m.jpg)