Embed Size (px)
Citation preview

149
Sanjoy K. Bhattacharya (ed.), Lipidomics: Methods and Protocols, Methods in Molecular Biology, vol. 1609,DOI 10.1007/978-1-4939-6996-8_14, © Springer Science+Business Media LLC 2017
Chapter 14
LC–MS-Based Lipidomics and Automated Identification of Lipids Using the LipidBlast In-Silico MS/MS Library
Tomas Cajka and Oliver Fiehn
Abstract
This protocol describes the analysis, specifically the identification, of blood plasma lipids. Plasma lipids are extracted using methyl tert-butyl ether (MTBE), methanol, and water followed by separation and data acquisition of isolated lipids using reversed-phase liquid chromatography coupled to quadrupole/time-of- flight mass spectrometry (RPLC–QTOFMS) operated in MS/MS mode. For lipid identification, acquired MS/MS spectra are converted to the mascot generic format (MGF) followed by library search using the in-silico MS/MS library LipidBlast. Using this approach, lipid classes, carbon-chain lengths, and degree of unsaturation of fatty-acid components are annotated.
Key words Liquid chromatography–mass spectrometry, Tandem mass spectrometry, Lipidomics, Lipids, Identification, LipidBlast
1 Introduction
Advances in mass spectrometry have had a big impact on overall lipidomics workflows over the last decade. Analytical protocols were streamlined and fast data acquisition mass spectrometers were introduced, enabling collecting multiple types of mass spectromet-ric data within a single run [1–3]. One of the key advantages of mass spectrometry is its ability to be used for quantification as well as molecule identification. By utilizing tandem mass spectrometry (MS/MS), the lipid class head group, the lengths of carbon-chains, and the degree of unsaturation of fatty-acid components of these acyl groups are annotated [4]. Licensed MS/MS repositories such as Metlin and NIST14, as well as public libraries such as MassBank, do not cover lipids well because these libraries are based on the acquisition of MS/MS spectra of pure chemical standards. For many lipids there are no commercially available lipid standards. Fortunately, many lipids break in an MS/MS experiment in a pre-dictable manner. Fragmentation rules were compiled from the literature and from authentic standards for 29 lipid classes, and

150
these rules were then applied to lipid structures that were gener-ated using in-silico methods to yield a really comprehensive lipido-mics library for compound annotations [5].
Generating an in-silico MS/MS library consists of the following steps: (1) selecting lipid classes of interest and defining structural boundaries to exclude biologically improbable compounds; (2) gen-erating all possible structures in-silico within these structural bound-aries; (3) interpreting experimental MS/MS spectra from literature, other libraries, and authentic standards; (4) generating rules based on characteristic fragmentations; (5) modeling MS/MS spectra including ion abundances for each in-silico molecular species; (6) validating the in-silico MS/MS spectra with additional compounds that were not included in the rule generation; (7) demonstrating the applicability of such library in proof-of- principle studies (Fig. 1) [5]. Besides the protocol presented here, different software solutions for lipid identification are available either from vendors (e.g., LipidView, Lipid Search, SimLipid) or as independent platforms (e.g., LipidBlast [5], LipidXplorer [6], LipidQA [7]) for untargeted LC–MS/MS-based lipi-domics. However, no thorough comparison of advantages and disad-vantages of these programs has been published.
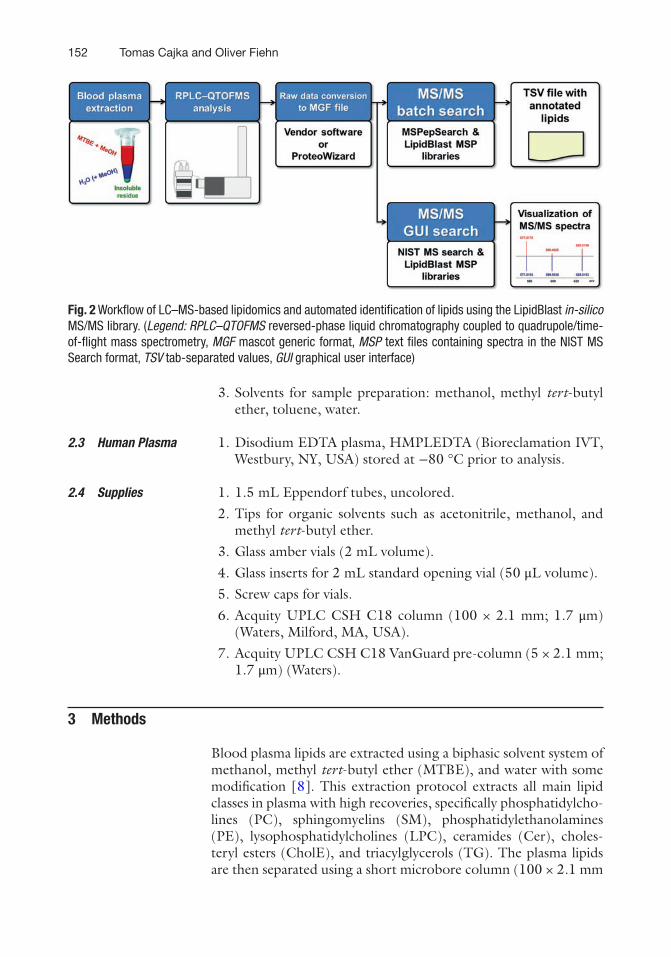
Here, we present a protocol for using the in-silico MS/MS library LipidBlast for the identification of blood plasma lipids sepa-rated using reversed-phase liquid chromatography coupled to high-resolution mass spectrometry with a quadrupole/time-of- flight mass analyzer (RPLC–QTOFMS) (Fig. 2). With slight mod-ifications, the protocol can be used also with high-resolution mass analyzer such as a quadrupole/orbital ion trap, or unit resolution mass spectrometers such as an ion trap or a single quadrupole.
2 Materials
1. Calibrated pipettes 1–10 μL, 10–200 μL, and 100–1000 μL. 2. Vortexer. 3. Orbital mixing chilling/heating plate. 4. Centrifuge. 5. Centrifugal vacuum concentrator. 6. Agilent 1290 Infinity LC system (Agilent Technologies, Santa
Clara, CA, USA) with a pump (G4220A), a column oven (G1316C), and an autosampler (G4226A).
7. Agilent 6550 iFunnel QTOFMS system (Agilent) with an electro-spray ion source operated in positive and negative ion polarity.
1. LC–MS-grade solvents: water, acetonitrile, isopropanol. 2. Mobile-phase modifiers: formic acid, ammonium formate,
ammonium acetate.
2.1 Equipment
2.2 Reagents
Tomas Cajka and Oliver Fiehn

151
Fig. 1 Creating, validating, and applying in-silico generated MS/MS spectra in LipidBlast. (a) Lipid compound structures are generated using in-silico methods. Lipid core structure scaffolds are connected via a linker to fatty acyls with different chain lengths and different degrees of unsaturation. Asterisks denote connection points. (b) Reference tandem spectra (top) are used to simulate mass spectral fragmentations and ion abun-dances of the in-silico spectra (bottom). The compound shown is a phosphatidylcholine (PC), PC (16:0/16:1) at precursor m/z 732.55 [M+H]+. (c) For lipid identification, MS/MS spectra obtained from LC–MS/MS experi-ments are submitted to LipidBlast. An m/z precursor-ion filter filters the data based on m/z precursors. If accurate mass data are used, usually 10 ppm precursor windows are used. Subsequently, experimental frag-ment ions are matched against the library spectra, generating a hit score that reflects the level of confidence for compound annotation. (Reproduced from [5] with permission from Nature Publishing Group)
152
3. Solvents for sample preparation: methanol, methyl tert-butyl ether, toluene, water.
1. Disodium EDTA plasma, HMPLEDTA (Bioreclamation IVT, Westbury, NY, USA) stored at −80 °C prior to analysis.
1. 1.5 mL Eppendorf tubes, uncolored. 2. Tips for organic solvents such as acetonitrile, methanol, and
methyl tert-butyl ether. 3. Glass amber vials (2 mL volume). 4. Glass inserts for 2 mL standard opening vial (50 μL volume). 5. Screw caps for vials. 6. Acquity UPLC CSH C18 column (100 × 2.1 mm; 1.7 μm)
(Waters, Milford, MA, USA). 7. Acquity UPLC CSH C18 VanGuard pre-column (5 × 2.1 mm;
1.7 μm) (Waters).
3 Methods
Blood plasma lipids are extracted using a biphasic solvent system of methanol, methyl tert-butyl ether (MTBE), and water with some modification [8]. This extraction protocol extracts all main lipid classes in plasma with high recoveries, specifically phosphatidylcho-lines (PC), sphingomyelins (SM), phosphatidylethanolamines (PE), lysophosphatidylcholines (LPC), ceramides (Cer), choles-teryl esters (CholE), and triacylglycerols (TG). The plasma lipids are then separated using a short microbore column (100 × 2.1 mm
2.3 Human Plasma
2.4 Supplies
Fig. 2 Workflow of LC–MS-based lipidomics and automated identification of lipids using the LipidBlast in-silico MS/MS library. (Legend: RPLC–QTOFMS reversed-phase liquid chromatography coupled to quadrupole/time- of- flight mass spectrometry, MGF mascot generic format, MSP text files containing spectra in the NIST MS Search format, TSV tab-separated values, GUI graphical user interface)
Tomas Cajka and Oliver Fiehn

153
I.D.) with 1.7 μm particle size with C18 sorbent, which represents the currently preferred method in LC–MS-based lipidomics [1]. Using positive and negative electrospray ionization with different mobile-phase modifiers for each polarity increases the coverage of detected lipids [9]. Fig. 3 shows typical positive and negative elec-trospray ionization chromatograms of plasma lipids.
High-resolution mass spectrometry employing a quadrupole/time-of-flight mass analyzer is used for tandem MS/MS spectra collection. For the system used, different fixed collision energies (+20 eV and −40 eV for ESI(+) and ESI(−), respectively) are used to obtain information-rich MS/MS spectra. After data
Fig. 3 Total ion chromatograms of plasma lipids, highlighting retention time ranges of particular lipid classes. (a) LC–ESI(+)-MS analysis; (b) LC–ESI(−)-MS analysis. (Legend: Cer ceramides, CholE cholesteryl esters, DG diacylglycerols, LPC lysophosphatidylcholines, LPE lysophosphatidylethanolamines, PC phos-phatidylcholines, PE phosphatidylethanolamines, PI phosphatidylinositols, SM sphingomyelins, TG triacylglycerols)
LC–MS-based Lipidomics & the LipidBlast Library

154
acquisition, MS/MS spectra are converted to an MGF file. This MGF file is queried for lipid annotation using the in-silico MS/MS library LipidBlast [5].
1. Add 225 μL of cold methanol (see Notes 1 and 2) to a 10 μL blood plasma aliquot (see Note 3) in a 1.5 mL tube (see Note 4).
2. Vortex at maximum for 10 s. 3. Add 750 μL of cold MTBE (see Note 1). 4. Vortex for 10 s. 5. Shake for 6 min at 4 °C in the orbital mixer. 6. Add 188 μL of MS-grade water (see Note 5). 7. Vortex for 20 s. 8. Centrifuge the sample for 2 min at 14,000 × g. 9. Collect two 200 μL aliquots (see Note 4). 10. Evaporate the aliquots. 11. For LC–ESI(+)-QTOFMS analysis:
(a) Resuspend dry extract using 150 μL of a methanol/tolu-ene (9:1, v/v) mixture (see Note 4).
(b) Vortex for 10 s. (c) Centrifuge the extract for 2 min at 14,000 × g. (d) Transfer 100 μL to a glass amber vial with a micro-insert. (e) Cap the vial. (f) Perform LC–ESI(+)-QTOFMS analysis.
12. For LC–ESI(−)-QTOFMS analysis:
(a) Resuspend dry extract using 50 μL of a methanol/toluene (9:1, v/v) mixture (see Note 4).
(b) Vortex for 10 s. (c) Centrifuge the extracts for 2 min at 14,000 × g. (d) Transfer 45 μL to a glass amber vial with a micro-insert. (e) Cap the vial. (f) Perform LC–ESI(−)-QTOFMS analysis.
1. Prepare the tuning solution: 10 mL Agilent Low Concentration ESI Tuning mix (Agilent), 88.5 mL acetonitrile, 4.5 mL water, 3 μL 0.1 mM HP-0321. Make sure to add the components in the order listed to avoid precipitation of any components of the tuning mix.
2. Tune the instrument in both polarities using tuning solution. 3. Prepare the reference ion mass solution: 95 mL acetonitrile,
5 mL water, 100 μL 5 mM 921 Reference Ion, and 100 μL
3.1 Sample Preparation
3.2 LC–MS Analysis
3.2.1 Pre-Run Procedures
Tomas Cajka and Oliver Fiehn
155
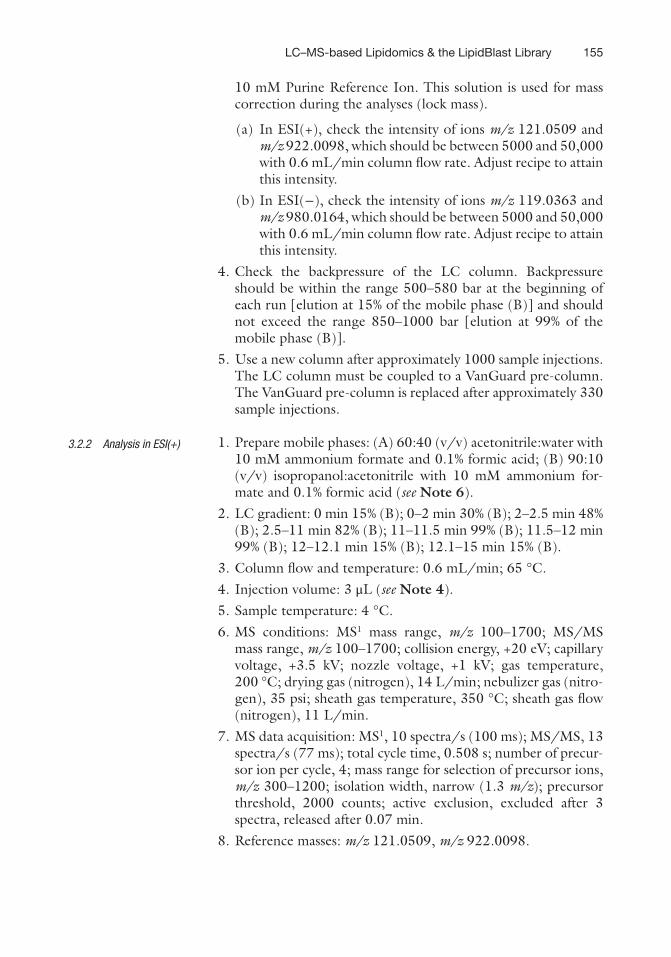
10 mM Purine Reference Ion. This solution is used for mass correction during the analyses (lock mass).
(a) In ESI(+), check the intensity of ions m/z 121.0509 and m/z 922.0098, which should be between 5000 and 50,000 with 0.6 mL/min column flow rate. Adjust recipe to attain this intensity.
(b) In ESI(−), check the intensity of ions m/z 119.0363 and m/z 980.0164, which should be between 5000 and 50,000 with 0.6 mL/min column flow rate. Adjust recipe to attain this intensity.
4. Check the backpressure of the LC column. Backpressure should be within the range 500–580 bar at the beginning of each run [elution at 15% of the mobile phase (B)] and should not exceed the range 850–1000 bar [elution at 99% of the mobile phase (B)].
5. Use a new column after approximately 1000 sample injections. The LC column must be coupled to a VanGuard pre-column. The VanGuard pre-column is replaced after approximately 330 sample injections.
1. Prepare mobile phases: (A) 60:40 (v/v) acetonitrile:water with 10 mM ammonium formate and 0.1% formic acid; (B) 90:10 (v/v) isopropanol:acetonitrile with 10 mM ammonium for-mate and 0.1% formic acid (see Note 6).
2. LC gradient: 0 min 15% (B); 0–2 min 30% (B); 2–2.5 min 48% (B); 2.5–11 min 82% (B); 11–11.5 min 99% (B); 11.5–12 min 99% (B); 12–12.1 min 15% (B); 12.1–15 min 15% (B).
3. Column flow and temperature: 0.6 mL/min; 65 °C. 4. Injection volume: 3 μL (see Note 4). 5. Sample temperature: 4 °C. 6. MS conditions: MS1 mass range, m/z 100–1700; MS/MS
mass range, m/z 100–1700; collision energy, +20 eV; capillary voltage, +3.5 kV; nozzle voltage, +1 kV; gas temperature, 200 °C; drying gas (nitrogen), 14 L/min; nebulizer gas (nitro-gen), 35 psi; sheath gas temperature, 350 °C; sheath gas flow (nitrogen), 11 L/min.
7. MS data acquisition: MS1, 10 spectra/s (100 ms); MS/MS, 13 spectra/s (77 ms); total cycle time, 0.508 s; number of precur-sor ion per cycle, 4; mass range for selection of precursor ions, m/z 300–1200; isolation width, narrow (1.3 m/z); precursor threshold, 2000 counts; active exclusion, excluded after 3 spectra, released after 0.07 min.
8. Reference masses: m/z 121.0509, m/z 922.0098.
3.2.2 Analysis in ESI(+)
LC–MS-based Lipidomics & the LipidBlast Library
156
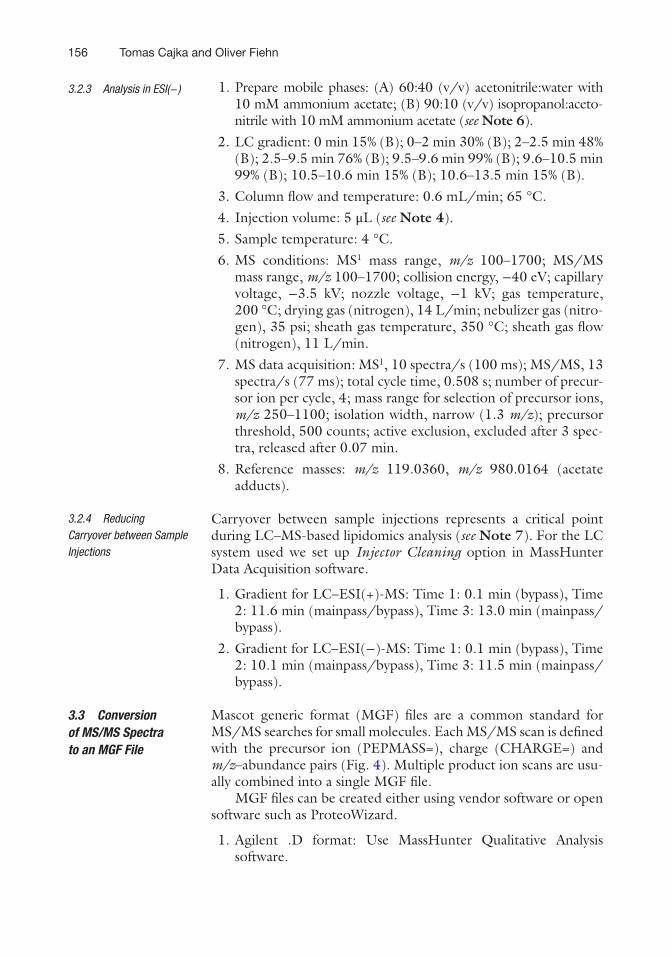
1. Prepare mobile phases: (A) 60:40 (v/v) acetonitrile:water with 10 mM ammonium acetate; (B) 90:10 (v/v) isopropanol:aceto-nitrile with 10 mM ammonium acetate (see Note 6).
2. LC gradient: 0 min 15% (B); 0–2 min 30% (B); 2–2.5 min 48% (B); 2.5–9.5 min 76% (B); 9.5–9.6 min 99% (B); 9.6–10.5 min 99% (B); 10.5–10.6 min 15% (B); 10.6–13.5 min 15% (B).
3. Column flow and temperature: 0.6 mL/min; 65 °C. 4. Injection volume: 5 μL (see Note 4). 5. Sample temperature: 4 °C. 6. MS conditions: MS1 mass range, m/z 100–1700; MS/MS
mass range, m/z 100–1700; collision energy, −40 eV; capillary voltage, −3.5 kV; nozzle voltage, −1 kV; gas temperature, 200 °C; drying gas (nitrogen), 14 L/min; nebulizer gas (nitro-gen), 35 psi; sheath gas temperature, 350 °C; sheath gas flow (nitrogen), 11 L/min.
7. MS data acquisition: MS1, 10 spectra/s (100 ms); MS/MS, 13 spectra/s (77 ms); total cycle time, 0.508 s; number of precur-sor ion per cycle, 4; mass range for selection of precursor ions, m/z 250–1100; isolation width, narrow (1.3 m/z); precursor threshold, 500 counts; active exclusion, excluded after 3 spec-tra, released after 0.07 min.
8. Reference masses: m/z 119.0360, m/z 980.0164 (acetate adducts).
Carryover between sample injections represents a critical point during LC–MS-based lipidomics analysis (see Note 7). For the LC system used we set up Injector Cleaning option in MassHunter Data Acquisition software.
1. Gradient for LC–ESI(+)-MS: Time 1: 0.1 min (bypass), Time 2: 11.6 min (mainpass/bypass), Time 3: 13.0 min (mainpass/bypass).
2. Gradient for LC–ESI(−)-MS: Time 1: 0.1 min (bypass), Time 2: 10.1 min (mainpass/bypass), Time 3: 11.5 min (mainpass/bypass).
Mascot generic format (MGF) files are a common standard for MS/MS searches for small molecules. Each MS/MS scan is defined with the precursor ion (PEPMASS=), charge (CHARGE=) and m/z–abundance pairs (Fig. 4). Multiple product ion scans are usu-ally combined into a single MGF file.
MGF files can be created either using vendor software or open software such as ProteoWizard.
1. Agilent .D format: Use MassHunter Qualitative Analysis software.
3.2.3 Analysis in ESI(−)
3.2.4 Reducing Carryover between Sample Injections
3.3 Conversion of MS/MS Spectra to an MGF File
Tomas Cajka and Oliver Fiehn

157
2. Thermo .raw format: Use extractMSn and MSFilereader plus dependency libraries.
3. SCIEX .wiff format: Use PeakView software and installation of MS Data Converter (downloadable at http://sciex.com/software-downloads-x2110).
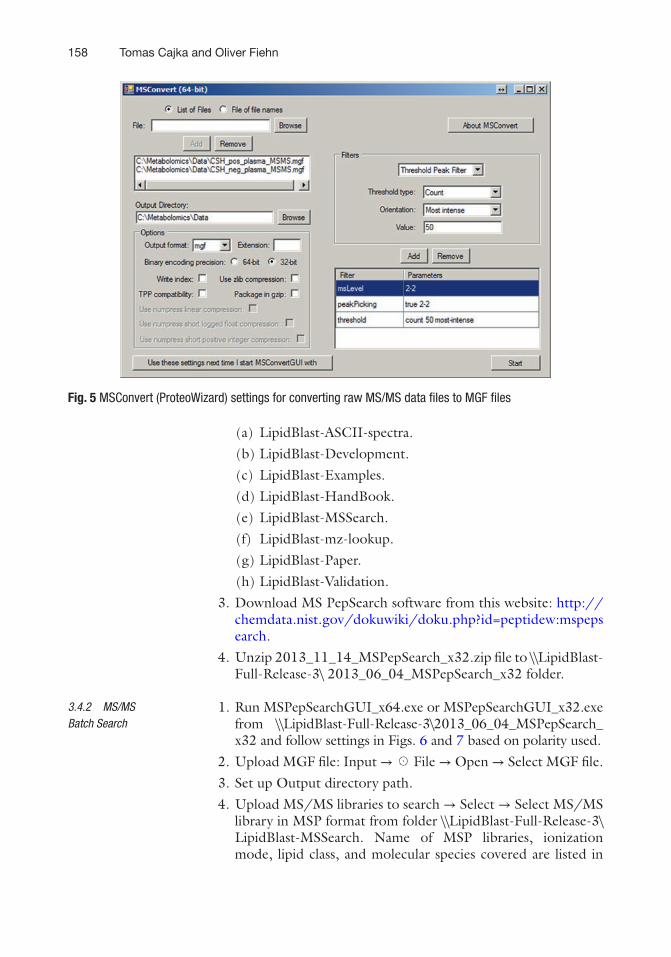
4. Alternatively, ProteoWizard software can be used to create MGF files (Fig. 5).
(a) Download and install the latest version of the ProteoWizard from the following website: http://proteowizard.source-forge.net.
(b) Run MSConvert.exe from ProteoWizard folder. (c) Browse and add files using MSConvert application. (d) Select output directory. (e) Select output format: mgf; binary encoding precision:
32-bit. (f) Select appropriate filters such as MS Level to work with
MS/MS data only, Peak Picking to centroid data, and Threshold Peak Filter (count; most intense; 50).
(g) Start conversion using Start, check the progress and create the MGF file.
1. Download the latest version of the LipidBlast from the follow-ing website: http://fiehnlab.ucdavis.edu/projects/LipidBlast (section Download LipidBlast)
2. Unzip the file. The LipidBlast folder contains several sub-folders:
3.4 LipidBlast in-Silico MS/MS Library
3.4.1 Installation
Fig. 4 Example of a product ion scan in mascot generic format (MGF)
LC–MS-based Lipidomics & the LipidBlast Library
158
(a) LipidBlast-ASCII-spectra. (b) LipidBlast-Development. (c) LipidBlast-Examples. (d) LipidBlast-HandBook. (e) LipidBlast-MSSearch. (f) LipidBlast-mz-lookup. (g) LipidBlast-Paper. (h) LipidBlast-Validation.
3. Download MS PepSearch software from this website: http://chemdata.nist.gov/dokuwiki/doku.php?id=peptidew:mspepsearch.
4. Unzip 2013_11_14_MSPepSearch_x32.zip file to \\LipidBlast- Full- Release-3\ 2013_06_04_MSPepSearch_x32 folder.
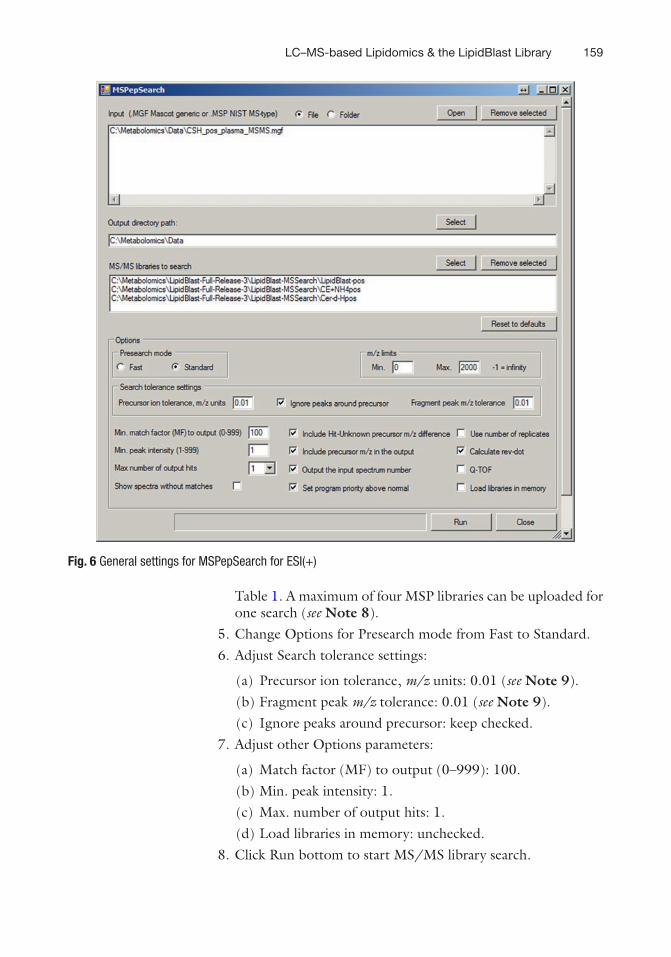
1. Run MSPepSearchGUI_x64.exe or MSPepSearchGUI_x32.exe from \\LipidBlast-Full-Release-3\2013_06_04_MSPepSearch_x32 and follow settings in Figs. 6 and 7 based on polarity used.
2. Upload MGF file: Input → ☉ File → Open → Select MGF file. 3. Set up Output directory path. 4. Upload MS/MS libraries to search → Select → Select MS/MS
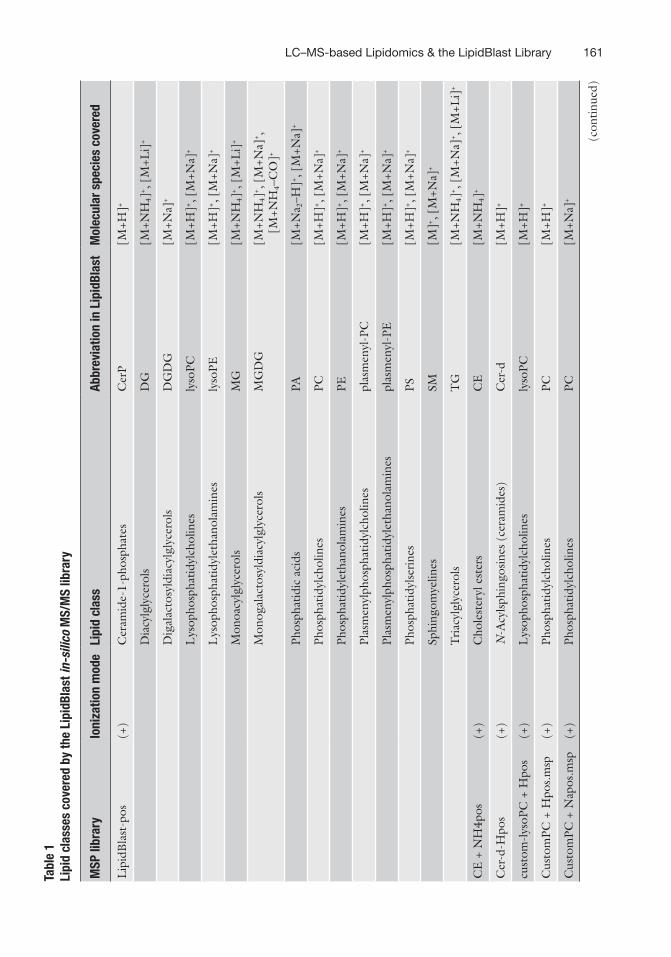
library in MSP format from folder \\LipidBlast-Full-Release-3\LipidBlast-MSSearch. Name of MSP libraries, ionization mode, lipid class, and molecular species covered are listed in
3.4.2 MS/MS Batch Search
Fig. 5 MSConvert (ProteoWizard) settings for converting raw MS/MS data files to MGF files
Tomas Cajka and Oliver Fiehn
159
Table 1. A maximum of four MSP libraries can be uploaded for one search (see Note 8).
5. Change Options for Presearch mode from Fast to Standard. 6. Adjust Search tolerance settings:
(a) Precursor ion tolerance, m/z units: 0.01 (see Note 9). (b) Fragment peak m/z tolerance: 0.01 (see Note 9). (c) Ignore peaks around precursor: keep checked.
7. Adjust other Options parameters:
(a) Match factor (MF) to output (0–999): 100. (b) Min. peak intensity: 1. (c) Max. number of output hits: 1. (d) Load libraries in memory: unchecked.
8. Click Run bottom to start MS/MS library search.
Fig. 6 General settings for MSPepSearch for ESI(+)
LC–MS-based Lipidomics & the LipidBlast Library
160
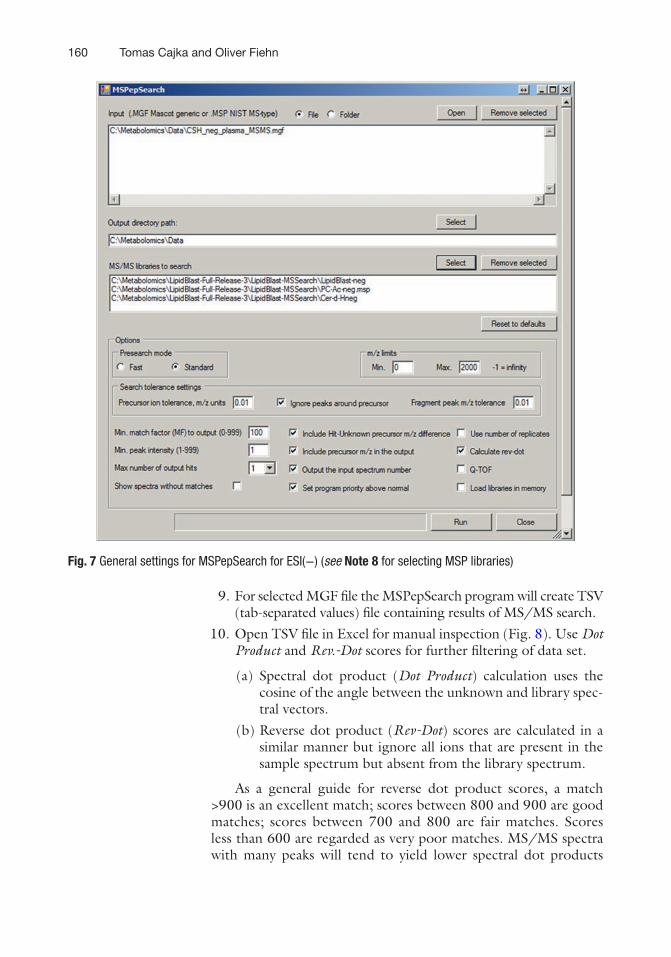
9. For selected MGF file the MSPepSearch program will create TSV (tab-separated values) file containing results of MS/MS search.
10. Open TSV file in Excel for manual inspection (Fig. 8). Use Dot Product and Rev.-Dot scores for further filtering of data set.
(a) Spectral dot product (Dot Product) calculation uses the cosine of the angle between the unknown and library spec-tral vectors.
(b) Reverse dot product (Rev-Dot) scores are calculated in a similar manner but ignore all ions that are present in the sample spectrum but absent from the library spectrum.
As a general guide for reverse dot product scores, a match >900 is an excellent match; scores between 800 and 900 are good matches; scores between 700 and 800 are fair matches. Scores less than 600 are regarded as very poor matches. MS/MS spectra with many peaks will tend to yield lower spectral dot products
Fig. 7 General settings for MSPepSearch for ESI(−) (see Note 8 for selecting MSP libraries)
Tomas Cajka and Oliver Fiehn
161Ta
ble
1 Li
pid
clas
ses
cove
red
by th
e Li
pidB
last
in-s
ilico
MS/
MS
libra
ry
MSP
libr
ary
Ioni
zatio
n m
ode
Lipi
d cl
ass
Abbr
evia
tion
in L
ipid
Blas
tM
olec
ular
spe
cies
cov
ered
Lip
idB
last
-pos
(+)
Cer
amid
e-1-
phos
phat
esC
erP
[M+H
]+
Dia
cylg
lyce
rols
DG
[M+N
H4]
+ , [
M+L
i]+
Dig
alac
tosy
ldia
cylg
lyce
rols
DG
DG
[M+N
a]+
Lys
opho
spha
tidyl
chol
ines
lyso
PC[M
+H]+ ,
[M
+Na]
+
Lys
opho
spha
tidyl
etha
nola
min
esly
soPE
[M+H
]+ , [
M+N
a]+
Mon
oacy
lgly
cero
lsM
G[M
+NH
4]+ ,
[M
+Li]
+
Mon
ogal
acto
syld
iacy
lgly
cero
lsM
GD
G[M
+NH
4]+ ,
[M
+Na]
+ ,
[M+N
H4–
CO
]+
Phos
phat
idic
aci
dsPA
[M+N
a 2–H
]+ , [
M+N
a]+
Phos
phat
idyl
chol
ines
PC[M
+H]+ ,
[M
+Na]
+
Phos
phat
idyl
etha
nola
min
esPE
[M+H
]+ , [
M+N
a]+
Plas
men
ylph
osph
atid
ylch
olin
espl
asm
enyl
-PC
[M+H
]+ , [
M+N
a]+
Plas
men
ylph
osph
atid
ylet
hano
lam
ines
plas
men
yl-P
E[M
+H]+ ,
[M
+Na]
+
Phos
phat
idyl
seri
nes
PS[M
+H]+ ,
[M
+Na]
+
Sphi
ngom
yelin
esSM
[M]+ ,
[M
+Na]
+
Tri
acyl
glyc
erol
sT
G[M
+NH
4]+ ,
[M
+Na]
+ , [
M+L
i]+
CE
+ N
H4p
os(+
)C
hole
ster
yl e
ster
sC
E[M
+NH
4]+
Cer
-d-H
pos
(+)
N-A
cyls
phin
gosi
nes
(cer
amid
es)
Cer
-d[M
+H]+
cust
om-l
ysoP
C +
Hpo
s(+
)L
ysop
hosp
hatid
ylch
olin
esly
soPC
[M+H
]+
Cus
tom
PC +
Hpo
s.m
sp(+
)Ph
osph
atid
ylch
olin
esPC
[M+H
]+
Cus
tom
PC +
Nap
os.m
sp(+
)Ph
osph
atid
ylch
olin
esPC
[M+N
a]+
(con
tinue
d)
LC–MS-based Lipidomics & the LipidBlast Library

162
MSP
libr
ary
Ioni
zatio
n m
ode
Lipi
d cl
ass
Abbr
evia
tion
in L
ipid
Blas
tM
olec
ular
spe
cies
cov
ered
cust
om-S
M +
Hpo
s(+
)Sp
hing
omye
lines
SM[M
]+
lyso
PA +
Hpo
s.m
sp(+
)L
ysop
hosp
hatid
ic a
cids
LPA
[M+H
]+
Lip
idB
last
-neg
(−)
Dia
cyla
ted
phos
phat
idyl
inos
itol m
onom
anno
side
Ac2
PIM
1[M
–H]−
Dia
cyla
ted
phos
phat
idyl
inos
itol d
iman
nosi
deA
c2PI
M2
[M–H
]−
Tri
acyl
ated
pho
spha
tidyl
inos
itol d
iman
nosi
deA
c3PI
M2
[M–H
]−
Tet
raac
ylat
ed p
hosp
hatid
ylin
osito
l dim
anno
side
Ac4
PIM
2[M
–H]−
Cer
amid
e-1-
phos
phat
esC
erP
[M–H
]−
Car
diol
ipin
sC
L[M
–H]−
, [M
–2H
]2−
Dig
alac
tosy
ldia
cylg
lyce
rols
DG
DG
[M–H
]−
Gan
glio
side
s[g
lyca
n]-C
er[M
–H]−
Dip
hosp
hory
late
d he
xaac
yl L
ipid
AL
ipid
A-P
P[M
–H]−
Lys
opho
spha
tidyl
etha
nola
min
esly
soPE
[M–H
]−
Mon
ogal
acto
syld
iacy
lgly
cero
lsM
GD
G[M
–H]−
Phos
phat
idic
aci
dsPA
[M–H
]−
Phos
phat
idyl
etha
nola
min
esPE
[M–H
]−
Phos
phat
idyl
glyc
erol
sPG
[M–H
]−
Phos
phat
idyl
inos
itols
PI[M
–H]−
Phos
phat
idyl
seri
nes
PS[M
–H]−
Sulfo
quin
ovos
yldi
acyl
glyc
erol
sSQ
DG
[M–H
]−
Sulfa
tides
ST[M
–H]−
Tabl
e 1
(con
tinue
d)
Tomas Cajka and Oliver Fiehn

163M
SP li
brar
yIo
niza
tion
mod
eLi
pid
clas
sAb
brev
iatio
n in
Lip
idBl
ast
Mol
ecul
ar s
peci
es c
over
ed
Cer
-d-H
neg
(−)
N-A
cyls
phin
gosi
nes
(cer
amid
es)
Cer
-d[M
–H]−
PC-A
c-ne
g.m
sp(−
)Ph
osph
atid
ylch
olin
esPC
[M+C
H3C
OO
]−
PC-F
orm
-neg
.msp
(−)
Phos
phat
idyl
chol
ines
PC[M
+HC
OO
]−
PC-M
e-ne
g.m
sp(−
)Ph
osph
atid
ylch
olin
esPC
[M–C
H3]
−
LC–MS-based Lipidomics & the LipidBlast Library

164
Fig.
8 E
xam
ple
of T
SV fi
le c
onta
inin
g an
ove
rvie
w o
f ide
ntifi
ed li
pids
bas
ed o
n M
S/M
S an
d Li
pidB
last
sea
rch.
Leg
end:
(1) s
can
num
ber i
n M
GF fi
le; (
2) n
ame
of
data
file
pro
cess
ed w
ith p
artic
ular
pre
curs
or io
n an
d re
tent
ion
time;
(3) p
recu
rsor
m/z
; (4)
rank
; (5)
MSP
libr
ary
nam
e; (6
) ide
ntifi
catio
n nu
mbe
r in
parti
cula
r MSP
lib
rary
; (7)
diff
eren
ce b
etw
een
theo
retic
al (L
ib P
recu
rsor
m/z
) and
exp
erim
enta
l (Pr
ecur
sor m
/z) m
asse
s; (8
) the
oret
ical
mas
s of
pre
curs
or io
n; (9
) spe
ctra
l dot
pr
oduc
t; (1
0) re
vers
e do
t pro
duct
; (11
) ann
otat
ed li
pid
Tomas Cajka and Oliver Fiehn

165
(Dot Product) than similar spectra with fewer peaks. This can be the case when using higher collision energy leading to extensive fragmentation of precursor ion (Fig. 9).
11. If lipid annotations occur multiple times, there can be two rea-sons: (1) a true separation of isomers, as in Fig. 10, where two triacylglycerols have the same precursor mass and the same number of acyl carbons and double bonds, however, differ in acyl chain lengths. (2) If MS/MS spectra are annotated with identical isomeric structures, peaks should be at least one peak width apart from each other to exclude erroneous MS/MS selection of the same peak.
12. Some lipids may have lower dot product score because their MS/MS spectra represent a mixture of two or even more lipid isomers having the same number of carbon and double bonds but differ in acyl chain lengths (Fig. 11). Such coelutions unavoidably occur during LC–MS-based lipidomic profiling of complex samples. In this case, the particular lipid is annotated using both species (e.g., TG 52:3; TG 16:1_18:1_18:1 and TG 16:0_18:1_18:2). To get these annotations in TSV file change the Max number of output hits parameter from 1 to 2 or 3 in the MSPepSearch (Figs. 6 and 7).
Fig. 9 Experimental MS/MS spectra of TG 16:0_18:0_18:1 (a, b, c) with a precursor ion m/z 878.8172 [M+NH4]+) and LipidBlast MS/MS spectrum (d). Using different collision energies (CE) yields more fragment ions and thus impacts calculating spectral dot products (Dot Prod.) and reversed dot products (Rev-Dot)
LC–MS-based Lipidomics & the LipidBlast Library

166
13. Each identified lipid can be manually inspected based on scan number using MS/MS Graphical User Interface (GUI)-based search.
1. Run nistms.exe from \\LipidBlast-Full-Release-3\LipidBlast- MSSearch folder.
2. Upload MGF file: File → Open → Choose file for spectra/structures import with files of type MGF.
3.4.3 MS/MS Graphical User Interface (GUI)-Based Search
Fig. 10 Extracted ion chromatograms of TG 54:5, m/z 898.7859 [M+NH4]+ with marked data points per peak: MS/MS spectrum acquired, no MS/MS data acquired
Fig. 11 MS/MS spectrum of TG 52:3 (precursor ion m/z 874.7859 [M+NH4]+) with two different MS/MS anno-tations from the LipidBlast library
Tomas Cajka and Oliver Fiehn

167
3. Check or change LipidBlast libraries including the settings and precursor and product ion window (Fig. 12):
(a) Options → Library Search Options → Search → Identity (MS/MS).
(b) Options → Library Search Options → MS/MS → MS/MS Search m/z Tolerance → Precursor ±0.01; Product ions ±0.01.
(c) Options → Library Search Options → MS/MS → Peptide MS/MS Options → Cysteine modification: None; Display: Reverse/Impure; Score Threshold: Low.
(d) Options → Library Search Options → MS/MS → Libraries → Add all libraries from Available Libs to Included Libs.
4. Double click on m/z value at a particular retention time to check if there is an MS/MS match with the LipidBlast MS/MS library (Fig. 13).
Fig. 12 Settings for MS/MS searches in the NIST MS graphic user interface
LC–MS-based Lipidomics & the LipidBlast Library

168
Fig.
13
Visu
aliz
atio
n of
libr
ary
sear
ch in
NIS
T M
S GU
I
Tomas Cajka and Oliver Fiehn

169
4 Notes
1. Store solvents (methanol, MTBE) in the −20 °C freezer to prechill.
2. To prevent contamination disposable material is used. To pre-vent inhalation of organic solvent vapor, use fume hood during lipid extraction.
3. Thaw each plasma sample on ice. During the extraction keep the Eppendorf tubes either on ice or use prechilled (−20 °C) block.
4. This extraction procedure has been optimized for the Agilent 6550 iFunnel QTOFMS system. For other LC–MS systems dif-fering in their sensitivity the protocol can be modified including (1) volume of blood plasma for analysis (10–30 μL), (2) aliquot taken during the extraction (up to ~700 μL MTBE/methanol layer), (3) volume of resuspension solvent, and (4) volume injected. To avoid band broadening during LC–MS analysis, we recommend a maximum volume of 5 μL during injection.
5. Store water in the +4 °C fridge to prechill. 6. To enhance solubilization of ammonium formate and ammo-
nium acetate after their addition in the mobile phase, dissolve these salts in a small volume of water before their addition in the mobile phases (0.631 g ammonium formate or 0.771 g ammonium acetate/1 mL water/1 L mobile phase). Mix each mobile phase with modifiers, sonicate them for 15 min to achieve complete dissolving of modifiers (salts), mix them again, and then sonicate for another 15 min.
7. Run plasma extract followed by injection of solvent mixture (methanol:toluene, 9:1, v/v) for checking the carryover. The carryover effect is observed mainly for triacylglycerols. Check the most intensive species such as TG 52:2 (m/z 876.802 [M+NH4]+) and TG 52:3 (m/z 874.786 [M+NH4]+) to evalu-ate the carryover. Carryover <0.2% for these most abundant lipid species is acceptable. If possible use different wash solvents during the sample injections, for instance, weak wash solvent: acetonitrile/water (50:50, v/v) followed by a strong wash sol-vent: isopropanol. If only one solvent for washing is available, use isopropanol and also check a software option to clean the injector using valve switching (e.g., Agilent) at the different composition of mobile phase to release adsorbed lipids.
8. [M+Li]+ ions are observed if a base such as LiOH is used as a mobile-phase modifier or coinjected during ionization. For phosphatidylcholines, the formation of [M+HCOO]− and [M+CH3COO]− adducts depends on mobile-phase modifier used. Use PC-Ac-neg.msp library if using ammonium acetate
LC–MS-based Lipidomics & the LipidBlast Library
170
(i.e., acetate adducts) and PC-Form-neg.msp library if using ammonium formate (i.e., formate adducts) mobile phase modifier.
9. Precursor and fragment ion tolerance depend on the mass accuracy of the particular instrument. Keep in mind that fixed mass tolerance in mDa has different values in ppm. For instance, using 0.01 Da mass tolerance this corresponds to 33, 20, 12, and 10 ppm mass tolerance for precursor ions m/z 300, 500, 800, and 1000, respectively. A wider ion tolerance (0.02–0.05 Da) can be used if precursor ions are very abun-dant, because mass accuracy is biased if the mass detector is saturated. However, default values should use narrower pre-cursor window tolerances in order to limit false-positive peak detections.
Acknowledgments
This study was supported by the U.S. National Institutes of Health (NIH) Grants P20 HL113452 and U24 DK097154.
References
1. Cajka T, Fiehn O (2014) Comprehensive analy-sis of lipids in biological systems by liquid chromatography- mass spectrometry. Trac- Trend Anal Chem 61:192–206. doi:10.1016/j.trac.2014.04.017
2. Hyotylainen T, Oresic M (2015) Optimizing the lipidomics workflow for clinical studies--practical considerations. Anal Bioanal Chem 407(17):4973–4993. doi:10.1007/s00216-015-8633-2
3. Cajka T, Fiehn O (2016) Toward merging untar-geted and targeted methods in mass spectrometry- based metabolomics and lipido-mics. Anal Chem 88(1):524–545. doi:10.1021/acs.analchem.5b04491
4. Blanksby SJ, Mitchell TW (2010) Advances in mass spectrometry for lipidomics. Annu Rev Anal Chem 3:433–465. doi:10.1146/annurev.anchem.111808.073705
5. Kind T, Liu KH, Lee do Y, DeFelice B, Meissen JK, Fiehn O (2013) LipidBlast in silico tandem mass spectrometry database for lipid identification. Nat Methods 10 (8):755-758. doi:10.1038/ nmeth.2551
6. Herzog R, Schuhmann K, Schwudke D, Sampaio JL, Bornstein SR, Schroeder M, Shevchenko A (2012) LipidXplorer: A software for consensual cross-platform lipidomics. Plos One 7(1.) ARTN:e29851. doi:10.1371/journal.pone.0029851
7. Song H, Hsu FF, Ladenson J, Turk J (2007) Algorithm for processing raw mass spectrometric data to identify and quantitate complex lipid molecular species in mixtures by data- dependent scanning and fragment ion database searching. J Am Soc Mass Spectr 18(10):1848–1858. doi:10.1016/j.jasms.2007.07.023
8. Matyash V, Liebisch G, Kurzchalia TV, Shevchenko A, Schwudke D (2008) Lipid extraction by methyl-tert-butyl ether for high- throughput lipidomics. J Lipid Res 49(5):1137–1146. doi:10.1194/jlr.D700041-JLR200
9. Cajka T, Fiehn O (2016) Increasing lipidomic coverage by selecting optimal mobile-phase modifiers in LC–MS of blood plasma. Metabolomics 12(2):article 34. doi:10.1007/s11306-015-0929-x
Tomas Cajka and Oliver Fiehn