Embed Size (px)
Citation preview

QS-000169-02-R460-003 – Assessment Report of Phase 1 and Phase 2
Traffic & Transport 14-1
14 TRAFFIC & TRANSPORT 14.1 INTRODUCTION This section describes the potential haul routes for delivery of large project components and construction materials in relation to Phases 1 and 2 of the proposed Oweninny Wind Farm project and the potential impacts on prevailing traffic conditions during the construction, operational and decommissioning phases of the proposed development have been assessed. Mitigation measures are proposed, where appropriate, to address the potential impacts associated with the proposed development. Cumulative impacts with the planning approved Corvoderry wind farm and the Coillte proposed Cluddaun wind farm are also discussed.
From a Traffic Generation and Road Haulage perspective, the traffic and transport elements of the proposed (112 61No. turbine) development are broadly in line with the development for which permission was granted by An Bord Pleanála in 2003 (An Bord Pleanála Case No. PL16.131260) for the construction of a 180 No. turbine wind farm on the same lands at Bellacorick. Both the permitted development and the proposed development propose to use the same existing access points from the strategic roads network, namely the N59 National Secondary Road, albeit upgraded in accordance with the recommendations of the Roads Safety Audit. The source of construction materials and the haul routes are also likely to be similar if not identical however the precise routes cannot be confirmed until the construction contract is at tender/award stage.
In terms of traffic impact arising from road haulage, construction traffic and the management of traffic during construction, save for the number and relative size of turbine components to be transported, and the duration of the construction, there is no significant difference in the likely daily traffic generation arising from the proposed 112 61 turbine development and the 180 turbine development which was granted permission by An Bord Pleanála in 2003.
14.2 TURBINE COMPONENT HAUL ROUTE ASSESSMENT
Abnormal loads are generally moved in small convoys typically late at night. The proposed site requires the delivery of some 758 components over the course of the 4 year construction program (average 160 components per year). By comparison, the permitted 180 turbine development is estimated to require some 1,080 components over an estimated 5-year construction programme (average 216 components per year).
As with the determination of haul routes for general construction materials, the exact haul route for turbine components will be confirmed prior to the award of the contract to a haulier specialising in the planning and execution of abnormal load delivery. The EIS does however contain a high-level appraisal of likely haul routes and potential alternative options and has identified one feasible route for the largest blade length proposed (56m) which would represent the worst case scenario. The haul route appraisal was initially informed by a desktop study, whilst preferred potential routes were further assessed by
QS-000169-02-R460-003 – Assessment Report of Phase 1 and Phase 2
Traffic & Transport 14-2
drive-over survey. Section 14.2 of the EIS, sets out that the preferred routes are from Killybegs Harbour (2 Alternative Routes) and Dublin Port and provides further information on the identified route for transport of the 56m turbine blade. The updated desktop study is entitled ‘Draft Oweninny Wind Farm Desktop Transport Study’, a copy of which was submitted as part of the planning application and further copies were submitted directly to An Bord Pleanála at the Oral Hearing.
The haul route will be confirmed by the turbine supplier following a competitive tendering process. Upon confirmation of the haul route, and prior to construction, a proposed condition survey will be carried out on the preferred haul route to confirm its suitability. Improvements and road/bridge strengthening requirements will be identified as part of the condition survey. A continuing pavement condition monitoring programme will be put in place for the duration of the construction phases so that mitigation measures can be implemented not only after but during the construction program. Further details relating to the management of general construction traffic and the transportation of abnormal loads are provided in the ‘Outline Transport Management Plan’, a copy of which was submitted as part of the planning application and further copies were submitted directly to An Bord Pleanála at the Oral Hearing.
14.2.1 Methodology Options for the proposed transport route of wind turbine components for the construction of the Oweninny Wind Farm in Co. Mayo were assessed. Three possible options have been identified which are feasible for turbine delivery to Oweninny. The preferred option will be finalised when the full wind turbine procurement process is complete and the selected turbine size is known.
As the turbine selection is subject to a competitive procurement process the following criteria have been assumed for the assessment:
• Blade length 56m • Tower Section maximum length 33m and maximum diameter 4.2m • Min road width 4.5m • Use of transport vehicles currently available in the UK or Ireland
The assessment comprised mainly a desktop study and drive over survey using the following sources:
• Ordnance survey maps, • Aerial photography, • Google Maps and Google Street-view • Previous experience of ESBI and Bord na Móna with wind development
projects.
Some initial field surveys at Swinford and Crossmolina were also undertaken to assess potential pinch points along the identified haul route options.
The assessment does not address finite detail such as structural surveys of bridges, road design, road structural assessment or bridge design, land take requirements associated with engineering design, or integrity of existing public roads including the width of existing roads or swept path analysis of potential pinch points.

QS-000169-02-R460-003 – Assessment Report of Phase 1 and Phase 2
Traffic & Transport 14-3
It has been assumed that the four main ports, Dublin, Cork, Foynes and Killybegs all have the required deep water facilities for unloading the size of component proposed. For the above ports it has been assumed that there would be no difficulty encountered with the temporary off-loading and storage for turbine blades up to 56m in length. Alternative ports such as Galway, Sligo and Moneypoint were also investigated but were determined to be unviable or to offer no identifiable advantage over any of the preferred main ports listed above.
The assessment uses the standard motorway bridge clearance in Ireland which is 5.1m. The assessment also assumes that the standard ramp accesses to and from Motorway junctions are passable for blade delivery, and that standard National Route Roundabouts are also passable with the removal and replacement of elements of street furniture.
14.2.2 Alternatives reviewed As part of the overall assessment the possibility of using rail freight transport was investigated as an option. Irish Rail operate a freight service from Dublin Port to Ballina but a height restriction of 9’ 6” (2.9m) on all their bridges ruled this option unviable.
The road infrastructure through the towns of Castlebar and Westport and the route approaching the site using the N59 from Westport or the R112 from Castlebar were examined at a high level and are also deemed unviable due to the amount of buildings that impact on the route and the amount of road widening and land take that would be required. The cost and the physical number of landowner agreements that would need to be negotiated for either of these options was considered reason enough to discount them from further investigation at this time.
The route from Foynes Port was deemed not to have any significant advantages over Dublin Port or Killybegs and would involve passing through either the Limerick Tunnel at 4.65m high (similar to Dublin Port Tunnel) or along the quays with the towns of Clarinbridge, Claregalway and Tuam to be negotiated before merging with the same route as proposed from Dublin and Killybegs on the N5 near Charlestown.
The option of using Cork Port was also deemed not to have significant advantages over the alternative ports with both potential route options from Cork using the Jack Lynch Tunnel of 4.6m height and merging with the route from Dublin Port at the M50 and was therefore not examined in detail.
14.2.3 Potential haul route options Based on the initial assessment, three possible route options were identified (see
Table 14.1).

QS-000169-02-R460-003 – Assessment Report of Phase 1 and Phase 2
Traffic & Transport 14-4
Table 14.1: Potential Turbine Component Haul Routes
Haul Route Route Map
Route1. Delivery of components to Dublin Port with delivery by road via the M50/N4/M4 out of Dublin City towards Longford Town. The route continues onto the N5 passing through Strokestown and Ballaghadereen where it continues towards Charlestown and turning onto the N26 towards Swinford and Foxford. The route continues on the N26 turning onto the N59 at Ballina and onwards towards Crossmolina and the Windfarm site entrance at Bellacorick.
Route 2: Delivery of components to the port of Killybegs and by road on the N56 towards Donegal Town, turning onto the N15 south towards Sligo Town bypassing Ballyshannon, Bundoran and Sligo Town. The route turns westwards south of Sligo Town onto the N17 where it passes through Tubbercurry and continues on the N17 towards Charlestown turning onto the N5 where the delivery would continue as per the route from Dublin Port (Route 1).
Route 3: The third potential route involves delivery to the port of Killybegs and by road on the N56 towards Donegal Town, turning onto the N15 south towards Sligo Town bypassing Ballyshannon, Bundoran and Sligo Town. The route then turns westwards south of Sligo Town onto the N59 through Ballisodare and continues towards Ballina where the delivery would turn over Ham bridge on the River Moy, continue through the town in a contraflow direction and onwards through Crossmolina and towards the Windfarm site entrance at Bellacorick.

QS-000169-02-R460-003 – Assessment Report of Phase 1 and Phase 2
Traffic & Transport 14-5
14.2.4 Assessment of Potential Routes The initial assessment identifies three route options that are feasible as haul routes, from port facilities capable of handling turbine components to the Oweninny wind farm site, subject to some additional study and modification.
Of these, Haul Route No. 2 is initially assessed as the most viable and cost effective option for component delivery and this route will be confirmed for its full potential once the final turbine blade length is known. This route originates at Killybegs and proceeds via the N56 towards Donegal Town, turning onto the N15 south towards Sligo Town (a distance of 64km and bypassing Ballyshannon, Bundoran and Sligo Town itself) where it joins the N4. It follows the N4 for 12km and joins the N17 south of Colloney for a distance of 36km passing through Tubbercurry and Charletown. It subsequently joins the N5 and then the N26 after 10km and continues on the N26 for 30km passing through Swinford and Foxford. It joins the N59 in Ballina and continues westwards for 29km to the Oweninny site access.
This assessment is based on the maximum turbine blade length of 56 metres, however, the actual blade lengths will not be known until a turbine supplier is selected through competitive tendering and could vary between 45 metres and 56 metres.
Detailed confirmatory haul route assessment can only be completed once the turbine supplier and the turbine dimensions are finalised. The landing port, detailed confirmatory haul route assessment and any modification requirements will be determined by the wind turbine supplier following contracting. The proposed haul route and any modifications required will be agreed with the relevant local authorities along the route.
14.3 TRAFFIC AND TRANSPORT ASSESSMENT 14.3.1 Methodology An initial review of the broad potential traffic impacts was conducted to estimate the study scope. This review or scoping study was informed by the detailed evaluation undertaken by Mayo County Council and An Bord Pleanála in determining the traffic impacts arising from the earlier planning application and appeal which culminated in the 2003 permission for a similar wind farm development consisting of 180-turbines (An Bord Pleanála Case No. PL16.131260). The purpose of the scoping study was to determine the data to be collected, the study area and the appropriate traffic appraisal methodology to be employed. The Traffic and Transport assessment was undertaken following further pre-planning consultation with Mayo County Council Road Department and reference to the following documents:
• The Chartered Institution of Highways and Transportation (CIHT) Guidelines for Traffic Impact Assessment (January 1999);
• National Roads Authority (NRA) Traffic and Transport Assessment Guidelines (September 2007);
• The Institute of Environmental Management and Assessment (IEMA) Guidelines for Environmental Assessment of Road Traffic (1993);
• NRA Design Manual for Roads and Bridges (DMRB) (January 2009); and

QS-000169-02-R460-003 – Assessment Report of Phase 1 and Phase 2
Traffic & Transport 14-6
• The NRA Project Appraisal Guidelines Unit 5.5 Link-Based Traffic Growth Forecasting.
Existing traffic flows were established from classified traffic counts which were undertaken at two locations on the N59 national secondary road in June/July 2012 by National Data Collection consultants. The equipment used was a metrocount MC5600 ATC. As is part of the standard short term traffic survey data validation process, long term traffic data was also obtained from the NRA permanent traffic counter on the N59 located 6km outside Mulranny.
14.3.2 Receiving Environment The principle road in the proposed development area is the N59 Ballina to Bangor national secondary road. The N59 National Secondary Road runs east to west immediately south of the proposed wind farm site. The N59 links Ballina to Westport via Crossmolina, Bangor Erris, Mulranny, and Newport. It also provides access to Belmullet The N59 is typically 6.0 metres wide with edge of carriageway and centreline markings the road surface is in good condition.
Figure 14-1 highlights the immediate receiving road network. Assigned local roads numbers have been provided by Mayo County Council. The L52926 provides access from the N59 to houses and farmland located in the Tawnaghmore area. The L52925, commonly known as the Srahnakilly road runs north from the N59 through the central areas of the site effectively dividing the site in two. The L5292 runs north from the N59 to the Shanvolahan area.
The R312 Regional Road runs northwest southwest linking the R311 from Castlebar to Bellacorick.
The R315 Regional Road runs north-south approximately 2.3km east of the proposed wind farm site. The R315 is a rural intertown route which links Crossmolina to the south with the R314 Regional Road to the north. The R315 intersects the N59 at Crossmolina.
14.3.3 Traffic Volumes
14.3.3.1 Traffic Counts
Traffic surveys using ATC’s (Automatic Traffic Counters) were undertaken by Nationwide Data Collection (NDC) at the following locations agreed with Mayo County Council road section as part of the initial assessment scoping study:
• N59 - approximately 450 metres north of the R312 junction with the N59 • N59 - approximately 1.1km west of Srahnakilla
Traffic survey locations can be seen in Figure 14-2. A summary of the count results is presented in Table 14-2.
Table 14-2: Summary of ATC Results June/July 2012*
Site Count
Location Count date
Direction 5 day
average 7 day
average
HGV
5 Day Average
%
HGV
7 Day Average
%
85%ile Speed km/h

QS-000169-02-R460-003 – Assessment Report of Phase 1 and Phase 2
Traffic & Transport 14-7
Site Count
Location Count date
Direction 5 day
average 7 day
average
HGV
5 Day Average
%
HGV
7 Day Average
%
85%ile Speed km/h
1
450 metres northeast
of the R312
26th June to
10th July Eastbound 796 748 - - -
Westbound 813 752 - - -
Dual 1609 1500 20 17 84.6
2
N59
1.1km west of
Shranakilla Rd
27th June to
11th July Eastbound 1123 1089 - - -
Westbound 1164 1111 - - -
Dual 2287 2200 25 22 105.5
*National Data Collection
The traffic count data indicates that passenger cars generally make up about 83% of traffic on the N59, with 0.25% being short vehicles (bicycle or motor bike) and 1.6% short towing vehicles (car and trailer). Small trucks and buses made up about 9.5% of the vehicles with the remainder 7% being heavy goods vehicles. The NRA also acknowledges that significant seasonal fluctuations in traffic movements can occur particularly on national secondary roads in counties with high tourism levels such as Mayo. Count data indicates an almost equal flow of traffic in either direction at both locations. The difference in total traffic counts between the western count location and the eastern count location is attributable to traffic using the R312 regional road. Traffic counts were also undertaken on the N59 approximately 160m north of the R312 junction with the N59 as part of the proposed Cluddaun wind farm development. Traffic flows recorded in the Cluddaun counts are provided in Table 14-3. The Cluddaun counts show a similar traffic flow to those site specific flows recorded by NDC at the Oweninny count location and are considered to confirm or somewhat validate the base data as representative of typical traffic flows.
Table 14-3: Summary of ATC Results July 2012 (Cluddaun)
Site Count
Location Count date
Direction 5 day
average 7 day
average
HGV
5 Day Average
%
HGV
7 Day Average
%
85%ile Speed km/h
1
160 metres north of
the R312
20th July
to 27th July
Eastbound 791 777 - - -

QS-000169-02-R460-003 – Assessment Report of Phase 1 and Phase 2
Traffic & Transport 14-8
Site Count
Location Count date
Direction 5 day
average 7 day
average
HGV
5 Day Average
%
HGV
7 Day Average
%
85%ile Speed km/h
Westbound 808 778 - - -
Dual 1599 1555 20 17 84.6
Form the recoded traffic flows Friday represented the busiest day of the week with a recorded volume of 1,698 two-way vehicles. The average weekday (Monday to Friday) traffic volumes were of the order of 1,609 two-way vehicles. The recorded weekday peak hour occurred from 5:00 to 6:00 p.m. on Friday with a peak volume of 169 two-way vehicles. During the period Monday to Friday the speed limit on the N59 at the Oweninny location was exceeded by 5 km/hour by 0.4% of traffic and by 10 km per hour by 0.1% of traffic.
14.3.3.2 Annual Average Daily Traffic (AADT) Counter Mulranny AADT refers to average 24-hour two way traffic flows per day (vehicles). Existing Annual Average Daily Traffic (AADT) volumes were estimated for the N59 in the vicinity of the proposed development site, on the basis of recorded traffic flows, and the nearest National Roads Authority’s (NRA) permanent traffic counter data at Mulranny.
Annual Average Daily Traffic (AADT) counts are available from the NRA. The nearest permanent NRA traffic counter “Mulranny N59-6” is located on the N59, approximately 6kms east of Mulranny.
A summary of the recorded peak weekday volumes, peak weekend volumes, average weekday volumes and the estimated AADT volumes, for 2012 on the N59 is detailed in Table 14-4 below150. HGVs account for 4.0 % of the AADT volumes on the N59
It has been assumed that the traffic along the N59 adjacent to the proposed development site has similar expansion factors to the traffic measured at the NRA permanent traffic counter on the N59. The recorded traffic volumes were expanded to represent AADT volumes at the Oweninny site accordingly. On the basis of the recorded traffic flows and using the expansion factor applied as per the NRA permanent traffic counter, AADT for the N59 at this location is estimated to be of the order of 1,181 two-way vehicles with
150 http://nraextra.nra.ie/CurrentTrafficCounterData/html/N59-6.htm

QS-000169-02-R460-003 – Assessment Report of Phase 1 and Phase 2
Traffic & Transport 14-9
HGV’s accounting for 4.0 percent.
Table 14-4. Existing Mulranny (2012) Two Way Traffic Volumes Summary
Day of week
Peak Daily
Traffic Flows
(HGV)
Average Daily
Traffic Flows
(HGV)
Monday 4,105 (158) 2,734 (122)
Tuesday 3,658 (137) 2,761 (99)
Wednesday 4,051 (154) 2,880 (113)
Thursday 4,106 (153) 2,915 (116)
Friday 4,617 (140) 3,230 (97)
Saturday 4,772 (95) 2,999 (65)
Sunday 4,326 (71) 2,853 (29)
Note Table 14-4 provides average and peak daily two-way traffic flows recorded at the NRA counter site for the period January to July 2012 inclusive.
Figures in brackets refer to HGV numbers. Heavy commercial vehicles are taken to include trucks, articulated vehicles, buses, agricultural vehicles and miscellaneous goods vehicles
The peak recorded daily traffic occurs on a Friday with peak weekend traffic on a Sunday.
The NRA provides an estimated AADT for Mulranny as 2,851 with HGV comprising 3.2% of this total, that is 91HGV per day.
14.3.4 Project Appraisal Guidelines (AADT Estimation) The corridor upon which development generated traffic will have the greatest impact is the N59. NRA Project Management Guidelines Unit 16.2 Expansion Factors for Short Period Traffic Counts (August 2012) can be used to derive a value for AADT from the ATC traffic surveys undertaken near the site access. Using the NRA published traffic flow profiles provided in Unit 16.2 the Monthly Flow Index of Unit 16.2 Annex C for February is 0.94 accordingly the estimated AADT on the N59 to the west of the site access is 2,200x0.94 = 2,068 whilst the AADT to the east of the site access is estimated to be in the order of 1,410 vehicles.
14.3.5 Existing Road Capacity An assessment of the existing flow capacity on the proposed haulage route, the N59 national secondary road, was undertaken. The estimated capacity was obtained using the NRA’s Design Manual for Roads and Bridges document Road Link Design TD 9/12 (2012). Estimated capacities for rural road layouts are provided in Table 6/1 of Recommended Rural Road Layouts of the Design Manual. The Manual provides estimated capacities for a number of different rural road types, as an approximation of Level of Service D. The level of traffic representing the practical capacity of a road link is routinely taken to be Level of Service D. At this level significant impact on traffic flow will occur.

QS-000169-02-R460-003 – Assessment Report of Phase 1 and Phase 2
Traffic & Transport 14-10
The smallest road type provided by the Manual is the reduced single (7.0m) carriageway S2 which gives an estimated capacity of 8,600 AADT. The typical carriageway width of the N59 is approximately 6.0m and a correction to the 7.0m estimated AADT is required to reflect this.
To establish the correction factor the NRA’s publication RT. 180 Geometric Design Guidelines (1986) was used. Two-way link capacities for Level of Service D represented in passenger car units (pcu’s) are provided in Table C4.2 (b) Design Capacities for Undivided Rural Roads of the NRA document. For the 7.0m wide and 6.0m wide road the following passenger car units are provided
• 7.0m – 1,500 pcu’s/ hour; and • 6.0m – 1,250 pcu’s/ hour.
The calculated ratio between the 7.0m carriageway and the 6.0m carriageway road width is 0.833. Applying this ratio to the N59 the estimated AADT capacity is 7,163 AADT.
To allow for pinch points on the rural route a further reduction of 20% of the estimated capacity has been applied. Hence the AADT capacity of the N59 is estimated at 5,731.
The percentage link capacity on the N59 has been estimated using the reduced capacity estimations and the recorded AADT volumes. Table 14-5 outlines the estimated two-way link capacities for the N59.
Table 14-5. Estimated Available Capacity on the N59
Road Link Estimated Capacity
(AADT)
Estimated Existing
Demand (AADT) Available Capacity
N59 (East of Site) 5,731 1,410 75%
N59 (West of Site) 5,731 2,068 64%
The N59 rural secondary road operates well within the capacity of the Level of Service D.
14.3.6 Public Transport Bus operators provide a service from Blacksod to Ballina, via Crossmolina on a regular basis. Bellacorick is one of the stops on this service.

QS-000169-02-R460-003 – Assessment Report of Phase 1 and Phase 2
Traffic & Transport 14-11
14.3.7 Accident Record The Road Safety Authority’s collision data151 shows a number of minor collisions and a few serious collisions along the N59 route from Crossmolina to Bangor between 2005 and 2009. The Road Safety Authority online Collstats database has been consulted for the period currently available (2005 to 2011 inclusive) and indicates that a single vehicle collision resulting in minor injury was recorded on a Sunday evening in 2011, in Bellacorick village. The collision was not in the vicinity of any of the proposed site accesses. Other collisions recorded were at least 3.5 km from the proposed site entrances. This data is summarised in Table 14-6.
Table 14-6: Summary Results for Fatal and Injury Collisions
Road Year Type of Injury Sustained
Total Fatal Serious Minor
N59
Crossmolina to Bangor
2005
2006
2007
2008
2009
2010
2011
0
0
0
0
0
0
0
1
0
0
1
0
0
0
1
1
1
3
3
4
2
15
14.3.8 Proposed Site Access Three existing site entrances are proposed as access locations to the Oweninny Wind Farm site as follows:
• Access Point 1 - the existing entrance to the Bord na Móna Bellacorick wind farm located approximately 260 metres east from the junction with the R312. This access will be utilised mainly during Phase 1 of the construction and also for Phase 2.
• Access Point 2 - the existing entrance to the Bord na Móna lands located approximately 1.4 kilometres west of the local road (LR002) to Srahnakilly.
151 Road Safety Authority, Road Collision Facts Ireland 2009, December 2010
QS-000169-02-R460-003 – Assessment Report of Phase 1 and Phase 2
Traffic & Transport 14-12
This access point will be used mainly during Phase 2 of the wind farm construction.
• Access Point 3 - the existing entrance to the Bord na Móna Workshops located 1.5 km east of the junction with the R312. This access is available but it is not at present programmed to be used in the construction of Phase 1 or Phase 2.
The locations of the access points are shown on Figure 14-3.
14.3.8.1 Site Access Road Safety Audit
A Stage 1/2 Road Safety Audit at the three proposed site entrances was prepared for Oweninny Power Ltd, see Appendix 12, by Traffic Transport and Road Safety Associates Ltd. in accordance with the requirements of National Roads Authority (NRA) Design Manual for Roads and Bridges Volume 5 Section 2 Part 2 - NRA HD 19/12 Road Safety Audit. A site visit was undertaken on 29th April 2013. During the site visit the weather was dry and the road surface was dry.
The characteristics of the N59 at the location of site accesses include:
• At Site Entrance No. 1, the surfaced carriageway is 7.7m in width, demarcated as a 3.4m wide westbound lane and 3.6m wide eastbound lane. The existing junction bell mouth is 24.5m in width at the stopline. The existing visibility splay to the west is in excess of 215m, as is eastbound forward visibility to the access. The existing visibility splay to the east is 180m, as is westbound forward visibility. Increasing the visibility splay to the east and westbound forward visibility, to 215m, is achievable
• At Site Entrance No. 2, the surfaced carriageway is 6.3m in width, demarcated as two 2.85m wide lanes. The existing junction bell mouth is 45m in width at the stopline. The existing visibility splay to the west is approximately 90m, as is eastbound forward visibility to the access. The existing visibility splay to the east is in excess of 215m, as is westbound forward visibility. Increasing the visibility splay to the west and eastbound forward visibility, to 215m, is achievable.
• At Site Entrance No. 3, the surfaced carriageway is 6.9m in width, demarcated as a 3.0m wide westbound lane and 3.2m wide eastbound lane. The existing junction bell mouth is 36.5m in width at the stopline. The existing visibility splay to the west is approximately 90m, with eastbound forward visibility to the access being approximately 100m. The existing visibility splay to the east is approximately 134m, whilst westbound forward visibility is in excess of 215m. Increasing the visibility splay to the west and eastbound forward visibility, to 215m, is achievable;
• At all of the locations the carriageway is marked with a solid centreline and dashed edge-lining, both with retro-reflective road studs. The verges are soft and surface water drainage is limited to grips aligning the carriageway;
• Chevron signing is present in the immediate vicinity of site entrances 1 and 3; • The posted speed limit for this section of the N59 is 100 kph; and, • There is no street lighting.
QS-000169-02-R460-003 – Assessment Report of Phase 1 and Phase 2
Traffic & Transport 14-13
The audit focused on the upgrading of three existing site accesses off the N59 national road, to form entrances for the construction of the Oweninny Wind Farm Development at Bellacorick, Co. Mayo. Abnormal loads are assumed to travel from east to west along the N59 to the site with a blade length of 56m and a maximum tower section length 33m.
The audit, in summary, recommended the following:
• Provide full clear visibility splays for all site entrances through land gradient re-profiling and vegetation clearance
• Relocate existing highway warning sign (with the approval of the highway authority)
• Ensure site entrance designed and constructed for the loading and swept path for all types of vehicles accessing the site, taking full account of the tie-in with the existing edge of the N59 carriageway and surface water drainage within the design and construction.
• Ensure sufficient gradient or dwell area to permit the safe access to or egress • At site entrance number 1 the dual use of this proposed site entrance for site
construction and public access to a visitor centre should be taken into full account within the design. The junction bellmouth of the site entrance should be reduced in width with a stop control priority junction markings and signage when open for public access, but for example incorporating removable fencing or bollards upon completion of the site construction in order to retain access for large/long vehicles as wind farm maintenance is required.
• Advance highway or local signs indicating the junction to the visitor centre should be provided with the approval of the highway authority and should not be positioned within the visibility splays of this entrance.
• Site Entrance No. 1 should accommodate two-way traffic, • Ensure repairs to existing N59 carriageway to allow appropriate tie in of site
roads.
The recommendations of the audit have been incorporated into the design drawings for the proposed access locations.

QS-000169-02-R460-003 – Assessment Report of Phase 1 and Phase 2
Traffic & Transport 14-14
14.3.9 Trip Generation and Distribution 14.3.9.1 Construction Phase
The wind farm project will be constructed in phases as indicated in Chapter 2. Phase 1 is likely to commence in 2015 with completion at the end 2016 or early 2017. Phase 2 will commence in 2016 and will be completed in 2018. A preliminary assessment of the construction traffic generation has been conducted based on the current construction plan, experience of similar schemes and first engineering principles. It is acknowledged that the timescales for the commencement of construction have slipped from the initial estimate of 2015. It can nevertheless be appreciated from yearly records of flows along the N59 that the delay of perhaps one year is highly unlikely to result in significant increases in the base N59 traffic flows and thus a delay of one year is accordingly highly likely to have a negligible impact upon the results of the capacity analyses provided in this assessment of the proposed wind farm development. Typically traffic assessments are based upon ‘robust’ figures in order to account for many parameters including such typical variation in base traffic flow figures as might arise due to unforeseen delays in the planning process. Despite this assertion the traffic capacity assessments provided in the original EIS have been revised to take into account a 2 year slippage in the construction timetable (Construction assumed to commence in 2017).. For this study, extreme worst case conditions have been based on the following assumptions:
• Individual deliveries of abnormal loads comprising wind turbine tower components (five per tower), nacelles (one per turbine), turbine blades (three per turbine), turbine transformers and substation transformers (two per substation) via the N59 to the site;
• Import of fill material (rock and gravel fill) from external quarry sources via the N59. A conservative estimate of 10 m3 per delivery vehicle has been used to estimate the vehicle movements; articulated HGV have a greater capacity and would be likely to be used on large scale projects.
• Import of all concrete material to the site via the N59. Concrete is assumed to be required for both turbine piling and turbine foundation construction. A conservative estimate of 8 m3 per concrete delivery vehicle has been used to estimate the vehicle movements; articulated concrete wagons have a greater capacity (10m3) and would be likely to be used on large scale projects.
• Import of all reinforcing steel bar to the site; • Miscellaneous construction traffic is assumed to equate to 10% of the total
vehicle movements; • The duration of Phase 1 is estimated at 24 months and is likely to comprise
construction of approximately thirty (30) wind turbines and associated crane stands, one substation, three meteorological masts, the Visitor Centre, the O&M building, the overhead line and approximately 26km of access tracks.
• The duration of Phase 2 is estimated to be 24 months and is likely to comprise construction of approximately thirty one (31) wind turbines and associated crane stands, one substation, three meteorological masts, the overhead line and approximately 20km of access tracks;
• Maximum of 150 construction workers on site at any one time;

QS-000169-02-R460-003 – Assessment Report of Phase 1 and Phase 2
Traffic & Transport 14-15
• A 10% overall contingency has been included in traffic numbers
Based on the above assumptions the projected traffic movements for each phase are provided in Table 14-7 – Table 14-9
Table 14-7: Phase 1 - Forecast Traffic Movements
Type Vehicle numbers Contingency
+10% Predicted Vehicle
Movements
Fill (10m3 per veh.) 19,615 21,557 43,154
Concrete (8m3 per veh.) 4,153 4,568 9,136
Rebar 151 166 331
Miscellaneous 2,561 2817 5,634
Abnormal Loads 373 - 746
Total 26,853 29,411 59,001
Table 14-8: Phase 2 - Forecast Traffic Movements
Type Vehicle numbers Contingency
+10% Predicted Vehicle
Movements
Fill (10m3 per veh.) 20,617 22,679 45,358
Concrete (8m3 per veh.) 3,773 4,150 8,300
Rebar 135 148 296
Miscellaneous 2,620 2,882 5,764
Abnormal Loads 385 - 770
Total 27,437 30,151 60,488
14.4 IMPACT OF THE DEVELOPMENT The Institute of Environmental Management and Assessment’s (IEMA) Guidelines for the Environmental Assessment of Road Traffic (1993) recommends that assessments should consider the period at which the impact is greatest and the period at which the impacts exhibit the greatest change.
Subject to planning permission, it is envisaged that:
Phase 1 construction work on site would commence in 2017 with a 24 month construction period. Phase 1 would become operational in 2018.
Phase 2 construction work on site would commence in 2016 2018 a 24 month construction period. Phase 2 would become operational in 2020
In the original EIS it was assumed likely that peak construction of the Cluddaun and Corvoderry Wind will coincide with peak construction of the proposed Oweninny Wind Farm in 2018, as a cumulative worst case scenario. This assumption was based upon developments that were in the planning stages being granted permission however this is

QS-000169-02-R460-003 – Assessment Report of Phase 1 and Phase 2
Traffic & Transport 14-16
not the case since the Cluddaun development was refused planning permission by An Bord Pleanála.
14.4.1 Future Background Traffic Flows Future traffic volumes have been estimated based on predictions outlined in the NRA publications Project Appraisal Guidelines (PAG) Unit 5.3: Traffic Forecasting, and PAG Unit 5.5: Link-Based Traffic Growth Forecasting (January 2011). These have been predicted on the basis of a medium growth scenario.
The NRA’s National Traffic Forecasts, in their Project Appraisal Guidelines Unit 5.5 (2011) envisage that passenger car traffic on National Roads will increase the factors shown in Table 14-10 in the west region of Ireland.
Table 14-10: NRA Derived Traffic Expansion Factors
Year Expansion Factor
Light Vehicles
Expansion Factor
Heavy Goods Vehicles
LV HGV
2013 1.012 1.007
2014 1.024 1.014
2015 1.036 1.021
2016 1.049 1.028
2017 1.061 1.035
2018 1.074 1.043
2019 1.087 1.050
2020 1.100 1.057
2021 1.113 1.065
2022 1.127 1.072
2023 1.140 1.135
2024 1.154 1.148
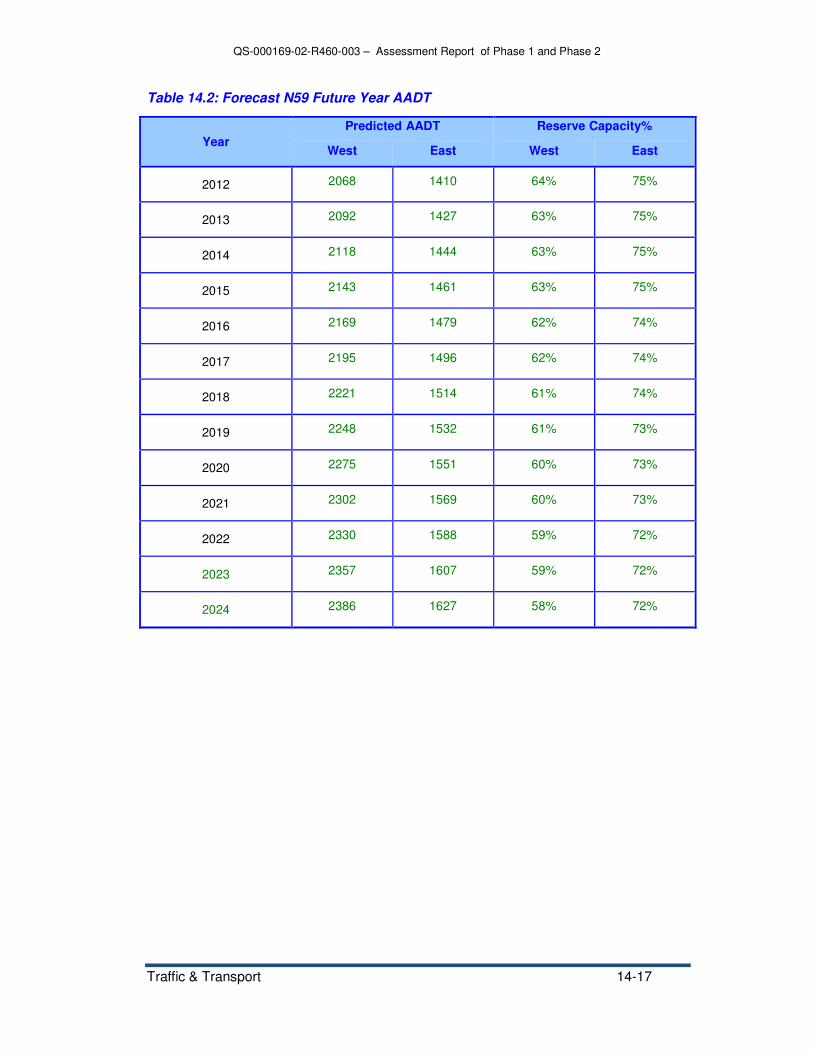
These factors were used to predict the 2012 to 2022 forecast year background traffic volumes and remaining capacity on the N59 both east and west of the R312 junction located along the southern site boundary, see Table 14.2 below.
QS-000169-02-R460-003 – Assessment Report of Phase 1 and Phase 2
Traffic & Transport 14-17
Table 14.2: Forecast N59 Future Year AADT
Year
Predicted AADT Reserve Capacity%
West East West East
2012 2068 1410 64% 75%
2013 2092 1427 63% 75%
2014 2118 1444 63% 75%
2015 2143 1461 63% 75%
2016 2169 1479 62% 74%
2017 2195 1496 62% 74%
2018 2221 1514 61% 74%
2019 2248 1532 61% 73%
2020 2275 1551 60% 73%
2021 2302 1569 60% 73%
2022 2330 1588 59% 72%
2023 2357 1607 59% 72%
2024 2386 1627 58% 72%

QS-000169-02-R460-003 – Assessment Report of Phase 1 and Phase 2
Traffic & Transport 14-18
14.4.2 Project Construction Traffic associated with the construction phase essentially comprises five types, as follows:
14.4.2.1 Miscellaneous Construction Vehicles
The vehicles requiring access during the civil engineering and earthworks phase will include tracked excavators, dump trucks, fixed or articulated haulage trucks and mobile cranes. Commercial traffic movements are likely to be spread throughout the working day and there will be a small increase in private car movements at the beginning and end of the day as the workforce arrives at and departs from the site. A total of 100 miscellaneous vehicles have been assumed for a project of this size. The forecast is considered robust on account of the fact that once much of the plant is brought to the site it will remain there for the duration of the works. It is unlikely that plant will be hauled to and from the site with any great regularity and certainly not on a daily basis.
14.4.2.2 Concrete Foundations and Piles The major requirement for ready mixed concrete will be for construction of the turbine bases, foundation piling, fencing bases, transformer bases and bunds at the Electrical Substation and for the Control Building within it, for the O&M building foundation and flooring, for the Visitor Centre foundation and flooring and for the meteorological mast foundations.
In the extreme worst case scenario all concrete required will be imported to the site from external suppliers. Concrete deliveries will be determined by potential journey time to the site from an external concrete supplier, vehicle turnaround time and production capacity of the concrete supplier. From experience on other wind farm construction sites it is expected that 6 to 8 concrete vehicles per hour would be the maximum number of deliveries associated with any single turbine foundation construction that would be practical from a construction aspect. This would equate to an additional 16 HGV movements associated with concrete deliveries on the N59 per hour. Foundation concrete pours must be completed in one day to ensure structural integrity of the concrete, hence on such days the duration of increased traffic movements would extend from between 10 – 14 hours. Increased traffic movements associated with foundation concrete pouring would occur for a total of:
• 30 days in phase 1 (24 month construction period – 15 days per year), • 31 days in phase 2 (24month construction period – 15.5 days per year) and
It has been assumed as a worst case that concrete piles will be required for each wind turbine. Approximately 30 concrete piles up to 17m in depth will be required to support a wind turbine foundation requiring two HGV concrete deliveries per pile. Again experience indicates that a maximum of 6 HGV concrete deliveries per hour would be the practical limit for such construction. This would equate to an additional 12 HGV movements on the N59 per hour. A maximum of 10 concrete piles per day can be installed requiring 20 concrete deliveries over the working day and three days to complete piling operations. Increased traffic movements associated with concrete pile pouring would occur for a total of:
QS-000169-02-R460-003 – Assessment Report of Phase 1 and Phase 2
Traffic & Transport 14-19
• 90 days in Phase 1 (24 month construction period – 45 days per year), • 93 days in Phase 2 (24month construction period – 46.5 days per year)
Concrete piles will be allowed to cure for a period of up to 35 days before turbine foundation formwork and foundation base pour occurs. The foundation base will be allowed to cure for a period of between 45 and 55 days before the turbine plinth is poured and turbine components erected.
Should piling construction and turbine foundation base pour occur on the same day it would result in additional 28 HGV movements per hour but over a lesser number of days in each phase. It should be noted nonetheless that the turbine foundation bases need to be poured must be completed in a single day by continuous pour. Given the importance of the continuous pour it is ordinarily the case that no other works requiring readymix concrete are undertaken at the same time as this reserves concrete plant capacity for the critical activity.
As set out in Section 14.5.3.2 the proposed development includes for a concrete batching plant. The original EIS traffic assessment nonetheless assumes that all concrete will be transported to the site from external plants and thus the original EIS ignores the reduction in HGV traffic flows that would result from the batching plant at the site. Whilst a batching plant on the site would generate vehicles associated with the import of the concrete constituents, given the sourcing of water on site clearly the batching plant has the potential to significantly reduce traffic impact. The transportation of materials to feed the on-site plant can be spread out and the materials stockpiled. Thus the primary advantage of the on-site batching plant would be to reduce the relatively concentrated demand for the import of concrete during the pouring of turbine base foundations.
14.4.2.3 Track Construction & Turbine Hardstands
Crushed stone fill material will be required for construction of access tracks and crane hard stands. As a worst case scenario it is envisaged that all fill required will be imported from external licensed quarries to the site for access track and crane stand construction. Additionally all the fill is assumed to be imported from either the western or eastern road direction but not from both. The rate of import of fill material will be dependent on distance from the quarry source to the site, vehicle turnaround time, quarry production capacity and access track development. Initially, fill utilisation will be low as a single access track is developed, however, this will increase when branch points occur on the track allowing more than one active working face. Based on previous experience in wind farm construction it is envisaged that a maximum of 8 HGV per hour is a practical limit on the N59 for a given direction. This would result in an additional 16 HGV movements per hour on the N59. Based on a 10 hour working day this would equate to the following predicted number of days of increased traffic movements associated with fill material:
• 269 days in Phase 1 (24 month construction period), • 285 days in Phase 2 (24month construction period) and
In reality access track and crane stands will be constructed on a continuous basis over a period of 14 months for Phase 1 and 16 months for Phase 2.

QS-000169-02-R460-003 – Assessment Report of Phase 1 and Phase 2
Traffic & Transport 14-20
Section 14.5.3.1 relates to the proposed extraction of aggregates and estimates that the proposed on-site borrow pit has the potential to yield 340,000m3 of suitable materials for the construction of access tracks and hardstanding areas for cranes. Based upon the estimated yield figure the borrow pit has the potential to reduce the number of vehicles importing aggregates by approximately 46% which equates to some 88 HGV traffic movements per day.
14.4.2.4 Abnormal Loads
It is expected that delivery of each turbine will involve about 10 loads using articulated haulage trucks. Deliveries will comprise towers (5), blades (3), nacelle (1), hub (2), transformer (1) and small parts. Typical composition of the significant components for a potential turbine at Oweninny is presented in Table 14.3.
A typical delivery of wind turbine tower components is shown in Figure 14-4.
The total number of abnormal loads was calculated on the basis of the installation of 112 turbines. Abnormal loads include turbine tower components, turbine blades, nacelle, turbine transformers, cranes and ballast and substation transformers. The estimated number of abnormal loads for each phase is predicted to be as follows:
• Phase 1 - 373 (38 days) • Phase 2 – 385 (39 days)
Experience indicates that 10 abnormal loads per day would be expected for each wind turbine delivery.
Table 14.3: Typical Wind Turbine Components*
Component Weight (t) Dimension (m)
1st Section (Base tower) 73 12.96 x 4.28
2nd Section 70 19.3 x 3.94 diameter
3rd section 72.5 25.5 x 3.93 diameter
4th Section 58 28.8 x 3.9 2
5th section (Top section) 42 23.2 m x 2.7m diameter
Nacelle 60-80 t 30 m x 3.66 m
Blades (3) 10 t 56 m x 3.5 m at Root
*Based on a Vestas V112/3000 kW turbine - Data courtesy of Vestas
14.4.2.5 Electrical Equipment & Building Materials
Miscellaneous building materials will be required for the construction of the four substations, O&M building and Visitor Centre notably blockwork, shuttering, glass, timber and other typical building construction materials
Miscellaneous electrical equipment such as transformers and switchgear will be needed
QS-000169-02-R460-003 – Assessment Report of Phase 1 and Phase 2
Traffic & Transport 14-21
in the substation and electrical cabling will be required for the underground connection of individual turbines to the substation.
Deliveries of miscellaneous other items will also arise and a total of about 500 additional deliveries is assumed.
14.4.2.6 Cranes
It will be a matter for the contractor, selected on the basis of open competitive tendering, to determine the number and type of cranes that will be employed on the site for turbine erection. However, based on experience in the construction of other wind farms, it is envisaged that a heavy lifting capacity (approximately 1,200t) main crane and a smaller capacity (approximately 350t) crane will work in tandem. It is likely that two smaller cranes will be engaged in assembly of the heavy lifting capacity main crane. The cranes are also likely to stay on site during each phase until wind farm turbine erection is completed.
14.4.2.7 Worst Case Traffic Scenarios
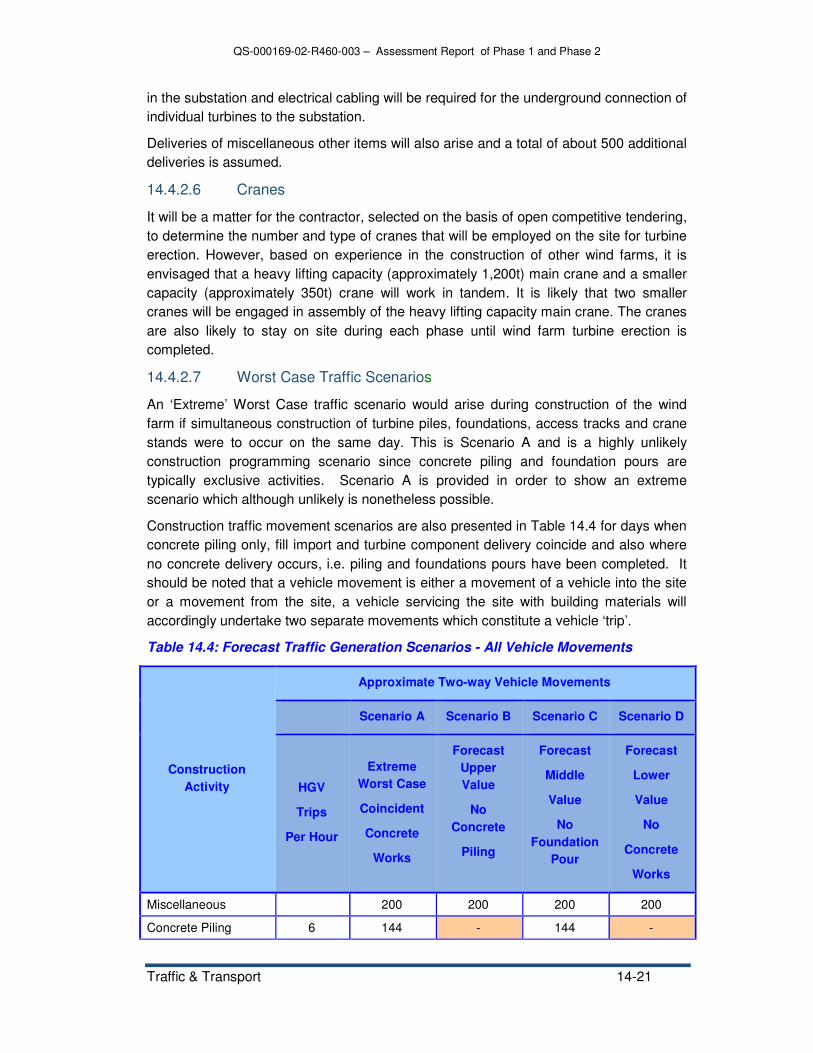
An ‘Extreme’ Worst Case traffic scenario would arise during construction of the wind farm if simultaneous construction of turbine piles, foundations, access tracks and crane stands were to occur on the same day. This is Scenario A and is a highly unlikely construction programming scenario since concrete piling and foundation pours are typically exclusive activities. Scenario A is provided in order to show an extreme scenario which although unlikely is nonetheless possible.
Construction traffic movement scenarios are also presented in Table 14.4 for days when concrete piling only, fill import and turbine component delivery coincide and also where no concrete delivery occurs, i.e. piling and foundations pours have been completed. It should be noted that a vehicle movement is either a movement of a vehicle into the site or a movement from the site, a vehicle servicing the site with building materials will accordingly undertake two separate movements which constitute a vehicle ‘trip’.
Table 14.4: Forecast Traffic Generation Scenarios - All Vehicle Movements
Construction
Activity
Approximate Two-way Vehicle Movements
Scenario A Scenario B Scenario C Scenario D
HGV
Trips
Per Hour
Extreme
Worst Case
Coincident
Concrete
Works
Forecast
Upper
Value
No
Concrete
Piling
Forecast
Middle
Value
No
Foundation
Pour
Forecast
Lower
Value
No
Concrete
Works
Miscellaneous 200 200 200 200
Concrete Piling 6 144 - 144 -
QS-000169-02-R460-003 – Assessment Report of Phase 1 and Phase 2
Traffic & Transport 14-22
Construction
Activity
Approximate Two-way Vehicle Movements
Scenario A Scenario B Scenario C Scenario D
HGV
Trips
Per Hour
Extreme
Worst Case
Coincident
Concrete
Works
Forecast
Upper
Value
No
Concrete
Piling
Forecast
Middle
Value
No
Foundation
Pour
Forecast
Lower
Value
No
Concrete
Works
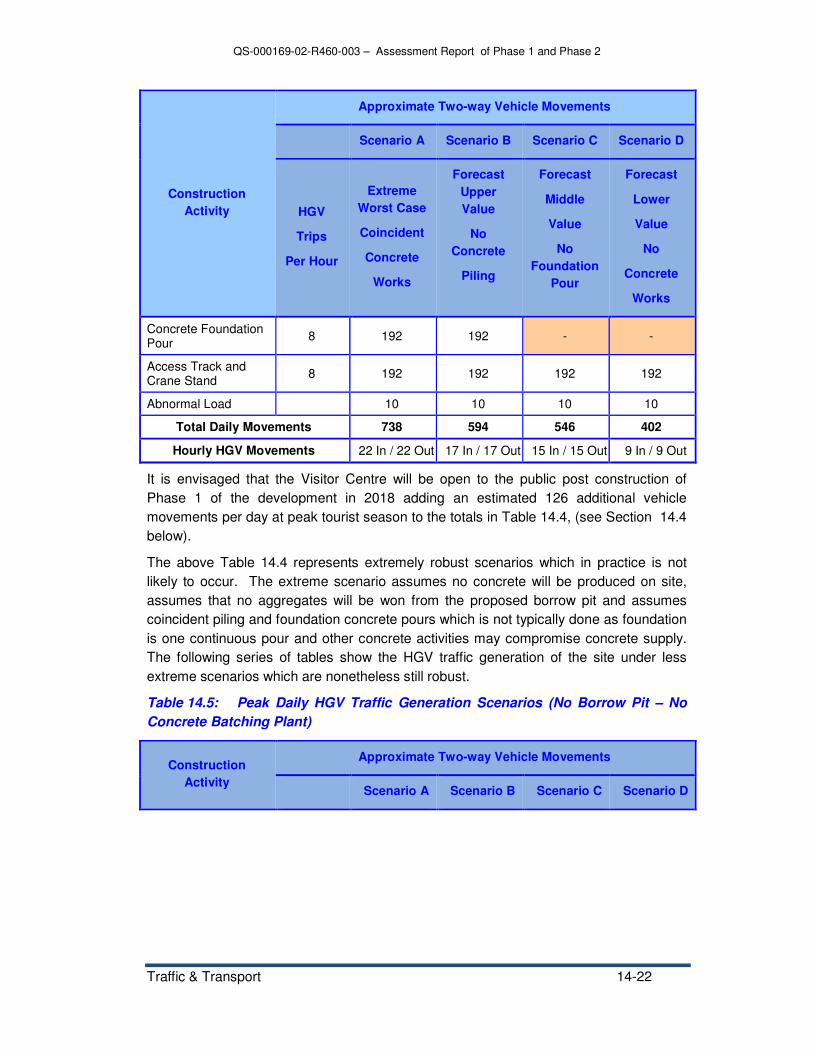
Concrete Foundation Pour 8 192 192 - -
Access Track and Crane Stand 8 192 192 192 192
Abnormal Load 10 10 10 10
Total Daily Movements 738 594 546 402
Hourly HGV Movements 22 In / 22 Out 17 In / 17 Out 15 In / 15 Out 9 In / 9 Out
It is envisaged that the Visitor Centre will be open to the public post construction of Phase 1 of the development in 2018 adding an estimated 126 additional vehicle movements per day at peak tourist season to the totals in Table 14.4, (see Section 14.4 below).
The above Table 14.4 represents extremely robust scenarios which in practice is not likely to occur. The extreme scenario assumes no concrete will be produced on site, assumes that no aggregates will be won from the proposed borrow pit and assumes coincident piling and foundation concrete pours which is not typically done as foundation is one continuous pour and other concrete activities may compromise concrete supply. The following series of tables show the HGV traffic generation of the site under less extreme scenarios which are nonetheless still robust.
Table 14.5: Peak Daily HGV Traffic Generation Scenarios (No Borrow Pit – No
Concrete Batching Plant)
Construction
Activity
Approximate Two-way Vehicle Movements
Scenario A Scenario B Scenario C Scenario D

QS-000169-02-R460-003 – Assessment Report of Phase 1 and Phase 2
Traffic & Transport 14-23
HGV
Trips
Per Hour
Extreme
Worst Case
Coincident
Concrete
Works
Forecast
Upper
Value
No
Concrete
Piling
Forecast
Middle
Value
No
Foundation
Pour
Forecast
Lower
Value
No
Concrete
Works
Concrete Piling 6 144 - 144 -
Concrete Foundation Pour 8 192 192 - -
Access Track and Crane Stand 8 192 192 192 192
Abnormal Load 10 10 10 10
Total Daily Movements 538 394 346 202
Hourly HGV Movements 22 In / 22 Out 17 In / 17 Out 15 In / 15 Out 9 In / 9 Out
Table 14.6: Peak Daily HGV Traffic Generation Scenarios (Including Borrow Pit –
Not Including Concrete Batching Plant)
Construction
Activity
Approximate Two-way Vehicle Movements
Scenario A Scenario B Scenario C Scenario D
HGV
Trips
Per Hour
Extreme
Worst Case
Coincident
Concrete
Works
Forecast
Upper
Value
No
Concrete
Piling
Forecast
Middle
Value
No
Foundation
Pour
Forecast
Lower
Value
No
Concrete
Works
Concrete Piling 6 144 - 144 -
Concrete Foundation Pour 8 192 192 - -
Access Track and Crane Stand 5 104 104 104 104
Abnormal Load 10 10 10 10
Total Daily Movements 450 306 258 114
Hourly HGV Movements 19 In / 19 Out 13 In / 13 Out 11 In / 11 Out 5 In / 5 Out

QS-000169-02-R460-003 – Assessment Report of Phase 1 and Phase 2
Traffic & Transport 14-24
As can be appreciated from 14.4.2.2. above, those construction activities involving concrete are not the normal everyday activity at the site. On average, concrete foundation pours will occur for only 15 days of the year whilst concrete piling operations are forecast to occur on 45 days per year or less over the course of the construction phases. The typical average daily HGV traffic generation is clearly represented by Scenario D where no concrete is poured. It is standard practice in traffic assessments to use generation rates that reflect the average and also a higher value. The higher value which has been commonly used for the past 20 years is the 85th percentile. Scenario C is considered representative of the typical 85th percentile figure in this instance whilst Scenario B can be considered the 100th percentile or absolute worst case. The Chartered Institution of Highways and Transportation guidelines recommend that traffic assessments should consider the average and 85th percentile traffic generation scenarios.
As with other strategically significant developments, such as motorway construction, it is not possible prior to the award of the contract to provide definitive sources of construction materials and thus it is not possible to definitively identify haul routes to the development site.
There are suitable sources of materials located both east and west of the three site accesses. The calculations in the original EIS nonetheless include another compounding worst case factor since traffic is assumed not to distribute east/west at the site accesses and all construction traffic is assumed to arrive and depart from one direction only. Considering this factor, together with the other robust assumptions made in the original EIS evaluation (such as no contribution from the on-site borrow pit and concrete batching plant), it can be readily appreciated that the traffic generation figures used in the original EIS in relation to the capacity of the receiving road are extraordinarily robust, in fact so robust as to be infeasible.
Further in this regard, Table 14-13c below provides an estimate of the increase in all traffic arising from the forecast 85th percentile value traffic generation Scenario C set out above together with the average value traffic generation of Scenario D.
Scenario C is representative of higher that average peak traffic flows generated by the development construction and is considered to reflect a realistic approximate 85th percentile traffic generation scenario which is robust and in line with industry standard practice in the appraisal of traffic impact and traffic flows.
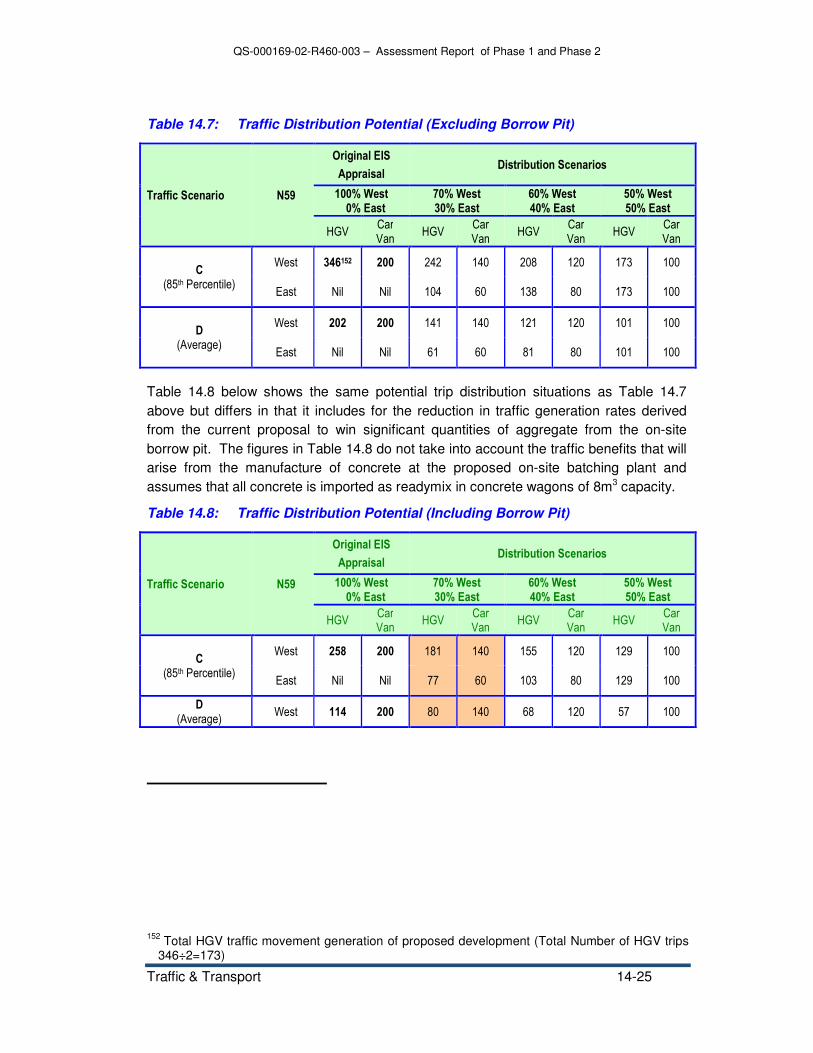
The figures in Table 14.7 below are based upon various potential traffic flow distribution assumptions at the site accesses. In the interest of a comprehensive evaluation the figures exclude consideration of winning any aggregates from the borrow pit for which permission has been sought and similarly exclude the traffic mitigation effects of the proposed on-site batching plant.
QS-000169-02-R460-003 – Assessment Report of Phase 1 and Phase 2
Traffic & Transport 14-25
Table 14.7: Traffic Distribution Potential (Excluding Borrow Pit)
Traffic Scenario N59
Original EIS
Appraisal Distribution Scenarios
100% West 0% East
70% West 30% East
60% West 40% East
50% West 50% East
HGV Car Van
HGV Car Van
HGV Car Van
HGV Car Van
C (85th Percentile)
West 346152 200 242 140 208 120 173 100
East Nil Nil 104 60 138 80 173 100
D (Average)
West 202 200 141 140 121 120 101 100
East Nil Nil 61 60 81 80 101 100
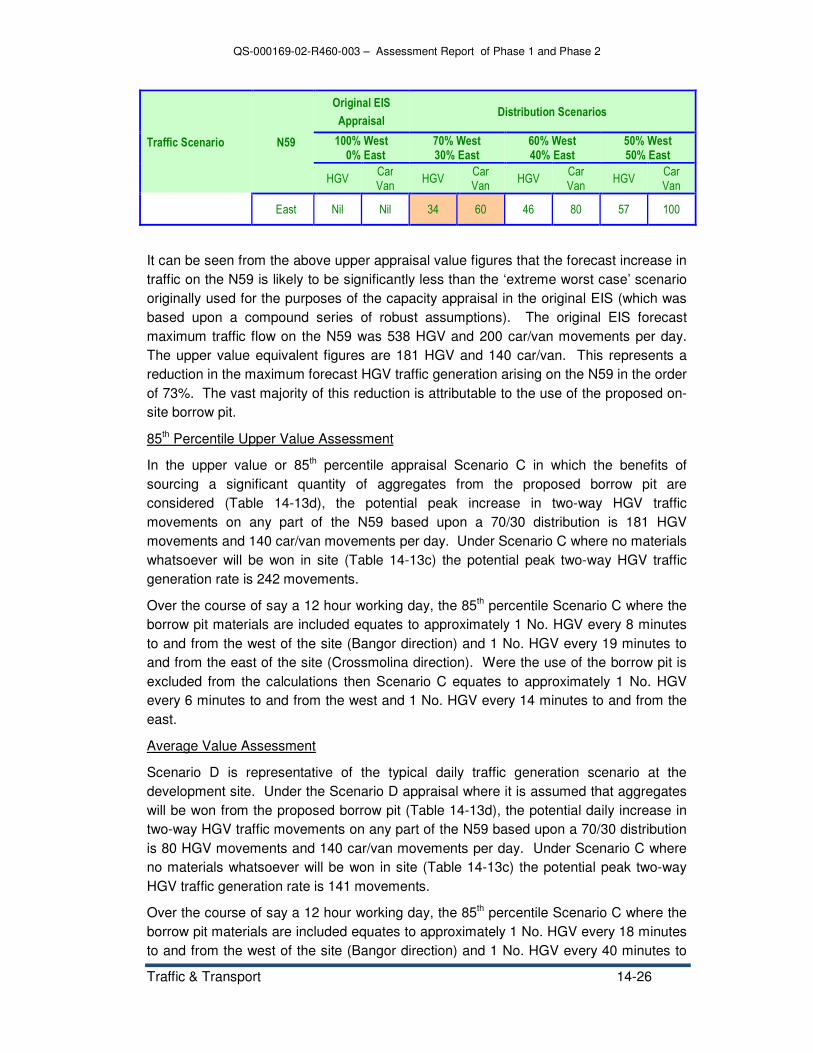
Table 14.8 below shows the same potential trip distribution situations as Table 14.7 above but differs in that it includes for the reduction in traffic generation rates derived from the current proposal to win significant quantities of aggregate from the on-site borrow pit. The figures in Table 14.8 do not take into account the traffic benefits that will arise from the manufacture of concrete at the proposed on-site batching plant and assumes that all concrete is imported as readymix in concrete wagons of 8m3 capacity.
Table 14.8: Traffic Distribution Potential (Including Borrow Pit)
Traffic Scenario N59
Original EIS
Appraisal Distribution Scenarios
100% West 0% East
70% West 30% East
60% West 40% East
50% West 50% East
HGV Car Van
HGV Car Van
HGV Car Van
HGV Car Van
C (85th Percentile)
West 258 200 181 140 155 120 129 100
East Nil Nil 77 60 103 80 129 100
D (Average)
West 114 200 80 140 68 120 57 100
152 Total HGV traffic movement generation of proposed development (Total Number of HGV trips
346÷2=173)
QS-000169-02-R460-003 – Assessment Report of Phase 1 and Phase 2
Traffic & Transport 14-26
Traffic Scenario N59
Original EIS
Appraisal Distribution Scenarios
100% West 0% East
70% West 30% East
60% West 40% East
50% West 50% East
HGV Car Van
HGV Car Van
HGV Car Van
HGV Car Van
East Nil Nil 34 60 46 80 57 100
It can be seen from the above upper appraisal value figures that the forecast increase in traffic on the N59 is likely to be significantly less than the ‘extreme worst case’ scenario originally used for the purposes of the capacity appraisal in the original EIS (which was based upon a compound series of robust assumptions). The original EIS forecast maximum traffic flow on the N59 was 538 HGV and 200 car/van movements per day. The upper value equivalent figures are 181 HGV and 140 car/van. This represents a reduction in the maximum forecast HGV traffic generation arising on the N59 in the order of 73%. The vast majority of this reduction is attributable to the use of the proposed on-site borrow pit.
85th Percentile Upper Value Assessment
In the upper value or 85th percentile appraisal Scenario C in which the benefits of sourcing a significant quantity of aggregates from the proposed borrow pit are considered (Table 14-13d), the potential peak increase in two-way HGV traffic movements on any part of the N59 based upon a 70/30 distribution is 181 HGV movements and 140 car/van movements per day. Under Scenario C where no materials whatsoever will be won in site (Table 14-13c) the potential peak two-way HGV traffic generation rate is 242 movements.
Over the course of say a 12 hour working day, the 85th percentile Scenario C where the borrow pit materials are included equates to approximately 1 No. HGV every 8 minutes to and from the west of the site (Bangor direction) and 1 No. HGV every 19 minutes to and from the east of the site (Crossmolina direction). Were the use of the borrow pit is excluded from the calculations then Scenario C equates to approximately 1 No. HGV every 6 minutes to and from the west and 1 No. HGV every 14 minutes to and from the east.
Average Value Assessment
Scenario D is representative of the typical daily traffic generation scenario at the development site. Under the Scenario D appraisal where it is assumed that aggregates will be won from the proposed borrow pit (Table 14-13d), the potential daily increase in two-way HGV traffic movements on any part of the N59 based upon a 70/30 distribution is 80 HGV movements and 140 car/van movements per day. Under Scenario C where no materials whatsoever will be won in site (Table 14-13c) the potential peak two-way HGV traffic generation rate is 141 movements.
Over the course of say a 12 hour working day, the 85th percentile Scenario C where the borrow pit materials are included equates to approximately 1 No. HGV every 18 minutes to and from the west of the site (Bangor direction) and 1 No. HGV every 40 minutes to

QS-000169-02-R460-003 – Assessment Report of Phase 1 and Phase 2
Traffic & Transport 14-27
and from the east of the site (Crossmolina direction). Were the use of the borrow pit is excluded from the calculations then Scenario C equates to approximately 1 No. HGV every 10 minutes to and from the west and 1 No. HGV every 24 minutes to and from the east.
By comparison, it can be readily appreciated that the ‘extreme scenario’ set out in the original EIS is extraordinarily robust and, whilst such a robust approach may demonstrate that the receiving road network has sufficient capacity to cater for multiples of the ordinary every day traffic generation of the site, it does not provide the average and 85th percentile scenarios typically considered in the determination of traffic impact on the receiving road network during the construction period. From the above refinement of the original assessment it can be appreciated that the peak increase (Scenario C) in HGV traffic on the N59 is likely to be less than half that figure presented in the original EIS. The average increase on a day to day basis (Scenario D) is considerably less than half and closer to one quarter where the sourcing of aggregates from the proposed borrow pit is considered.
14.4.3 Assessment of Potential Traffic Routes – Wind Turbine Components
The assessment of a suitable delivery route for wind turbine components involves the following:
• Identification of suitable port facilities – principally the availability of off-loading equipment and sizeable laydown area.
• Assessment of the delivery route from port to site entrance in relation to vertical and horizontal road alignment.
• Assessment of the delivery route from port to site entrance in relation to road (and bridge / culvert) strength and running width.
Delivery of components of the nacelle is likely to involve the heaviest loads with delivery of turbine blades being the longest loads.
Although the turbine blades are relatively light it is the blade delivery that typically defines both vertical and horizontal alignment requirements. Blade trailers are extendable and invariably have rear wheel steer with the capability of being operated automatically during regular road use, or manually during slow walking pace manoeuvring.
While multiple blade load trailers may be preferred, this means that blades can have no overhang and the trailer unit must extend to the full length of the blade. In this instance, the possibility of tighter turning circles and avoidance of grounding indicate the use of a trailer with shortened wheel base and blade overhang.
The project is currently at a stage where the contracts for the supply of materials and for construction of the project are not yet in place. In accordance with EU procurement rules for utilities, the contract to supply and construct the wind farm will be open to international competition. It will be a matter for the chosen contractor to determine the most suitable haulage route to the site. In such circumstances, definitive details with regard to proposed haulage route for heavy vehicles cannot be provided at this time.
QS-000169-02-R460-003 – Assessment Report of Phase 1 and Phase 2
Traffic & Transport 14-28
However, it is likely to be one of the three haul routes identified in Section 14.2.3 above.
14.4.4 Assessment of Construction Impacts (Extreme Worst Case Scenario)
The original EIS estimated maximum number of vehicle movements per day at peak construction will be approximately 738, assuming concrete pouring for piles, and foundations occur simultaneously and also fill material and turbine components are being delivered to the site on the same day, and assuming all traffic arrives from one direction. The predicted contribution to the AADT on the N59 from the Oweninny construction phase and the remaining capacity is set out in Table 14.9. The predicted AADT during all construction phases is well within the capacity of the Level of Service D for this link road. When concrete pour is completed the main construction traffic will be related to the import of fill material to the site. The estimated traffic movements associated with this will be 402 per day and the remaining capacity on the N59 will increase accordingly.

QS-000169-02-R460-003 – Assessment Report of Phase 1 and Phase 2
Traffic & Transport 14-29
Table 14.9: Forecast Capacity in AADT during construction period (Extreme Worst
Case Scenario of Original EIS)
Year Estimated
AADT
Oweninny Construction
Abs. Max. AADT Total AADT
Remaining capacity on the
N59
2012 2068 0 2068 64%
2013 2092 0 2092 63%
2014 2118 0 2118 63%
2015 2143 0 2143 63%
2016 2169 0 2169 62%
2017 2195 738 2933 49%
2018 2221 738 2959 48%
2019 2248 738 2986 48%
2020 2275 738 3013 47%
2021 2302 0 2302 60%
2022 2330 0 2330 59%
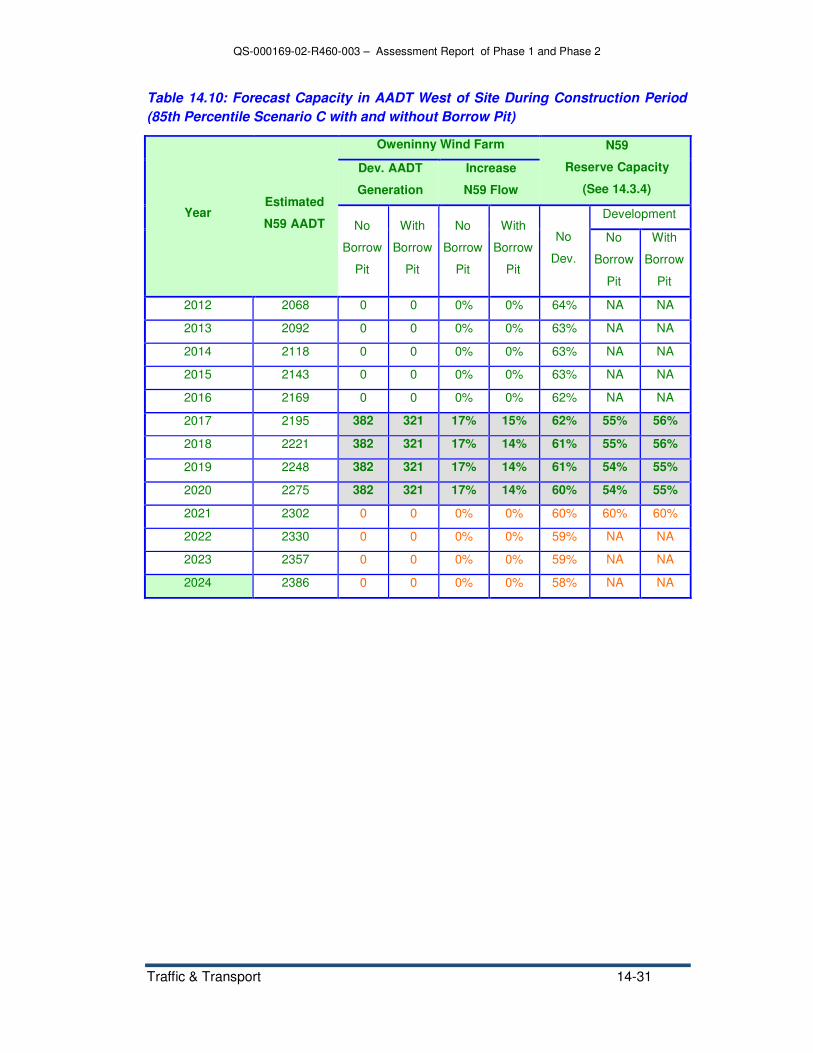
The following Table 14.10 is derived from the above Table 14.9 but reflects the 85th Percentile upper value Scenario C assessment figures of Table 14.7and Table 14.8. Table 14.10 provides an assessment of the carrying capacity and relative impact of the development on the section of the N59 to the west of the site access whilst

QS-000169-02-R460-003 – Assessment Report of Phase 1 and Phase 2
Traffic & Transport 14-30
Table 14.11 shows the same information on the N59 to the east of the site access (Crossmolina Side).
QS-000169-02-R460-003 – Assessment Report of Phase 1 and Phase 2
Traffic & Transport 14-31
Table 14.10: Forecast Capacity in AADT West of Site During Construction Period
(85th Percentile Scenario C with and without Borrow Pit)
Year Estimated
N59 AADT
Oweninny Wind Farm N59
Reserve Capacity
(See 14.3.4)
Dev. AADT
Generation
Increase
N59 Flow
No
Borrow
Pit
With
Borrow
Pit
No
Borrow
Pit
With
Borrow
Pit
No
Dev.
Development
No
Borrow
Pit
With
Borrow
Pit
2012 2068 0 0 0% 0% 64% NA NA
2013 2092 0 0 0% 0% 63% NA NA
2014 2118 0 0 0% 0% 63% NA NA
2015 2143 0 0 0% 0% 63% NA NA
2016 2169 0 0 0% 0% 62% NA NA
2017 2195 382 321 17% 15% 62% 55% 56%
2018 2221 382 321 17% 14% 61% 55% 56%
2019 2248 382 321 17% 14% 61% 54% 55%
2020 2275 382 321 17% 14% 60% 54% 55%
2021 2302 0 0 0% 0% 60% 60% 60%
2022 2330 0 0 0% 0% 59% NA NA
2023 2357 0 0 0% 0% 59% NA NA
2024 2386 0 0 0% 0% 58% NA NA

QS-000169-02-R460-003 – Assessment Report of Phase 1 and Phase 2
Traffic & Transport 14-32
Table 14.11: Forecast Capacity in AADT East of Site During Construction Period
(85th Percentile Scenario C with and without Borrow Pit)
Year Estimated
N59 AADT
Oweninny Wind Farm N59
Reserve Capacity
(See 14.3.4)
Dev. AADT
Generation
Increase
N59 Flow
No
Borrow
Pit
With
Borrow
Pit
No
Borrow
Pit
With
Borrow
Pit
No
Dev.
Development
No
Borrow
Pit
With
Borrow
Pit
2012 1410 0 0 0% 0% 75% NA NA 2013 1427 0 0 0% 0% 75% NA NA 2014 1444 0 0 0% 0% 75% NA NA 2015 1461 0 0 0% 0% 75% NA NA 2016 1479 0 0 0% 0% 74% NA NA 2017 1496 164 137 11% 9% 74% 71% 72%
2018 1514 164 137 11% 9% 74% 71% 71%
2019 1532 164 137 11% 9% 73% 70% 71%
2020 1551 164 137 11% 9% 73% 70% 71%
2021 1569 0 0 0% 0% 73% NA NA 2022 1588 0 0 0% 0% 72% NA NA 2023 1607 0 0 0% 0% 72% NA NA 2024 1627 0 0 0% 0% 72% NA NA
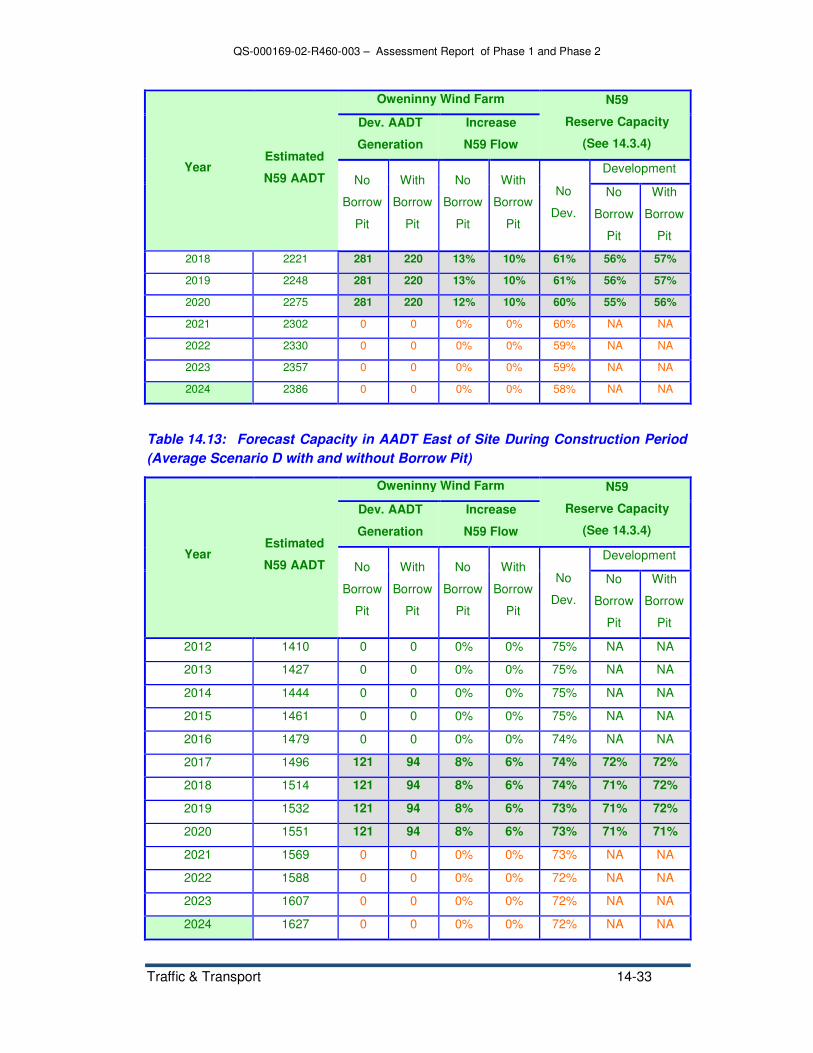
The following Table 14.12 and Table 14.13 are derived from the above Table 14.9 but reflect the average traffic generation Scenario D assessment figures of Table 14.7 and Table 14.8.
Table 14.12: Forecast Capacity in AADT West of Site During Construction Period
(Average Scenario D with and without Borrow Pit)
Year Estimated
N59 AADT
Oweninny Wind Farm N59
Reserve Capacity
(See 14.3.4)
Dev. AADT
Generation
Increase
N59 Flow
No
Borrow
Pit
With
Borrow
Pit
No
Borrow
Pit
With
Borrow
Pit
No
Dev.
Development
No
Borrow
Pit
With
Borrow
Pit
2012 2068 0 0 0% 0% 64% NA NA
2013 2092 0 0 0% 0% 63% NA NA
2014 2118 0 0 0% 0% 63% NA NA
2015 2143 0 0 0% 0% 63% NA NA
2016 2169 0 0 0% 0% 62% NA NA
2017 2195 281 220 13% 10% 62% 57% 58%
QS-000169-02-R460-003 – Assessment Report of Phase 1 and Phase 2
Traffic & Transport 14-33
Year Estimated
N59 AADT
Oweninny Wind Farm N59
Reserve Capacity
(See 14.3.4)
Dev. AADT
Generation
Increase
N59 Flow
No
Borrow
Pit
With
Borrow
Pit
No
Borrow
Pit
With
Borrow
Pit
No
Dev.
Development
No
Borrow
Pit
With
Borrow
Pit
2018 2221 281 220 13% 10% 61% 56% 57%
2019 2248 281 220 13% 10% 61% 56% 57%
2020 2275 281 220 12% 10% 60% 55% 56%
2021 2302 0 0 0% 0% 60% NA NA
2022 2330 0 0 0% 0% 59% NA NA
2023 2357 0 0 0% 0% 59% NA NA
2024 2386 0 0 0% 0% 58% NA NA
Table 14.13: Forecast Capacity in AADT East of Site During Construction Period
(Average Scenario D with and without Borrow Pit)
Year Estimated
N59 AADT
Oweninny Wind Farm N59
Reserve Capacity
(See 14.3.4)
Dev. AADT
Generation
Increase
N59 Flow
No
Borrow
Pit
With
Borrow
Pit
No
Borrow
Pit
With
Borrow
Pit
No
Dev.
Development
No
Borrow
Pit
With
Borrow
Pit
2012 1410 0 0 0% 0% 75% NA NA
2013 1427 0 0 0% 0% 75% NA NA
2014 1444 0 0 0% 0% 75% NA NA
2015 1461 0 0 0% 0% 75% NA NA
2016 1479 0 0 0% 0% 74% NA NA
2017 1496 121 94 8% 6% 74% 72% 72%
2018 1514 121 94 8% 6% 74% 71% 72%
2019 1532 121 94 8% 6% 73% 71% 72%
2020 1551 121 94 8% 6% 73% 71% 71%
2021 1569 0 0 0% 0% 73% NA NA
2022 1588 0 0 0% 0% 72% NA NA
2023 1607 0 0 0% 0% 72% NA NA
2024 1627 0 0 0% 0% 72% NA NA

QS-000169-02-R460-003 – Assessment Report of Phase 1 and Phase 2
Traffic & Transport 14-34
There is adequate carrying capacity on the N59 at peak construction periods with a residual capacity of greater than 50% under either the upper value 85th percentile traffic generation or average traffic generation scenarios at the proposed development. In practical terms under the day to day figures of Scenario D show that the level of impact on the carrying capacity of the N59 is likely to be in the order of 6% to the east and 12% to the west which is a significant (more than 50%) reduction over the impact forecast in the original EIS Table 14.9 above. Albeit that the road network has sufficient capacity and the reduction in capacity is relatively modest it is acknowledged that the forecast in traffic flows on the N59 resulting from the proposed development is likely to be in the order of 6-12% on a day to day basis and up to 17% on days where traffic generation is above average (during concrete pours for instance). Albeit that the level of service on the road may remain relatively high it is acknowledged that a 17% increase in traffic flows is likely to result in an incre4ase in journey times for users of the N59 and will also result in increased delay at junctions. It follows that the influences of development traffic diminish with increasing distance from the site and clearly the greatest influence of construction traffic will be at the construction accesses.
In addition to the above the following potential impacts associated with the construction period may occur:
• Damage to the N59 and other road pavement may occur due to the increased traffic movements associated with HGVs over the construction period
• Damage to road bridges along construction routes could occur from the increased traffic movements of HGVs. This will be dependent on the construction delivery routes selected by the construction contractor.
• There is a potential for increase in traffic accidents during the construction period due to the increased traffic movements and turning requirements at the three site entrances.
• Some temporary inconvenience during the construction period to other road users will be created by the increased level of traffic movements on the N59. However, the relatively low level of current use of the roads surrounding the site means that only a limited number of existing road users will be impacted.
• The increased vehicle movements will lead to a degree of temporary increased traffic noise at residences situated on the delivery routes. This will primarily result from increases in use by conventional HGVs carrying concrete and stone as opposed to the exceptional load traffic.
14.4.5 Project Operation 14.4.5.1 Wind Farm Maintenance
Normally each turbine will have its own in-built supervision and control system that will be capable of starting the turbine, monitoring its operation and shutting down the turbine in the case of fault conditions.
Supervisory operational and monitoring activities will be carried out remotely from the O&M building with the aid of computers connected via a telephone modem link. It is anticipated that the wind farm will be manned during the operational phase with an estimated twelve full time employees on site. This will generate up to 24 light vehicle
QS-000169-02-R460-003 – Assessment Report of Phase 1 and Phase 2
Traffic & Transport 14-35
movements per day peaking in the early morning and evening periods which will have insignificant impact on the N59.
In the unlikely event of a major component failure, a mobile crane will be required on site.
14.4.5.2 Road Safety
By their very nature wind turbines are significant features in the landscape and the turbines at Oweninny will be visible intermittently from the N59, from the R312 and from local roads. However, there is no evidence from Ireland or elsewhere to indicate that wind farm turbine towers or moving wind turbine blades endanger public safety by reason of traffic hazard.
Fast moving objects in the field of view or on the horizon are much more likely to cause distraction to motorists than wind turbine blades. These move slowly and steadily, rotating at a speed of one revolution every 3 – 5 seconds. Instances of fast moving objects include views from the public road of aircraft take-offs and landings at airports; trains crossing roads at bridges or running on tracks parallel to roadways; traffic crossing road over bridges and on parallel, higher, lower or crossing roads at sophisticated motorway interchanges. Horses and other animals are also liable to move quickly in the field of view. There is no indication that such phenomena impact adversely on road safety.
There is no recorded instance where the presence of a wind turbine in the field of vision was cited as a contributory factor in a road accident. Nor is there any recorded instance where the presence of a wind turbine in the field of vision was cited as having a negative impact on road safety.
Delivery of large wind turbine components poses special road traffic risks and there have been a number of road accidents associated with collisions involving wind turbine component delivery. These accidents can be avoided by undertaking comprehensive route surveys with deliveries accompanied by a Garda escort and should the need arise the temporary closure of roads to traffic.
Any local road improvements that are necessary for delivery of wind turbine components will improve overall road safety in the long term.
There is no potential for a wind turbine to impact directly on the N59 in the event of a turbine collapse as the nearest turbine to the N59 is located some 400 metres away.
QS-000169-02-R460-003 – Assessment Report of Phase 1 and Phase 2
Traffic & Transport 14-36
14.4.5.3 Visitor Centre traffic
It is anticipated that the proposed Visitor Centre will have the potential to attract large numbers of visitors when it becomes fully operational. It is located in the general area of the Céide Fields Visitor Centre in Ballycastle and Bellmullet town in County Mayo both tourist venues. The Céide Fields has attracted large numbers of visitors, peaking at 28,253 in 2009 and with a recorded 25,885 visitors in 2011,153 and it would be expected that a proportion of visitors to the general area would avail of the opportunity to visit the proposed centre at Bellacorick.
The Oweninny Visitor Centre will be open to visitors post construction of phase 1 of the project. During peak season, the centre could have five to ten people employed on a full and part time basis. This could generate up to twenty car vehicle movements daily in peak season.
It is anticipated that an additional 300 visitors per day on average including tour groups could be envisaged at peak tourism activity periods. Assuming this would include three tour buses with sixty visitors each and the remainder as cars with two passengers This would give rise to an additional 3 commercial vehicles and 60 cars on the N59, that is an additional 126 vehicle movements per day during peak construction. This would result in remaining capacity being reduced on the N59 to between 64% and 62%. Should visitor numbers increase at the Visitor Centre during the construction of Phase 2 there will still be adequate capacity remaining on the N59 link road. These figures are based upon the original extreme EIS scenario.
14.4.6 Project Decommissioning Short-term effects will arise during decommissioning. Any impact that does arise will be temporary and very short lived.
Vehicle movements over the decommissioning period will be much less than those of the construction period, given that the major elements of traffic movements involving stone and concrete deliveries will not arise. It is envisaged that access tracks and crane hard stands would not be removed from the site. Concrete foundations would be left in situ.
The dismantling of the wind turbines will involve the use of mobile cranes and their removal will entail a similar number of loads to turbine delivery during construction. Alternatively, turbine blades, for example, may be cut into shorter sections before being loaded onto conventional flatbed trucks.
153 http://debates.oireachtas.ie/dail/2012/01/31/00172.asp

QS-000169-02-R460-003 – Assessment Report of Phase 1 and Phase 2
Traffic & Transport 14-37
Dismantling of substations would involve removal of transformers and other electrical equipment from the site which would involve a small number of abnormal loads for the transformers.
14.5 MITIGATION OF POTENTIAL IMPACTS 14.5.1 Delivery of Wind Turbine Components With regard to deliveries of turbine components, the appropriate authorities will be notified of the movement of long and abnormal loads. Appropriate traffic management measures will be agreed in advance and it is expected that these will include the following:
• Delivery of wind turbine components will use special transporter vehicles with rear wheel steering to assist safe transportation and manoeuvrability on the roads.
• Placing warning notices to advise other road users of the presence of slow moving vehicles.
• Notification of residents along the route prior to deliveries • Using lead warning vehicles and using Garda escorts where required. • Undertaking deliveries at times that minimise the impact on other road users
and resting in safe lay-bys to reduce any traffic congestion. • Closing extendable transporter vehicles on return journeys. • Closing short sections of road if this proves necessary
The movement of the abnormal loads by road will be the subject of an application requesting permission to move the goods. This ‘Permit for Specialised Vehicles’ form, when signed by the Garda Síochána Permits Officer, grants permission to move abnormal loads as defined under Road Traffic (Permits for Specialised Vehicles)
Regulations, 2009, on inter-urban routes. These Regulations introduce a streamlined permit system for the movement of wide and long vehicles (including loads) not exceeding 27.4 m in length and 4.3 m in width.
Inter urban routes are identified in the schedule of Designated Roads governed in Road
Traffic (Specialised Vehicle Permits) (Amendments) Regulations 2010. The Regulations state that any deviations from the Schedule of Designated Roads requires independent authorisation from the Local Authority concerned and or Minister for Transport. This subsequent process is covered under the Road Traffic (Specialised Permits for
Particular Vehicles) Regulations, 2007.
14.5.2 Maximising use of existing ground conditions and existing on site tracks
Maximising the use of the existing ground conditions and existing access trackways is intrinsic to the design process and is essential to mitigation by design. The Oweninny site is former raised bog area which has been extensively worked in the past leaving areas of bare subsoil and reduced peat depth. The site also has an existing network of access trackways leading to the existing Bellacorick wind farm and trackways associated with the former railway network used in peat harvesting. The design of the access

QS-000169-02-R460-003 – Assessment Report of Phase 1 and Phase 2
Traffic & Transport 14-38
trackway has minimized the requirement for cut and fills operations to the extent possible by routing along ridge lines and areas of minimum peat depth. This has minimised the volume of fill material required for access track construction and consequently helped to minimize the transport requirements. Additionally, 6 km of existing access trackways have been incorporated into the design and although these will be upgraded this has also reduced the requirement for imported fill and the associated transport.
14.5.3 Potential Reduction in the traffic movements
14.5.3.1 On-site borrow pit A borrow pit, 17 hectares in area, has been identified on site which could yield up to 340,000m3 of material suitable for access track and crane hardstand construction. The use of this borrow pit would lead to a substantial reduction of vehicle traffic on the N59 road. Based on a full load of 10m3 per vehicle, a reduction of the overall vehicle movements on the N59 by 68,000 could be achieved as these movements would be internal to the site.
14.5.3.2 On site Concrete Batching Plant An on-site concrete batching plant is proposed to provide a continuous supply of concrete for pile and foundation works. The provision of the concrete batching plant would not significantly reduce the overall traffic movements associated with the construction as aggregate, sand and cement would have to be delivered to site for concrete production. However, delivery of such materials would be scheduled over a more prolonged period with stockpiling at the batching plant well in advance of concrete requirements. This would then lead to a reduction in peak traffic movements associated with concrete deliveries on the N59 as a proportion of the concrete required would be batched internal to the site.
14.5.4 General Construction Traffic It is proposed that a joint condition survey of public roads be carried out by Oweninny Power Ltd. and Mayo County Council prior to commencement of the project. This will form the basis for agreeing:
• Local road improvements in the vicinity of the site to minimise impacts on other road users.
• Any remedial works that may be necessary following completion of the construction.
Trucks used in deliveries of fill and concrete will be regular road going vehicles having no special constraints in relation to width or alignment. However, it is recognised that public roads will be affected by these deliveries. For the delivery route from concrete source to the site entrance, the assessment will focus on road strength and in particular on the quality of the running surface.
This is likely to include the following:
• Pavement Condition Index (PCI) survey. A visual inspection, incorporating a video survey of the access roads is normally conducted prior to movement of construction traffic to record road condition.

QS-000169-02-R460-003 – Assessment Report of Phase 1 and Phase 2
Traffic & Transport 14-39
• Alignment and Width Survey. A full width and road alignment survey is conducted by an appropriately qualified transport company, in conjunction with both the turbine manufacturer and the site project engineer. Prior to delivery it would also be standard practice to complete a dry run with an unladen tractor and extendable trailer unit.
• Structural Survey (Falling Weight Deflection). A full structural survey may be undertaken over any sections of road which appear particularly weak or liable to subside.
Liaison will be maintained with the residents along local access routes and they will be advised of any particularly busy periods.
14.5.5 Traffic Management Plan A number of measures are proposed to ensure road safety and to minimise inconvenience to other road users. A Traffic Management Plan will be developed and agreed with Mayo County Council’s Roads Engineering Department prior to commencement of works and this will include the following specific mitigation measures:
• Construction and delivery vehicles will be instructed to use only the approved and agreed means of access and movement of construction vehicles will be restricted to these designated routes
• Appropriate vehicles will be used to minimise environmental impacts from transporting construction materials, for example the use of dust covers on trucks carrying dust producing material.
• Temporary traffic lights and/or road or lane closures will be provided as required to ensure traffic safety.
• Parking of site vehicles on the public highway will not be permitted. • A road sweeper and/or wheel washing facilities will be utilised to clean the
public roads of any mud that may be introduced from the site roads. • All vehicles will be properly serviced and maintained to avoid any leaks or
spillage of oil, petrol or diesel. All scheduled maintenance will be carried out off site.
14.5.6 Landtake Where road improvements involve landtake, the following approach will be adopted:
• Upon grant of planning permission and following full evaluation of any conditions in the permission relating to turbine deliveries, Oweninny Power Limited will meet with the landowners concerned, to provide detail of the works required and negotiate compensation arrangements.
• As part of this process, the Landowners will complete a Deed of Dedication. This will provide permission for takeover by the relevant Local Authority of the amended road area where applicable.
• Oweninny Power Limited will remain engaged with the Council at all stages through construction work and will remain so until the completion of works and the final takeover by the local authority of amended road sections.
QS-000169-02-R460-003 – Assessment Report of Phase 1 and Phase 2
Traffic & Transport 14-40
14.5.7 Access points The recommendations of the Road Safety Audit prepared for the access points will be implemented in the detailed design of the project.
14.6 CUMULATIVE IMPACTS 14.6.1 General There are a number of other infrastructure and wind farm projects that have or may have the potential during construction to have an impact upon the receiving roads and haul routes associated with the proposed Oweninny Wind Farm and thus have the potential to give rise to a cumulative impact. The following projects are considered:
• Corvoderry Wind Farm (10 Turbines) • Sheskin Wind Farm (6 Turbines) • Cluddaun Wind Farm (48 Turbines) • Tawnanasool Wind Farm (8 Turbines) • Bellacorick – Castlebar 110kV Overhead Line Upgrade • Bellacorick – Moy 110kV Overhead Line Upgrade
14.7 Wind Farm Developments Corvoderry Wind Farm, which is located within the Oweninny site, has been granted planning permission by Mayo County Council for the construction of 10 wind turbines. This wind farm is not likely to be connected to the national grid until the EirGrid Grid West project has been constructed, hence construction of Corvoderry is unlikely to occur prior to the completion of Phase 2 of the Oweninny Project. The Corvoderry site has a right of way along the existing Bellacorick wind farm access track. A reasonable basis upon which to estimate traffic arising from the construction of Corvoderry Wind Farm would be using a generation rate based upon the number of turbines since there is a relatively proportional relationship between the number of turbines and the quantum of construction materials, access tracks, concrete foundations, workforce etc. Based upon the Corvoderry EIS it is expected that the 10 turbine wind farm could be completed with one year. Table 14.7 Scenario D provides day to day construction traffic generation of the proposed Oweninny Wind Farm. The calculations for Oweninny are based upon a rate of construction equating to 15 turbines per year. A reasonable estimate of the daily traffic generation to the N59 is considered to be two thirds of the daily average estimate for Oweninny. From Table 14.7 this equates to a daily increase in HGV in the order of 94 to the west of the site and 41 to the east and an increase in light vehicle traffic equating to 93 cars/vans to the west and 40 to the east.
In addition, 19.3 hectares of the existing private forest plantation will be clearfelled to facilitate the Corvoderry Wind Farm development. This plantation is semi mature and the clearfell requirement will generate approximately 16 timber transport vehicle loads per hectare or 309 timber loads equating to an additional 618 timber transport vehicle movements. This clearfell would take place in advance of construction works on the

QS-000169-02-R460-003 – Assessment Report of Phase 1 and Phase 2
Traffic & Transport 14-41
Corvoderry site. Traffic generation during this period of timber harvesting will clearly be less than during the construction programme proper.
The potential impact arising from the construction of the Cluddaun Wind Farm by Coillte had been considered in the original EIS traffic section. The planning application for the Coillte Wind Farm proposal at Cluddaun which comprised 48 wind turbines has been refused planning permission by An Bord Pleanála and will therefore not contribute to cumulative impact.
Tawnanasool Wind Farm is an 8 turbine facility which it is proposed will be accessed directly from N59 between Bangor and Ballycroy at a location west of the Oweninny Wind Farm. The cumulative impact of Tawnanasool arising on the N59 will be from the construction traffic. It is considered likely that the majority of fill materials would be sourced from a local supply in Bangor. As per the round estimates associated with Corvoderry the traffic generation associated with the construction of the wind farm is expected to be in the order of 75 HGV to the east of the site and 33 to the west (directions reversed as source of materials predominantly expected to be Bangor). The forecast increase in light vehicle traffic on the N59 equates 75 cars/vans to the east and 33 to the west.
In addition the Tawnanasool Wind Farm proposes a grid connection that would involve the construction of an underground cable generally running in the N59 carriageway between the site and Bangor. There is an impact that arises from the transportation of materials for such a cable construction but by far the greatest impact arises from the management of traffic during the cable laying project. Cables are typically places in 100-150m sections using a programme of rolling lane closure and one-way working. It is not considered likely that cable construction would be undertaken on the N59 at the same time as wind farm construction since the N59 is the primary haulage route. It is also unlikely that Mayo County Council would permit the cable works to be undertaken at the same time as perhaps other cable construction elsewhere on the N59 as may be associated with Phase 3 of the Oweninny Wind Farm project. Clearly there is likely to be an element of coordination between the various projects that involve traffic management measures that have a direct impact upon the operation of the N59. In the context of potential cumulative impacts it is not considered reasonable to investigate a crisis type uncontrolled scenario where the worst combination of all projects operating at 100th percentile together with all the worst impact arising from poor programming of traffic management works along the N59. This assessment instead focuses on the typical day-to-day scenario where all sites are assumed to coincidently operate at typical daily traffic generation rates. This is a reasonable scenario since there is a finite capacity of local resources such as stone and concrete and it is unlikely that all sites could progress intensive concrete works simultaneously.
It is assumed for the purposes of the traffic assessment that Corvoderry could be constructed in 2020. The Tawnanasool Wind Farm EIS predicts that construction would be carried out in 2017 and the site operational in 2018.
The following Table 14.14 and Table 14.15 are based upon Table 14.12 and Table 14.13 respectively and include for the cumulative impact of the various potential wind farm construction projects.

QS-000169-02-R460-003 – Assessment Report of Phase 1 and Phase 2
Traffic & Transport 14-42
Table 14.14: Forecast Capacity in AADT West of Site During Construction Period
(Average Scenario D with and without Borrow Pit)
Year Estimated
N59 AADT
Oweninny Wind Farm
+ Corvoderry
+ Tawnanasool
N59
Reserve Capacity
(See 14.3.4) Dev. AADT
Generation
Increase
N59 Flow
No
Borrow
Pit
With
Borrow
Pit
No
Borrow
Pit
With
Borrow
Pit
No
Dev.
Development
No
Borrow
Pit
With
Borrow
Pit
2013 2092 0 0 0% 0% 63% NA NA
2014 2118 0 0 0% 0% 63% NA NA
2015 2143 0 0 0% 0% 63% NA NA
2016 2169 0 0 0% 0% 62% NA NA
2017 2195 281
+66
220
+66 16% 13% 62% 56% 57%
2018 2221 281 220 13% 10% 61% 56% 57%
2019 2248 281 220 13% 10% 61% 56% 57%
2020 2275 281
+187
220
+187 21% 18% 60% 52% 53%
2021 2302 0
0
3% 3% 60% 58% 58%
2022 2330 0 0 0% 0% 59% NA NA
2023 2357 0 0 0% 0% 59% NA NA
2024 2386 0 0 0% 0% 58% NA NA
Table 14.15: Forecast Capacity in AADT East of Site During Construction Period
(Average Scenario D with and without Borrow Pit)
Year Estimated Oweninny Wind Farm N59
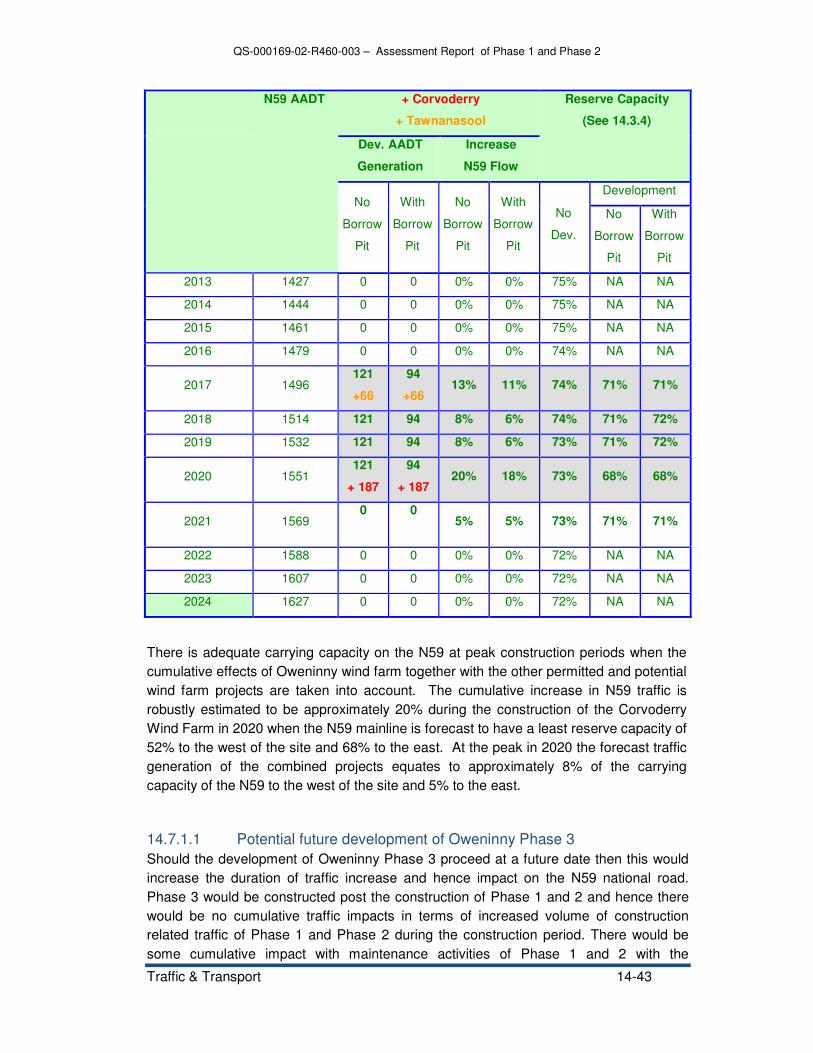
QS-000169-02-R460-003 – Assessment Report of Phase 1 and Phase 2
Traffic & Transport 14-43
N59 AADT + Corvoderry
+ Tawnanasool
Reserve Capacity
(See 14.3.4)
Dev. AADT
Generation
Increase
N59 Flow
No
Borrow
Pit
With
Borrow
Pit
No
Borrow
Pit
With
Borrow
Pit
No
Dev.
Development
No
Borrow
Pit
With
Borrow
Pit
2013 1427 0 0 0% 0% 75% NA NA
2014 1444 0 0 0% 0% 75% NA NA
2015 1461 0 0 0% 0% 75% NA NA
2016 1479 0 0 0% 0% 74% NA NA
2017 1496 121
+66
94
+66 13% 11% 74% 71% 71%
2018 1514 121 94 8% 6% 74% 71% 72%
2019 1532 121 94 8% 6% 73% 71% 72%
2020 1551 121
+ 187
94
+ 187 20% 18% 73% 68% 68%
2021 1569 0
0
5% 5% 73% 71% 71%
2022 1588 0 0 0% 0% 72% NA NA
2023 1607 0 0 0% 0% 72% NA NA
2024 1627 0 0 0% 0% 72% NA NA
There is adequate carrying capacity on the N59 at peak construction periods when the cumulative effects of Oweninny wind farm together with the other permitted and potential wind farm projects are taken into account. The cumulative increase in N59 traffic is robustly estimated to be approximately 20% during the construction of the Corvoderry Wind Farm in 2020 when the N59 mainline is forecast to have a least reserve capacity of 52% to the west of the site and 68% to the east. At the peak in 2020 the forecast traffic generation of the combined projects equates to approximately 8% of the carrying capacity of the N59 to the west of the site and 5% to the east.
14.7.1.1 Potential future development of Oweninny Phase 3 Should the development of Oweninny Phase 3 proceed at a future date then this would increase the duration of traffic increase and hence impact on the N59 national road. Phase 3 would be constructed post the construction of Phase 1 and 2 and hence there would be no cumulative traffic impacts in terms of increased volume of construction related traffic of Phase 1 and Phase 2 during the construction period. There would be some cumulative impact with maintenance activities of Phase 1 and 2 with the

QS-000169-02-R460-003 – Assessment Report of Phase 1 and Phase 2
Traffic & Transport 14-44
construction of Phase 3 but this would be insignificant. Cumulative impact could also occur with traffic generated by visitors to the proposed Visitor Centre which would be developed during Phase 1 and 2. However, as the Phase 1 and 2 construction will be completed before Phase 3 there will still be adequate spare carrying capacity on the N59. Cumulative operational impacts will be low and as described in the original EIS Chapter 14 Traffic and Transport submitted with the planning application to An Bord Pleanála in 2013.
14.7.2 110kV Overhead Line Upgrade Given that overhead line (OHL) construction is typically carried out at locations remote from the public road network, the potential impact upon public road traffic is generally associated with the requirement to transport both construction machinery and materials.
Traffic generation can reasonably be categorised into construction and operations staff traffic and commercial construction traffic. The workforce required and the need to transport machinery and materials depends upon the complexity of the works. In comparison to underground cable installation or wind farm construction works the workforce is modest as is the quantum of materials required to be transported to or from the various sites of towers and polesets. The upgrade of existing OHL is generally less demanding upon the receiving road network than new build. The OHL upgrade works will be accessed from the R312, the only cumulative impact arising from the works would be the transport needs along the N59. Given the modest transport demands of the upgrade works it is considered unlikely that these OHL projects would give rise to a significantly increases cumulative impact. Given the generally robust nature of the traffic generation and impacts arising from the proposed wind farm development it is likely that the additional impact of the OHL upgrade works if undertaken in concert with the wind farm construction would be practically negligible in the context of the N59 shared construction access route
Other traffic related impacts during the construction phase arises from the potential need for traffic management measures to ensure tower and poleset sites are accessible. These measures, if required, will be very short term in nature and should not have a long term appreciable impact upon road network capacity or level of service. All such traffic management relating to the OHL upgrade is remote from the N59.
14.8 CONCLUSION Albeit on a larger scale, the construction of the wind farm at Oweninny is similar to many other wind farms in Ireland and will generate a number of abnormal loads for wind turbine component delivery and will generate significant HGV movements associated with construction traffic.
Three potential haul routes for abnormal loads have been identified and an initial assessment of these has been made. Final haul route selection will be the responsibility of the turbine supplier and the final route and any modifications will be agreed with local authorities along the selected route.

QS-000169-02-R460-003 – Assessment Report of Phase 1 and Phase 2
Traffic & Transport 14-45
Traffic and transport impacts will occur mainly during the construction phase of the project. The worst case scenario assumes that all fill material and concrete will be imported to the site from local suppliers along the N59. This will generate increased traffic movements to the site along the N59 at each phase of construction. However the existing capacity of the N59 is adequate to cater for the additional traffic movements generated by Oweninny wind farm with a residual capacity in excess of 50% throughout the construction. Construction will take place in phases over a 7-8 year period with potential for impact spread across this period.
In the case where Corvoderry wind farm could potentially be constructed at the same time as Phase 2 of Oweninny wind farm a worst case scenario where all construction materials are imported via the N59 would still leave adequate capacity on the N59 secondary road with an estimated 50% reserve capacity during the peak construction period in 2020.
Potential impacts during construction can be mitigated significantly by on-site concrete batching and by developing an on-site borrow pit. Concrete batching will not reduce the required import of materials but would reduce peak traffic by spreading out delivery of concrete batching materials over a prolonged period. The on-site borrow pit if developed would substantially reduce the requirement for imported fill in the latter part of Phase 1 and for subsequent phases. This updated EIS shows the various scenarios which include calculations of traffic generation both with and without the borrow pit.
A condition survey of the N59 will be undertaken prior to construction and any strengthening works agreed with the local authority. Post construction surveys will be undertaken and any required remedial works agreed with the local authority also.
Abnormal load deliveries will be accompanied by safety vehicles and a Garda escort and the timing of delivery will be notified to the County Council and local residents along the transport route.
A traffic management plan will be developed and agreed with Mayo County Council to manage potential impacts from the site. With implementation of the mitigation measures no residual significant impact is predicted.
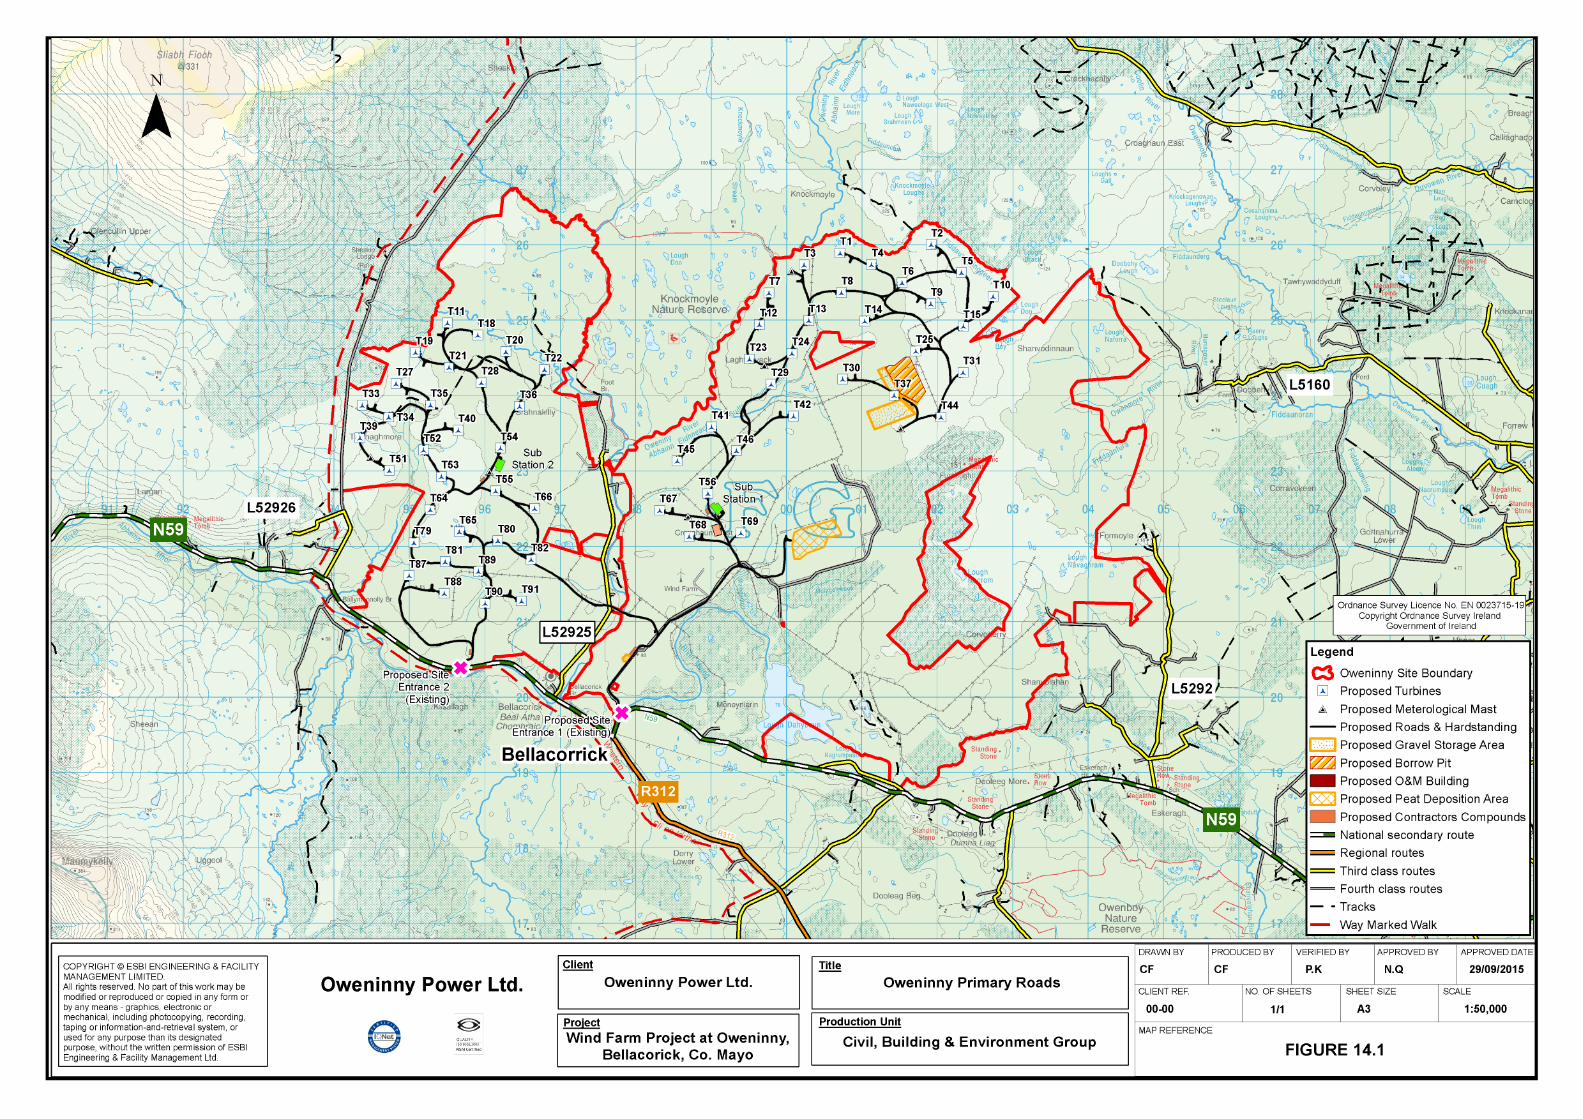
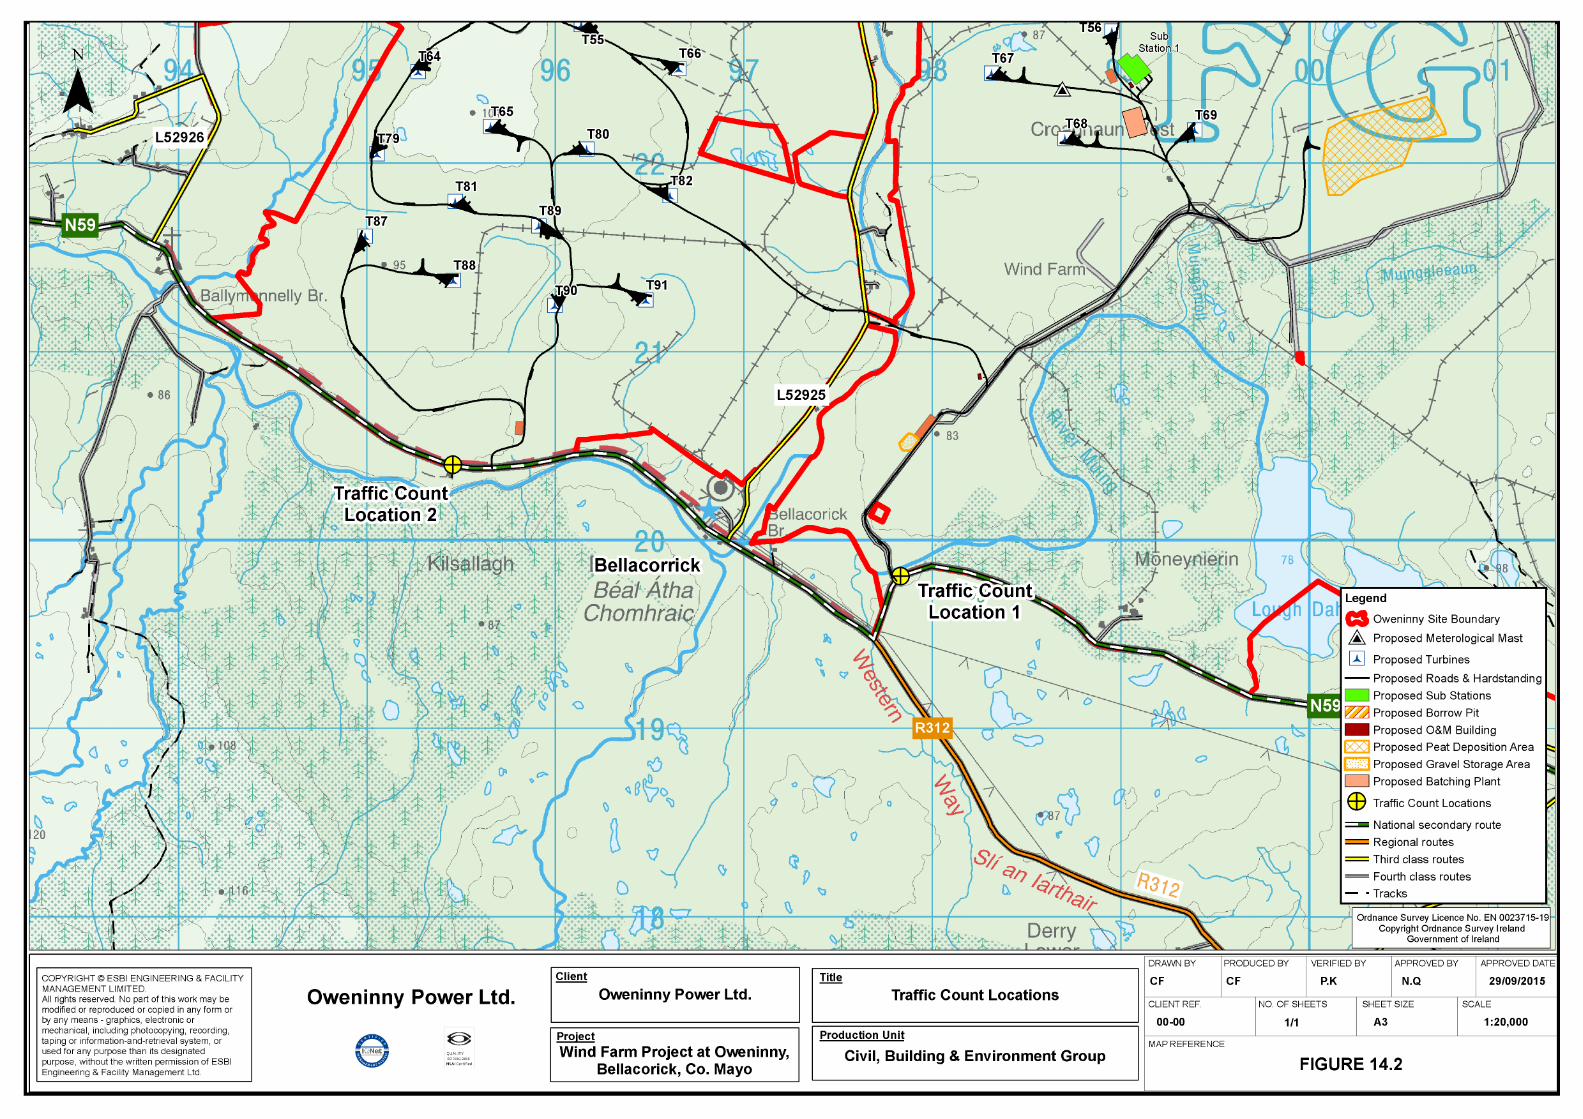
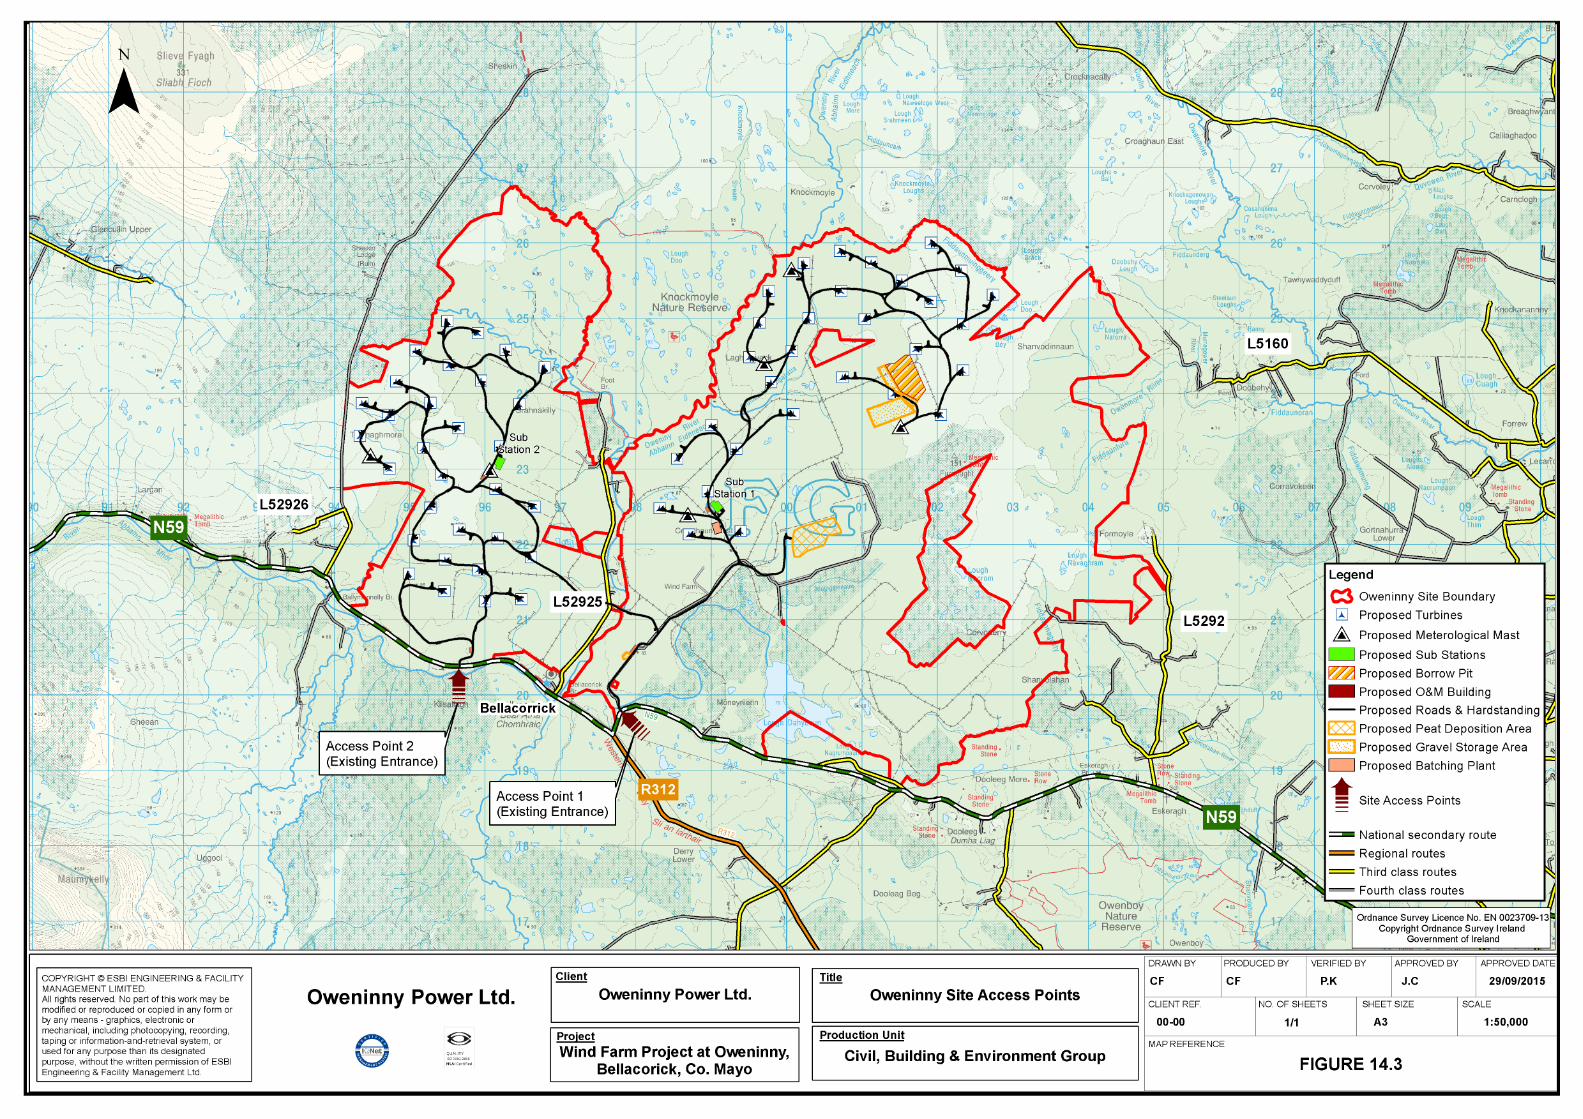
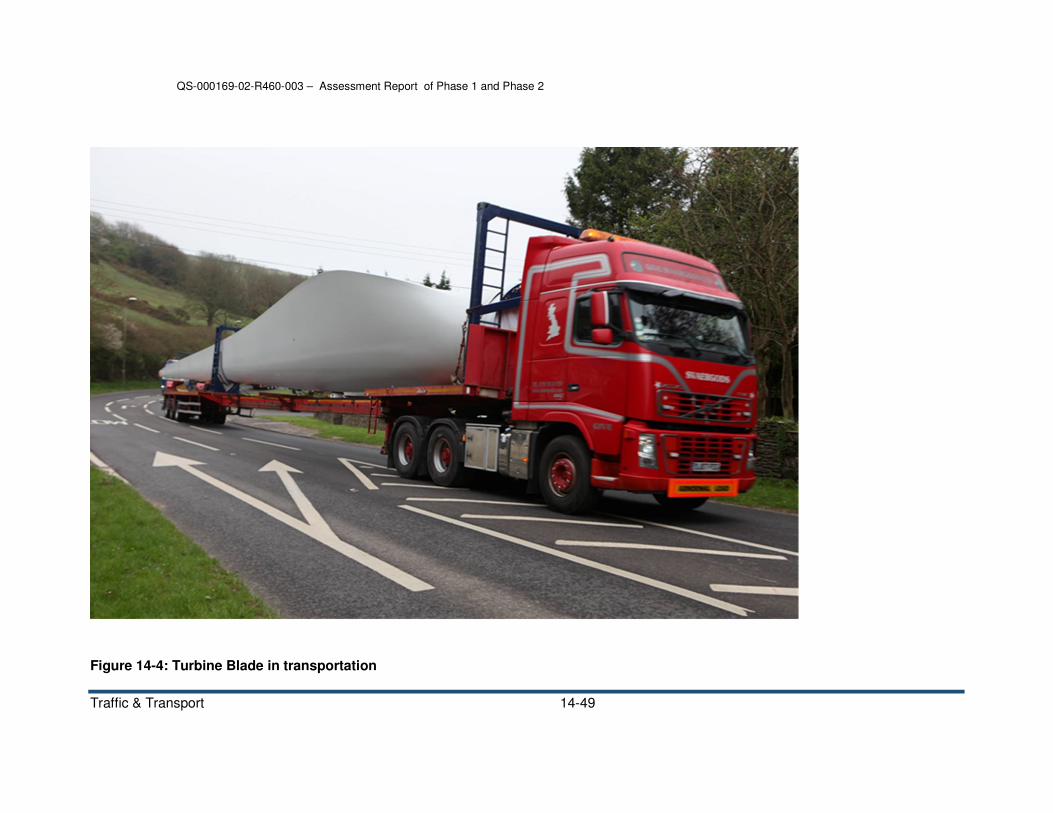
QS-000169-02-R460-003 – Assessment Report of Phase 1 and Phase 2
Traffic & Transport 14-49
Figure 14-4: Turbine Blade in transportation