Embed Size (px)
Citation preview

CHAPTER 14CHAPTER 14
InvestmentsInvestments
Bond Prices and Bond Prices and YieldsYields
Slides bySlides by
Richard D. JohnsonRichard D. Johnson
Copyright © 2008 by The McGraw-Hill Companies, Inc. All rights reservedCopyright © 2008 by The McGraw-Hill Companies, Inc. All rights reserved McGraw-Hill/IrwinMcGraw-Hill/Irwin
Cover image

14- 14- 22
CoverCoverimageimage
Face or par valueCoupon rate
– Zero coupon bond
Compounding and payments– Accrued Interest
Indenture
Bond Characteristics

14- 14- 33
CoverCoverimageimage
Different Issuers of Bonds
U.S. Treasury
– Notes and Bonds Corporations Municipalities International Governments and Corporations Innovative Bonds
– Floaters and Inverse Floaters
– Asset-Backed
– Catastrophe

14- 14- 44
CoverCoverimageimage
Figure 14.1 Listing of Treasury Issues

14- 14- 55
CoverCoverimageimage
Figure 14.2 Corporate Bond Listings

14- 14- 66
CoverCoverimageimage
Secured or unsecuredCall provisionConvertible provisionPut provision (putable bonds)Floating rate bondsSinking funds
Provisions of Bonds

14- 14- 77
CoverCoverimageimage
Table 14.1 Principal and Interest Payments for Treasury Inflation Protected Security

14- 14- 88
CoverCoverimageimage
)1()1(1 rParValue
rCP T
T
T
tt
tB
PB = Price of the bond
Ct = interest or coupon payments
T = number of periods to maturity
y = semi-annual discount rate or the semi-annual yield to maturity
Bond Pricing
14- 14- 99
CoverCoverimageimage
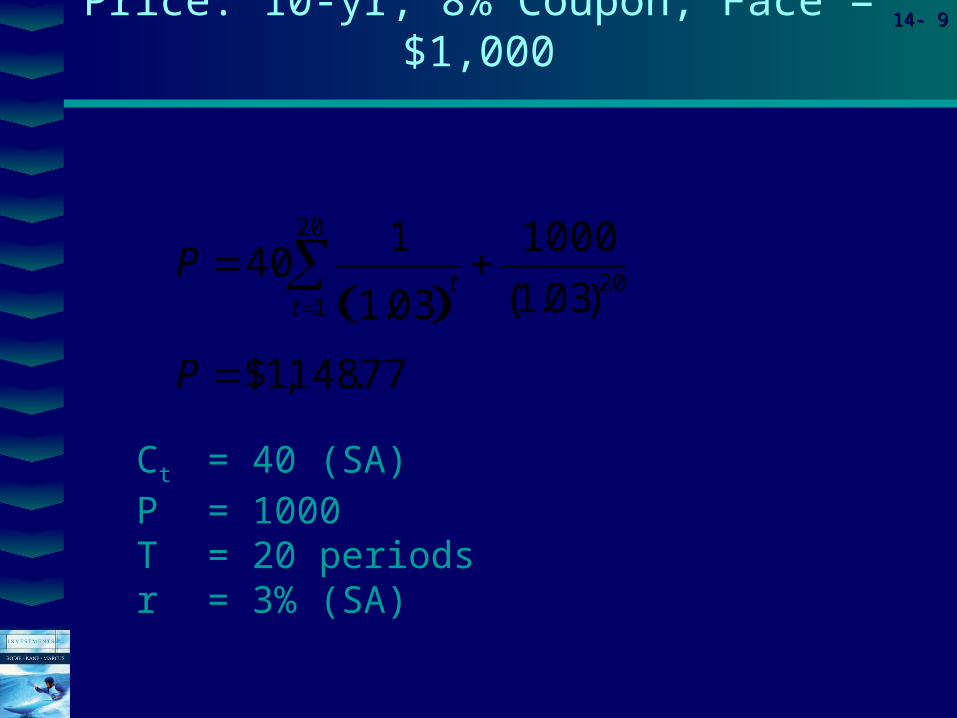
Ct = 40 (SA)P = 1000T = 20 periodsr = 3% (SA)
Price: 10-yr, 8% Coupon, Face = $1,000
77.148,1$
)03.1(
1000
03.1
140
20
20
1
P
Pt
t

14- 14- 1010
CoverCoverimageimage
Prices and Yields (required rates of return) have an inverse relationship
When yields get very high the value of the bond will be very low.
When yields approach zero, the value of the bond approaches the sum of the cash flows.
Bond Prices and Yields

14- 14- 1111
CoverCoverimageimage
Figure 14.3 The Inverse Relationship Between Bond Prices and Yields

14- 14- 1212
CoverCoverimageimage
Table 14.2 Bond Prices at Different Interest Rates (8% Coupon Bond, Coupons Paid Semiannually

14- 14- 1313
CoverCoverimageimage
Yield to Maturity
Interest rate that makes the present value of the bond’s payments equal to its price.
Solve the bond formula for r
)1()1(1 rParValue
rCP T
T
T
tt
tB

14- 14- 1414
CoverCoverimageimage
Yield to Maturity Example
)1(1000
)1(35950
20
1 rrT
tt
10 yr Maturity Coupon Rate = 7%
Price = $950
Solve for r = semiannual rate r = 3.8635%

14- 14- 1515
CoverCoverimageimage
Yield Measures
Bond Equivalent Yield
7.72% = 3.86% x 2
Effective Annual Yield
(1.0386)2 - 1 = 7.88%
Current Yield
Annual Interest / Market Price
$70 / $950 = 7.37 %
Yield to Call

14- 14- 1616
CoverCoverimageimage
Figure 14.4 Bond Prices: Callable and Straight Debt

14- 14- 1717
CoverCoverimageimage
Example 14.4 Yield to Call

14- 14- 1818
CoverCoverimageimage
Realized Yield versus YTM
Reinvestment AssumptionsHolding Period Return
– Changes in rates affects returns
– Reinvestment of coupon payments
– Change in price of the bond

14- 14- 1919
CoverCoverimageimage
Figure 14.5 Growth of Invested Funds

14- 14- 2020
CoverCoverimageimage
Figure 14.6 Prices over Time of 30-Year Maturity, 6.5% Coupon Bonds

14- 14- 2121
CoverCoverimageimage
Holding-Period Return: Single Period
HPR = [ I + ( P0 - P1 )] / P0
where
I = interest payment
P1 = price in one period
P0 = purchase price

14- 14- 2222
CoverCoverimageimage
Holding-Period Example
CR = 8% YTM = 8% N=10 years
Semiannual Compounding P0 = $1000
In six months the rate falls to 7%
P1 = $1068.55
HPR = [40 + ( 1068.55 - 1000)] / 1000
HPR = 10.85% (semiannual)

14- 14- 2323
CoverCoverimageimage
Figure 14.7 The Price of a 30-Year Zero-Coupon Bond over Time at a Yield to Maturity of 10%
14- 14- 2424
CoverCoverimageimage
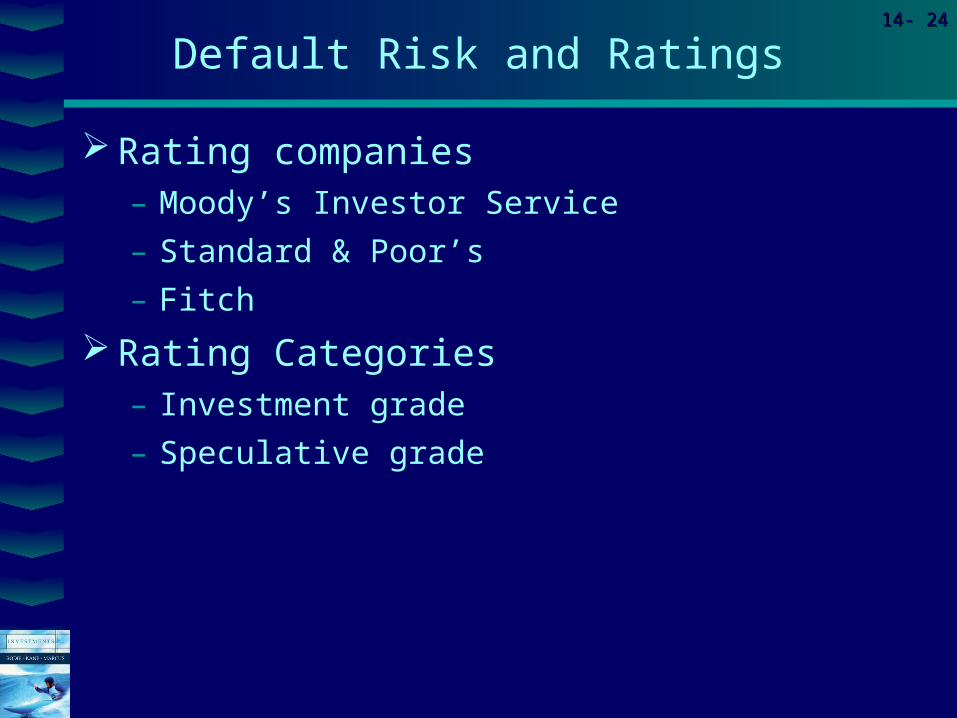
Rating companies– Moody’s Investor Service
– Standard & Poor’s
– Fitch
Rating Categories– Investment grade
– Speculative grade
Default Risk and Ratings

14- 14- 2525
CoverCoverimageimage
Figure 14.8 Definitions of Each Bond Rating Class

14- 14- 2626
CoverCoverimageimage
Coverage ratiosLeverage ratiosLiquidity ratiosProfitability ratiosCash flow to debt
Factors Used by Rating Companies

14- 14- 2727
CoverCoverimageimage
Table 14.3 Financial Ratios and Default Risk by Rating Class, Long-Term Debt

14- 14- 2828
CoverCoverimageimage
Figure 14.9 Discriminant Analysis

14- 14- 2929
CoverCoverimageimage
Sinking fundsSubordination of future debtDividend restrictionsCollateral
Protection Against Default

14- 14- 3030
CoverCoverimageimage
Figure 14.10 Callable Bond Issue by Mobil

14- 14- 3131
CoverCoverimageimage
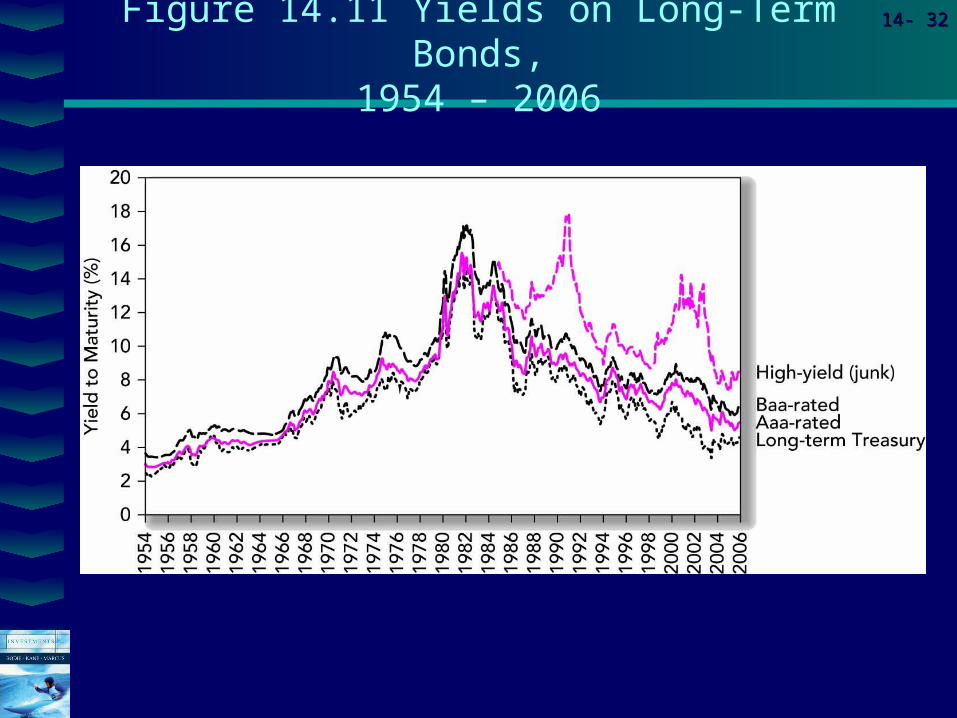
Default Risk and Yield
Risk structure of interest ratesDefault premiums
– Yields compared to ratings
– Yield spreads over business cycles
14- 14- 3232
CoverCoverimageimage
Figure 14.11 Yields on Long-Term Bonds,1954 – 2006