Embed Size (px)
Citation preview

Predicting the MarketsChapter 14 Charts:
Predicting ValuationYardeni Research, Inc.
September 25, 2017
Dr. Edward Yardeni516-972-7683
Mali Quintana480-664-1333
Please visit our sites atwww.yardeni.comblog.yardeni.com
thinking outside the box

Table Of Contents Table Of ContentsTable Of Contents
September 25, 2017 / Chapter 14 Charts: Predicting Valuation www.yardeni.com
Yardeni Research, Inc.
Predicting Valuation 1-19

79 80 81 82 83 84 85 86 87 88 89 90 91 92 93 94 95 96 97 98 99 00 01 02 03 04 05 06 07 08 09 10 11 12 13 14 15 16 17 18 19 205
15
25
35
45
55
5
15
25
35
45
55
Sep
FORWARD P/E RATIOS FOR S&P 500 STOCK PRICE INDEX*
Forward P/EsS&P 500S&P 500 Technology
* S&P 500 stock price index divided by S&P 500 12-month forward consensus expected operating earnings.Source: Thomson Reuters I/B/E/S.
yardeni.com
Figure 1.
79 80 81 82 83 84 85 86 87 88 89 90 91 92 93 94 95 96 97 98 99 00 01 02 03 04 05 06 07 08 09 10 11 12 13 14 15 16 17 18 19 201
2
3
4
5
6
7
8
9
10
11
12
13
14
15
16
17
18
1
2
3
4
5
6
7
8
9
10
11
12
13
14
15
16
17
18
Aug
Aug
S&P 500 FORWARD EARNINGS YIELD & NOMINAL US TREASURY 10-YEAR BOND YIELD
US Treasury 10-Year Bond YieldS&P 500 Forward Earnings Yield*
* S&P 500 12-month forward consensus expected operating earnings divided by S&P 500 stock price index.Source: Thomson Reuters I/B/E/S and Federal Reserve Board.
yardeni.com
Figure 2.
Predicting Valuation
Page 1 / September 25, 2017 / Chapter 14 Charts: Predicting Valuation www.yardeni.com
Yardeni Research, Inc.

79 80 81 82 83 84 85 86 87 88 89 90 91 92 93 94 95 96 97 98 99 00 01 02 03 04 05 06 07 08 09 10 11 12 13 14 15 16 17 18 19 2075
1125
2175
3225
4275
53256375742584759525
75
1125
2175
3225
4275
53256375742584759525
Aug
Aug
STOCK VALUATION MODEL (using US Treasury 10-year bond yield)(ratio scale)
S&P 500 Fair-Value Price*S&P 500 Stock Price Index
* S&P 500 12-month forward consensus expected operating earnings divided by US Treasury 10-year bond yield.Source: Thomson Reuters I/B/E/S and Federal Reserve Board.
yardeni.com
Figure 3.
79 80 81 82 83 84 85 86 87 88 89 90 91 92 93 94 95 96 97 98 99 00 01 02 03 04 05 06 07 08 09 10 11 12 13 14 15 16 17 18 19 20-100
-50
0
50
100
-100
-50
0
50
100
Aug
STOCK VALUATION MODEL (using US Treasury 10-year bond yield)*(percent overvalued or undervalued)
* S&P 500 stock price index divided by S&P 500 fair-value price defined as S&P 500 12-month forward consensus expected operating earningsdivided by 10-year US Treasury bond yield converted to percentage.Source: Thomson Reuters I/B/E/S and Federal Reserve Board.
yardeni.com
Figure 4.
Predicting Valuation
Page 2 / September 25, 2017 / Chapter 14 Charts: Predicting Valuation www.yardeni.com
Yardeni Research, Inc.
85 86 87 88 89 90 91 92 93 94 95 96 97 98 99 00 01 02 03 04 05 06 07 08 09 10 11 12 13 14 15 16 17 18 19 208
10
12
14
16
18
20
8
10
12
14
16
18
20
Sep
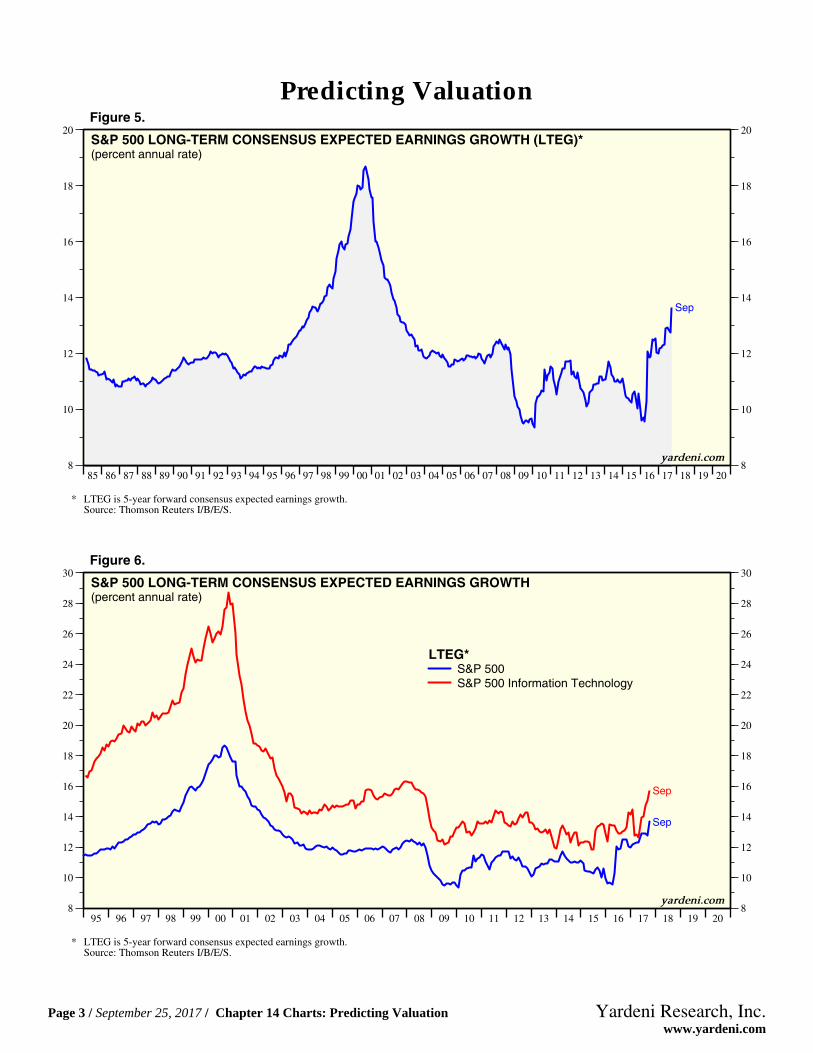
S&P 500 LONG-TERM CONSENSUS EXPECTED EARNINGS GROWTH (LTEG)*(percent annual rate)
* LTEG is 5-year forward consensus expected earnings growth.Source: Thomson Reuters I/B/E/S.
yardeni.com
Figure 5.
95 96 97 98 99 00 01 02 03 04 05 06 07 08 09 10 11 12 13 14 15 16 17 18 19 208
10
12
14
16
18
20
22
24
26
28
30
8
10
12
14
16
18
20
22
24
26
28
30
Sep
Sep
S&P 500 LONG-TERM CONSENSUS EXPECTED EARNINGS GROWTH(percent annual rate)
LTEG*S&P 500S&P 500 Information Technology
* LTEG is 5-year forward consensus expected earnings growth.Source: Thomson Reuters I/B/E/S.
yardeni.com
Figure 6.
Predicting Valuation
Page 3 / September 25, 2017 / Chapter 14 Charts: Predicting Valuation www.yardeni.com
Yardeni Research, Inc.

79 80 81 82 83 84 85 86 87 88 89 90 91 92 93 94 95 96 97 98 99 00 01 02 03 04 05 06 07 08 09 10 11 12 13 14 15 16 17 18 19 200
5
10
15
20
0
5
10
15
20
Aug
CORPORATE BOND YIELDS (percent)
Corporate Bond Yields*
Average Corporate Yield
AA-AAA Corporate Bond YieldBBB-A Corporate Bond Yield
yardeni.com
* Moody’s data for Aaa and Baa yields through 1996, then BoA Merrill Lynch data for AA-AAA and BBB-A yields.Source: Federal Reserve Board and Haver Analytics.
Figure 7.
54 56 58 60 62 64 66 68 70 72 74 76 78 80 82 84 86 88 90 92 94 96 98 00 02 04 06 08 10 12 14 16 18 200
100
200
300
400
500
600
0
100
200
300
400
500
600
YIELD SPREAD: CORPORATE* & US TREASURY 10-YEAR BOND(basis points)
Aug
* Corporate bond yield is average of Moody’s Aaa and Baa yields through 1996, then average of BoA Merrill Lynch data for AA-AAA and BBB-A yields.Note: Shaded areas denote recessions according to the National Bureau of Economic Research.Source: Federal Reserve Board and Haver Analytics.
yardeni.com
Figure 8.
Predicting Valuation
Page 4 / September 25, 2017 / Chapter 14 Charts: Predicting Valuation www.yardeni.com
Yardeni Research, Inc.

79 80 81 82 83 84 85 86 87 88 89 90 91 92 93 94 95 96 97 98 99 00 01 02 03 04 05 06 07 08 09 10 11 12 13 14 15 16 17 18 19 200
5
10
15
20
0
5
10
15
20
Aug
Aug
S&P 500 FORWARD EARNINGS YIELD & CORPORATE BOND YIELD
Corporate Bond Yield**S&P 500 Forward Earnings Yield*
* S&P 500 12-month forward consensus expected operating earnings divided by S&P 500 stock price index.** Corporate bond yield is average of Moody’s Aaa and Baa yields through 1996, then average of BoA Merrill Lynch data for AA-AAA and BBB-A yields.
Source: Federal Reserve Board and Haver Analytics.
yardeni.com
Figure 9.
79 80 81 82 83 84 85 86 87 88 89 90 91 92 93 94 95 96 97 98 99 00 01 02 03 04 05 06 07 08 09 10 11 12 13 14 15 16 17 18 19 200
5
10
15
20
0
5
10
15
20
Aug
x0.0
x0.1
x0.2
S&P 500 FORWARD EARNINGS YIELD & CORPORATE BOND YIELD
Corporate Bond Yield Less LTEGWeighted by 0.0, 0.1, and 0.2**
S&P 500 Forward Earnings Yield*
* S&P 500 12-month forward consensus expected operating earnings divided by S&P 500 stock price index.** Corporate bond yield (average of Moody’s Aaa and Baa yields through 1996, then average of BoA Merrill Lynch data for AA-AAA and BBB-A yields)
less analysts’ consensus of S&P 500 long-term earnings growth.Source: Thomson Reuters I/B/E/S, Federal Reserve Board, and Haver Analytics.
yardeni.com
Figure 10.
Predicting Valuation
Page 5 / September 25, 2017 / Chapter 14 Charts: Predicting Valuation www.yardeni.com
Yardeni Research, Inc.

79 80 81 82 83 84 85 86 87 88 89 90 91 92 93 94 95 96 97 98 99 00 01 02 03 04 05 06 07 08 09 10 11 12 13 14 15 16 17 18 19 2075
1125
2175
3225
4275
5325
75
1125
2175
3225
4275
5325
Aug
Aug
STOCK VALUATION MODEL (using corporate bond yield)(ratio scale)
S&P 500 Stock Price IndexS&P 500 Fair-Value Price*
* S&P 500 forward consensus expected operating earnings divided by corporate bond yield (average of Moody’s Aaa and Baa yields through 1996,then average of BoA Merrill Lynch data for AA-AAA and BBB-A yields).Source: Thomson Reuters I/B/E/S, Federal Reserve Board, and Haver Analytics.
yardeni.com
Figure 11.
79 80 81 82 83 84 85 86 87 88 89 90 91 92 93 94 95 96 97 98 99 00 01 02 03 04 05 06 07 08 09 10 11 12 13 14 15 16 17 18 19 20-100
-50
0
50
100
-100
-50
0
50
100
Aug
Aug
FED’S STOCK VALUATION MODEL(percent overvalued or undervalued)
Percentage S&P 500 Over/UnderValued Relative to Fair Value
Using Treasury Bond Yield*Using Corporate Bond Yield**
* S&P 500 12-month forward consensus expected operating earnings divided by 10-year US Treasury bond yield converted to percentage.** S&P 500 12-month forward consensus expected operating earnings divided by corporate bond yield (using average of Moody’s Aaa and Baa yields
through 1996, then average of BoA Merrill Lynch data for AA-AAA and BBB-A yields) converted to percentage.Source: Thomson Reuters I/B/E/S, Federal Reserve Board, and Haver Analytics.
yardeni.com
Figure 12.
Predicting Valuation
Page 6 / September 25, 2017 / Chapter 14 Charts: Predicting Valuation www.yardeni.com
Yardeni Research, Inc.

1999 2000 2001 2002 2003 2004 2005 2006 2007 2008 2009 2010 2011 2012 2013 2014 2015 2016 2017 20183
4
5
6
7
8
9
10
11
3
4
5
6
7
8
9
10
11
Aug
Aug
S&P 500 FORWARD EARNINGS YIELD & CORPORATE BOND YIELD(percent)
Corporate Bond Yield*S&P 500 Forward Earnings Yield**
* Corporate bond yield is average of Moody’s Aaa and Baa yields through 1996, then average of BoA Merrill Lynch data for AA-AAA and BBB-A yields.** S&P 500 12-month forward consensus expected operating earnings divided by S&P 500 stock price index.
Source: Thomson Reuters I/B/E/S, Standard & Poor’s, Federal Reserve Board, and Haver Analytics.
yardeni.com
Figure 13.
1999 2000 2001 2002 2003 2004 2005 2006 2007 2008 2009 2010 2011 2012 2013 2014 2015 2016 2017 20180
100
200
300
400
500
600
700
800
0
100
200
300
400
500
600
700
800
Q2
S&P 500 BUYBACKS(billion dollars, annualized)
Source: Standard & Poor’s.
yard
eni.
com
Figure 14.
Predicting Valuation
Page 7 / September 25, 2017 / Chapter 14 Charts: Predicting Valuation www.yardeni.com
Yardeni Research, Inc.

79 80 81 82 83 84 85 86 87 88 89 90 91 92 93 94 95 96 97 98 99 00 01 02 03 04 05 06 07 08 09 10 11 12 13 14 15 16 17 18 19 20-2
0
2
4
6
8
10
12
14
16
18
-2
0
2
4
6
8
10
12
14
16
18
Aug9/22
Aug
S&P 500 EARNINGS YIELD & REAL BOND YIELD
Real US Treasury 10-Year Yield*S&P 500 Forward Earnings Yield**10-Year TIPS Yield(weekly)
* US Treasury 10-year bond yield minus median expected CPI inflation rate for next 10 Years using Philadelphia Fed Survey of Professional Forecastersdata (monthly series interpolated from quarterly data starting as two quarters per year during Q4-1979 until Q4-1991 when the data continuewith four quarters a year).
** S&P 500 12-month forward consensus operating earnings divided by S&P 500 stock price index.Source: Federal Reserve Board, US Treasury, Thomson Reuters I/B/E/S, and Federal Reserve Bank of Philadelphia.
yardeni.com
Figure 15.
79 80 81 82 83 84 85 86 87 88 89 90 91 92 93 94 95 96 97 98 99 00 01 02 03 04 05 06 07 08 09 10 11 12 13 14 15 16 17 18 19 200
5
10
15
0
5
10
15
AugAverage = 5.0
S&P 500 EARNINGS RISK PREMIUM*(percent)
* S&P 500 forward earnings yield minus the real interest rate defined as the nominal 10-year Treasury yield minus median expected CPI inflation ratefor next 10 Years using Philadelphia Fed Survey of Professional Forecasters data (monthly series interpolated from quarterly data starting astwo quarters per year during Q4-1979 until Q4-1991 when the data continue with four quarters a year).Source: Federal Reserve Board, US Treasury, Thomson Reuters I/B/E/S, and Federal Reserve Bank of Philadelphia.
yardeni.com
Figure 16.
Predicting Valuation
Page 8 / September 25, 2017 / Chapter 14 Charts: Predicting Valuation www.yardeni.com
Yardeni Research, Inc.

79 80 81 82 83 84 85 86 87 88 89 90 91 92 93 94 95 96 97 98 99 00 01 02 03 04 05 06 07 08 09 10 11 12 13 14 15 16 17 18 19 200
5
10
15
0
5
10
15
Aug
EXPECTED INFLATION: SURVEY OF PROFESSIONAL FORECASTERS
CPI: Ex Food & Energy(yearly percent change)Professional Forecasters*
* Median forecast of year-over-year CPI inflation rate over the next 10 years using Philadelphia Fed Survey of Professional Forecasters data (monthly seriesinterpolated from quarterly data starting as two quarters per year during Q4-1979 until Q4-1991 when the data continue with four quarters per year).Source: Bureau of Labor Statistics and Federal Reserve Bank of Philadelphia.
yardeni.com
Figure 17.
2003 2004 2005 2006 2007 2008 2009 2010 2011 2012 2013 2014 2015 2016 2017 2018.0
.5
1.0
1.5
2.0
2.5
3.0
.0
.5
1.0
1.5
2.0
2.5
3.0
9/22
MEASURES OF EXPECTED INFLATION(percent)
Sep
Expected Inflation
10-Year TIPS**Professional Forecasters*
Source: Federal Reserve Board and Federal Reserve Bank of Philadelphia.** Nominal US Treasury 10-year minus 10-year TIPS yields.
* Median forecast of year-over-year CPI inflation rate over the next 10 years using Philadelphia Fed Survey of Professional Forecasters data (monthly seriesinterpolated from quarterly data starting as two quarters per year during Q4-1979 until Q4-1991 when the data continue with four quarters per year).
yardeni.com
Figure 18.
Predicting Valuation
Page 9 / September 25, 2017 / Chapter 14 Charts: Predicting Valuation www.yardeni.com
Yardeni Research, Inc.
35 37 39 41 43 45 47 49 51 53 55 57 59 61 63 65 67 69 71 73 75 77 79 81 83 85 87 89 91 93 95 97 99 01 03 05 07 09 11 13 15 17 19 215
10
15
20
25
30
35
5
10
15
20
25
30
35
Q2
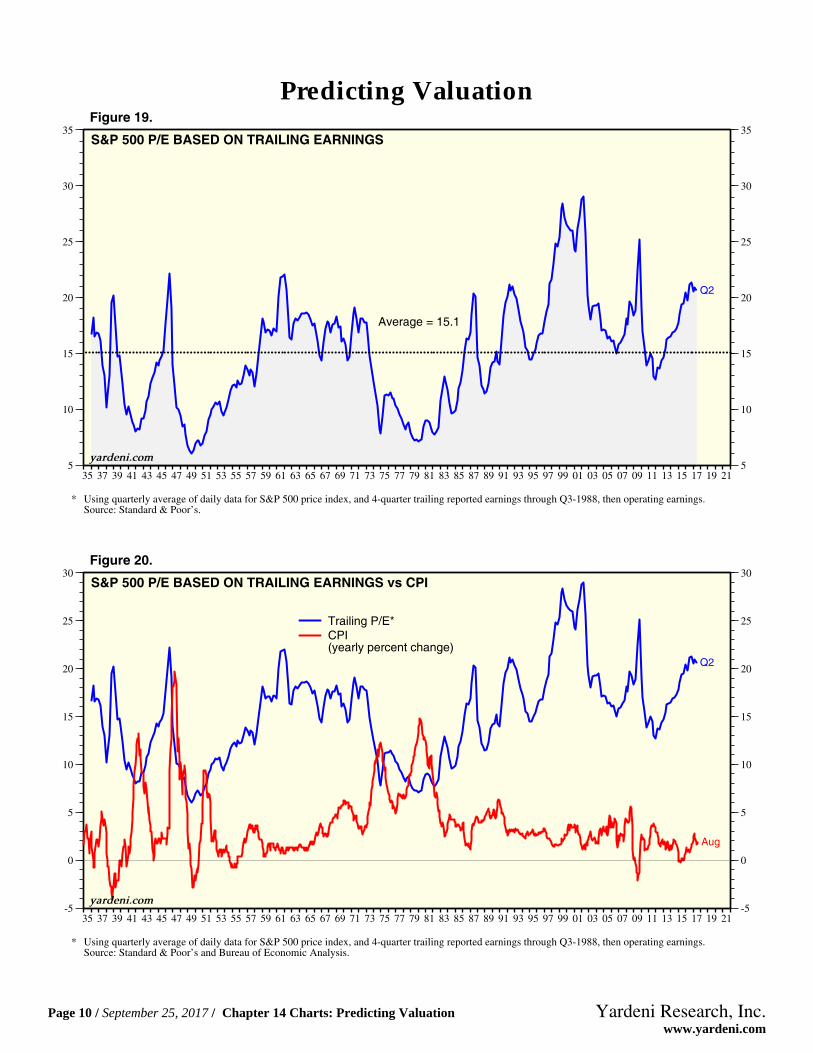
S&P 500 P/E BASED ON TRAILING EARNINGS
Average = 15.1
* Using quarterly average of daily data for S&P 500 price index, and 4-quarter trailing reported earnings through Q3-1988, then operating earnings.Source: Standard & Poor’s.
yardeni.com
Figure 19.
35 37 39 41 43 45 47 49 51 53 55 57 59 61 63 65 67 69 71 73 75 77 79 81 83 85 87 89 91 93 95 97 99 01 03 05 07 09 11 13 15 17 19 21-5
0
5
10
15
20
25
30
-5
0
5
10
15
20
25
30
Q2
Aug
S&P 500 P/E BASED ON TRAILING EARNINGS vs CPI
Trailing P/E*CPI(yearly percent change)
* Using quarterly average of daily data for S&P 500 price index, and 4-quarter trailing reported earnings through Q3-1988, then operating earnings.Source: Standard & Poor’s and Bureau of Economic Analysis.
yardeni.com
Figure 20.
Predicting Valuation
Page 10 / September 25, 2017 / Chapter 14 Charts: Predicting Valuation www.yardeni.com
Yardeni Research, Inc.

53 55 57 59 61 63 65 67 69 71 73 75 77 79 81 83 85 87 89 91 93 95 97 99 01 03 05 07 09 11 13 15 17 19 21 230
5
10
15
20
25
30
35
0
5
10
15
20
25
30
35
Q2
Aug
S&P 500 P/E BASED ON TRAILING EARNINGS vs US TREASURY 10-YEAR BOND YIELD
Trailing P/E*10-Year Bond Yield(percent)
* Using quarterly average of daily data for S&P 500 price index, and 4-quarter trailing reported earnings through Q3-1988, then operating earnings.Source: Standard & Poor’s and Federal Reserve Board.
yardeni.com
Figure 21.
53 55 57 59 61 63 65 67 69 71 73 75 77 79 81 83 85 87 89 91 93 95 97 99 01 03 05 07 09 11 13 15 17 19 21 230
2
4
6
8
10
12
14
16
18
0
2
4
6
8
10
12
14
16
18
Q2
Aug
S&P 500 EARNINGS YIELD vs US TREASURY 10-YEAR BOND YIELD(percent)
S&P 500 Earnings Yield*10-Year Bond Yield
* Using quarterly average of daily data for S&P 500 price index, and 4-quarter trailing reported earnings through Q3-1988, then operating earnings.Source: Standard & Poor’s and Federal Reserve Board.
yardeni.com
Figure 22.
Predicting Valuation
Page 11 / September 25, 2017 / Chapter 14 Charts: Predicting Valuation www.yardeni.com
Yardeni Research, Inc.
89 90 91 92 93 94 95 96 97 98 99 00 01 02 03 04 05 06 07 08 09 10 11 12 13 14 15 16 17 18 19 208
12
16
20
24
28
32
8
12
16
20
24
28
32
Q2
Sep
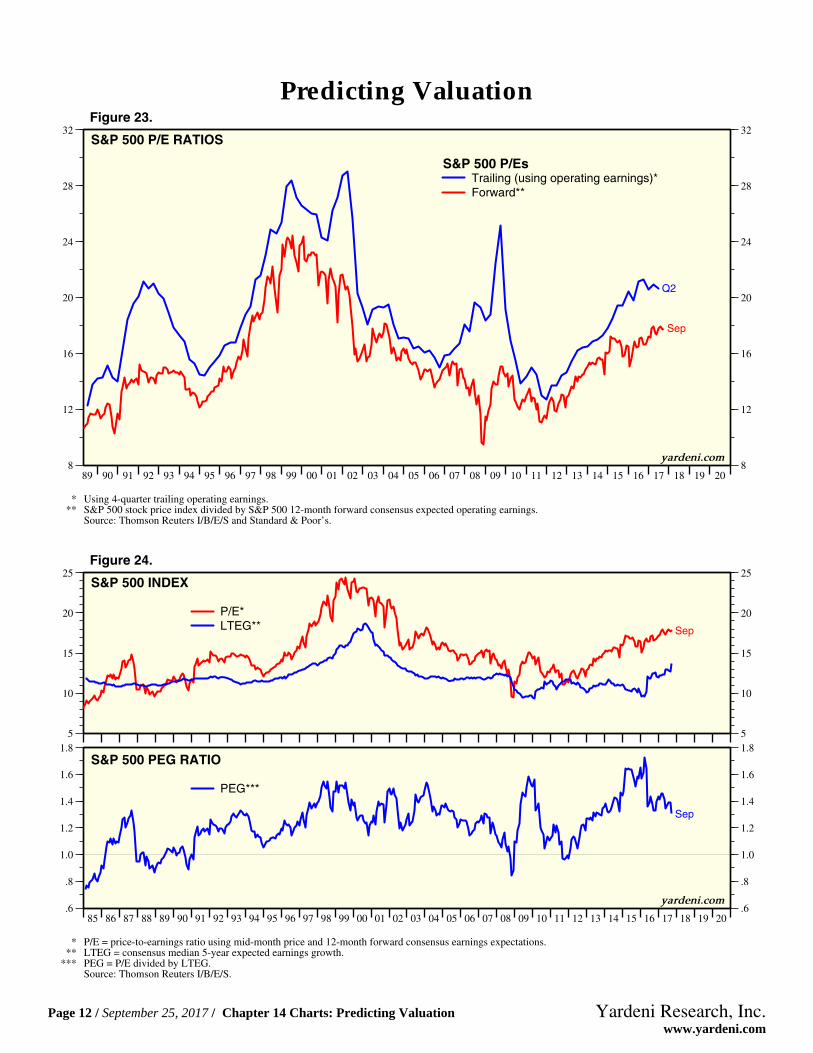
S&P 500 P/E RATIOS
S&P 500 P/EsTrailing (using operating earnings)*Forward**
* Using 4-quarter trailing operating earnings.** S&P 500 stock price index divided by S&P 500 12-month forward consensus expected operating earnings.
Source: Thomson Reuters I/B/E/S and Standard & Poor’s.
yardeni.com
Figure 23.
5
10
15
20
25
5
10
15
20
25
Sep
85 86 87 88 89 90 91 92 93 94 95 96 97 98 99 00 01 02 03 04 05 06 07 08 09 10 11 12 13 14 15 16 17 18 19 20.6
.8
1.0
1.2
1.4
1.6
1.8
.6
.8
1.0
1.2
1.4
1.6
1.8
Sep
S&P 500 INDEX
S&P 500 PEG RATIO
P/E*LTEG**
PEG***
* P/E = price-to-earnings ratio using mid-month price and 12-month forward consensus earnings expectations.** LTEG = consensus median 5-year expected earnings growth.
*** PEG = P/E divided by LTEG.Source: Thomson Reuters I/B/E/S.
yardeni.com
Figure 24.
Predicting Valuation
Page 12 / September 25, 2017 / Chapter 14 Charts: Predicting Valuation www.yardeni.com
Yardeni Research, Inc.
2006 2007 2008 2009 2010 2011 2012 2013 2014 2015 2016 2017 2018.7
.8
.9
1.0
1.1
1.2
1.3
1.4
1.5
1.6
1.7
1.8
1.9
2.0
7
8
9
10
11
12
13
14
15
16
17
18
19
20
9/14
9/14
yardeni.com
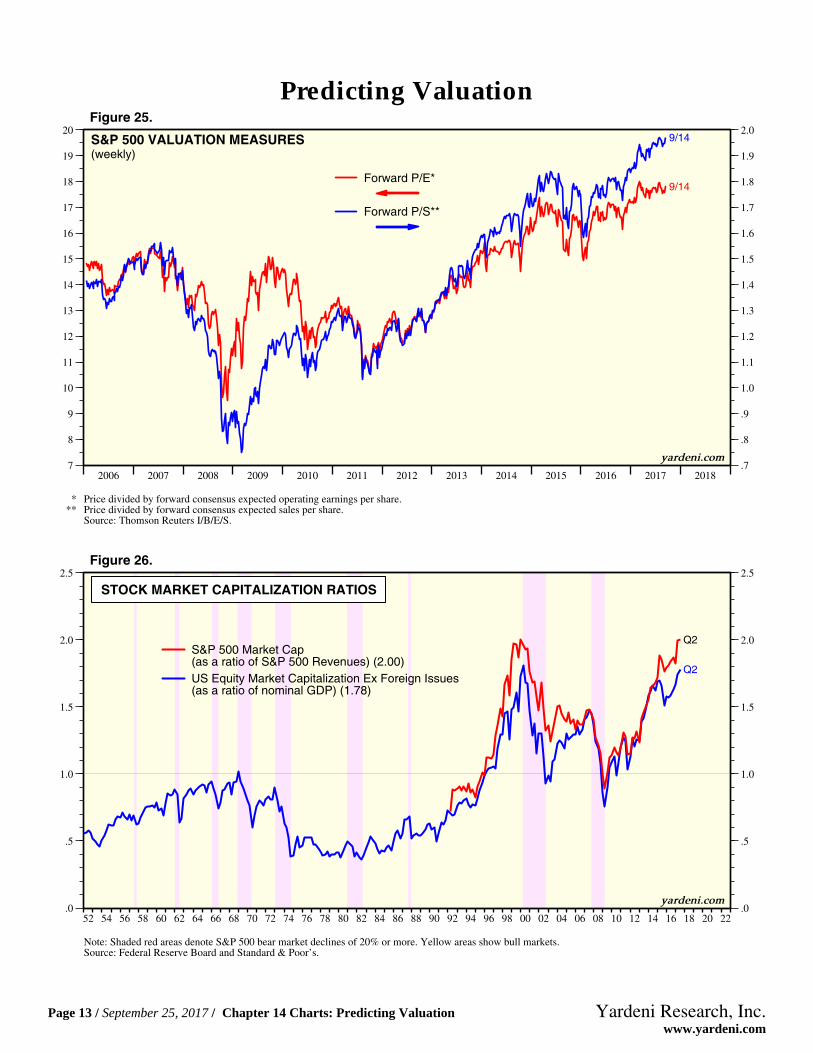
* Price divided by forward consensus expected operating earnings per share.** Price divided by forward consensus expected sales per share.
Source: Thomson Reuters I/B/E/S.
S&P 500 VALUATION MEASURES(weekly)
Forward P/E*
Forward P/S**
Figure 25.
52 54 56 58 60 62 64 66 68 70 72 74 76 78 80 82 84 86 88 90 92 94 96 98 00 02 04 06 08 10 12 14 16 18 20 22.0
.5
1.0
1.5
2.0
2.5
.0
.5
1.0
1.5
2.0
2.5
Q2
STOCK MARKET CAPITALIZATION RATIOS
Q2S&P 500 Market Cap(as a ratio of S&P 500 Revenues) (2.00)US Equity Market Capitalization Ex Foreign Issues(as a ratio of nominal GDP) (1.78)
Note: Shaded red areas denote S&P 500 bear market declines of 20% or more. Yellow areas show bull markets.Source: Federal Reserve Board and Standard & Poor’s.
yardeni.com
Figure 26.
Predicting Valuation
Page 13 / September 25, 2017 / Chapter 14 Charts: Predicting Valuation www.yardeni.com
Yardeni Research, Inc.

93 94 95 96 97 98 99 00 01 02 03 04 05 06 07 08 09 10 11 12 13 14 15 16 17 18 19 20.7
.8
.9
1.0
1.1
1.2
1.3
1.4
1.5
1.6
1.7
1.8
1.9
2.0
2.1
.7
.8
.9
1.0
1.1
1.2
1.3
1.4
1.5
1.6
1.7
1.8
1.9
2.0
2.1
Q2Sep
yardeni.com
* S&P 500 index divided by 52-week forward consensus expected revenues per share for S&P 500.Source: Thomson Reuters I/B/E/S and Federal Reserve Board.
S&P 500 PRICE-TO-SALES RATIO
S&P 500 Market Cap(as a ratio of S&P 500 RevenuesForward P/S*
Figure 27.
52 54 56 58 60 62 64 66 68 70 72 74 76 78 80 82 84 86 88 90 92 94 96 98 00 02 04 06 08 10 12 14 16 18 20 22.0
.5
1.0
1.5
2.0
2.5
.0
.5
1.0
1.5
2.0
2.5
TOBIN’S Q FOR NONFINANCIAL CORPORATIONS*(ratio)
Q2
Q2Actual QAdjusted Q**
* Ratio of the market value of equities to the net worth of the corporations including real estate and structures at market value and equipment,intellectual property products, and inventories at replacement cost.
Source: Federal Reserve Board Financial Accounts of the United States.
** Actual divided by average since 1952.Note: Shaded red areas denote S&P 500 bear market declines of 20% or more. Yellow areas show bull markets.
yardeni.com
Figure 28.
Predicting Valuation
Page 14 / September 25, 2017 / Chapter 14 Charts: Predicting Valuation www.yardeni.com
Yardeni Research, Inc.

79 80 81 82 83 84 85 86 87 88 89 90 91 92 93 94 95 96 97 98 99 00 01 02 03 04 05 06 07 08 09 10 11 12 13 14 15 16 17 18 19 205
10
15
20
25
30
5
10
15
20
25
30
Aug
S&P 500 FORWARD P/E & RULE OF 20 P/E BASED ON CPI INFLATION RATE(monthly)
S&P 500 Forward P/E*20 minus CPI Inflation Rate(yearly percent change)
* P/E = price-to-earnings ratio using mid-month price and 12-month forward consensus earnings expectations.Source: Thomson Reuters I/B/E/S and Bureau of Labor Statistics.
yardeni.com
Figure 29.
78 80 82 84 86 88 90 92 94 96 98 00 02 04 06 08 10 12 14 16 18 205
7
9
11
13
15
17
19
21
23
25
27
5
7
9
11
13
15
17
19
21
23
25
27
Jul
Aug
FORWARD PE RATIO FOR S&P 500 vs MISERY INDEX
Misery Index*S&P 500 Forward P/E**
* Yearly percent change in core personal consumption expenditures deflator plus unemployment rate.
Source: Bureau of Economic Analysis, Bureau of Labor Statistics, and Thomson Reuters I/B/E/S.** Price divided by 12-month forward consensus expected operating earnings per share.
yardeni.com
Figure 30.
Predicting Valuation
Page 15 / September 25, 2017 / Chapter 14 Charts: Predicting Valuation www.yardeni.com
Yardeni Research, Inc.

48 50 52 54 56 58 60 62 64 66 68 70 72 74 76 78 80 82 84 86 88 90 92 94 96 98 00 02 04 06 08 10 12 14 16 18 20 222
4
6
8
10
12
14
16
18
20
22
24
26
2
4
6
8
10
12
14
16
18
20
22
24
26
MISERY INDEX* & STOCK MARKET CYCLE(percent)
Aug
* Unemployment rate plus yearly percent change in consumer price index.Note: Shaded red areas denote S&P 500 bear market declines of 20% or more. Yellow areas show bull markets.Source: Bureau of Economic Analysis and Bureau of Labor Statistics.
yardeni.com
Figure 31.
78 80 82 84 86 88 90 92 94 96 98 00 02 04 06 08 10 12 14 16 18 2015
20
25
30
35
15
20
25
30
35
S&P 500 FORWARD P/E* PLUS MISERY INDEX**
Aug
Average = 23.9
** Unemployment rate plus yearly percent change in consumer price index.
Source: Bureau of Economic Analysis, Bureau of Labor Statistics, and Thomson Reuters I/B/E/S.
* Average monthly S&P 500 stock price index divided by S&P 500 12-month forward consensus expected operating earnings per share.
Note: Bear markets are declines of 20% or more (in red shades).
yardeni.com
Figure 32.
Predicting Valuation
Page 16 / September 25, 2017 / Chapter 14 Charts: Predicting Valuation www.yardeni.com
Yardeni Research, Inc.

46 48 50 52 54 56 58 60 62 64 66 68 70 72 74 76 78 80 82 84 86 88 90 92 94 96 98 00 02 04 06 08 10 12 14 16 18 2020
30
40
50
60
70
80
90
20
30
40
50
60
70
80
90
Q2
S&P DIVIDEND PAYOUT RATIO*(percent)
S&P 500S&P Industrials Composite
* Four-quarter trailing dividends per share divided by four-quarter trailing reported earnings.S&P 500 dividend payout not available from Q4-2008 to Q3-2009 because dividends exceeded earnings.Source: Standard & Poor’s.
yardeni.com
Figure 33.
80 82 84 86 88 90 92 94 96 98 00 02 04 06 08 10 12 14 16 18 2065
70
75
80
85
90
95
100
65
70
75
80
85
90
95
100
2016
S&P 500 COMPANIES PAYING A DIVIDEND(percent of total)
Source: Standard & Poor’s.
yardeni.com
Figure 34.
Predicting Valuation
Page 17 / September 25, 2017 / Chapter 14 Charts: Predicting Valuation www.yardeni.com
Yardeni Research, Inc.

70 72 74 76 78 80 82 84 86 88 90 92 94 96 98 00 02 04 06 08 10 12 14 16 18 200
5
10
15
20
25
30
35
40
45
50
55
60
65
0
5
10
15
20
25
30
35
40
45
50
55
60
65
Q2
S&P 500 DIVIDEND YIELD(trailing 4-quarter sum)
Invested in 1970Invested in 1980Invested in 1990Invested in 2000
Source: Standard & Poor’s.
yardeni.com
Figure 35.
52 54 56 58 60 62 64 66 68 70 72 74 76 78 80 82 84 86 88 90 92 94 96 98 00 02 04 06 08 10 12 14 16 18 20 220
2
4
6
8
10
12
14
16
18
0
2
4
6
8
10
12
14
16
18
Aug
S&P 500 DIVIDEND YIELD vs US TREASURY 10-YEAR BOND YIELD(percent)
Bond YieldS&P 500 Dividend Yield*
* S&P 500 four-quarter trailing dividends per share divided by quarterly closing value of the S&P 500 index.Source: Standard & Poor’s and Federal Reserve Board.
yardeni.com
Figure 36.
Predicting Valuation
Page 18 / September 25, 2017 / Chapter 14 Charts: Predicting Valuation www.yardeni.com
Yardeni Research, Inc.

45 50 55 60 65 70 75 80 85 90 95 00 05 10 15 20 2510
1010
2010
3010
401050106010
10
1010
2010
3010
401050106010
1%
2%
3% 4% 5% 6%
S&P 500 INDEX AND DIVIDEND YIELD(ratio scale)
S&P 500 Index09/20/17
Blue Angels Implied Dividend Yield*
* Blue lines show hypothetical values of S&P 500 stock price index using actual S&P 500 dividend (4-quarter trailing sum) divided by dividend yieldsfrom 1.0% to 6.0%Source: Standard & Poor’s.
yardeni.com
Figure 37.
45 50 55 60 65 70 75 80 85 90 95 00 05 10 15 20 25.7
50.7
100.7
150.7
200.7250.7300.7
.7
50.7
100.7
150.7
200.7250.7300.7
Q2
S&P 500 TRAILING 4-QUARTER DIVIDENDS WITH 5% TO 8% CAGR GROWTH PATHS(base period Dec 1946 = 0.71, ratio scale)
5%
6%
7%
8%
Source: Standard & Poor’s.
Figure 38.
Predicting Valuation
Page 19 / September 25, 2017 / Chapter 14 Charts: Predicting Valuation www.yardeni.com
Yardeni Research, Inc.
http://blog.yardeni.com
http://blog.yardeni.com
Copyright (c) Yardeni Research, Inc. 2017. All rights reserved. The informationcontained herein has been obtained from sources believed to be reliable, but is notnecessarily complete and its accuracy cannot be guaranteed. No representation orwarranty, express or implied, is made as to the fairness, accuracy, completeness, orcorrectness of the information and opinions contained herein. The views and the otherinformation provided are subject to change without notice. All reports posted onwww.yardeni.com, blog.yardeni.com, and YRI’s Apps for iPads and iPhones are issuedwithout regard to the specific investment objectives, financial situation, or particular needsof any specific recipient and are not to be construed as a solicitation or an offer to buy or sellany securities or related financial instruments. Past performance is not necessarily a guideto future results. Company fundamentals and earnings may be mentioned occasionally, butshould not be construed as a recommendation to buy, sell, or hold the company’s stock.Predictions, forecasts, and estimates for any and all markets should not be construed asrecommendations to buy, sell, or hold any security--including mutual funds, futurescontracts, and exchange traded funds, or any similar instruments.
The text, images, and other materials contained or displayed on any Yardeni Research, Inc.product, service, report, email or website are proprietary to Yardeni Research, Inc. andconstitute valuable intellectual property. No material from any part of www.yardeni.com, blog.yardeni.com, and YRI’s Apps for iPads and iPhones may be downloaded, transmitted,broadcast, transferred, assigned, reproduced or in any other way used or otherwisedisseminated in any form to any person or entity, without the explicit written consent ofYardeni Research, Inc. All unauthorized reproduction or other use of material from YardeniResearch, Inc. shall be deemed willful infringement(s) of this copyright and other proprietaryand intellectual property rights, including but not limited to, rights of privacy. YardeniResearch, Inc. expressly reserves all rights in connection with its intellectual property,including without limitation the right to block the transfer of its products and services and/orto track usage thereof, through electronic tracking technology, and all other lawful means,now known or hereafter devised. Yardeni Research, Inc. reserves the right, without furthernotice, to pursue to the fullest extent allowed by the law any and all criminal and civilremedies for the violation of its rights.
The recipient should check any email and any attachments for the presence of viruses.Yardeni Research, Inc. accepts no liability for any damage caused by any virus transmittedby this company’s emails, website, blog and Apps. Additional information available onrequest.