Embed Size (px)
Citation preview
57
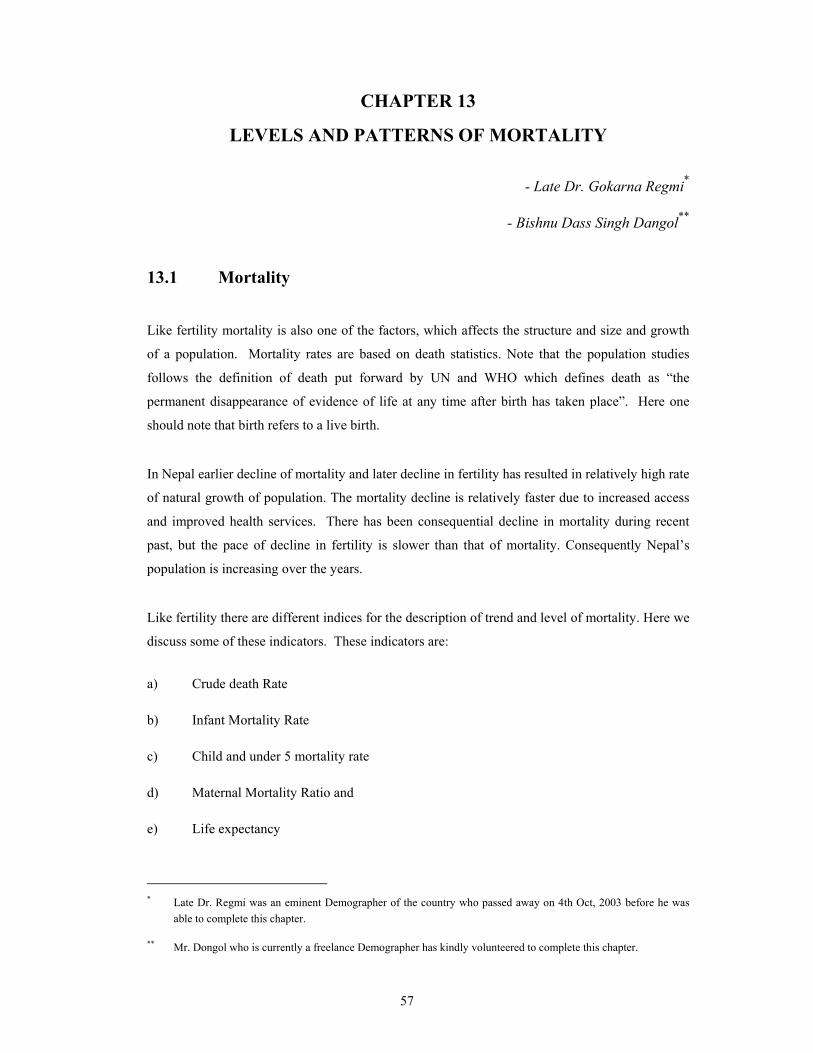
CHAPTER 13
LEVELS AND PATTERNS OF MORTALITY
- Late Dr. Gokarna Regmi*
- Bishnu Dass Singh Dangol**
13.1 Mortality
Like fertility mortality is also one of the factors, which affects the structure and size and growth
of a population. Mortality rates are based on death statistics. Note that the population studies
follows the definition of death put forward by UN and WHO which defines death as “the
permanent disappearance of evidence of life at any time after birth has taken place”. Here one
should note that birth refers to a live birth.
In Nepal earlier decline of mortality and later decline in fertility has resulted in relatively high rate
of natural growth of population. The mortality decline is relatively faster due to increased access
and improved health services. There has been consequential decline in mortality during recent
past, but the pace of decline in fertility is slower than that of mortality. Consequently Nepal’s
population is increasing over the years.
Like fertility there are different indices for the description of trend and level of mortality. Here we
discuss some of these indicators. These indicators are:
a) Crude death Rate
b) Infant Mortality Rate
c) Child and under 5 mortality rate
d) Maternal Mortality Ratio and
e) Life expectancy
* Late Dr. Regmi was an eminent Demographer of the country who passed away on 4th Oct, 2003 before he was
able to complete this chapter.
** Mr. Dongol who is currently a freelance Demographer has kindly volunteered to complete this chapter.

58
13.2 Source of Data
Main source of death data generally is the vital registration system. In Nepal though the system
was implemented firstly in 1977 in 10 districts and had made universal by 1990, the recording
system is still immature. Despite the continuous effort of government for exhaustive coverage of
death statistics, it remained highly under reported. As of the system-report the death rate is about
3.0 deaths per thousand. The country has not yet developed its social and economical status so as
to meeting the crude death rate as low as 3 per thousand in 2000. So the data from the system
could not reflect actual mortality level of Nepalese people. Under such situation, mortality indices
have to be continually derived either from frequently conducted surveys or decennial censuses.
Note that the sample surveys have proved to be better sources than in censuses in terms of
coverage and quality. In the survey, collection of mortality related data had generally given less
attention compared to fertility related data collection as it is closely linked with family planning,
which is more often interested. However the mortality indicators discussed below are either based
on stable or quasi-stable population analysis or data based on survey, where both the direct and
indirect measures of estimation are employed.
13.3 Crude Death Rate (CDR)
Crude death rate (CDR) is defined as ratio of annual number of deaths to the person years of
exposure to death during that period multiplied by a constant (usually 1000). Note that for
simplicity, person-years of exposure is usually approximated by the mid-year population. Like
crude birth rate this is usually widely understood and is very frequently used summary measure of
mortality. However, like CBR, CDR is also heavily affected by the age and other compositional
structure of the population. For example, note that age specific death rate at age 15-19 is very low
compared age specific death rate at 0-4 or 60-64 years of age. Therefore, combining all the deaths
into one and calculating the rate for all population ignores the age composition of the population.
In two populations even if the age specific death rates are exactly the same, if age-sex structure is
different then they will have different crude death rate (CDR).
13.3.1 Crude Death Rate for Different Years
Different estimates of CDR for Nepal available since 1954 are provided in Table 13.1. Because
most of these estimates are based on stable population techniques, these estimates do not present a
very consistent trend. Moreover, this could be also due to the use of different data that come
either from censuses or surveys. It should be borne in mind that both of these sources of data
suffer from inherent errors.

59
Table 13.1 : Crude death rate, Nepal, 1954 - 1999
Crude Death Rate S.N. Source Estimated
Duration Total Male Female 1. Vaidhyanathan & Gaige, 1973 1954 36.7 - -
2. CBS, 1977 1953-61 27.0 28.0 24.8
3. Guvaju, 1975 1961 22.0 - -
4. CBS, 1977 1961-71 21.4 21.3 22.6
5. CBS, Demographic Sample Survey, 1976 1974-75 19.5 18.6 20.4
6. CBS, Demographic Sample Survey, 1977 1976 22.2 21.5 22.8
7. CBS, Demographic Sample Survey, 1978 1977-78 17.1 17.9 16.2
8. CBS, 1977 1971-81 13.5 12.2 14.9
9. New Era, 1986 1984 10.9 10.8 11.0
10. CBS, Demographic Sample Survey, 1986 1986-87 16.1 - -
11. CBS 1991 13.3 12.9 13.6
12. CBS 1996 11.6 - -
13. MOPE 1999 10.3 - -
Source: CBS, 1995; CBS, 1998; MOPE, 1998
The table indicates that CDR was a little over 35 in 1950s, which decreased to less than 20 in
1970s, and further reduced to 10.3 by 1999. Despite fluctuations in the estimate of CDR, it can
easily be concluded from the table that mortality in Nepal has been declining over the years.
Another thing that emerges from the table is that these estimates consistently indicate higher
female mortality than males. Nepal is one of the few countries in the world where female
mortality is higher than males.
There is no reliable information on Age Specific Death Rates (ASDR) in Nepal, which could
provide mortality information for different age groups. The lack of reliable estimates of adult
mortality by age has led us to use CDR.
13.3.2 Crude Death Rate 2001
Direct estimation of crude death rate is not possible because of data dearth. Despite of poor
reporting in the vital registration system, the census of 2001 also showed under reporting of
deaths. For example the rate was found to be 4.7 per thousand populations in 2001. Health
services available, prevailing living standard of population (more than 90 percent population are
in the area which is of rural characteristics) and high poverty level (about 42 %) should led high
60
death rate. The rate does not reflect crude death rate of Nepalese population in 2001. Therefore
this asks for indirect estimates of death rates in the country.
As of the computation made in the forth-coming population projection of the Central Bureau of
Statistics, the crude birth rate is about 33.3 per thousand populations (TFR is 4.0) in 2001.
Population growth rate is 2.25 percent during the period 1991 to 2001. These statistics, the
population growth rate and crude birth rate put Nepalese crude death rate at 10.8 per thousand
populations (assuming net international migration is nil). Note that beside this type of crude and
general rate, no information is available on mortality separately for adults.
13.4 Infant Mortality Rate (IMR)
The IMR is the number of deaths under one year of age per 1000 live births during a period of
time, usually one year. Although it is called a rate, in fact, it is the probability of survival to age
one since birth. Several factors affect the IMR of a country and these are:
a) Nutrition of mothers and children
b) Birth intervals
c) Parity
d) Age of the mother at child’s birth
e) Basic health services including
i. Immunization
ii. ARI
iii. Diarrhea
iv. Safer motherhood programmes etc;
In other words IMR usually declines with a certain level of socio-economic development as
reflected by the above-mentioned services. Therefore IMR has been considered as an indicator of
socio-economic development and general health condition of a society. Since the adult mortality
is relatively lower even in developing countries and smaller proportion of population is in older
group, a substantial number of deaths occur during the first five years of life. In developing
countries where medical health systems are not fully developed infant death is a substantial part of
under five-age deaths. Therefore, reduction of IMR is needed to achieve a significant reduction in
the overall morality. Moreover the interdependent relationship between fertility and infant
mortality suggests that a reduction in infant child mortality will trigger a subsequent decline in
fertility (Regmi, 1994), it has also found that lower IMR motivates couples to produce less
number of children.

61
Table 13.2 : Infant mortality rate, Nepal, 1954 – 1999.
Infant Mortality Rate S.N. Source Estimated
Duration Total Male Female 1. Vaidhyanathan & Gaige, 1973 1954 - 260 2502. Guvaju, 1974 1961-71 - 200 1863. CBS, 1974 1971 172 - -4. Nepal Fertility Survey, 1977 1976 152 - -5. CBS, 1985 1978 144 147 1426. New Era, 1986 1981 117 136 1117. Fertility and Family Planning Survey 1983-84 108 117 988. Fertility and Family Planning Survey, 1991 1989 102 - -9. Census, 1991 1991 97 94 10110. Family Health Survey,1996 1993-96 79 - -11. Nepal demographic Health Survey 1998-2001 64 - -
Source : CBS, 1995; MOH, 1997; NDHS2001
In Table 13.2 provides estimates of infant mortality based on different sources have been
provided. Note that except for the census estimate for 1991 all the estimates before 1989 have
either been based on indirect techniques of estimation. Since the 1991 survey it has been argued
that the quality of pregnancy history data has improved and there is very little omission of births
and deaths especially during the recent past. As the effect of these omissions on the calculation of
demographic rates is minimal, direct method of estimation has been used since then.
The Table 13.2
indicates that a high
IMR of around 250
per thousand live
births prevailed in
the country during
the fifties. In the
sixties it decreased
to around 150 to 200
per thousand live
births. Since the mid
seventies decline in
IMR is secular and
by 1998-2001 it has
reached 64 per 1000
live births. Figure 13.1 shows the success in lowering IMR more clearly.
Figure 13.1 : Infant mortality rate, 1954-1999
0
50
100
150
200
250
300
1954 1961-71
1971 1976 1978 1981 1983-84
1989 1991 1994 1999
Year
Mor
talit
y R
ate
Male
Female
Total

62
Infant mortality is affected by various socio-economic and demographic factors. These factors are
particular interest, since these provide clues for the identification of priority groups in policy
formulation and programme implementation. Differentials in IMR in Nepal has been presented in
Table 13.3
Table 13.3 : Infant mortality rates by socio-economic & demographic characteristics, Nepal, NFHS 1996 and NDHS 2001.
(for ten years period preceding the survey)
Characteristics NFHS 1996 NDHS 2001 Residence Urban 61.1 50.1 Rural 95.3 79.3
Ecological Region Mountain 136.5 112.0 Hill 87.4 66.2 Terai 90.9 80.8
Development Region Eastern 79.4 77.5 Central 86.3 77.4 Western 84.3 60.1 Mid-Western 114.8 72.9 Far Western 124.3 112.2 Education No Education 97.5 84.6 Primary 80.0 61.0 Secondary 53.4 49.9*
Age of Mother at Birth < 20 120.1 108.2 20-29 79.5 67.6 30-39 103.9 72.9
Previous Birth Interval < 2 yrs 141.4 124.4 2-3 yrs 78.8 67.8* 3 yrs - 45.2 4+ yrs 44.7 38.9
Sex of Child Male 101.9 79.2 Female 83.7 75.2
Source : MOH, 1997, NDHS2001
Note : *Refers to two year birth interval
Before the data in Table 13.3 is discussed we would like to remind the readers that the estimate of
IMR from NFHS 1996 and NDHS 2001 presented in Table 13.2 were based on births that
63
occurred during the preceding 5 years. The estimate of infant mortality differentials presented in
Table 13.3 is based on births that occurred during the preceding 10-year period. Both of these
surveys indicate that mother's education, place of residence; birth interval and age of mother have
great impact on IMR. IMR for mothers whose age is less than 20 or the duration of birth interval
is less than two years, is much higher than those aged 20+ and have longer birth interval. In
general the differentials observed during the 1996 survey seem to have decreased in the 2001
survey. This indicates that decrease in IMR is somewhat faster in groups where IMR used to be
higher.
13.5 Child and Under 5 Mortality
Before we present the data from the two recent surveys i.e. NFHS1996 and NDHS2001 definition
of these mortality indicators would be in order. Child mortality rate is defined as the probability
of surviving from age 1 to age 5. This assumes that the child has already survived to age 1 to
begin with. Under-five mortality rate is defined as follows. Of the 1000 children born today how
many will die before their 5th birthday. In other words, it is probability of dying between birth and
their fifth birthday. Note, once again that the estimate of these indicators are based on the births
that occurred during the last 5 years. Data on child and under age-5 mortality obtained from
NDHS 2001 have been summarized in Table 13.4.
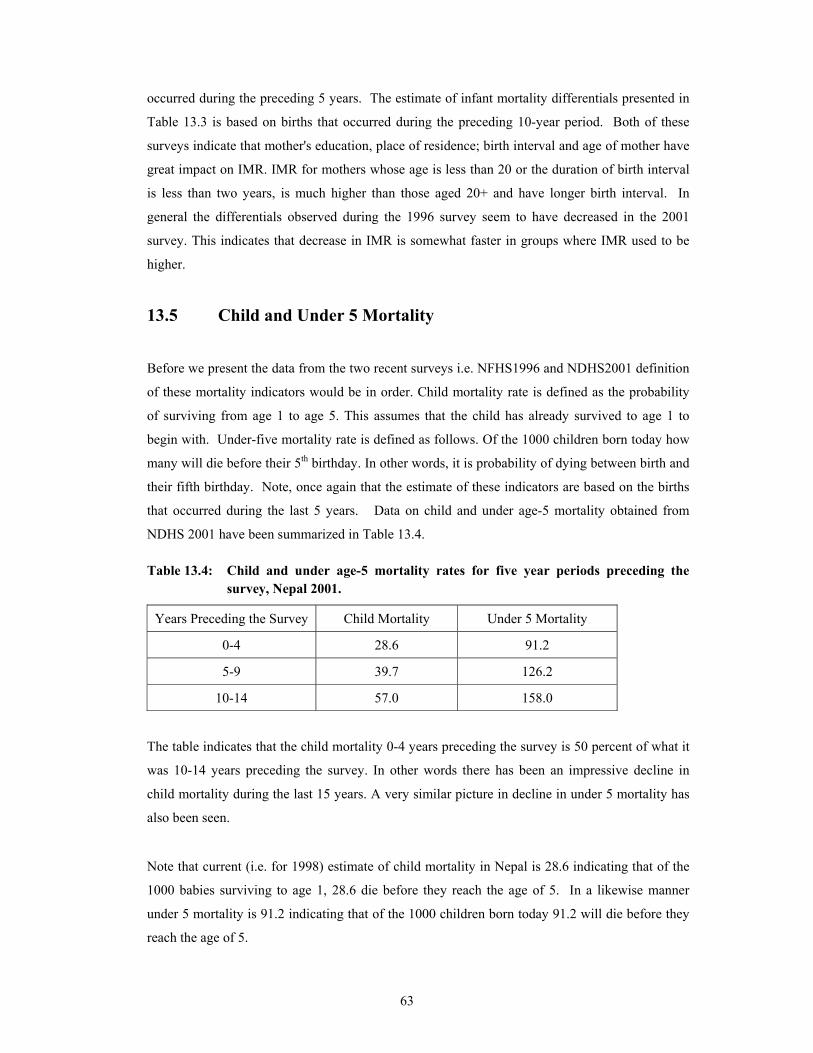
Table 13.4: Child and under age-5 mortality rates for five year periods preceding the survey, Nepal 2001.
Years Preceding the Survey Child Mortality Under 5 Mortality
0-4 28.6 91.2
5-9 39.7 126.2
10-14 57.0 158.0
The table indicates that the child mortality 0-4 years preceding the survey is 50 percent of what it
was 10-14 years preceding the survey. In other words there has been an impressive decline in
child mortality during the last 15 years. A very similar picture in decline in under 5 mortality has
also been seen.
Note that current (i.e. for 1998) estimate of child mortality in Nepal is 28.6 indicating that of the
1000 babies surviving to age 1, 28.6 die before they reach the age of 5. In a likewise manner
under 5 mortality is 91.2 indicating that of the 1000 children born today 91.2 will die before they
reach the age of 5.

64
Table 13.5 : Child and under 5 mortality rates by socio-economic & demographic characteristics, Nepal, NFHS 1996 and NDHS 2001.
(for ten years period preceding the survey) NFHS 1996 NDHS 2001
Characteristics Child Mortality
Under 5 Mortality
Child Mortality
Under 5 Mortality
Residence Urban 22.5 82.2 16.7 65.9 Rural 53.2 143.4 35.4 111.9 Ecological Regions Mountains 82.2 207.5 51.2 157.4 Hill 43.3 126.9 29.7 93.9 Terai 53.0 139.1 34.8 112.8 Development Regions Eastern 36.3 112.8 29.6 104.8 Central 56.1 137.5 36.4 110.9 Western 37.6 118.8 25.1 83.7 Mid Western 71.2 177.8 41.2 111.0 Far Western 62.3 178.9 41.7 149.2 Education No Education 56.8 148.8 39.5 120.7 Primary 21.0 99.3 13.4 73.5 Secondary 7.7** 60.7** 14.3 63.5 S.L.C.+ - - 3.7 14.9 Age of the Mother at Birth of the Child
<20 44.1 158.9 28.5 133.6 20-29 52.4 127.7 32.6 98.0 30-39 54.5 152.8 42.5 112.3 Previous Birth Interval < 2 Years 74.7 205.5 54.8 172.4 2-3 Years 52.4 127.1 40.0* 105.1* 3 Years - - 22.4 66.6 4 or More Years 32.1 75.4 20.1 58.2 Sex of the Child Male 45.5 142.8 27.8 104.8 Female 56.5 135.5 40.2 112.4
Table 13.5 provides the differentials in child and under5 mortality for Nepal obtained from NFHS
1996 and NDHS 2001 surveys. Note once again that for the differentials births that occurred
during the last ten year period has been taken into account.

65
The same factors, which were important in the differentials of infant mortality, are also important
for child and under age-5 mortality. These are mother’s education, mother’s age, previous birth
interval and ecological regions.
Like the infant mortality the differentials in child and under5 mortality has decreased over the last
five years again suggesting that the programmes aimed at reducing child mortality is also reaching
those groups where child and under 5 mortality used to be higher, however the differentials still
persist in child and under-age 5 mortality.
13.6 Maternal Mortality
Maternal deaths are defined as any death that occurred during pregnancy, childbirth or within six
weeks after the birth or termination of pregnancy. Maternal mortality is defined as the ratio of
maternal deaths and number of live births during the same period multiplies by 100,000. The
hospital record on maternal mortality shows that maternal mortality was 189 per 100,000 live
births (Malla, 1986 as cited in MOH, 1993, pp.142) in 1979 to 1985. Taking time reference into
consideration, the hospital record is inappropriate for estimation of maternal mortality rate.
Because such low rate in the time prior to 1985 is no way to endorse it. The fertility, mortality
and morbidity survey carried out some time in 1997-78 in the three rural areas of Katmandu,
Rupendehi and Kavre revealed maternal mortality ratio of 850 per 100,000 live births (FP/MCH
as cited in CBS, 1987, pp250).
Table 13.6: Maternal mortality ratio 1987 - 1998
Reference Year Ratio per 100,000 Sources
1991 515 NFHS, 1991, MOH
1990-1996 539 NFHS, 1996, MOH
1998 596-683 MMMS, 1998, MOH
NFHS, 1991 and 1996 had collected data on maternal mortality through sisterhood method in
1991 and direct method in 1996. Estimation of maternal mortality ratio utilizing the methods
mentioned above yielded a ratio of 519 and 539 deaths per 100,000 live births respectively. The
slight increased in ratio in the latter year may be due to differences in methods adopted and
inherent errors. However the difference is very small. The survey from MMMS, 1998 estimated
maternal mortality ratio at 596-683 per 100,000 live births. Note that this study was on the basis
of Hospital Death Audits of two districts hospitals. Result of the later survey has problems,
basically of reporting from the area outside the concerned district, which seriously effect on
66
deciding the denominator. Nevertheless, maternal mortality ratio is still continuing to be as high
as 500 to 550 per 100,000 live births in the country. This ratio is one of the highest in the world
indicting that a sizable number of mothers die during childbirth.
In order to combat this high ratio of maternal mortality His majesty’s government has embarked
on a number of programmes under Family Health division’s safer motherhood programmes. In
this effort the government is also being supported by different donor agencies such as UNICEF,
DFID, USAID, GTZ and other INGOs.
13.7 Life Expectancy at Birth in the Past
Life expectancy at birth is defined as the average number years a newborn baby will survive if
s/he is subjected to current mortality pattern. Note that like the TFR this is also a synthetic cohort
measure. This measure of mortality like the IMR is free from distortions of age composition and
thus international comparisons can readily be made.
To calculate life expectancy we need the age specific mortality rates, which are difficult to obtain,
as it requires a survey of large sample size. Because the birth registration data is not available,
life expectancy in Nepal is usually estimated based on the census data, employing indirect
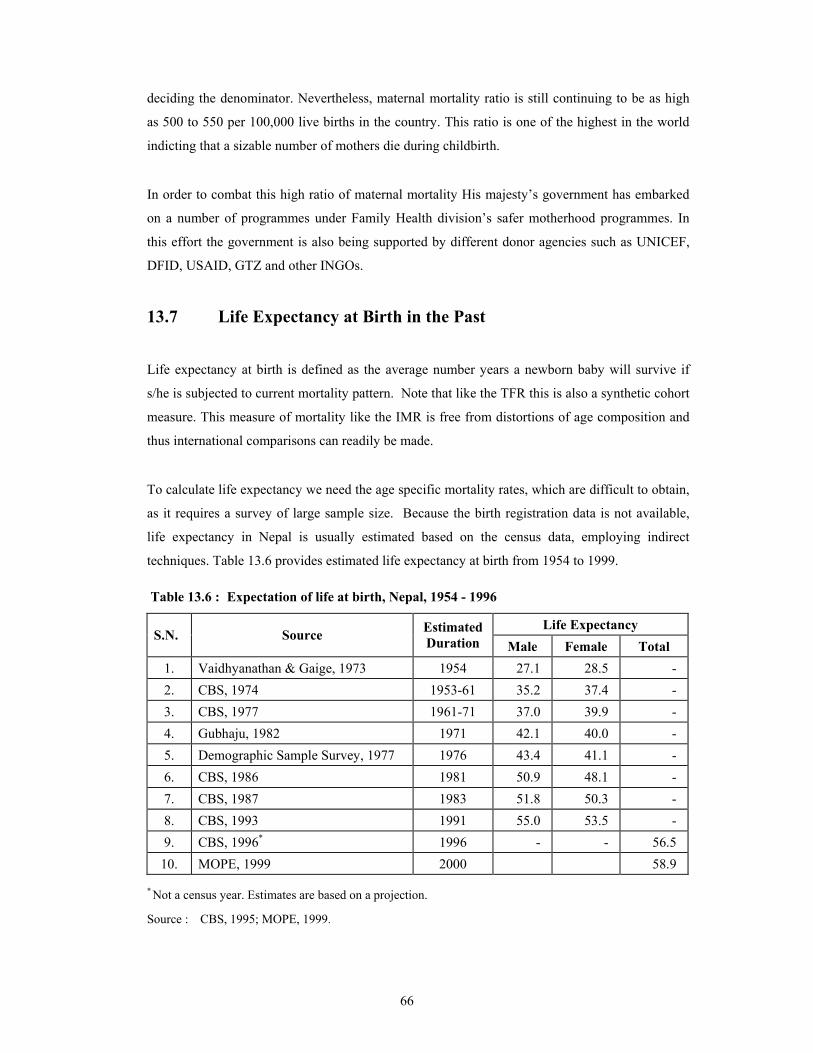
techniques. Table 13.6 provides estimated life expectancy at birth from 1954 to 1999.
Table 13.6 : Expectation of life at birth, Nepal, 1954 - 1996
Life Expectancy S.N. Source Estimated
Duration Male Female Total 1. Vaidhyanathan & Gaige, 1973 1954 27.1 28.5 - 2. CBS, 1974 1953-61 35.2 37.4 - 3. CBS, 1977 1961-71 37.0 39.9 - 4. Gubhaju, 1982 1971 42.1 40.0 - 5. Demographic Sample Survey, 1977 1976 43.4 41.1 - 6. CBS, 1986 1981 50.9 48.1 - 7. CBS, 1987 1983 51.8 50.3 - 8. CBS, 1993 1991 55.0 53.5 - 9. CBS, 1996* 1996 - - 56.5 10. MOPE, 1999 2000 58.9
* Not a census year. Estimates are based on a projection.
Source : CBS, 1995; MOPE, 1999.
67
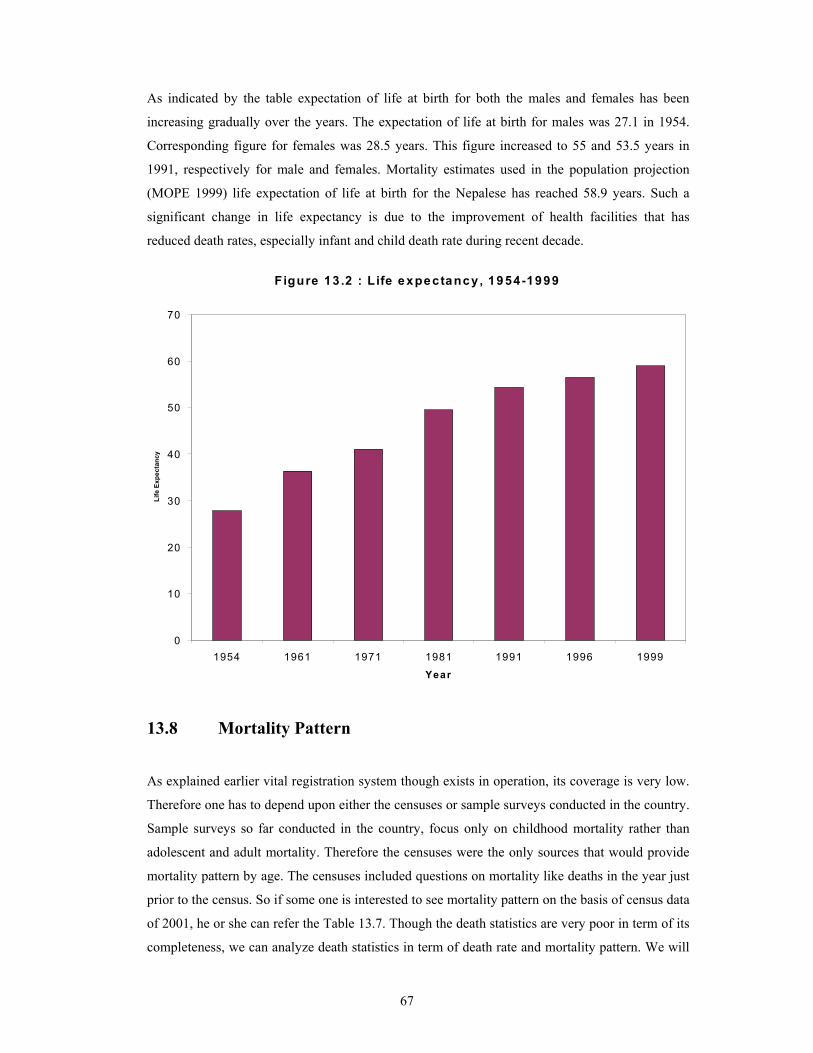
As indicated by the table expectation of life at birth for both the males and females has been
increasing gradually over the years. The expectation of life at birth for males was 27.1 in 1954.
Corresponding figure for females was 28.5 years. This figure increased to 55 and 53.5 years in
1991, respectively for male and females. Mortality estimates used in the population projection
(MOPE 1999) life expectation of life at birth for the Nepalese has reached 58.9 years. Such a
significant change in life expectancy is due to the improvement of health facilities that has
reduced death rates, especially infant and child death rate during recent decade.
Source: Table 18
13.8 Mortality Pattern
As explained earlier vital registration system though exists in operation, its coverage is very low.
Therefore one has to depend upon either the censuses or sample surveys conducted in the country.
Sample surveys so far conducted in the country, focus only on childhood mortality rather than
adolescent and adult mortality. Therefore the censuses were the only sources that would provide
mortality pattern by age. The censuses included questions on mortality like deaths in the year just
prior to the census. So if some one is interested to see mortality pattern on the basis of census data
of 2001, he or she can refer the Table 13.7. Though the death statistics are very poor in term of its
completeness, we can analyze death statistics in term of death rate and mortality pattern. We will
Figure 13 .2 : L ife expectancy, 1954-1999
0
10
20
30
40
50
60
70
1954 1961 1971 1981 1991 1996 1999
Year
Life
Exp
ecta
ncy
68
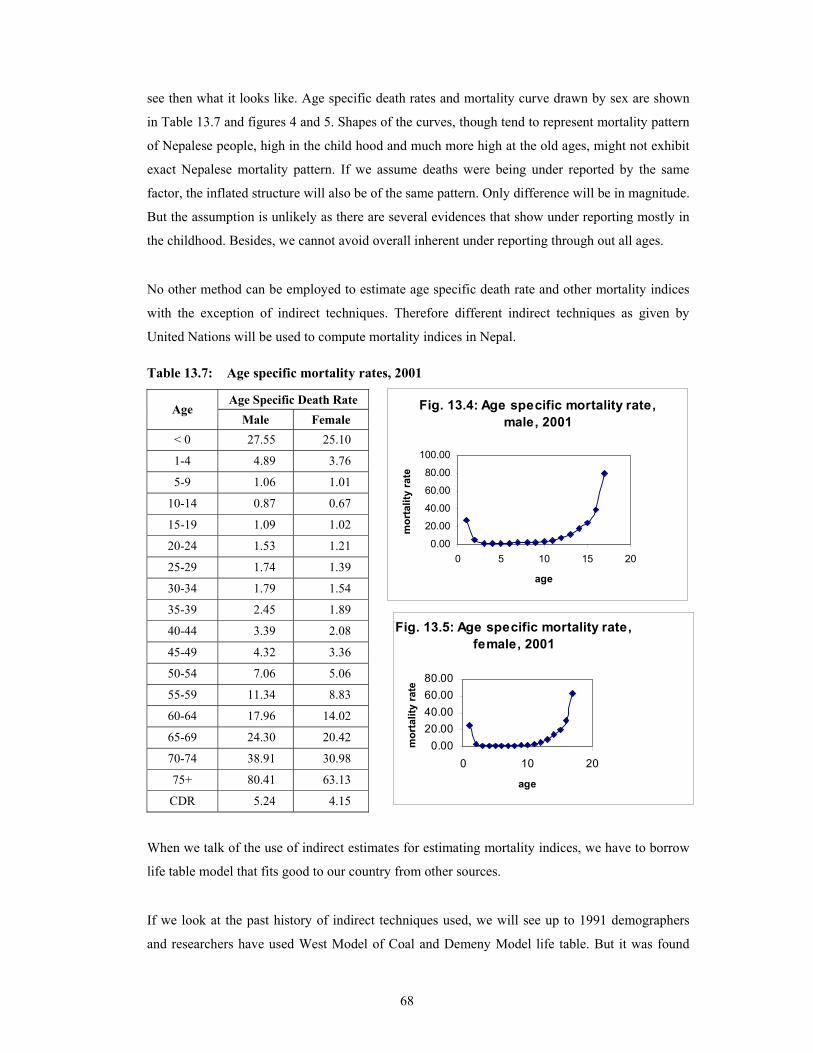
see then what it looks like. Age specific death rates and mortality curve drawn by sex are shown
in Table 13.7 and figures 4 and 5. Shapes of the curves, though tend to represent mortality pattern
of Nepalese people, high in the child hood and much more high at the old ages, might not exhibit
exact Nepalese mortality pattern. If we assume deaths were being under reported by the same
factor, the inflated structure will also be of the same pattern. Only difference will be in magnitude.
But the assumption is unlikely as there are several evidences that show under reporting mostly in
the childhood. Besides, we cannot avoid overall inherent under reporting through out all ages.
No other method can be employed to estimate age specific death rate and other mortality indices
with the exception of indirect techniques. Therefore different indirect techniques as given by
United Nations will be used to compute mortality indices in Nepal.
Table 13.7: Age specific mortality rates, 2001
When we talk of the use of indirect estimates for estimating mortality indices, we have to borrow
life table model that fits good to our country from other sources.
If we look at the past history of indirect techniques used, we will see up to 1991 demographers
and researchers have used West Model of Coal and Demeny Model life table. But it was found
Age Specific Death Rate Age
Male Female < 0 27.55 25.10
1-4 4.89 3.76
5-9 1.06 1.01
10-14 0.87 0.67
15-19 1.09 1.02
20-24 1.53 1.21
25-29 1.74 1.39
30-34 1.79 1.54
35-39 2.45 1.89
40-44 3.39 2.08
45-49 4.32 3.36
50-54 7.06 5.06
55-59 11.34 8.83
60-64 17.96 14.02
65-69 24.30 20.42
70-74 38.91 30.98
75+ 80.41 63.13
CDR 5.24 4.15
Fig. 13.4: Age specific mortality rate,male, 2001
0.00
20.00
40.00
60.00
80.00
100.00
0 5 10 15 20
age
mor
talit
y ra
te
Fig. 13.5: Age specific mortality rate,female, 2001
0.0020.0040.0060.0080.00
0 10 20
age
mor
talit
y ra
te
69
that Nepal fits very close to General pattern of United Nations model rather than West model of
Coal and Demeny model1. The study was done using data of the Nepal Fertility Survey, 1976.
Question is now “how about in 2001”. Is this model still fit in 2001? So our first task is to
investigate “which model fits well to the country?” For this investigation we will use information
from the latest survey data of Demographic Health Survey 2001.
For this purpose we will use the cross sectional data of IMR and corresponding CMR as described
by the same manual.
Following attempts were being made to investigate this issue:
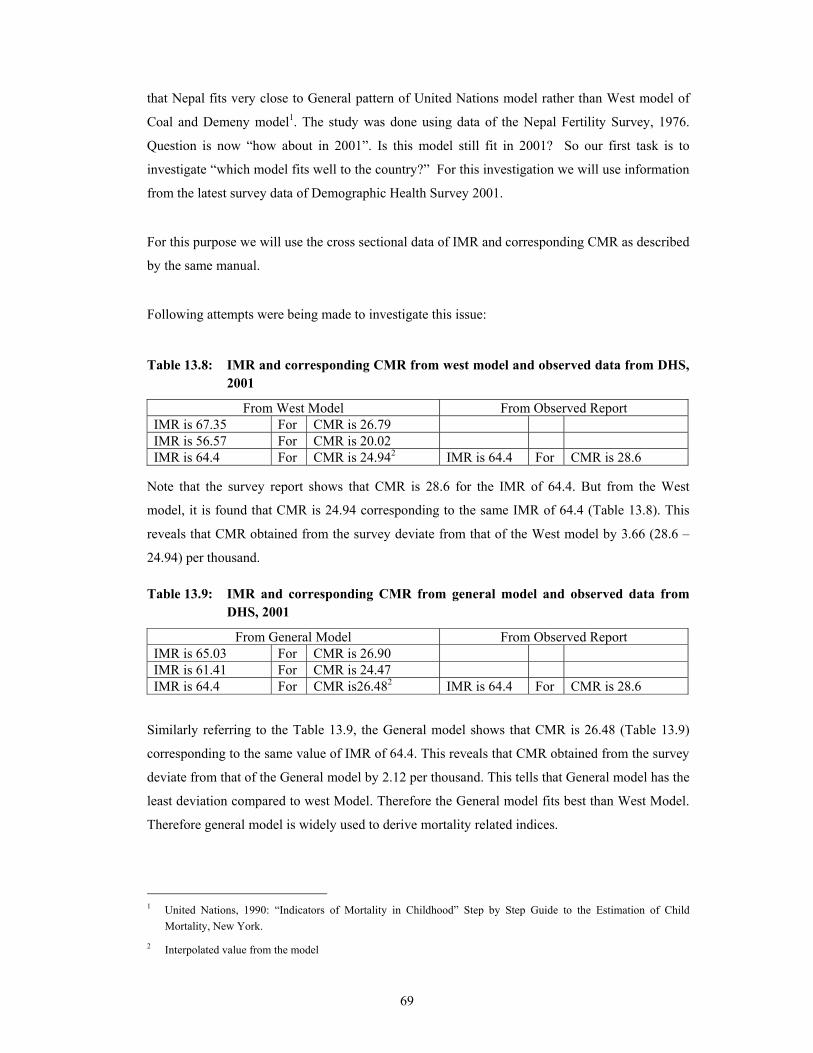
Table 13.8: IMR and corresponding CMR from west model and observed data from DHS,
2001
From West Model From Observed Report IMR is 67.35 For CMR is 26.79 IMR is 56.57 For CMR is 20.02 IMR is 64.4 For CMR is 24.942 IMR is 64.4 For CMR is 28.6
Note that the survey report shows that CMR is 28.6 for the IMR of 64.4. But from the West
model, it is found that CMR is 24.94 corresponding to the same IMR of 64.4 (Table 13.8). This
reveals that CMR obtained from the survey deviate from that of the West model by 3.66 (28.6 –
24.94) per thousand.
Table 13.9: IMR and corresponding CMR from general model and observed data from DHS, 2001
From General Model From Observed Report IMR is 65.03 For CMR is 26.90 IMR is 61.41 For CMR is 24.47 IMR is 64.4 For CMR is26.482 IMR is 64.4 For CMR is 28.6
Similarly referring to the Table 13.9, the General model shows that CMR is 26.48 (Table 13.9)
corresponding to the same value of IMR of 64.4. This reveals that CMR obtained from the survey
deviate from that of the General model by 2.12 per thousand. This tells that General model has the
least deviation compared to west Model. Therefore the General model fits best than West Model.
Therefore general model is widely used to derive mortality related indices.
1 United Nations, 1990: “Indicators of Mortality in Childhood” Step by Step Guide to the Estimation of Child
Mortality, New York.
2 Interpolated value from the model

70
In fact it is not enough to establish the suitability of the model life table on the basis of infant and child mortality only. The basis of establishing a suitable model should include adult mortality and elderly mortality also. But there is no such study ever taken to provide adult and elderly mortality rate.
13.9 Determination of Mortality Level
When we say certain particular mortality Level of a country, it will be very technical term. So we will translate it into “life expectancy at birth” so that every body could understand what does it mean?
There are various indirect techniques to determine life expectancy at birth. We will use those techniques only that are permissible by the available statistics in the country. Among the different methods stable population technique is also one. But in the context of Nepal where fertility as well as mortality level is declining since the last several years, the population is no longer stable.
13.9.1 Survivorship Ratio Method
Theoretically this method can be applied to sexes, male and female separately. But due to
substantial size of out migration, particularly of males this method would not hold good for
estimating level or life expectancy at birth of male during inter census period (in 2001 male
absentees were 679468). Similarly age distribution of females also could have been affected by
out migration (in 2001 female absentees were 82712). However the statistics shows that females
out migration are comparatively less (ratio of out migration to total present population is about 0.7
percent females against 6.0 percent males). Therefore here an attempt is being made to study
mortality level or life expectancy at birth by using female’s ten years survivorship ratio method
from 1991 to 2001.
The Table 13.10 reveals that life expectancy at birth for females varies from the lowest value of
42 years to highest value of 67 years during 1991 to 2001. The ranges can be divided into two set
of life expectancy at birth. One set is below 54 years and another is more than 60 years with a
large gap.
If we assume the reference year as 1996, the values of life expectancy at birth below 54 years
cannot be accepted as the study done already based on population census of 1991 showed
Nepalese life expectancy at birth had reached 54 years in 1991. Of course it could be less than 54
years if health services had worsened dramatically during 1991 to 1996, which is unexceptional

71
case as well as beyond the reality. Another set of figures showed life expectancy at birth lies
between 61 years and 67 years in 1996. Even if we accept the lowest value of 61 as life
expectancy at birth in 1996, the statistics showed that the life expectancy at birth increased by 7
years (54 years in 1991 to 61 years in 1996) in 5 years period, which ruled out universal annual
increment rate in life expectancy at birth.
Table 13.10: Ten-year female life table survival ratio (1991-2001)
Female Population3 Survival Ratio (General Pattern) Age
1991 2001 From To SR eo 0-'4 1,435,313 1,539,450 0-4' 10-14' 0.9950 GT 5-'9 1,266,523 1,492,620 5-'9 15-19 0.9988 GT
10-'14 1,116,166 1,428,130 10-'14 20-24 0.9897 67.0 15-19 970,968 1,264,950 15-19 25-29 0.9743 60.7 20-24 851,512 1,104,720 20-24 30-34 0.9323 49.6 25-29 741,834 946,027 25-29 35-39 0.8908 42.6 30-34 618,453 793,883 30-34 40-44 0.8869 43.6 35-39 508,384 660,789 35-39 45-49 0.8864 46.0 40-44 421,205 548,518 40-44 50-54 0.8712 47.6 45-49 347,913 450,638 45-49 55-59 0.8629 53.9 50-54 284,128 366,953 50-54 60-64 0.8546 61.9 55-59 231,759 300,197 55-59 65-69 0.7953 62.9 60-64 183,005 242,828 60-64 0.6714 65-69 128,602 184,311 65-69 0.6187 70 + …… ……
There would be several constraints in using survivorship ratio for determining mortality indices. Most common problem is that both set of population were suffering from net migration. Population who were out in 1991 could already be back in 2001. Similarly some of the population who were present in the cohort in 1991 might had gone out during 10 years period, 1991 to 2001. Therefore though they were counted in 1991, they would be among the absentees in 2001.
13.9.2 Translation of Under-Age 5 Mortality into Life Expectancy at Birth
As explained earlier Nepal Life Table is not available due to paucity of data. It was also already
described that General Model Life Table suits the Nepalese population. Therefore indirect
technique is used to estimate life expectancy at birth using the General Model.
3 Population data has been smoothed

72
It is possible to estimate life expectancy at birth in any country using probability of surviving to
age 5. The advantage of this method is that results hold good even when the population in
question is far from stable (United Nations: 1983).
Table 13.11: Translations of under-five mortality rate into life expectancy at birth.
Sex Under Five4
Mortality (Per 1000 Live Birth)
Probability of Surviving to Under 5 (λ5)
(Per 1000 Live Births)
Translation of (λ5) into eo
Reference Year
Male 104.8 895.2 58.8 years 1996
Female 112.4 887.6 59.3 years 1996
According to Griffith Feeney increment of life expectancy at birth in developing countries is
about 2.3 years (refer Annex 1) during five-year period when the life expectancy at birth
approaches 59 years. This would place life expectancy at birth for the country in 2001 as
followings:
a) 61.1 years for males and
b) 61.6 years for females
13.9.3 Translation of Proportion of Population Under Age-15 into Life
Expectancy at Birth
As we did translation of probability of surviving to under-age five among the live births into life
expectancy at birth, similarly proportion of population under-age 15 can be translated into life
expectancy at birth by sex. The advantage of this method also is that results hold good even when
the population in question is far from stable (United Nations: 1983). The main problem in
computation of life expectancy at birth is that detail works has not yet been done to make the
Model Life Tables for developing countries user friendly as were done in Coale and Demeny
model life tables. In this case, therefore West Model life table of Coale and Demeny has been
used. Note that the statistics has to be adjusted to fit the figures in the General model.
4 Under-five mortality rates for 10-years period preceding the survey
73
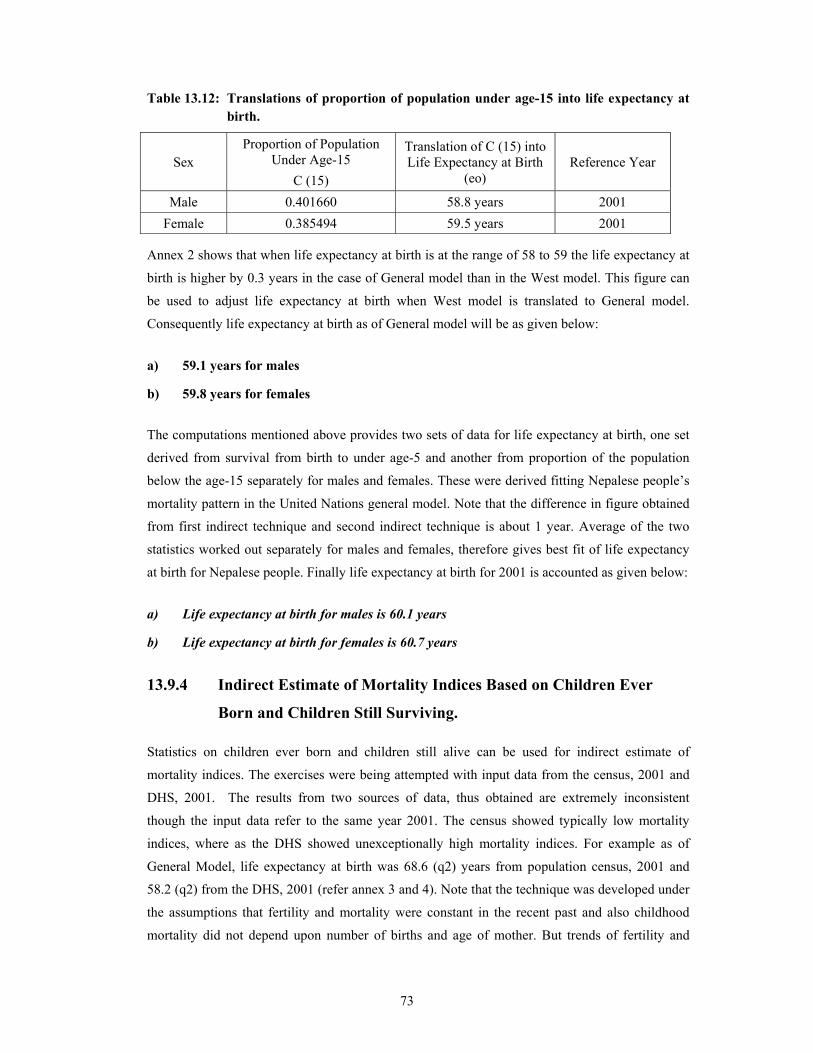
Table 13.12: Translations of proportion of population under age-15 into life expectancy at birth.
Sex Proportion of Population
Under Age-15 C (15)
Translation of C (15) into Life Expectancy at Birth
(eo) Reference Year
Male 0.401660 58.8 years 2001 Female 0.385494 59.5 years 2001
Annex 2 shows that when life expectancy at birth is at the range of 58 to 59 the life expectancy at
birth is higher by 0.3 years in the case of General model than in the West model. This figure can
be used to adjust life expectancy at birth when West model is translated to General model.
Consequently life expectancy at birth as of General model will be as given below:
a) 59.1 years for males
b) 59.8 years for females
The computations mentioned above provides two sets of data for life expectancy at birth, one set
derived from survival from birth to under age-5 and another from proportion of the population
below the age-15 separately for males and females. These were derived fitting Nepalese people’s
mortality pattern in the United Nations general model. Note that the difference in figure obtained
from first indirect technique and second indirect technique is about 1 year. Average of the two
statistics worked out separately for males and females, therefore gives best fit of life expectancy
at birth for Nepalese people. Finally life expectancy at birth for 2001 is accounted as given below:
a) Life expectancy at birth for males is 60.1 years
b) Life expectancy at birth for females is 60.7 years
13.9.4 Indirect Estimate of Mortality Indices Based on Children Ever
Born and Children Still Surviving.
Statistics on children ever born and children still alive can be used for indirect estimate of
mortality indices. The exercises were being attempted with input data from the census, 2001 and
DHS, 2001. The results from two sources of data, thus obtained are extremely inconsistent
though the input data refer to the same year 2001. The census showed typically low mortality
indices, where as the DHS showed unexceptionally high mortality indices. For example as of
General Model, life expectancy at birth was 68.6 (q2) years from population census, 2001 and
58.2 (q2) from the DHS, 2001 (refer annex 3 and 4). Note that the technique was developed under
the assumptions that fertility and mortality were constant in the recent past and also childhood
mortality did not depend upon number of births and age of mother. But trends of fertility and
74
mortality level showed that the fertility level is declining and mortality rate is decreasing over the
years significantly (see fertility chapter). Similarly childhood mortality rate depends also on
number of births and age of mother (see Table 13.5). These evidences clearly tell that under lying
assumptions of the technique do not hold good any more. It is also evident from the results
(Appendices 3 and 4) that the census of 2001 is highly affected by under reporting of children
deaths to the mothers, whereas survey work of 2001 is less likely affected.
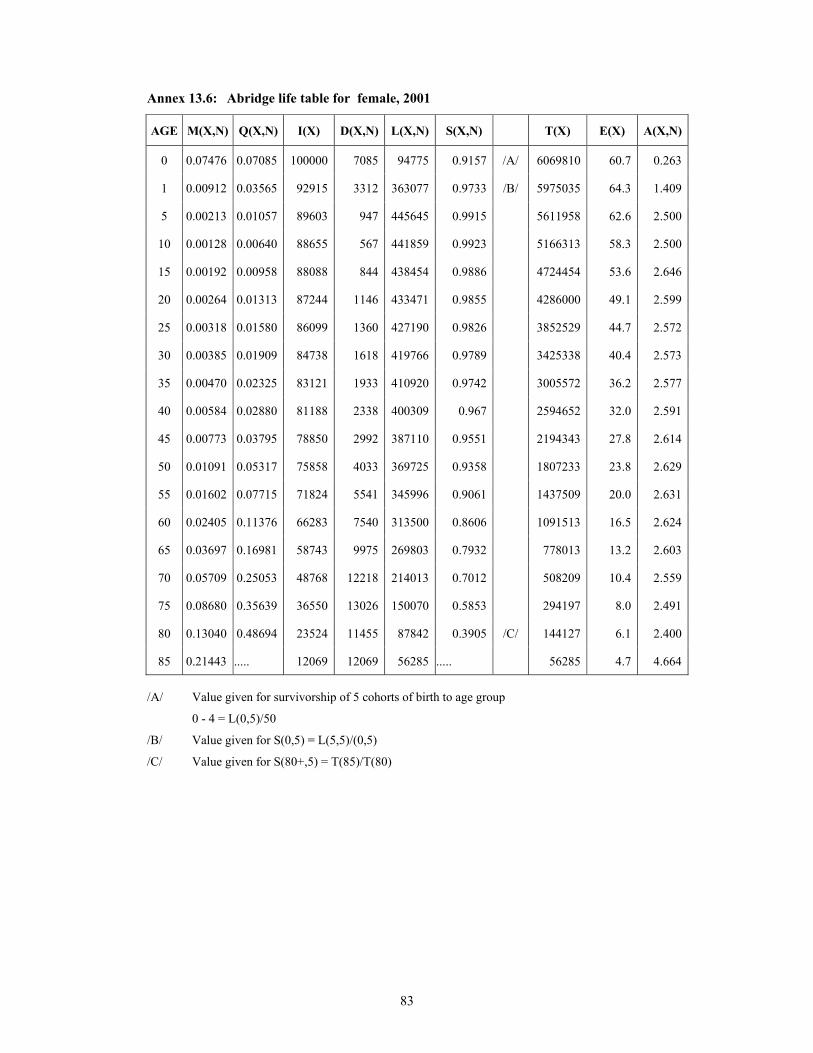
13.10 Model Life Table
On the basis of general model life table, which is found to be most appropriate for Nepalese
people in 2001 Abridge Life Table has been computed separately for male and female (refer
Annex 5 and 6). This life tables showed that IMR is slightly more than what has been computed
directly from the survey data of 2001. The figure from the table IMR is about 71.4 for males and
70.9 for females in 2001 against 79.2 for males and 75.2 for females in 1996 (see Table 13.3). It
is to be noted that the life table provides indirect estimate of IMR rather than direct method.
13.11 Conclusion
In Nepal though vital registration system has been universally implemented since 1990, the
recording of events are so poor that we cannot use them to estimate vital rates. Under such
situation, mortality indices have to be continually derived either from frequently conducted
surveys or decennial censuses. Note that the sample surveys have proved to be better sources than
the censuses in terms of coverage and quality. In the survey, collection of mortality related data
had generally given less attention compared to fertility related data collection as it is closely
linked with family planning, which is more often of interest. However mortality indicators are
particularly computed from the survey based data. Both direct and indirect measures of estimation
are employed depending upon the quality of data.
Probability of surviving to under-age five among the live births and proportion of population
under-age 15 are being translated into life expectancy at birth by sex. This explains mortality level
of Nepalese people by sex in 2001. General model for developing countries of United Nations fits
best the Nepalese mortality experience. Life expectancy at birth of Nepalese female is found
higher than that of males in 2001. The figure was 60.1 years for males and 60.7 years females in
2001.
Limitation of this study is that due to lack of any information on mortality indices of adult and
elderly persons, defining mortality level estimation derived at in this present study may not able to
take into account, in precision, the mortality pattern of adult and elderly persons.

75
References
Central Bureau of Statistics (CBS) (1998). Environmental Statistics of Nepal, National Planning Commission Secretariat, Kathmandu, Nepal.
Central Bureau of Statistics (CBS) (1994). Environmental Compendium of Nepal, National Planning Commission Secretariat, Kathmandu, Nepal.
Central Bureau of Statistics (CBS) (1994). Population Projection of Nepal 1991-2011, National Planning Commission Secretariat, Kathmandu, Nepal.
Central Bureau of Statistics (CBS) (1987). Population Monograph of Nepal, National Planning Commission Secretariat, Kathmandu, Nepal.
Central Bureau of Statistics (CBS) (1995). Population Monograph of Nepal, National Planning Commission Secretariat, Kathmandu, Nepal.
East West Center (1999). Asia - Pacific Population and Policy, Program on Population, Number 49.
Nepal Living Standard Survey Report (NLSS) (1996). Central Bureau of Statistics, National Planning Commission Secretariat, Kathmandu, Nepal.
Maternal Mortality and Morbidity Study (MMMRS) (1998). Family Health Division (FHD), Ministry of Health, Kathmandu, Nepal.
Nepal Family Health Survey (NFHS) (1996). Ministry of Health Family Health Division, Ministry of Health, Kathmandu, Nepal.
Nepal Fertility, Family Planning and Health Survey (NFFHS) (1991). Family Planning and Maternal Child Health Division, Ministry of Health, Kathmandu, Nepal.
Nepal Fertility and Family Planning Survey (NFFPS) (1986). Family Planning and Maternal Child Health Division, Ministry of Health, Kathmandu, Nepal.
Department of Health Service, (DHS) (1996/97). Annual Report, Ministry of Health, Kathmandu, Nepal.
Nepal Demographic and Health Survey (NDHS) (2001). Family Health Division, Ministry of Health, Kathmandu, Nepal.
Ministry of Population and Environment (MOPE) (1998). Population Projection for Nepal, 1996-2016, Kathmandu, Nepal.
National Planning Commission (NPC) (2002). The Tenth Plan, 1997-2002, Kathmandu, Nepal.
Gwatkin, D.R. (1980). Indication of Change in Developing Country Mortality Trend, The End of an Era, Population Development Review, vol.6, no.4
United Nations (UN) (1990). Step to Step Guide to the Estimating of Child Mortality, New York.
United Nations (UN) (1983). Indirect Techniques for Demographic Estimation, Manual X, New York.
United Nations (UN) (1982). Model Life Table for Developing Countries, New York .

76
Annex 13.1: Rate of change in expectation of life at birth at different levels of life expectancy.
Initial Base Rescaled Level Change Change
40 2.10 3.13 41 2.14 3.19 42 2.18 3.24 43 2.21 3.30 44 2.25 3.36 45 2.29 3.42 46 2.31 3.45 47 2.33 3.48 48 2.35 3.51 49 2.38 3.55 50 2.40 3.58 51 2.42 3.61 52 2.44 3.63 53 2.45 3.65 54 2.45 3.65 55 2.44 3.64 56 2.42 3.62 57 2.40 3.58 58 2.37 3.53 59 2.33 3.48 60 2.28 3.39 61 2.20 3.28 62 2.11 3.15 63 2.00 2.98 64 1.88 2.81 65 1.78 2.65 66 1.66 2.48 67 1.54 2.30 68 1.44 2.14 69 1.32 1.98 70 1.18 1.78
Notes: Estimated form United Nations Population Division estimates of life expectancy for 181 countries for five year periods from 1950-55 through 1985-90. See text for further explanation. The two columns show the relationship between level of expectation of life at birth in a given five year period and the change in expectation of life at birth between this and the following period. To illustrate using the first scaling, if expectation of life at birth for 1986-91 is 50 years, expectation of life at birth for 1991-96 would be 50 + 2.40 = 52.40 years. Alternative scaling allow for the very different rates of increase observed in different countries. The second scaling is used for extrapolating expectation of life at birth in Nepal for future periods based on the rate of increase estimated in previous sections.
Source: Griffith Feeney, 1998: Population Projection for Nepal 1996 – 2016, Volume 1, Ministry of Population and Environment HMG, June 1998.
77
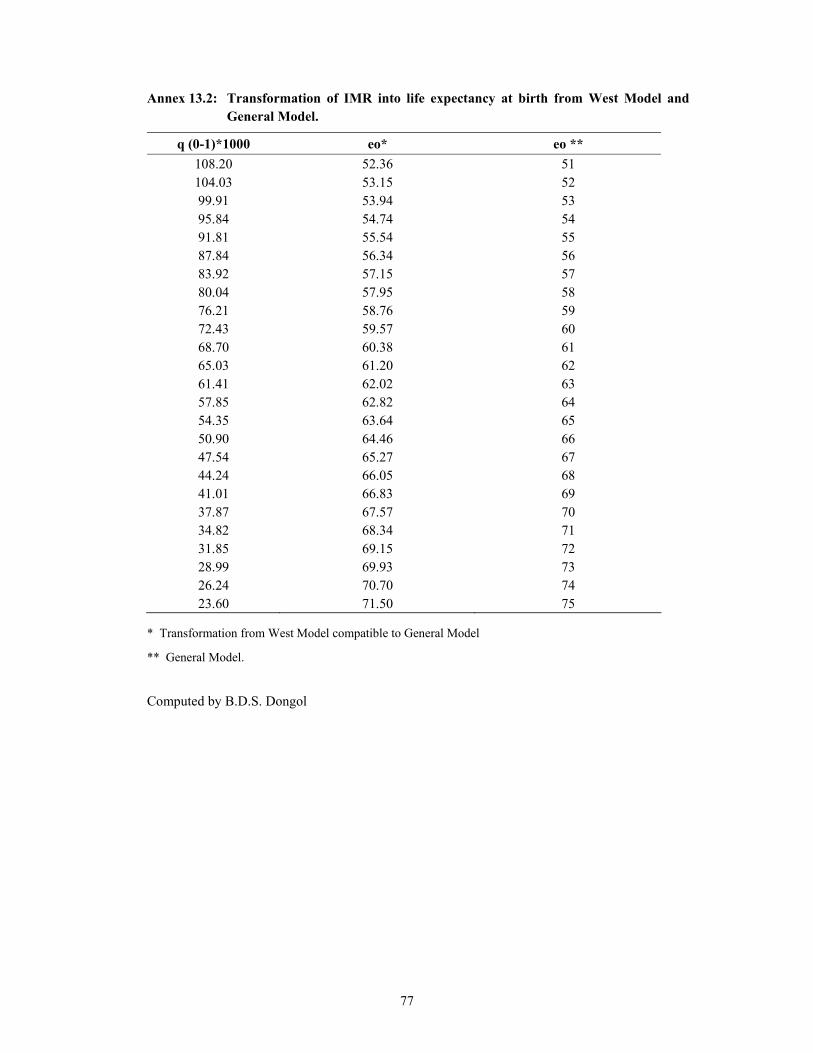
Annex 13.2: Transformation of IMR into life expectancy at birth from West Model and General Model.
q (0-1)*1000 eo* eo ** 108.20 52.36 51 104.03 53.15 52 99.91 53.94 53 95.84 54.74 54 91.81 55.54 55 87.84 56.34 56 83.92 57.15 57 80.04 57.95 58 76.21 58.76 59 72.43 59.57 60 68.70 60.38 61 65.03 61.20 62 61.41 62.02 63 57.85 62.82 64 54.35 63.64 65 50.90 64.46 66 47.54 65.27 67 44.24 66.05 68 41.01 66.83 69 37.87 67.57 70 34.82 68.34 71 31.85 69.15 72 28.99 69.93 73 26.24 70.70 74 23.60 71.50 75
* Transformation from West Model compatible to General Model
** General Model.
Computed by B.D.S. Dongol
78
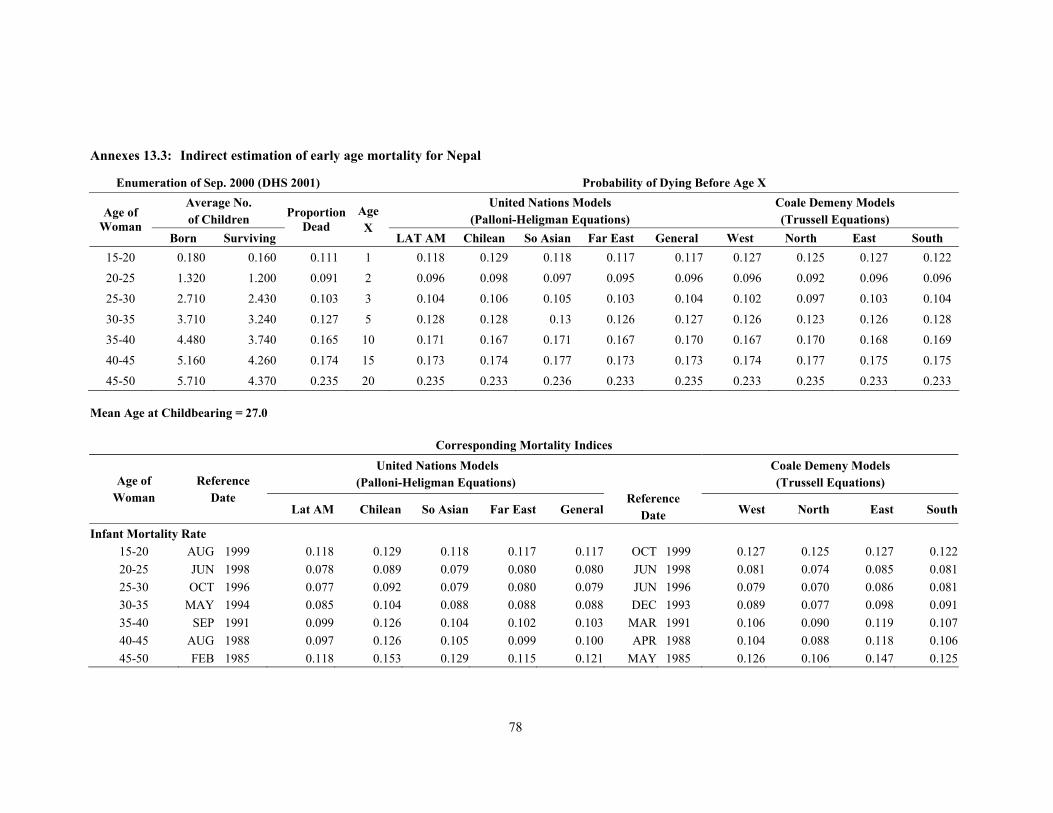
Annexes 13.3: Indirect estimation of early age mortality for Nepal
Enumeration of Sep. 2000 (DHS 2001) Probability of Dying Before Age X Average No. of Children
United Nations Models (Palloni-Heligman Equations)
Coale Demeny Models (Trussell Equations) Age of
Woman Born Surviving
Proportion Dead
Age X
LAT AM Chilean So Asian Far East General West North East South 15-20 0.180 0.160 0.111 1 0.118 0.129 0.118 0.117 0.117 0.127 0.125 0.127 0.122
20-25 1.320 1.200 0.091 2 0.096 0.098 0.097 0.095 0.096 0.096 0.092 0.096 0.096
25-30 2.710 2.430 0.103 3 0.104 0.106 0.105 0.103 0.104 0.102 0.097 0.103 0.104
30-35 3.710 3.240 0.127 5 0.128 0.128 0.13 0.126 0.127 0.126 0.123 0.126 0.128 35-40 4.480 3.740 0.165 10 0.171 0.167 0.171 0.167 0.170 0.167 0.170 0.168 0.169
40-45 5.160 4.260 0.174 15 0.173 0.174 0.177 0.173 0.173 0.174 0.177 0.175 0.175
45-50 5.710 4.370 0.235 20 0.235 0.233 0.236 0.233 0.235 0.233 0.235 0.233 0.233 Mean Age at Childbearing = 27.0
Corresponding Mortality Indices United Nations Models
(Palloni-Heligman Equations) Coale Demeny Models (Trussell Equations) Age of
Woman Reference
Date Lat AM Chilean So Asian Far East General
Reference Date West North East South
Infant Mortality Rate 15-20 AUG 1999 0.118 0.129 0.118 0.117 0.117 OCT 1999 0.127 0.125 0.127 0.12220-25 JUN 1998 0.078 0.089 0.079 0.080 0.080 JUN 1998 0.081 0.074 0.085 0.08125-30 OCT 1996 0.077 0.092 0.079 0.080 0.079 JUN 1996 0.079 0.070 0.086 0.08130-35 MAY 1994 0.085 0.104 0.088 0.088 0.088 DEC 1993 0.089 0.077 0.098 0.09135-40 SEP 1991 0.099 0.126 0.104 0.102 0.103 MAR 1991 0.106 0.090 0.119 0.10740-45 AUG 1988 0.097 0.126 0.105 0.099 0.100 APR 1988 0.104 0.088 0.118 0.10645-50 FEB 1985 0.118 0.153 0.129 0.115 0.121 MAY 1985 0.126 0.106 0.147 0.125

79
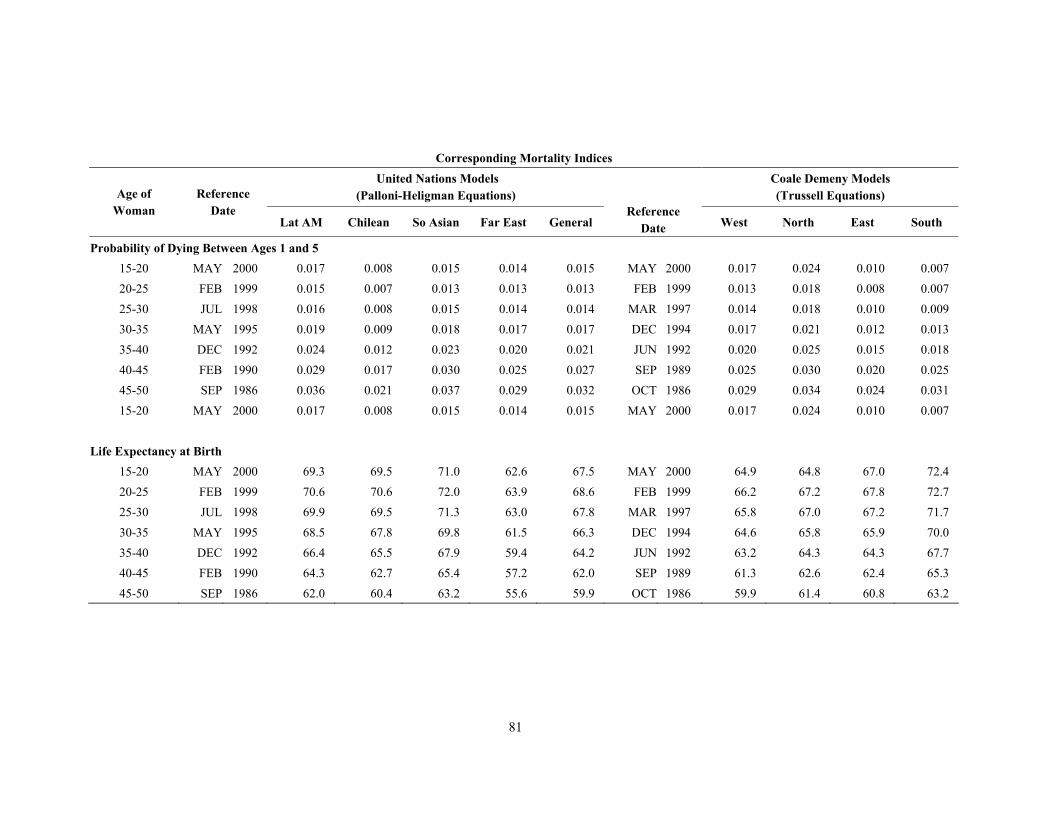
Corresponding Mortality Indices United Nations Models
(Palloni-Heligman Equations) Coale Demeny Models (Trussell Equations) Age of
Woman Reference
Date Lat AM Chilean So Asian Far East General
Reference Date West North East South
Probability of Dying Between Ages 1 and 5 15-20 AUG 1999 0.086 0.039 0.076 0.071 0.074 OCT 1999 0.069 0.097 0.048 0.07920-25 JUN 1998 0.042 0.020 0.038 0.036 0.037 JUN 1998 0.036 0.047 0.025 0.03125-30 OCT 1996 0.041 0.021 0.038 0.036 0.037 JUN 1996 0.035 0.043 0.026 0.03230-35 MAY 1994 0.048 0.027 0.046 0.043 0.044 DEC 1993 0.041 0.050 0.031 0.04135-40 SEP 1991 0.063 0.037 0.062 0.055 0.057 MAR 1991 0.053 0.062 0.043 0.05840-45 AUG 1988 0.060 0.037 0.062 0.052 0.055 APR 1988 0.052 0.060 0.042 0.05845-50 FEB 1985 0.084 0.053 0.088 0.067 0.075 MAY 1985 0.069 0.077 0.059 0.083
Life Expectancy at Birth
15-20 AUG 1999 49.8 52.3 54.0 43.1 48.5 OCT 1999 48.9 46.4 53.4 52.520-25 JUN 1998 60.3 60.6 62.9 52.9 58.2 JUN 1998 57.9 57.9 60.3 63.225-30 OCT 1996 60.6 60.1 62.9 52.9 58.3 JUN 1996 58.1 58.8 60.1 63.030-35 MAY 1994 58.5 57.4 60.8 50.8 56.2 DEC 1993 56.2 57.1 58.1 60.635-40 SEP 1991 54.7 53.1 57.1 47.1 52.4 MAR 1991 52.9 53.9 54.7 56.540-45 AUG 1988 55.4 53.1 57.0 47.9 53.1 APR 1988 53.2 54.5 54.8 56.645-50 FEB 1985 50.1 48.0 51.9 43.9 48.1 MAY 1985 49.0 50.4 50.4 51.7

80
Annexes 13.4: Indirect estimation of early age mortality for
Enumeration of June 2001 (Census) Probability of Dying Before Age X Average No. of Children
United Nations Models (Palloni-Heligman Equations)
Coale Demeny Models (Trussell Equations) Age of
Woman Born Surviving
Proportion Dead
Age X
LAT AM Chilean So Asian Far East General West North East South 15-20 0.154 0.147 0.045 1 0.046 0.051 0.046 0.047 0.047 0.049 0.048 0.049 0.046
20-25 0.969 0.924 0.046 2 0.049 0.050 0.049 0.048 0.049 0.049 0.046 0.049 0.048
25-30 2.059 1.947 0.054 3 0.055 0.056 0.056 0.055 0.055 0.054 0.052 0.055 0.055
30-35 2.870 2.683 0.065 5 0.067 0.067 0.068 0.066 0.066 0.066 0.064 0.066 0.067 35-40 3.442 3.166 0.080 10 0.084 0.082 0.084 0.083 0.084 0.082 0.084 0.083 0.083
40-45 3.821 3.433 0.102 15 0.102 0.103 0.105 0.103 0.103 0.103 0.105 0.103 0.103
45-50 4.037 3.535 0.124 20 0.126 0.126 0.126 0.127 0.127 0.125 0.126 0.125 0.125 Mean Age at Childbearing = 27.0
Corresponding Mortality Indices United Nations Models
(Palloni-Heligman Equations) Coale Demeny Models (Trussell Equations) Age of
Woman Reference
Date Lat AM Chilean So Asian Far East General
Reference Date West North East South
Infant Mortality Rate 15-20 MAY 2000 0.046 0.051 0.046 0.047 0.047 MAY 2000 0.049 0.048 0.049 0.046 20-25 FEB 1999 0.042 0.047 0.043 0.043 0.043 FEB 1999 0.043 0.039 0.045 0.044 25-30 JUL 1998 0.044 0.051 0.045 0.045 0.045 MAR 1997 0.045 0.040 0.048 0.048 30-35 MAY 1995 0.049 0.058 0.051 0.050 0.050 DEC 1994 0.050 0.044 0.055 0.055 35-40 DEC 1992 0.056 0.068 0.058 0.057 0.057 JUN 1992 0.056 0.050 0.063 0.063 40-45 FEB 1990 0.063 0.080 0.068 0.065 0.065 SEP 1989 0.065 0.056 0.074 0.073 45-50 SEP 1986 0.072 0.090 0.077 0.070 0.073 OCT 1986 0.071 0.060 0.083 0.081
81
Corresponding Mortality Indices United Nations Models
(Palloni-Heligman Equations) Coale Demeny Models (Trussell Equations) Age of
Woman Reference
Date Lat AM Chilean So Asian Far East General
Reference Date West North East South
Probability of Dying Between Ages 1 and 5 15-20 MAY 2000 0.017 0.008 0.015 0.014 0.015 MAY 2000 0.017 0.024 0.010 0.007 20-25 FEB 1999 0.015 0.007 0.013 0.013 0.013 FEB 1999 0.013 0.018 0.008 0.007 25-30 JUL 1998 0.016 0.008 0.015 0.014 0.014 MAR 1997 0.014 0.018 0.010 0.009 30-35 MAY 1995 0.019 0.009 0.018 0.017 0.017 DEC 1994 0.017 0.021 0.012 0.013 35-40 DEC 1992 0.024 0.012 0.023 0.020 0.021 JUN 1992 0.020 0.025 0.015 0.018 40-45 FEB 1990 0.029 0.017 0.030 0.025 0.027 SEP 1989 0.025 0.030 0.020 0.025 45-50 SEP 1986 0.036 0.021 0.037 0.029 0.032 OCT 1986 0.029 0.034 0.024 0.031 15-20 MAY 2000 0.017 0.008 0.015 0.014 0.015 MAY 2000 0.017 0.024 0.010 0.007
Life Expectancy at Birth
15-20 MAY 2000 69.3 69.5 71.0 62.6 67.5 MAY 2000 64.9 64.8 67.0 72.4 20-25 FEB 1999 70.6 70.6 72.0 63.9 68.6 FEB 1999 66.2 67.2 67.8 72.7 25-30 JUL 1998 69.9 69.5 71.3 63.0 67.8 MAR 1997 65.8 67.0 67.2 71.7 30-35 MAY 1995 68.5 67.8 69.8 61.5 66.3 DEC 1994 64.6 65.8 65.9 70.0 35-40 DEC 1992 66.4 65.5 67.9 59.4 64.2 JUN 1992 63.2 64.3 64.3 67.7 40-45 FEB 1990 64.3 62.7 65.4 57.2 62.0 SEP 1989 61.3 62.6 62.4 65.3 45-50 SEP 1986 62.0 60.4 63.2 55.6 59.9 OCT 1986 59.9 61.4 60.8 63.2

82
Annex 13.5: Abridge life table for male, 2001
AGE M(X,N) Q(X,N) I(X) D(X,N) L(X,N) S(X,N) T(X) E(X) A(X,N)
0 0.07540 0.07135 100000 7135 94632 0.91952 /A/ 6014280 60.1 0.248
1 0.00677 0.02662 92865 2472 365127 0.97875 /B/ 5919648 63.7 1.438
5 0.00176 0.00874 90393 790 449990 0.99268 5554521 61.4 2.500
10 0.00118 0.00589 89603 528 446695 0.99285 5104532 57.0 2.500
15 0.00181 0.00900 89075 802 443499 0.98905 4657837 52.3 2.660
20 0.00259 0.01286 88273 1135 438642 0.98610 4214337 47.7 2.599
25 0.00298 0.01480 87138 1290 432545 0.98392 3775696 43.3 2.560
30 0.00356 0.01763 85849 1514 425588 0.97994 3343151 38.9 2.585
35 0.00464 0.02297 84335 1937 417049 0.97315 2917563 34.6 2.612
40 0.00637 0.03139 82398 2586 405850 0.96260 2500514 30.3 2.626
45 0.00908 0.04443 79811 3546 390671 0.94622 2094664 26.2 2.635
50 0.01334 0.06464 76265 4930 369659 0.92174 1703993 22.3 2.633
55 0.01965 0.09387 71336 6696 340728 0.88788 1334334 18.7 2.618
60 0.02861 0.13388 64639 8654 302527 0.83508 993606 15.4 2.612
65 0.04469 0.20164 55985 11289 252633 0.75966 691079 12.3 2.582
70 0.06636 0.28491 44697 12734 191914 0.66903 438446 9.8 2.521
75 0.09598 0.38556 31962 12323 128396 0.56211 246532 7.7 2.451
80 0.13686 0.50296 19639 9878 72173 0.38906 /C/ 118135 6.0 2.366
85 0.21238 ..... 9761 9761 45962 ..... 45962 4.7 4.709
/A/ Value given for survivorship of 5 cohorts of birth to age group
0 - 4 = L(0,5)/50
/B/ Value given for S(0,5) = L(5,5)/(0,5)
/C/ Value given for S(80+,5) = T(85)/T(80)
83
Annex 13.6: Abridge life table for female, 2001
AGE M(X,N) Q(X,N) I(X) D(X,N) L(X,N) S(X,N) T(X) E(X) A(X,N)
0 0.07476 0.07085 100000 7085 94775 0.9157 /A/ 6069810 60.7 0.263
1 0.00912 0.03565 92915 3312 363077 0.9733 /B/ 5975035 64.3 1.409
5 0.00213 0.01057 89603 947 445645 0.9915 5611958 62.6 2.500
10 0.00128 0.00640 88655 567 441859 0.9923 5166313 58.3 2.500
15 0.00192 0.00958 88088 844 438454 0.9886 4724454 53.6 2.646
20 0.00264 0.01313 87244 1146 433471 0.9855 4286000 49.1 2.599
25 0.00318 0.01580 86099 1360 427190 0.9826 3852529 44.7 2.572
30 0.00385 0.01909 84738 1618 419766 0.9789 3425338 40.4 2.573
35 0.00470 0.02325 83121 1933 410920 0.9742 3005572 36.2 2.577
40 0.00584 0.02880 81188 2338 400309 0.967 2594652 32.0 2.591
45 0.00773 0.03795 78850 2992 387110 0.9551 2194343 27.8 2.614
50 0.01091 0.05317 75858 4033 369725 0.9358 1807233 23.8 2.629
55 0.01602 0.07715 71824 5541 345996 0.9061 1437509 20.0 2.631
60 0.02405 0.11376 66283 7540 313500 0.8606 1091513 16.5 2.624
65 0.03697 0.16981 58743 9975 269803 0.7932 778013 13.2 2.603
70 0.05709 0.25053 48768 12218 214013 0.7012 508209 10.4 2.559
75 0.08680 0.35639 36550 13026 150070 0.5853 294197 8.0 2.491
80 0.13040 0.48694 23524 11455 87842 0.3905 /C/ 144127 6.1 2.400
85 0.21443 ..... 12069 12069 56285 ..... 56285 4.7 4.664
/A/ Value given for survivorship of 5 cohorts of birth to age group
0 - 4 = L(0,5)/50
/B/ Value given for S(0,5) = L(5,5)/(0,5)
/C/ Value given for S(80+,5) = T(85)/T(80)